HUD Consolidated Plan Cuyahoga County Planning Commission Cuyahoga Urban County September 16, 2009.
38
HUD Consolidated Plan Cuyahoga County Planning Commission Cuyahoga Urban County September 16, 2009
-
Upload
dulcie-harris -
Category
Documents
-
view
218 -
download
1
Transcript of HUD Consolidated Plan Cuyahoga County Planning Commission Cuyahoga Urban County September 16, 2009.

HUD Consolidated Plan
Cuyahoga County Planning CommissionCuyahoga Urban County
September 16, 2009

19741980’s
1987 19901990
19921994
20092008
Housing Assistance
Plan
Planning Documents
HUD Housing Programs and Planning Documents
Establishment of Programs
Comprehensive Housing
Affordability Strategy
Five-Year Consolidated
Plan
Emergency Shelter Grant
Program
HOME Investment
Partnerships Program
Housing Opportunities for
Persons with AIDS
Cuyahoga Housing
Consortium created
Neighborhood Stabilization
Program
American Recovery and Reinvestment
Act
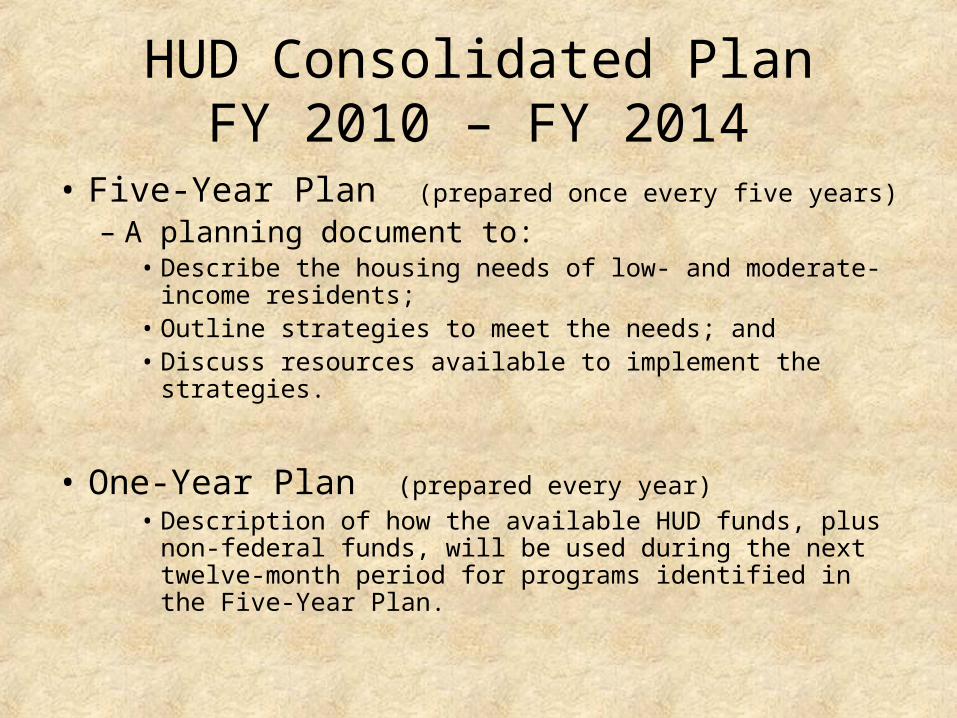
HUD Consolidated PlanFY 2010 – FY 2014
• Five-Year Plan (prepared once every five years)
– A planning document to:• Describe the housing needs of low- and moderate-income
residents;• Outline strategies to meet the needs; and • Discuss resources available to implement the strategies.
• One-Year Plan (prepared every year)• Description of how the available HUD funds, plus non-
federal funds, will be used during the next twelve-month period for programs identified in the Five-Year Plan.
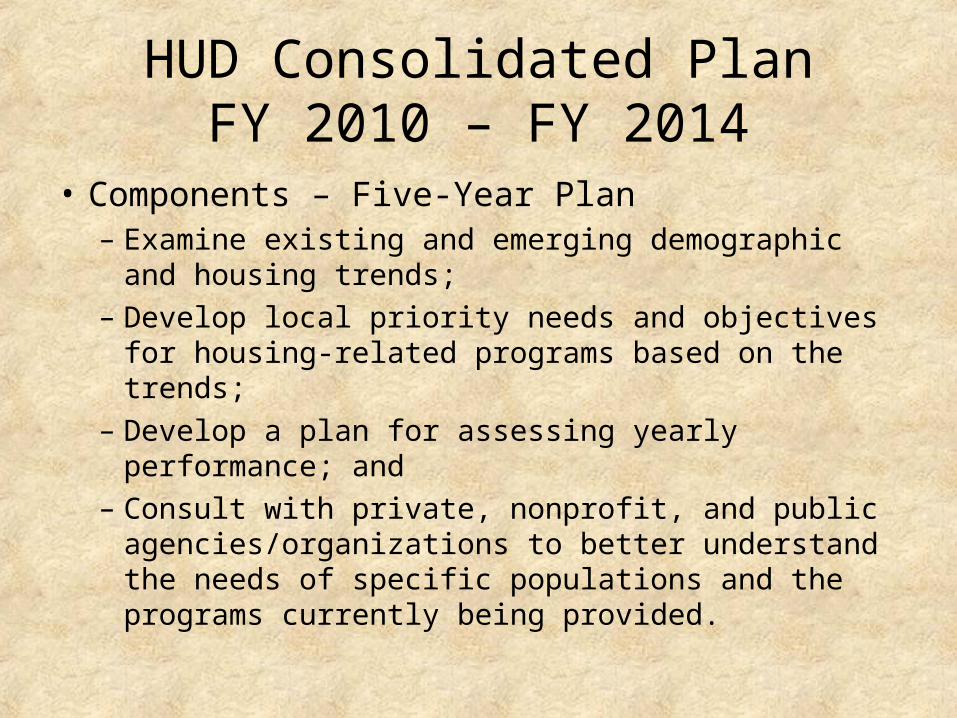
HUD Consolidated PlanFY 2010 – FY 2014
• Components – Five-Year Plan– Examine existing and emerging demographic and
housing trends;– Develop local priority needs and objectives for
housing-related programs based on the trends;– Develop a plan for assessing yearly performance; and– Consult with private, nonprofit, and public
agencies/organizations to better understand the needs of specific populations and the programs currently being provided.

HUD Consolidated PlanFY 2010 – FY 2014
• Content – Five-Year Plan– Community Profile
• Characteristics of the general population;• Characteristics of the housing stock and housing
market;• Affordable housing needs of low- and moderate-
income persons and families;• Needs of homeless persons; and• Needs of non-homeless persons with special needs
who require supportive services.

GEA
UG
A C
O.
SUMMIT CO.
MEDINA CO.
LORAIN
CO
.
S.Euclid
RichmondHts
Warr.Hts
Lakewood
Univ.Hts
E.Cleveland
ClevelandHtsCleveland
Parma
Strongsville
Euclid
Beachwood
Bedford
BedfordHts Bentleyville
Berea
Brecksville
BroadviewHts
Brooklyn
BrooklynHts
ChagrinFalls Vill
ChagrinFalls TwpFairview
Park
GarfieldHts
GatesMills
Glenwillow
HighlandHts
HuntingValley
Linndale
Lyndhurst
MapleHts
Mayfield
MayfieldHts
MiddleburgHts
NewburghHts
N.Randall
N.Royalton
Oakwood
Orange
ParmaHts
PepperPike
SevenHills
ShakerHts
SolonValleyView
WaltonHills
HighlandHills
WestlakeWoodmere
MorelandHills
Bratenahl
Bay Village
RockyRiver
BrookPark
N.Olmsted
OlmstedFalls
Independence
OlmstedTwp
CuyahogaHts
Other Consortium Community (4)
Cuyahoga Urban County Community (50)
Cuyahoga Housing Consortium

Demographics
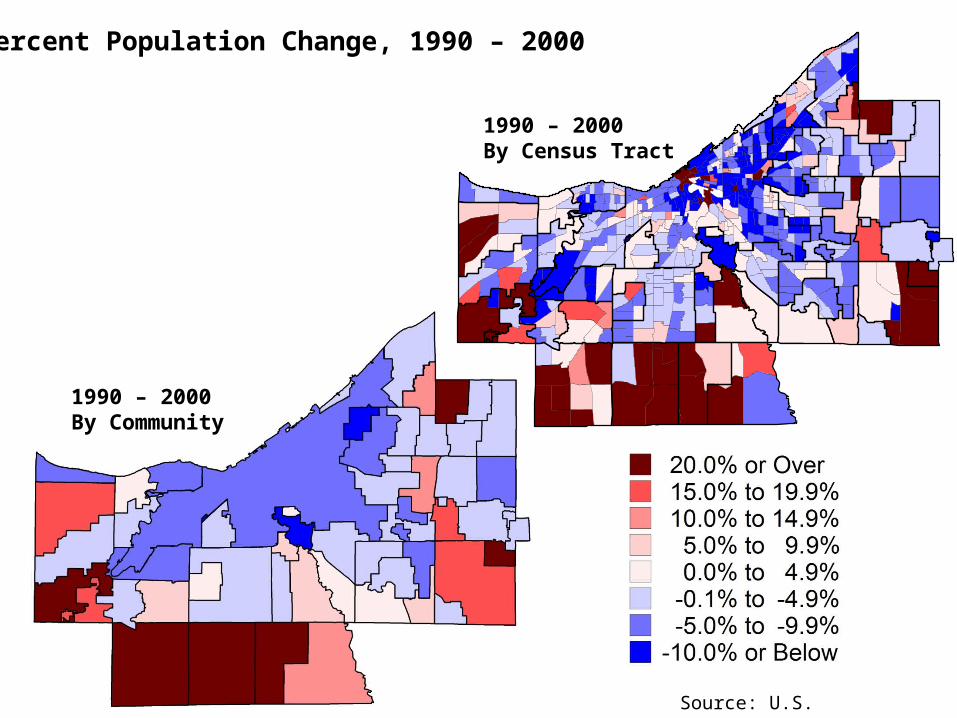
1990 – 2000By Community
1990 – 2000By Census Tract
Percent Population Change, 1990 – 2000
Source: U.S. Census

1990 - 2000 2000 - 2008Urban County 4.2% -6.2%Cleveland -5.4% -9.3%Cuyahoga County -1.3% -7.9%
Urban County Population (based on 2009 community roster)
1990 600,295
2000 625,386
2008 (estimate) 586,727
2005 – 2007American Community Survey (approximation)
651,044
Source: U.S. Census
Percent Population Change

Source: U.S. Census,2005 – 2007 ACS
Age Composition
17 Years or Under 18 to 39 Years 40 to 64 Years 65 years and over
Number Percent Number Percent Number Percent Number PercentUrban County* 150,719 23.2% 152,030 23.4% 237,973 36.6% 110,322 16.9%Cleveland 105,553 26.1% 118,484 29.3% 131,067 32.4% 49,910 12.3%Cuyahoga County 314,282 24.0% 344,662 26.3% 453,540 34.6% 198,421 15.1%*approximation

Percent Minority Compositionby Census Tract
2000
1990
Source: U.S. Census

Source: U.S. Census
1990 2000
2005 - 2007American Community Survey
Urban County 11.4% 16.7% 14.5%*Cleveland 52.2% 61.2% 64.2%Cuyahoga County 28.4% 34.1% 36.2%
Percent Minority Composition
*approximation

Median Household Incomeby Census Tract
1999
1989*
Source: U.S. Census
*Adjusted to 1999 dollars

Source: U.S. Census
1989 1999
2005 - 2007American Community Survey
Urban County* $38,856 $51,636 Not availableCleveland $17,821 $25,928 $27,007Cuyahoga County $28,595 $39,168 $43,162
Not adjusted to current dollars.
Median Household Income
*approximation

“120% of Area Median Income” in 2008 = $67,050 for a family of three persons.

Percent Persons Below Poverty Levelby Census Tract
1999
1989
Source: U.S. Census
One adult under age 65 = $8,867
One adult under age 65 = $6,451

Source: U.S. Census
1989 1999
2005 - 2007American Community Survey
Urban County 3.8% 4.6% 7.6%*Cleveland 28.7% 26.3% 29.7%Cuyahoga County 13.8% 13.1% 15.7%
Percent Persons Below Poverty Level
*approximation
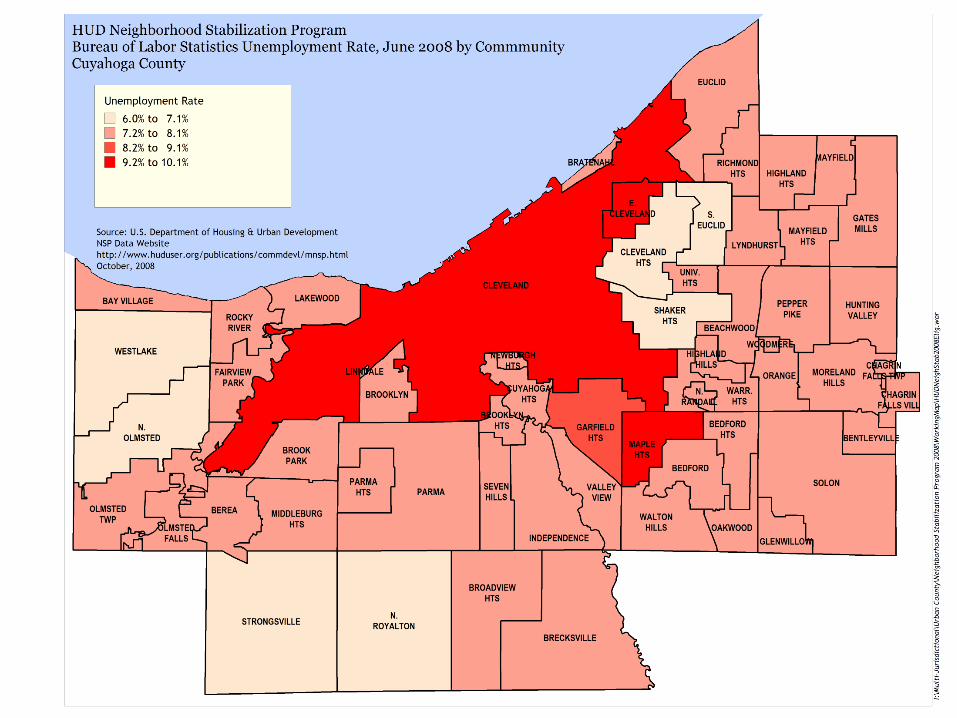

Source: Ohio Department of Job and Family Services, Ohio Labor Market Information
October
2008June 2009
July 2009
Percent IncreaseOct. 2008 – July 2009
Urban County* 5.7% 9.2% 8.6% 50.9%Cuyahoga County 6.5% 10.2% 9.5% 46.2%Ohio 6.6% 11.2% 11.1% 68.2%
Unemployment Rate
*approximation

Housing

1939 or Earlier
1940 – 1969
Percent Residential Housing Unit Period of Constructionby Census Tract
Source: U.S. Census

Percent Renter-Occupied HousingUnits by Census Tract
2000
1990
Source: U.S. Census

Source: U.S. Census,2005 – 2007 ACS
Tenure by Units in Structure
Total Occupied Housing
Units
1 Unit in Structure (Detached and
Attached)
2 Unitsin Structure
3 to 9 Units in Structure
10 - 49 Units in Structure
50 or more Units in Structure
Total Percent Owner-
Occupied Total
Percent Owner-
Occupied
Total Percent Owner-
Occupied
Total Percent Owner-
Occupied
Total Percent Owner-
OccupiedUrban County* 264,074 201,140 93.5% 5,846 26.3% 13,711 18.8% 21,141 15.4% 20,403 10.0% Cleveland 168,557 93,206 72.8% 33,212 29.6% 17,299 7.1% 11,129 2.8% 12,913 4.7% Cuyahoga County 542,856 363,758 87.2% 47,561 28.8% 39,594 11.4% 42,768 9.1% 46,399 8.8%*approximation
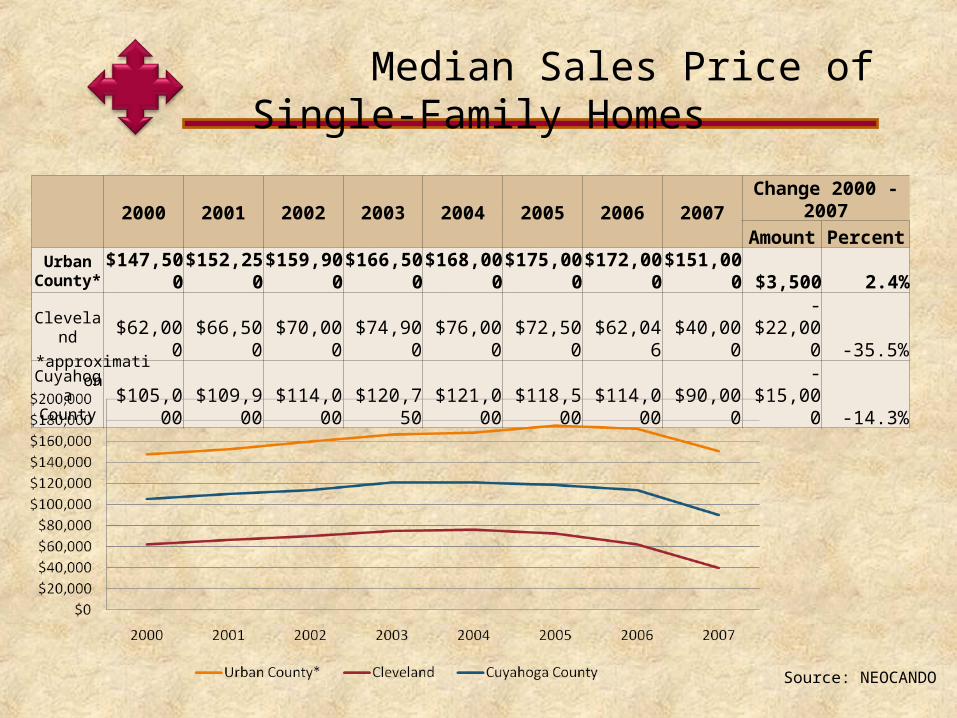
Source: NEOCANDO
2000 2001 2002 2003 2004 2005 2006 2007
Change 2000 - 2007Amount Percent
Urban County* $147,500 $152,250 $159,900 $166,500 $168,000 $175,000 $172,000 $151,000 $3,500 2.4%
Cleveland $62,000 $66,500 $70,000 $74,900 $76,000 $72,500 $62,046 $40,000 -$22,000 -35.5%Cuyahoga
County $105,000 $109,900 $114,000 $120,750 $121,000 $118,500 $114,000 $90,000 -$15,000 -14.3%
Median Sales Price of Single-Family Homes
*approximation


“High-Cost” defined as an interest rate 3% or more above prime rate. Prime rate in 2004-2006 = 4.0% - 8.25%.

Source: NEOCANDO


2006 2007 2008 2009 (through Sept 4)
Number Percent of Total Number Percent
of Total Number Percent of Total Number Percent of
TotalUrban County 3,568 25.7% 4,016 26.8% 4,686 31.6% 3,195 34.2%Cleveland 7,484 54.0% 7,821 52.2% 7,111 48.0% 4,051 43.3%Cuyahoga County 13,861 100.0% 14,982 100.0% 14,809 100.0% 9,353 100.0%
Foreclosure Filings
Source: NEOCANDO
Foreclosure Filings

2006 2007 2008 2009 (Through Sept 4)
Number Percent of Total Number Percent
of Total Number Percent of Total Number Percent of
TotalUrban County 3,568 25.7% 4,016 26.8% 4,686 31.6% 3,195 34.2%Cleveland 7,484 54.0% 7,821 52.2% 7,111 48.0% 4,051 43.3%Cuyahoga County 13,861 100.0% 14,982 100.0% 14,809 100.0% 9,353 100.0%
Foreclosure Filings
Source: NEOCANDO
Foreclosure Filings
2006 2007 2008
NumberAs % of
Foreclosure Filings
NumberAs % of
Foreclosure Filings
NumberAs % of
Foreclosure Filings
Urban County 1,350 37.8% 2,508 62.5% 2,375 50.7%Cleveland 3,286 43.9% 5,931 75.8% 4,337 61.0%Cuyahoga County 5,621 40.6% 10,283 68.6% 8,285 55.9%
Sheriff Deeds
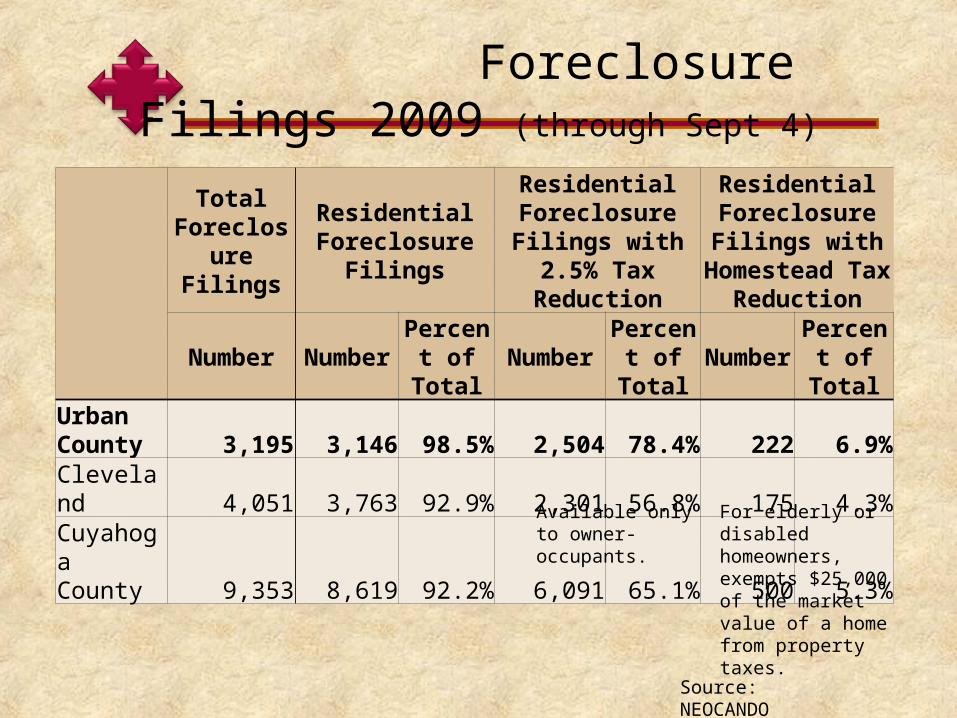
Total Foreclosure
Filings
Residential Foreclosure Filings
Residential Foreclosure Filings
with 2.5% Tax Reduction
Residential Foreclosure Filings with Homestead
Tax Reduction
Number Number Percent of Total Number Percent
of Total Number Percent of Total
Urban County 3,195 3,146 98.5% 2,504 78.4% 222 6.9%Cleveland 4,051 3,763 92.9% 2,301 56.8% 175 4.3%Cuyahoga County 9,353 8,619 92.2% 6,091 65.1% 500 5.3%
Source: NEOCANDO
Foreclosure Filings 2009 (through Sept 4)
For elderly or disabled homeowners, exempts $25,000 of the market value of a home from property taxes.
Available only to owner-occupants.
HUD Consolidated Plan
Cuyahoga County Planning CommissionCuyahoga Urban County
September 16, 2009