HTwitt: a hadoop-based platform for analysis and ...
16
S.I. : DEEP NEURO-FUZZY ANALYTICS IN SMART ECOSYSTEMS HTwitt: a hadoop-based platform for analysis and visualization of streaming Twitter data Umit Demirbaga 1,2 Received: 15 October 2020 / Accepted: 15 April 2021 Ó The Author(s) 2021 Abstract Twitter produces a massive amount of data due to its popularity that is one of the reasons underlying big data problems. One of those problems is the classification of tweets due to use of sophisticated and complex language, which makes the current tools insufficient. We present our framework HTwitt, built on top of the Hadoop ecosystem, which consists of a MapReduce algorithm and a set of machine learning techniques embedded within a big data analytics platform to efficiently address the following problems: (1) traditional data processing techniques are inadequate to handle big data; (2) data preprocessing needs substantial manual effort; (3) domain knowledge is required before the classification; (4) semantic explanation is ignored. In this work, these challenges are overcome by using different algorithms combined with a Naı ¨ve Bayes classifier to ensure reliability and highly precise recommendations in virtualization and cloud environments. These features make HTwitt different from others in terms of having an effective and practical design for text classification in big data analytics. The main contribution of the paper is to propose a framework for building landslide early warning systems by pinpointing useful tweets and visualizing them along with the processed information. We demonstrate the results of the experiments which quantify the levels of overfitting in the training stage of the model using different sizes of real-world datasets in machine learning phases. Our results demonstrate that the proposed system provides high-quality results with a score of nearly 95% and meets the requirement of a Hadoop-based classification system. Keywords Big data MapReduce Machine learning Classification Monitoring Visualization 1 Introduction The concept of big data has become a part of our lives with the use of the internet although it first appeared in astron- omy and genetics [1, 2]. The fact that the computer is in almost every area of our lives has resulted in the storage, processing, and management of a huge amount of data. The use of the internet in many areas of our lives has also increased the amount of data available in electronic form by the help of cloud computing [3, 4]. The data we are talking about, which consists of the data entered and stored to perform services along with a huge amount of data that is mostly useless, is growing like an avalanche. With 2019 figures, more than 2.5 quintillion bytes of data are gener- ated in a day in the world, and the data size is estimated to reach 45 times that in 10 years [5]. So, we see a garbage dump consisting of unstructured data. It was not long before it was understood that this phenomenon, called ‘information dump’, was potentially a large treasure but could not be used because it was not structured. As a matter of fact, this dump, which consists of items such as posts on social media platforms, blogs, records of web servers, internet statistics, can be converted into a useful and ben- eficial form. If these data are interpreted with the correct analytics methods, a great progress will be made in making important decisions, managing risks correctly and sign- posting new discoveries. For these crucial reasons, big data analytics is getting more and more important in some special areas, such as government sector [6], e-commerce [7, 8], semantic analysis [9], healthcare industry [10–12], entertainment industry [13], weather patterns [14], linear A preliminary version of this paper is presented in IEEE SC2 2018 Conference. & Umit Demirbaga [email protected] 1 School of Computing, Newcastle University, Newcastle upon Tyne, UK 2 Faculty of Engineering, Bartin University, Bartin, Turkey 123 Neural Computing and Applications https://doi.org/10.1007/s00521-021-06046-y
Transcript of HTwitt: a hadoop-based platform for analysis and ...
S. I . : DEEP NEURO-FUZZY ANALYTICS IN SMART ECOSYSTEMS
HTwitt: a hadoop-based platform for analysis and visualizationof streaming Twitter data
Umit Demirbaga1,2
Received: 15 October 2020 / Accepted: 15 April 2021� The Author(s) 2021
AbstractTwitter produces a massive amount of data due to its popularity that is one of the reasons underlying big data problems.
One of those problems is the classification of tweets due to use of sophisticated and complex language, which makes the
current tools insufficient. We present our framework HTwitt, built on top of the Hadoop ecosystem, which consists of a
MapReduce algorithm and a set of machine learning techniques embedded within a big data analytics platform to
efficiently address the following problems: (1) traditional data processing techniques are inadequate to handle big data; (2)
data preprocessing needs substantial manual effort; (3) domain knowledge is required before the classification; (4) semantic
explanation is ignored. In this work, these challenges are overcome by using different algorithms combined with a Naıve
Bayes classifier to ensure reliability and highly precise recommendations in virtualization and cloud environments. These
features make HTwitt different from others in terms of having an effective and practical design for text classification in big
data analytics. The main contribution of the paper is to propose a framework for building landslide early warning systems
by pinpointing useful tweets and visualizing them along with the processed information. We demonstrate the results of the
experiments which quantify the levels of overfitting in the training stage of the model using different sizes of real-world
datasets in machine learning phases. Our results demonstrate that the proposed system provides high-quality results with a
score of nearly 95% and meets the requirement of a Hadoop-based classification system.
Keywords Big data � MapReduce � Machine learning � Classification � Monitoring � Visualization
1 Introduction
The concept of big data has become a part of our lives with
the use of the internet although it first appeared in astron-
omy and genetics [1, 2]. The fact that the computer is in
almost every area of our lives has resulted in the storage,
processing, and management of a huge amount of data. The
use of the internet in many areas of our lives has also
increased the amount of data available in electronic form
by the help of cloud computing [3, 4]. The data we are
talking about, which consists of the data entered and stored
to perform services along with a huge amount of data that
is mostly useless, is growing like an avalanche. With 2019
figures, more than 2.5 quintillion bytes of data are gener-
ated in a day in the world, and the data size is estimated to
reach 45 times that in 10 years [5]. So, we see a garbage
dump consisting of unstructured data. It was not long
before it was understood that this phenomenon, called
‘information dump’, was potentially a large treasure but
could not be used because it was not structured. As a matter
of fact, this dump, which consists of items such as posts on
social media platforms, blogs, records of web servers,
internet statistics, can be converted into a useful and ben-
eficial form. If these data are interpreted with the correct
analytics methods, a great progress will be made in making
important decisions, managing risks correctly and sign-
posting new discoveries. For these crucial reasons, big data
analytics is getting more and more important in some
special areas, such as government sector [6], e-commerce
[7, 8], semantic analysis [9], healthcare industry [10–12],
entertainment industry [13], weather patterns [14], linear
A preliminary version of this paper is presented in IEEE SC2
2018 Conference.
& Umit Demirbaga
1 School of Computing, Newcastle University,
Newcastle upon Tyne, UK
2 Faculty of Engineering, Bartin University, Bartin, Turkey
123
Neural Computing and Applicationshttps://doi.org/10.1007/s00521-021-06046-y(0123456789().,-volV)(0123456789().,-volV)
road benchmarking [15], banking sector [16, 17], IoT
technology [18–20], natural disaster management [21],
cyber-physical systems [22, 23], smart city projects
[24–26], and social networks [27, 28].
In recent years, social media has generated tons of data
every second as it becomes universally accepted. Twitter,
one of the most widespread social networks, has led to the
generation of huge data, as it allows people to share their
thoughts easily everywhere about any topic. At the same
time, it is a major area of interest within the field of gaining
precious information. Twitter provides Rest API for
developers to retrieve tweets and related information and
Streaming API for those who are curious about real-time
data [29]. In this way, very big data sets can be collected,
analyzed, and stored in different data formats. However,
advanced processing techniques are required for such
operations due to the big data characteristics known as the
5 V model: volume, variety, velocity, variability, veracity
[30, 31]. In addition, processing and analysis of Twitter
data are remarkably complex and difficult in comparison to
traditional and well-formatted sets of documents as the
tweets do not always contain an actual ‘‘pass value’’. For
these reasons, it is not possible to process big, complex and
streaming data with traditional methods. Hadoop has the
capability to handle all kinds of data in petabyte size that
requires cloud-based data centers [32], and comes with
some considerable features, such as scalable, cost-effec-
tive, fast, resilience to system failures. The MapReduce
technique, one of Hadoop’s main components, provides an
appropriate method to analyze Twitter big data [33].
Apache Mahout provides different machine learning algo-
rithms, and runs on top of Apache Hadoop [34]. That is the
reason why the MapReduce algorithm is convenient to
apply machine learning techniques on the Twitter social
media platform. The combination of MapReduce paradigm
and the machine learning library provides the opportunity
of extracting beneficial information from large-scale
databases.
In this paper, we introduce HTwitt, a Hadoop-based
platform for analysis and visualization of streaming Twitter
data, which analyzes and visualizes tweets using big data
technologies along with a set of machine learning algo-
rithms to address the following problems: (1) traditional
data processing techniques cannot work for big data; (2)
manual intervention and efforts are inadequate for pre-
processing of big data; (3) tweets are generally noisy and
contain a lot of nonsense phrases that make it difficult to
extract useful expressions. HTwitt analytics lifecycle pro-
poses the process of conducting data analysis for both
batch and streaming for text mining applications. This
work, therefore, is one step ahead of other works in terms
of effectiveness and usefulness by means of its flexible and
modular design. In text classification, machine learning is
used to make classifications by learning from past obser-
vations rather than resorting to manually designed rules. A
machine learning algorithm learns the different relation-
ships between the pieces of text using pre-labelled exam-
ples for training purposes [35, 36]. It gives expected
outputs (i.e., tags) to pieces of unlearned text using these
learned patterns (i.e., text). Last but not least, machine
learning teaches machines to understand and act without
being directly programmed that significantly affects the
performance of rule-based applications as it learns the
patterns of the complexity of the problem before. The
purpose of using machine learning in this study is to
develop a scalable and efficient algorithm with tweets
accumulated over time and automatically classify stream-
ing tweets. In HTwitt framework, the data are first parsed
and transferred into csv format, then classified using the
MapReduce algorithm based on the location where the
tweets were posted from and post date and time in the Data
Preparation module. These outputs are used for training
and testing a model for classifying tweets related to natural
disaster in the Model Training and Testing system using
the Naıve Bayes machine learning algorithm to perform an
efficient classification as the British Geological Survey
(BGS) collects tweets related to landslide event which
includes the words of landslide, soil sliding, mudslide,
landfall, landslip. We use a Naıve Bayes classifier as it is
easy to implement and does not require as much data for
training, as well as not being prone to irrelevant features.
We propose this framework to distinguish the tweets
related to natural events from the tweets which involve
landslide phrase but are not related to the natural events in
some sentences, as many irrelevant tweets were also
gathered during the data collection from Twitter due to
homophones. For example, in politics, the landslide
expression means an overwhelming victory in the elections
as well. In addition to that, we created the Real-time data
collection/injection module to acquire the streaming data
from Twitter based on the specific keywords using Twitter
Streaming API and to store them into Hadoop Distributed
File System (HDFS) concurrently. However, Twitter has a
restriction on streaming API, which allows users to
download a limited number of tweets at a specified time.
For this reason, an efficient tool is required to retrieve very
big data from Twitter. That is why we decided to use
Apache Flume, a highly distributed, reliable, and config-
urable tool, to collect, aggregate and move huge amounts
of data. To visualize the result of the predicted decisions
after classifying the tweets, visualization module allows
users to see the exact location of the tweets. These features
make our framework different from others in terms of
processing and analyzing large Twitter data.
Neural Computing and Applications
123
1.1 Related work
Over the last few years, there has been a rising consider-
ation in the area of Twitter sentiment analysis within
Hadoop ecosystems. Beck et al. [37] proposed a recom-
mender system using item-based Collaborative Filtering
algorithms and implementing it using Apache Mahout. The
system processes the streaming messages by splitting them
into small pieces and then builds a recommendation model
for news recommendation. Meanwhile, the system contin-
ues to build a new recommender and replaces the old
model with the new one. The results of the experiments
show that the proposed system ensures highly precise
results and low response time. Tare et al. [38] presented a
system to classify a large number of tweets using Naıve
Bayes algorithm over a MapReduce paradigm. They cate-
gorize the tweets based on their topics using a multi-node
Hadoop cluster. The main purpose of the work is to show
how to combine Naıve Bayes algorithm with MapReduce
algorithm. Martin et al. [39] proposed a framework
implemented in Apache Spark to describe city events and
explore their spatial-temporal characteristics by analyzing
the tweets. They conducted this study in the city of
Valencia, Spain and focus on how Twitter data can be used
to depict city events and explore its spatial-temporal
properties. A general event map was created by using
positive and negative emotions in determining the location
of an event by using a one-year daily average heat map of
the city. At the end of the study, they combine all daily
events in a single map to create a convenient urban
infrastructure of Valencia city. The authors in [40] propose
a recommendation system implemented in Apache Mahout
to provide users’ reviews, feedback, opinions and com-
ments regarding any items using a large amount of web
data. They use a set of filtering techniques along with
classification algorithms to extract positive and negative
reviews about movies. Yang et al. [41] used a supervised
classification approach to identify adverse drug reactions
automatically through a dimension reduction technique
called Latent Dirichlet Allocation (LDA). They collect
3000 original posts and comments about people’s drug use
experience over 60 days via a Web spidering program and
use this data to build a robust classifier. They claim that the
performance of the proposed method is quite satisfactory in
identifying drug surveillance. The authors in [42] proposed
a model to analyze unstructured social media datasets
obtained from Twitter for sentiment analysis using both
supervised and unsupervised machine learning methods.
They achieved 80.68% accuracy on the unsupervised
method implementing Support Vector Machines, Multi-
nomial Naıve Bayes, and Maximum Entropy while
achieving an accuracy of 67% on the supervised method by
performing unigram, bigram and Part-of-Speech tech-
niques. Authors in [43] proposed a Hadoop-based frame-
work implemented in MapReduce programming model to
extract the customers’ opinion about the products to inform
the companies. They collected tweets via Twitter4J and
stored them in HDFS through Apache Flume. Then, they
performed the sentiment analysis via SentiGem sentiment
analysis API by classifying the words as negative, positive
and neutral opinion. Khade [44] used a C4.5 decision tree
algorithm by combining it with a MapReduce paradigm to
create a model which predicts customer behavior as they
claim that traditional decision tree algorithms are not
convenient for big data. They used a data set which con-
tains a large number of customer records related to pur-
chases. They successfully analyzed the new data using the
created model and stored the results in HDFS. They finally
visualized the data using D3.js through a web user
interface.
However, these works are not sufficient for providing an
adaptive and time-efficient framework for both streaming
and batch big Twitter data analysis. Table 1 gives a sum-
mary of other related papers along with their specifications
and limitations.
1.2 Motivation
Although some researchers have developed frameworks to
refer to this area, there is still a gap in the literature con-
cerning a comprehensive social media analysis [55]. The
authors in [56] define four basic steps of social media
analytics in comprehensive coverage: Discovery, revealing
of hidden structures; Tracking, which includes decisions
about the data source (e.g., LinkedIn, Instagram, Twitter),
approach and method; Preparation, which explains the
steps to make the data ready for processing; and finally
Analysis, which covers a variety of methods, including
opinion mining. In [57], the key factors of the difference
between this new fact and the traditional analytics are
summarized as 3V: Velocity, Volume and Variety, which
causes some problems on working with Twitter data, such
as (1) Retrieving data sets in real-time; (2) Extracting
useful information; (3) Getting meaningful outputs; (4)
Distinguishing the tweets based on the contents of the text;
(5) Visualizing the tweets along with the selected param-
eters. Different frameworks are proposed in the literature.
However, to the best of our knowledge, there is no previous
work addressing all the challenges above while proposing a
comprehensive framework for an automated classification
of Twitter messages into categories with a high accuracy
without intervention from a human operator and visual-
ization of the outputs in a very short period of time. This
work contributes to designing a highly available, scalable
and cost-effective framework for text classification in big
Neural Computing and Applications
123

data analytics. This research, therefore, shows the useful-
ness of the proposed framework that has many significant
advantages in terms of agility and flexibility along with the
accuracy of the analysis results that makes it one step ahead
of the other works, especially for early warning systems.
1.3 Contributions
In this paper, we aim to build a novel framework, HTwitt,
which allows users to collect, analyze and visualize a large
amount of Twitter data using a set of machine learning
algorithms in big data ecosystem. The contribution of this
paper is to develop the framework of the previous work
[58] to carry out the following scenarios:
• Proposing a novel framework for batch and stream
processing pipelines for smart early warning systems.
• The collection of real-time data from Twitter and
storing them into HDFS automatically without manual
intervention.
• Combining a set of techniques and algorithms with the
big data frameworks to analyze large-scale Twitter data.
• Defining the key factors that impact the performance of
the analysis of Twitter data, such as the levels of
overfitting in the training stage of the model using real-
world data sets in different size and the varying
execution time of the model training with different
CPU numbers based on the ideal data size.
• The visualization of the analyzed results on Google
Earth.
Outline. A brief background is given in Sect. 2. In Sect. 3,
the implementation of our proposed framework is pre-
sented. Section 4 illustrates the experimental results and
discussion while Sect. 5 concludes this paper discussing
the conclusion and future work.
2 Background
The rapid growth of social media has caused some serious
issues regarding data storage and management, which has
led to the emergence of big data framework technologies as
the classic data process methods are insufficient to handle
such data. The big data frameworks used in this work are
Apache Hadoop,1 Apache Mahout,2 Apache Flume3 along
with a set of machine learning techniques presented in the
next section. Apache Hadoop enables the processing of a
huge amount of data, both batch and streaming, and
implements MapReduce paradigm as a run-time system
[59] while Apache Mahout allows developers to implement
their machine learning algorithm by providing a set of
classification algorithms on a distributed cluster [60].
Apache Flume has the ability to collect, aggregate, and
move large amounts of streaming data from various sour-
ces to a centralized data storage like HDFS [61].
2.1 Preliminaries
In this section, important background concepts are given
briefly, including Naıve Bayes classifier, n-Grams language
model, Tf-Idf, Log-Likelihood Ratio Similarity, and Nor-
malization to develop the proposed model.
Table 1 Summary of other related papers
Study Analysis Methods Processing types Data usage Visualization
[45] MapReduce Naıve Bayes algo Batch Classification No
[46] MapReduce n-Gram language model Batch Decision support No
K-nearest neighbors algo
[47] MapReduce n-Gram language model Batch Event detection No
[48] MapReduce K-means algo Batch Clustering No
Particle swarm opt.
[49] Spark Random forest algo Real-time Early detection Yes
[50] Spark Naıve Bayes algo Real-time Disease detection No
Logistic regression
[51] MapReduce Approx. string matching Batch Spam detection No
[52] MapReduce Five-factor model Batch Personality extraction No
[53] Hive K-means algo Batch Clustering No
[54] MapReduce Clustering algo Batch Clustering No
1 https://hadoop.apache.org/.2 https://mahout.apache.org/.3 https://flume.apache.org/.
Neural Computing and Applications
123

2.1.1 Naıve Bayes classifier
Naıve Bayes is a well-known probabilistic classification
algorithm that proposes solutions for classification prob-
lems [62]. It is used for classification purpose through a set
of given predictors trained with training data that creates a
classifier by calculating the posterior probability based on
the attributes.
Equation 1 is used to calculate probability based on
class conditional independence in a Naıve Bayes algorithm.
Pðx=yÞ ¼ Pðy=xÞ � PðxÞPðyÞ ð1Þ
where P(x/y) represents the probability of event x occurring
when event y is given. P(x) shows the probability of
occurrence of x while P(y) indicates the probability of
occurrence of y. Lastly, P(y/x) states the probability of
event y occurring when event x is given.
2.1.2 n-grams language model
n-Grams models, termed as a series of words, are com-
monly used in statistical natural language processing [63].
Words are modelled so that each n-Gram consists of n
words for parsing. Each separate word is named as 1-Gram.
Two words, like happy day, are regarded as a single unit
and called 2-Grams (bigram). Figure 1 shows a sample of
n-Grams for three different models.
Equation 2 demonstrates the calculation of the n-Grams
language model.
pðwijw1; . . .;wi�1Þ ¼ pðwijwi�nþ1; . . .;wi�1Þ ð2Þ
Here, pðwiÞ states unigram and pðwijwi�1Þ symbolizes bi-
gram while pðwijwi�2;wi�1Þ indicates trigram [64].
When f is considered as a word, then
wf ¼Nf
countðf Þ ð3Þ
where f indicates the weight in the feature vector while Nf
states how many times f appeared in the tweet and finally
count(f) shows the quantity of f value.
2.1.3 Tf-Idf
Tf-Idf (term frequency-inverse document frequency) is a
text processing algorithm usually used in information
retrieval (IR) that reflects how relevant a keyword is in a
given document and assigns the importance to that key-
word depending on how many times it appears in the
document [65]. While the Tf represents how many times a
word is in a text, the Idf calculates how significant that
phrase is in the entire corpus. The calculations of tfi, idfi
and tfidf are shown in Eqs. 4, 5 and 6, respectively.
tfi ¼ðniÞPk nk
ð4Þ
idfi ¼ logjDj
jd : ti 2 dj ð5Þ
tfidf ¼ tf � idf ð6Þ
2.1.4 Log-likelihood ratio (LLR) similarity
LLR, one of the Mahout similarity algorithms for
improving the recommendation accuracy, is a way of cal-
culating the similarity between two objects depending on
the statistics. It estimates whether the probability of over-
lap between preferences is coincidental or because it really
is similar [66]. It is valid only when n-Grams size is greater
than 1. We used this technique as it solves the problem that,
for example, while generating n-Grams, some combina-
tions do not represent meaningful units, such as if the
sentence is it was the best of days, then was the is generated
in case of bigrams. When we generate weights using Td-Idf
by combining the unigrams and bigrams from a text, we
face many meaningless bigrams with large weights as they
have large Idf. Mahout solves this problem using log-
likelihood tests.
Equations 7 and 8 show the maximum likelihood
estimation.
pðwaÞ ¼cðwaÞN
ð7Þ
pðwbjwaÞ ¼cðwa;wbÞPwbcðwa;wbÞ
� cðwa;wbÞcðwaÞ
ð8Þ
where w symbolizes a phrase and N denotes the total
number of phrases while c(.) indicates the count of the
phrase sequence in the training data [64].
2.1.5 Normalization
In text mining, normalization is used to transform the text
into a single canonical form, namely a standard way to
present the text, which ensures that the text is consistent
(N=1) late be�er than never
(N=2) late be�er than neverlate be�er,be�er than, than never.
late,be�er,than, never.
(N=3) late be�er than neverlate be�er than,be�er than never.
Fig. 1 A sample of n-Grams models
Neural Computing and Applications
123
before the mining operations are performed on it [67]. This
process requires basic information about the type of text to
be normalized and the steps of the process thereafter.
Mahout uses what is known in statistics as the q-normfor normalization [68]. For instance, the calculation the q-norm of a 2-dimensional vector, [a, b], is:
a
ðjajq þ jbjqÞ1=q;
b
ðjajq þ jbjqÞ1=qð9Þ
The expression ðjajq þ jbjqÞ1=q is known as the vector
norm that any value greater than 0 can be used for q. Tocreate 2-normalized bigram vectors, in short Euclidean
norm, the -n flag must be set to 2 when using the seq2s-
parse command in Mahout. The 2-norm is demonstrated in
Eq. 10 while Eq. 11 shows the infinite norm.
affiffiffiffiffiffiffiffiffiffiffiffiffiffiffia2 þ b2
p ;b
ffiffiffiffiffiffiffiffiffiffiffiffiffiffiffia2 þ b2
p ð10Þ
a
maxðjaj; jbjÞ ;b
maxðjaj; jbjÞ ð11Þ
where the norm power (q) chosen depends on the type of
operations performed on the vector as seen from the
equations.
3 Proposed method
This section defines the overall architecture and imple-
mentation details of the proposed solution, HTwitt, for
analysis and visualization of tweets. Figure 2 describes the
high-level system architecture of proposed architecture
which consists of six main components: Batch Data
Injection, Data Preparation, Model Training and Testing,
Real-Time Data Collection/Injection, Classification, and
Visualization.
The preliminary version of this work [58] focuses
Twitter data classification only on batch historical data
without visualization. HTwitt is noticeably more suit-
able for analysis of Twitter data in terms of data collection
and visualization, which enables capture of real-time
streaming data at varying scales and visualization of the
analyzed tweets on Google Earth. Thus, this study con-
tributes to the background information for the use of big
data frameworks in Twitter data processing.
In theory, it is a new concept to automatically determine
whether tweets collected using specific keywords help to
collect and visualize the information via a map. This new
concept requires working with machine learning as well as
big data technologies to improve the accuracy of the
analysis of large amounts of tweets. The purpose of using
machine learning models in the paper is to learn the dif-
ferent relationships between pieces of tweets using pre-
labelled examples for training purposes. Then, they use
these learned patterns and give the classified tweets based
on the pre-defined labels without any manual intervention.
The proposed work consists of four main sections. The first
one is preparing raw data for model training, the second is
training a Tweet classifier. The third one is the real-time
collection of related tweets, and the last one is visualization
of the classified tweets on Google Earth.
3.1 Preparing raw data for model training
The data retrieved for this work are in a complex nested
JSON format that includes users’ text along with around 74
different attributes, such as hashtags, coordinates, entities,
truncated, name, screen_name, user_name, URLs, tweet id,
etc., which needs to be processed carefully to extract the
necessary information. It is very important to know the
structure of the tweets to perform the pre-processing on the
data.
3.1.1 Data gathering
The Twitter dataset acquired via the BGS is used to train
the model. This dataset was collected using hashtags with
certain keywords, landslide, mudslide, landfall, landslip,
soil sliding and without considering any specifications and
location restrictions. The data was collected between 29
November 2016 and 12 March 2017. The periods when the
tweets were collected are: 29 November 2016 to 20
December 2016, 13 January 2017 to 28 February 2017, and
01 March 2017 to 12 March 2017, which is in total 78 days
of data. A total of nearly 100,000 tweets were collected.
3.1.2 Pre-processing
Preprocessing is an important step making the text more
digestible by removing the noise, nonsense phrases,
unnecessary repetitions so that machine learning algo-
rithms can boost their efficiency [69]. Twitter Streaming
API provides the tweets in JSON (JavaScript Object
Notation) format which is the default response. However,
this brings some difficulties with it, such as the size and
complexity of the data. Such complex and large volume
data need big data technologies in order to be processed
and made ready for training and testing. In order to achieve
this goal, Data Preparation component, which consists of
Pre-processing and Grouping Tweets, is created. In the
Pre-processing step, the necessary elements, such as
country code, coordinates, the creation date, user id and
text, are parsed carefully using Gson library4 used to
deserialize JSON.
4 https://github.com/google/gson.
Neural Computing and Applications
123

3.1.3 MapReduce algorithm for grouping tweets
After the parsing process, tweets are grouped depending on
the unique code of each country to see which country the
tweet came from and are also grouped based on the time of
their creation to identify the time of events. In this way, the
tweets are easily distinguished by the BGS or interested
people based on these identifiers. These steps are executed
using MapReduce programming model in a Hadoop clus-
ter. Algorithm 1 and Algorithm 2 give pseudo code for
Map and Reduce functions, respectively. The dataset is
imported and converted into another dataset, where each
element is divided into tuples (key-values) during the Map
phase. As a first step, the first line of the data is taken and
converted to a string value (see Algorithm 1, Line 6). Then,
this value is split based on the delimiter (comma in our
case) (see Algorithm 1, Line 8). Next, the keys (country
code and tweet post date) are taken and are updated (see
Algorithm 1, Line 10 and see Algorithm 1, Line 11).
Finally, the intermediate data which is the output of the
Map function are generated for the Reduce function (see
Algorithm 1, Line 13).
After that, the output of the Map function is taken as
input by the Reduce task and all the inputs are combined
into a set of files. To this end, the key generated by theMap
function is taken and a file is created and this file is entitled
with this key (see Algorithm 2, Line 5). As a second step,
the value generated by Map function is copied into that file
(see Algorithm 2, Line 7). Besides, to group the tweets
based on the date when the tweets are posted they are
gathered in the same way by following Algorithm 2, Line
11 and Algorithm 2, Line 13. Lastly, the output of the
Reduce function is generated and the algorithm is com-
pleted (see Algorithm 2, Line 15). The outputs serve as
input for our next steps.
Fig. 2 HTwitt framework
Neural Computing and Applications
123
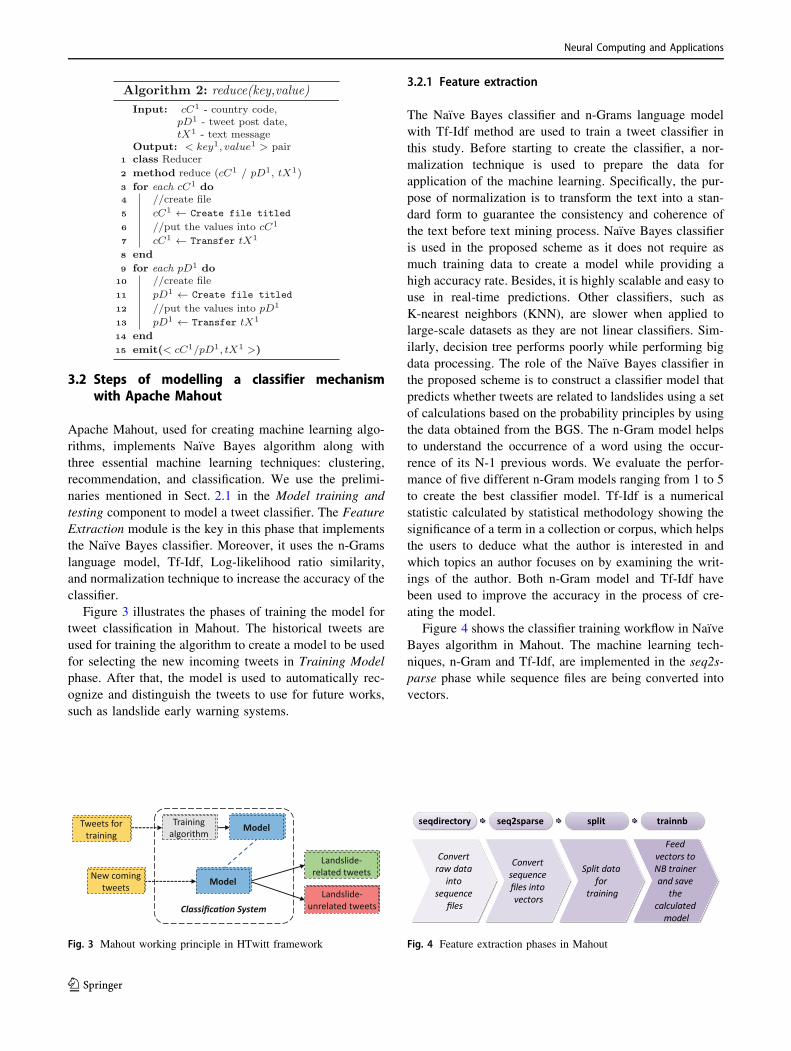
3.2 Steps of modelling a classifier mechanismwith Apache Mahout
Apache Mahout, used for creating machine learning algo-
rithms, implements Naıve Bayes algorithm along with
three essential machine learning techniques: clustering,
recommendation, and classification. We use the prelimi-
naries mentioned in Sect. 2.1 in the Model training and
testing component to model a tweet classifier. The Feature
Extraction module is the key in this phase that implements
the Naıve Bayes classifier. Moreover, it uses the n-Grams
language model, Tf-Idf, Log-likelihood ratio similarity,
and normalization technique to increase the accuracy of the
classifier.
Figure 3 illustrates the phases of training the model for
tweet classification in Mahout. The historical tweets are
used for training the algorithm to create a model to be used
for selecting the new incoming tweets in Training Model
phase. After that, the model is used to automatically rec-
ognize and distinguish the tweets to use for future works,
such as landslide early warning systems.
3.2.1 Feature extraction
The Naıve Bayes classifier and n-Grams language model
with Tf-Idf method are used to train a tweet classifier in
this study. Before starting to create the classifier, a nor-
malization technique is used to prepare the data for
application of the machine learning. Specifically, the pur-
pose of normalization is to transform the text into a stan-
dard form to guarantee the consistency and coherence of
the text before text mining process. Naıve Bayes classifier
is used in the proposed scheme as it does not require as
much training data to create a model while providing a
high accuracy rate. Besides, it is highly scalable and easy to
use in real-time predictions. Other classifiers, such as
K-nearest neighbors (KNN), are slower when applied to
large-scale datasets as they are not linear classifiers. Sim-
ilarly, decision tree performs poorly while performing big
data processing. The role of the Naıve Bayes classifier in
the proposed scheme is to construct a classifier model that
predicts whether tweets are related to landslides using a set
of calculations based on the probability principles by using
the data obtained from the BGS. The n-Gram model helps
to understand the occurrence of a word using the occur-
rence of its N-1 previous words. We evaluate the perfor-
mance of five different n-Gram models ranging from 1 to 5
to create the best classifier model. Tf-Idf is a numerical
statistic calculated by statistical methodology showing the
significance of a term in a collection or corpus, which helps
the users to deduce what the author is interested in and
which topics an author focuses on by examining the writ-
ings of the author. Both n-Gram model and Tf-Idf have
been used to improve the accuracy in the process of cre-
ating the model.
Figure 4 shows the classifier training workflow in Naıve
Bayes algorithm in Mahout. The machine learning tech-
niques, n-Gram and Tf-Idf, are implemented in the seq2s-
parse phase while sequence files are being converted into
vectors.
New coming tweets
Training algorithm
ModelLandslide-
unrelated tweets
Landslide-related tweets
Classifica�on System
Model
ModelTweets for training
Fig. 3 Mahout working principle in HTwitt framework
Convert raw data
into sequence
files
Convert sequence files into vectors
Split data for
training
Feed vectors to NB trainer and save
the calculated
model
seqdirectory seq2sparse split trainnb
Fig. 4 Feature extraction phases in Mahout
Neural Computing and Applications
123
3.3 Real-time collection/injection of relatedtweets
In this work, the real-time data are captured from Twitter
using Apache Flume via Twitter Streaming API. However,
this API gives low access to entire data to developers. The
data are provided in JSON format, presented in key/value
pairs. The following sub-steps need to be taken for getting
permission to access the streaming API to collect the
streaming data and sink them into HDFS.
3.3.1 The creating of Twitter application for Apache flumestreaming
The steps for creating a Twitter application are given
below.
1. Click on https://apps.twitter.com, then sign in the
Twitter account and click on ‘‘Create an app’’, then fill
the form.
2. Create own access token, then choose what Access
Type You Need.
3. Take a note of these OAuth Settings as they will be
used in the Flume.conf file to connect to this
application.
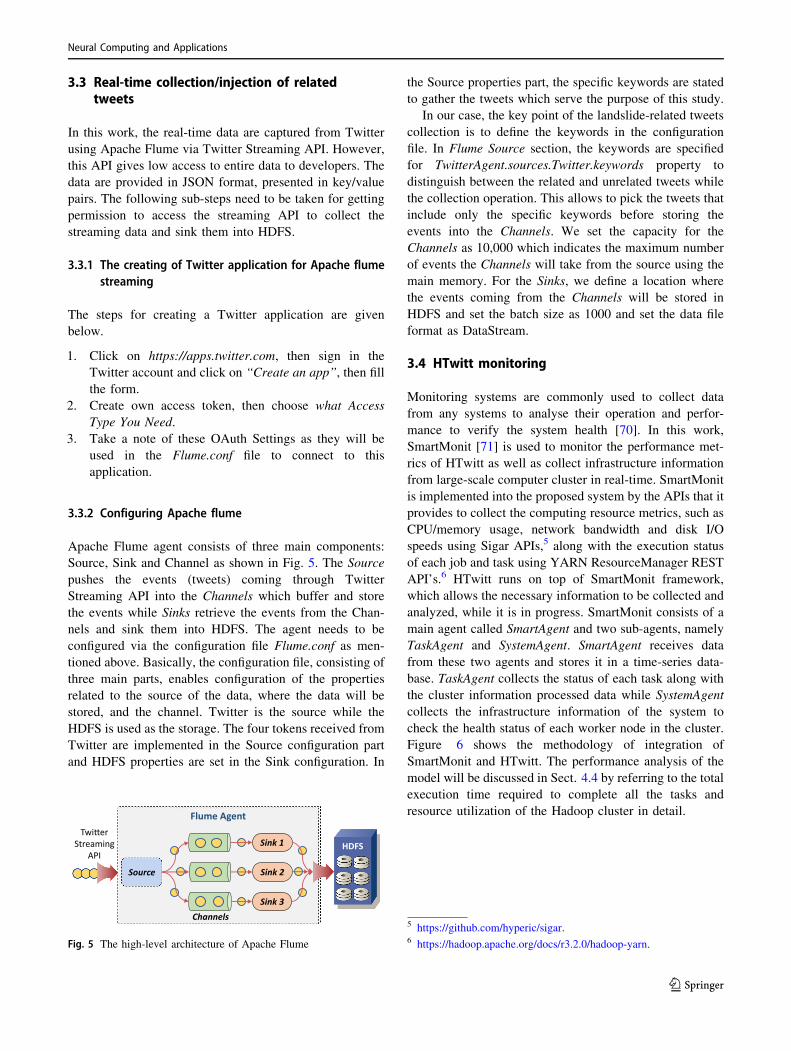
3.3.2 Configuring Apache flume
Apache Flume agent consists of three main components:
Source, Sink and Channel as shown in Fig. 5. The Source
pushes the events (tweets) coming through Twitter
Streaming API into the Channels which buffer and store
the events while Sinks retrieve the events from the Chan-
nels and sink them into HDFS. The agent needs to be
configured via the configuration file Flume.conf as men-
tioned above. Basically, the configuration file, consisting of
three main parts, enables configuration of the properties
related to the source of the data, where the data will be
stored, and the channel. Twitter is the source while the
HDFS is used as the storage. The four tokens received from
Twitter are implemented in the Source configuration part
and HDFS properties are set in the Sink configuration. In
the Source properties part, the specific keywords are stated
to gather the tweets which serve the purpose of this study.
In our case, the key point of the landslide-related tweets
collection is to define the keywords in the configuration
file. In Flume Source section, the keywords are specified
for TwitterAgent.sources.Twitter.keywords property to
distinguish between the related and unrelated tweets while
the collection operation. This allows to pick the tweets that
include only the specific keywords before storing the
events into the Channels. We set the capacity for the
Channels as 10,000 which indicates the maximum number
of events the Channels will take from the source using the
main memory. For the Sinks, we define a location where
the events coming from the Channels will be stored in
HDFS and set the batch size as 1000 and set the data file
format as DataStream.
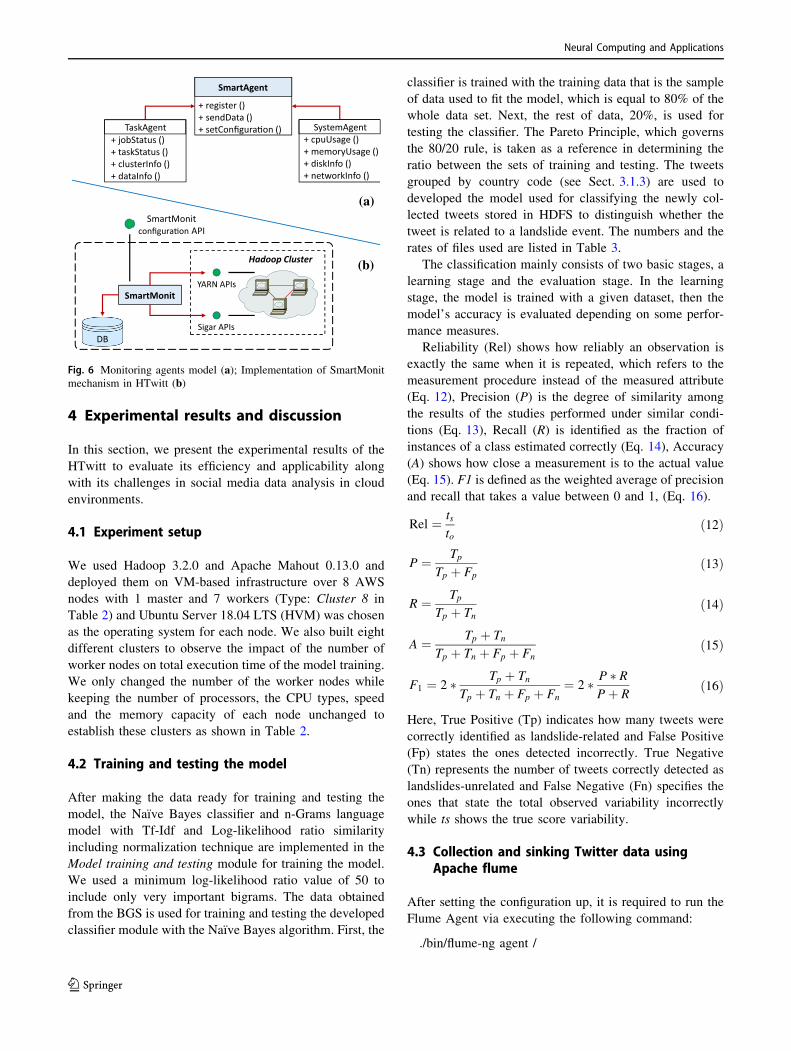
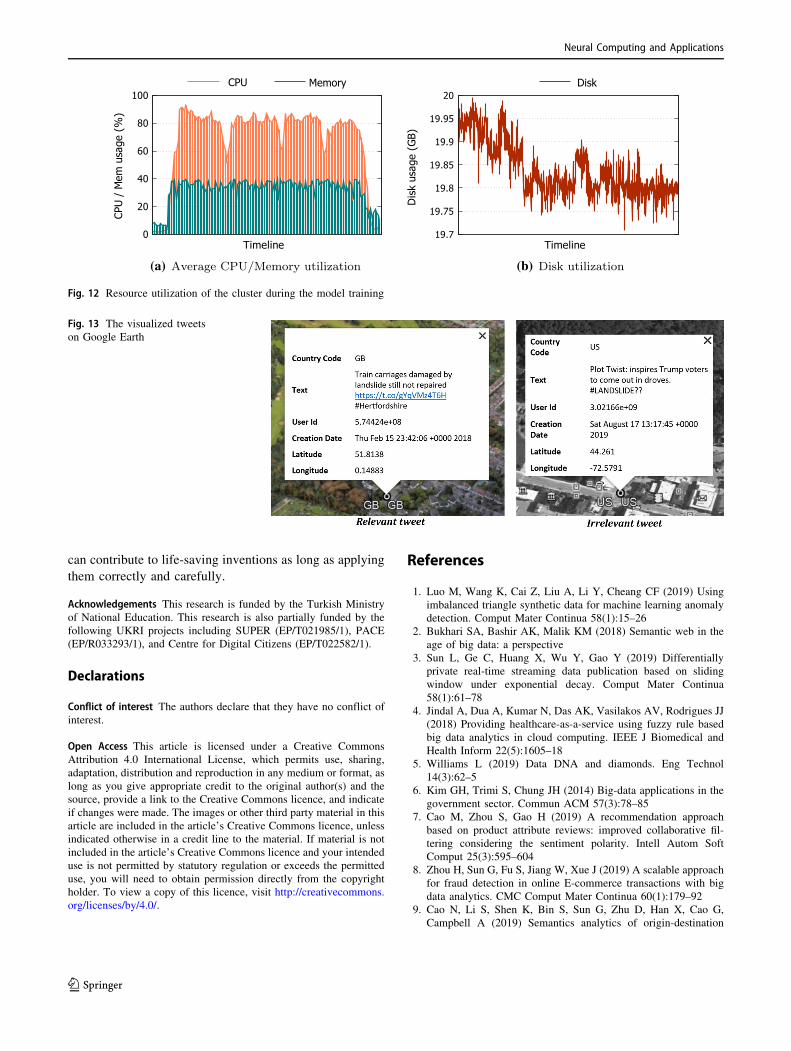
3.4 HTwitt monitoring
Monitoring systems are commonly used to collect data
from any systems to analyse their operation and perfor-
mance to verify the system health [70]. In this work,
SmartMonit [71] is used to monitor the performance met-
rics of HTwitt as well as collect infrastructure information
from large-scale computer cluster in real-time. SmartMonit
is implemented into the proposed system by the APIs that it
provides to collect the computing resource metrics, such as
CPU/memory usage, network bandwidth and disk I/O
speeds using Sigar APIs,5 along with the execution status
of each job and task using YARN ResourceManager REST
API’s.6 HTwitt runs on top of SmartMonit framework,
which allows the necessary information to be collected and
analyzed, while it is in progress. SmartMonit consists of a
main agent called SmartAgent and two sub-agents, namely
TaskAgent and SystemAgent. SmartAgent receives data
from these two agents and stores it in a time-series data-
base. TaskAgent collects the status of each task along with
the cluster information processed data while SystemAgent
collects the infrastructure information of the system to
check the health status of each worker node in the cluster.
Figure 6 shows the methodology of integration of
SmartMonit and HTwitt. The performance analysis of the
model will be discussed in Sect. 4.4 by referring to the total
execution time required to complete all the tasks and
resource utilization of the Hadoop cluster in detail.
Twi�er Streaming
API
Channels
Source
Sink 3
Sink 2
Sink 1
Flume Agent
HDFS
Fig. 5 The high-level architecture of Apache Flume
5 https://github.com/hyperic/sigar.6 https://hadoop.apache.org/docs/r3.2.0/hadoop-yarn.
Neural Computing and Applications
123
4 Experimental results and discussion
In this section, we present the experimental results of the
HTwitt to evaluate its efficiency and applicability along
with its challenges in social media data analysis in cloud
environments.
4.1 Experiment setup
We used Hadoop 3.2.0 and Apache Mahout 0.13.0 and
deployed them on VM-based infrastructure over 8 AWS
nodes with 1 master and 7 workers (Type: Cluster 8 in
Table 2) and Ubuntu Server 18.04 LTS (HVM) was chosen
as the operating system for each node. We also built eight
different clusters to observe the impact of the number of
worker nodes on total execution time of the model training.
We only changed the number of the worker nodes while
keeping the number of processors, the CPU types, speed
and the memory capacity of each node unchanged to
establish these clusters as shown in Table 2.
4.2 Training and testing the model
After making the data ready for training and testing the
model, the Naıve Bayes classifier and n-Grams language
model with Tf-Idf and Log-likelihood ratio similarity
including normalization technique are implemented in the
Model training and testing module for training the model.
We used a minimum log-likelihood ratio value of 50 to
include only very important bigrams. The data obtained
from the BGS is used for training and testing the developed
classifier module with the Naıve Bayes algorithm. First, the
classifier is trained with the training data that is the sample
of data used to fit the model, which is equal to 80% of the
whole data set. Next, the rest of data, 20%, is used for
testing the classifier. The Pareto Principle, which governs
the 80/20 rule, is taken as a reference in determining the
ratio between the sets of training and testing. The tweets
grouped by country code (see Sect. 3.1.3) are used to
developed the model used for classifying the newly col-
lected tweets stored in HDFS to distinguish whether the
tweet is related to a landslide event. The numbers and the
rates of files used are listed in Table 3.
The classification mainly consists of two basic stages, a
learning stage and the evaluation stage. In the learning
stage, the model is trained with a given dataset, then the
model’s accuracy is evaluated depending on some perfor-
mance measures.
Reliability (Rel) shows how reliably an observation is
exactly the same when it is repeated, which refers to the
measurement procedure instead of the measured attribute
(Eq. 12), Precision (P) is the degree of similarity among
the results of the studies performed under similar condi-
tions (Eq. 13), Recall (R) is identified as the fraction of
instances of a class estimated correctly (Eq. 14), Accuracy
(A) shows how close a measurement is to the actual value
(Eq. 15). F1 is defined as the weighted average of precision
and recall that takes a value between 0 and 1, (Eq. 16).
Rel ¼ tsto
ð12Þ
P ¼ TpTp þ Fp
ð13Þ
R ¼ TpTp þ Tn
ð14Þ
A ¼ Tp þ TnTp þ Tn þ Fp þ Fn
ð15Þ
F1 ¼ 2 � Tp þ TnTp þ Tn þ Fp þ Fn
¼ 2 � P � RPþ R
ð16Þ
Here, True Positive (Tp) indicates how many tweets were
correctly identified as landslide-related and False Positive
(Fp) states the ones detected incorrectly. True Negative
(Tn) represents the number of tweets correctly detected as
landslides-unrelated and False Negative (Fn) specifies the
ones that state the total observed variability incorrectly
while ts shows the true score variability.
4.3 Collection and sinking Twitter data usingApache flume
After setting the configuration up, it is required to run the
Flume Agent via executing the following command:
./bin/flume-ng agent /
+ jobStatus ()+ taskStatus () + clusterInfo () + dataInfo ()
TaskAgent+ cpuUsage ()+ memoryUsage ()+ diskInfo () + networkInfo ()
SystemAgent
+ register () + sendData ()+ setConfigura on ()
SmartAgent
SmartMonit
Hadoop Cluster
YARN APIs
Sigar APIs
SmartMonit configura API
(a)
(b)
DB
Fig. 6 Monitoring agents model (a); Implementation of SmartMonit
mechanism in HTwitt (b)
Neural Computing and Applications
123

-f TwitterStream.properties /
--name TwitterAgent /
--conf $FLUME_HOME/conf /
-Dflume.root.logger=INFO, console
The description of the parameters of the command is
given below:
name: specifies the name of the Agent. Here it is
TwitterAgent.
conf: indicates the configuration directory of the flume.
Dflume.root.logger=INFO, console: writes the logs to
the console.
4.4 Experimental results
The trained model is tested for different n-Grams models at
different splits of the dataset as shown in Fig. 7. The
estimated accuracy results for the model indicate that the
classifier with different n-Gram models accurately classi-
fies Twitter data with an accuracy rate of around 71% to
95%. The best result, 94.28%, was reached using the
3-Grams model with 25% dataset split ratio shown in
Table 4.
F1 score, the success criterion, helps to understand the
performance of the classifier along with Accuracy criteria,
which gives an indication of the classifier consistency.
Figure 8 shows the correlation between F1 score and
Accuracy based on the best results of all n-Grams values.
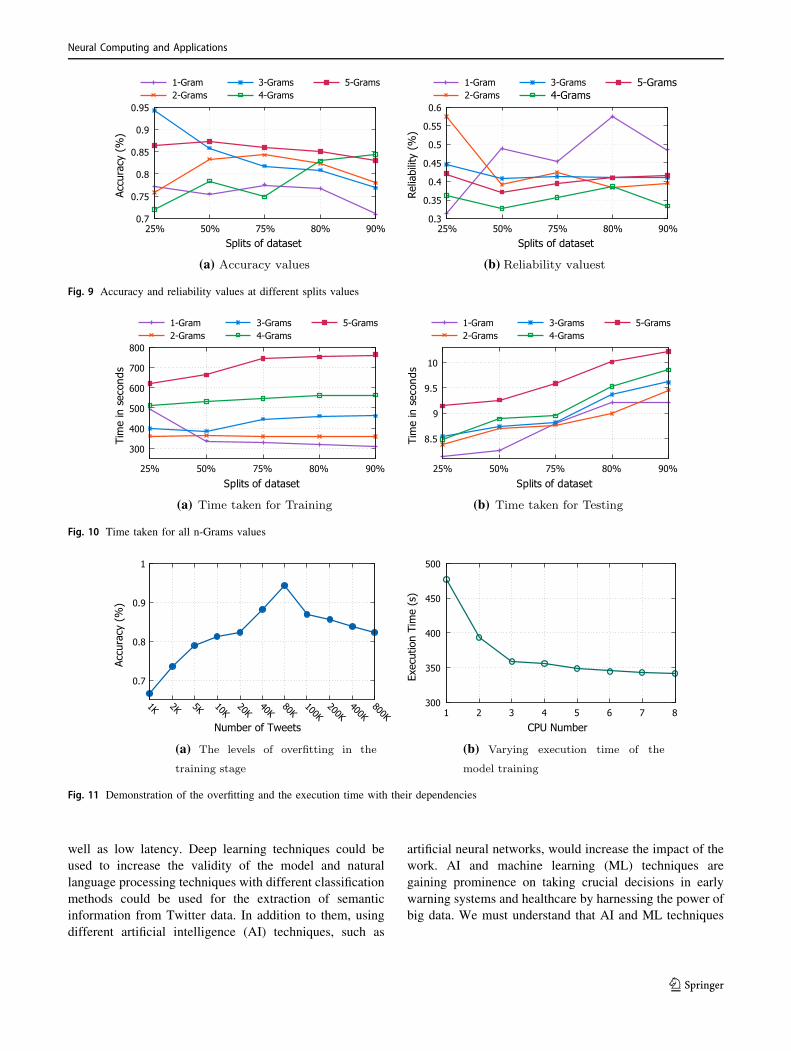
Figure 9a demonstrates the accuracy values at five differ-
ent splits of the dataset while the results of the reliability
values are shown in Fig. 9b.
We have monitored the performance of our machine
learning model by examining the execution time for both
the training and testing phases with respect to the splits of
the dataset shown in Fig. 10a and b, respectively.
The levels of overfitting in the training stage of the
model via real-world data sets taken from Twitter are
shown in Fig. 11a while Fig. 11b demonstrates the rela-
tionship between CPU number and execution time in the
training stage of the model while the number of tweets as
80K and keeping the number of Mappers unchanged. We
conducted this experiment that aims to build a classifier
using the 3-Grams model with 25% dataset split ratio as it
has given the best results and deployed it to the eight dif-
ferent clusters in AWS with 3.0 GHz Intel Scalable Pro-
cessors shown in Table 2.
Finally, Fig. 12a demonstrates the average CPU and
memory utilization while Fig. 12b shows the disk utiliza-
tion across the whole cluster during the model training.
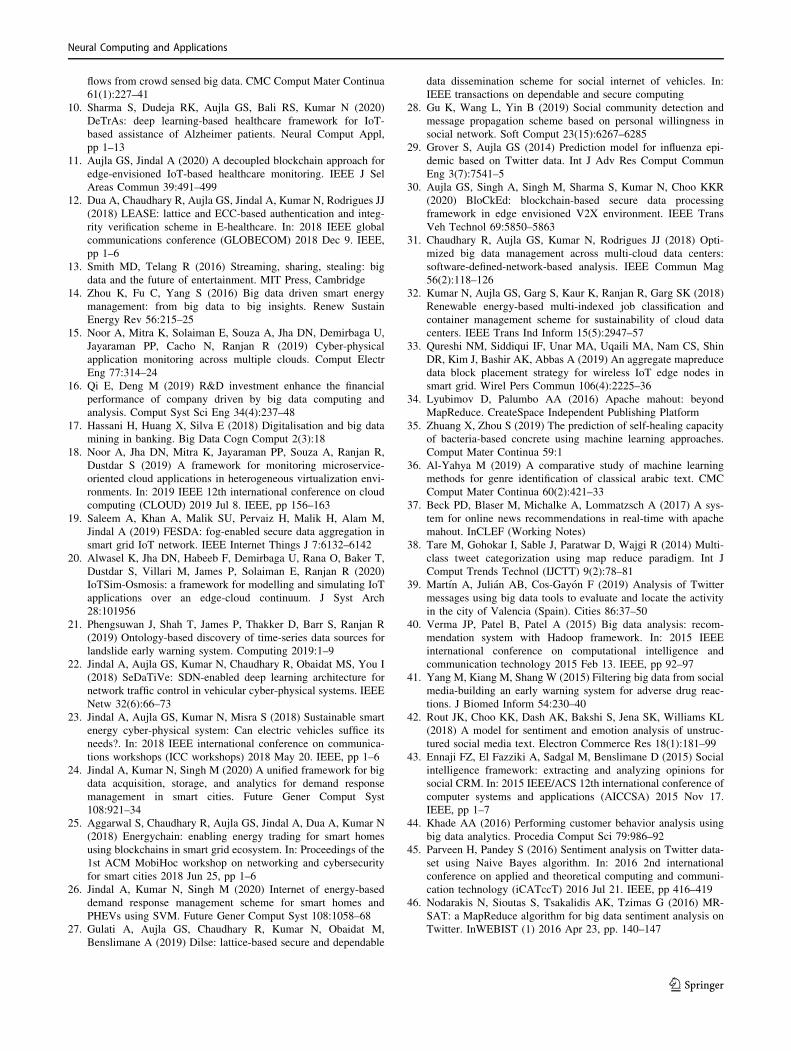
4.5 Visualization of the classified Tweetson Google Earth
The visualization of geographically linked data on Google
Earth is one of the effective and simple ways as the user
can come closer to a point of interest or go away from
somewhere using a mouse. The analyzed data, containing
the specific attributes, are visualized on Google Earth using
the location information via SmartWriter which is the agent
responsible to receive the predicted decisions and transfer
them to Google Earth. Figure 13 shows the screenshots of
the visualized tweets, posted from the United Kingdom that
is a landslide-related tweet and posted from the United
Table 2 Clusters specification adopted in the experiments in AWS
Cluster type Specification (no. of nodes) Total CPU Core (3.0 GHz) Total memory (GB) Total storage (GB)
Cluster 1 pseudo-distributed 1 8 30
Cluster 2 1 master, 1 slave 2 16 60
Cluster 3 1 master, 2 slaves 3 24 90
Cluster 4 1 master, 3 slaves 4 32 120
Cluster 5 1 master, 4 slaves 5 40 150
Cluster 6 1 master, 5 slaves 6 48 180
Cluster 7 1 master, 6 slaves 7 56 210
Cluster 8 1 master, 7 slaves 8 64 240
Table 3 The ratio of training
and testing dataData set
Training data (80%) Testing data (20%) Total (100%)
80K tweets (in 17 files) 20K tweets (in 100 files) 100K tweets (in 117 files)
Neural Computing and Applications
123

States that is not a landslide-related tweet, on Google
Earth.
4.6 Discussion
Twitter data analysis has some challenges regarding data
collection and processing due to the complexity of the data
in JSON format. Furthermore, it requires use of efficient
machine learning techniques along with big data tools to
extract the beneficial and usable information from the large
amount of data. Another challenge is the data collection
from Twitter via Streaming API because of some restric-
tions set by Twitter. The main challenge is to distinguish
whether the tweets are related to a landslide natural event
or not due to the homonyms words. Considering these
challenges, the evaluation shows the classification with
Apache Mahout along with the Naıve Bayes algorithm is
very efficient and the proposed framework, HTwitt, is
promising, having an accuracy of 94.28%.
5 Conclusion and future work
Many institutions and organizations around the world use
social media platforms like Twitter to explore people’s
feelings, attitudes, and behaviors regarding any situation
for mostly commercial purposes. For instance, the BGS
uses Twitter to make an inference about the natural disaster
of landslides. In this study, a novel technique is presented
to automatically analyze tweets and a model is proposed
for the BGS or those who are curious about this area to
distinguish the landslide-related tweets. Apache Hadoop
and Apache Mahout are used to process the given data and
develop the model. The batch data from the BGS, around
100K, is primarily used in the training and testing stages.
The results show the model is very successful in the cat-
egorization of Twitter data using big data technologies like
Apache Hadoop and machine learning algorithm along
with some techniques.
Combining the perspectives of batch and real-time
processing techniques is a promising approach for future
work. As a further step, Apache Flink could be used to
collect and analyze the Twitter data in real-time as it
promises high compatibility with Hadoop ecosystem as
-Gram model
Valu
es
Splits of dataset25% 50% 75% 80% 90%
1
0.8
0.6
0.4
0.2
0
F1 ScoreRecallPrecisionSDKappa
-Grams model
Valu
es
Splits of dataset25% 50% 75% 80% 90%
1
0.8
0.6
0.4
0.2
0
-Grams model
Valu
es
Splits of dataset25% 50% 75% 80% 90%
1
0.8
0.6
0.4
0.2
0
-Grams model
Valu
es
Splits of dataset
25% 50% 75% 80% 90%
1
0.8
0.6
0.4
0.2
0
(a) 1 (b) 2 (c) 3
(d) 4 (e) 5-Grams model
Valu
es
Splits of dataset
25% 50% 75% 80% 90%
1
0.8
0.6
0.4
0.2
0
Fig. 7 The results of all n-Grams models
Table 4 The number of the classified files
Summary
Correctly classified files 33 94.2857 %
Incorrectly classified files 2 5.7143 %
Total classified files 35
0.75
0.8
0.85
0.9
0.95
1-Gram 2-Grams 3-Grams 4-Grams 5-Grams
Perc
enta
ge (
%)
n-Grams values
Accuracy F1 Score
Fig. 8 Relationship between accuracy and F1 score
Neural Computing and Applications
123
well as low latency. Deep learning techniques could be
used to increase the validity of the model and natural
language processing techniques with different classification
methods could be used for the extraction of semantic
information from Twitter data. In addition to them, using
different artificial intelligence (AI) techniques, such as
artificial neural networks, would increase the impact of the
work. AI and machine learning (ML) techniques are
gaining prominence on taking crucial decisions in early
warning systems and healthcare by harnessing the power of
big data. We must understand that AI and ML techniques
0.7
0.75
0.8
0.85
0.9
0.95
25% 50% 75% 80% 90%
Accu
racy
(%
)
Splits of dataset
1-Gram2-Grams
3-Grams4-Grams
5-Grams
(a) Accuracy values
0.3
0.35
0.4
0.45
0.5
0.55
0.6
25% 50% 75% 80% 90%
Relia
bilit
y (%
)
Splits of dataset
1-Gram2-Grams
3-Grams4-Grams
5-Grams
(b) Reliability valuest
Fig. 9 Accuracy and reliability values at different splits values
300
400
500
600
700
800
25% 50% 75% 80% 90%
Tim
e in
sec
onds
Splits of dataset
1-Gram2-Grams
3-Grams4-Grams
5-Grams
(a) Time taken for Training
8.5
9
9.5
10
25% 50% 75% 80% 90%
Tim
e in
sec
onds
Splits of dataset
1-Gram2-Grams
3-Grams4-Grams
5-Grams
(b) Time taken for Testing
Fig. 10 Time taken for all n-Grams values
0.7
0.8
0.9
1
1K 2K 5K 10K20K
40K80K
100K200K
400K800K
Accu
racy
(%
)
Number of Tweets
(a) The levels of overfitting in the
training stage
300
350
400
450
500
1 2 3 4 5 6 7 8
Exec
utio
n Ti
me
(s)
CPU Number
(b) Varying execution time of the
model training
Fig. 11 Demonstration of the overfitting and the execution time with their dependencies
Neural Computing and Applications
123
can contribute to life-saving inventions as long as applying
them correctly and carefully.
Acknowledgements This research is funded by the Turkish Ministry
of National Education. This research is also partially funded by the
following UKRI projects including SUPER (EP/T021985/1), PACE
(EP/R033293/1), and Centre for Digital Citizens (EP/T022582/1).
Declarations
Conflict of interest The authors declare that they have no conflict of
interest.
Open Access This article is licensed under a Creative Commons
Attribution 4.0 International License, which permits use, sharing,
adaptation, distribution and reproduction in any medium or format, as
long as you give appropriate credit to the original author(s) and the
source, provide a link to the Creative Commons licence, and indicate
if changes were made. The images or other third party material in this
article are included in the article’s Creative Commons licence, unless
indicated otherwise in a credit line to the material. If material is not
included in the article’s Creative Commons licence and your intended
use is not permitted by statutory regulation or exceeds the permitted
use, you will need to obtain permission directly from the copyright
holder. To view a copy of this licence, visit http://creativecommons.
org/licenses/by/4.0/.
References
1. Luo M, Wang K, Cai Z, Liu A, Li Y, Cheang CF (2019) Using
imbalanced triangle synthetic data for machine learning anomaly
detection. Comput Mater Continua 58(1):15–26
2. Bukhari SA, Bashir AK, Malik KM (2018) Semantic web in the
age of big data: a perspective
3. Sun L, Ge C, Huang X, Wu Y, Gao Y (2019) Differentially
private real-time streaming data publication based on sliding
window under exponential decay. Comput Mater Continua
58(1):61–78
4. Jindal A, Dua A, Kumar N, Das AK, Vasilakos AV, Rodrigues JJ
(2018) Providing healthcare-as-a-service using fuzzy rule based
big data analytics in cloud computing. IEEE J Biomedical and
Health Inform 22(5):1605–18
5. Williams L (2019) Data DNA and diamonds. Eng Technol
14(3):62–5
6. Kim GH, Trimi S, Chung JH (2014) Big-data applications in the
government sector. Commun ACM 57(3):78–85
7. Cao M, Zhou S, Gao H (2019) A recommendation approach
based on product attribute reviews: improved collaborative fil-
tering considering the sentiment polarity. Intell Autom Soft
Comput 25(3):595–604
8. Zhou H, Sun G, Fu S, Jiang W, Xue J (2019) A scalable approach
for fraud detection in online E-commerce transactions with big
data analytics. CMC Comput Mater Continua 60(1):179–92
9. Cao N, Li S, Shen K, Bin S, Sun G, Zhu D, Han X, Cao G,
Campbell A (2019) Semantics analytics of origin-destination
0
20
40
60
80
100
CPU
/ M
em u
sage
(%
)
Timeline
CPU Memory
(a) Average CPU/Memory utilization
19.7
19.75
19.8
19.85
19.9
19.95
20
Dis
k us
age
(GB)
Timeline
Disk
(b) Disk utilization
Fig. 12 Resource utilization of the cluster during the model training
Fig. 13 The visualized tweets
on Google Earth
Neural Computing and Applications
123
flows from crowd sensed big data. CMC Comput Mater Continua
61(1):227–41
10. Sharma S, Dudeja RK, Aujla GS, Bali RS, Kumar N (2020)
DeTrAs: deep learning-based healthcare framework for IoT-
based assistance of Alzheimer patients. Neural Comput Appl,
pp 1–13
11. Aujla GS, Jindal A (2020) A decoupled blockchain approach for
edge-envisioned IoT-based healthcare monitoring. IEEE J Sel
Areas Commun 39:491–499
12. Dua A, Chaudhary R, Aujla GS, Jindal A, Kumar N, Rodrigues JJ
(2018) LEASE: lattice and ECC-based authentication and integ-
rity verification scheme in E-healthcare. In: 2018 IEEE global
communications conference (GLOBECOM) 2018 Dec 9. IEEE,
pp 1–6
13. Smith MD, Telang R (2016) Streaming, sharing, stealing: big
data and the future of entertainment. MIT Press, Cambridge
14. Zhou K, Fu C, Yang S (2016) Big data driven smart energy
management: from big data to big insights. Renew Sustain
Energy Rev 56:215–25
15. Noor A, Mitra K, Solaiman E, Souza A, Jha DN, Demirbaga U,
Jayaraman PP, Cacho N, Ranjan R (2019) Cyber-physical
application monitoring across multiple clouds. Comput Electr
Eng 77:314–24
16. Qi E, Deng M (2019) R&D investment enhance the financial
performance of company driven by big data computing and
analysis. Comput Syst Sci Eng 34(4):237–48
17. Hassani H, Huang X, Silva E (2018) Digitalisation and big data
mining in banking. Big Data Cogn Comput 2(3):18
18. Noor A, Jha DN, Mitra K, Jayaraman PP, Souza A, Ranjan R,
Dustdar S (2019) A framework for monitoring microservice-
oriented cloud applications in heterogeneous virtualization envi-
ronments. In: 2019 IEEE 12th international conference on cloud
computing (CLOUD) 2019 Jul 8. IEEE, pp 156–163
19. Saleem A, Khan A, Malik SU, Pervaiz H, Malik H, Alam M,
Jindal A (2019) FESDA: fog-enabled secure data aggregation in
smart grid IoT network. IEEE Internet Things J 7:6132–6142
20. Alwasel K, Jha DN, Habeeb F, Demirbaga U, Rana O, Baker T,
Dustdar S, Villari M, James P, Solaiman E, Ranjan R (2020)
IoTSim-Osmosis: a framework for modelling and simulating IoT
applications over an edge-cloud continuum. J Syst Arch
28:101956
21. Phengsuwan J, Shah T, James P, Thakker D, Barr S, Ranjan R
(2019) Ontology-based discovery of time-series data sources for
landslide early warning system. Computing 2019:1–9
22. Jindal A, Aujla GS, Kumar N, Chaudhary R, Obaidat MS, You I
(2018) SeDaTiVe: SDN-enabled deep learning architecture for
network traffic control in vehicular cyber-physical systems. IEEE
Netw 32(6):66–73
23. Jindal A, Aujla GS, Kumar N, Misra S (2018) Sustainable smart
energy cyber-physical system: Can electric vehicles suffice its
needs?. In: 2018 IEEE international conference on communica-
tions workshops (ICC workshops) 2018 May 20. IEEE, pp 1–6
24. Jindal A, Kumar N, Singh M (2020) A unified framework for big
data acquisition, storage, and analytics for demand response
management in smart cities. Future Gener Comput Syst
108:921–34
25. Aggarwal S, Chaudhary R, Aujla GS, Jindal A, Dua A, Kumar N
(2018) Energychain: enabling energy trading for smart homes
using blockchains in smart grid ecosystem. In: Proceedings of the
1st ACM MobiHoc workshop on networking and cybersecurity
for smart cities 2018 Jun 25, pp 1–6
26. Jindal A, Kumar N, Singh M (2020) Internet of energy-based
demand response management scheme for smart homes and
PHEVs using SVM. Future Gener Comput Syst 108:1058–68
27. Gulati A, Aujla GS, Chaudhary R, Kumar N, Obaidat M,
Benslimane A (2019) Dilse: lattice-based secure and dependable
data dissemination scheme for social internet of vehicles. In:
IEEE transactions on dependable and secure computing
28. Gu K, Wang L, Yin B (2019) Social community detection and
message propagation scheme based on personal willingness in
social network. Soft Comput 23(15):6267–6285
29. Grover S, Aujla GS (2014) Prediction model for influenza epi-
demic based on Twitter data. Int J Adv Res Comput Commun
Eng 3(7):7541–5
30. Aujla GS, Singh A, Singh M, Sharma S, Kumar N, Choo KKR
(2020) BloCkEd: blockchain-based secure data processing
framework in edge envisioned V2X environment. IEEE Trans
Veh Technol 69:5850–5863
31. Chaudhary R, Aujla GS, Kumar N, Rodrigues JJ (2018) Opti-
mized big data management across multi-cloud data centers:
software-defined-network-based analysis. IEEE Commun Mag
56(2):118–126
32. Kumar N, Aujla GS, Garg S, Kaur K, Ranjan R, Garg SK (2018)
Renewable energy-based multi-indexed job classification and
container management scheme for sustainability of cloud data
centers. IEEE Trans Ind Inform 15(5):2947–57
33. Qureshi NM, Siddiqui IF, Unar MA, Uqaili MA, Nam CS, Shin
DR, Kim J, Bashir AK, Abbas A (2019) An aggregate mapreduce
data block placement strategy for wireless IoT edge nodes in
smart grid. Wirel Pers Commun 106(4):2225–36
34. Lyubimov D, Palumbo AA (2016) Apache mahout: beyond
MapReduce. CreateSpace Independent Publishing Platform
35. Zhuang X, Zhou S (2019) The prediction of self-healing capacity
of bacteria-based concrete using machine learning approaches.
Comput Mater Continua 59:1
36. Al-Yahya M (2019) A comparative study of machine learning
methods for genre identification of classical arabic text. CMC
Comput Mater Continua 60(2):421–33
37. Beck PD, Blaser M, Michalke A, Lommatzsch A (2017) A sys-
tem for online news recommendations in real-time with apache
mahout. InCLEF (Working Notes)
38. Tare M, Gohokar I, Sable J, Paratwar D, Wajgi R (2014) Multi-
class tweet categorization using map reduce paradigm. Int J
Comput Trends Technol (IJCTT) 9(2):78–81
39. Martın A, Julian AB, Cos-Gayon F (2019) Analysis of Twitter
messages using big data tools to evaluate and locate the activity
in the city of Valencia (Spain). Cities 86:37–50
40. Verma JP, Patel B, Patel A (2015) Big data analysis: recom-
mendation system with Hadoop framework. In: 2015 IEEE
international conference on computational intelligence and
communication technology 2015 Feb 13. IEEE, pp 92–97
41. Yang M, Kiang M, Shang W (2015) Filtering big data from social
media-building an early warning system for adverse drug reac-
tions. J Biomed Inform 54:230–40
42. Rout JK, Choo KK, Dash AK, Bakshi S, Jena SK, Williams KL
(2018) A model for sentiment and emotion analysis of unstruc-
tured social media text. Electron Commerce Res 18(1):181–99
43. Ennaji FZ, El Fazziki A, Sadgal M, Benslimane D (2015) Social
intelligence framework: extracting and analyzing opinions forsocial CRM. In: 2015 IEEE/ACS 12th international conference of
computer systems and applications (AICCSA) 2015 Nov 17.
IEEE, pp 1–7
44. Khade AA (2016) Performing customer behavior analysis using
big data analytics. Procedia Comput Sci 79:986–92
45. Parveen H, Pandey S (2016) Sentiment analysis on Twitter data-
set using Naive Bayes algorithm. In: 2016 2nd international
conference on applied and theoretical computing and communi-
cation technology (iCATccT) 2016 Jul 21. IEEE, pp 416–419
46. Nodarakis N, Sioutas S, Tsakalidis AK, Tzimas G (2016) MR-
SAT: a MapReduce algorithm for big data sentiment analysis on
Twitter. InWEBIST (1) 2016 Apr 23, pp. 140–147
Neural Computing and Applications
123
47. Yan P (2017) Mapreduce and semantics enabled event detection
using social media. J Artif Intell Soft Comput Res 7(3):201–13
48. Chunne AP, Chandrasekhar U, Malhotra C (2015) Real time
clustering of tweets using adaptive PSO technique and MapRe-
duce. In: 2015 global conference on communication technologies
(GCCT) 2015 Apr 23. IEEE, pp 452–457
49. Ed-Daoudy A, Maalmi K (2019) Real-time machine learning for
early detection of heart disease using big data approach. In: 2019
international conference on wireless technologies, embedded and
intelligent systems (WITS) 2019 Apr 3. IEEE, pp 1–5
50. Alotaibi S, Mehmood R, Katib I, Rana O, Albeshri A (2020)
Sehaa: a big data analytics tool for healthcare symptoms and
diseases detection using Twitter, apache spark, and machine
learning. Appl Sci 10(4):1398
51. Kumar A, Singh M, Pais AR (2019) Fuzzy string matching
algorithm for spam detection in Twitter. In: International con-
ference on security and privacy (2019 Jan 9). Springer, Singa-
pore, pp 289–301
52. Kafeza E, Kanavos A, Makris C, Pispirigos G, Vikatos P (2019)
T-PCCE: Twitter personality based communicative communities
extraction system for big data. IEEE Trans Knowl Data Eng
32:1625–1638
53. El Abdouli A, Hassouni L, Anoun H (2019) A distributed
approach for mining moroccan hashtags using Twitter platform.
In: Proceedings of the 2nd international conference on network-
ing, information systems and security 2019 Mar 27, pp 1–10
54. Tripathi AK, Sharma K, Bala M, Kumar A, Menon VG, Bashir
AK (2020) A parallel military dog based algorithm for clustering
big data in cognitive industrial internet of things. IEEE Trans Ind
Inform 17:2134–2142
55. Wang G, Liu M (2019) Dynamic trust model based on service
recommendation in big data. Comput Mater Continua
58:845–857
56. Chinnov A, Kerschke P, Meske C, Stieglitz S, Trautmann H
(2015) An overview of topic discovery in Twitter communication
through social media analytics
57. Barika M, Garg S, Zomaya AY, Wang L, Moorsel AV, Ranjan R
(2019) Orchestrating big data analysis workflows in the cloud:
research challenges, survey, and future directions. ACM Comput
Surv (CSUR) 52(5):1–41
58. Demirbaga U, Jha DN (2018) Social media data analysis using
MapReduce programming model and training a Tweet Classifier
using Apache Mahout. In: 2018 IEEE 8th international sympo-
sium on cloud and service computing (SC2) 2018 Nov 18. IEEE,
pp 116–121
59. Ramaraju R, Ravi G, Madhavi K (2021) Sentimental analysis on
Twitter data using hadoop with spring web MVC. In: Intelligent
system design. Springer, Singapore, pp 265–273
60. Dulhare UN, Gouse S (2020) Hands on MAHOUT-machine
learning tool. Mach Learn Big Data Concepts Algorithms Tools
Appl 15:361–421
61. Vohra D (2016) Apache flume. In: Practical Hadoop ecosystem
2016. Apress, Berkeley, CA, pp 287–300
62. Rish I (2001) An empirical study of the Naive Bayes classifier.
In: IJCAI 2001 workshop on empirical methods in artificial
intelligence 2001 Aug 4, vol 3, No 22, pp 41–46
63. Brown PF, Desouza PV, Mercer RL, Pietra VJ, Lai JC (1992)
Class-based n-gram models of natural language. Comput Linguist
18(4):467–79
64. Siu M, Ostendorf M (2000) Variable n-grams and extensions for
conversational speech language modeling. IEEE Trans Speech
Audio Process 8(1):63–75
65. Aizawa A (2003) An information-theoretic perspective of tf-idf
measures. Inf Process Manag 39(1):45–65
66. Ahmad M, Bashir AK, Khan AM (2017) Metric similarity reg-
ularizer to enhance pixel similarity performance for hyperspectral
unmixing. Optik 140:86–95
67. Ujjan RM, Pervez Z, Dahal K, Bashir AK, Mumtaz R, Gonzalez J
(2019) Towards sFlow and adaptive polling sampling for deep
learning based DDoS detection in SDN. Future Gener Comput
Syst 111:763–779
68. Owen S, Owen S (2012) Mahout in action. Manning, Shelter
Island
69. Qian B, Su J, Wen Z, Jha DN, Li Y, Guan Y, Puthal D, James P,
Yang R, Zomaya AY, Rana O (2020) Orchestrating the devel-
opment lifecycle of machine learning-based IOT applications: a
taxonomy and survey. ACM Comput Surv (CSUR) 53(4):1–47
70. Aujla GS, Barati M, Rana O, Dustdar S, Noor A, Llanos JT, Carr
M, Marikyan D, Papagiannidis S, Ranjan R (2020) COM-PACE:
compliance-aware cloud application engineering using block-
chain. IEEE Internet Comput 24(5):45–53
71. Demirbaga U, Noor A, Wen Z, James P, Mitra K, Ranjan R
(2019) SmartMonit: real-time big data monitoring system. In:
2019 38th symposium on reliable distributed systems (SRDS)
2019 Oct 1. IEEE, pp 357–3572
Publisher’s Note Springer Nature remains neutral with regard to
jurisdictional claims in published maps and institutional affiliations.
Neural Computing and Applications
123