Crossing the Cell membrane http://www.biology4kids.com/files/cell_main.html.
Upload
morsolutions-helpdeskCategory
view
212download
0description

A SHIFTY LOT
Des Byrne
This talk was given on Thursday, October 12th 2006, at The Royal College of Physicians Kildare Street Dublin.
1
12th October 2006
A SHIFTY LOT
What Living in Modern Ireland is doing to us
Des Byrne
Isn’t this a wonderful building. It makes such a statement about the people who built it: Their sense of themselves, their ambitions for the future and so on.
evenings and so on.
2
LANDSCAPE & MEMORYEach generation leaves its particular mark on the landscape. This particular mark – Newgrange was build about 5,000 years ago. We leave our mark on the landscape but, as Simon Schama pointed out in his book Landscape and Memory, the landscape leaves its mark on us also. The Irish psyche has undoubtedly been strongly influenced by the particular character of the Irish countryside, the fact that we are an island, our prevailing weather conditions, the long winter
Some influences are even more subtle than that however. For a great deal of its history, Newgrange lay forgotten. It had become overgrown and might have been mistaken for any other grassy mound. It wasn’t until 1699 that the site was rediscovered when the then owner of the land asked his workmen to remove some stones for a building project he had in mind. They rediscovered the entry point to the monument and excavations began. The early excavators questioned the locals about this particular mound. They discovered that it was known locally as “the hill that swallows the sun”.
1
It took more than 200 years to rediscover, and prove, the origins of this particular piece of folklore. This cultural artefact had survived in the folk memory, over a period of 5,000 years, without the benefit of any written record, or at least any written record that people could still interpret. Our culture, like our landscape leaves its mark on us.
3
THE HILL THAT SWALLOWS THE SUN
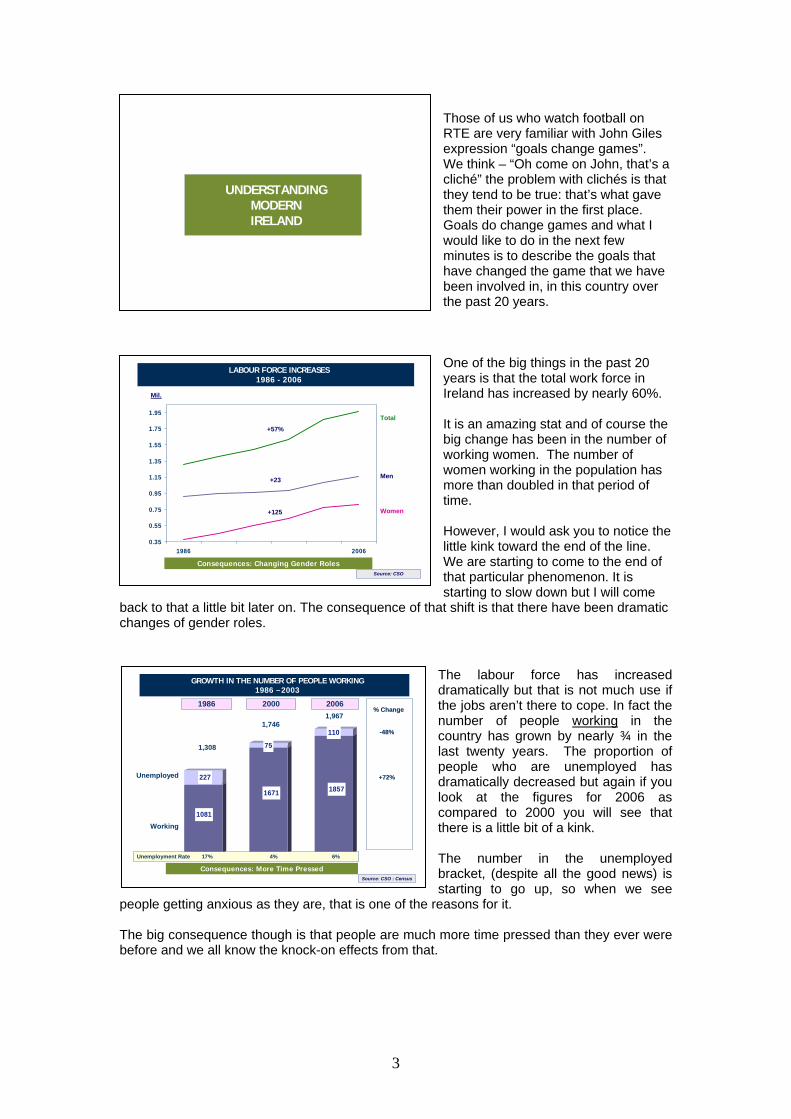
Other factors leave their mark also. Simple things like how many of us are living on this island. There can be few people who would doubt that the Irish psyche suffered a cruel blow as a result of the great famine and its after effects. Our national self-esteem must have been dented by the long population decline that followed. But look what has happened recently. There has been a steady uplift in the population of this country since the mid-e Celtic Tiger phenomenon.
4
SUCCESS BREED SUCCESS (Long Term Population Change)
2.0
2.5
3.0
3.5
4.0
4.5
5.0
5.5
6.0
6.5
1841 1851 1861 1871 1881 1891 1901 1911 1926 1936 1946 1951 1956 1961 1966 1971 1981 1986 1991 1996 2001 2004
Mil.Republic of Ireland
1960s. That simple fact has been the genesis of th
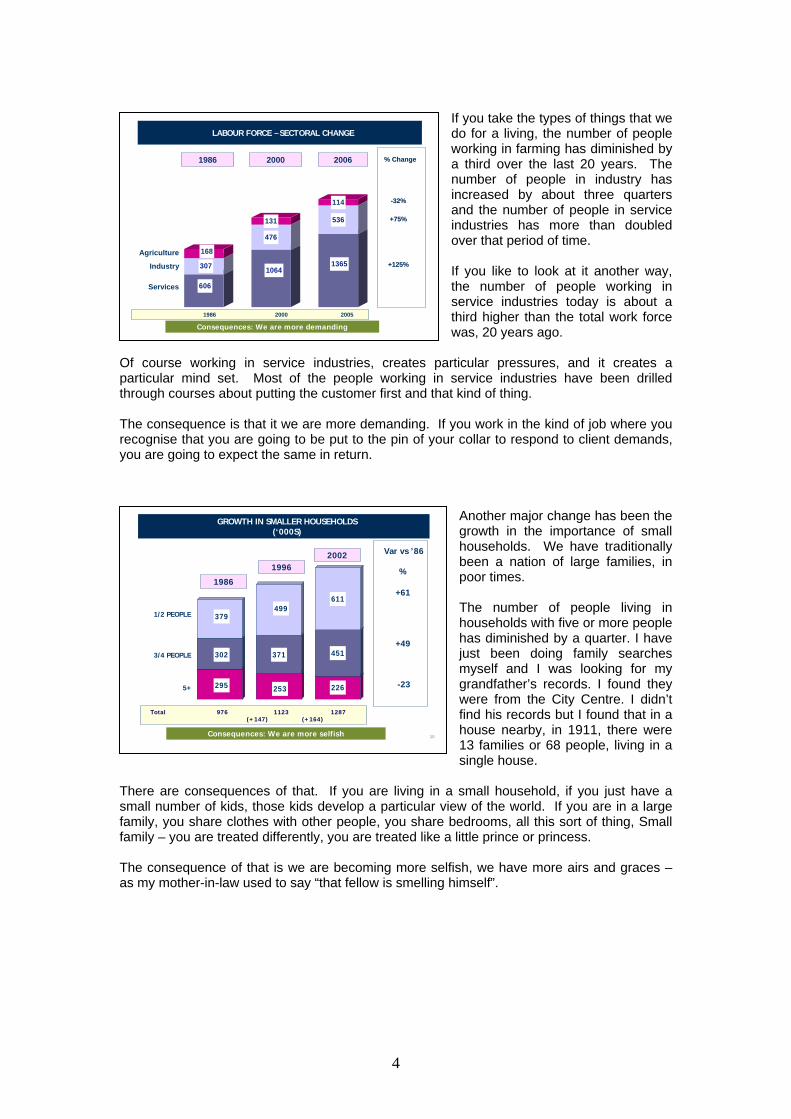
idden beneath the national population
C
Hfigure there are other stories waiting to
rEp
IRISH BY BIRTH; BY GRACE OF GOD; CORK
hen doing some work for the Irish y
runs much deeper than that. Today,
of ork. It wasn’t always so, as can be seen in this cha he
be rediscovered. WExaminer some years ago, I was verstruck by how deep-seated is the Cork conviction of being “the real Capital of Ireland”. Visitors to this country may beinclined to dismiss this as another case of second City syndrome. Itthe population of Dublin City and Country is two and half times that rt. If you go back far enough in time, t
everse pattern was true. The population of Cork was substantially bigger than that of Dublin. ven as recently as the founding of the State, the two areas had roughly the same size opulations.
5
586.9636.2
718.3
852.2
1058.3
420.5
693.0
1025.31003.2
505.7
372.8418.9
477.2
405.3405.1 410.3 419.2
448.2
356.0 343.7 341.2 330.4 352.9402.5 410.4
365.7
854.1
392.1
649.3
544.8517.1
495.6438.4
404.6
0.0
100.0
200.0
300.0
400.0
500.0
600.0
700.0
800.0
900.0
1000.0
1100.0
1841 1851 1861 1871 1881 1891 1901 1911 1921 1931 1941 1951 1961 1971 1981 1991 1996
Dublin
Cork
2
Those of us who watch football on
s
a
that
ne of the big things in the past 20
.
is an amazing stat and of course the
has
owever, I would ask you to notice the
e back to that a little bit later on. The consequence of tha c
he labour force has increased
UNDERSTANDING MODERN IRELAND
RTE are very familiar with John Gileexpression “goals change games”. We think – “Oh come on John, that’scliché” the problem with clichés is that they tend to be true: that’s what gave them their power in the first place. Goals do change games and what Iwould like to do in the next few minutes is to describe the goals have changed the game that we havebeen involved in, in this country over the past 20 years.
Oyears is that the total work force in Ireland has increased by nearly 60% Itbig change has been in the number of working women. The number of women working in the population more than doubled in that period of time. Hlittle kink toward the end of the line. We are starting to come to the end ofthat particular phenomenon. It is starting to slow down but I will comt shift is that there have been dramati
changes of gender roles.
7
LABOUR FORCE INCREASES1986 - 2006
0.35
0.55
0.75
0.95
1.15
1.35
1.55
1.75
1.95
1986 2006
+125
+23
+57%
Total
Men
Women
Mil.
Source: CSO
Consequences: Changing Gender Roles
Tdramatically but that is not much use if the jobs aren’t there to cope. In fact the number of people working in the country has grown by nearly ¾ in the last twenty years. The proportion of people who are unemployed has dramatically decreased but again if you look at the figures for 2006 as compared to 2000 you will see that there is a little bit of a kink. The number in the unemployed
people getting anxious as they are, that is one of the r
he big consequence though is that people are much more time pressed than they ever were
bracket, (despite all the good news) is starting to go up, so when we see easons for it.
8
GROWTH IN THE NUMBER OF PEOPLE WORKING1986 – 2003
1081
227
1671
75
1857
110
Unemployed
Working
1986 2000 2006
Unemployment Rate 17% 4% 6%
1,308
1,7461,967
% Change% Change
--48%48%
+72%+72%
Source: CSO : Census
Consequences: More Time Pressed
Tbefore and we all know the knock-on effects from that.
3
If you take the types of things that we do for a living, the number of people working in farming has diminished by a third over the last 20 years. The number of people in industry has increased by about three quarters and the number of people in service industries has more than doubled over that period of time.
LABOUR FORCE – SECTORAL CHANGE
606
307
168
1064
476
131
1365
536
114
Agriculture
Industry
Services
1986 2000 2006
1986 2000 2005
% Change% Change
--32%32%
+75%+75%
+125%+125%
Consequences: We are more demanding
If you like to look at it another way, the number of people working in service industries today is about a third higher than the total work force was, 20 years ago.
Of course working in service industries, creates particular pressures, and it creates a particular mind set. Most of the people working in service industries have been drilled through courses about putting the customer first and that kind of thing. The consequence is that it we are more demanding. If you work in the kind of job where you recognise that you are going to be put to the pin of your collar to respond to client demands, you are going to expect the same in return.
10
GROWTH IN SMALLER HOUSEHOLDS(‘000S)
295
302
379
253
371
499
226
451
611
1/2 PEOPLE
3/4 PEOPLE
5+
1986
19962002
+61
+49
-23
Var vs ’86
%
Total 976 1123 1287(+147) (+164)
Consequences: We are more selfish
Another major change has been the growth in the importance of small households. We have traditionally been a nation of large families, in poor times. The number of people living in households with five or more people has diminished by a quarter. I have just been doing family searches myself and I was looking for my grandfather’s records. I found they were from the City Centre. I didn’t find his records but I found that in a house nearby, in 1911, there were 13 families or 68 people, living in a single house.
There are consequences of that. If you are living in a small household, if you just have a small number of kids, those kids develop a particular view of the world. If you are in a large family, you share clothes with other people, you share bedrooms, all this sort of thing, Small family – you are treated differently, you are treated like a little prince or princess. The consequence of that is we are becoming more selfish, we have more airs and graces – as my mother-in-law used to say “that fellow is smelling himself”.
4

With that kind of growth in the number of working people – you don’t have to be a genius to work out that this means there is more money to go around. There is more money to pay the bills and so on and we have been reaping the benefits. Any analysis you might do, shows that.
11
REAPING THE
BENEFITS
REAPING THE
BENEFITS
12
FINANCIAL HOLDINGS
56%
77%
40%
60%
17%
33%
13%22%
4% 7%0%
10%
20%
30%
40%
50%
60%
70%
80%
'94 '04
Deposit A/c
Cash Card
Credit Card
Overdraft/loan
These data are drawn from the Joint National Readership Surveys on financial holdings. Just look at it over a 10 year period, from ’94 to 2004; huge increases. Even something like stocks and shares; which it is only up from 4 to 7% for that period of time, but that is a doubling.
Stocks and shares
Source: JNRR Surveys
13
HOME ENTERTAINMENT
0.27
0.78
19%
57%
5%
21%
0% 11%0%
10%
20%
30%
40%
50%
60%
70%
80%
'94 '04
CD Players
Home computer
Camcorder
If you take things like home entertainment - huge increases. So we have been reaping the benefits. Digital
Camera
78%
27%
Source: JNRR Surveys
5

14
The Tipping Point
- April 2002 Euro Entry -
But there was a tipping point in this story of well-being, which I would pinpoint to April 2002 when we joined the Euro.
15
CONSUMER CONFIDENCE INDEXPERSONAL FINANCES - SUMMARY
113
100
120
101
71
100
104
60
70
80
90
100
110
120
2002 2003 2004 2005
Jan Mar May JulySept Nov Jan MarJuneSept Nov Jan Mar May AugSept Nov Jan Mar May JulySept Nov
Over the last number of years, in B&A, we have been tracking consumer confidence. Things were going very nicely, thank you very much, up to March 2002. We went into the Euro in April 2002 and you can see straight away what the impact was. There are a whole lot of reasons for this. We started to see ads for items in Northern Ireland that were in pounds sterling. We started to see ads down here that were in Euro and you said “Jesus we are being ripped off - hello rip off Ireland”.
You went away to Spain or to Portugal on holidays and you were going to countries where things were at the very cheapest levels and making comparisons. So we ran into that and it took a long time to recover. It is an interesting comment on the power of the media (and the power of media commentary) – do you see the dip there in September of 2005, that was Eddie Hobbs TV programme, and it was just reminding us of the horrors that we had gone through before.
So after that tipping point we started to notice some of the things that were not such good news.
16
After the Tipping Point
“We began to notice the less good news”
6

Our GDP per head has been doing very nicely; 1997 to 2003 growth of about 43%. However, quite a lot of that growth, and Ireland and Luxembourg are the only two countries in Europe where this matters – comes from the difference between Gross Domestic Product and Gross National Income, because of the amount of money that is taken out by foreign national companies. If you take our Gross National Income per head (which is a better indicator of our domestic
wealth), the increase was 30% over that time span. Again, the kink; if you look between 2000 and 2003 only one sixth of the increase occurred in that period of time. Five sixties of the growth came in the first half of this time span.
17
GDP + GNI PER CAPITA Constant 2003 Prices
28.8
33.933.2
31.830.5
28.1
25.6
23.7
So we were suddenly faced with a downturn in what we were becoming used to, as our God given right to get wealthier and wealthier.
22.123.6
25.3
28.228.127.5
20
25
30
35
40
1997 1998 1999 2000 2001 2002 2003
€’000
GDP -+43%
GNI +30%
Source: CSO/Eurostat
+5%
18
CONSUMER FOCUS“We have retained our loyalty to big-ticket purchases”
Even if we must make savings in other areas.
Because we have convinced ourselves that “we are worth it”.
Of course we were addicts at this stage. We found it difficult to step off. We had become addicted to nice homes, big motor cars, foreign holidays, holiday homes abroad. I heard George Hook the other evening say that a third of Irish people are supposed to have holiday homes abroad at this stage. I find that hard to believe, but it must be bloody high. We have to go for these big ticket items because we have become used to them, even if we have to make savings in other areas.
7

When I say these are big ticket items, they really are big ticket items. Here is an example. in 1994 the amount of money going out in new mortgages in Ireland was 2.1 billion euro. By 2005 it was 21 billion euro. (The decimal point had moved). Now some of that is obviously from people buying second homes and that kind of thing, but a large proportion of it is for people who are buying their first home and those people are “concertinaed” into a particular segment of the population They are young marrieds, starting out in
life and they are feeling the pinch - by God, they are feeling the pinch.
19
TOTAL VALUE OF NEW MORTGAGES (€ Bil.)
20.8
16.9
13.5
7.76.5
7.6
10.8
4.63.6
3.02.32.11.7
1
6
11
16
21
1993 1994 1995 1996 1997 1998 1999 2000 2001 2002 2003 2004 2005
€ Bil.
44.4 44.7 48.6 52.8 62.0 74.7 92.0 102.3 114.8 136.5 159.5 171.5 194.4
9.58 7.18 7.62 6.80 7.22 7.10 4.93 5.38 5.69 4.86 4.66 3.74 3.48Rate %Aver Value ‘000
Source: CSOCan this continue?
Here is another index. I was brought up in a world where Ireland was seen as a very big tourist destination and we had terrific earnings from tourists coming from overseas. That was the case up to relatively recently.
20
TOURISM EARNINGS VS. EXPENDITURE(Imports vs. Exports)
4.1
3.2
2.9
4.0
3.1
3.6
3.94.1
Tourism earnings from foreign visitors4.0
2.2
2.8
2.5
4.2 4.2
2.0
2.2
2.4
2.6
2.8
3.0
3.2
3.4
3.6
3.8
4.0
4.2
4.4
1998 1999 2000 2001 2002 2003 2004
Irish outward Tourist spend
Gap +737 +650 +832 +711 +37 -101 -114
Source: CSO
€ Bil
But by 2002 the amount of money that Irish people were spending overseas came to equal the amount of money that foreign visitors were spending in Ireland and in the last few years it has gone the other way. Irish people are spending more money abroad than foreign visitors are spending in Ireland and the reasons for that, of course, are obvious.
If you are buying a holiday home abroad and if you can get cheap flights to it, you are going to use it as often as you can. That means that seasonality patterns are dramatically affected for a lot of products. A lot of our clients are finding this. The soft drinks world, for example.
8
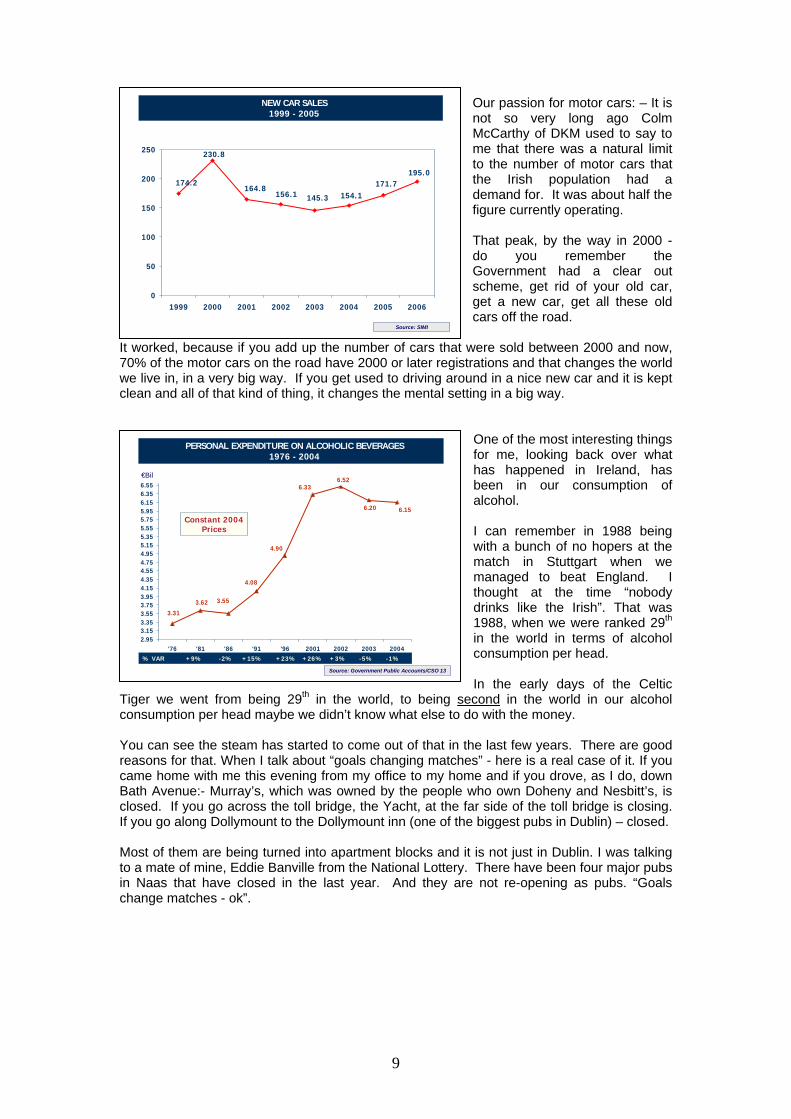
Our passion for motor cars: – It is not so very long ago Colm McCarthy of DKM used to say to me that there was a natural limit to the number of motor cars that the Irish population had a demand for. It was about half the figure currently operating. That peak, by the way in 2000 - do you remember the Government had a clear out scheme, get rid of your old car, get a new car, get all these old cars off the road.
It worked, because if you add up the number of cars that were sold between 2000 and now, 70% of the motor cars on the road have 2000 or later registrations and that changes the world we live in, in a very big way. If you get used to driving around in a nice new car and it is kept clean and all of that kind of thing, it changes the mental setting in a big way.
21
NEW CAR SALES1999 - 2005
195.0171.7
154.1145.3156.1
230.8
164.8174.2
0
50
100
150
200
250
1999 2000 2001 2002 2003 2004 2005 2006
Source: SIMI
One of the most interesting things for me, looking back over what has happened in Ireland, has been in our consumption of alcohol. I can remember in 1988 being with a bunch of no hopers at the match in Stuttgart when we managed to beat England. I thought at the time “nobody drinks like the Irish”. That was 1988, when we were ranked 29th in the world in terms of alcohol consumption per head. In the early days of the Celtic
Tiger we went from being 29th in the world, to being second in the world in our alcohol consumption per head maybe we didn’t know what else to do with the money.
22
PERSONAL EXPENDITURE ON ALCOHOLIC BEVERAGES 1976 - 2004
6.15
3.313.62 3.55
4.08
4.90
6.336.52
6.20
2.953.153.353.553.753.954.154.354.554.754.955.155.355.555.755.956.156.356.55
'76 '81 '86 '91 '96 2001 2002 2003 2004% VAR +9% -2% +15% +23% +26% +3% -5% -1%
€Bil
Source: Government Public Accounts/CSO 13
Constant 2004 Prices
You can see the steam has started to come out of that in the last few years. There are good reasons for that. When I talk about “goals changing matches” - here is a real case of it. If you came home with me this evening from my office to my home and if you drove, as I do, down Bath Avenue:- Murray’s, which was owned by the people who own Doheny and Nesbitt’s, is closed. If you go across the toll bridge, the Yacht, at the far side of the toll bridge is closing. If you go along Dollymount to the Dollymount inn (one of the biggest pubs in Dublin) – closed. Most of them are being turned into apartment blocks and it is not just in Dublin. I was talking to a mate of mine, Eddie Banville from the National Lottery. There have been four major pubs in Naas that have closed in the last year. And they are not re-opening as pubs. “Goals change matches - ok”.
9

23
MARKET SHARES – ALCOHOLOn vs. Off Premises
1994 - 2004
69.070.8
76.6
70.671.772.574.177.9 77.278.4
75.4
31.029.229.428.327.525.924.623.422.822.121.6
0
10
20
30
40
50
60
70
80
1994 1995 1996 1997 1998 1999 2000 2001 2002 2003 2004
On-Trade
Off-Licence
% of Value
Source: Government Public Accounts/CSO 13
There is a story below that as well. If you look at the off licence as against the on licence trade, this is what has been happening. And the guys who have been over pricing their product in pubs, because they thought the good times would never end, weren’t looking at those kinds of numbers. They just assumed they could jack up the prices to make up for what were, in fact, declines in volume. It wasn’t just the smoking ban that changed things, it has been coming for ten years.
As you allow for price differences I would guess that 50% of our alcohol intake is now being consumed at home.
The effect of that can be seen in retail sales. These are from the Government published data for 2005 as compared to 2000. If you look at them, sales in bars, (in value terms over that period) have gone up by 11%. In volume, they have gone down by 10% and the price of booze in bars has gone up by 23%. There is no such thing as a consumer who doesn’t change his or her behaviour in response to the price mechanism. But there are some other interesting areas here. The things that we have
started to spend a great deal more on are things like footwear and leather, textiles and clothing, hardware paint and glass, (to decorate those homes that we treasure so much) and a huge one, pharmaceuticals, medical and, cosmetic items. I will come back to that in a few moments if I may. They managed to set big increases in volume and in price.
24
RETAIL SALES – KEY CATEGORIES2005 (Index 2000 = 100)
Value VolumeShift in
Relative Pricing
Footwear and Leather 123 152 81
Textiles and Clothing 127 152 84
Hardware, Paints, Glass 160 135 119
Pharmaceuticals, medical and cosmetic articles 145 124 117
"Other" retail/sales 125 108 116
Electrical goods 114 107 107
Furniture and lighting 115 106 108
Food, beverages and tobacco 121 104 116
Books, newspapers and stationery 120 104 115
Bars 111 90 123
So our incomes are slowing down. We are still addicted to the big ticket items and we are being more choosey about where we spend our money on small luxuries. So how do we pay the piper?
25
Paying the PiperPaying the Piper
10

In 1995 the typical Irish household debt amounted to just under half our annual income. By 2004 it was over 100% of annual income per household in the country. That includes our mortgages, but even if we leave that out, this is what is happening.
26
CONSUMER DEBT
In 1995 the typical Irish household debt amounted to just under half annual income.
By 2004 it was well over 100% of income.
However that includes mortgages. If we leave these out, the story is more “telling”.
27
CONSUMER DEBT AS % OF DISPOSABLE INCOME(Excluding Mortgages)
2.5 18%
2.4 16%
2.3 16%
2.0 15%
1.8 14%
1.7 14%
1.5 12%
1.3 10%
1.1 10%
0.9 9%1995
1996
1997
1998
1999
2000
2001
2002
2003
2004
Credit Card Total Consumer Debt
Source: Central Bank Quarterly Report I/2005
The amount of stuff that is paid for via debt has doubled over that 10 year period. If you take the number of credit cards and the indebtedness of those credit cards, over a relatively short period of time 2002 – 2005 the number of credit cards in domestic hands went up by 14%, the indebtedness on those cards went up by 46%.
28
CREDIT CARDSDecember 2002 - 2005
2200.0
1870.0
1993.0 2002.0 2141.0 No. of cards (‘000)
1512.0
1997.0
1722.0
1000
1100
1200
1300
1400
1500
1600
1700
1800
1900
2000
2100
2200
2002 2003 2004 2005
Credit Card Indebtedness (€Mil)
Growth
Cards +14%
Debt +46%
Growth
Cards +14%
Debt +46%
11

And then you have to ask yourself where are we going next? We are still relatively low in the credit card stakes by comparison with Britain or the USA. We are high by comparison to Continental Europe, but which path are we going to follow and what are the consequences of that going to be?
29
CREDIT CARD PENETRATION AND USE- International Companies -
Eurozone average
Ireland
UK
USA
Average value of
transaction (€)
No. of credit cards per
1000 inhabitants
No. of transactions
per inhabitant
411
456
1066
4361
8.3
20.5
31.8
62.0
81.2
87.5
102.4
85.9
Source: Central Bank Quarterly Report I/2005
Which model will we follow:
Boston or Berlin?
30
NON-FINANCIAL COSTS
NON-FINANCIAL COSTS
There have also been non financial costs and I would like to just say thank you here to Brendan Finn of Vhi Healthcare for giving me permission to use some data from a survey we did for them earlier this year. It is, what they call, the Health of the Nation project.
31
STRESS LEVELS AT WORK(Base: All employed/self employed)
0%8%
35%
36%
17%
5%
0%7%
34%
37%
18%
4%
0%9%
35%
34%
16%
6%
1%8%
37%
32%
17%
6%
0%8%
32%
39%
17%
4%Extremely stressful
Very stressful
Fairly stressful
Not very stressful
Not at all stressfulDon’t know/not stated
PRESENCE OF CHILDTOTAL
Yes No
GENDER
Male Female
Source: Vhi Healthcare – Health of the Nation
Here is just one index of the non financial costs. Between a fifth and a quarter of us find work levels very stressful now.
12

32
NO. OF VISITS TO GP IN PAST 12 MONTHS(Base: All Respondents)
24%
26%
19%
9%
22%
32%
30%
15%
7%
17%
15%
21%
24%
1%
28%
31%
20%
22%
13%
14%
27%
30%
17%
8%
19%
22%
30%
19%
6%
23%
12%
24%
19%
10%
35%4+
3
2
1
None/not stated/DK
A G E20-29 30-39 40-49 50+
GENDERMale Female
Average (Visitors)Average (incl none)
3.9 3.0 4.7 3.0 3.8 4.2 4.83.0 2.0 4.0 2.1 2.7 3.3 4.2
TOTAL
Source: Vhi Healthcare – Health of the Nation
Do you remember I spoke about the pharmaceutical stuff. This is the number of times people are visiting the doctor in a 12 month period. It is not just the a&e units that are facing into overload. A third of the population are going to the doctor at least once a quarter, and if you go towards my end of the age spectrum it gets worse.
33
WHETHER ON LONG TERM MEDICAL TREATMENT(Base: All Respondents)
77%
23%
78%
22%
77%
23%
90%
10%
83%
17%
75%
25%
56%
44%
51%
49%
84%
16%Yes
No
AGE
20-29 30-39 40-49 50+
GENDER
Male Female Yes No
MEDICAL CARDTOTAL
Source: Vhi Healthcare – Health of the Nation
What proportion of people are on long term medical treatment, cholesterol reducing tablets and what have you. Because the doctors have become more scared about not prescribing stuff for people, because of the litigious nature of society, a quarter of Irish people are now on long term medical treatment. For people on medical cards, it is nearly half.
One of the consequences of all this change is that we have ended up with what the old timers would have called a house divided.
34
A HOUSE DIVIDED
A HOUSE DIVIDED
13

Take the Household Budget Surveys (and there is one due to be published early next year which I can't wait to see).
35
RICH MAN – POOR MAN
1995 3.1 : 1.0
2000 3.6 : 1.0
2006
Top 10% vs Bottom 10%
?
Spending Power
Source: Household Budget Surveys - CSO
In 1995 - which is the last but one Household Budget Survey published; if you compared the spending power of the top 10% of our population to the bottom 10%, the gap was 3.1 to 1. By 2000 it was 3.6 to 1. I would guess today it is probably over 4:1. The gap is getting wider.
36
WEEKLY ATTENDANCE AT CHURCH SERVICE/MASS
53%57%
79%
16%
30%
42%
0%
20%
40%
60%
80%
Dublin Other urban Rural
Over 35
Under 35
(% W
eekly)
Source: B&A Barometer
There are all kinds of indices you could look at to demonstrate that type of change. This information is probably about three years old now. It is looking at church attendance in Dublin, other urban areas and rural areas for under 35s and over 35s. At one end of the spectrum - the over 35 rural dwellers, 80% were still going to church weekly at that stage. And among young people in Dublin it was about 16% - so a huge, huge differences within society.
37
FREQUENCY OF LEISURE SHOPPING NOWADAYS(Base: All Respondents)
3%
44%
29%
10%
10%3%
4%
56%
25%
8%6%1%
2%
32%
33%
12%
15%
6%
2%
31%
32%
14%
16%
5%
2%
38%
37%
11%
10%2%
3%
49%
24%
9%
13%2%
5%
63%
20%
5%2%
4%Several times a weekAt least once a week
About once a fortnight
About once every three to four
weeks
Less often
Never
A G E20-29 30-39 40-49 50+
GENDERTOTALMale Female
Source: Vhi Healthcare – Health of the Nation
So we have invented a new religion, it is called leisure shopping. You know it yourself, you see what is happening at the weekends. It is not shopping for groceries; going into furniture stores, home décor outlets, gardening centres and so on. It really is big stuff.
14
39
A SOCIAL CHANGE BAROMETERWhich brings me to the idea of differences within different groups in society. I was prompted to go to this document - the JNRS which most people underutilise. It really is a very strong barometer of social change in Ireland.
40
A SOCIAL CHANGE BAROMETER
Analysed 49 product categories
By six variables (gender, age, class etc.)
Measured the variance
2006
I went back to this year’s copy and I analysed 49 product categories in the special interest group area. I looked at them by six variables, gender, age, class, area and so on, and I measured the variance by age, by class etc. Just the average difference between men and women, between the extremes in age and social class and so on. This is what I found.
41
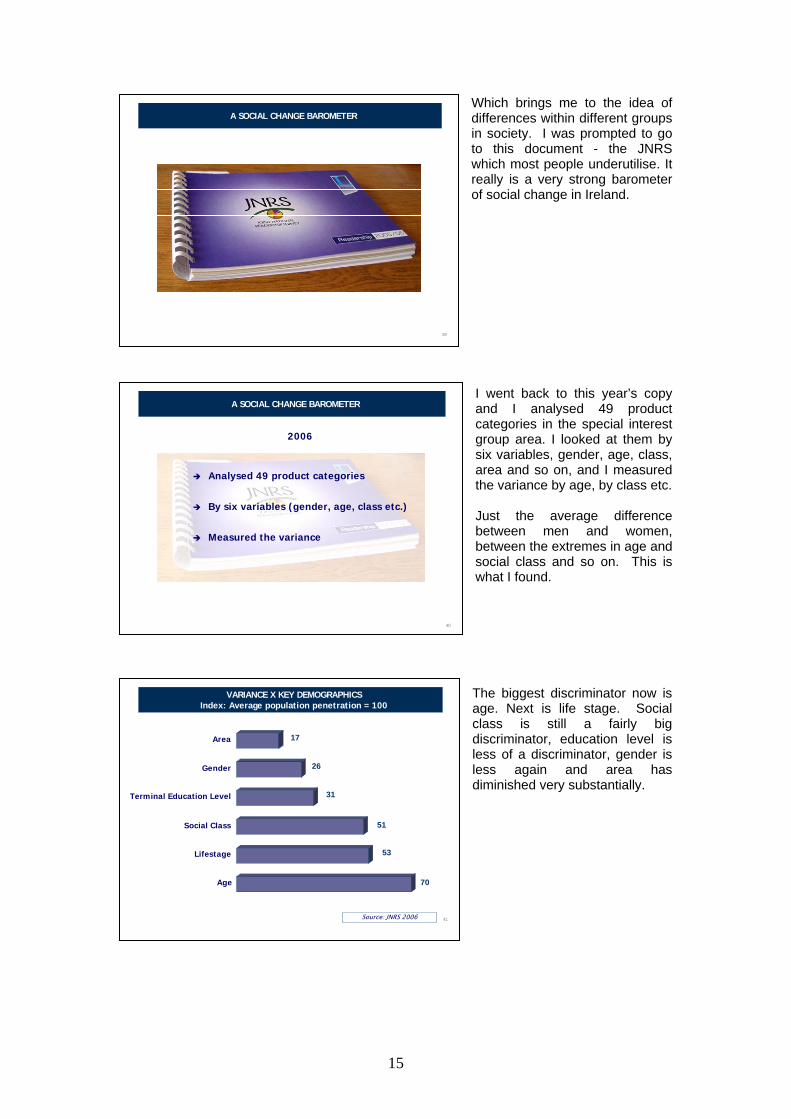
VARIANCE X KEY DEMOGRAPHICSIndex: Average population penetration = 100
Area 17
26Gender
31Terminal Education Level
51Social Class
53Lifestage
70Age
Source: JNRS 2006
The biggest discriminator now is age. Next is life stage. Social class is still a fairly big discriminator, education level is less of a discriminator, gender is less again and area has diminished very substantially.
15

If you look at it, age and class tend to be the main discriminators depending on the area of activity, alcohol, financial services, and so on. (Gender is really important still in the case of toiletries). One thing I did notice, by the way, was on area differences. When I entered this business there was a big difference between Urban and Rural areas and the Rural areas were losing out. If you look at the financial services indicators now there is a higher level of ownership of most financial service products in Rural areas than Urban areas; another mark of change.
42
INDEXES OF DISCRIMINATION- Standard Demographics -
Category Sex Age Class Area TEL Lifestage
Item s
3 Alcohol 32 65 29 20 23 3215 Financial Services 8 66 67 13 34 503 Eating Habits 7 109 46 29 30 716 Entertainm ent 18 197 46 34 62 1875 Pam pering 23 43 61 8 38 167 Secialist Foods 16 34 22 19 14 316 Toiletries 121 55 24 10 11 534 Quasi Medical 74 117 48 30 41 1042 Internet 7 97 133 20 87 44
51 All 26 70 51 17 31 53
Variance : Index 100 = Penetration level in 2006
No. of Elem ents
Source: Joint National Readership Survey
43
VARIANCE ON FINANCIAL HOLDINGS1990 VS 2006
106
79
58
27
9Gender
Area
Age
Education Level
Social Class
1990
67
34
66
13
8
2006
Source: JNRS 1990 + 2006
I also went back to 1990. One of the interesting things was that only 9 of the 49 items were being measured in 1990. I think that is an index of the way our own emphasis has changed. I took the equivalent data, just for financial holdings because they are the ones that had the greatest commonality. Social class was the big discriminator then, but it has diminished in importance since. There have been decreases in gender difference and a big decrease in the urban/rural divide.
Age difference have actually increased. Educational level differences have diminished and the social classes have diminished. So age and class continue to be the main discriminators. Across a wider spectrum of products, age is the most important predictor. Where are we going to go from here?
16

45
20:20 VISION
Source: NCB/The Irish Times
I have just included this chart which was stolen from the Irish Times some weeks ago; a simple summary chart of what is predicted by ncb. Population growth, from 4 million to over 5 million. The number of migrants -they are predicting from 400,000 to a million. The rate of economic growth - they are predicting from 5% average down to 4%. The number of motor cars, from 1.7 million to 3 million.
The housing units built – 80,000 a year at the moment. That means that a third of the households in the country have been built in the last five years. So we are living in newer houses as we are driving newer and shinier cars. These things have an effect on the way we think about the world.
46
IMPLICATIONS
Reaching out to consumers
Touching them
Turning them on
Reaching out to consumers
Touching them
Turning them on
A few final thoughts on implications. I think there are implications at a number of levels: Reaching out to consumers, touching them and turning them on.
47
REACHING CONSUMERS
THE IMPORTANCE OF MICRO-MARKETING
REACHING CONSUMERS
THE IMPORTANCE OF MICRO-MARKETING
Reaching consumers, here I want to deal with the importance of micro marketing. We think we are getting more and more different; we are actually getting more and more similar. As we get more and more similar it becomes more and more difficult to reach key target groups. So, things like micro marketing come into effect.
17

I talked earlier about the impact of population growth on confidence. When you look at it in a shorter time frame, you see how quickly the population has been growing in the last ten years, and how it is still on an upward curve. That is most certainly going to be a factor in the short term.
48
POPULATION GROWTH
3,525,719
3,443,405
4,234,923
1981 1986 1991 1996 2002 2006
+3 -0.5 +3%
+8%
+8%4 Million
3 Million
3.5 Million
4.5 Million
49
POPULATION INCREASE X PLANNING REGION1996 - 2006
1996 2002 2006 10 Year Growth
Border 407,295 432,534 467,327 +15%Dublin 1,058,264 1,122,821 1,186,159 +12%
Mid East 347,407 412,625 475,026 +37%
Midlands 205,542 225,363 251,381 +22%
Mid West 317,069 339,591 360,651 +14%
South East 391,517 423,616 460,474 +18%
South West 546,640 580,356 620,525 +14%West 352,353 380,297 413,383 +17%
Where has the population growth happened? The mid eastern area, that consumer belt around Dublin, the population has grown in the last ten years by nearly 40% in that area. So if you are not there, you are not at the races for a lot of things.
50
POPULATION INCREASEPLANNING REGIONS IN COUNTY DUBLIN
1996 2002 2006% Increase (10
Years)North City 287,216 290,521 294,420 +3
South City 194,638 205,260 211,319 +9
Dun Laoghaire/Rathdown 189,999 191,792 193,688 +2
Fingal 167,683 196,413 239,813 +43
South County Dublin 218,728 238,835 246,919 +13
1996 - 2006
In the Dublin area, Fingal where I happen to live unfortunately; the population has gone up by over 40% in that period of time.
18

51
THE IMPORTANCE OF MICRO-MARKETING
If you just take as a microcosm of that, Swords – here is an aerial shot of Swords. Go and visit this area as soon as you can. The Pavillions in Swords and across the road the Airside Shopping Centre. They are, for me, the proto type of what we are facing into for weekend shopping. Why should it have happened in this particular location?
In 1971 the population of Swords was 4001. By 2002 it had grown to 30,548. If you add in Malahide, Balbriggan, Donabate, Rush and Lusk, it is 70,000. Where do you draw the boundary? If you want to go up as far as Drogheda or the people living in that belt, they are within easy reach of Newry and Northern Ireland if they want to go there.
52
THE IMPORTANCE OF MICRO-MARKETING- Swords -
33%
46%
21%
19%
56%
25%Under 14
15-44
45+
National Pop.
Swords
In 1971 the population of Swords was 4,100.
2002 Census 30,548
Add in Malahide, Balbriggan, Donabate, Rush and Lush 70,304 (+18% since 1996).
Where do you draw the outer boundary – Drogheda?
Easy run to Newry & N.I. prices/offers
Look at the population structure of Swords as against the population of the country as a whole. The 30,000 people living in Swords are, very very young. There were only 300 people aged 65+ living there in the 2002 Census.
53
They are all within easy reach of the M50 and connections to Liffey Valley etc. These brands form their familiar landscape.
19
Reaching out to consumers: We all know it is becoming more difficult. As audiences become more fragmented and more cynical we have to find new ways to reach them. This is a book that was published in 1998. It deals with this very topic. The author makes a strong case that to reach today’s cynical consumers we have to get at them “under the radar”. We are going to see some really creative ways of doing this in the next presentation (Jessica Greenwood of Contagious - UK).
54
REACHING CONSUMERS
What messages do we need to send to consumers? What tone of voice do we need to adopt in addressing them. Luckily for those of us involved in my particular business, there is no better way of doing this than becoming immersed in regular research designed to understand the consumer mindset.
55
TOUCHING CONSUMERS
Understanding the consumer mindset
TOUCHING CONSUMERS
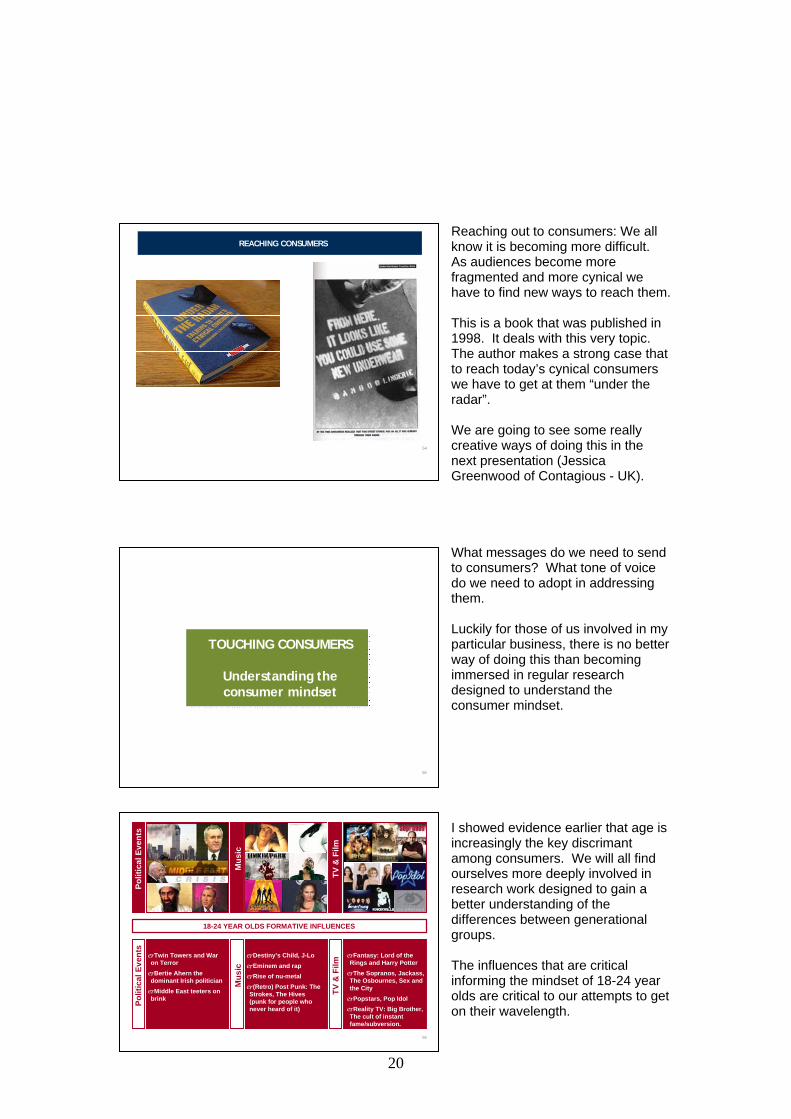
Understanding the consumer mindset
I showed evidence earlier that age is increasingly the key discrimant among consumers. We will all find ourselves more deeply involved in research work designed to gain a better understanding of the differences between generational groups. The influences that are critical informing the mindset of 18-24 year olds are critical to our attempts to get on their wavelength.
20
56
Destiny’s Child, J-LoEminem and rapRise of nu-metal(Retro) Post Punk: The
Strokes, The Hives (punk for people who never heard of it)
Twin Towers and War on TerrorBertie Ahern the
dominant Irish politicianMiddle East teeters on
brink
Fantasy: Lord of the Rings and Harry Potter
The Sopranos, Jackass, The Osbournes, Sex and the City
Popstars, Pop IdolReality TV: Big Brother,
The cult of instant fame/subversion.
Mus
ic
Polit
ical
Eve
nts
TV &
Film
18-24 YEAR OLDS FORMATIVE INFLUENCES
Mus
ic
Polit
ical
Eve
nts
TV &
Film

58
Mus
ic
Polit
ical
Eve
nts
TV &
Film
55+ YEAR OLDS FORMATIVE YEARS AND DEFINING MOMENTS
BallroomBeatles and StonesWoodstock a defining eventHendrix, Doors, Beach BoysPolitics seeping into music:
Bob Dylan and Joan BaezShowbands & HorslipsRadio Luxembourg and
Caroline
Vietnam war & anti war protestsCold War at its height
during Cuban Missile Crisis1968: Onset of NI troublesEnd of de Valera era and
Lemass and then Lynch take over Fianna FailKennedy assassination
James BondWesternsThe Green Hornet, The
AvengersMarilyn Monroe diesButch and SundanceTV Arrives: RTE sets up in
1961Late Late Show
Mus
ic
Polit
ical
Eve
nts
TV &
Film
Those influences are very different from the factors that were at work with earlier generations. Like all good marketing practitioners we will be giving more and more thought to creative ways of reaching our audience. We will immerse ourselves in their formative experiences to understand their mindset. How do we get them to respond to our messages?
TURNING THEM ON
TURNING THEM ON
We should never be too proud to turn up our noses at learning from past experience. I would suggest that we need to rediscover the art of telling stories: the sort of stories that carried the message of the hill that swallowed the sun for over 5,000 years.
I can still remember where I was and who I was with when I saw the film Chinatown for the first time. I left the cinema in Leicester Square in seething rage. I would gladly have killed John Huston if I had met him outside. The emotional impact of the movie on me, was an enormous compliment to his performance, and to the movie script. I assumed at the time that the script had been written by Roman Polanski it was much later when I realised that it had been written by
Robert Towne. His original idea was that the movie would have a happy ending. The real power of the movie for me, and I am sure for most people, was its very “blackness”.
61
RE-DISCOVERING THE ART OF TELLING STORIES
The public mood at that time was perfectly attuned to that type of ending which was so at odds with what had gone before and with conventional expectations. Even Mr. Towne himself came to agree: After the first $20 million of royalties came through.
21

62
RE-DISCOVERING THE ART OF TELLING STORIES
The people who will have most success in telling their stories in a compelling way to the Irish population are those people who best understand the new Irish, emerging from the melting pot of the last 20 years. Those storytellers will have something in common with Patrick Kavanagh. They will have a strong instinctive feel for what makes us “tick”. They will have the self-confidence to realise that events that happen on even our little stage can have an international resonance.
In the years running up to the Second World War (in what Kavanagh described as “the year of the Munich bother”) he was fascinated to see that in the border counties the thing that really exercised the minds of his neighbours was a fight between two families over who owned a small plot of disputed land. He marvelled at the scale difference between the two conflicts, but resolved it for himself in his poem, Epic
“… I inclined To lose my faith in Ballyrush and Gortin
Till Homer’s ghost came whispering to my mind He said: I made the Iliad from such
A local row: Gods make their own importance.”
The builders of Newgrange, who made their mark on the entrance stone to their monument, would, I feel sure, have agreed with that sentiment.
22