20NRI
93
NATURAL RESOURCES INVENTORY of the TOWN OF MEREDITH, NH Prepared for the TOWN OF MEREDITH PLANNING DEPARTMENT And the MEREDITH CONSERVATION COMMISSION Rick Van de Poll, Ph.D. Ecosystem Management Consultants 30 North Sandwich Rd. Center Sandwich, NH 03227 [email protected] August 2005
-
Upload
eric-ferland -
Category
Documents
-
view
213 -
download
0
description
http://meredithnh.org/pdfdocs/Meredith%20NRI.pdf
Transcript of 20NRI

NATURAL RESOURCES INVENTORY
of the
TOWN OF MEREDITH, NH
Prepared for the
TOWN OF MEREDITH PLANNING DEPARTMENT
And the
MEREDITH CONSERVATION COMMISSION
Rick Van de Poll, Ph.D. Ecosystem Management Consultants
30 North Sandwich Rd. Center Sandwich, NH 03227
August 2005

i
EXECUTIVE SUMMARY
During the 2003-2004 fiscal year, the Town of Meredith commissioned a municipal natural resources inventory (NRI) to be completed by Ecosystem Management Consultants (EMC) of Sandwich, New Hampshire. The purpose of the NRI was to augment the recently published Community Plan, which had been adopted by the Meredith Planning Board on December 3, 2002 after considerable public participation and the assistance of the Lakes Region Planning Commission and several Community Plan subcommittees. Page 22 of the Community Plan cited the need for an open space plan that included 4 areas of emphasis: 1) resource inventory, 2) education and awareness, 3) permanent land protection, and 4) land use regulation. With the assistance of the Natural Resources Subcommittee of the Meredith Conservation Commission, initial planning for the NRI got underway in February of 2003. Subsequently, a proposal to complete a comprehensive planning document was submitted by EMC in March of 2003 and approved on April 1, 2003. The proposal included a two-phase work product: Phase I: the development of natural resources GIS1 maps of the Town of Meredith and the development of co-occurrence layers,2 and Phase II: the analysis of the co-occurrence layers on a parcel by parcel basis. The co-occurrence layers were derived from carefully selected natural resource features represented by the existing NH GRANIT GIS maps and other sources. These were compiled for the Town of Meredith and then sorted according to dominant conservation themes such as agriculture, wildlife, forests, and water resources. The analysis in Phase II included the careful selection of high value co-occurrence areas, and the development of an attribute assessment model that tested how each parcel within these areas compared to one another. The compilation of the Meredith GIS maps and the co-occurrence layers took most of 2003 to complete. This process was slowed down by the need to accurately identify wetland resources in the Town. Careful delineation of wetland boundaries took place through aerial photograph interpretation (API), which improved the accuracy and precision of wetland maps tremendously. Additional time was spent on the derivation of the NRI data for the Lake Waukewan watershed, as requested by the Town Planner. This data augmented a concurrent project undertaken by the Town of Meredith to inventory and assess the land uses and potential pollution sources that could impact the Town’s largest drinking water supply. A short report on this effort was presented at the “watershed round-up” meeting on April 7, 2004.
1 GIS = Geographic Information System, or computer-generated maps 2 Co-occurrence refers to those areas where valuable natural resources overlap.

ii
Phase II of the NRI took most of the spring of 2004 to develop and test. This process included the adaptation of an attribute assessment model that EMC had written for another municipality, which was seeking conservation funds through the Land and Community Heritage and Investment Program (LCHIP). Revisions to the model developed for the Town of Meredith included the recognition of specific natural resource data as derived from Phase I above, and the addition of greater specificity within each of the following 15 attribute areas:
ATTRIBUTE 1 - SIZE ATTRIBUTE 2 - STATUS / PROXIMITY TO CONSERVATION LAND ATTRIBUTE 3 - CULTURAL RESOURCES ATTRIBUTE 4 - AGRICULTURAL RESOURCES ATTRIBUTE 5 - SCENIC VALUE ATTRIBUTE 6 - WATER QUALITY ATTRIBUTE 7 - WETLANDS ATTRIBUTE 8 - SURFACE WATER RESOURCES ATTRIBUTE 9 - FOREST COVER ATTRIBUTE 10A - WILDLIFE – Open Uplands ATTRIBUTE 10B - WILDLIFE –Forested Uplands ATTRIBUTE 10C - WILDLIFE –Wetlands & Water Bodies ATTRIBUTE 11 - RARE & ENDANGERED SPECIES, EXEMPLARY NATURAL
COMMUNITIES ATTRIBUTE 12 - SPECIAL NATURAL RESOURCE FEATURES ATTRIBUTE 13 - RECREATIONAL USE ATTRIBUTE 14 - ACCESS & FRAGMENTATION ATTRIBUTE 15 - LEVEL OF HUMAN ACTIVITY
After discussion and review by the Town Planner and NRI Subcommittee, the more “social value laden” attributes such as historic sites and trail systems, were tabled for use in the future, i.e. as town-wide coverages become available. This was done in order to maintain an emphasis on natural resources and provide a science-based rationale for balancing conservation with “smart growth.” Model development received a secondary review after several test parcels were analyzed. Owing to time limitations, tertiary review and implementation of the attribute assessment model for all parcels within the high-value co-occurrence areas was not completed as a part of this project. This step is scheduled for completion in the near future.
Findings
Results of the Co-occurrence Analysis included the identification of 10 areas of Town with high conservation value according to selected NRI parameters:
1) Hawkins Brook to Meredith Bay 2) Bartlett Brook 3) Page Pond and Page Brook

iii
4) Hatch Brook 5) Forest Pond and Dolloff Brook 6) Blake Brook to Lake Wicwas 7) Meredith Center to Chemung 8) Spectacle Pond 9) Leavitt Mountain 10) Pemigewasset Lake
The above list does not include general high-value areas such as lakeshores, or noteworthy sites that may have a single unusual or rare natural resource attributes such as state-listed endangered plants or old growth forests. However, on the basis co-occurrence, this list of 10 areas in Meredith does highlight the locales where conservation initiatives would be best served on a municipal basis. Further analyses of the data provided in this report indicate that more fieldwork is needed prior to implementing selected conservation measures as outlined in the last section. This is true for assessing wildlife habitat quality, freshwater ecosystem health, forest condition, and the extent of prime wetlands. Wildlife corridor assessments are best completed on the ground, as are estimates of freshwater fish, macro-invertebrate diversity and forest tree species and health. The latter can be completed after initial parcel attribute assessments yield findings about where conservation measures are warranted on an apriori basis. Conservation measures that might help protect the natural resources of the high value co-occurrence areas include:
Zoning Ordinance Amendments Conservation Overlay Districts Volunteer Neighborhood Agreements Conservation Easements Conservation Land Purchases Volunteer Monitoring and Stewardship
The author would like to thank John C. Edgar for the essential and pivotal role he played in crafting the design of this project, Jacquie Colburn of the Meredith Conservation Commission for her valuable and timely feedback, and Robin McCann, Meredith IT/GIS Coordinator, for her patient and careful proofing and assistance in producing the GIS maps and tables. Additional thanks are due to the Town of Meredith Conservation Commission members for their general support and interest in the project, and the staff at the Meredith Town Planning Office for fielding so many of my phone calls and questions.

iv
How to Use This Document This report is meant to be read by Meredith residents, Town officials, and laypersons interested in the natural resources of Meredith. It provides a set of maps that identify where the significant natural resources are Meredith are, as well as description of each resource in the following order: Agricultural Resources Forest Resources Visual Resources Water Resources Wildlife Resources Agricultural resources include active farmland, good growing soils,3 as well as where these two resources intersect. Forest resources include all forestland as well as where long-term forest resources exist in areas away from roadways and development. Visual resources relies on a report by Tom Kokx in 2000 that summarized the high quality scenic value areas of Meredith as well as the views of surrounding towns. Water resources are broken into two areas: open water (lakes, ponds, rivers and streams) and wetlands. Both of the latter are combined in the wetland wildlife resource discussion, which is separated from the upland wildlife discussion. The first part of this report gives some background on the NRI project in general. It provides the context for the initiation of the work, as well as a summary of what work has been completed on natural resource inventories prior to the project. It describes the “why” part of the report, as well as what benefits the Town residents might enjoy by focusing on natural resource protection. It also gives the context for the larger Planning Department effort in crafting a follow-up Open Space Plan to the 2002 Community Plan. The second part of this report describes the methods involved in deriving the natural resource overlays and maps. It discusses the accuracy of each existing data layer, the process used in deriving the created data layers, and the interpretation of the data in preparing the co-occurrence maps, that is, those maps that illustrate where multiple natural resources overlap. The latter form the bulk of the Findings section of this report. Each contributing natural resource is discussed in the order given above, complete with maps and statistics about each resource. The rationale is also given for using certain components of each resource area in preparing the co-occurrence maps. The last sub-section talks about the co-occurrence maps themselves, and provides a synopsis of the final overlay map.
3 Soil information was provided initially by an unvalidated NRCS soils map in 2003, which in July 2005, was validated and made publicly available. Soils information relative to the agricultural and forest resources in Meredith were unaffected by this change.

v
A subsequent Findings section talks exclusively about the Lake Waukewan watershed. A study was completed of this 8265-acre area within the towns of Meredith, Center Harbor, New Hampton, Ashland, and Holderness in order to assist the Town in their planning efforts to protect the Lake Waukewan drinking water supply. This section is succinct, and contains a written summary of all natural resource attributes of the watershed. The last Findings section discusses the Attribute Assessment model that was created to evaluate each parcel within the high value co-occurrence areas. This model was adapted from work completed by the author in another town in New Hampshire. It is based on the statewide land conservation criteria produced by the Land and Community Heritage Investment Program, and provides a follow-up procedure to prioritize land conservation in Meredith. The Meredith Conservation Commission, the Town Planning Department or a subcommittee of volunteers can use this procedure to begin protecting high value natural resource areas in Meredith. The Conclusions and Recommendations section summarizes the natural resource inventory and provides several “next steps,” including recommended actions that the Town could take to achieve greater protection of their natural resources. This section offers an in-depth review of protection strategies, as well as a discussion of the implementation of the attribute assessment model. The Appendix lists the GIS data layers that were created or modified for the NRI, and gives their file type, overlay reference, and written description. The Appendix also contains the latest version of the Attribute Assessment model, which can be applied to parcels contained within each co-occurrence area as described above. The report can be leafed through to review an individual natural resource area, or it can be digested as a whole to better understand how each co-occurrence area was derived. The maps provide a readily accessible reference to the location and distribution of each natural resource, and the attribute assessment model provide a user-friendly way for readers to understand how each parcel can be evaluated for its natural resource value. Table 1 on pages 8 and 9 list the remote data for the project as well as the modifications that were made to them during the data analysis phase. Table 1 also indicates the approximate precision level of each natural resource as mapped. An additional description of map accuracy is provided in the methods section of the report.

vi
CONTENTS
Executive Summary i –iii
How to Use This Document iv-v
Introduction 1 Methods A) Development of the NRI Data Layers 7 B) Development of the Co-Occurrence Layers 13 C) Development of Improved Digital Tax Maps 17 D) Development of Co-Occurrence Areas Map 17 E) Lake Waukewan Watershed 18 F) Development of the Attribute Assessment Model 19 Findings A) General Natural Resource Attributes of Meredith 20 B) Co-Occurrence Layers 22 1) Agricultural Resources 22 2) Forest Resources 23 3) Visual Resources 24 4) Water Resources 25 5) Wildlife Resources 35 C) Improved Digital Tax Maps 39 D) Co-Occurrence Area Map 39 E) Lake Waukewan Watershed 42 F) Attribute Assessment Model 46 Conclusions 47
Recommendations & Next Steps 48
Acknowledgments 51 References 53 Appendices
A. List of GIS Shapefiles (ArcView 3.2a) B. Attribute Assessment Model C. National Wetlands Inventory (NWI) wetland classes list

vii
List of Maps following page Agricultural Resources Map 22 Forest Resources Map 24 Visual Resources Map 24 Water Resources Map 28 Wetlands Map 30 Upland Wildlife Habitat Map 36 Wetland Wildlife Habitat Map 38 Co-Occurrence Areas Map 40 List of Figures Figure 1. Meredith news article 3 Figure 2. Digital orthophotograph (DOQ) showing downtown Meredith 5 Figure 3. Base map of Meredith showing location in state of NH 5 Figure 4. Bedrock Geology map of Meredith 7 Figure 5. Sample DOQ from upper Winona Lake 11 Figure 6. Active agricultural land photo and map 12 Figure 7. Viewpoint in Meredith 14 Figure 8. Upland versus wetland wildlife habitat in Meredith 16 Figure 9. Sunset on lake Waukewan 18 Figure 10. Old growth trees in Hamlin Town Forest 21 Figure 11. Low quality forest trees 23 Figure 12. DOQ of lower Lake Waukewan showing hydric soil units 28 Figure 13. DOQ of lower Lake Waukewan showing API-mapped wetlands 29 Figure 14. Prime wetlands sample photograph 31 Figure 15. Wetlands map of upper Waukewan watershed 33 Figure 16. DOQ image of Hermit Lake, Sanbornton showing wetlands 34 Figure 17. Upland wildlife habitat showing fields and ecotone at edge 35 Figure 18. Pemigewasset Pond bathymetry map 37 Figure 19. Sample wetland types 38 Figure 20. Lake Waukewan bathymetry map showing 15-foot depth zone 43 List of Tables Table 1. GIS Data Layer Derivation and Precision 8 Table 2. Attribute Assessment Model Example – Water Quality 19 Table 3. List of Designated Streams in Meredith 26 Table 4. Prime Wetlands of Meredith 30 Table 5. High-value Co-occurrence Areas in Meredith 39 Table 6. Co-Occurrence Area Attributes in Meredith 40 Table 7. Attributes of 10 High-value Co-Occurrence Areas in Meredith 41

viii

Meredith NRI Project
Van de Poll / EMC Page 1 August 2005
INTRODUCTION
Our natural resources are more than breathtaking; they are fundamental to our long term health and prosperity. The richness and diversity of our natural resources define our landscape character and compel us to live, work, recreate, and invest here. With these resources comes individual and collective responsibility to act as prudent stewards.”
Town of Meredith Community Plan 2002, p. 21. The chapter on Natural Resource Conservation in the Town of Meredith Community Plan of 2002 begins with the above vision statement, discusses the existing conditions and issues facing the Town, and then goes on to describe the general natural resources conservation goal: “Conserve our natural resources through balanced, thoughtful, and respectful consideration without stifling human betterment.” Town of Meredith Community Plan 2002, p. 30. With the assistance of the subcommittee on Conservation and Community Recreation, Meredith Town Planner John Edgar addressed this goal by implementing several of the recommendations that arose from the plan. The first four activities that Mr. Edgar implemented are listed under Objective B of the Plan, “Develop and implement a comprehensive open space strategy”:
1) Support the Conservation Commission’s efforts to develop a Natural Resources Inventory (NRI). Adopt the NRI as a future supplement to the Community Plan to help further guide and refine local decision-making.
2) Develop useful inventory information in the areas of wildlife and forest resources as a component of the NRI.
3) Reinforce the multiple benefits associated with open space generally, and the specific benefits associated with a particular donation or acquisition. Assign higher conservation priority to acquisitions that will result in multiple community benefits.
4) Integrate the NRI with the current efforts to improve mapping capabilities.
On February 25, 2003, a meeting was held at the Meredith Town Offices to discuss ways of implementing these 4 specific recommendations. John Edgar laid out the required tasks reflected in the Community Plan and described the context of undertaking an NRI in cooperation with the Meredith Conservation Commission, the Town of Meredith Planning Office, and local citizens. Conservation Commission member Jacquie Colburn reviewed the following goals and scope of the proposed

Meredith NRI Project
Van de Poll / EMC Page 2 August 2005
NRI based on work completed to date by the Meredith Conservation Commission (MCC) and Americorps volunteers: 1) Evaluate significant wildlife habitat and corridors 2) Evaluate water resources 3) Evaluate forest resources (cover types, stand age, species composition, unique forests,
tree farms, etc.) 4) Identify exemplary resource features
a) Inventory and evaluate recreational resources (including land and water trails) b) Inventory and evaluate historical and archaeological resources
5) Increase public education of Meredith's NRI (including education in schools) 6) Create an NRI which is easily updateable, informative, and understandable 7) Design an NRI in such a way that over time it may evolve into a fine-tuned natural
resource database As of February 2003, the Town of Meredith had already compiled a great deal of NRI information. A "Status of NRI Maps/Reports" document dated November 2002 indicated that the following map resource layers were available:
Resource Layer Format, Author / Comments aerial photos paper (1988), digital DOQ's NHDOT/GRANIT bird sightings paper, NH Audubon (1986 - present) conservation land digital, SPNHF (1998) current use paper (Assessor's Office) deer yards paper (NH Fish & Game, 1998) drinking water, wellhead areas digital, NHDES (1999) farmland inventory maps paper, (LCIP, 1988) fisheries paper (NH Fish & Game) flood hazard areas paper (FEMA, 1998) groundwater paper, digital, NHDES (1997) groundwater threats digital, NHDES (1999, non-point, point) important farmland soils paper, (SCS, 1978) land cover (Lansat TM, 23 types) digital, GRANIT (1998) parcels mylar & paper, digital (note: under revision) recreational resources digital, NHOSP/LRPC roads paper, mylar, digital, NH DOT/GRANIT soils mylar, paper, digital, NHDES/NRCS (unvalidated) topography paper, 1975, 1987 digital, USGS (DRG & TVC) unfragmented lands digital, LRPC (2002) viewsheds digital, Tom Kokx (2001, point, polygon) wetlands mylar (prime), digital lansat TM, NWI, USGS zoning mylar, digital, LRPC
What was lacking from this compilation of maps and data was an over-arching evaluation of natural resources that could be translated into a list of conservation priorities for the Town. The evaluation and assessment phase had not been implemented beyond a few local or property-specific surveys that fueled targeted land protection initiatives. What was needed was updated mapping, an assessment of critical natural resources, and a strategic plan for conserving high value property.

Meredith NRI Project
Van de Poll / EMC Page 3 August 2005
Figure 1. Meredith News article in March of 2001
What is a Natural Resource Inventory (NRI)?
In general terms, a natural resources inventory is an accounting of all elements of the natural landscape within a defined region, watershed, town, or locale. It maps, lists and describes all aspects of the land, including forests, wildlife, water bodies, wetlands, bedrock, soils, as well as unique features such as rare and endangered species and exemplary natural communities.1 Since the term resources implies that these natural elements have value for society, an NRI also typically includes elements of the landscape that rely on these natural resources, such as agricultural fields, managed forests, wellhead protection areas, impounded waterways, and scenic vistas. In order to protect the integrity of these natural resources, an inventory of “artifacts” of the built landscape – e.g. political boundaries, roads, railways, trails, buildings, utility rights-of-way, hazardous waste sites, and flood control and water supply structures, may also be included. According to Natural Resources Inventories, A Guide for New Hampshire Communities and Conservation Groups (2001) published by UNH Cooperative Extension, a comprehensive NRI should be organized to contain the following elements:
1) Maps – showing in various scales the location and extent of the natural resources in a given region, watershed, town, or locale
2) Associated Data and Information Sources – tabular and graphical depictions of the
natural resources contained within the maps
3) Descriptive Report – a written document that contains the NRI project’s goals and objectives, the methods used in deriving and analyzing the data, and the textual narrative that defines the natural resources being studied
1 A natural community is defined as “recurring assemblages of plants and animals found in a particular physical environment” (Sperduto 2000).

Meredith NRI Project
Van de Poll / EMC Page 4 August 2005
This NRI contains all three of these components, as well as a detailed analysis of those areas within the town where multiple natural resources co-occur and where conservation measures may be more important.
How will this NRI benefit the Town of Meredith? This project has already yielded several benefits for the Town of Meredith:
A) The latest, up-to-date natural resource map data have been procured, compiled and archived
B) Wetlands have been remapped using aerial photograph interpretation (API) of
1998 digital orthophotoquads and knowledge of existing drainage patterns
C) Prime wetlands have been redefined as a result of the revised wetlands mapping and a more accurate depiction of their extent and location has been completed
D) Shorelines have been corrected according to 1998 digital orthophotographs
E) Town designated streams have been realigned according to 1998 digital
orthophotograph imagery and ground control points
F) Active agricultural areas have been identified and mapped from 1998 digital orthophotograph imagery and windshield surveys
G) The 2003-2005 conservation lands data have been updated and mapped using
current town tax records
H) Some watershed and sub-watershed boundary lines have been revised and updated according to contour maps, digital orthophotograph imagery, and roadside observations of drainage patterns
I) Shallow water wetlands associated with lakes and ponds have been identified
from NH DES Water Resources data, digitized and added as a separate bathymetry map layer2
J) Unfragmented land buffers have been revised according to updated roadway
alignments (1998 digital orthophotograph imagery) to provide more accurate estimates of the extent of wildlife habitat away from roads
K) Additional NRI data from the half-mile buffer zone around Meredith has been
compiled as separate and integrative map units
2 Note that Lake Winnipesaukee lacks bathymetry data and a 50-foot horizontal distance was used.

Meredith NRI Project
Van de Poll / EMC Page 5 August 2005
L) A separate NRI of the Lake Waukewan watershed has provided important natural resource information about the area above the Town’s largest water supply
Figure 2. Digital orthophotograph showing wetlands mapping near downtown Meredith
Besides this report, what else can the Town get from the NRI?
This NRI fulfills the recommendations of the Community Plan described above, specifically, to act as a supplement to the Community Plan of 2002, to provide in-depth information on the forest and wildlife resources of the Town, to improve current mapping capabilities, and to provide an analysis of high-value conservation areas in Meredith. As stated above, it has also provided information regarding the natural resources within a half-mile of the Town boundary and the entire Lake Waukewan watershed.
This is not all that this NRI can and will provide. The following benefits are also possible:
∗ Knowledge of where multiple natural resources co-occur ∗ Improved planning capability around prime wetlands ∗ More accurate maps with which to protect water resources ∗ Up-to-date knowledge of where the most productive forests lie ∗ A single GIS layer of active agricultural lands ∗ Strategic planning tool for land conservation in Meredith
Finally, the NRI provides a set of maps, tables, and descriptions with which it can educate and inform the general public about those attributes that make Meredith special and unique in the Lakes Region.
Figure 3. Base Map of Meredith as enlarged from map of state of New Hampshire
Portion of aerial photograph showing corrections. New wetland boundaries are in yellow, and hydric soils are in pink. Green-shadedareas are from 1983 wetlands map, and blue areas are from the NWI map.

Meredith NRI Project
Van de Poll / EMC Page 6 August 2005
Disclaimer
During the development of the natural resource maps and overlays, a number of “remote” data sources were used. Remote data sources include map, tabular and text data that were created with the help of an airplane or satellite and produced outside of Meredith and typically, outside of the state of New Hampshire. An example is the United States Geological Survey’s topographic quadrangle or contour map. The primary source for the digital version of these remotely derived maps and data was Complex Systems Research Center at the University of New Hampshire in Durham.3 Both the original maps and the digitized map products contain a certain degree of error. Innate mapping errors can be between 2 and 25%, depending on the accuracy of the equipment used and the skills of the author or interpreter. As with any map created and produced by federal or state agencies, the degree of error is compounded when it is subsequently digitized by UNH Complex Systems. Many of these errors were assumed during the map interpretation phase of this project, although every effort was made to minimize additional errors from manipulating this data. The soils map, for example, was created from an unvalidated map4 product of the Natural Resource Conservation Service, and contains a maximum precision level of between 2 and 5 acres per soil map unit, or roughly an error of about 4 – 9% overall. The attached soils maps reflect this level of precision, and therefore no claims can be made about the verity of the soil map unit boundaries beyond the stated level of error. Similarly, the lansat TM 23 (i.e. a satellite-based thematic mapper image showing 23 cover types) contained minimum precision levels of .25 to 1.0 acres, yet even at sizes larger than this cover type were often misidentified. As a result, these and several other coverages had to be derived by interpretation. Many of the derived maps were based on the 1998 digital orthophotographs of the region, which were produced for the New Hampshire Department of Transportation (NHDOT) by Complex Systems. Since many changes have occurred since that time, certain wetlands areas, shorelines, or stream courses may not be fully up-to-date. The principal purpose of compiling these maps was to provide a usable tool for planning purposes. The maps and data contained in this report do not represent, nor should they be used to represent any legal claim to a resource depicted in paper or digital form. [For a more in-depth listing of the approximate level of error associated with each map layer, please see Table 1 on pages 8 and 9.]
3 Complex Systems Research Center (CSRC) maintains and manages the stateside GIS map system known as NH GRANIT. GIS coverages for all regions and towns are available through their web site at http://www.granit.sr.unh.edu/. 4 This unvalidated version of the Belknap County Soils Survey was cross-checked with a July 2005 validated version and no significant changes were noted in the validated version.

Meredith NRI Project
Van de Poll / EMC Page 7 August 2005
METHODS
A) Development of the NRI Data Layers The following pages list the geographic information system (GIS) data files that were obtained or created from various sources during the course of the project. The GRANIT GIS system, as maintained by the Complex Systems Research Center (CSRC) at the University of New Hampshire (UNH) in Durham, was the original source for many of the computer-based map files and the tabular data associated with them. Compact disc (CD) copies of these files were obtained prior to the onset of the study, and permission was obtained for reproducing this data in the form of maps and tables for the Town of Meredith. An example of a typical GIS data map for Meredith is shown below.
Figure 4. Bedrock Geology map of the Town of Meredith (plus ½ mile extended study area). The map shows just four types of bedrock, yet each contributes a slightly different quality of soil, water-borne nutrients, and landform type to the region. Bedrock types, along with four other baseline NRI themes, namely soils, open water resources, wetlands, and land cover, formed the basic set of natural resources that were reviewed prior to the derivation of more specific natural resource overlays. Since one of the goals was to improve the spatial accuracy of Meredith’s natural resources, a considerable effort was expended in updating various GIS data layers using ArcView 3.2a software and Auto Cad Map. Table 1 on pages 8 and 9 identify the 50 data layers that were obtained and/or modified from various sources, and gives the sources and levels of precision before and after modification, and the modifier, the date of modification and the approximate linear or spatial precision of each GIS layer.

Mer
edith
NR
I Pro
ject
Tab
le 1
. GIS
Dat
a L
ayer
Der
ivat
ion
& P
reci
sion
GIS
Lay
erSo
urce
1So
urce
2D
igita
l?R
evis
ed?
Rev
. by
Dig
itize
d?B
eg. P
reci
sion
End
Pre
cisi
on
Act
ive
Agr
icul
tura
l Lan
dLa
nsat
199
8, N
HD
ES 2
003
DO
Q's
1998
YY
R. M
cCan
nY
mod
erat
eve
ry h
igh
Aqu
ifers
– lo
catio
n &
tran
smis
sivi
tyN
HD
ES, 1
992
NH
GR
AN
ITY
Nm
oder
ate
mod
erat
eB
athy
met
ryN
HD
ES v
ar. d
ates
NH
DES
199
2N
YR
. Van
de
Poll
Ym
oder
atel
y hi
ghhi
gh
Bed
rock
Geo
logy
Lyon
s et a
l., 1
997
NH
GR
AN
ITY
Nlo
wlo
wC
oner
vatio
n La
nds
SPN
HF
2003
Tow
n of
Mer
edith
YY
R. M
cCan
nY
fairl
y hi
ghfa
irly
high
Cur
rent
Use
Tow
n of
Mer
edith
NY
R. M
cCan
nY
mod
erat
em
oder
atel
y hi
ghD
eer W
inte
ring
Are
as o
r Yar
ds
NH
Fis
h &
Gam
e, 1
987
N
YR
. McC
ann
Ylo
wlo
wD
esig
nate
d St
ream
sTo
wn
of M
ered
ithD
OQ
's 19
98Y
YR
. Van
de
Poll
Yhi
ghve
ry h
igh,
< 2
5 ft
Dig
ital O
rthop
hoto
grap
hs (D
OQ
’s)
NH
AP,
199
8N
H G
RA
NIT
YN
very
hig
h, <
25
ftve
ry h
igh,
< 2
5 ft
Fore
st T
ypes
of M
ered
ithLa
nsat
TM
199
8D
OQ
's 19
98Y
YR
. Van
de
Poll
Ym
oder
ate
fairl
y hi
ghFo
rest
Lan
d So
ils (P
rime
& L
ocal
Impo
rtanc
e)N
HD
ES, N
RC
S 20
03D
OQ
's 19
98Y
YR
. Van
de
Poll
Ym
oder
ate
fairl
y hi
ghG
ood
Fore
st L
and
Are
asN
HD
ES, N
RC
S 20
04D
OQ
's 19
99Y
YR
. Van
de
Poll
Ym
oder
ate
fairl
y hi
ghH
igh
Elev
atio
n La
nds (
> 12
00 ft
.)U
SGS,
198
7N
H G
RA
NIT
YN
high
high
Hyd
ric S
oils
NH
DES
200
3N
RC
S 19
77Y
Nm
oder
ate
mod
erat
eH
ydro
grap
hy –
surf
ace
wat
ers
USG
S, 1
987
NH
GR
AN
ITY
YR
. Van
de
Poll
Yfa
irly
high
very
hig
h, <
25
ftLa
kes &
pon
ds, c
orre
cted
& th
eir b
uffe
rsU
SGS,
198
7D
OQ
's 19
98Y
YR
. Van
de
Poll
Yfa
irly
high
very
hig
h, <
25
ftLa
nd C
over
- La
nsat
TM
Sat
ellit
e Im
ager
yN
H G
RA
NIT
CSR
C, 1
998
YN
low
-med
ium
low
-med
ium
Nat
iona
l Wet
land
s Inv
ento
ry (N
WI)
NH
GR
AN
ITC
SRC
, 199
8Y
YR
. Van
de
Poll
Ym
oder
ate
very
hig
h, <
25
ftN
on-p
rime
Wet
land
s > .1
ac.
& th
eir b
uffe
rsU
SGS,
NW
I 198
7D
OQ
's 19
98Y
YR
. Van
de
Poll
Ym
oder
ate
very
hig
h, <
25
ftO
pen
Wat
er A
reas
USG
S 19
87, N
HD
ES 2
003
DO
Q's
1998
YY
R. V
an d
e Po
llY
fairl
y hi
ghve
ry h
igh,
< 2
5 ft
Polit
ical
Bou
ndar
ies
NH
GR
AN
ITC
SRC
, 199
8Y
YR
. McC
ann
Yhi
ghhi
gh, u
pdat
edPo
tent
ial C
onta
min
ant T
hrea
tsN
H D
ES, 1
992
CSR
C, 1
998
YY
R. M
cCan
nY
fairl
y hi
ghhi
ghPr
ime
Agr
icul
tura
l Soi
lsN
HD
ES 2
003
NR
CS
1977
YN
mod
erat
em
oder
ate
Prim
e W
etla
nds &
thei
r buf
fers
Tow
n of
Mer
edith
DO
Q's
1998
NY
R. V
an d
e Po
llY
mod
erat
eve
ry h
igh,
< 2
5 ft
Priv
ate
Wel
lsN
H D
ES, 1
992
CSR
C, 1
998
YY
R. M
cCan
nY
high
very
hig
h Pu
blic
Wat
er S
uppl
ies
NH
DES
, 199
2C
SRC
, 199
8Y
YR
. McC
ann
Yhi
ghve
ry h
igh
Qua
dran
gle
Inde
xN
H G
RA
NIT
CSR
C, 1
998
YN
very
hig
h ve
ry h
igh
Rai
lroad
sN
H G
RA
NIT
CSR
C, 1
998
YN
fairl
y hi
ghfa
irly
high
Riv
ers &
stre
ams,
corr
ecte
d &
thei
r buf
fers
USG
S 19
87
DO
Q's
1998
YY
R. V
an d
e Po
llY
high
very
hig
h, <
25
ftR
oads
, Priv
ate
Tow
n of
Mer
edith
Tow
n of
Mer
edith
YY
R. M
cCan
nY
high
very
hig
hR
oads
, Pub
licN
H G
RA
NIT
CSR
C, 1
998
YN
high
fairl
y hi
ghSa
nd &
Gra
vel T
erra
ces (
from
Soi
ls M
ap)
NR
CS
field
shee
tsN
HD
ES 2
003
YN
mod
erat
em
oder
ate
Sign
ifica
nt &
Hig
hly
Sign
ifica
nt V
iew
Poi
nts
Tom
Kok
xTo
wn
of M
ered
ithY
Nve
ry h
igh
very
hig
h (G
PS)
Scen
ic L
ands
of M
ered
ith
Tom
Kok
xTo
wn
of M
ered
ithY
Nm
oder
atel
y hi
ghm
oder
atel
y hi
ghSo
il D
rain
age
Cla
sses
(fro
m S
oils
Map
)N
RC
S 19
77N
HD
ES 2
003
YN
mod
erat
em
oder
ate
Soils
(unv
alid
ated
)N
RC
S fie
ld sh
eets
NH
DES
200
3Y
Nm
oder
ate
mod
erat
e So
ils o
f Loc
al Im
porta
nce
NR
CS
1977
NH
DES
200
3Y
Nm
oder
ate
mod
erat
e St
ream
s - T
own
Des
igna
ted
USG
S, 1
987
Tow
n of
Mer
edith
YY
R. V
an d
e Po
llY
high
very
hig
hSt
ream
s - U
ndes
igna
ted
USG
S, 1
988
DO
Q's
1998
YY
R. V
an d
e Po
llY
high
very
hig
hTo
tal V
ecto
r Con
tour
s (tv
c’s)
USG
S, 1
987
CSR
C, 1
998
YN
fairl
y hi
ghfa
irly
high
Van
de
Pol
l / E
MC
Pag
e 8
Aug
ust 2
005

Mer
edith
NR
I Pro
ject
Tab
le 1
. GIS
Dat
a L
ayer
Der
ivat
ion
& P
reci
sion
GIS
Lay
erSo
urce
1So
urce
2D
igita
l?R
evis
ed?
Rev
. by
Dig
itize
d?B
eg. P
reci
sion
End
Pre
cisi
on
Unf
ragm
ente
d La
nds
Tow
n of
Mer
edith
DO
Q's
1998
YY
R. V
an d
e Po
llY
mod
erat
ely
high
high
Upl
and
Wild
life
Hab
itat
NH
DES
200
3D
OQ
's 19
98Y
YR
. Van
de
Poll
Ym
oder
ate
very
hig
hU
SGS
topo
grap
hic
map
qua
ds (D
RG
’s)
USG
S, 1
987
NH
GR
AN
ITY
N
fairl
y hi
ghfa
irly
high
Util
ity R
OW
’sN
H G
RA
NIT
CSR
C, 1
998
YN
fairl
y hi
ghfa
irly
high
Wau
kew
an W
ater
shed
N
H G
RA
NIT
DO
Q's
1998
YY
R. V
an d
e Po
llY
high
very
hig
hW
etla
nd W
ildlif
e H
abita
tN
HD
ES 2
003
DO
Q's
1998
YY
R. V
an d
e Po
llY
mod
erat
eve
ry h
igh
Wet
land
s - A
PI c
orre
cted
Van
de
Poll
YY
R. V
an d
e Po
llY
mod
erat
eve
ry h
igh,
< 2
5 ft
Wet
land
s - T
own
Des
igna
ted
Non
-Prim
eTo
wn
of M
ered
ithN
YR
. McC
ann
Ym
oder
ate
mod
erat
eW
etla
nds -
Tow
n D
esig
nate
d Pr
ime
Tow
n of
Mer
edith
NY
R. M
cCan
nY
mod
erat
em
oder
ate
Wet
land
s - U
SGS
USG
S, 1
987
NH
GR
AN
ITY
Nlo
wlo
w
Van
de
Pol
l / E
MC
Pag
e 9
Aug
ust 2
005

Meredith NRI Project
Van de Poll / EMC Page 10 August 2005
Each of the revised GIS data layers above required a similar method of modification or creation. Remote data was clipped to fit three areas of study: 1) the Town of Meredith, 2) the area within a half-mile extended study area of the town, and 3) the upper part of the Lake Waukewan watershed that lay outside the half-mile zone. Town boundaries were initially defined by USGS and digitized by GRANIT, but were then modified by the Meredith IT/GIS Office to reflect historic boundary changes that were not recognized by the latest GRANIT topographic maps. The half-mile extended study area was established using ArcView 3.2a theme buffering techniques. The entire Lake Waukewan watershed was modified from the existing NH DES watershed data by studying the 1998 digital orthophotographs and the 20-foot contour interval from the Tagged Vector Contour (tvc) map.5 Some watershed revisions were also made by ground truthing, since tree cover and roadway ditches masked the actual watershed divide in certain places. Map data for areas outside of these three study sites were often “watermarked” and kept as a background reference. This was particularly helpful when deriving accurate road and stream alignments, shorelines, and wetlands. “Watermarked” data included NHDOT and private roads, 20-foot contours, surface water, and soils. Keeping this data in each map view allowed for the accurate identification of all wetlands that flowed into the three study areas but which fell outside of the study area boundaries. Once the initial GIS data layers were uploaded and clipped, NRI map derivations took place. The list of Town benefits on page 4 and 5 summarizes some of these. Wetland map were the most time-consuming among the NRI layers that were modified. The USGS, National Wetlands Inventory (NWI) and hydric soil maps were compared against the 1998 digital orthophotographs (DOQ).6 Existing wetlands that were visible on the 1998 DOQ were either modified or created using a 1:3,000 scale view and hand-held mouse as a digitizing tool. Wetland classes were assigned according to the 1979 Cowardin et al. publication of the US Fish and Wildlife Service.7 A limited field review took place in April of 2004 to verify the boundaries of palustrine, forested swamps in selected roadside locations throughout the town. Limited field checks of wetland classes were also made, and this helped reduce aerial photograph interpretation (API) errors. In 2004, the Meredith IT/GIS Office digitized prime wetlands from mylar maps produced by Barry Keith in 1983 for the Town of Meredith Prime Wetlands Study. This digital version of the 1983 maps was used as a reference for selecting the wetland units that were identified during in the aerial photograph interpretation (API) process. All contiguous
5 TVC’s are also supplied by the NH GRANIT system and are simply a linear (vector) representation of the USGS topographic contour lines. Although not entirely accurate, in combination with the digital aerial photographs, they provide a readily accessible way of checking watershed boundaries. It should be noted that the boundaries used in this project have been verified by NHDES or the USGS and should be considered official. 6 DOQ’s are high altitude aerial photographs that have been “geo-referenced” to the New Hampshire State Plane Coordinate System, and reflect in reduced size the actual distance on the ground. Very good to excellent detail can be seen in these photographs, including buildings, cars on the highway, and boats on the lake. 7 Cowardin, L.M., V. Carter, F.C. Golet, and E.T. LaRoe. 1979. Classification of Wetlands and Deepwater Habitats of the United States. Biological Services Program. FWS/OBS-79/31.

Meredith NRI Project
Van de Poll / EMC Page 11 August 2005
(hydrologically connected) wetlands were included in each prime wetland area even if a paved road crossed them. Beyond this, guidance followed the general boundaries of the original report to the greatest extent possible. In no case were isolated or hydrologically unconnected wetlands lumped in with prime wetlands areas. Shoreline configurations were updated by using the 1998 DOQ’s as well. New shoreline alignments were digitized using a scale of 1:3,000 or 1:5,000. Visual estimation of the mean high water (MHW) mark was used as the reference line. No docks or bridges were circumscribed, except those that appeared to be made of fill materials. All islands and rock reefs > .01 acres were deducted from the open water area. Estimates of MHW in areas of tree shade were made by using the base of the shadow line. Shallow coves and embayments of less than .01 acres in size were not included.
Figure 5. Sample aerial photograph from upper Winona Lake showing where USGS stream and shoreline alignments (in blue) needed changing. Yellow lines indicate wetland and open water boundaries created for this project. Actual stream course appears on the photograph as a dark, sinuous line. Notice how different it is from the blue line.
In a similar fashion, streams were identified and realigned. The Town Planning Office provided an initial list of designated streams in Meredith, and two additional streams were added after reviewing the USGS topographic maps. Each stream alignment was checked against the 1998 DOQ and then field-verified at selected road crossings. Mid and lower perennial stream drainages were fairly easy to discern through API, although their upper headwater channels were sometimes obscured by tree cover. Approximations of their alignments were made in these instances by referencing the angle points of contour lines. The same procedure was followed for the other two study areas, although these stream alignments were not subject to field or windshield review. Agricultural areas were identified from town reports, current use designations, and the 1998 lansat imagery from UNH Complex Systems Research Center. The latter provided

Meredith NRI Project
Van de Poll / EMC Page 12 August 2005
23 satellite-based cover types in raster format, one of which, layer 21, provided estimates of cropland and pasture. Final rectification of agricultural land boundaries was made by using the 1998 DOQ, as well as a windshield survey conducted by the Town Planning Office. Active agricultural lands were defined by the absence of natural woody vegetation and the presence of low herbaceous cover. These generally included areas of row crops, cover crops, hay fields, pasture, Christmas tree plantations, berry farms, and other commercial or non-commercial open upland areas. Exceptions to this were lawns and gardens near houses, and unmanaged wet meadows. Some map errors can be expected in areas that were clearcut just before the 1998 DOQ’s were taken, especially if they were adjacent to existing hay or crop fields. Similar errors may have also occurred in prior converted cropland that is now reverting back to natural wetland (i.e. emergent marsh).
The latest (2004) conservation land layer, as supplied by the Town of Meredith IT/GIS Office, was not changed except to add the recently acquired Longridge Farm property and Eames property. The Meredith IT/GIS Coordinator updated these data on the Town’s geo-referenced parcel map and they were provided in the fall of 2004.8 As described above, NRI data for the Lake Waukewan watershed was updated by using the 1998 DOQ and the existing NH DES watershed data layer as supplied by GRANIT. The Meredith Community Plan depicted sub-watersheds boundaries within the Town of Meredith, and these were not modified except for the area within the Lake Waukewan watershed. Sub-watersheds above Lake Waukewan were modified according to the 1998 DOQ imagery and the 20-foot contour overlay. A reasonable approximation of sub-
8 It should be noted that the 2004 Meredith land conservation layer will align differently than the 2003 conservation data layer as created by SPNHF owing to parcel realignments by the Meredith IT/GIS Coordinator.
Figure 6. Active agricultural land, as depicted below and as seen in the 1998 aerial photograph at right (area bounded by green lines). Arrow indicates direction of view. Yellow lines on map indicate wetlands, tan lines are 20-foot contours.

Meredith NRI Project
Van de Poll / EMC Page 13 August 2005
watersheds above the Lake Waukewan lakeshore was made on the basis of lake bathymetry as well as well-defined drainage divides that contained streams that entered the lake. Units with large, hydrologically connected wetland systems were also lumped into sub-watersheds even if they spanned more than one lakeshore cove. The bathymetry of each open water body in Meredith was derived from NHDES paper and digital data on selected ponds in and around Meredith. Paper maps were scanned and geo-referenced into ArcView 3.2a using Image Analysis and pertinent bathymetry lines were hand-digitized. A depth of 15 feet was defined as the area where predominant littoral zone vegetation occurs.9 This very productive wetland and deepwater edge can be quite sensitive to pollution. It also defines the most productive aquatic wildlife area in a given lacustrine or palustrine system. The pondshore and lakeshore buffer zone was added as a critical NRI element in the Wildlife – Wetlands overlay. The determination of good forest land was made by combining four different remote data sources: the 1998 lansat 23 land cover data (from GRANIT), the updated (2004) road alignment layer (from Meredith IT/GIS Office), the 2003 soils data from unvalidated NRCS field sheets, and the 1998 digital orthophotographs. No attempt was made to search current use or intent-to-cut records to determine the quality of the existing forest stands. This step, while a worthwhile one, remains as a recommended follow-up step that could be undertaken by the Town. An agreed upon setback of 100-feet from a paved road and a minimum forest block size of 50 acres was used for determining areas where forest cover may indicate a potential for timber harvesting activity. Further manipulations of the existing remote data sources are described in the next section, which addresses the development and creation of 7 different co-occurrence layers, that is, areas where multiple natural resources overlap in meaningful and important ways.
B) Development of the Co-Occurrence Layers
Layer Principal Components10
Agriculture active agricultural land, prime agricultural soils, soils of local importance Shapefile Name: activeag-prime-importsoils.shp The purpose of this derivation was to demonstrate where good, active agricultural land exists in Meredith. “Good” was defined as areas where prime agricultural soils and soils of statewide and local importance are shown on the NRCS soils map of Meredith. These include soils in Land Capability Classes I, IIe and IIw,11 which comprise the prime agricultural soils, and Class III & IV, which comprise the soils of statewide and local importance, respectively. These areas (polygons) were intersected with the above-described areas of active agricultural land, and
9 An exception was made for Lake Winnipesaukee where bathymetry was not available. A shoreline buffer of 50 feet was used as the approximate average of a 15-foot depth. 10 Not all shapefiles listed in Appendix A for each layer are shown on the maps or are listed here. 11 See the attached shapefile list with notes for a description of IIe, and IIw.

Meredith NRI Project
Van de Poll / EMC Page 14 August 2005
presented as a shapefile called “activeag-prime-importsoils.” Although the soil polygons have possible errors of between 2 and 5 acres, no attempt was made to determine soil types in the field. Layer Principal Components Forest Resources unfragmented forest land, good forest land soils, current use parcels Shapefile Names: forland-unfrag100-forsoils.shp, parcels-goodforests-currentuse.shp Where do the best forests exist in Meredith for the purpose of timber production and/or wildlife habitat? Forested areas were first determined from the lansat 23 data layer as described above, and then checked against the 1998 aerial photographs (DOQ’s). A buffer of 100-feet was set against the corrected road alignments and clipped out of this area. A minimum fragment (forest block) size of 50 acres was selected based on the estimated minimum viable size for timber production. Finally, these areas were intersected with the prime, statewide, and local importance soils to yield a theme that reflects the best forest land in Town. As stated above, it was beyond the scope of this project to estimate the quality of the current forest stands within these areas. Roadside surveys, a review of intents-to-cut, and timber tax slips might aid in this next step.
Figure 7. Significant view point in Meredith
Layer Principal Components Visual Resources unfragmented lands (500-ft buffer), critical viewshed areas (cva) Shapefile Name : unfrag-cva.shp This layer was derived from the work of Tom Kokx,12 who completed a scenic inventory of Meredith in 2002. Based on standardized models, he provided a synopsis of the most valuable viewshed areas that were observable from roadside points in Meredith. These viewshed areas extended beyond the Town boundaries, however all significant and highly significant view points were identified from areas within the Town. The only map layer created from this data was the
12 See page 26 for more information.

Meredith NRI Project
Van de Poll / EMC Page 15 August 2005
intersection of unfragmented lands (with a 500-foot buffer from roadway centerlines) with the critical viewshed areas. Layer Principal Components Water Resources open water areas and their buffers, stratified drift aquifers Shapefile Names: aquifers-meredith.shp, aquifers-med.shp, sand&gravelterraces.shp
openwater-meredith+2640.shp, openwater-meredithbuff250.shp designatedstreams.shp, nondesignatedstreams.shp streamsallbuff10mrg.shp, streamsallbuff200.shp
The water supply layer contains NRI information about where water lies at or beneath the surface of Meredith. This layer emphasizes stratified drift (sand and gravel) aquifers as well as surface water bodies. Wetlands have been separated into a different view in order to simplify the layer. The water supply layer was derived from USGS (1997) data on aquifers, and GRANIT data on hydrography, which includes lakes and ponds, rivers and streams. As described above, the extent of these four open water types were modified on the basis of aerial photographs (1998 DOQ’s). These were then clipped to the Town boundaries and buffered by a specified number of feet using ArcView 3.2a software. Subwatershed lines were added to provide the Town of Meredith Planning Office with information regarding how these water resources vary within different drainages in Town. Subwatershed lines were also extended into the Lake Waukewan watershed area, as well as the half mile extended study area beyond Meredith’s boundary. Layer Principal Components Wetlands prime wetlands, API-derived wetlands, open water areas Shapefile Names: apiprimes.shp, apiwetldsall.shp, openwater-all.shp Wetland derivations took place according to the methods described above. Each wetland unit was identified according to the Cowardin et al. (1979) system of wetland classification.13 Wetlands were then separated into several different groups, according to location, size and the inclusion of open water areas. Location groups were based on the three study areas, Meredith, Meredith plus a half-mile extended study area, and the Lake Waukewan watershed. Size classes were ≥ 1 acre, < 1acre, and < 3,000 square feet. Shapefiles were also created for wetland groups with and without open water in all thee study areas. The presence of water was determined on the basis of inundation at the time of the 1998 aerial photographs. Buffers of 100 feet and 200 feet were created for all wetlands areas. These were created both for water resource protection purposes and for identifying wetland wildlife habitat areas. 13 See footnote 7 above or http://wetlands.fws.gov/mapcodes.htm.

Meredith NRI Project
Van de Poll / EMC Page 16 August 2005
Layer Principal Components Wildlife – Upland Unfragmented lands above 1,200 feet with > 25% slopes, softwood
stands, deer wintering areas, agricultural land ecotones (75 feet) Shapefile Names: unfrag-steep-1200+.shp, soft-deer-unfrag.shp, ag-openbuff75-
unfrag-int.shp Upland wildlife habitat was identified on the basis of Identifying and Protecting New Hampshire’s Significant Wildlife Habitat by Kanter, Suomala, and Snyder (2001), as well as the author’s knowledge of critical habitat components on the landscape. The shapefile for lands unfragmented by roads (500-foot buffer) was intersected with the shapefile of softwood cover as determined by Lansat and aerial photograph imagery. This intersection was then combined with an overlay of the N.H. Fish and Game Department’s deer yard maps, which were digitized by the Meredith IT/GIS Office. The latter were not field-checked and a significant amount of error may be present in their depiction. A second intersection combined the unfragmented lands theme with steep slopes (NRCS 2003, ≥ 25% slopes) and lands above 1200 feet in elevation in order to identify upland wildlife feedings areas. Twelve hundred feet was selected as the average lowest elevation of boreal northern hardwood forests n Meredith. A third contributing overlay was created by buffering all active agricultural land by 75 feet, or, the approximate width of the forest edge ecotone. This was clipped to the unfragmented lands theme and added to the upland wildlife habitat layer.
Figure 8. Upland wildlife habitat on Leavitt Mtn. Wetland wildlife habitat in Chemung Layer Principal Components Wildlife – Wetland Open water and wetland buffer areas Shapefile Names wetlandwildlifehab.shp Wetland wildlife habitat was mapped on the basis of existing open water and wetland areas. Open water areas were assumed to have excellent habitat for aquatic wildlife along their shorelines. Wetland areas were assumed to have high quality habitat for wetland-
Photo by Peter Miller

Meredith NRI Project
Van de Poll / EMC Page 17 August 2005
dependent wildlife within a certain distance from their edge (Kanter et al. 2001). Upland buffers of 200 feet to all perennial streams and all non-open water wetlands > 1 acre in size were included, as well as a 250-foot buffer from all lakes and ponds. Buffer areas were merged together based on the maximum extent of the buffer in each locale. For example, if a 250-foot buffer to a pond extended beyond the 200-foot buffer to the pondshore wetland, then the maximum buffer was used to create the wetland wildlife map overlay. The merged buffer habitat was then clipped according to the unfragmented lands area (500-foot buffer) and compiled as a single theme for wetlands wildlife.
C) Development of Improved Digital Tax Maps Critical to the interpretation of the NRI data that has been the accurate depiction of town-wide tax parcels. Mylars maps that were previously scanned, digitized and compiled by John E. O’Donnell and Associates were then edited, geo-referenced and updated by the Town of Meredith IT/GIS Office using Auto Cad Map. The Meredith IT/GIS Coordinator performed this task, which required the realignment of almost all tax parcel boundaries according to new data on roads, shorelines, and rights-of-way. The new data included alignments that were based on global positioning system (GPS) satellites, as well as digital aerial photography. The second phase of this project, the assessment of parcels based on their natural resource and conservation attributes, rests on the ability to accurately locate each parcel on the new maps. Now that this is complete, this attribute assessment process can proceed uninterrupted.
D) Development of Co-Occurrence Areas Map The above seven co-occurrence layers in Section B were compiled according to a particular natural resource such as wildlife or forests. The principal goal of the co-occurrence exercise, however, was to look at areas that hold multiple natural resource values, and to combine them into discrete polygons. A GIS view called “Intersections – All” was created in order to portray multiple natural resources in a single view. Each contributing resource theme was given a unique red-shaded color symbol, which was overlain by successive natural resource themes until certain areas became quite dark. Layering in the 19 intersection themes created a very visible shade pattern. This was then used to draw an approximate line around all areas that clearly had multiple natural resources displayed. Edges were rounded to conform to contour lines and exclude developed areas wherever possible. This step was completed by examining the deeply shaded areas on a copy of the 1998 digital aerial photograph. A total of ten darkly shaded areas were defined in this way. Each of the ten co-occurrence areas contained a minimum of 2 and as many as 11 natural resource themes that intersected. Since a preponderance of the intersection themes (11 out of 19) related to water resources, almost all of the areas with heavy shading involved open water bodies or large wetland areas. Current use parcels and conservation parcels in Meredith were also compared to the 10 co-occurrence areas to determine land use

Meredith NRI Project
Van de Poll / EMC Page 18 August 2005
patterns and opportunities for protection. A more detailed analysis of each of the ten co-occurrence areas is provided in the following section.
Figure 9. Sunset on Lake Waukewan.
E) Lake Waukewan Watershed
In February of 2004, a preliminary GIS analysis of the 8275-acre Waukewan watershed was completed. The purpose of this ancillary study was to compile selected natural resource attributes of the watershed in order to assist in the development of the 2005 Waukewan Watershed Management Plan. This process was spearheaded by the (then) Northeast Rural Watershed Association or NERWA, who provided technical assistance to the Town of Meredith in an effort to protect their largest drinking water supply. The preparation of natural resource data for the 5,546-acre portion of the watershed that lay outside of Meredith involved many of the same procedures as described above for the portion within Meredith. The first step, redefining the Waukewan watershed boundary, was completed as described above through the careful examination of contour lines and aerial photograph features. The same process was used to determine the sub-watershed boundaries, although some “lumping” of near-shore areas that lacked any significant drainage divides was required. Since the effort of defining sub-watersheds was also for the purpose of identifying potential contaminant risks to the lake’s water quality, the areas closest to the lake were also divided according to shoreline features such as coves and shallow water embayments. Analyses were completed of selected natural resource attributes of the Lake Waukewan watershed that were not completed for the Town of Meredith as a whole. For example, a visual estimation of the most developed areas within the watershed was performed in order to aid in the designation of sub-watershed areas that may face higher risk of water pollution. Steep slopes, or those soil map areas with slopes in excess of 25%, were also identified and provided as an overlay to the GIS map of the watershed.14 Wetlands were identified through the API process described under the Methods Section, and aquifers were added as additional important water resource areas. The composite map for the Waukewan watershed considered the above seven attributes as well as specific open water and wetland buffers as areas where future development could be restricted.
14 Soil polygons for the Waukewan watershed were also provided by NRCS as an unvalidated data set. Since this entailed the aggregation of soil map units from two separate counties, some adjustments were required for areas that were added by the revision of watershed boundary lines.

Meredith NRI Project
Van de Poll / EMC Page 19 August 2005
F) Development of the Attribute Assessment Model
Phase II of the study involved the assessment of the co-occurrence overlays and development of an attribute assessment model for the purpose of evaluating individual parcels within each co-occurrence area. This model was derived from one drafted in 2001 by the author for another municipality in New Hampshire. It relied on the evaluation criteria published by the state of New Hampshire’s Land Conservation Investment Program (LCIP) of the late 1980’s and the Land and Community Heritage Investment Program (LCHIP) that began in the late 1990’s. The model also reflected the important natural resource values held by the Town of Meredith as expressed in the 2002 Community Plan. The model assigns a series of point values, based on questions about each parcel. In theory, those parcels that receive the highest cumulative number of points are the most suitable for, or in critical need of conservation. The model was composed of 15 attributes initially, although two, cultural resources and recreational use were deleted after discussions with the NRI Planning Team. Each approved attribute was set up to include a stated basis for inclusion, a rationale for the assignment of point values for each area of concern, and a series of attribute values statements with 1 – 5 points assigned for each statement. In cases where “0” points made sense because of the absence of an attribute, a “0” value was included in the list of statements. In one instance, potential contaminant threat (5C), negative values were also assigned for parcels with known contaminant threats. An example of the values statements is included below, and the full text of the attribute assessment model can be found in Appendix B.
Table 2. Attribute Assessment Model Example – Water Quality
5A Stratified Drift Aquifers – present or absent, low or medium transmissivity; based on NHDES aquifer map information
Point rank: Value Range 0 – 5 (0) No stratified drift aquifer present beneath the parcel (1) Stratified drift aquifer present, with undeterminable yield (2) Stratified drift aquifer present, of low yield and with fine-grained
materials present (3) Stratified drift aquifer present, of low yield and with fine-grained
over coarse-grained materials present (4) Stratified drift aquifer present, of low yield and with coarse-
grained materials present (5) Stratified drift aquifer present, of medium yield and with coarse-
grained materials present

Meredith NRI Project
Van de Poll / EMC Page 20 August 2005
FINDINGS
A) General Natural Resource Attributes of the Greater Meredith Area15 The Town of Meredith comprises about 35,026 acres,16 9290 acres of which (or 26.5%) is open water. There are 7 lakes in Meredith, all of which have been impounded to a limited degree. Only one, Lake Wicwas, is wholly contained within the Town boundaries. The 14,511-acre half-mile buffer area to Meredith also contains a lot of open water coverage, or about 39%. Most of the open water in this area is from two lakes, Lake Winnipesaukee and Lake Winnisquam. The 5546-acre upper Waukewan watershed outside of the Town of Meredith contains just over 5% open water, which reflects the upper watershed nature of this largely terrestrial land area. Lake Waukewan, Winona Lake, Hawkins Pond, and Bear and Otter Ponds are the principal open water areas of the upper Waukewan watershed. Besides the lakes and ponds of the greater Meredith study area, over 3,675 acres of wetlands (6.7% of the study area) were found to be present. Calculated without the acreage of lakes and ponds, this figure increases to 9.2% of the terrestrial landscape. If open water areas are added to wetland areas, the entire amount of water resources in the greater Meredith study area comprises 18,764 acres, or about 34.1% of the landscape. This is an impressive amount of surface water resources for a single area, and it is clearly a defining element of the character and uniqueness of the Lakes Region as a whole. Of the 23,491 acres (67.1%) in Meredith that is not open water or wetlands, approximately 87% (20,437 ac.) is forested with a mix of hardwoods and softwoods.17 The hemlock-beech-oak-pine forest is the most common cover type, and occupies the lower to mid slopes of hills and valleys between an elevation of 482 feet (the lowest elevation in Meredith at Lake Winnisquam), and about 1200 feet in elevation on Leavitt and Ladd Mountains. Above this, the northern hardwood forest predominates, with a mixture of maple, beech and birch, and an occasional spruce or balsam fir. The higher slopes of Leavitt Mountain, which is the highest point in Meredith at an elevation of 1414 feet, contain mixtures of spruce, hemlock, and northern hardwoods. These forest types are more common in the White Mountains and northern New Hampshire. On some of the sunnier, south-facing slopes of low hills and valleys, red and white oak are common. These tree species are common in forests with southern affinities, where well-drained soils and strong solar radiation favor drought-tolerant plants. Most of the forest types in Meredith are successional in nature. They represent second and third growth forests that have sprung up from former pasture, during a time when agricultural activities in the region were on the wane. The Erie Canal, the railroads, and
15 These findings reflect NRI information on all three study areas, namely, the Town of Meredith proper, the half-mile extended study area surrounding Meredith, and the upper Lake Waukewan watershed, which lies in 4 other towns to the north – Center Harbor, Holderness, Ashland and New Hampton. 16 The actual acreage of Meredith is derived from the revised town boundary as digitally supplied by the Meredith IT/GIS office in 2003. Note that this differs substantially from other town documents. 17 The amount of forest land was derived from 2003 lansat GIS data.

Meredith NRI Project
Van de Poll / EMC Page 21 August 2005
the Civil War brought about the demise of upland hill farming in central New England (Wessels 1997). Whereas much of Meredith was occupied by pasture and cropland in the mid-1800’s, by the turn of the 19th century the reverse was true. White pine and red oak forests were increasingly common and were the dominant woodland type that loggers began to harvest in the 1930’s and 1940’s. As a result of the hurricane of 1938 and the timber demand during World War II, most of the post-pasture forests were cut over at least once. Very few pockets of uncut timber remain in Meredith, although pockets of old growth hemlock and black gum can be found, such as at the Hamlin Recreation Area.
Since most of the upland portion of Meredith is forested, it follows that most of the wildlife resources in the Town prefer forested habitats. Deer, moose, bear, bobcat and coyote are among the largest of the mammals present in the region, and several large tracts of unbroken forest land remain as viable habitat for these species. Because of the numerous wetlands and large open water bodies, riparian and aquatic wildlife species are also quite common. Otter, mink, raccoon, red-spotted newt, spotted salamander, wood frog, northern water snake, and numerous fish species make their home in the freshwater systems of the area. Several great blue heron rookeries can be found near these systems, nesting loons are a feature in a few of the protected coves of Lake Winnipesaukee, and nesting ospreys have been recorded nearby. Waterfowl and other water-dependent bird species are abundant, especially in migration, and these groups of birds take advantage of the large open water areas that provide excellent feeding and stop-over opportunities. Since most of Meredith is comprised of a rural, post-agricultural landscape, the long-term effects of human habitation are widespread and common. Nearly all of the forests in Town contain evidence of former pasturage or cultivation, and the forest and wildlife species that have arisen all reflect adaptation to centuries of human disturbance. Whereas most of this has been fairly benign, an increasing amount of concern has been expressed about the fragmentation of open space and the loss of biodiversity. The following section provides a more detailed analysis of the quantity and quality of the natural resources in Meredith, and highlights where multiple natural resources of concern can be found.
Figure 10. Old growth hemlock (L) and black gum (R) in the Hamlin Town Forest. Meredith Conservation Commissioner and current Selectman, Peter Miller (R), was instrumental inhelping protect this exemplary stand of old trees for the Town.

Meredith NRI Project
Van de Poll / EMC Page 22 August 2005
B) Co-Occurrence Layers
The following section reviews the five primary natural resource areas that were studied as a part of this project: agricultural resources, forest resources, visual resources, water resources, and wildlife habitat. Each section begins with a map of the resource, and discusses the statistical data that were derived from the GIS map analysis. A general statement is made about the quality and threats to each resource area, although no specifics are given about particular locales. Most resource areas contain a single map and discussion, although water resources are broken into two maps, one that treats open water bodies and groundwater resources and another that treats wetlands. Wildlife habitat is also separated into two areas, upland wildlife and wetland wildlife habitat. A final co-occurrence areas map highlights the location of all of all pertinent natural resources that make up the seven natural resource overlay maps.
1) Agriculture A total of 608 acres of prime farmland soil is estimated for the Town of Meredith. These soils are deep, fairly stone free, and have loamy textures that make them perfect for growing crops. This resource is scattered across 23 units that range in size from 4.2 acres to 156 acres. These include soil series such as Becket, Marlow, Monadnock, Peru, and Skerry. An additional 7557 acres (21.5%) of Meredith are made up of soils of statewide or local importance. These include the above five soil series plus Adams series soils. Slight restrictions such as a hardpan layer, slope, or stoniness make these soils somewhat less productive for agriculture. According to the NRCS, they are still quite desirable for farming or forestry (USDA 1968). Intersecting these prime, statewide, and locally important farmland soils with areas where active agriculture is being practiced provides a sense of where the most valuable agricultural sites are in Meredith. At present, roughly 820 acres of land in Town (2.3%) are being actively managed for agricultural products. This includes hay fields, pasture land, row crops, Christmas tree plantations, and cover crops. This does not include sugar bushes or other forest-based production areas. Of this area, 538 acres (66% or 1.5% of Meredith) are located on prime, statewide or locally important soils. An approximate total of 337 tax parcels contain this acreage. The Town of Meredith has demonstrated its commitment to maintaining the long tradition of local agriculture by helping protect Moulton and Longridge Farms. Both of these areas contain prime farmland soils as well as soils of statewide and local importance. Whereas they represent less than one-third of the active agriculture on these soils types in Meredith, it would benefit the Town to identify other areas where such valuable resource could be protected in perpetuity through the purchase of development rights or other conservation tools.

Meredith NRI Project
Van de Poll / EMC Page 23 August 2005
2) Forest Resources Eighty-seven percent of the terrestrial landscape of Meredith is forested (20,437 ac.). This amount is roughly the same as the current statewide average, and reflects the preponderance of our climate and topography for growing trees. Approximately 20% of Town contains forests on good growing soils. These include areas of prime farmland soils and soils of statewide and local importance that are not being used for active agriculture. When a roadway buffer of 100 feet from the centerline of all public and private roads was put in place using the GIS mapping analysis program, the resultant acreage of good forest land was 4868 acres, or roughly 14% of Meredith. Approximately 640 parcels contained this good forest land area, or an average of 7 acres per parcel. In 2004, current use designated parcels included 58% of this good forest land area. The abundant forest resources in Meredith supplies local fuelwood and lumber needs, and provides excellent habitat for wildlife. New Hampshire was historically a timber-based economy, and although this has shifted due to an expansion of global markets and increased trade with Central and South America, the importance of the timber industry is quite evident when one considers the amount of building and development that is currently taking place in the region. Conserving good forest land requires knowing both the types of forests in Meredith as well as their condition. Satellite imagery taken in 1998 shows a predominantly mixed forest landscape in Meredith. Hemlock, pine, oak, and beech are common components of the lowland forest, especially in the low hills and valleys that surround the three largest lakes. Northern hardwoods of sugar maple, beech, and yellow birch are more common in the higher elevations, particularly on the upper slopes of Leavitt and Ladd Mountains in the western part of Town. Mixed oak forests are prevalent on sandy soils and south-facing slopes, although successive periods of timber harvesting have expanded the presence of oak in other forest types as well.
Figure 11. Low quality, young trees with little diversity is often the result of continuous high-grading over time. This forest will require another 50-60 years before it recovers enough to provide merchantable timber products.

Meredith NRI Project
Van de Poll / EMC Page 24 August 2005
Since the 1938 hurricane, the most significant non-development disturbance to Meredith’s forests has been timber management. Beginning in the 1940’s when demand for local wood products was very high, most of Meredith’s forest lands have undergone successive timber harvests by local or regional timber companies. The practice of “high-grading,” or taking out the best and leaving the rest, has been the most common form of harvesting. As a result, many of the wood lots in Town are of poor quality or contain trees that are too young to be of value as saw-log timber. Since the mid-1980’s, however, there has been an increasing amount of care taken in the selective removal of lower quality trees and the fostering of young vigorous stems. White pine forests that regenerated from the 1938 hurricane are becoming mature and are being thinned and conditioned for future saw-log potential. Red oak, one of the most valuable timber species in the Northeast, has been increasing in the understory partly as a result of active timber management. While the future of Meredith forests largely depends on the condition of global economies and the health of global ecosystems, it appears that in the immediate future there are ample timber supplies of low to medium-grade wood products. Meredith would do well, however, to consider the creation of forest reserves or forest land zones where long-term, conscientious stewardship of forest resources are emphasized. 3) Visual Resources
In 1999, Tom Kokx of Thomas Kokx Associates in Gilford was hired by the Meredith Planning Office to produce a summary report on the scenic quality of Meredith. This report was revised in 2000 to include a set of additional scenic view points that were considered “highly significant.” Whereas many of these view points were along roadsides that have been subsequently developed, the designation of a “critical viewshed area” (CVA) first introduced the idea of preserving areas of the Town where aesthetic features were dramatic. This NRI project, while it did not improve upon the scenic area study, utilized the results of the critical viewshed analysis in designating co-occurrence areas. The total area of the CVA in Meredith is 11,392 acres, or roughly 32% of Town. Six areas comprise the CVA, the largest of which is the Lake Waukewan – Meredith Bay region. Since one of the goals of this NRI was to evaluate areas where further landscape fragmentation could potentially alter the natural scenic quality of Meredith, a roadway buffer of 500 feet was applied to the CVA using GIS analysis tools. This resulted in a map showing 42 separate critical viewshed areas that are at least 500 feet from the nearest road. The total size of these 42 blocks is 4782 acres, the largest of which lies atop Leavitt and Ladd Mountains, the two most prominently visible landmarks in Meredith. The next largest block lies along Page Brook on Meredith Neck, and the third largest lies between Route 104 and Route 3 surrounding the upper headwaters of Reservoir Brook.

Meredith NRI Project
Van de Poll / EMC Page 25 August 2005
4) Water Resources
a) Groundwater Resources
An initial map of the groundwater resources of Meredith was created by compiling the USGS (1997) aquifer data and the NRCS (2003) sand & gravel soil data for the Town of Meredith. A total of 1,670 acres (28 units) mapped as low or medium-yield stratified drift aquifer was identified from the USGS aquifer map. Stratified drift, or deep, layered beds of water-sorted sands and gravels, and occasionally clayey silts, has the highest potential for supplying drinking water to residents in Town. Other sand and gravel areas, as identified from the NRCS soil map, totaled 323 acres, 75 acres of which lie outside of the areas marked as aquifers by the USGS. The largest aquifer in Meredith is found along Hawkins Brook. It is comprised of a 126-acre medium-yield (1000 – 2000 acre-feet per day) aquifer surrounded by a 314-acre low-yield (0 – 1000 acre-feet per day) aquifer. The only other medium-yield aquifer is along Bartlett Brook next to Lake Winnipesaukee at the north edge of Town. This 33-acre aquifer is surrounded by a 38-acre low-yield aquifer upstream. Like the Hawkins Brook aquifer complex, this aquifer area is characterized by a fairly high density of residential homes. The Hawkins Brook aquifer, however, also holds several commercial developments including gas stations and garages, restaurants, and the Town transfer station. Most of the other stratified drift aquifers in Meredith are low-yield aquifers along drainageways and near lakes or ponds. Both a 250-foot buffer area to lakes and a 100-foot buffer area to ponds and wetlands capture greater than 53% of the aquifer areas, yet only 63.4 acres (7%) of this area is on conservation land. The Town of Meredith is encouraged to more carefully review the current protection status of all aquifer areas, including significant bedrock aquifers, and promote sound conservation practices as well as designate potential drinking water protection areas.
b) Open Water Resources
Within the Town of Meredith, the total amount of open water in lakes and ponds is about 9290 acres. This includes twelve named water bodies, Lake Winnipesaukee (44,586 ac.), Lake Winnisquam (4264 ac.), Lake Waukewan (954 ac.), Lake Wicwas (334 ac.), Pemigewasset Lake (259 ac.), Pickerel Pond (80 ac.), Randlett Pond (32 ac.), Page Pond (30 ac.), Spectacle Pond (29 ac.), Forest Pond (19 ac.), Swain’s Pond (4 ac.) and Mud Pond (3 ac.). With the exception of Lake Wicwas, each of these water bodies contains acreage outside of Meredith. The most notable are Lake Winnipesaukee, of which only 16% of its waters are within Meredith, and Lake Waukewan, of which about 70% is contained within Meredith.

Meredith NRI Project
Van de Poll / EMC Page 26 August 2005
Meredith also has a number of smaller open water bodies that can be considered wetland ponds or woodland pools. Most of the larger of these are impounded either by beaver or by humans or both. In the one-acre and larger size class, there are 50 wetland water bodies with open surface water during most of the year, or about 210 acres.18 Of these, about 39 (59 ac.) are deep enough to support warmwater fish. In the one-acre and smaller size class, there are at least 43 wetland water bodies (9.2 ac.) with open surface water. Over 90% of these are excavated farm ponds. In addition, there are a number of small vernal and seasonal pools that are ephemerally inundated during the winter and spring months. Vernal pools, by definition, contain open water for approximately 2 months or more during the growing season at a sufficient depth to support certain species of breeding amphibians and invertebrates.19 They do not generally contain fish, yet are an excellent intermediate habitat for small to medium-sized mammals, reptiles, and amphibians. Seasonal pools, by contrast, do not contain “obligate” species of breeding amphibians, but do typically contain a number of invertebrate species that support lower food chain wildlife. Only a few of these water bodies were discernible through aerial photo interpretation, and the remainder (possibly 1000 more) require fieldwork in order to be mapped. Surface waters in Meredith that flow through an identifiable channel or bank include 13 named streams that have been designated by the Town as special aquatic resources, and 7 other perennial stream segments that are unnamed but are visible on the USGS topographic map of the Town. The 13 designated streams have a combined total length of 27.27 miles, and are summarized in the following table: Table 3. Designated Streams in Meredith Name Location Length (ft.) Length (miles) Bartlett Brook E edge of Town 10,009 1.90 Blake Brook W central 21,940 3.87 Collins Brook S central 5415 1.03 Dolloff Brook N central 14,108 2.67 Hatch Brook W of Lk. Waukewan 13,355 2.53 Hawkins Brook Along Rte 3 N 19,437 2.53 Hermit Brook SW edge of Town 10,837 2.05 Mead Brook Meredith Neck 4,640 .88 Merrill Brook W of Pemi. Lake 6,549 1.24
18 This figure for open water wetlands is based on the aerial photo interpretation of Meredith’s wetlands as described under Methods part A. It does not include the 12 lakes and ponds named above, but does include aquatic bed and unconsolidated (mud) bottoms in waterways dammed by beavers or humans or both. 19 Further information about vernal pools can be obtained by reading Identification and Documentation of Vernal Pools in New Hampshire edited by Anne Tappan and published by the N.H. Fish and Game Department (1997).

Meredith NRI Project
Van de Poll / EMC Page 27 August 2005
Mill Brook Meredith Center 6,675 1.26 Page Brook Meredith Neck 17,454 3.31 Reservoir Brook S of Lk. Waukewan 6,522 1.24 Stoney Brook W of Lk. Winnisquam 14,578 2.76 The approximate total length of the other 7 non-designated streams is 6.58 miles. These are located along the edge of Meredith in the western part (feeding Pemigewasset Lake, Hermit Lake and Spectacle Pond), near the Laconia town line (feeding into Lake Winnipesaukee), and on Meredith Neck. Their additional combined lengths increase the total mileage of perennial streams in Meredith to 33.85 miles. Since Meredith is comprised of relatively low elevation, hilly topography, and numerous lakes, the drainages that flow into the large water bodies are fairly short. For this reason, nearly all of the perennial streams in Meredith are first or second order streams.20 The only third order stream is Mill Brook below Lake Wicwas. It was quite logical that the original center of town (Meredith Center) surrounded a mill that was built on the largest stream in the municipality. The quality of open water resources in Meredith is fairly high. Long-term environmental monitoring of the major lakes and ponds has shown a consistently high quality in spite of previous impacts from water and air borne pollution. Lake Winnipesaukee has the highest amount of development on its shoreline, as well as the highest amount of use by boats, anglers, and other recreationists. For this reason, some of the water quality of Lake Winnipesaukee has been compromised, particularly in heavily used coves. Parts of the lake are rated as oligotrophic, that is, having low mineral enrichment and low amounts of human-caused nutrients. However, other parts, including Meredith Bay, are mesotrophic, and contain sufficient amounts of nutrients, siltation and sediments to have low water visibility. The following Water Resources and Water Supply Map shows open water areas in light blue, designated streams in dark blue, non-designated streams in dark pink, and aquifers as blue cross-hatched areas. Buffer areas are also indicated as described in the map legend. The map also depicts the USGS-derived wetlands (magenta lines), sand & gravel areas (red vertical bars), and sub-watershed boundaries (thin purple lines). Note that the latter extend beyond the greater Meredith study area.21
20 First order streams are headwater streams at the uppermost reaches of the watershed. When a first order stream joins another first order stream, it becomes a second order stream, and when two second order streams join together they become a third order stream, etc. 21 Sub-watershed lines were created for the 2002 Meredith Community Plan and were not field or map-checked by the author.

Meredith NRI Project
Van de Poll / EMC Page 28 August 2005
Since this study assessed water resources from a distance, an in-depth discussion of the various water quality parameters of the open water bodies in town is not warranted. However, some attention was paid to the Lake Waukewan watershed owing to its importance as a drinking water supply for the Town. The results of the assessment work on the natural resources of the Lake Waukewan watershed is discussed in section E of this report.
c) Wetland Resources Wetlands were the most intensively studied of all natural resources in Town. Previous work by the Town of Meredith as well as by various state and federal agencies was found to be inaccurate. Most notably, the National Wetlands Inventory or NWI, the sole federal agency whose job it is to map and classify wetlands of the United States, was the source of maps that contained numerous discrepancies with the hydric soil maps provided by the (then) Soil Conservation Service or SCS. A review of the updated SCS (now Natural Resource Conservation Service or NRCS) soil maps of Meredith illustrates this discrepancy quite well.
Figure 12. Aerial photo of lower Lake Waukewan area with hydric soils shown in pink, National Wetlands Inventory wetlands shown in green, and mapped prime wetlands (Keith 1983) shown in blue. Note the much greater extent of the hydric soil units.
In general, hydric soil mapping shows a much larger area of wetland than any other data source, and NWI wetland maps show a much smaller area of wetlands (Van de Poll 1994). In studying the 1998 digital aerial photographs, it was evident that the actual wetland acreage fell somewhere in between. NRCS soil mapping showed a total of 2870 acres and NWI showed a total of

Meredith NRI Project
Van de Poll / EMC Page 29 August 2005
1383 acres of wetlands in Meredith, exclusive of the 12 open water lakes and ponds. After the aerial photo interpretation (API) was completed, a total of 2089 acres was tallied for wetlands over 1 acre in size, and 156 acres was tallied for wetlands under 1 acre in size. This does not include about 10 created ponds that were mapped and which totaled less than .5 acres overall. It should be noted that the total number of wetland units that were mapped through API (1203) more than doubled the amount of wetland units that were mapped by NWI (474). Since each wetland map unit is equal to one wetland class and since many wetlands are made up of more than one wetland class, the number of wetland units does not accurately reflect the number of wetlands in Meredith.
Figure 13. Aerial photo of lower Lake Waukewan area showing API-mapped wetlands according to their wetland class. Light green and blue-green areas are different types of forested wetlands, pink areas are scrub-shrub swamps, and yellow areas are emergent wetlands and blue areas are dammed ponds.
The actual number of wetlands in Meredith is estimated at 845, with greater than 50% of these occurring as single unit wetlands, that is, comprised of a single wetland cover class. The wetland class system of the NWI was used in the mapping work, a copy of which is included in Appendix C. This system is based on five basic types or systems, three of which are present in Meredith: palustrine (non-tidal freshwater wetlands), riverine (wetlands associated with rivers and streams), and lacustrine (wetlands associated with lakes and ponds). The most common sub-types included the palustrine forested wetland class (PFO), the palustrine scrub-shrub wetland class (PSS), and the palustrine emergent wetland class (PEM). Scattered, shallow open water bodies including named and unnamed ponds were also fairly frequent and were designated as palustrine unconsolidated bottom wetlands (PUB).
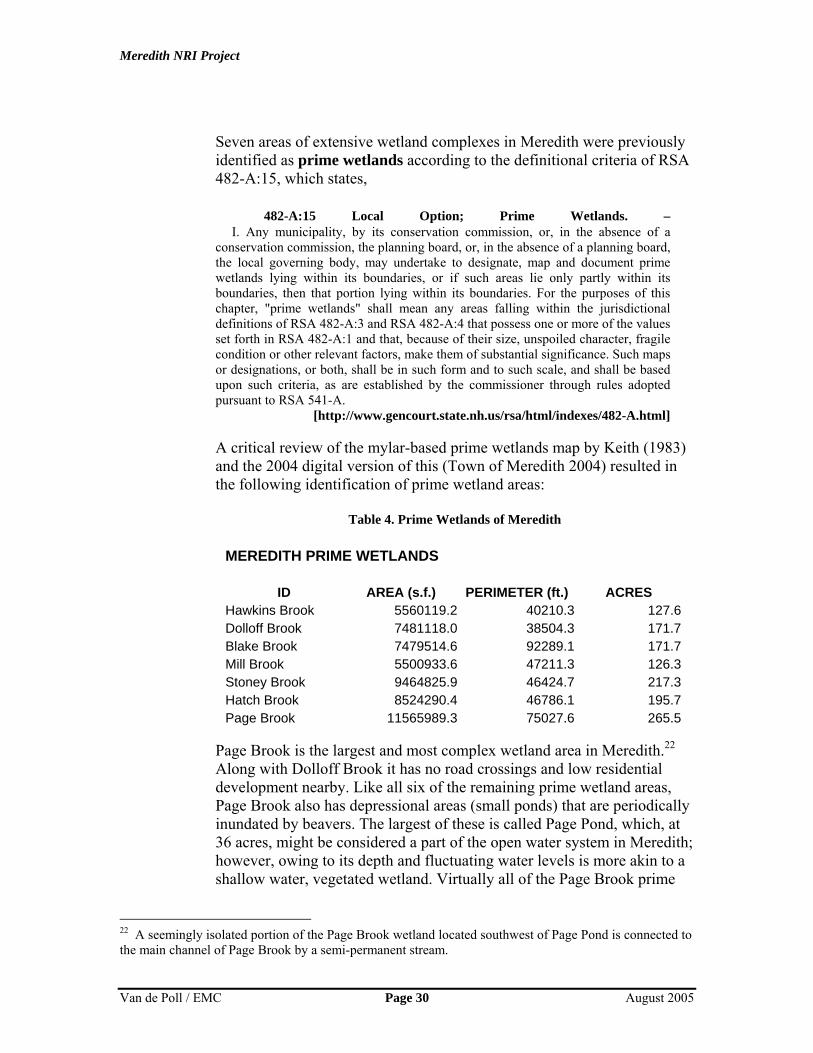
Meredith NRI Project
Van de Poll / EMC Page 30 August 2005
Seven areas of extensive wetland complexes in Meredith were previously identified as prime wetlands according to the definitional criteria of RSA 482-A:15, which states, 482-A:15 Local Option; Prime Wetlands. – I. Any municipality, by its conservation commission, or, in the absence of a conservation commission, the planning board, or, in the absence of a planning board, the local governing body, may undertake to designate, map and document prime wetlands lying within its boundaries, or if such areas lie only partly within its boundaries, then that portion lying within its boundaries. For the purposes of this chapter, "prime wetlands" shall mean any areas falling within the jurisdictional definitions of RSA 482-A:3 and RSA 482-A:4 that possess one or more of the values set forth in RSA 482-A:1 and that, because of their size, unspoiled character, fragile condition or other relevant factors, make them of substantial significance. Such maps or designations, or both, shall be in such form and to such scale, and shall be based upon such criteria, as are established by the commissioner through rules adopted pursuant to RSA 541-A. [http://www.gencourt.state.nh.us/rsa/html/indexes/482-A.html] A critical review of the mylar-based prime wetlands map by Keith (1983) and the 2004 digital version of this (Town of Meredith 2004) resulted in the following identification of prime wetland areas:
Table 4. Prime Wetlands of Meredith
MEREDITH PRIME WETLANDS
ID AREA (s.f.) PERIMETER (ft.) ACRES Hawkins Brook 5560119.2 40210.3 127.6Dolloff Brook 7481118.0 38504.3 171.7Blake Brook 7479514.6 92289.1 171.7Mill Brook 5500933.6 47211.3 126.3Stoney Brook 9464825.9 46424.7 217.3Hatch Brook 8524290.4 46786.1 195.7Page Brook 11565989.3 75027.6 265.5
Page Brook is the largest and most complex wetland area in Meredith.22 Along with Dolloff Brook it has no road crossings and low residential development nearby. Like all six of the remaining prime wetland areas, Page Brook also has depressional areas (small ponds) that are periodically inundated by beavers. The largest of these is called Page Pond, which, at 36 acres, might be considered a part of the open water system in Meredith; however, owing to its depth and fluctuating water levels is more akin to a shallow water, vegetated wetland. Virtually all of the Page Brook prime
22 A seemingly isolated portion of the Page Brook wetland located southwest of Page Pond is connected to the main channel of Page Brook by a semi-permanent stream.

Meredith NRI Project
Van de Poll / EMC Page 31 August 2005
wetland is valuable as wildlife habitat that in the absence of nearby development has very high value. Moving to the west, Hawkins Brook is the narrowest and most impacted prime wetland in Meredith. Its course roughly follows Route 3 north of its intersection with Route 25, and it includes the heavily developed areas surrounding downtown. Hawkins Brook has the highest number of road crossings and historic wetland fills, and would rank the lowest for wetland wildlife and ecological integrity if assessed for wetland function.23 It offers critical pollution abatement and sediment deposition functions, however, and provides an aesthetic backdrop to an otherwise highly developed commercial-industrial zone along Route 3. Coincidentally, it also overlies the largest and highest-yield aquifer in Meredith.
Figure 14. Prime wetlands provide valuable and essential services to the community, such as clean drinking water, sediment and toxicant removal, floodwater storage, wildlife habitat, and visual & aesthetic resources. Hatch Brook lies between Winona Road and Hatch Corner Road and includes a historically dammed beaver flowage that drains southerly into Mill Brook on the south side of Route 104. It is the largest open wetland complex that is visible from Route 104 in Meredith, and was one of the first prime wetlands to be nominated owing to its superb wildlife habitat for migratory waterfowl. Since Route 104 crosses the southern ‘fingers’ of this wetland complex, there is some concern relative to salt and other road-related pollution. Most of the upper portion of this wetland is protected by a conservation easement.
23 Wetland wildlife and ecological integrity are two of the common functions associated with wetlands, and are described in Method for the Comparative Evaluation of Non-tidal Wetlands in New Hampshire (1991), a cooperative publication between the USDA, Audubon Society of New Hampshire and the NH Department of Environmental Services.

Meredith NRI Project
Van de Poll / EMC Page 32 August 2005
Dolloff Brook includes a first order stream that descends from Dolloff Hill in New Hampton, is joined by an outflow stream from Forest Pond, and flows into Lake Wicwas as its largest tributary. It also contains open beaver meadows that are suitable for waterfowl nesting and stop-over habitat. No roads cross the prime wetlands area as designated, although two dirt roads intersect small adjacent wetlands on the north and west sides. Dolloff Brook itself passes under Route 104 before entering Lake Wicwas, and therefore carries some risk of transporting roadside pollutants into the lake.24 No portions of the Dolloff Brook prime wetland are currently under any conservation restriction. Blake Brook forms a highly irregular wetland complex west of Dolloff Brook on both sides of Route 104. It includes much of the watershed divide area between Lake Wicwas and Pemigewasset Lake. After Page Brook, this prime wetland contains the highest number of individual wetland units of any wetland complex in Meredith, most of which are forested wetlands with a softwood canopy. This wetland cover type provides excellent deer wintering habitat, and the portion of the prime wetland along the west shores of Lake Wicwas has the potential to contain the largest wintering deer yard in Meredith. Blake Brook has over 12 road crossings and is severely affected by road-related pollution associated with Route 104. The only protected area in this prime wetland area is a thin sliver of land within the Hamlin Recreation Area near the shores of Lake Wicwas. The Mill Brook prime wetlands complex includes three fairly large beaver meadows on either side of Mill Brook near Meredith Center. The Meredith Center Road is the only major roadway that crosses this wetland, yet several historic alterations to the wetland took place during the height of agricultural and silvicultural activity in Meredith Center in the early 19th century. Several old dams are still visible along the main course of Mill Brook, and some of the wetland areas were impounded as mill ponds for this purpose. Most of the forested wetland areas represent second and third growth timber, and certain areas were previously drained to convert the land to agriculture. A 25-acre portion of the largest of these forested wetlands is under a conservation restriction along Chemung Road. Stoney Brook is the second largest prime wetland in Meredith and is named for the stream that flows from Mud Pond (south of Lake Wicwas) to Lake Winnisquam through Chemung State Forest. It contains a very visible wetland resource that has become well known as the place to see great blue herons nesting. Most of the Stoney Brook wetland lies along the edge of Chemung Road, although Tucker Mountain Road and Weed Road cross portions of it as well. This wetland is also highly valued for wildlife
24 The sediment fan (delta) that exists where the brook discharges into the lake continues to expand. Every year the area of emergent vegetation associated with this sediment delta gets larger and larger.

Meredith NRI Project
Van de Poll / EMC Page 33 August 2005
as it includes the aforementioned heron rookery, a mix of coniferous and deciduous forests suitable for wintering deer, and excellent stream habitat for brook trout. Limited pollution concerns arise from adjacent roadways and residential development. Chemung State Forest protects nearly two-thirds of this wetland area.
Figure 15. Wetland map of the upper part of the Lake Waukewan watershed. Red lines are municipal boundaries. The pink line is the half-mile extended study area. A total of 191 wetland and deepwater units were identified and mapped in the upper watershed portion of the Lake Waukewan watershed.25 This included the 153-acre Winona Lake, the 85-acre Hawkins Pond, the 25-acre Snake River flowage, the 15-acre Otter Pond, the 13-acre Bear Pond, and the 14 acres of Lake Waukewan within this study area. The non-open water portions of this wetland area equaled 378 acres (185), with a mean size of 2 acres. Over three-quarters of these wetlands drain into Winona Lake or the Snake River. Most are forested and several apparently isolated wetlands occur at upper elevations in the watershed. Roads cross these wetlands 25 times and present some concern for water pollution, although road use and other development-associated impacts are limited. On the whole, these wetlands offer critical water quality regulating functions to the drinking water supply of Lake Waukewan, as discussed more fully in section C below.
25 The upper Lake Waukewan watershed study area included everything outside of the half-mile extended study area of Meredith. The 191 wetland units made up roughly 110 individual wetlands.

Meredith NRI Project
Van de Poll / EMC Page 34 August 2005
Within the half-mile extended study area outside of Meredith proper, a total of 343 wetland and deepwater units were recognized and mapped with a total acreage of 6255.2 acres [See wetland resource map on page 34]. Nine of these wetland units included lacustrine (lake) water bodies, which on their own comprised 5582 acres. The remaining palustrine wetlands (334) equaled 673.2 acres and averaged 2 acres in size. Many of these were connected to wetlands within Meredith proper, as well as to the wetlands in the upper section of the Lake Waukewan watershed as described above. An additional 56 acres of wetlands were mapped outside of this study area in cases where contiguous wetlands crossed the study area boundary. The most significant wetlands that were mapped as a part of this study area included the aforementioned lakes, the wetland units associated with Meredith prime wetland areas, and those wetlands upslope of Hermit Lake located in Sanbornton. A large number of wetlands units were also mapped in the Chemung area of Sanbornton and along Hawkins Brook in Center Harbor, although most of these were less than 5 acres in size.
Figure 16. Hermit Lake, Sanbornton, showing API-mapped wetlands within half-mile extended study area of Meredith. (Town line in red; half-mile extended study area in pink) Note Interstate 93 in southwest part of picture.

Meredith NRI Project
Van de Poll / EMC Page 35 August 2005
5) Wildlife Resources
a) Upland Wildlife Three types of upland wildlife habitat were assessed within the Meredith study area: the 75-foot ecotone26 between forest and field, steep slopes above 1200 feet in elevation, and potential deer wintering areas. These three types of upland wildlife habitat were selected because of the availability of GIS data that could portray where these habitats likely exist on the ground. A large number of other upland habitat types were considered, such as high-yield oak and beech mast (nut) areas, talus slopes, exposed ledges and low summits, and old growth forests, although none of these could be accurately portrayed on a map without doing extensive fieldwork. Selected upland wildlife habitat areas that have been subject to field review by the author, however, such as the Hamlin Recreation Area, the Eames property, Hatch Corners, and Moulton Farm, were considered in the overall review of upland wildlife habitat potential. The 75-foot buffer area around active agricultural areas was selected because of the known value to wildlife of this type of ecotone (Fuller & Mosher 1981; Harris 1984; DeGraaf et al. 1992; Kanter et al. 2001)27. Since active agricultural areas had been updated as a part of the overall update of GIS data, this assessment was easy to complete. The additional variable of a 500-foot setback from all Town roads was also included in order to estimate the location of the best habitat that was available for upland wildlife. The result of this intersection was the identification of 215.9 acres (54) of this type of habitat, or .62% of the Town. Sizes of these units varied from less than a quarter acre to over 9 acres in size. The latter was equivalent to roughly one half mile of field edge.
Figure 17. Upland wildlife habitat in Meredith in an unfragmented landscape.
26 An ecotone is defined as the transitional area between two discrete ecological areas, such as the transition between upland and open water, between the open sea and dry land, and between a farm field and forest. The latter example was used in this study for the purposes of assessing upland wildlife habitat. 27 A buffer zone of 75 feet was chosen as a standard owing to the high concentration of upland wildlife species that tend to occupy this area. 75 feet roughly approximates the length of a single tree at the forest’s edge and this 150-foot zone has been shown to be significant for (mostly) vertebrate wildlife.

Meredith NRI Project
Van de Poll / EMC Page 36 August 2005
The second upland wildlife habitat type that was portrayed on the wildlife habitat maps was steep (i.e. > 25%) slopes above 1200 feet in elevation. This was selected due to the fact that certain species of vertebrate wildlife, notably mammals, prefer these sites for resting or feeding during different seasons. Bobcats, deer, and porcupines, for example, will optimize these areas during the winter months, both for solar gain and for feeding purposes. Steep slopes have a greater likelihood that talus boulders or ledges will be associated with them, and these types of habitats are perfect for den sites or resting areas. The same can be said for steep north-facing slopes during the summer months, where different types of browse are available for bears, snowshoe hare, and flying squirrels. At 1200 feet in elevation in Meredith there is a fairly predictable shift from lower elevation hemlock-beech-oak-pine woods to mid and upper elevation northern hardwoods (i.e. beech-birch-maple) (Sperduto and Nichols 2004). This shift also represents an ecotone of sorts where vertebrate wildlife that prefer lower elevation woods overlap with those that prefer higher elevation woods. Since the highest elevation in Meredith is 1414 feet on Leavitt Mountain, there was no need to segregate elevation and steep slopes any further. An approximate total of 336 acres of Meredith lies above 1200 feet in elevation. Four hills or ridge tops comprise this total, with the largest area atop Leavitt Mountain (251 acres). The unvalidated NRCS soils map indicate that 91 soil units exceed 25% slopes, with most of these in the Chemung district along the Ladd-Leavitt Mountain Ridge or along the high ground between Pemigewasset Lake and Lake Wicwas. The intersection of both variables resulted in six areas above 1200 feet in elevation with slopes > 25%, or 134.8 acres. All but .4 acres are greater than 500 feet from Town roads, and therefore roughly .4% of the Town of Meredith is represented by this high quality upland wildlife habitat. The third upland wildlife habitat assessment looked at wintering deer habitat. “Deer yard” maps produced by the New Hampshire Fish & Game Department were intersected with lansat-based softwood cover in Meredith, and then intersected with lands outside of the 500-foot roadway buffer. As stated above, no attempt was made to correct or otherwise improve the NH Fish & Game maps, and so the resultant coverage reflects the errors associated with their mapping system. A similar degree of error was estimated for the satellite-based softwood cover map, and so the final deer wintering area map should be viewed with some caution. For example, the second largest deer wintering area was indicated for Bear Island in Lake Winnipesaukee. The utility of this area for wintering deer is largely dependent on winter ice and snow depth, and is it is suspected that it is not sufficient for wintering deer during most years. The largest area, as mentioned above, is just west of Lake Wicwas within the Hamlin Recreation Area. This site actually does contain excellent field evidence of wintering deer, as noted in a rapid ecological assessment completed by the author in September 2002. Overall, 940 acres of good deer wintering habitat exists in Meredith according to these data, or roughly 2.8% of the total Town area. This preliminary estimate of deer wintering habitat should be compared with wetland wildlife habitat area created during the wetland wildlife habitat assessment step described below.

Meredith NRI Project
Van de Poll / EMC Page 37 August 2005
b) Wetland Wildlife An improved and accurate estimation of wetland wildlife habitat was effected by delineating water bodies and wetlands through aerial photograph interpretation (API), especially in the areas that include a buffer to these water resources. The aquatic wildlife analysis step, which included an assessment of habitat for certain salamanders, frogs, toads, snakes, turtles, fish, birds, and mammals, was derived from the delineation of shorelines and an estimation of bathymetry as described on page 13. For the 6 lakes and ponds with bathymetry maps, the aquatic wildlife habitat portion was estimated as all open waters to a depth of 15 feet. For 5 other ponds with shallow water, the entire area of open water was deemed suitable for aquatic wildlife. For Lake Winnipesaukee, which has not been sounded or mapped for depth by the State, an estimation of a 50-foot width from the shoreline was used. These 12 aquatic wildlife habitat areas in Meredith was estimated to be 1237.8 acres in size, or 10.73% of the twelve lakes and ponds described on page 28. This does not include several shallow water wetlands in Meredith, which added another 100.5 acres of aquatic wildlife habitat to the total area.
Figure 18. Sample bathymetry base map used to estimate aquatic wildlife habitat
For streams, wetland wildlife associated with riparian areas was calculated by establishing a 200-foot buffer from the centerline of all designated and non-designated streams in Meredith (17). The 200-foot buffer follows provisional guidance from a report to the Massachusetts Natural Heritage and Endangered Species Advisory Committee, which supports an enlarged buffer area to protect wetland wildlife (Boyd 2001). The total area of the 200-foot buffer zone of all perennial streams in Meredith equaled 1332.9 acres with an average of 78.4 acres per stream. This buffer zone was then added to the aquatic wildlife habitat area as a second contribution to the wetland wildlife habitat overlay.

Meredith NRI Project
Van de Poll / EMC Page 38 August 2005
On the upland side of shorelines a 250-foot buffer was mapped and analyzed in order to reflect the greater attraction of lakes and large ponds to wildlife species that depend upon them for part of their critical food, shelter and reproductive needs. This would include habitat for beaver, mink, otter, moose, deer, bear, raccoon, long-tailed weasel, bald eagle, osprey, great horned owl, northern water snakes, toads, frogs, clubtail dragonflies and a host of other vertebrates and invertebrates. The 250-foot distance also conforms to that area treated by the Comprehensive Shoreland Protection Act under the provisions of RSA 483-B. The total area encompassed by the 250-foot setback to Meredith’s 12 lakes and ponds was 1872 acres among 70 separate units. Most of the latter included islands within the lakes and ponds that represent unique and exceptional habitat for wetland-dependent wildlife. This area was also added to the overall wetland wildlife habitat overlay, although many of these buffer areas overlapped with riparian buffers where streams entered or exited the lakes and ponds.
The third and final contribution to the wetland wildlife habitat overlay was the 200-foot buffer to wetlands. This included a 200-foot zone to all palustrine wetlands, since both riverine and lacustrine wetlands were covered in the two previous buffer areas. This zone was drawn around all API-derived wetlands in Meredith, and resulted in a total buffer area of 4603 acres. When added to the area of the above three habitat types, the total wetland wildlife habitat acreage equaled 8143 acres. This includes roughly 902 acres where shoreline, stream and wetland setbacks overlapped. Total optimal wetland wildlife habitat in Meredith equals approximately 23% of the entire Town.
Figure 19. Wetlands provide some of the richest habitat for wildlife in any given locale. Unusual wetland types like the old growth vernal pool below in the Hamlin Recreation Area, or the slow-moving Snake River on the right provideessential food, shelter, and reproduction needs for a wide variety of invertebrate and vertebrate animals.

Meredith NRI Project
Van de Poll / EMC Page 39 August 2005
C) Improved Digital Tax Maps The Meredith IT/GIS Coordinator completed the editing and updating of all tax parcel information in Meredith. This was a monumental job that allowed for a smooth transition between mapping natural resource overlays and plotting them on a parcel map of Town. Over 5500 parcels with a mean size of roughly 6 acres were hand-digitized using Auto Cad Map software. The corrected parcel alignments used API and global positioning satellite (GPS) data in crafting a final GIS map. They also followed the shoreline map data completed for this NRI, and will be indispensable in working the Attribute Assessment Model described in Section F. At present, the digital tax map of Meredith is a seamless product, however the inaccuracies that was latent in the composite of the original tax maps should be kept in mind.28 Please refer to the Disclaimer on page 6.
D) Co-Occurrence Area Map The map on the following page represents an aggregate of all of the salient natural resource attributes in Meredith as described in the seven co-occurrence layers above. In drafting a final co-occurrence map every contributing overlay was given equal weight, and therefore the NRI attribute representations in the map show equal gradients of color. This can easily be manipulated during future analyses when conservation planners wish to emphasize one set of attributes over another. Since one of the main objectives of this project was to discover where a large number of natural resource attributes overlap, each of the 19 overlays were assigned a single weight and included in the final map. The resulting depiction shows high concentrations of significant natural resources that are generally centered around the prime wetland areas in Town. An inclusive polygon line was drawn around each one in order to illustrate each zone more clearly. This resulted in the following list of high-value co-occurrence areas in Meredith:
Table 5. High-Value Co-Occurrence Areas in Meredith
ID NAME ACRES 1 Hawkins Brook 554.2 2 Bartlett Brook 95.8 3 Page Brook / Page Pond 664.4 4 Hatch Brook 457.8 5 Forest Pd/Dolloff Brook 479.0 6 Blake Brook/Wicwas 831.9 7 Meredith Center / Chemung 1190.3 8 Spectacle Pond 85.9 9 Leavitt Mtn 380.4 10 Pemigewasset Lake 447.3
28 It should be noted that very few of the tax map parcels were adapted from subdivision plats or from ground surveys, and therefore much of the same inaccuracies that were latent in the original mylars created by John E. O’Donnell and Associates were transferred to the new map. Whereas this has presented some limitations in the map analysis of parcels that contain certain NRI attributes, corrections to the digital version will be much easier to accomplish once proper parcel information is available.

Mer
edith
NR
I Pro
ject
Van
de
Poll
/ EM
C
Pag
e 40
A
ugus
t 200
5
TA
BL
E 6
.
C
O-O
CC
UR
RE
NC
E A
RE
A A
TT
RIB
UT
ES
IN M
ER
ED
ITH
LA
YE
R
LA
YE
R
PT
TO
TA
L
PER
CE
NT
TO
TA
L
TO
TA
L #
M
INM
AX
M
EA
NT
YPE
VA
LU
EA
RE
A (a
c) o
f TO
WN
# U
NIT
S PA
RC
EL
SSI
ZE
SIZ
E
SIZ
E
AG
Pr
ime
Farm
land
-Soi
ls o
f Loc
al Im
porta
nce-
Act
ive
Ope
n A
gric
. Lan
d1
537.
5 1.
5314
0 33
7 0.
0027
.52
3.84
FOR
EST
Exis
ting
Fore
st L
and-
Unf
ragm
ente
d/10
0-fo
ot-G
ood
Fore
stla
nd S
oils
1
4868
.33
13.9
38
639
0.00
131.
347.
09V
ISU
AL
Crit
ical
Vie
wsh
ed A
reas
-Unf
ragm
ente
d La
nds (
500-
ft bu
ffer
) 1
4835
.5
13.8
132
47
2 0.
0015
5.10
10.0
5W
ATE
R
Ope
n W
ater
Are
as U
nder
Priv
ate
Ow
ners
hip
1 66
.67
0.19
2 10
0.
0032
.16
6.67
WA
TER
25
0-ft
Buf
fer o
f Ope
n W
ater
Are
as U
nder
Pub
lic O
wne
rshi
p.
1 20
35.7
5 5.
8110
21
94
0.00
65.3
80.
93W
ATE
R
All
Pere
nnia
l Stre
am C
orrid
ors (
10 fe
et fr
om c
ente
rline
) 1
66.1
2 0.
1917
24
2 0.
003.
290.
27W
ATE
R
All
Pere
nnia
l Stre
am C
orrid
ors (
200
feet
from
cen
terli
ne)
1 13
43.4
8 3.
8417
49
2 0.
0151
.51
2.73
WA
TER
A
quife
rs -
all
1 16
60.8
2 4.
7419
11
20
0.00
63.5
71.
48W
ATE
R
Aqu
ifers
- m
ediu
m y
ield
1
158.
57
0.45
2 22
7 0.
0011
.17
0.70
WET
LAN
DS
Mer
edith
API
wet
land
s 1
2242
.73
6.4
860
1842
0.
0512
2.60
1.24
WET
LAN
DS
Prim
e W
etla
nds
1 12
75.9
3.
647
949
0.00
217.
3018
2.30
WET
LAN
DS
Wet
land
buf
fer z
one
(100
feet
) to
all A
PI w
etla
nds
1 37
85.6
10
.81
320
3014
0.
0010
1.16
1.25
WIL
DLI
FE U
plan
d W
ildlif
e H
abita
t: A
ctiv
e A
g La
nd (7
5-ft
Buf
fer)
- U
nfra
g La
nd1
215.
9 0.
6254
14
4 0.
009.
041.
50W
ILD
LIFE
Upl
and
Wild
life
Hab
itat:
Stee
p sl
opes
-unf
ragm
ente
d la
nd-1
200
ft+
1 12
3.8
0.35
3 12
0.
0044
.90
10.3
0W
ILD
LIFE
Upl
and
Wild
life
Hab
itat:
Softw
oods
, Dee
r Yar
ds, U
nfra
gmen
ted
1 10
06.6
2.
8735
22
2 0.
0049
.90
1.25
WIL
DLI
FE W
etla
nd W
ildlif
e H
abita
t: R
ipar
ian
Zone
(200
-foo
t buf
fer)
1
1332
.9
3.81
17
492
22.8
616
9.90
78.4
1W
ILD
LIFE
Wet
land
Wild
life
Hab
itat:
Wet
land
Buf
fers
(200
feet
) 1
4603
.1
13.1
432
0 16
74
2.55
690.
267.
06W
ILD
LIFE
Wet
land
Wild
life
Hab
itat:
Lake
shor
e B
uffe
rs (2
50 fe
et)
1 18
72.5
5.
3595
21
57
0.01
650.
5726
.74
WIL
DLI
FE W
etla
nd W
ildlif
e H
abita
t: A
quat
ic B
uffe
rs -
15-f
oot B
athy
met
ry
1 12
37.8
3.
5312
90
5 4.
5037
5.78
103.
15
A
LL
Inte
rsec
tion
of a
ll C
o-O
ccur
renc
e A
rea
Type
s
4836
.55
13.8
110
89
5 85
.90
956.
5048
3.66

Meredith NRI Project
Van de Poll / EMC Page 41 August 2005
The previous page illustrates the 19 attribute layers that went into the final co-occurrence overlay. It lists the layer type: (AG) Agriculture; (FOREST) Forest Resources; (VISUAL) Visual Resources; (WATER) Surface Water Resources; (WETLANDS) Wetland Resources; (WILDLIFE) Upland and Wetland Wildlife Habitat; and (ALL), which is a representation of all attributes as shown on the map on page 47. The layer is described in the “Layer” column, and each contributing overlay refers to the GIS shapefiles as listed in Appendix A. As described above, each of the contributing layers was assigned a point value of “1,” and therefore has equal weight in the map depicted on page 44. The total area in acres is listed next, which indicates the GIS-derived total size of the various land areas associated with each attribute. Since the final intersection map includes all 19 attributes, some of which overlap with several others, the total area of “ ALL” is considerably less than the sum of all 19 individual attributes. The column following the total area column gives the percentage of each attribute layer relative to the entire acreage in Meredith (35,026 acres). The following column gives the total number of units that comprise each attribute layer. The 2004 digital parcel map was used to derive the total number of parcels that contain all or part of each attribute, which in some cases (e.g. 250-foot buffer area to open water under public ownership) is quite large (2194). It should be noted that the number of parcels that were estimated to contain each attribute will vary when final parcel alignments take place using field-based surveys. The final three columns give the minimum, maximum, and mean size of the attribute units and not the min-max-mean sizes of the parcels that contain them. Whereas a detailed description of each of the10 final co-occurrence areas is beyond the scope of this work, a tabular summary is in order. The following table summarizes the salient attributes of each area and utilizes the order listed above in Table 5. Table 7. Attributes of 10 High-value Co-Occurrence Areas in Meredith
Unit # Name Size (ac.) Salient Attributes
1 Hawkins Brook 554.2 Medium yield aquifer; prime wetland; excellent water quality mitigation potential; highly visible landscape
2 Bartlett Brook 95.8 Low yield aquifer; wetland complex directly feeds Lake Winnipesaukee; agric. nutrient attenuation
3 Page Bk / Page Pond 664.4 Very high wildlife habitat value; prime wetland; most diverse wetland complex; low population density
4 Hatch Brook 457.8 Excellent wildlife habitat; prime wetlands; excellent deer wintering potential; low density development
5 Forest Pd/Dolloff Bk 479.0 Excellent waterfowl habitat; prime wetland; primary water supply for Lake Wicwas
6 Blake Brook/Wicwas 715.2 Best vernal pool habitat in Meredith; prime wetland; largest deer wintering area; roadside pollution abatement
7 Meredith Ctr/Chemung 956.5 Several unique wildlife features; 2 prime wetlands; shoreline and aquifer areas; best recreation potential
8 Spectacle Pond 85.9 Largest sand & gravel deposit & aquifer area; good wildlife habitat corridor

Meredith NRI Project
Van de Poll / EMC Page 42 August 2005
9 Leavitt Mtn 380.4 Highest elevation in Meredith; unique forest types & wildlife habitat; most visible landmark in Town
10 Pemigewasset Lake 447.3 Excellent aquatic wildlife habitat; high recreational use area; Drains into to Pemigewasset River
E) Lake Waukewan Watershed The following section was originally written for the Lake Waukewan Watershed Advisory Committee as a part of their preparation for the watershed-wide management plan that was finished in 2005. It was requested that this section be included in this report since Lake Waukewan provides critical drinking water supplies to the Town of Meredith, and the natural resource attributes that lie upstream of the lake factor greatly into the quality and quantity of water that the lake is supplied with. This section was written in December 2004, and was reviewed by the Meredith Town Planning Office and members of the Waukewan Watershed Advisory Committee.
I. Overview At 8275 acres, the Lake Waukewan watershed is a medium-sized drainage basin in the upper Winnipesaukee Hydrological Unit (HUC # 100107000201) in central New Hampshire. It includes parts of Meredith (2729.5 acres), Center Harbor (2370.2 acres), New Hampton, (1949.0 acres) Ashland (699.2 acres), and Holderness (527.3 acres). Elevations range between 1500 feet on Beech Hill near Sky Pond in New Hampton, to 540 feet at the outflow point in Meredith. The watershed is mostly undeveloped and forested, although a number of residences are found along the shores of the 5 lakes and ponds that are within the watershed. Lake Waukewan, the most prominent open water body, is approximately 953 acres in size. It lies at the bottom of the watershed and supplies Meredith with roughly 40% of its public drinking water supply.
II. Principal Natural Resource Features Lake Waukewan is the largest and most significant natural resource feature of the watershed. With roughly 11 miles of shoreline, it supports between 150 and 200 residences and camps. Water-skiing, boating, fishing, swimming, and other water-based recreational activities are prevalent year-round, and the heaviest use of the lake occurs during the summer months. The earliest camps were established in the mid-1700’s, and by the early 1800’s a dam was erected that regulated the level of the lake as well as the flow of water through several canals that powered mills in the present downtown area of Meredith. All five of the lakes and ponds in the watershed have dam control structures at their outlets, and all were likely used at various times for storing logs for timber production or storing water for downstream mills. With the exception of Otter Pond, the other four water bodies represent a chain of lakes and ponds along the main watercourse above Lake Waukewan.

Meredith NRI Project
Van de Poll / EMC Page 43 August 2005
Nine well-formed stream channels totaling 8.2 miles in length can be found within the watershed.29 Two of these are second order perennial streams and the remainder are first order streams that vary in type from mostly perennial to mostly intermittent. The largest stream is known as the Snake River, which runs from Winona Lake to Lake Waukewan. It has considerable width and several well-developed, beaver-mediated wetlands along it. Three other brooks are found above Winona Lake, the smallest arising to the southwest of the lake, one arising to the northwest, and the third passing through Bear and Hawkins Ponds to the northeast of the lake. The remaining 5 streams all feed directly into Lake Waukewan, including the longest, Reservoir Brook in Meredith, and Saywood Brook in New Hampton. The other three unnamed streams are mostly intermittent and contribute very little to the lake in terms of year-round flow. One flows out of Otter Pond to the north of the lake, another flows out of several small ponds near the Waukewan Golf Course, and the third flows into the southwest part of the lake. Other intermittent stream and stormwater drainages that lead into the lake have yet to be identified. Because of the small amount of perennial stream discharges into Lake Waukewan, the turn-over (“flushing”) rate of water in the lake itself is fairly low, and is estimated at .6 times per year (NHDES 2002). In other words, it takes about 20 months for the water in the lake to be replaced. The flushing rate would be considerably slower if the lake was not relatively shallow. The average depth of Lake Waukewan is less than 25 feet, although two fairly deep holes, one in the north central part and one in the south central part, exceed 65 feet in depth. The slow flushing rate places a particularly important emphasis on the lakeshore wetlands in mitigating pollution discharges into or above the lake. Aquatic bed wetlands less than 15 feet deep exist in over 38% of the lake, especially in the northwestern part, around Chapman Island, and in Perkins Cove. The Snake River wetland complex also plays a critical role in attenuating nutrients, removing toxicants, and settling sediments that would otherwise flow directly into the lake.
Figure 20. Lake Waukewan bathymetry map showing 15-foot depth zone in light blue
29 The total density of perennial streams in the watershed is .63 miles per square mile, which is quite low relative to average drainage densities in the state. While this is good in terms of minimizing pollution inputs to Lake Waukewan, it also places a higher need for regulation and the control of development.

Meredith NRI Project
Van de Poll / EMC Page 44 August 2005
Wetlands above Lake Waukewan are few in number. Excluding the lakes and ponds, only 5.9% of the watershed is comprised of palustrine (freshwater) wetlands, and most of these are forested swamps that either fall along the watershed boundary in undeveloped regions of the watershed, or lie along the stream drainageways. A total of 249 wetland units were identified in the watershed using digital 1998 aerial photographs. Some of these were confirmed during the windshield survey of roads and agricultural land, and many others were confirmed by fieldwork. Many of these wetland units are contiguous, and if lumped according to discrete wetland complexes, an approximate total of 110 wetland areas are recognized. A look at the unverified soils map for the watershed yields additional concerns about the capacity of the landscape to handle water pollution discharges.30 Three types of soils that are rated as “severe” in terms of environmental sensitivity can be found.31 The first type, hydric soils, was already mentioned under the discussion of wetlands above. These soils have high water tables during the growing season, and periodically saturate or flood at or above the surface. Whereas the unvalidated soils map showed a total of 539 acres of hydric soils, the above-described aerial photograph interpretation yielded a slightly lower amount (497 acres). The second type of severe soils, those that are shallow to bedrock, are much more prevalent. A total of 2618 acres of soils that are less than 40 inches deep were identified from the soils map. Shallow soils are more sensitive to water-borne pollution because of the speed with which pollutants can enter groundwater and bedrock aquifers. The 2618-acre figure only includes shallow soils on slopes between 8 and 25%. Those soils that are on steeper slopes (i.e. ≥ 25%) were calculated under the steep (“E”) slope category. A total of 680.9 acres of steep (“E”) slope soils were found in the watershed. All totaled, environmentally sensitive soils that are rated severe for housing, roads, and septic systems equaled 3795.6 acres, or 52% of the land area. All of these soil types have the capacity for transmitting water-borne pollutants more quickly to streams, lakes and ponds upstream of Lake Waukewan. When combined with the amount of open water (lakes and ponds only), the total area of soils with high environmental sensitivity equals 61% of the watershed. When ecologically significant stream, lake, pond, and wetland buffers are added (100 feet), this figure increases to 73.6%. Conservation land in the Waukewan watershed varies by town. Overall, a total of 919.3 acres (10 parcels) or 11.1% of the land area is protected either publicly or privately. Protection class also varies, since some parcels could be partially developed, whereas others have permanent development restrictions on them. Approximately 80% of the conservation land exists in areas where severe development restrictions are present. Less than 1% of all lakeshores and pondshores are protected, whereas 85% of them are developed.
30 The 2003 soils map for the Waukewan Watershed was compiled by NHDES and the NRCS for both Belknap and Grafton Counties. The Belknap portion is an unvalidated draft that employs new soil taxonomy and field characteristics for soil complexes. It should be referred to as a guide only. 31 Environmental sensitivity can be roughly correlated with the suitability of a soil for development – i.e. the capability of a soil to receive roads, buildings, and septic systems. Soil suitability is typically rated as slight, moderate or severe.

Meredith NRI Project
Van de Poll / EMC Page 45 August 2005
In looking at the subwatershed basins surrounding Lake Waukewan and within the Waukewan watershed, some distinct patterns of natural resource attributes emerge in contrast to existing development patterns. Based on primary drainageways and natural topography, there are approximately 18 subwatersheds that have been identified. Ten of these contain defined stream channels that are recognizable as perennial at their point of inflow into a lake, pond or other stream. They range in size from 26.7 acres (Chapman Island) to 1402 acres (Hawkins and Bear Ponds), with a mean of 385.3 acres. Those subwatersheds with the most environmentally sensitive soils (e.g. subwatersheds I and J) have the least amount of development. Those subwatersheds with the best soils (e.g. subwatersheds B and C) have the most amount of development. Although the soils of these highly developed subwatersheds are less environmentally sensitive, their capability of minimizing water pollution contributions to Lake Waukewan could be compromised during periods of excessive flooding and stormwater run-off.
III. Summary A quick synopsis of the above results in the following summary:
The Lake Waukewan watershed is a minimally disturbed watershed with generally good water quality
The fact that there are few streams in the watershed places an emphasis on the
role of wetlands in mitigating the effects of water-borne pollution
Lakeshore wetlands play an important role in helping control the largest sources of point and non-point pollution that is associated with seasonal and permanent lakeshore residences
The amount of protected land in four of the five towns in the watershed is below
the 2004 statewide average of 14.7%, and very little of this protected land includes the shorelines of lakes and ponds
A relatively high percentage of land with development limitations exist in the
watershed, and this has the potential to cause a number of natural resource versus development conflicts in the near future

Meredith NRI Project
Van de Poll / EMC Page 46 August 2005
F) Attribute Assessment Model The Attribute Assessment Model consists of a set of criteria that were used to evaluate the value of individual parcels in Meredith relative to their conservation of natural resources. As described on page 19, this model was developed from a similar effort completed by the author in another New Hampshire community. Both the Land Conservation Investment Program (LCIP) and the Land and Community Heritage Conservation Program or LCHIP evaluation criteria were adopted for this model. Input from the 2002 Meredith Community Plan was also critical to the revision of this model, as was input from the NRI sub-committee of the Meredith Conservation Community. Owing to time constraints, only a few tests of this model were possible under the current scope of work completed under this NRI. Five parcels were assessed using this model, including one that has already been purchased for conservation, the Hamlin Recreation Area. The results of the five sample assessments yield a point value that ranged between 34 and 71 out of a possible 100 points, with the highest belonging to the Hamlin Recreation Area. While it was intended to use this model to run assessments on 100 parcels, the effort involved in deriving the NRI base line data did not allow this to occur. With a few additional pieces of critical information, such as the status of each conservation parcel in Meredith, the age and quality of timber management lands that have been harvested over the last 50 years, and a windshield survey of access and relative use of each parcel, this model can proceed as planned. It is anticipated that the Meredith Conservation Commission will sponsor a student intern or other capable volunteer to use this model in deriving a list of conservation priorities in Meredith. If properly applied, this model can provide the basis for a strategic Open Space Plan, as well as parcel-based confirmation of the natural resource assessments completed as a part of this NRI.

Meredith NRI Project
Van de Poll / EMC Page 47 August 2005
CONCLUSIONS The Town of Meredith has committed itself to the sound conservation of natural resources within its borders. It has also demonstrated a conscientious dedication to the protection of natural resources in adjacent municipalities, particularly in the Lake Waukewan watershed. This study has achieved the Town’s objective of documenting in map, table and text format a baseline assessment of natural resources. Updated soils, water resources, wetlands, agricultural areas, and wildlife habitat maps have been created and analyzed. Selected natural resource attributes that contribute to the well being of Meredith’s citizen have been identified, highlighted, and treated as critical ingredients of the quality of life that this region offers. The resulting overlays of natural resources and their attributes have provided a fundamental picture of a Town with a highly developed and integrated sense of land and water conservation. With one of the highest percentages of its total area in lakes, ponds, and wetlands in the state of New Hampshire, Meredith continues to value its water resources above all else. The foresight that created the protection of highly valued water resources – prime wetlands – has provided the means to establish high priorities for their protection and wise use. The value and weight that Meredith places on water-based recreation, its commitment to water quality protection, and its designation of critical stream resources underscores the evolution of a Town that began along its largest source of water power, Mill Brook, and ended up along its largest source of water transportation, recreation, and enjoyment, Lake Winnipesaukee. Given that Meredith is a rapidly growing community in the Lakes Region, the maps that were created in establishing baseline conditions of the natural resources in Town are meant to be regularly updated and improved. The tabular and graphical data that illustrates the findings of this work are meant to be refined and re-analyzed. With the completion of the digital parcel map and the supporting natural resource attribute overlays, the attribute assessment is ready to be implemented. It is the intention of the Meredith Planning Department to highlight the findings of this work in several public information sessions as well as on the Town’s web site. New data and further map refinements are also intended to be provided for public use and review. Completing the recommended action steps in the final section of this report will aid in updating the existing maps and providing the Town with even better, more accurate base line data from which to make conscientious, conservation-minded decisions. An initial draft of these recommended action steps was first published as a part of the original scope of services for the Meredith NRI Project. It should be noted that recommendation C) Watershed Analysis for Water Quality is currently underway under the auspices of the Town of Meredith Planning Department, Plymouth State University, and the NH Department of Environmental Services (NHDES). The Waukewan Watershed Project was approved for funding by NHDES in December of 2004 and has already begun to implement the strategies of the Waukewan Watershed Advisory Committee, which has recently finalized a watershed-wide plan to help protect the primary drinking water supply in Meredith.

Meredith NRI Project
Van de Poll / EMC Page 48 August 2005
RECOMMENDATIONS & NEXT STEPS “The long standing environmental preservation and conservation ethic within the community will progress to an unparalleled level. Critical natural resources such as significant wetlands, undeveloped shoreline areas, scenic vistas, wildlife corridors, groundwater supplies, large forested areas, and agricultural soils will be conserved …” (Meredith Community Plan p.10) The following list of six suggested next-steps are derived directly from this NRI Project. The case for emphasizing these achievable actions steps was built upon a careful review of Meredith’s natural resources, as well as the existing land use patterns that affect them. Whereas there are perhaps a dozen more actions that could be taken to improve the quality of life and conservation of natural resources in Town, these six represent the most logical follow-up to the present state of natural resource knowledge as well as the desire of the citizens of Meredith to conserve valuable natural resources as noted in the above 2002 Community Plan statement.
A) Complete the Attribute Assessment Model and Develop a Strategic
Conservation Plan The completion of NRI includes the preparation of a design model for identifying significant parcels of strategic conservation importance. The Attribute Assessment Model that was created for this purpose lays out a clear and repeatable series of steps for assessing the conservation value of a given tract of land. This model should be implemented for all parcels that fall within the 10 high-value co-occurrence areas identified in this report. The 400+ parcels, if analyzed in this way, could initiate a conservation priority plan for the Town, and end up with greater protection for those areas where multiple natural resources overlap. The completion of a strategic conservation plan would also include the identification and assessment of areas outside of the 10 high-value co-occurrence areas that are worthy of inclusion as conservation priorities. In general, this should include an assessment of forest land in current use, and the possible consideration of a high-value, forest land zone in Town. On a more specific basis, it might look at unique forest habitats such as the talus slope area west of Lake Winnisquam or the ledges above Spectacle Pond. Several other habitats, notably ones that have rare and endangered elements in them – e.g. loon nesting areas on Lake Winnipesaukee, should also receive such a review. The ultimate plan should provide the Meredith Planning Department and the Meredith Conservation Commission with a priority list for conserving particular areas of Town that have been highly ranked by the Attribute Assessment process.
B) Field-based survey of high-value co-occurrence areas Forest condition, wildlife habitat value and ecological uniqueness cannot always
be ascertained from remote data sources. Even in areas with known past land uses (and abuses), the integrity of the ecological landscape requires on-site surveys in order to adequately determine representativeness or exemplariness among biodiversity elements. This process can be initially done with the help of town volunteers who are capable of surveying basic characteristics. However, in order to place each parcel or land area in the

Meredith NRI Project
Van de Poll / EMC Page 49 August 2005
proper perspective of having regional or statewide significance, the experienced eye of a trained ecologist is required. The author has performed such rapid ecological assessments for over 20 years, and has completed bio-inventory evaluations on over 150,000 acres in New England. Since the initial identification of high-value co-occurrence areas has now been completed, it is suggested that a more in-depth windshield survey and field review be initiated in order to optimize the detection of important field attributes such as wildlife corridors, short-migratory vertebrate areas (i.e. routes to and from vernal pools), important bird areas, exemplary natural communities, and critical wildlife habitat areas. All critical habitats and species should be mapped on overlays of the original high-value co-occurrence areas map. Conservation management guidelines should be developed for each area that is identified and documented.
C) Watershed Analysis for Water Quality Lake Waukewan currently serves as the primary drinking water supply for
roughly 40% of the Town of Meredith (Community Plan, 2002). Its watershed includes lands beyond Meredith's borders, most of which lies on private property. Whereas good water quality data has been derived for Meredith Bay through the Volunteer Lakes Assessment Program at NHDES (VLAP), no data is currently collected at many of the tributary source sites for such an important drinking water supply. This field-based survey would include the establishment of regular water quality monitoring stations at 5 additional sites in the Lake Waukewan watershed, and would include base line testing of temperature, pH, dissolved oxygen, conductivity, total dissolved solids, alkalinity, and total phosphorus. Five of the existing VLAP sites would also receive biological monitoring efforts in the form of aquatic macro-invertebrate assays. Coordination with VLAP under the auspices of NHDES would ensure the inclusion of these sites in their regular volunteer monitoring program. The bio-monitoring effort should model statewide bio-monitoring protocols and include the calculation of a Hilsenhoff Biotic Integrity Index (HBI) on the assemblage of organisms found. This option would require a minimum of 12 days of summer field sampling time and at least 12 days of lab time. PSU students and the new laboratory operated by PSU’s Center for the Environment can provide ample staff and equipment resource support for this essential project. Biological confirmation of water quality in selected tributaries of the Waukewan watershed will cross-check existing water quality data and will provide the basis for more informed and targeted drinking water protection initiatives.
[Ed. Note: a modified plan to preserve the water quality of the Lake Waukewan watershed has
begun under a grant provide by the New Hampshire Department of Environmental Services. This project is also funded by the Town of Meredith and Plymouth State University, and follows guidance (in part) provided by the Lake Waukewan Watershed Advisory Committee, as published in their June 2005 document, Management Plan for the Waukewan Watershed.]
D) Wildlife Habitat Analysis Significant wildlife habitat is not always included in the mapping of riparian
areas, deer yards, heron rookeries, and wetlands. Although potential use by specific species can be implied from habitat analysis, actual use may not so easily discerned. This

Meredith NRI Project
Van de Poll / EMC Page 50 August 2005
recommended follow-up step to the natural resource inventory should rely on Fish & Game information, (e.g. hunting and trapping records), anecdotal reports, and targeted field assessments of wildlife habitat and corridor use. The primary goal is to identify areas where species that are rare and/or sensitive to human intrusion exist in viable population levels. This type of survey compliments remote data information provided by the GIS-map based NRI, and offers the opportunity for ground-truthing several of the wildlife attribute assessments for both upland and wetland wildlife. Upland wildlife habitat areas may include ridgeline corridors for large game species, and wetland wildlife habitat areas may include the mapping of vernal pools that harbor obligate breeding amphibians. Once identified, significant habitat areas can then be more accurately mapped and steps taken to protect these critical sites. Point and polygon mapping should compliment existing data overlays.
E) Prime Wetlands Delineation & Mapping The 1983 prime wetlands study by Barry Keith provided a necessary first step in
identifying "unique and fragile" wetland areas that were worthy of special protection from development. However, accurate on-the-ground delineation and assessment work was not completed at the time. The accompanying NRI report discussed the limitations in the interpretation of aerial photographs as well as the limitation of arbitrarily selecting mapped wetlands as a part of a prime wetland complex. Several questions arise: Are all seven of the prime wetlands equally sensitive to human disturbance? Does surrounding land use especially imperil any of the wetland functions? Are there activities that may safely occur within the 100-foot buffer that the Meredith Conservation Commission can support at a public hearing? These and other field-based questions would be answered by a recommended prime wetlands survey and assessment, which should include an Army Corps of Engineers (1987 manual) delineation that gives the Planning Board, the Conservation Commission, and the State of New Hampshire more accurate location information about each wetland area, as well as greater justification in placing these wetlands under high levels of scrutiny when faced with adjacent development.
F) Rare & Endangered Species, Exemplary Natural Communities Survey Initial rare and endangered species information has been researched through the
NH Natural Heritage Bureau (NHB), although many of the records in the NHB database are out-of-date or in serious need of updating. Of the 10 elements of occurrence recorded for the Town, 4 are historic (i.e. > 25 years old). Of particular importance are the aquatic plants that are more sensitive to water quality degradation and can be eliminated in a single year's time. All known occurrences of rare species and/or habitats should be surveyed in the field and the Element Occurrence Records (EOR's) updated on standardized data sheets. Locale-specific maps should be created that highlight recommended buffer areas, and a database created that outlines recommended management activities for each site.

Meredith NRI Project
Van de Poll / EMC Page 51 August 2005
ACKNOWLEDGMENTS
A project as complex as this one could not have been completed without the
tremendous support and assistance of many dedicated individuals. First and foremost, the vision and commitment of the Meredith Planning Department, especially Mr. John C. Edgar, provided the context and direction for this project from outset to finish. John’s persistent and inspiring method of eliciting a positive response was heart-warming and welcomed at all meetings. Equally dedicated and instrumental in moving this project forward was Jacquie Colburn of the NH Department of Environmental Services and the Meredith Conservation Commission (MCC). Jacquie’s foresight and ability to work with both the NHDES staff and the MCC provided valuable coordination between all parties involved. Ms. Robin McCann, Meredith’s IT/GIS Coordinator, provided essential GIS and technical support for the project, without which the very fine map productions included herein would not have been possible. Mr. Peter Miller, currently on the Board of Selectmen and the Meredith Conservation Commission provided detailed guidance in assessing valuable wildlife habitat areas in Town, particularly the Hamlin and Eames Town Forest. Dan Sundquist and David McGraw of the Society for the Protection of New Hampshire Forests provided initial support for co-occurrence mapping protocols, and were willing partners in the initial creation of project design. Finally, I would like to acknowledge my wife, without whose dedication and support during late nights and weekend assignments this project could not have been completed.

Meredith NRI Project
Van de Poll / EMC Page 52 August 2005

Meredith NRI Project
Van de Poll / EMC Page 53 August 2005
REFERENCES Ammann, A., and A.L. Stone. 1991. Method for the Comparative Evaluation of Non-tidal
Wetlands in New Hampshire. Concord, NH: NH Department of Environmental Services.
Barbour, M.T., J. Gerritsen, B.D. Snyder, and J.B. Stribling. 1999. Rapid Bioassessment
Protocols for Use in Wadeable Streams and Rivers: Periphyton, Benthic Macroinvertebrates, and Fish. 2nd ed. EPA 814-B-99-002. Washington, D.C.: U.S. Environmental Protection Agency, Office of Water.
Bonham, Charles C. 1989. Measurements of Terrestrial Vegetation. New York: John C.
Wiley & Sons. Boyd, Lynn. 2001. Buffer zones and beyond: Wildlife use of wetland buffer zones and
their protection under the Massachusetts Wetland Protection Act. Project report to the Department of Natural Resources Conservation, University of Massachusetts, July. Duplicated.
Brower, J.E., J.H. Zar, and C.N. von Ende. 1990. Field and Laboratory Methods for
General Ecology. 3rd ed. Dubuque: Wm. C. Brown Publishers. Colburn, E.A. ed. 1991. Certified! A Citizen's Step-by-Step Guide to Protecting Vernal
Pools. 4th ed. Lincoln: Massachusetts Audubon Society. Cortell and Associates. 1969. Bio-engineering Study, Squam Lake, Squam Lake
Association. Jason M. Cortell and Associates, Wellesley Hills, Massachusetts. December.
Cowardin, L.M., V. Carter, F.C. Golet, and E.T. LaRoe. 1979. Classification of Wetlands
and Deepwater Habitats of the United States. U.S. Fish and Wildlife Service. FWS/OBS – 79/31. Washington, D.C.: Government Printing Office.
Crisp, Norman H., and Catherine B. Crisp. 1974. Squam Lakes Project: Bacterial and
Benthic Characteristics of Tributaries. Report submitted to the Lakes Region Planning Commission, Meredith, New Hampshire. November.
DeGraaf, R.M., M. Yamasaki. B.B. Leak, and J.W. Lanier. 1992. New England Wildlife:
Management of Forested Habitats. Radnor, PA: USDA Forest Service, Northeastern Forest Experiment Station, GTR NE-144.
DeGraaf, Richard, and Mariko Yamasaki. 2001. New England Wildlife. 2nd ed. Amherst:
University of Massachusetts and the Northeast Forest Experiment Station, USDA. Gen. Tech. Rpt. NE-108.
Foss, Carol, ed. 1994. Atlas of Breeding Birds in New Hampshire. Dover: Arcadia.
(Published for the Audubon Society of New Hampshire).

Meredith NRI Project
Van de Poll / EMC Page 54 August 2005
Fuller, M.R. and J. Mosher. 1981. Methods of detecting and counting raptors: a review.
In Estimating Numbers of Terrestrial Birds. Studies in Avian Biology 6:235-246, ed. by C.J. Ralph and J.M. Scott. Lawrence, KN: Allen Press.
GAP Analysis Project. 1999. Land cover types of New England. Digital data supplied by
Complex Systems Resources Center, Durham, NH. December. Godin, A.J. 1977. Wild Mammals of New England. Baltimore: John Hopkins University
Press.
Harris, L.D. 1984. The Fragmented Forest: Island Biogeography Theory and the Preservation of Biodiversity. Chicago: University of Chicago Press.
Harvard University. 1976. Squam Lakes Study, Report to the Lakes Region Planning
Commission, Meredith, New Hampshire. Cambridge: Harvard University, Division of Engineering and Applied Physics.
Hilsenhoff, W.L. 1987. An improved biotic index of organic stream pollution. Great
Lakes Entomologist 20:31-39. http://www.gencourt.state.nh.us/rsa/html/indexes/482-A.html Kanter, J., R. Suomala, and E. Snyder. 2001. Identifying and Protecting New
Hampshire’s Significant Wildlife Habitat, A Guide for Towns and Conservation Groups. Concord, NH: NH Fish & Game Department.
Leak, W.B. 1979. Habitat Mapping in New England. Upper Darby, PA: USDA Forest
Service, NE Forest Experiment Station. Lyons, Charles, Eugene Boudette, et. al. 1997. New Hampshire Bedrock Geology Map
(with annotations). NH Department of Environmental Services, Concord, NH.
NAAMP. 2001. North American Amphibian Monitoring Project website: NH Department of Environmental Services. 1995. Lakes and Ponds Report. Concord:
NHDES. NH GRANIT. 2001. GIS data from Complex System Resources Center, Durham, NH. NHNHI. 2003. Rare and endangered species check with the NH Natural Heritage
Inventory, Concord, NH. December.
New England Interstate Water Pollution Control Commission. 1998. Field Identification of Hydric Soils. v2. Concord, MA: NEIWPCC.

Meredith NRI Project
Van de Poll / EMC Page 55 August 2005
NRCS. 2003. Unvalidated soil map of the Town of Meredith. Pilgrim, Sidney. 1978. Soils of New Hampshire. Durham: US Department of Agriculture
Soil Conservation Service. Scarola, John, F. 1987. Freshwater Fishes of New Hampshire. Concord: New Hampshire
Fish & Game Department. Schloss, Jeffrey, and Robert Craycraft. 1995. Squam Lake 1995 – NH Lay lakes
Monitoring Program. Dr. Alan Baker and Dr. James Haney, ed.s. Durham: UNH Cooperative Extension.
Silver, H. 1957. A History of New Hampshire furbearers. Survey report 6. Concord: NH
Fish & Game Department. Sperduto, D. D. 2000a. Draft - A Classification of the Natural Communities of New
Hampshire. New Hampshire Natural Heritage Inventory. Department of Resources and Economic Development, Concord, New Hampshire.
____________. 2000b. A guide to the wetland natural communities of New Hampshire.
New Hampshire Natural Heritage Program and The Nature Conservancy – Eastern Conservation Science. October. Duplicated.
Taylor, J. 1993. The Amphibians and Reptiles of New Hampshire. Concord: NH Fish &
Game Dept. Town of Meredith. 2004. Digital version of the 1983 prime wetlands map (mylar) by
Barry Keith. Prepared for review by R. McCann, Meredith Planning Office.
U.S. Army Corps of Engineers. 1987. Wetlands Delineation Manual. Technical Report 1-3-87. Washington, D.C.: Government Printing Office.
United States Department of Agriculture (USDA). 1968. Soil Conservation Service. Soil
Survey of Belknap County, New Hampshire. U.S. Department of the Interior. U.S. Geological Survey. 1997. Geohydrology and Water
Quality of Stratified Drift Aquifers in the Winnipesaukee River Basin, Central New Hampshire. WRIR 97-4150. Joseph D. Ayotte, principal author.
U.S. EPA. 2001. Protocols for Rapid Bioassessments of Wetlands:
http://www.epa.gov/OWOW/monitoring/techmon.html
Van de Poll, R. 2000a. Amherst Wetland Assessment and Prime Wetland Designation Project. Final report to the Town of Amherst, State of New Hampshire Department of Environmental Services Water Resources Bureau, and the Pennichuck Water Works Corporation. January.

Meredith NRI Project
Van de Poll / EMC Page 56 August 2005
Van de Poll, R. 2001a. Town of Nelson Priority Conservation Plan, Nelson, NH. January. Van de Poll, R.D. 1996. Natural and cultural resource inventories: A guide to
comprehensive methods for the private landowner in New England. Doctoral thesis. The Union Institute. UMI Publications. Cincinnati, OH.
Van de Poll, R. 1994. Wetlands Assessment of the Town of Rindge 1993. Prepared
for: the Town of Rindge Conservation Commission. Wessels, Thomas. 1997. Reading the Forested Landscape. Woodstock, VT: Countryman
Press.

Appendix A
List of ArcView GIS Shapefiles Color-coded by ArcView Layers

Mer
edith
NR
I Pro
ject
APP
EN
DIX
A -
Arc
Vie
w S
hape
file
Dir
ecto
ry C
olor
-cod
ed b
y L
ayer
AL
L(N
O C
OLO
R)
AG
RIC
UL
TU
RE
yello
wC
O-O
CC
UR
RE
NC
Epi
nkFO
RE
ST R
ESO
UR
CE
Sm
ediu
m g
reen
VIS
UA
L R
ESO
UR
CE
Sbl
ue-g
reen
WA
TE
R R
ESO
UR
CE
Slig
ht b
lue
WE
TL
AN
D R
ESO
UR
CE
Slig
ht g
reen
WIL
DL
IFE
- U
PLA
ND
oran
geW
ILD
LIF
E -
WE
TL
AN
Dm
ediu
m b
lue
NO
N-S
PEC
IFIC
gray
NA
ME
(.sh
p)Sh
apef
ile T
ype
NR
I Lay
erD
escr
iptio
n
1200
+-st
eeps
lope
spo
lygo
nIn
ters
ectio
nIn
ters
ects
are
as o
f slo
pes >
25%
and
land
s abo
ve 1
200
feet
in e
leva
tion
25%
+slo
pepo
lygo
nW
ildlif
e-U
plan
dSh
ows a
ll ar
eas w
ith >
25%
slop
es; b
ased
on
soil
poly
gons
activ
eagb
uff7
5bu
ffer
to p
olyg
onA
gric
ultu
reSh
ows 7
5-fo
ot in
ner a
nd o
uter
buf
fer t
o al
l are
as th
at a
re u
nder
act
ive
agric
ultu
reac
tivea
g-pr
ime-
impo
rtsoi
lspo
lygo
nIn
ters
ectio
nIn
ters
ects
are
as o
f act
ive
agric
ultu
re, p
rime
farm
land
soils
and
soils
of l
ocal
impo
rtanc
eag
-ope
npo
lygo
nA
gric
ultu
reSh
ows a
ll ar
eas w
here
act
ive
mow
ing,
hay
ing,
cro
p pr
oduc
tion,
or o
pen
gras
slan
d is
bei
ng m
aint
aine
dag
-ope
nbuf
f75-
unfr
ag-in
tpo
lygo
nIn
ters
ectio
nIn
ters
ects
75-
foot
buf
fer t
o ac
tive
ag si
tes w
ith u
nfra
gmen
ted
land
s (50
0-ft
road
buf
fer)
agop
enbu
ff-u
nfra
g-pa
rcel
spo
lygo
nIn
ters
ectio
nPr
ovid
es p
arce
l cou
nt o
f abo
ve in
ters
ectio
nag
ric-a
ctiv
era
ster
-bas
ed p
olyg
onA
gric
ultu
reC
onve
rted
lans
at ra
ster
clip
of a
ctiv
e ag
ricul
ture
with
in M
ered
ith +
1/2
mile
buf
fer
agric
-act
ivec
lipra
ster
-bas
ed p
olyg
onA
gric
ultu
reC
onve
rted
lans
at ra
ster
clip
of a
ctiv
e ag
ricul
ture
with
in T
own
of M
ered
ithap
i-mer
edith
+100
buff
buff
er to
pol
ygon
Wet
land
sSh
ows 1
00-f
oot b
uffe
r to
Aer
ial P
hoto
Inte
rpre
ted
(API
) wet
land
are
as w
ithin
Tow
n of
Mer
edith
api-m
ered
ith+2
640
poly
gon
Wet
land
sA
eria
l Pho
to In
terp
rete
d w
etla
nds w
ithin
Mer
edith
+ 1
/2 m
ile b
uffe
rap
iprim
espo
lygo
nW
etla
nds
API
wet
land
sin
Mer
edith
that
repr
esen
ts "
best
fit"
with
Prim
e W
etla
nds M
ap (1
983)
apiw
etld
s1ac
-po
lygo
nW
etla
nds
API
wet
land
s in
Mer
edith
that
are
less
than
1 a
cre
in si
ze (n
o op
en w
ater
)ap
iwet
lds1
ac+
poly
gon
Wet
land
sA
PI w
etla
nds i
n M
ered
ith th
at a
re g
reat
er th
an o
r equ
al to
1 a
cre
in si
ze (w
ith o
pen
wat
er)
apiw
etld
s-1a
c+po
lygo
nW
etla
nds
API
wet
land
s in
Mer
edith
that
are
gre
ater
than
or e
qual
to 1
acr
e in
size
(no
open
wat
er)
apiw
etld
s1ac
+-pa
rcel
spo
lygo
nIn
ters
ectio
nPr
ovid
es p
arce
l cou
nt o
f wet
land
are
as in
Mer
edith
tha
t are
>=
1 ac
re
apiw
etld
s300
0po
lygo
nW
etla
nds
API
wet
land
s in
Mer
edith
that
are
less
than
300
0 sq
uare
feet
in si
zeap
iwet
ldsa
llpo
lygo
nW
etla
nds
API
wet
land
s in
Mer
edith
, 1/2
mile
buf
fer,
and
uppe
r Wau
kew
an w
ater
shed
(with
ope
n w
ater
)ap
iwet
ldsa
ll-no
wat
erpo
lygo
nW
etla
nds
API
wet
land
s in
Mer
edith
, 1/2
mile
buf
fer,
and
uppe
r Wau
kew
an w
ater
shed
(with
no
open
wat
er)
apiw
etld
s-in
-hal
f-m
ilebu
ffpo
lygo
nW
etla
nds
API
wet
land
s in
half-
mile
ext
ende
d st
udy
area
apiw
etld
s-m
ered
ithpo
lygo
nW
etla
nds
API
wet
land
s in
Mer
edith
(with
ope
n w
ater
)ap
iwet
ldsm
ered
ith+2
640
poly
gon
Wet
land
sA
PI w
etla
nds i
n M
erdi
th +
1/2
mile
buf
fer (
with
ope
n w
ater
)ap
iwtld
smrd
thno
wat
erpo
lygo
nW
etla
nds
API
wet
land
s in
Mer
edith
(no
wat
er)
apiw
etld
sall-
now
ater
poly
gon
Wet
land
sA
PI w
etla
nds i
n M
ered
ith, 1
/2 m
ile st
udy
area
and
upp
er W
auke
wan
wat
ersh
ed -
no o
pen
wat
erap
iwtld
snow
ater
diss
diss
love
pol
ygon
Wet
land
sA
PI w
etla
nds i
n M
ered
ith, 1
/2 m
ile b
uffe
r, an
d up
per W
auke
wan
wat
ersh
ed (n
o op
en w
ater
, one
uni
t)aq
uatic
buff
-50
buff
er to
pol
ygon
Wild
life-
Wet
land
sSh
ows 5
0-fo
ot b
uffe
r to
API
ope
n w
ater
wet
land
s in
Mer
edith
aqui
ferc
lippo
lygo
nG
roun
dwat
erN
HD
ES a
quife
rs w
ithin
Mer
edith
and
1/2
mile
buf
fer
aqui
fer-
pem
i-mer
edith
poly
gon
Gro
undw
ater
NH
DES
aqu
ifers
with
in th
e Pe
mig
ewas
set w
ater
shed
por
tion
of M
ered
ith
aqui
fers
inha
lfmile
buff
buff
er to
pol
ygon
Gro
undw
ater
NH
DES
aqu
ifers
in h
alf-
mile
buf
fer t
o To
wn
of M
ered
ithaq
uife
rs-m
edpo
lygo
nG
roun
dwat
erN
HD
ES m
ediu
m-y
ield
aqu
ifers
(mid
rang
e of
tran
smis
sivi
ty)
aqui
fers
-med
-par
cels
poly
gon
Inte
rsec
tion
Inte
rsec
ts p
arce
ls w
ith m
ediu
m-y
ield
aqu
ifers
aqui
fers
-mer
edith
poly
gon
Gro
undw
ater
NH
DES
aqu
ifers
in M
ered
ithaq
uife
r-w
inni
-mer
edith
poly
gon
Gro
undw
ater
NH
DES
aqu
ifers
with
in th
e W
inni
pesa
ukee
wat
ersh
ed p
ortio
n of
Mer
edith
aq
uife
rs-p
arce
lspo
lygo
nIn
ters
ectio
nPr
ovid
es p
arce
l cou
nt o
f are
as w
ithin
all
aqui
fers
in M
ered
ith
NO
TE: N
ot a
ll sh
apef
iles
liste
bel
ow a
re c
onta
ined
in
the
map
s at
tach
ed to
this
repo
rt
Van
de
Pol
l / E
MC
Pag
e A
- 1
Aug
ust 2
005

Mer
edith
NR
I Pro
ject
NA
ME
(.sh
p)Sh
apef
ile T
ype
NR
I Lay
erD
escr
iptio
nba
thy1
5mer
edith
poly
gon
Wild
life-
Wet
land
sSh
ows o
pen
wat
er fr
inge
to 1
5-fo
ot d
epth
(app
roxi
mat
es W
inni
pesa
ukee
by
usin
g 50
-foo
t sho
relin
e bu
ffer
)ba
thy1
5-pa
rcel
spo
lygo
nIn
ters
ectio
nPr
ovid
es p
arce
l cou
nt o
f priv
ate
land
s with
in 1
5-fo
ot d
epth
of a
ll op
en w
ater
are
as in
Mer
edith
bedr
ockc
lippo
lygo
nB
edro
ckSh
ows b
edro
ck g
eolo
gy w
ithin
Mer
edith
+ 1
/2 m
ile b
uffe
rbe
ech-
oak
rast
er-b
ased
pol
ygon
Land
Cov
erLa
nsat
23
clip
of b
eech
-oak
fore
st c
over
type
in M
ered
ith +
1/2
mile
buf
fer
beec
h-oa
kint
own
rast
er-b
ased
pol
ygon
Land
Cov
erLa
nsat
23
clip
of b
eech
-oak
fore
st c
over
type
in M
ered
ithbh
k w
etla
nds
poly
gon
Wet
land
sD
igita
l ver
sion
of B
arry
H. K
eith
-map
ped
wet
land
s in
Mer
edith
cons
-co-
occu
rpo
lygo
nIn
ters
ectio
nIn
ters
ects
200
4 co
nser
vatio
n la
nd in
Mer
edith
with
9 c
o-oc
curr
ence
are
asco
nser
vatio
n 4-
04po
lygo
nC
onse
rvat
ion
Land
Show
s all
desi
gnat
ed c
onse
rvat
ion
land
in M
erdi
th a
s of A
pril
2004
co-o
ccur
renc
eare
aspo
lygo
nIn
ters
ectio
n A
llSh
ows a
ll 9
area
s in
Mer
edith
whe
re th
e m
ost h
igh
valu
e na
tura
l res
ourc
es o
verla
pcr
itica
l vie
war
easc
lippo
lygo
nV
iew
shed
Clip
s Tom
Kok
x's c
ritic
al v
iew
shed
are
as; s
how
s onl
y la
nds i
n M
ered
ith +
1/2
mile
buf
fer
curr
ent u
sepo
lygo
nC
onse
rvat
ion
Land
Show
s all
parc
els i
n M
ered
ith th
at a
re re
gist
ered
und
er C
urre
nt U
se T
ax L
awcu
rren
tuse
-co-
occu
rpo
lygo
nIn
ters
ectio
nPr
ovid
es p
arce
l cou
nt o
f all
curr
ent u
se la
nds w
ithin
are
as o
f co-
occu
rren
cede
er y
ards
poly
gon
Wild
life-
Upl
and
Dig
ital v
ersi
on o
f NH
Fis
h &
Gam
e de
er y
ards
map
for M
ered
ithde
sigb
hkno
n-pr
imeb
uff1
00bu
ffer
to p
olyg
onW
etla
nds
Show
s 100
-foo
t buf
fer o
f des
igna
ted
non-
prim
e w
etla
nds i
n M
ered
ith fr
om 1
983
stud
yde
sigb
hkno
n-pr
imes
poly
gon
Wet
land
sD
igiti
zed
vers
ion
of th
e de
sign
ated
non
-prim
e w
etla
nds f
rom
Tow
n of
Mer
edith
198
3 st
udy
desi
gnat
edbh
kprim
espo
lygo
nW
etla
nds
Dig
itize
d ve
rsio
n of
the
desi
gnat
ed p
rime
wet
land
s fro
m T
own
of M
ered
ith 1
983
stud
yde
sign
ated
stre
ams
poly
line
Surf
ace
Wat
ers
Dig
ital c
lip o
f USG
S st
ream
s as s
peci
ally
des
igna
ted
by T
own
of M
ered
ithde
sig-
plin
e1po
lylin
eSu
rfac
e W
ater
sD
esig
nate
d st
ream
s plu
s USG
S st
ream
line
thro
ugh
wet
land
s in
Mer
edith
desi
gstre
ambu
ff10
0bu
ffer
to p
olyl
ine
Surf
ace
Wat
ers
Show
ing
100-
foot
buf
fer o
f des
igna
ted
stre
ams i
n M
ered
ithde
sigs
tream
buff
10ft
buff
er to
pol
ylin
eSu
rfac
e W
ater
sSh
owin
g 10
-foo
t buf
fer o
f des
igna
ted
stre
ams i
n M
ered
ithde
sigs
tream
buff
200
buff
er to
pol
ylin
eSu
rfac
e W
ater
sSh
owin
g 20
0-fo
ot b
uffe
r of d
esig
nate
d st
ream
s in
Mer
edith
desi
gstre
ambu
ff30
0bu
ffer
to p
olyl
ine
Surf
ace
Wat
ers
Show
ing
300-
foot
buf
fer o
f des
igna
ted
stre
ams i
n M
ered
ithde
sigs
tream
buff
300-
parc
els
poly
gon
Inte
rsec
tion
Prov
ides
par
cel c
ount
of a
rea
with
in 3
00 fe
et o
f des
igna
ted
stre
ams i
n M
ered
ithfo
rest
cove
rra
ster
-bas
ed p
olyg
onLa
nd C
over
Land
sat 2
3 cl
ip o
f for
est c
over
in T
own
of M
ered
ith +
1/2
mile
buf
fer
fore
stla
ndcl
ipra
ster
-bas
ed p
olyg
onLa
nd C
over
Land
sat 2
3 cl
ip o
f for
est c
over
in T
own
of M
ered
ithfo
rest
land
-unf
rag
poly
gon
Inte
rsec
tion
Inte
rsec
ts fo
rest
land
and
unf
ragm
ente
d la
nds (
500-
foot
buf
fer f
rom
road
s)fo
rest
min
usro
adbu
ff10
0po
lygo
nLa
nd C
over
Show
s ras
ter-
base
d fo
rest
are
a in
Mer
edith
that
is >
= 10
0 fe
et fr
om ro
ad c
ente
rline
sfo
rland
less
than
50po
lygo
nLa
nd C
over
Show
s ras
ter-
base
d fo
rest
land
in M
ered
ith o
f les
s tha
n 50
acr
es w
hen
frag
men
ted
by ro
ads w
ith 1
00-f
oot b
uffe
rfo
rland
-unf
rag1
00-f
orso
ilspo
lygo
nIn
ters
ectio
nIn
ters
ects
and
smoo
ths r
aste
r-ba
sed
fore
st la
nds (
outs
ide
100-
ft ro
ad b
uffe
r) w
ith g
ood
fore
st so
ilsfo
rland
-unf
rag-
fors
oils
poly
gon
Inte
rsec
tion
Inte
rsec
ts ra
ster
-bas
ed fo
rest
land
in M
ered
ith (o
utsi
de o
f 100
-foo
t roa
d bu
ffer
) with
goo
d fo
rest
soils
(prim
e an
d lo
cal i
mpo
rtanc
e)go
odfo
rest
land
soils
poly
gon
Land
Cov
erSh
ows a
ll pr
ime
farm
land
soils
and
soils
of l
ocal
impo
rtanc
e in
Mer
edith
half-
mile
clip
per
buff
er to
pol
ygon
All
laye
rsSh
ows 1
/2 m
ile b
uffe
r are
a to
Tow
n of
Mer
edith
half-
mile
buff
less
road
buff
100
buff
er to
pol
ygon
Land
Cov
erC
lips a
ll ro
ads a
nd th
eir 1
00-f
oot b
uffe
rs fr
om h
alf-
mile
"do
ughn
ut"
arou
nd M
ered
ithha
lf-m
ile-p
line
poly
line
Bas
e M
apPo
lylin
e pe
rimet
er o
f hal
f-m
ile e
xten
ded
stud
y ar
eaH
SVP
poin
tV
iew
shed
Show
s hig
hly
sign
ifica
nt v
iew
poin
ts a
s GPS
poi
nts f
rom
scen
ic a
reas
of M
ered
ith st
udy
hydr
icso
ilpo
lygo
nW
etla
nds
Clip
s all
soil
poly
gons
from
Mer
edith
soils
map
that
show
a "
Y"
unde
r the
hyd
ric c
ateg
ory
hydr
oclip
poly
line
Surf
ace
Wat
ers
Clip
s all
hydr
ogra
phy
poly
lines
to sh
ow h
ydro
grap
hy w
ithin
Mer
edith
+ 1
/2 m
ile b
uffe
rhy
drom
rgpo
lylin
eSu
rfac
e W
ater
sM
erge
s all
hydr
ogra
phy
poly
lines
for q
uads
that
incl
ude
Mer
edith
, 1/2
/ mile
buf
fer a
nd L
ake
Wau
kew
an w
ater
shed
ii2cl
ippo
lygo
nSo
ilsSh
ows a
ll C
ateg
ory
II so
ils in
Mer
edith
(prim
e fa
rmla
nd a
nd so
il;s o
f sta
tew
ide
impo
rtanc
e)iie
poly
gon
Soils
Show
s all
Cat
egor
y II
soils
in g
reat
er M
ered
ith a
rea
with
som
e er
osio
n po
tent
ial d
ue to
slop
esiie
clip
poly
gon
Soils
Show
s all
Cat
egor
y II
soils
in M
ered
ith +
1/2
mile
buf
fer w
ith so
me
eros
ion
pote
ntia
l due
to sl
opes
iii a
nd iv
poly
gon
Soils
Show
s all
Cat
egor
y II
I and
IV so
ils (s
oils
of l
ocal
impo
rtanc
e) in
gre
ater
Mer
edith
are
aiii
and
ivcl
ippo
lygo
nSo
ilsSh
ows a
ll C
ateg
ory
III a
nd IV
soils
(soi
ls o
f loc
al im
porta
nce)
in M
ered
ithiiw
poly
gon
Soils
Show
s all
Cat
egor
y II
soils
in g
reat
er M
ered
ith a
rea
with
som
e w
etne
ss li
mita
tions
iiwcl
ippo
lygo
nSo
ilsSh
ows a
ll C
ateg
ory
II so
ils in
Mer
edith
with
som
e w
etne
ss li
mita
tions
inte
rsec
tagr
icpo
lygo
nIn
ters
ectio
nIn
ters
ects
rast
er-b
ased
agr
icul
tura
l lan
d w
ith C
ateg
ory
II, I
II, a
nd IV
soils
lake
wau
kew
anbu
ff25
0bu
ffer
to p
olyg
onSu
rfac
e W
ater
sSh
ows 1
25-f
oot b
uffe
r ins
ide
and
outs
ide
of M
ered
ith p
ortio
n of
Lak
e W
auke
wan
lake
wau
kew
anm
erpo
lygo
nSu
rfac
e W
ater
sLa
ke W
auke
wan
insi
de M
ered
ithla
ewin
nim
ered
ithpo
lygo
nSu
rfac
e W
ater
sLa
ke W
inni
pesa
ukee
insi
de M
ered
ithla
ndsa
bove
1200
ftpo
lygo
nW
ildlif
e-U
plan
dA
ll la
nds i
n M
ered
ith a
bove
120
0 fe
et in
ele
vatio
n
Van
de
Pol
l / E
MC
Pag
e A
- 2
Aug
ust 2
005

Mer
edith
NR
I Pro
ject
NA
ME
(.sh
p)Sh
apef
ile T
ype
NR
I Lay
erD
escr
iptio
nla
ndsa
t lan
d co
ver
rast
er-b
ased
pol
ygon
Land
Cov
erLa
nd c
over
from
lans
at 2
3 fo
r tow
n of
Mer
edith
+ 1
/2 m
ile b
uffe
r (co
nver
ted
from
rast
er)
lans
at-h
emra
ster
-bas
ed p
olyg
onLa
nd C
over
Lans
at c
over
#42
3 - h
emlo
ckla
nsat
-spr
uce&
firra
ster
-bas
ed p
olyg
onLa
nd C
over
Lans
at c
over
#42
2 - s
pruc
e an
d fir
lans
at-w
p&rp
rast
er-b
ased
pol
ygon
Land
Cov
erLa
nsat
cov
er #
421
- whi
te a
nd re
d pi
nelk
win
niha
lfmile
buff
poly
gon
Surf
ace
Wat
ers
Lake
Win
nipe
sauk
ee in
Mer
edith
's ha
lf m
ile b
uffe
r are
a lk
win
nisq
uam
halfm
ilebu
ffpo
lygo
nSu
rfac
e W
ater
sLa
ke W
inni
squa
m in
Mer
edith
's ha
lf-m
ile b
uffe
r are
am
ered
ith p
oliti
cal b
ound
arie
spo
lygo
nB
ase
Map
Mer
edith
pol
itica
l bou
ndar
ies (
old,
exc
lude
s isl
ands
)m
ered
ith p
rivat
e ro
ads
poly
line
Bas
e M
apM
ered
ith's
priv
ate
road
s as d
igiti
zed
by T
own
Plan
ning
Off
ice
from
tax
map
s and
DO
Q's
mer
edith
road
spo
lylin
eB
ase
Map
All
publ
ic a
nd se
mi-p
rivat
e ro
ads i
n M
ered
ith a
s fou
nd in
NH
GR
AN
IT d
ata
base
(199
8)m
ered
ithpo
lygo
nPa
rcel
Map
Firs
t ver
sion
of t
ax m
ap -
Feb
2004
(Tow
n Pl
anni
ng O
ffic
e)m
ered
ithaq
uife
rspo
lygo
nG
roun
dwat
erN
HD
ES a
quife
rs c
lippe
d to
Tow
n of
Mer
edith
mer
edith
bndr
ynew
poly
gon
Bas
e M
apN
ew b
ound
ary
map
(Sep
t 200
3) fo
r Mer
edith
with
cor
rect
ed la
ke d
ivis
ions
mer
edith
cons
ease
mts
poly
gon
Con
serv
atio
n La
ndM
ay 2
005
upda
te o
f all
cons
erva
tion
ease
men
t par
cels
in M
ered
ithm
ered
ithco
nsla
ndpo
lygo
nC
onse
rvat
ion
Land
2003
clip
of S
PNH
F co
nser
vatio
n la
nd in
Mer
edith
mer
edith
cons
land
-all
poly
gon
Con
serv
atio
n La
ndM
ered
ith c
onse
rvat
ion
parc
el d
ata
with
pid
sm
ered
ithco
nsla
nd-o
ther
poly
gon
Con
serv
atio
n La
ndM
ay 2
005
upda
te o
f oth
er to
wn-
owne
d pa
rcel
s in
Mer
edith
mer
edith
fore
stco
ver
poly
gon
Land
Cov
erLa
nsat
-bas
ed fo
rest
cov
er c
lippe
d fo
r Mer
edith
mer
edith
nwin
owat
erpo
lygo
nW
etla
nds
All
NW
I wet
land
s in
Mer
edith
(no
PUB
or L
UB
ope
n w
ater
are
as)
mer
edith
nwip
lus2
640
poly
gon
Wet
land
sN
WI q
uads
clip
ped
to M
ered
ith +
1/2
mile
buf
fer a
rea
mer
edith
tow
nfor
ests
poly
gon
Con
serv
atio
n La
ndM
ay 2
005
parc
els o
f Tow
n Fo
rest
s in
Mer
edith
mer
edith
wet
lds-
1ac+
poly
gon
Wet
land
sA
PI w
etla
nds i
n M
ered
ith >
= 1
acre
; sam
e as
abo
ve b
ut w
ithou
t wet
land
cla
sses
dbf
, for
use
in a
ggre
gate
wet
land
cal
cula
tion
mer
edith
wet
lds1
ac+b
uff1
00bu
ffer
to p
olyg
onW
ildlif
e-W
etla
nds
Show
s 100
-foo
t buf
fer t
o al
l Mer
edith
wet
land
s >=
1acr
e in
size
mer
edith
wet
lds-
1ac+
buff
200
buff
er to
pol
ygon
Wild
life-
Wet
land
sSh
ows 2
00-f
oot b
uffe
r to
all M
ered
ith w
etla
nds >
= 1a
cre
in si
zeno
ndes
igna
teds
tream
spo
lylin
eSu
rfac
e W
ater
sA
ll no
n To
wn-
desi
gnat
ed st
ream
s in
Mer
edith
+ 1
/2 m
ile b
uffe
r (N
= 2
)no
n-de
sig-
stre
am-a
dds
poly
line
Surf
ace
Wat
ers
Incl
udes
all
non-
desi
gnat
ed st
ream
s not
pic
ked
in in
itial
NR
I sur
vey
nond
esig
stre
ambu
ff10
ftbu
ffer
to p
olyl
ine
Surf
ace
Wat
ers
Show
s 10-
foot
buf
fer t
o al
l non
Tow
n-de
sign
ated
stre
ams i
n M
ered
ith +
1/2
mile
buf
fer
nond
esig
stre
ambu
ff20
0bu
ffer
to p
olyl
ine
Surf
ace
Wat
ers
Show
s 200
-foo
t buf
fer t
o al
l non
Tow
n-de
sign
ated
stre
ams i
n M
ered
ith +
1/2
mile
buf
fer
nond
esig
stre
ams-
parc
els
poly
gon
Inte
rsec
tion
Inte
rsec
ts 1
0-fo
ot b
uffe
r to
non-
desi
gnat
ed st
ream
s with
Mer
edith
par
cels
nwi
poly
gon
Wet
land
sA
ll N
WI w
etla
nds a
nd u
plan
ds in
qua
dran
gles
surr
ound
ing
Mer
edith
nwi-b
hkpo
lygo
nIn
ters
ectio
nIn
ters
ects
nw
i wet
land
s (no
lake
s) w
ith 1
983
Mer
edith
prim
e w
etla
nds
nwi-b
hk-h
ydric
sbuf
f150
buff
er to
pol
ygon
Wild
life-
Wet
land
sSh
ows 1
50-f
oot b
uffe
r to
inte
rsec
tion
of n
wi,
1983
prim
e an
d hy
dric
soil
wet
land
s in
Mer
edith
nwi-b
hk-h
ydric
soil
poly
gon
Inte
rsec
tion
Inte
rsec
tion
of n
wi a
nd 1
983
prim
e w
etla
nds w
ith N
HD
ES 2
003
hydr
ic so
ils in
Mer
edith
nwic
lippo
lygo
nW
etla
nds
NW
I wet
land
s in
Mer
edith
+ 1
/2 m
ile b
uffe
rnw
iclip
now
ater
poly
gon
Wet
land
sN
WI w
etla
nds i
n M
ered
ith +
1/2
mile
buf
fer (
no o
pen
wat
er)
nwi-h
ydric
buff
200
buff
er to
pol
ygon
Wild
life-
Wet
land
sSh
ows 2
00-f
oot b
uffe
r to
inte
rsec
tion
of n
wi w
etla
nds a
nd h
ydric
soils
in M
ered
ith +
1/2
mile
buf
fer
nwi-h
yric
soils
mrg
poly
gon
Wet
land
sM
erge
s NW
I wet
land
s and
hyd
ric so
ils in
Mer
edith
+ 1
/2 m
ile b
uffe
rnw
imrg
all
poly
gon
Wet
land
sM
erge
s all
NW
I wet
land
s and
upl
ands
in M
ered
ith, 1
/2 m
ile b
uffe
r and
upp
er W
auke
wan
wat
ersh
ednw
iove
r1ac
buff
100
buff
er to
pol
ygon
Wild
life-
Wet
land
sSh
ows 1
00-f
oot b
uffe
r of N
WI w
etla
nds i
n M
ered
ith +
1/2
mile
buf
fer
open
wat
er-a
llpo
lygo
nSu
rfac
e W
ater
sSh
ows a
ll la
rge
lake
s & p
onds
in e
ntire
stud
y ar
eaop
enw
ater
buff
250
buff
er to
pol
ygon
Surf
ace
Wat
ers
Show
s 250
-foo
t buf
fer t
o op
enw
ater
-mer
edith
.shp
open
wat
er-m
ered
ithpo
lygo
nSu
rfac
e W
ater
sM
ered
ith A
PI-b
ased
ope
n w
ater
: Win
nipe
sauk
ee, W
inni
squa
m, W
auke
wan
, Wic
was
, Pem
igew
asse
t, Sp
ecta
cle,
Pic
kere
lop
enw
ater
-mer
edith
+264
0po
lygo
nSu
rfac
e W
ater
sO
pen
wat
er a
reas
as a
bove
+ 1
/2 m
ile b
uffe
r are
a to
Tow
nop
enw
ater
-mer
edith
buff
250
buff
er to
pol
ygon
Wild
life-
Wet
land
sSh
ows 2
5-0-
foot
buf
fer t
o op
en w
ater
in M
ered
ithop
enw
ater
nrcs
poly
gon
Surf
ace
Wat
ers
Incl
udes
abo
ve o
pen
wat
ers,
plus
PU
B w
etla
nds:
Mud
, Sw
ains
, Ran
dlet
t, Pa
ge, F
ores
t and
Litt
le P
onds
open
wat
ernr
csbu
ff25
0bu
ffer
to p
olyg
onSu
rfac
e W
ater
sSh
ows 2
50-f
oot b
uffe
r to
NR
CS
(API
-cor
rect
ed) "
WA
TER
" in
Mer
edith
incl
udin
g M
ud a
nd P
age
Pond
sop
enw
ater
-wet
land
spo
lygo
nW
etla
nds
Show
s all
open
wat
er w
etla
nds (
PUB
's, P
AB
's) th
at a
re n
ot p
onds
parc
el li
nes
poly
line
Parc
el M
apM
arch
200
4 pa
rcel
line
s for
Mer
edith
tax
map
parc
el-a
gint
poly
gon
Inte
rsec
tion
Inte
rsec
ts a
ctiv
e ag
ricul
tura
l lan
d (a
gope
n.sh
p) w
ith M
ered
ith p
arce
ls (p
arce
ls 4
-04.
shp)
parc
el-g
oodf
ores
tspo
lygo
nIn
ters
ectio
nIn
ters
ects
goo
d fo
rest
land
s (go
odfo
rest
land
soils
.shp)
with
Mer
edith
par
cels
parc
els 4
-04
poly
gon
Parc
el M
apA
pril
2004
ver
sion
of M
ered
ith ta
x pa
rcel
map
(Tow
n Pl
anni
ng O
ffic
e)
Van
de
Pol
l / E
MC
Pag
e A
- 3
Aug
ust 2
005

Mer
edith
NR
I Pro
ject
NA
ME
(.sh
p)Sh
apef
ile T
ype
NR
I Lay
erD
escr
iptio
npa
rcel
s-ap
iwtld
s int
poly
gon
Inte
rsec
tion
Inte
rsec
ts A
PI w
etla
nds i
n M
ered
ith (a
piw
etld
s-m
ered
ith.sh
p) w
ith M
ered
ith p
arce
ls (p
arce
ls 4
-04.
shp)
parc
els-
aqui
ferm
ed in
tpo
lygo
nIn
ters
ectio
nIn
ters
ects
med
ium
yie
ld a
quife
rs in
Mer
edith
with
Mer
edith
tax
parc
els
parc
els-
aqui
fers
int
poly
gon
Inte
rsec
tion
Inte
rsec
ts M
ered
ith a
quife
rs (a
quife
rs-m
ered
ith.sh
p) w
ith M
ered
ith ta
x pa
rcel
spa
rcel
s-co
-occ
urpo
lygo
nIn
ters
ectio
nIn
ters
ects
9 a
reas
of c
o-oc
curr
ence
with
Mer
edith
tax
parc
els
parc
els-
good
fore
sts-
curr
entu
sepo
lygo
nIn
ters
ectio
nIn
ters
ects
goo
d fo
rest
land
s with
par
cels
and
cur
rent
use
in M
ered
ithpa
rcel
s-m
ered
ithow
buff
250
poly
gon
Inte
rsec
tion
Inte
rsec
ts 2
50-f
oot b
uffe
r to
open
wat
er a
reas
in M
ered
ith (o
penw
ater
-mer
edith
.shp)
with
Mer
edith
par
cels
parc
els-
open
wat
erbu
ff25
0po
lygo
nIn
ters
ectio
nIn
ters
ects
parc
els-
prim
ewtld
s int
poly
gon
Inte
rsec
tion
Inte
rsec
ts A
PI-d
eriv
ed p
rime
wet
land
s (ap
iprim
es.sh
p) w
ith M
erdi
th ta
x pa
rcel
spa
rcel
s-pr
ivw
ater
int
poly
gon
Inte
rsec
tion
Inte
rsec
ts o
pen
wat
er in
Mer
edith
(ope
nwat
ernr
cs.sh
p) w
ith M
ered
ith ta
x pa
rcel
s with
Rem
_pid
spa
rcel
s-st
ream
sbuf
f10
int
buff
er to
pol
ygon
Inte
rsec
tion
Inte
rsec
ts 1
0-fo
ot b
uffe
r to
all M
ered
ith st
ream
s (st
ream
sallb
uff1
0mrg
.shp)
with
Mer
edith
par
cels
parc
els-
stre
amsa
llbuf
f200
int
buff
er to
pol
ygon
Inte
rsec
tion
Inte
rsec
ts 2
00-f
oot b
uffe
r to
all M
ered
ith st
ream
s (st
ream
sallb
uff2
00m
rg.sh
p) w
ith M
ered
ith p
arce
lspa
rcel
s-un
frag
-cva
int
poly
gon
Inte
rsec
tion
Inte
rsec
ts 5
00-f
t unf
ragm
ente
d la
nds b
uffe
r and
crit
ical
vie
wsh
ed a
reas
with
Mer
edith
par
cels
parc
els-
visu
al in
tpo
lygo
nIn
ters
ectio
nIn
ters
ects
crti
cal v
iew
shed
are
as (c
ritic
al v
iew
area
sclip
.shp)
with
Mer
edith
tax
parc
els
pct-m
ered
ithpo
int
PCT
Vie
wSh
ows l
ocat
ion
of k
now
n po
int p
ollu
tion
sour
ces i
n M
ered
ith (s
alt s
heds
, gra
vel p
its, s
ewag
e tre
atm
ent a
reas
)pe
stm
erge
poly
gon
PCT
Vie
wSh
ows l
ocat
ion
of k
now
n re
leas
e si
tes f
or p
estic
ides
in g
reat
er M
ered
ith a
rea
poly
gons
poly
gon
Vie
wsh
edIll
ustra
tes c
ritic
al v
iew
shed
are
as a
s pol
ygon
s in
Mer
edith
and
nea
rby
tow
ns (P
lann
ing
Off
ice)
pond
spo
lygo
nW
ater
Sup
ply
Show
s all
non-
lake
, non
-wet
land
ope
n w
ater
bod
ies i
n M
ered
ithpr
imew
tldsa
llpo
lygo
nW
etla
nds
All
API
-der
ived
prim
e w
etla
nds i
n M
ered
ith a
s who
le u
nits
prim
ewtld
sallb
uff1
50bu
ffer
to p
olyg
onW
etla
nds
Show
s 150
-foo
t buf
fer t
o al
l API
-der
ived
wet
land
s in
Mer
edith
(api
prim
es.sh
p)pr
ivat
e w
ells
poin
tPC
T V
iew
Loca
tes a
ll pr
ivat
e w
ells
in M
ered
ith a
ccor
ding
to 1
998
NH
DES
dat
apr
ivat
ewel
lbuf
f400
buff
er to
poi
ntPC
T V
iew
Show
s 400
-foo
t rad
ius f
rom
eac
h pr
ivat
e w
ell p
oint
in M
ered
ithpu
blic
wat
er su
pply
wel
lspo
int
PCT
Vie
wLo
cate
s all
publ
ic w
ater
supp
ly w
ells
in a
nd a
djac
ent t
o M
ered
ith (N
HD
ES 2
003)
publ
icw
ells
buff
1320
buff
er to
poi
ntPC
T V
iew
Show
s 1/4
mile
radi
us to
eac
h pu
blic
supp
ly w
ell i
n an
d ad
jace
nt to
Mer
edith
road
real
ignm
ent
poly
line
All
laye
rsD
raw
s new
road
alig
nmen
t in
W p
art o
f Tow
n (P
lann
ing
Off
ice)
road
sall
poly
line
All
laye
rsD
epic
ts a
ll pu
blic
road
s in
Mer
edith
+ 1
/2 m
ile b
uffe
r (no
t rea
ligne
d)ro
ads-
all-b
uff1
00bu
ffer
to p
olyg
onFo
rest
rySh
ows g
ener
al la
nd a
rea
with
in 1
00 fe
et o
f the
cen
terli
ne o
f all
publ
ic &
priv
ate
road
sro
adsc
lippo
lylin
eA
ll la
yers
Dep
icts
all
publ
ic ro
ads i
n M
ered
ith
road
sinh
alf-
mile
buff
erpo
lylin
eA
ll la
yers
Dep
icts
road
s in
1/2
mile
buf
fer o
f Mer
edith
road
smrg
poly
line
Bas
e M
apSh
ows a
ll ro
ads i
n M
ered
ith re
gion
(by
quad
); in
clud
es p
rivat
e ro
ads i
n M
ered
ithro
adsp
rivat
epo
lylin
eA
ll la
yers
Show
s all
priv
ate
road
s in
Mer
edith
(Pla
nnin
g O
ffic
e)sa
nd&
grav
elte
rrac
espo
lygo
nW
ater
Sup
ply
Sele
cts a
ll sa
nd a
nd g
rave
l soi
l typ
es w
ithin
Mer
edith
(NH
DES
200
3)so
ft-de
erpo
lygo
nIn
ters
ectio
nIn
ters
ects
lans
at so
ftwoo
d ty
pes (
softw
oods
clip
.shp)
with
NH
F&G
dee
r yar
ds (d
eer y
ards
.shp)
soft-
deer
-unf
rag
poly
gon
Inte
rsec
tion
Inte
rsec
ts la
nsat
softw
ood
type
s, de
er y
ards
, and
unf
ragm
ente
d la
nds i
n M
ered
ith (u
nfra
gmen
tedl
andc
lip.sh
p)so
ft-de
er-u
nfra
g-pa
rcel
spo
lygo
nIn
ters
ectio
nIn
ters
ects
lans
at so
ftwoo
ds, d
eer y
ards
, unf
ragm
ente
d la
nds,
and
Mer
edith
tax
parc
els
softw
oods
clip
rast
er-b
ased
pol
ygon
Wild
life-
Upl
and
Clip
s lan
sat 2
3 so
ftwoo
ds (s
oftw
oods
mrg
.shp)
to M
ered
ith +
1/2
mile
buf
fer
softw
oods
mrg
rast
er-b
ased
pol
ygon
Wild
life-
Upl
and
Show
s lan
sat s
oftw
ood
type
s (42
3, 4
22, 4
21) f
rom
regi
onal
lans
at m
ap (l
ansa
t lan
d co
ver.s
hp)
soils
map
poly
gon
Soils
NH
DES
200
3 un
valid
ated
soils
map
(cor
rect
ed fr
om 1
977
NR
CS
soils
surv
ey)
stat
elan
dspo
lygo
nC
onse
rvat
ion
Land
Two
stat
e pr
oper
ties a
s der
ive
from
4-0
4 pa
rcel
map
of M
ered
ithst
oney
bro
okpo
lylin
eW
ater
Sup
ply
Show
s API
-adj
uste
d st
ream
alig
nmen
t for
Sto
ney
Bro
ok in
Mer
edith
stre
amsa
llbuf
f10m
rgpo
lygo
nW
ildlif
e-W
etla
nds
Show
s mer
ged
10-f
oot b
uffe
r of a
ll st
ream
s in
Tow
n of
Mer
edith
stre
amsa
llbuf
f200
poly
gon
Wild
life-
Wet
land
sSh
ows 2
00-f
oot b
uffe
r fro
m c
ente
rline
of a
ll st
ream
s in
Mer
edith
stre
ams-
no w
etld
spo
lylin
eSu
rfac
e W
ater
sU
SGS-
deriv
ed st
ream
s (hy
drom
rg) w
ith w
etla
nds d
elet
edst
ream
s-no
wet
-now
auk
poly
line
Surf
ace
Wat
ers
All
API
-der
ived
stre
ams i
n M
ered
ith &
1/2
mile
stud
y ar
ea (n
o w
etla
nds)
stre
ams-
parc
els
poly
gon
Inte
rsec
tion
Inte
rsec
ts 1
0-fo
ot b
uffe
r of d
esig
nate
d st
ream
s in
Mer
edith
(des
igst
ream
buff
10ft.
shp)
with
Mer
edith
tax
parc
els
stre
ams-
uppe
rwau
kpo
lylin
eSu
rfac
e W
ater
sSh
ows A
PI-d
eriv
ed st
ream
s in
uppe
r Wau
kew
an w
ater
shed
(no
wet
land
s)st
ream
s-us
gs-h
alf-
mile
poly
line
Wat
er S
uppl
ySh
ows a
ll U
SGS-
desi
gnat
ed st
ream
s in
half-
mile
ext
ende
d st
udy
area
stre
am-w
etla
ndbu
ff20
0mrg
poly
gon
Inte
rsec
tion
Mer
ges 2
00-f
oot b
uffe
r of a
ll M
ered
ith st
ream
s with
200
-foo
t buf
fer o
f all
API
-der
ived
Mer
edith
wet
land
sst
ream
-wtld
-buf
f200
clip
poly
gon
Inte
rsec
tion
Clip
s abo
ve st
ream
-wet
land
200
-foo
t buf
fer m
erge
to M
ered
ithsu
b-w
ater
shed
s rev
poly
gon
Wat
er S
uppl
yR
evis
ed su
b-w
ater
shed
map
of M
ered
ith su
b-w
ater
shed
s (su
bwat
ersh
eds.s
hp)
subw
ater
shed
spo
lygo
nW
ater
Sup
ply
Subw
ater
shed
s of M
ered
ith a
nd a
djac
ent l
ands
(inc
ludi
ng W
auke
wan
wat
ersh
ed)
Van
de
Pol
l / E
MC
Pag
e A
- 4
Aug
ust 2
005

Mer
edith
NR
I Pro
ject
NA
ME
(.sh
p)Sh
apef
ile T
ype
NR
I Lay
erD
escr
iptio
nsu
bwat
ersh
edsc
lippo
lygo
nW
ater
Sup
ply
Subw
ater
shed
s of M
ered
ith (s
ub-w
ater
shed
s rev
.shp)
clip
ped
to T
own
boun
dary
tow
nbnd
rypo
lygo
nB
ase
Map
Orig
inal
(USG
S 19
87) M
ered
ith to
wn
boun
dary
(unc
orre
cted
)to
wnb
uff2
640
buff
er to
pol
ygon
Bas
e M
apSh
ows 1
/2 m
ile b
uffe
r of u
ncor
rect
ed M
ered
ith to
wn
boun
dary
trans
mis
sivi
ty p
emi
poly
gon
Gro
undw
ater
All
aqui
fers
in lo
wer
Pem
igew
asse
t Riv
er w
ater
shed
(NH
DES
199
2)tra
nsm
issi
vity
win
nipe
sauk
eepo
lygo
nG
roun
dwat
erA
ll aq
uife
rs in
Win
nipe
sauk
ee w
ater
shed
(NH
DES
199
2)tv
c120
0+po
lylin
eW
ildlif
e-U
plan
dC
onta
ins a
ll po
lylin
e co
ntou
rs (t
agge
d ve
ecto
r con
tour
s) a
t or a
bove
120
0 fe
et e
l;eva
tion
in M
ered
ith +
1/2
mile
buf
fer
tvcm
rgpo
lylin
eD
OQ
Vie
wSh
ows a
ll tv
c's fo
r the
qua
ds th
at su
rrou
nd M
ered
ithtv
cmrg
clip
poly
line
DO
Q V
iew
Show
s all
tvc's
for M
ered
ith +
1/2
mile
buf
fer
unfr
ag-c
vapo
lygo
nIn
ters
ectio
nIn
ters
ects
unf
ragm
ente
d la
nds (
unfr
agm
ente
d cl
ip.sh
p) a
nd c
ritic
al v
iew
shed
are
as (p
olyg
ons.s
hp) i
n M
ered
ith +
1/2
nile
buf
fer
unfr
ag-c
va-s
teep
poly
gon
Inte
rsec
tion
Inte
rsec
ts u
nfra
gmen
ted
land
s, cr
itica
l vie
wsh
ed a
reas
, and
stee
p sl
opes
(25%
+ sl
ope.
shp)
in M
ered
ith +
1/2
mile
buf
fer
unfr
ag-h
ydric
poly
gon
Inte
rsec
tion
Inte
rsec
ts u
nfra
gmen
ted
land
s and
hyd
ric so
ils (h
ydric
soil.
shp)
in M
ered
ithun
frag
-hyd
ric-s
oft-d
eer
poly
gon
Inte
rsec
tion
Inte
rsec
ts u
nfra
gmen
ted
land
s, hy
dric
soils
, sof
twoo
d fo
rest
s (so
ftwoo
dclip
.shp)
and
dee
r yar
ds (d
eer y
ards
.shp)
unfr
agm
ente
d la
ndpo
lygo
nW
ildlif
e-U
plan
dSh
ows a
ll ar
eas i
n M
ered
ith >
= 50
0 fe
et fr
om p
ublic
and
priv
ate
road
s (ro
adsi
nhal
fmile
buff
er.sh
p)un
frag
men
tedl
andc
lippo
lygo
nW
ildlif
e-U
plan
dSh
ows a
ll un
frag
men
ted
land
are
as in
Mer
edith
unfr
ag-s
teep
-120
0+po
lygo
nIn
ters
ectio
nIn
ters
ects
unf
ragm
ente
d la
nd, s
teep
slop
es, a
nd la
nds a
bove
120
0 fe
et in
ele
vatio
n in
Mer
edith
unfr
ag-s
teep
-120
0+-p
arce
lspo
lygo
nIn
ters
ectio
nIn
ters
ects
unf
ragm
ente
d al
nds,
stee
p sl
opes
, and
land
s abo
ve 1
200
ft el
evat
ion
and
Mer
edith
tax
parc
els
upla
ndnw
ipo
lygo
nW
etla
nds
Clip
s the
upl
ands
from
the
NW
I map
for M
ered
ith +
1/2
mile
buf
fer
uppe
rwau
kew
annw
ipo
lygo
nW
etla
nds
Show
s all
NW
I wet
land
s in
the
uppe
r Wau
kew
an w
ater
shed
visu
alin
tow
npo
lygo
nV
iew
shed
Clip
s crit
ical
vie
wsh
ed a
reas
to th
e To
wn
of M
ered
ithV
Ppo
int
Vie
wsh
edV
iew
poi
nts f
rom
Mer
edith
Pla
nnin
g O
ffic
e re
port
(Kok
x 20
02)
wat
er-p
arce
lspo
lygo
nIn
ters
ectio
nLi
mit
of p
arce
ls in
Mer
edith
that
con
tain
priv
ate
open
wat
er b
odie
sw
ater
-priv
ate
poly
gon
Inte
rsec
tion
Exte
nt o
f priv
ate
open
wat
er b
odie
s in
Mer
edith
(Pag
e an
d Sw
ain'
s Pon
d)w
ater
-pub
licpo
lygo
nIn
ters
ectio
nEx
tent
of p
ublic
ope
n w
ater
in M
ered
ithw
auke
wan
shed
-aqu
ifers
poly
gon
Gro
undw
ater
Show
s ext
ent o
f USG
S-m
appe
d aq
uife
rs in
Wau
kew
an W
ater
shed
wau
kshe
d-w
hpa4
00bu
ffer
to p
oint
Gro
undw
ater
Show
s 400
-foo
t rad
ius f
rom
eac
h pr
ivat
e w
ell p
oint
in W
auke
wan
Wat
ersh
edw
ells
+400
buff
er to
poi
ntPC
T V
iew
400-
foot
buf
fer t
o al
l pub
lic a
nd p
rivat
e w
ells
In M
ered
ith +
1/2
mile
buf
fer
wel
lsre
gion
alpo
int
PCT
Vie
wPr
ivat
e w
ells
(NH
DES
200
3) in
Lak
es R
egio
nw
etla
ndw
ildlif
ehab
poly
gon
Wild
life-
Wet
land
sM
erge
s 250
-foo
t buf
fer t
o op
en w
ater
, 200
-foo
t buf
fer t
o A
PI w
etla
nds a
nd st
ream
s, an
d 15
-foo
t bat
hym
etry
are
a fo
r Tow
n of
Mer
edith
w
etla
ndw
ildlif
emrg
poly
gon
Wild
life-
Wet
land
sSh
ows w
etla
nd w
ildlif
e ha
bita
t mer
ge in
Mer
edith
+ h
alf-
mile
ext
ende
d st
udy
area
wet
ldbu
ff10
0-pa
rcel
spo
lygo
nIn
ters
ectio
nIn
ters
ects
100
-foo
t buf
fer o
f API
wet
land
s in
Mer
edith
>=
1 ac
re a
nd M
ered
ith ta
x pa
rcel
sw
etld
buff
200-
parc
els
poly
gon
Inte
rsec
tion
Inte
rsec
ts 2
00-f
oot b
uffe
r of a
ll A
PI w
etla
nds i
n M
ered
ith >
= 1
acre
and
Mer
edith
tax
parc
els
whp
a400
-s&
gpo
lygo
nIn
ters
ectio
nIn
ters
ects
400
-foo
t wel
lhea
d pr
otec
tion
area
and
sand
& g
rave
l soi
ls a
reas
in M
ered
ithw
inni
pesa
ukee
mer
edith
poly
gon
Surf
ace
Wat
ers
Show
s ext
ent o
f Lak
e W
inni
pesa
ukee
in M
ered
ith (A
PI c
orre
cted
)
Van
de
Pol
l / E
MC
Pag
e A
- 5
Aug
ust 2
005

Appendix B.
Attribute Assessment Model

Meredith NRI Project APPENDIX B – Attribute Assessment Model
Van de Poll / EMC August 2005 Page B - 1
TOWN OF MEREDITH –ATTRIBUTE ASSESSMENT MODEL
For Use in the NRI Parcel Assessment of Highly-Valued Co-Occurrence Areas
ATTRIBUTE 1 – SIZE
Value range: 1 – 5
Based on: mean, min/max parcel sizes in the Town of Meredith Rationale: larger parcels provide greater potential for protection of
natural resource attributes Point ranks: (1) 0-2 ac. (2) 2-10 ac. (3) 10-50 ac. (4) 50-150 ac. (5) >150 ac
ATTRIBUTE 2 – STATUS / PROXIMITY TO CONSERVATION LAND Based on: A) current status as conservation land; and B) proximity to conservation land Rationale: Conservation land contains greater long-term potential for
protection of natural resources Conservation status is not equal, that is, some lands contain
more stringent restrictions against development Existing conservation status may not be sufficient for long-
term protection of a particular natural resource Close proximity to conservation land allows the parcel to
act as a buffer to the protected area Distance intervals are based on 2003 conservation data
layer from Town of Meredith, and spatial analysis of conservation property distribution in Meredith area
Point ranks: Value range: 1 – 5
(A) Current Status of Parcel
(1) Unprotected – parcel not under any conservation protection (2) Somewhat Protected – parcel under public or private open space
restriction (e.g. current use), but could convert to development in the future

Meredith NRI Project APPENDIX B – Attribute Assessment Model
Van de Poll / EMC August 2005 Page B - 2
(3) Moderately Protected – parcel in public or private trust (e.g. Town Forest or private common land), but does not have permanent development restriction attached to deed
(4) Highly Protected – parcel under some form of restrictive covenant, but can be developed for public or private use (e.g. recreational trails, timber harvest)
(5) Forever Wild – parcel under public or private permanent restriction that prevents purposeful alteration of any natural resources
(B) Proximity of Parcel to Conservation Land
Point ranks: Value range: 1 – 5 (1) > 2 mi. (2) 1.5 – 2 mi. (3) .75 – 1.5 mi. (4) .25 - .75 mi. (5) < .25 mi.
ATTRIBUTE 3 – AGRICULTURAL RESOURCES Based on: prior or existing cropland, pasture land, mowing field,
orchard, or other actively managed agricultural activity in whole or in part on the parcel
Rationale: Agricultural land represents one of the most cherished and
disappearing land uses in Town Agricultural land offers valuable diversity in commercial
enterprises in Town Agricultural land provides a scenic backdrop to a
predominantly wooded landscape Land previously used for farming and cleared of stones has
higher soil potential for future use as agricultural land
Point ranks: Value range: 0 – 5 (0) No known agricultural site present on parcel (1) Agricultural site <25% of the entire parcel, and activity restricted to non-
commercial mowing (2) Agricultural site < 25% of the entire parcel, but activity involves actively
used fields for hay, crops, orchards, or other commercial agricultural activity
(3) Agricultural site >25% of the entire parcel and activity restricted to non-commercial mowing
(4) Agricultural site >25% of the entire parcel and activity involves actively used fields for hay, crops, orchards, or other commercial agricultural activity
(5) Commercial agriculture the predominant land use (i.e. > 50%) of the parcel

Meredith NRI Project APPENDIX B – Attribute Assessment Model
Van de Poll / EMC August 2005 Page B - 3
ATTRIBUTE 4 – SCENIC VALUE
Based on: aesthetic attributes of parcel Rationale: Scenic resources are highly valued in Town Higher value exists on parcels with a diversity of landscape
structure, as well as visual wholeness or integrity Scenic resource assessments have yielded valuable
information about especially scenic areas of Town
Point ranks: Value range: 1 – 5 1) Parcel not easily visible from trail, road, or residence, and not located within
the critical viewshed area 2) Parcel somewhat visible from trail, road, or residence but of ordinary quality,
and without any features that demonstrate variety or integrity (wholeness); or parcel not easily visible from trail, road, or residence and located within the critical viewshed area
3) Parcel easily visible from trail, road, or residence and containing aesthetically pleasing attributes such as brilliant fall foliage, open wetlands, perennial stream or river, dramatic landscapes, remnant historical features, etc.; parcel outside of critical viewshed area
4) Parcel easily visible from trail, road, or residence and containing aesthetically pleasing attributes, and within critical viewshed area (Kokx 2000)
5) Parcel containing or adjacent to highly significant viewpoint (Kokx 2000) ATTRIBUTE 5 – WATER QUALITY
Based on: Presence/absence stratified drift aquifers underneath parcel Presence/absence drinking water supplies Presence/absence known or potential contaminant threats Rationale: Water quality is of paramount importance to the residents
of the Town Parcels that overlie stratified drift aquifers have higher
value as recharge sites for future drinking water supplies Parcels that have current drinking water supplies have
higher natural resource value, with greater value placed on larger yield, public systems
Parcels that have known or potential contaminant threats have less value than those that do not
5A Stratified Drift Aquifers – present or absent, low or medium transmissivity;
based on NHDES aquifer map information

Meredith NRI Project APPENDIX B – Attribute Assessment Model
Van de Poll / EMC August 2005 Page B - 4
Point rank: Value Range 0 – 5 (0) No stratified drift aquifer present beneath the parcel (1) Stratified drift aquifer present, with undeterminable yield (2) Stratified drift aquifer present, of low yield and with fine-grained materials
present (3) Stratified drift aquifer present, of low yield and with fine-grained over coarse-
grained materials present (4) Stratified drift aquifer present, of low yield and with coarse-grained materials
present (5) Stratified drift aquifer present, of medium yield and with coarse-grained
materials present 5B Drinking Water Supply - based on the presence/absence of private or public
wells on the parcel and/or the proximity of the parcel to such well Point rank: Value Range 1 – 5
(1) Parcel without current drinking water supply well and/or > ½ mile from public
drinking water supply well (2) Parcel with private drinking water supply well and > ½ mile from public
drinking water supply well (3) Parcel with private drinking water supply well and < ½ mile from public
drinking water supply well (4) Parcel with or without private well, but within wellhead protection zone (1/4
mile) of public drinking water supply well (5) Parcel contains active, public drinking water supply well 5C Potential Contaminant Threat – present or absent on parcel
Point rank: Value Range –5 - 0 (-5) Parcel with known contaminant threat (-3) Parcel within potential contaminant threat area but without known contaminant threat (0) Parcel without known or potential contaminant threat 5D Lake Waukewan watershed –parcel inside or outside of watershed
Point rank: Value Range 0, 5 (0) parcel not wholly within watershed (5) parcel wholly within watershed

Meredith NRI Project APPENDIX B – Attribute Assessment Model
Van de Poll / EMC August 2005 Page B - 5
ATTRIBUTE 6 – WETLANDS
Based on: Presence/absence wetlands on parcel and total wetland percent of parcel
Number of wetland classes present on parcel Level of protection – i.e. prime wetland, designated, or
undesignated Rationale: Wetlands are of tremendous value in terms of providing
natural resources that are beneficial to humans Wetlands provide value for recharge sites for future drinking water supplies flood storage wildlife habitat educational and scenic resources nutrient and sediment attenuation hunting & fishing water-based recreation shoreline anchoring rare & endangered species Parcels that contain wetlands have higher natural resource
value, with greater value placed on larger, more diverse classes or cover types
Parcels that have protected wetlands have higher value than those without such protection
Parcels that contain upland habitat in the 200-foot buffer zone of wetlands have higher value than those outside of the 200-foot buffer zone (see narrative text)
[Note: wetland values directly associated with wildlife – i.e. wetland buffer zones, are
addressed under wetland wildlife below] 6A Wetland Presence or Absence – present or absent, percent of total parcel that
is in wetland Point rank: Value Range 1 – 5 (1) Parcel does not contain any wetlands (2) Parcel is comprised of less than 25% wetland (3) Parcel is comprised of 25-50% wetland (4) Parcel is comprised of 50-75% wetland (5) Parcel is comprised of >75% wetland 6B Number of Wetland Classes – based on the Cowardin et al. (1979) system of
wetland classification used in the National Wetlands Inventory (NWI); parcel assessment based on revised NWI map from 1998 digital aerial photography (NH GRANIT), soils, and USGS hydrography

Meredith NRI Project APPENDIX B – Attribute Assessment Model
Van de Poll / EMC August 2005 Page B - 6
Point rank: Value Range 0 – 5 (0) Parcel does not contain any wetlands (1) Parcel is comprised of one wetland class (2) Parcel is comprised of 2-3 wetland classes that are not interspersed (3) Parcel is comprised of 2-3 wetland classes that are highly interspersed (4) Parcel is comprised of >3 wetland classes that are not interspersed (5) Parcel is comprised of >3 wetland classes that are highly interspersed 6C Proximity to Wetland Buffer – based on level of regulatory protection on a
municipal level and uniform ecological buffer Point rank: Value Range 0 – 5 (0) Parcel does not contain any wetlands, or is within the 200-foot buffer zone of any wetland (1) Parcel contains one or more undesignated wetlands, or is within the 200-foot
buffer zone of any wetland (2) Parcel contains one or more undesignated wetlands, and is within the 200-foot
buffer zone of a designated wetland (3) Parcel contains one or more designated wetlands, or is within the 200-foot
buffer zone of a prime wetland (4) Parcel contains one or more designated wetlands, and is within the 200-foot
buffer zone of a prime wetland (5) Parcel contains one or more prime wetlands
ATTRIBUTE 7 – SURFACE WATER RESOURCES
Based on: Presence/absence of surface water resources on or adjacent to parcel
Size and position of surface water resources on parcel Level of protection of surface water resources on parcel Rationale: Surface waters are of paramount importance to the
residents of the Town Parcels that contain surface water resources have more
value than those without Parcels that contain larger and/or designated or otherwise
protected surface water resources have more value than smaller surface water resources or those without such protection
7A Surface Water Resources - Streams – based on presence/absence of streams
on parcel, as well as type of stream
Meredith NRI Project APPENDIX B – Attribute Assessment Model
Van de Poll / EMC August 2005 Page B - 7
Point rank: Value Range 0 – 5 (0) No stream or river within or bordering the parcel (1) Parcel only containing intermittent stream or portion of 200-foot buffer area
of any perennial stream (2) Parcel containing undesignated Order 1 stream and all or part of its 200-foot
buffer area (3) Parcel containing Order 2 or 3 stream, or designated Order 1 stream (4) Parcel containing designated Order 2 or 3 stream and <10% (measured
lineally) of its complete 200-foot buffer (5) Parcel containing designated Order 2 or 3 stream and >10% (measured
lineally) of its complete 200-foot buffer [Note: surface water values directly associated with wildlife – i.e. riparian buffer zones,
are addressed under wetland wildlife below]
7B Surface Water Resources – Lakes & Ponds – based on presence/absence of
lake or pond on or adjacent to parcel, as well as size of lake or pond and amount of shorefront in parcel
Point rank: Value Range 0 – 5 (0) No lake or pond within or bordering the parcel (1) Parcel within 100 feet of a pond < 10 acres in size but not bordering such a
pond (2) Parcel within 250 feet of a lake or pond > 10 acres in size but not bordering
such a pond (3) Parcel bordering a pond < 10 acres in size (4) Parcel bordering a lake or pond > 10 acres in size (5) Parcel containing all or most of the shoreline of a small (< 10 acres) pond, or
having shoreline of > 1000 feet on a lake or pond > 10 acres in size [Note: surface water values directly associated with wildlife – i.e. aquatic and shoreline
buffer zones, are addressed under wetland wildlife below] ATTRIBUTE 8 – FOREST COVER
Based on: Presence/absence of forests on the parcel Forest cover type(s) on the parcel (mostly from lansat
imagery, with additional data from aerial photographs) Quality of forest cover on the parcel and ability to produce
timber resources Rationale: Forests are an invaluable resource for long-term
environmental, cultural and socio-economic stability

Meredith NRI Project APPENDIX B – Attribute Assessment Model
Van de Poll / EMC August 2005 Page B - 8
Parcels with a predominance of forest cover have a greater opportunity to contribute to such long-term value
Parcels containing a higher number of forest cover types are more valuable than those with a single forest cover type
Parcels with mature, uncut timber offer a higher value than those that have been cut within the last 25 years.
8A Forest Cover Type Diversity – based on discernible cover type diversity from lansat and aerial photograph data
Point rank: Value Range 0 – 5 (0) No mapped or observable forest present on parcel (1) Parcel with a single forest type (3) Parcel with two forest types (5) Parcel with three or more forest types
8B Forest Cover: Management Status - based on current use status, and level of timber harvest activity as noted in intent-to-cut files, aerial photograph interpretation, or direct knowledge of forest history on property
Point rank: Value Range 0 – 5 (0) No mapped or observable forest present on parcel (1) Parcel not in current use and < 10 acres in size, or has < 10 acres of forest (2) Parcel not in current use, but has > 10 acres of forest that has not been cut in
the last ten years (3) Parcel in current use, but without stewardship plan or active management (4) Parcel in current use, with active stewardship plan, and forest has been
harvested in last 10 years (5) Parcel in current use, with active stewardship plan, and forest has not been
harvested in last 10 years
[Note: forest cover values directly associated with wildlife are addressed under wildlife below]
ATTRIBUTE 9A – WILDLIFE – Open Uplands
Based on: Presence of open land and forested buffers on the parcel Size of open area on or adjacent to the parcel Level of habitat fragmentation on or adjacent to the parcel Rationale: Open land, including agricultural land, old fields,
“gentlemen farms,” abandoned gravel pits, parks &

Meredith NRI Project APPENDIX B – Attribute Assessment Model
Van de Poll / EMC August 2005 Page B - 9
gardens, golf courses, airports, powerlines, and utility rights-of-way, offer unique habitat opportunities for a variety of vertebrate and invertebrate wildlife
Parcels containing undisturbed, forested buffer zones adjacent to open land have higher value than those without such buffers
Active agricultural land with suitable forested buffers has higher value than most other types of open land habitat
Old fields with suitable forested buffers has higher value than active agricultural land
Point rank: Value Range 0 – 5 (0) Parcel contains no open upland habitat (1) Parcel contains < 1 acre of open upland habitat with > 40% forested buffer of
150 feet, or parcel contains > 1 acre of open upland habitat with a forested buffer of < 150 feet along >40% of its edge
(2) Parcel contains < 1 acre of active agricultural land with > 40% forested buffer of 150 feet, or parcel contains > 1 acre of active agricultural land with a forested buffer of < 150 feet along >40% of its edge
(3) Parcel contains > 1 acre of active agricultural land with > 40% of its edge with a buffer of forested land at least 150 feet in width
(4) Parcel contains > 1 acre of old field habitat with > 40% of its edge with a buffer of forested land at least 150 feet in width
(5) Parcel contains 2 or more open upland habitats of > 1 acre each that are well interspersed with forested areas >150 feet wide
ATTRIBUTE 9B – WILDLIFE –Forested Uplands
Based on: Presence/absence of upland forest habitat Diversity of upland forest cover types Presence of mast-producing trees (i.e. oak and beech) Level of forest fragmentation Rationale: Presence of unfragmented, forested uplands provide
essential habitat for a wide variety of wildlife species A higher diversity of upland forest cover types has higher
value than areas with low upland forest cover diversity Forest cover types that have trees that produce hard mast,
such as beechnuts and acorns, have more wildlife value than those without such trees
Point rank: Value Range 0 – 5
(0) Parcel contains < 2.5 acres of upland forest habitat of any type, and is directly
connected to unfragmented forested tracts of < 2.5 acres

Meredith NRI Project APPENDIX B – Attribute Assessment Model
Van de Poll / EMC August 2005 Page B - 10
(1) Parcel contains < 2.5 acres of upland forest habitat of any type, but is directly connected to unfragmented forested tracts of > 2.5 acres
(2) Parcel contains < 2.5 acres of upland forest habitat of beech-oak, and is directly connected to unfragmented forested tracts of > 2.5 acres
(3) Parcel contains > 2.5 acres of upland forest habitat of non-beech-oak forest, and is directly connected to > 2.5 acres of unfragmented, non-beech-oak forest
(4) Parcel has > 2.5 acres of upland forest cover of beech-oak, and is connected to > 2.5 acres of unfragmented, non-beech-oak forest
(5) Parcel has > 2.5 acres of upland forest cover of beech-oak, and is connected to > 2.5 acres of unfragmented, beech-oak forest
ATTRIBUTE 9C – WILDLIFE –Wetlands & Water Bodies
Based on: Presence/absence of wetland & water body habitat Size of wetland or water body habitat Unfragmented upland habitat adjacent to wetland habitat Rationale: Wetlands and water bodies provide a tremendous benefit to
a high diversity of wildlife species in New England Larger wetlands, riparian areas, or shorelines have higher
value than smaller areas of a similar nature Wetlands with unfragmented upland buffers have more
value than wetlands that are surrounded by roads, houses, or other types of development
Point rank: Value Range 0 – 5
(0) Parcel contains no wetland habitat, and lies outside the 200 foot buffer zone of
wetlands or streams, or 250-foot buffer zone of lakes & ponds (1) Parcel contains no wetland habitat, but lies inside the 200 foot buffer zone of
wetlands or streams, or 250-foot buffer zone of lakes & ponds (2) Parcel has < 1 acre of wetland habitat, < 100 lineal feet of perennial stream, or
< 100 feet of pond or lake shoreline (3) Parcel has 1-2 acres of wetland habitat, or 100-500 lineal feet of stream, or
100-500 feet of shoreline on a lake or pond, but is within an area where adjacent upland forests or open lands are fragmented into blocks of < 2.5 acres
(4) Parcel has 1-2 acres of wetland habitat, or 100-500 lineal feet of stream, or 100-500 feet of shoreline on a lake or pond, and contains areas where adjacent upland forests or open lands are > 2.5 acres in size
(5) Parcel has > 2 acres of wetland habitat, or > 500 lineal feet of stream, or > 500 feet of shoreline on a lake or pond, and contains areas where adjacent upland forests or open lands are > 2.5 acres in size

Meredith NRI Project APPENDIX B – Attribute Assessment Model
Van de Poll / EMC August 2005 Page B - 11
ATTRIBUTE 10 – RARE & ENDANGERED SPECIES, EXEMPLARY NATURAL COMMUNITIES
Based on: Presence/absence of rare or endangered species as
determined from NH Natural Heritage Bureau data Presence/absence of exemplary natural communities Level of threat or endangerment Rationale: Rare and endangered species represent the most critically
imperiled types of biodiversity High biodiversity implies greater stability in almost all
ecosystem types, and often reflects an absence of human disturbance over time
Exemplary natural communities with high quality examples of plants, animals and their natural habitats are more valuable than low quality or significantly disturbed natural habitats
Long-term survival of the human species is predicated on functional ecosystems
Point rank: Value Range 0 – 5
(0) No known or documented rare and endangered species or exemplary natural
community is present on the parcel (1) No documented rare or endangered species or exemplary natural community
is recorded, but habitat and/or anecdotal evidence suggests one or more is present on the parcel
(2) Documented state-listed special concern species or natural community is present on the parcel
(3) Documented state-listed threatened species or natural community is present on the parcel
(4) Documented state-listed endangered species or natural community is present on the parcel
(5) Documented federally-listed threatened or endangered species is present on the parcel
[Note: Due to the sensitivity of rare & endangered species, no maps have or will
be provided to the general public of this resource]
ATTRIBUTE 11 – SPECIAL NATURAL RESOURCE FEATURES
Based on: Presence/absence of special natural resource features with significant conservation value, such as: open cliffs talus slopes steep south-facing slopes dense softwood stands

Meredith NRI Project APPENDIX B – Attribute Assessment Model
Van de Poll / EMC August 2005 Page B - 12
caves quarries & mines special geomorphological features
The number and quality of such features Rationale: Special natural resource features enrich the ecological
and/or cultural fabric of a Town Historical, educational, and/or scenic value are often
attributed to these features
Point rank: Value Range 0 – 5 (0) No known special features present on parcel (1) 1 special natural resource feature present (3) 2 or more special natural resource features present (5) 2 or more special natural resource features, and at least one of especial public
value ATTRIBUTE 12 – ACCESS & FRAGMENTATION
Based on: Current or potential accessibility by pedestrian and/or
motorized traffic Level of parcel fragmentation by roads or development Rationale: Parcels accessible by trails or byways have greater potential
for use by the general public than parcels that are land-locked Parcels fragmented by Class I, II, III or IV roads have less value than those not so fragmented
Parcels that are farther from residential development have higher value for wildlife than those that occur within such development
Parcels that are farther from residential development have higher value for wildlife than those that occur within such development
12A Access – based on accessibility of parcel to the public Point rank: Value Range 1 – 5 (1) Parcel landlocked and inaccessible by public (2) Parcel occurs along a roadside but is posted or otherwise inaccessible by the
public (3) Parcel has roadside access, is not posted, but is owned privately (4) Parcel has roadside access, is not posted, is owned publicly, but does not have
defined trails for the purpose of public recreation

Meredith NRI Project APPENDIX B – Attribute Assessment Model
Van de Poll / EMC August 2005 Page B - 13
(5) Parcel has roadside access, is owned publicly, and has defined trails for the purpose of public recreation
12B Fragmentation – based on fragmentation of parcel by roads Point rank: Value Range 1 – 5 (1) Parcel < 2.5 acres and fragmented (including bordered) by Class II or III road (2) Parcel > 2.5 acres but fragmented (including bordered) by Class II or III road (3) Parcel < 2.5 acres and fragmented (including bordered) by Class IV or V road (4) Parcel > 2.5 acres and fragmented (including bordered) by Class IV or V road (5) Parcel > 2.5 acres, but landlocked and unfragmented
ATTRIBUTE 13 - LEVEL OF HUMAN ACTIVITY
Based on: Current condition relative to natural community structure
Presence/absence of trash, garbage, or other visual human-caused detractors
Rationale: Parcels with greater amounts of visible human activity are
less valuable than those with little to no visible human activity
Ecological processes that provide long-term ecosystem stability have greater functionality in undisturbed versus disturbed habitats
Point rank: Value Range 1 – 5 1) High level of human activity visible – many trails, roads, trash, OR < 20% of
the parcel bordered by undisturbed upland and/or wetland habitat 2) Moderate level of human activity visible – some trails, roads, trash, OR 20 -
80% of the parcel bordered by undisturbed upland and/or wetland habitat 3) Low level of human activity visible – few trails, roads, trash, OR > 80% of the
parcel bordered by undisturbed upland and/or wetland habitat 4) Minimal level of human activity visible – few if any trails, roads, trash visible,
AND > 80% of the parcel bordered by undisturbed upland and/or wetland habitat
5) Parcel unfragmented and lacking any sign of human activity

Appendix C
National Wetlands Inventory (NWI) Wetland Classes List
(including water regime & special modifiers)

Meredith NRI Project
Van de Poll / EMC Page C - 1 August 2005
WETLANDS AND DEEPWATER HABITATS CLASSIFICATION (from Cowardin et al. 1979)
SYSTEM SUBSYSTEM CLASS SUBCLASS |- RB=Rock Bottom 1=Bedrock | 2=Rubble | |- UB=Unconsolidated Bottom 1=Cobble-Gravel | 2=Sand | 3=Mud | 4=Organic | |-- 1=SUBTIDAL----|- AB=Aquatic Bed 1=Algal | | 3=Rooted Vascular | | 5=Unknown | | Submergent | | | |- RF=Reef 1=Coral | | 3=Worm | | | |- OW=Open Water/Unknown Bottom (used on older | maps) M=MARINE--------| | | |- AB=Aquatic Bed 1=Algal | | 3=Rooted Vascular | | 5=Unknown | | Submergent | | | |- RF=Reef 1=Coral |-- 2=INTERTIDAL--| 3=Worm | |- RS=Rocky Shore 1=Bedrock | 2=Rubble | |- US=Unconsolidated Shore 1=Cobble-Gravel 2=Sand 3=Mud 4=Organic |- RB=Rock Bottom 1=Bedrock | 2=Rubble | |- UB=Unconsolidated Bottom 1=Cobble-Gravel | 2=Sand | 3=Mud | 4=Organic E=ESTUARINE-----| | |-- 1=SUBTIDAL----|- AB=Aquatic Bed 1=Algal | | 3=Rooted Vascular | | 4=Floating | | Vascular | | 5=Unknown | | Submergent | | 6=Unknown Surface | |- RF=Reef 2=Mollusc

Meredith NRI Project
Van de Poll / EMC Page C - 2 August 2005
| | 3=Worm | |- OW=Open Water/Unknown Bottom (used on older E=ESTUARINE-----| | |- AB=Aquatic Bed 1=Algal | | 3=Rooted Vascular | | 4=Floating | | Vascular | | 5=Unknown | | Submergent | | 6=Unknown Surface | | | |- RF=Reef 2=Mollusc | | 3=Worm | | | |- SB=Streambed 3=Cobble-Gravel | | 4=Sand | | 5=Mud | | 6=Organic | | | |- RS=Rocky Shore 1=Bedrock | | 2=Rubble | | |-- 2=INTERTIDAL--|- US=Unconsolidated Shore 1=Cobble-Gravel | 2=Sand | 3=Mud | 4=Organic | |- EM=Emergent 1=Persistent | 2=Nonpersistent | |- SS=Scrub-Shrub 1=Broad-Leaved | Deciduous | 2=Needle-Leaved | Deciduous | 3=Broad-Leaved | Evergreen | 4=Needle-Leaved | Evergreen | 5=Dead | 6=Indeterminate | Deciduous | 7=Indeterminate | Evergreen | |- FO=Forested 1=Broad-Leaved Deciduous 2=Needle-Leaved Deciduous 3=Broad-Leaved Evergreen 4=Needle-Leaved Evergreen 5=Dead 6=Indeterminate Deciduous 7=Indeterminate Evergreen

Meredith NRI Project
Van de Poll / EMC Page C - 3 August 2005
SYSTEM SUBSYSTEM CLASS SUBCLASS |- RB=Rock Bottom 1=Bedrock | 2=Rubble | |- UB=Unconsolidated Bottom 1=Cobble-Gravel | 2=Sand |--1=TIDAL--------| 3=Mud | | 4=Organic | | | |-*SB=Streambed 1=Bedrock | | 2=Rubble | | 3=Cobble-Gravel |--2=LOWER | 4=Sand | PERENNIAL----| 5=Mud | | 6=Organic | | 7=Vegetated | | | |- AB=Aquatic Bed 1=Algal R=RIVERINE------|--3=UPPER | 2=Aquatic Moss | PERENNIAL----| 3=Rooted Vascular | | 4=Floating | | Vascular | | 5=Unknown | | Submergent |--4=INTERMITTENT-| 6=Unknown Surface | | | |- RS=Rocky Shore 1=Bedrock | | 2=Rubble | | | |- US=Unconsolidated Shore 1=Cobble-Gravel |--5=UNKNOWN | 2=Sand | PERENNIAL----| 3=Mud (used on older | 4=Organic maps) | 5=Vegetated | |-**EM=Emergent 2=Nonpersistent | |- OW=Open Water/Unknown Bottom (used on older | maps) |-*STREAMBED is limited to TIDAL and | INTERMITTENT SUBSYSTEMS, and comprises | the only CLASS in the INTERMITTENT SUBSYSTEM. | |-**EMERGENT is limited to TIDAL and LOWER | PERENNIAL SUBSYSTEMS.

Meredith NRI Project
Van de Poll / EMC Page C - 4 August 2005
SYSTEM SUBSYSTEM CLASS SUBCLASS |- RB=Rock Bottom 1=Bedrock | 2=Rubble | |- UB=Unconsolidated Bottom 1=Cobble-Gravel | 2=Sand | 3=Mud | 4=Organic | |-- 1=LIMNETIC----|- AB=Aquatic Bed 1=Algal | | 2=Aquatic Moss | | 3=Rooted Vascular | | 4=Floating | | Vascular | | 5=Unknown | | Submergent | | 6=Unknown Surface | | | |- OW=Open Water/Unknown Bottom (used on older | maps) L=LACUSTRINE----| | | | |- RB=Rock Bottom 1=Bedrock | | 2=Rubble | | | |- UB=Unconsolidated Bottom 1=Cobble-Gravel | | 2=Sand | | 3=Mud | | 4=Organic | | | |- AB=Aquatic Bed 1=Algal | | 2=Aquatic Moss | | 3=Rooted Vascular | | 4=Floating |-- 2=LITTORAL----| Vascular | 5=Unknown | Submergent | 6=Unknown Surface | |- RS=Rocky Shore 1=Bedrock | 2=Rubble | |- US=Unconsolidated Shore 1=Cobble-Gravel | 2=Sand | 3=Mud | 4=Organic | 5=Vegetated | |- EM=Emergent 2=Nonpersistent | |- OW=Open Water/Unknown Bottom (used on older maps)

Meredith NRI Project
Van de Poll / EMC Page C - 5 August 2005
SYSTEM SUBSYSTEM CLASS SUBCLASS |- RB=Rock Bottom 1=Bedrock | 2=Rubble | |- UB=Unconsolidated Bottom 1=Cobble-Gravel | 2=Sand | 3=Mud | 4=Organic | |- AB=Aquatic Bed 1=Algal | 2=Aquatic Moss | 3=Rooted Vascular | 4=Floating | Vascular | 5=Unknown | Submergent | 6=Unknown Surface | |- US=Unconsolidated Shore 1=Cobble-Gravel | 2=Sand | 3=Mud | 4=Organic | 5=Vegetated | |- ML=Moss-Lichen 1=Moss | 2=Lichen | P=PALUSTRINE----------------------|- EM=Emergent 1=Persistent | 2=Nonpersistent | |- SS=Scrub-Shrub 1=Broad-Leaved | Deciduous | 2=Needle-Leaved | Deciduous | 3=Broad-Leaved | Evergreen | 4=Needle-Leaved | Evergreen | 5=Dead | 6=Indeterminate | Deciduous | 7=Indeterminate | Evergreen | |- FO=Forested 1=Broad-Leaved | Deciduous | 2=Needle-Leaved | Deciduous | 3=Broad-Leaved | Evergreen | 4=Needle-Leaved | Evergreen | 5=Dead | 6=Indeterminate | Deciduous | 7=Indeterminate

Meredith NRI Project
Van de Poll / EMC Page C - 6 August 2005
| Evergreen | |- OW=Open Water/Unknown Bottom (used on older maps) MODIFIERS |- A=Temporarily Flooded |- B=Saturated |- C=Seasonally Flooded |- D=Seasonally Flooded/Well Drained |- E=Seasonally Flooded/Saturated |- F=Semipermanently Flooded |--Non-Tidal------|- G=Intermittently Exposed | |- H=Permanently Flooded | |- J=Intermittently Flooded | |- K=Artificially Flooded | |- W=Intermittently Flooded/Temporary (used on | | older maps) | |- Y=Saturated/Semipermanent/Seasonal (used on | | older maps) | |- Z=Intermittently Exposed/Permanent (used on | | older maps) WATER REGIME----| |- U=Unknown | | | | | |- K=Artificially Flooded | |- L=Subtidal | |- M=Irregularly Exposed | |- N=Regularly Flooded |--Tidal----------|- P=Irregularly Flooded |-*S=Temporary-Tidal |-*R=Seasonal-Tidal |-*T=Semipermanent-Tidal |-*V=Permanent-Tidal |- U=Unknown | |-*These water regimes are only used in | tidally influenced, freshwater systems.

Meredith NRI Project
Van de Poll / EMC Page C - 7 August 2005
|- 1=Hyperhaline |- 2=Euhaline |--Coastal |- 3=Mixohaline (Brackish) | Halinity-------|- 4-Polyhaline | |- 5=Mesohaline | |- 6=Oligohaline | |- 0=Fresh | | | WATER CHEMISTRY-| | |- 7=Hypersaline |--Inland |- 8=Eusaline | Salinity-------|- 9=Mixosaline | |- 0=Fresh | | | | |--pH Modifiers |- a=Acid for all |- t=Circumneutral Fresh Water----|- i=Alkaline SOIL------------------------------|- g=Organic |- n=Mineral |- b=Beaver |- d=Partially Drained/Ditched SPECIAL MODIFIERS-----------------|- f=Farmed |- h=Diked/Impounded |- r=Artificial Substrate |- s=Spoil |- x=Excavated U = Uplands