Redirecting to http www cakecentral com angelina jolie nude in hd ...
Upload
mark-daminCategory
view
198download
7
EX-99.(C)(3) 4 a11-4882_1ex99dc3.htm EX-99.(C)(3) Exhibit (c)(3)
Virgin Media Limited Fair Market Value of a 66.7 Percent Equity Interest in ntl (South Hertfordshire) Limited As of September 30, 2010 Report issued: November 24, 2010
Page 1 of 76
11/04/2011http://www.sec.gov/Archives/edgar/data/857957/000110465911004017/a11-4882_1ex99dc3.htm
November 24, 2010
Re: Fair Market Value of a 66.7 Percent Equity Interest in ntl (South Hertfordshire) Limited Dear Mr. Khan: As requested by Virgin Media Limited and ntl Fawnspring Limited, the General Partner of South Hertfordshire UK Fund Ltd, we have estimated the fair market value of the South Hertfordshire UK Fund Ltd’s 66.7 percent equity interest in the ordinary shares of ntl (South Hertfordshire) Limited, as of September 30, 2010. It is our understanding that management may use this valuation of fair market value for a potential acquisition of South Hertfordshire UK Fund Ltd’s 66.7 percent interest in ntl (South Hertfordshire) Limited pursuant to provisions in the Partnership Agreement. Our analysis, conclusions and calculations are in conformity with the Statement on Standards for Valuation Services No. 1 (“SSVS 1”) of the American Institute of Certified Public Accountants and are invalid if used for any purpose or any valuation date other than that stated here. For purposes of this appraisal, fair market value is defined as: the price, expressed in terms of cash equivalents, at which property would change hands between a hypothetical willing and able buyer and a hypothetical willing and able seller, acting at arm’s length in an open and unrestricted market, when neither is under compulsion to buy or sell and when both have reasonable knowledge of the relevant facts.(1) A going concern premise of value was utilized in this valuation assignment. Our investigation included an analysis of the available information, including historical financial statements, prospective financial information, indications of the potential market value of ntl South Hertfordshire, discussions with management concerning the history and nature of the business, and a study of the economic status and prospects of the business. We determined the Company’s equity value utilizing a combination of the income approach and the market approach. The Company’s equity value, on a control, marketable basis, was estimated to be £16,936,000 (under the discounted cash flow (“DCF”) method), £22,956,000 (under the guideline public company method), and £25,775,000 (under the guideline transaction method).
(1) The International Glossary of Business Valuation. Chartered Accountants A US member firm of Grant Thornton International Limited
Mr. Shuja Khan Audit - Tax - Advisory Strategy Director - Corporate Strategy
Virgin Media Limited Grant Thornton LLP Media House, Bartley Wood Business Park 520 Pike Street, Suite 2800 Hook, Hampshire RG27 9UP Seattle, WA 98101-1389
T 206.623.1121
F 206.223.4774
www.GrantThornton.com
Page 2 of 76
11/04/2011http://www.sec.gov/Archives/edgar/data/857957/000110465911004017/a11-4882_1ex99dc3.htm

Based on a number of factors, as discussed more fully in the attached report, we determined the fair market value of ntl South Hertfordshire’s equity on a control, marketable basis, before a discount for lack of marketability, to be £20,651,000. Based on the analyses and factors discussed in the attached report, it is our opinion that a 6.5 percent lack of marketability discount for a six-month holding period is reasonable for a controlling interest in ntl South Hertfordshire’s ordinary shares. Therefore, based upon the information and financial data provided and management representations received, as well as the analyses performed, summarized and discussed in the attached report, the fair market value of a controlling, 66.7 percent equity interest in ntl (South Hertfordshire) Limited, for potential acquisition purposes, as of September 30, 2010, is £12,879,000 (or US $20,260,000 at the spot rate of $1.5731 per GBP £). The conclusions and opinions expressed in this letter and the attached report are contingent upon the qualifying factors set forth in the Assumptions and Limiting Conditions attached to this completed report. A copy of the completed calculation report and the working papers from which it was prepared will be retained in our files and will be available for review upon request. If you have any questions concerning this report and the valuation it contains, please contact Neil J. Beaton at 206.398.2487 or Brent E. Sloan at 206.398.2478. Respectfully Submitted,
© Grant Thornton LLP. All rights reserved.
Neil J. Beaton, CPA/ABV/CFF, CFA, ASA Brent E. Sloan, ASA Partner in Charge, Advisory Services Senior Manager, Advisory Services
Page 3 of 76
11/04/2011http://www.sec.gov/Archives/edgar/data/857957/000110465911004017/a11-4882_1ex99dc3.htm

FAIR MARKET VALUE OF A 66.7 PERCENT EQUITY INTEREST
IN THE ORDINARY SHARES OF
NTL (SOUTH HERTFORDSHIRE) LIMITED
As of
September 30, 2010
Grant Thornton LLP
Advisory Services – Valuation © Grant Thornton LLP. All rights reserved.
Page 4 of 76
11/04/2011http://www.sec.gov/Archives/edgar/data/857957/000110465911004017/a11-4882_1ex99dc3.htm
Contents
Page
Engagement Overview 3
PURPOSE OF ENGAGEMENT 3SOURCES OF INFORMATION 3
Company Overview 4BRIEF COMPANY DESCRIPTION 4COMPETITION 7FINANCIAL STATEMENT ANALYSIS 8
Valuation Methodology 13SELECTION OF APPROACH 13VALUATION ANALYSIS 14DISCOUNT FOR LACK OF MARKETABILITY 22
Conclusion of Value 28 Appraiser Representation/Certification 29 Assumptions and Limiting Conditions 33 Addenda 36
Page 5 of 76
11/04/2011http://www.sec.gov/Archives/edgar/data/857957/000110465911004017/a11-4882_1ex99dc3.htm
Virgin Media Limited Fair Market Value of a 66.7 Percent Equity Interest in ntl (South Hertfordshire) Limited Engagement Overview PURPOSE OF ENGAGEMENT Grant Thornton LLP was engaged by Virgin Media Limited (hereinafter referred to as “Virgin Media”) and ntl Fawnspring Limited, the General Partner (“General Partner”) of South Hertfordshire UK Fund Ltd (“Partnership”) to estimate the fair market value of the Partnership’s 66.7 percent equity interest in the ordinary shares of ntl (South Hertfordshire) Limited (“ntl South Hertfordshire” or the “Company”), as of September 30, 2010. It is our understanding that management may use this valuation of fair market value for a potential acquisition of the Partnership’s 66.7 percent interest in the Company pursuant to provisions in the Partnership Agreement. Our analysis, conclusions and calculations are in conformity with the Statement on Standards for Valuation Services No. 1 (“SSVS 1”) of the American Institute of Certified Public Accountants and are invalid if used for any purpose or any valuation date other than that stated here. For purposes of this valuation, fair market value is defined as: the price, expressed in terms of cash equivalents, at which property would change hands between a hypothetical willing and able buyer and a hypothetical willing and able seller, acting at arm’s length in an open and unrestricted market, when neither is under compulsion to buy or sell and when both have reasonable knowledge of the relevant facts.(1) A going concern premise of value was utilized in this valuation assignment. SOURCES OF INFORMATION Information was principally obtained through discussions with Virgin Media regarding recent developments in the business; a review of historical financial statements and other relevant Company documents; and by conducting outside research. Historical financial statements and other pertinent information provided by Virgin Media and the Company have been accepted without further verification as correctly reflecting the results of operations and the financial and business conditions of the Company for the respective periods. As a basis for our valuation, we relied on various financial sources, including the Capital IQ database from Standard & Poor’s, Morningstar’s (formerly Ibbotson Associates) Stocks, Bonds, Bills and Inflation 2010, and other published financial and economic data mentioned in this report. Public information and industry and statistical information have been obtained from sources we believe to be reliable. However, we make no representation as to the accuracy or completeness of such information and have performed no procedures to corroborate the information.
(1) The International Glossary of Business Valuation. 3
Page 6 of 76
11/04/2011http://www.sec.gov/Archives/edgar/data/857957/000110465911004017/a11-4882_1ex99dc3.htm
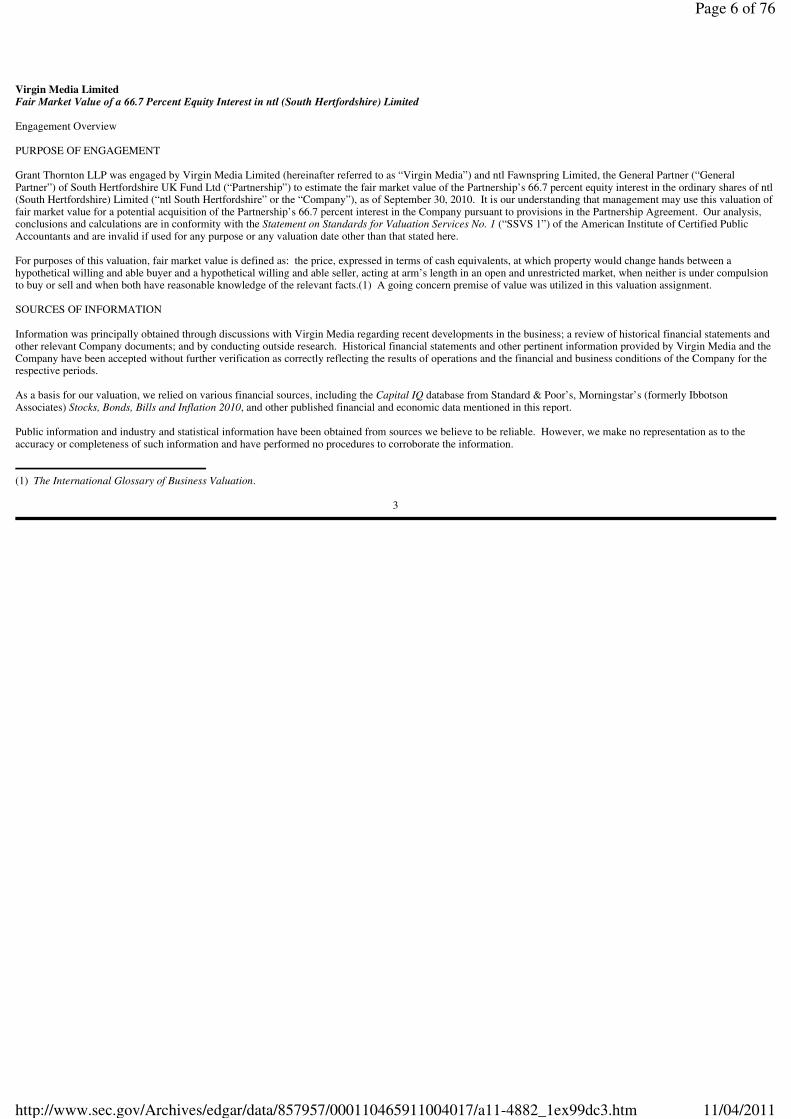
Company Overview BRIEF COMPANY DESCRIPTION ntl (South Hertfordshire) Limited, incorporated in England and Wales, is principally engaged in the development, construction, management and operation of broadband communications networks for telephone, cable television and Internet services in the United Kingdom (“UK”). The areas highlighted on the map below distinguish the approximate franchise area where cable television and fixed line telephony services are available in the East of England region, specifically the non-metropolitan districts of Three Rivers, Watford and Hertsmere, which are primarily residential commuter areas north of the City of London.
4
Page 7 of 76
11/04/2011http://www.sec.gov/Archives/edgar/data/857957/000110465911004017/a11-4882_1ex99dc3.htm
As of the quarterly period ended September 30, 2010, the Company served 34,829 customers, consisting of 28,103 digital television (“DTV”), 29,163 broadband and Internet and 30,539 fixed line telephony subscribers, totaling 87,805 revenue-generating units (“RGUs”) throughout its service area, which passes 96,000 marketable homes and 7,000 marketable businesses. ntl South Hertfordshire sells its cable video programming, high-speed data and fixed line telephony services primarily on a subscription basis, often in a bundle of two or more services, providing savings and convenience to its customers. As of the quarterly period ended June 30, 2010 (latest available), approximately 86.6 percent of the Company’s customers subscribed to more than one service (commonly referred to as “double-play” for two services and “triple-play” for three services”: 22.2 percent double-play and 64.4 percent triple-play. ntl South Hertfordshire’s network utilizes the hybrid fiber coaxial cable (“HFC”) architecture, which combines the use of fiber optic cable with coaxial cable. Throughout the Company’s system, signals are delivered via fiber optic cable from the headend to a group of nodes, and coaxial cable is used to deliver the signal from individual nodes to the homes passed served by that node. The design provides two-way signal capacity for the addition of future services. ntl South Hertfordshire’s local network is interconnected to a national transport backbone within the consolidated operations of Virgin Media, enabling efficient and timely transport of Internet traffic, voice traffic, and high definition video content distribution. While the Company owns the local cable infrastructure, it is not a stand-alone business as its network is totally integrated with Virgin Media. The Company’s customers procure services through Virgin Media and under the Virgin Media name, and the Company is totally dependent on Virgin Media for its technology infrastructure, telecommunications backbone, cable television content, marketing and billing services, customer and technical support, financing, and back office services. Partnership Agreement The South Hertfordshire UK Fund Ltd (“Partnership”) was formed December 31, 1991 by ntl Fawnspring Limited, a wholly-owned, indirect subsidiary of Virgin Media, and approximately 5,000 U.S.-based limited partners (collectively referred to as the “Limited Partners”). A summary of significant provisions of the Limited Partnership Agreement (the “Partnership Agreement”) follows. Management Pursuant to Section 2.1 of the Partnership Agreement, the General Partner shall have complete and unrestricted power and authority to manage the business, properties and activities of the Partnership in its sole exclusive discretion. Term Pursuant to Section 1.5 of the Partnership Agreement, the term of the Partnership is due to expire on December 23, 2016 (“Expiration Date”), the 25 anniversary of the formation of the Partnership, at which point it would be dissolved and the Limited Partners would be entitled to receive their share of the value of the Partnership’s assets once all outstanding liabilities have been settled.
5
th
Page 8 of 76
11/04/2011http://www.sec.gov/Archives/edgar/data/857957/000110465911004017/a11-4882_1ex99dc3.htm
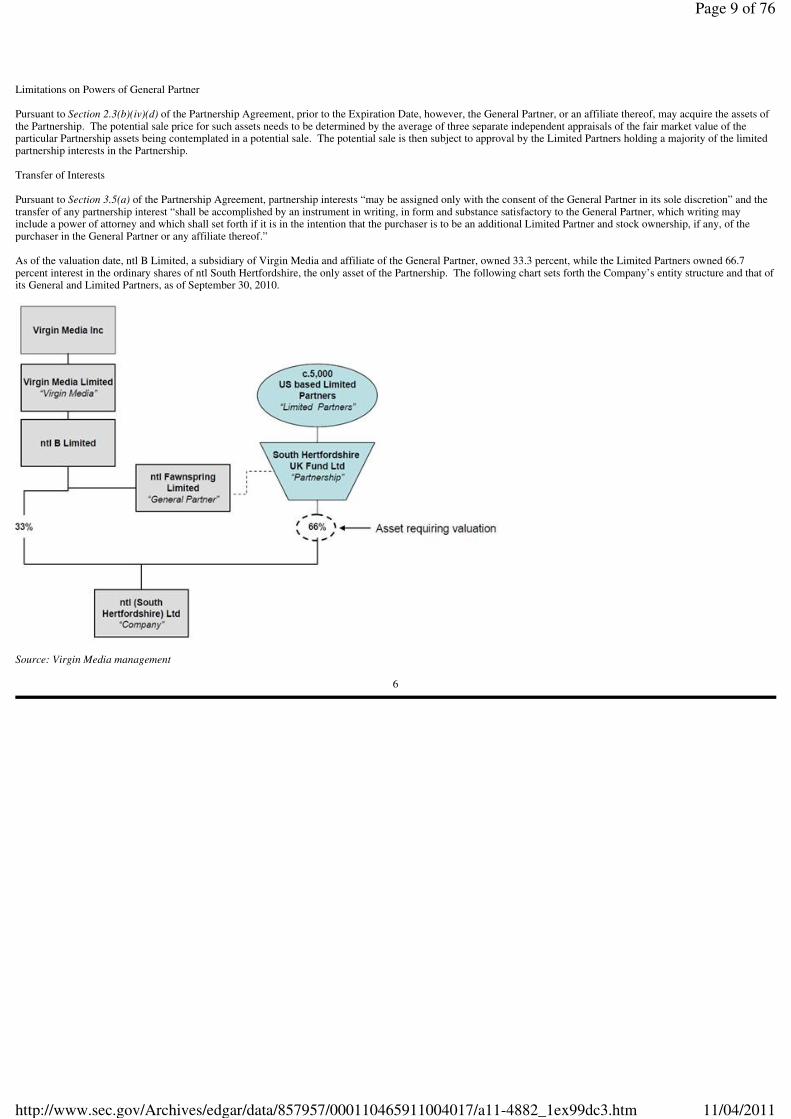
Limitations on Powers of General Partner Pursuant to Section 2.3(b)(iv)(d) of the Partnership Agreement, prior to the Expiration Date, however, the General Partner, or an affiliate thereof, may acquire the assets of the Partnership. The potential sale price for such assets needs to be determined by the average of three separate independent appraisals of the fair market value of the particular Partnership assets being contemplated in a potential sale. The potential sale is then subject to approval by the Limited Partners holding a majority of the limited partnership interests in the Partnership. Transfer of Interests Pursuant to Section 3.5(a) of the Partnership Agreement, partnership interests “may be assigned only with the consent of the General Partner in its sole discretion” and the transfer of any partnership interest “shall be accomplished by an instrument in writing, in form and substance satisfactory to the General Partner, which writing may include a power of attorney and which shall set forth if it is in the intention that the purchaser is to be an additional Limited Partner and stock ownership, if any, of the purchaser in the General Partner or any affiliate thereof.” As of the valuation date, ntl B Limited, a subsidiary of Virgin Media and affiliate of the General Partner, owned 33.3 percent, while the Limited Partners owned 66.7 percent interest in the ordinary shares of ntl South Hertfordshire, the only asset of the Partnership. The following chart sets forth the Company’s entity structure and that of its General and Limited Partners, as of September 30, 2010.
Source: Virgin Media management
6
Page 9 of 76
11/04/2011http://www.sec.gov/Archives/edgar/data/857957/000110465911004017/a11-4882_1ex99dc3.htm
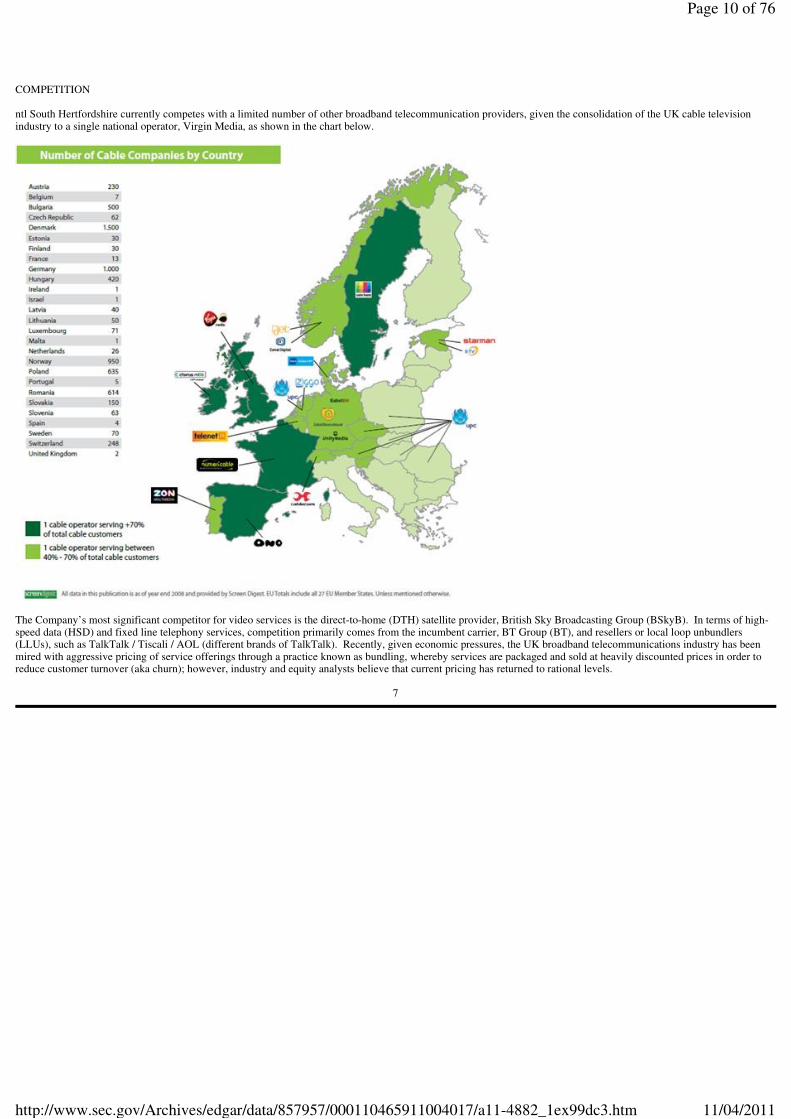
COMPETITION ntl South Hertfordshire currently competes with a limited number of other broadband telecommunication providers, given the consolidation of the UK cable television industry to a single national operator, Virgin Media, as shown in the chart below.
The Company’s most significant competitor for video services is the direct-to-home (DTH) satellite provider, British Sky Broadcasting Group (BSkyB). In terms of high-speed data (HSD) and fixed line telephony services, competition primarily comes from the incumbent carrier, BT Group (BT), and resellers or local loop unbundlers (LLUs), such as TalkTalk / Tiscali / AOL (different brands of TalkTalk). Recently, given economic pressures, the UK broadband telecommunications industry has been mired with aggressive pricing of service offerings through a practice known as bundling, whereby services are packaged and sold at heavily discounted prices in order to reduce customer turnover (aka churn); however, industry and equity analysts believe that current pricing has returned to rational levels.
7
Page 10 of 76
11/04/2011http://www.sec.gov/Archives/edgar/data/857957/000110465911004017/a11-4882_1ex99dc3.htm
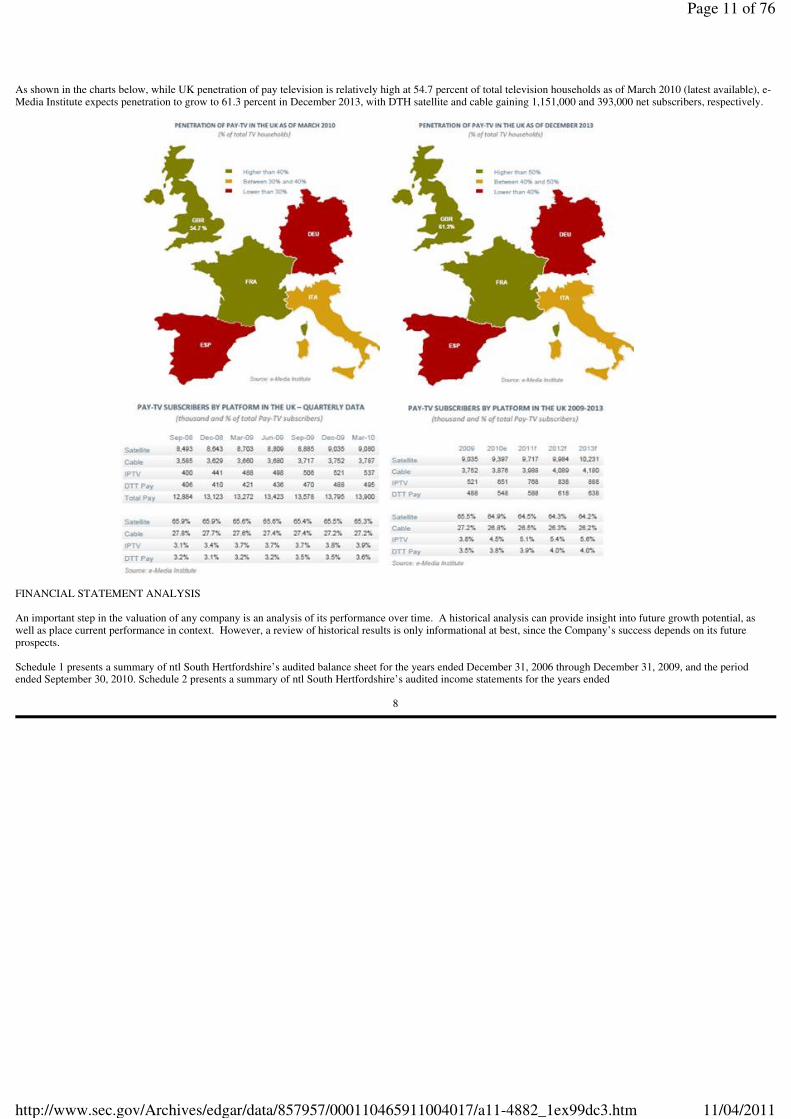
As shown in the charts below, while UK penetration of pay television is relatively high at 54.7 percent of total television households as of March 2010 (latest available), e-Media Institute expects penetration to grow to 61.3 percent in December 2013, with DTH satellite and cable gaining 1,151,000 and 393,000 net subscribers, respectively.
FINANCIAL STATEMENT ANALYSIS An important step in the valuation of any company is an analysis of its performance over time. A historical analysis can provide insight into future growth potential, as well as place current performance in context. However, a review of historical results is only informational at best, since the Company’s success depends on its future prospects. Schedule 1 presents a summary of ntl South Hertfordshire’s audited balance sheet for the years ended December 31, 2006 through December 31, 2009, and the period ended September 30, 2010. Schedule 2 presents a summary of ntl South Hertfordshire’s audited income statements for the years ended
8
Page 11 of 76
11/04/2011http://www.sec.gov/Archives/edgar/data/857957/000110465911004017/a11-4882_1ex99dc3.htm
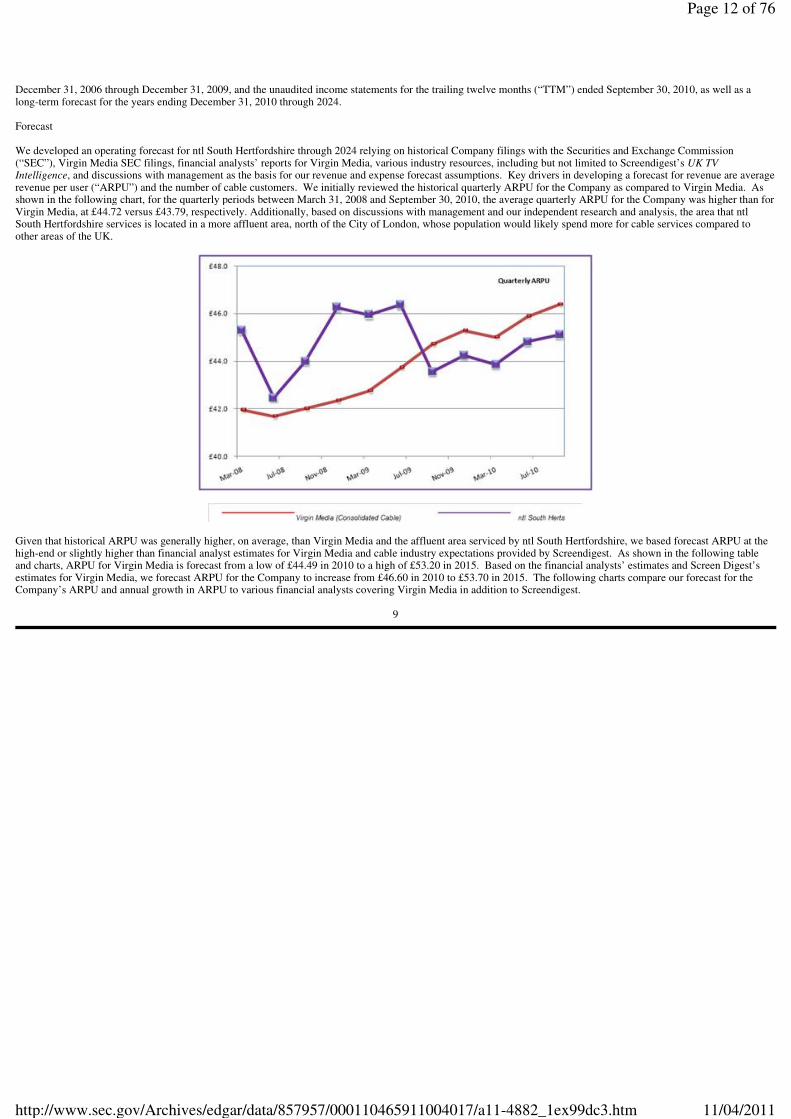
December 31, 2006 through December 31, 2009, and the unaudited income statements for the trailing twelve months (“TTM”) ended September 30, 2010, as well as a long-term forecast for the years ending December 31, 2010 through 2024. Forecast We developed an operating forecast for ntl South Hertfordshire through 2024 relying on historical Company filings with the Securities and Exchange Commission (“SEC”), Virgin Media SEC filings, financial analysts’ reports for Virgin Media, various industry resources, including but not limited to Screendigest’s UK TV Intelligence, and discussions with management as the basis for our revenue and expense forecast assumptions. Key drivers in developing a forecast for revenue are average revenue per user (“ARPU”) and the number of cable customers. We initially reviewed the historical quarterly ARPU for the Company as compared to Virgin Media. As shown in the following chart, for the quarterly periods between March 31, 2008 and September 30, 2010, the average quarterly ARPU for the Company was higher than for Virgin Media, at £44.72 versus £43.79, respectively. Additionally, based on discussions with management and our independent research and analysis, the area that ntl South Hertfordshire services is located in a more affluent area, north of the City of London, whose population would likely spend more for cable services compared to other areas of the UK.
Given that historical ARPU was generally higher, on average, than Virgin Media and the affluent area serviced by ntl South Hertfordshire, we based forecast ARPU at the high-end or slightly higher than financial analyst estimates for Virgin Media and cable industry expectations provided by Screendigest. As shown in the following table and charts, ARPU for Virgin Media is forecast from a low of £44.49 in 2010 to a high of £53.20 in 2015. Based on the financial analysts’ estimates and Screen Digest’s estimates for Virgin Media, we forecast ARPU for the Company to increase from £46.60 in 2010 to £53.70 in 2015. The following charts compare our forecast for the Company’s ARPU and annual growth in ARPU to various financial analysts covering Virgin Media in addition to Screendigest.
9
Page 12 of 76
11/04/2011http://www.sec.gov/Archives/edgar/data/857957/000110465911004017/a11-4882_1ex99dc3.htm
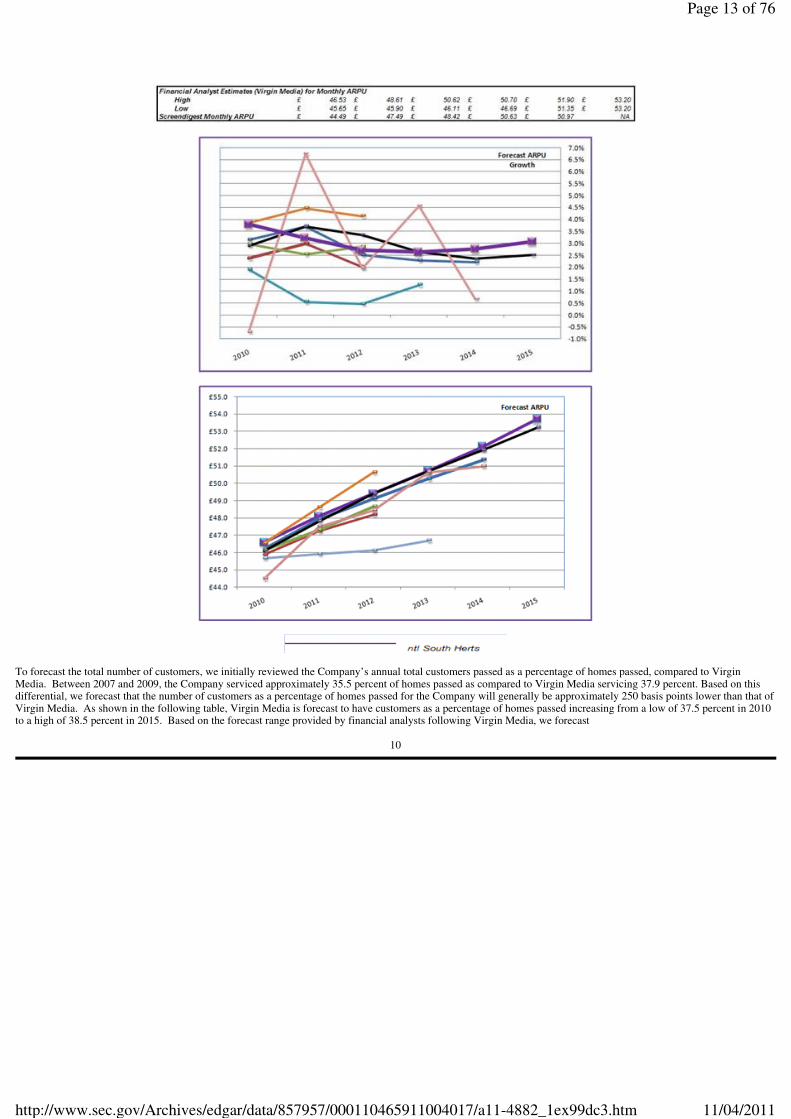
To forecast the total number of customers, we initially reviewed the Company’s annual total customers passed as a percentage of homes passed, compared to Virgin Media. Between 2007 and 2009, the Company serviced approximately 35.5 percent of homes passed as compared to Virgin Media servicing 37.9 percent. Based on this differential, we forecast that the number of customers as a percentage of homes passed for the Company will generally be approximately 250 basis points lower than that of Virgin Media. As shown in the following table, Virgin Media is forecast to have customers as a percentage of homes passed increasing from a low of 37.5 percent in 2010 to a high of 38.5 percent in 2015. Based on the forecast range provided by financial analysts following Virgin Media, we forecast
10
Page 13 of 76
11/04/2011http://www.sec.gov/Archives/edgar/data/857957/000110465911004017/a11-4882_1ex99dc3.htm
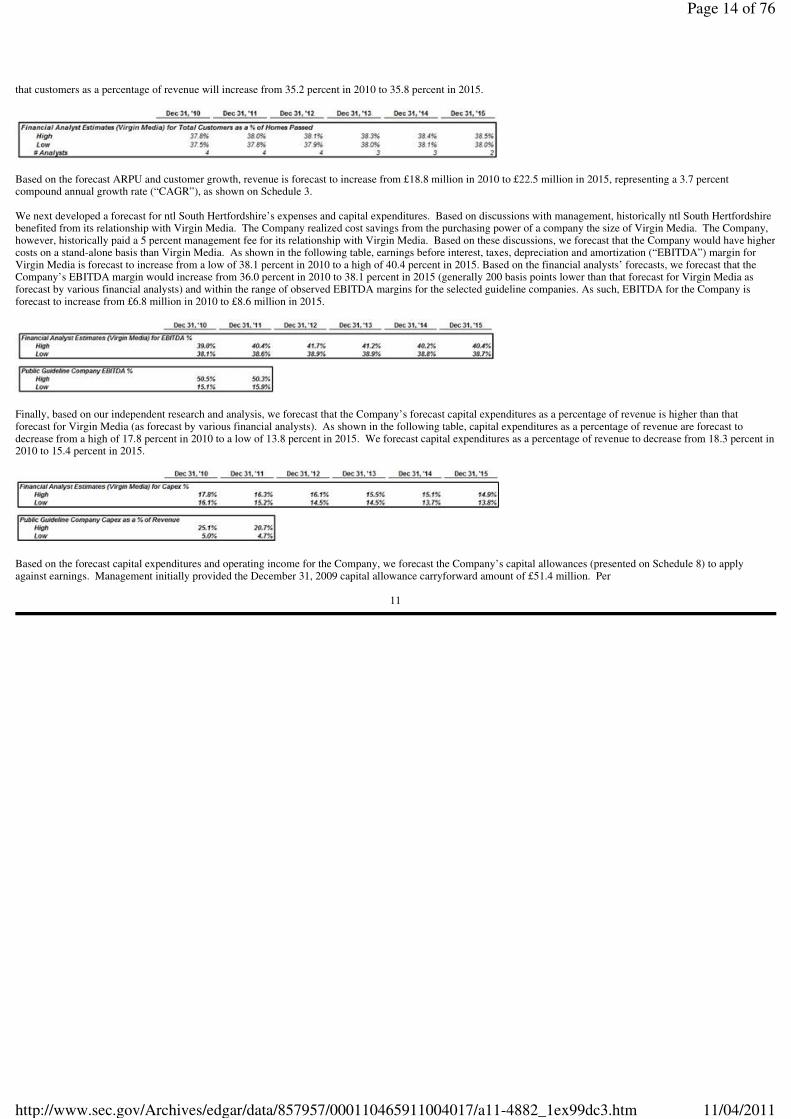
that customers as a percentage of revenue will increase from 35.2 percent in 2010 to 35.8 percent in 2015.
Based on the forecast ARPU and customer growth, revenue is forecast to increase from £18.8 million in 2010 to £22.5 million in 2015, representing a 3.7 percent compound annual growth rate (“CAGR”), as shown on Schedule 3. We next developed a forecast for ntl South Hertfordshire’s expenses and capital expenditures. Based on discussions with management, historically ntl South Hertfordshire benefited from its relationship with Virgin Media. The Company realized cost savings from the purchasing power of a company the size of Virgin Media. The Company, however, historically paid a 5 percent management fee for its relationship with Virgin Media. Based on these discussions, we forecast that the Company would have higher costs on a stand-alone basis than Virgin Media. As shown in the following table, earnings before interest, taxes, depreciation and amortization (“EBITDA”) margin for Virgin Media is forecast to increase from a low of 38.1 percent in 2010 to a high of 40.4 percent in 2015. Based on the financial analysts’ forecasts, we forecast that the Company’s EBITDA margin would increase from 36.0 percent in 2010 to 38.1 percent in 2015 (generally 200 basis points lower than that forecast for Virgin Media as forecast by various financial analysts) and within the range of observed EBITDA margins for the selected guideline companies. As such, EBITDA for the Company is forecast to increase from £6.8 million in 2010 to £8.6 million in 2015.
Finally, based on our independent research and analysis, we forecast that the Company’s forecast capital expenditures as a percentage of revenue is higher than that forecast for Virgin Media (as forecast by various financial analysts). As shown in the following table, capital expenditures as a percentage of revenue are forecast to decrease from a high of 17.8 percent in 2010 to a low of 13.8 percent in 2015. We forecast capital expenditures as a percentage of revenue to decrease from 18.3 percent in 2010 to 15.4 percent in 2015.
Based on the forecast capital expenditures and operating income for the Company, we forecast the Company’s capital allowances (presented on Schedule 8) to apply against earnings. Management initially provided the December 31, 2009 capital allowance carryforward amount of £51.4 million. Per
11
Page 14 of 76
11/04/2011http://www.sec.gov/Archives/edgar/data/857957/000110465911004017/a11-4882_1ex99dc3.htm

UK tax law, the Company can take 20 percent of the carryforward balance plus capital allowances each year through April 2012, which is then reduced to 18 percent. For the 12-month period ended December 31, 2010, we forecast that the Company will utilize a £4.3 million capital allowance to apply to earnings before taxes and depreciation (“EBTD”); for the 3-month period from September 30, 2010 to December 31, 2010, we estimate that this amount will be £1.1 million. Subtracting capital allowances from EBTD results in earnings before taxes (EBT). To arrive at the cash flows from operations for the enterprise, we add back the interest expense which was subtracted to calculate the earnings to apply the capital allowances against. After 2015, we assumed that EBITDA would continue to grow at a long-term growth rate of 2.0 percent per annum through 2024, as discussed on page 21. At 2024, the expected future benefits from the utilization of the Company’s current balance of capital allowance carryforwards are expected to equal future capital expenditure needs. While we have relied on these financial forecasts, we have not examined the projected or forecast data or the underlying assumptions in accordance with the standards prescribed by the AICPA and do not express an opinion or any other form of assurance on the projected or forecast data and related assumptions. The future may not occur as anticipated, and actual operating results may vary significantly from the estimates included in this report.
12
Page 15 of 76
11/04/2011http://www.sec.gov/Archives/edgar/data/857957/000110465911004017/a11-4882_1ex99dc3.htm

Valuation Methodology SELECTION OF APPROACH In general, methodology with regard to valuing a business or business interest can be categorized into three generally accepted approaches to value: market, income and asset. Within each of these approaches are various methods for quantifying value. In any appraisal study, all three approaches should be considered, and the approach or approaches deemed most relevant will then be selected for use in the valuation of that asset. Cost Approach This is a general way of determining a value indication of a business, business ownership interest, or security by using one or more methods based on the value of the assets of that business net of liabilities.(2) The cost approach establishes value based on the cost of reproducing or replacing the business or asset, less depreciation from physical deterioration, functional obsolescence and economic obsolescence, if present and measurable. This approach generally results in an upper limit of value in cases where the asset is easily replaced or reproduced, since no prudent investor would pay more for an asset than the cost to create a comparable asset. This approach is most applicable when: • The subject interest is tangible-asset intensive; and/or • The highest-and-best value for the subject interest would be obtained by liquidating its net assets.
In the case of ntl South Hertfordshire, the important operating assets are intangible, such as the franchises and customer relationships, and the Company’s highest-and-best value will be obtained by pursuing its current business plan and achieving positive future earnings and cash flows. Furthermore, the Company is a going concern and management was not contemplating the disposal of the assets in a liquidating event, as of the valuation date. Therefore, the cost approach is not likely to capture the true value of the Company and has not been applied in this fair market value analysis.
(2) International Glossary of Business Valuation Terms published in January 2000 as a joint project by the American Institute of Certified Public Accountants, American Society of Appraisers, Canadian Institute of Chartered Business Valuators, National Association of Certified Valuation Analysts, and the Institute of Business Appraisers.
13
Page 16 of 76
11/04/2011http://www.sec.gov/Archives/edgar/data/857957/000110465911004017/a11-4882_1ex99dc3.htm
Income Approach This is a general way of determining a value indication of a business or business interest using one or more methods that convert anticipated benefits into a present single amount.(3) In the income approach, an economic benefit stream of the asset or business interest under analysis is selected, usually based on forecast cash flow. This cash flow is then discounted to present value with an appropriate risk-adjusted discount rate. Discount rate factors often include general market rates of return at the valuation date, business risks associated with the industry in which the company operates, and other risks specific to the asset being valued. There are two basic methods under the income approach:
• Capitalization of the earnings or cash flows of a single representative year; • Discounting the earnings or cash flows of multiple future periods.
Since the operations of ntl South Hertfordshire have a continually improving operating history, are expected to grow due to increased demand for its services, were not contemplating liquidation, and a forecast through 2024 was developed, the income approach, specifically the discounted future earnings/cash flow method, was the primary approach utilized in our valuation analysis, and is further discussed below. Market Approach This is a general way of determining a value indication of a business or business interest using one or more methods that compare the subject to similar businesses or business interests that have been sold.(4) There are three basic methods under the market approach:
• The publicly traded guideline company method; • The guideline company transaction method; and • Reference to transactions in the subject’s equity securities.
Since the Partnership is publicly traded, we considered whether transactions in the Partnership’s equity securities are an indication of value in our analysis. In addition, information from other, similar companies (both publicly traded guideline companies as well as transactions in guideline companies) was utilized as further indications of value in the subject’s equity securities. The key facts and analysis under the market approach methods noted above are discussed below under the heading, “Market Approach”. VALUATION ANALYSIS Income Approach Under the discounted cash flow (“DCF”) method, the principal valuation focus is on an entity’s cash-generating capabilities. The discounted cash flow method in our valuation analysis is an invested capital method. It utilizes the cash flow to all investors, both debt holders and equity holders, to derive an overall business enterprise value. To arrive at the value of equity, the value of relevant outstanding
(3) Ibid. (4) International Glossary of Business Valuation Terms.
14
Page 17 of 76
11/04/2011http://www.sec.gov/Archives/edgar/data/857957/000110465911004017/a11-4882_1ex99dc3.htm
interest-bearing debt (loans, notes payable, etc.) is subtracted. A reasonable estimate of future cash flows is the initial step in determining value using a discounted cash flow model. The discounted cash flow method for ntl South Hertfordshire is shown on Schedule 6 attached and described below. Discounted Cash Flow Method To adjust the forecasts to reflect the total cash flow available for all investors, both debt and equity, tax-adjusted interest expense was added back to forecast net income. Other non-cash expense adjustments were also required to derive estimated invested capital cash flow. Non-cash expenses included depreciation of fixed assets / capital allowances of capital expenditures, as shown on Schedule 8, and were added back. Additionally, adjustments were made for future capital expenditures for maintenance and upgrading of its cable network architecture in order to compete more effectively as a stand-alone entity and leverage growth opportunities in broadband deployment. In addition to capital expenditures, a company must have a certain level of working capital to support future revenue. The Company’s historical working capital requirements, as well as the working capital requirements of the selected guideline public companies, were analyzed to determine the appropriate level of working capital over the forecast period. Cable television systems, however, are unique in that working capital requirements are typically negative, as the cable television industry defers payment of programming costs and franchise fees from 30 to 90 days, yet they bill in advance. Therefore, based on the aforementioned, we determined that ntl South Hertfordshire had no working capital requirements. Furthermore, after a review of the Company’s operations, there was no indication of a deficiency in working capital in the Company, and therefore no additional cash requirement was reflected in our fair market value analysis. Applying the adjustments for non-cash expenses and capital expenditures results in the estimated net invested capital cash flows for the Company, as shown on Schedule 6. To arrive at an indication of value for the invested capital for the Company, the projected cash flows for the three months remaining in 2010 through 2024 must be discounted to present value and the normalized cash flow must be capitalized and discounted to present value to estimate the value due to cash flows occurring after 2024. Derivation of Discount Rate With invested capital cash flow determined, the next step is to select an appropriate discount or capitalization rate that can be used to convert the forecast invested capital cash flows into value. A discount rate is used to convert a future stream of cash flows into value, whereas a capitalization rate (equal to the discount rate minus the cash flow growth rate) is utilized to convert a single period’s cash flow into value. In the case of ntl South Hertfordshire, a multi-period forecast of future cash flows has been utilized, and therefore, both a discount rate and a capitalization rate must be developed. When utilizing debt-free cash flow, the most appropriate discount rate is the Company’s weighted average cost of capital (“WACC”), as shown on Schedule 5. The WACC provides an expected rate of return based on
15
•••• a given capital structure;
• an estimated return on equity; and
Page 18 of 76
11/04/2011http://www.sec.gov/Archives/edgar/data/857957/000110465911004017/a11-4882_1ex99dc3.htm
The basic formula for computing WACC can be expressed as follows:
WACC = (ke x We) + (kd x [1 - t] x Wd)
The cost of equity was estimated by utilizing the capital asset pricing model (“CAPM”). The CAPM, also summarized on Schedule 5, can be expressed as follows:
The following definitions expand on CAPM inputs noted above:
RFR — For the purposes of our analysis, we used a risk-free rate of 3.4 percent, equal to the average yield on 20-year treasury bonds at September 30, 2010. Beta — The beta of a stock is typically estimated by regressing the stock’s return on the overall market’s return. This gives the relationship between the movement of the stock and the movement of the market. In essence, beta is a measure of the volatility of a stock’s price as compared to the overall price volatility of the market. Therefore, a stock with a beta equal to 1.0 indicates that a one percent (%) change in the market index equals a one percent change in the price of the stock—the individual stock is as risky at the market as a whole. In situations where there is a difference in the leverage of the guideline companies, the indicated peer group beta is de-levered to remove the peer capital structure and re-levered to reflect a capital structure consistent with the WACC calculation. For the purposes of our analysis, we applied a relevered equity beta of 0.81, based on the betas of the public guideline company group as identified in the “Market Approach” section of this report and as shown on Schedule 5. MRP — Traditionally, business appraisers have almost uniformly used Morningstar’s (formerly Ibbotson Associates) equity risk premium (“ERP”) study that was based on data gathered by the Center for Research in Security Prices (“CRSP”) at the University of Chicago as the basis for the generic, or market risk, component. This data began to be collected by the CRSP in 1926; thus, the equity return in excess of the riskless rate was somewhat arbitrarily calculated back to that date. Numerous recent studies citing periods of extremely low bond prices during that time period have either openly criticized the use of 1926 as a start date, or, have simply calculated the equity risk
16
• an estimated required yield on interest-bearing debt.
Where:
WACC = Weighted average cost of capital
ke = Company’s cost of equity capital
We = Percentage of equity capital in the capital structure
kd = Company’s cost of debt capital
t = Company’s effective income tax rate
Wd = Percentage of debt capital in the capital structure
ER = RFR + ß x (MRP) + SSRP + ARP
Where:
ER = The security’s expected return
RFR = An appropriate risk-free rate
ß = The security’s beta statistic
MRP = The market’s return premium over the risk free return
SSRP = Small stock risk premium
ARP = Additional risk premium
Page 19 of 76
11/04/2011http://www.sec.gov/Archives/edgar/data/857957/000110465911004017/a11-4882_1ex99dc3.htm
premium on more recent data. In doing so, these new studies are all reporting equity risk premiums lower than the Morningstar study. In fact, a study done by Roger Ibbotson himself, along with Peng Chen, found an ERP of approximately 5.2 percent on an arithmetic average — roughly 1.5 percent less than that reported in Morningstar’s Stocks, Bonds, Bills and Inflation 2010 Yearbook. Other studies have estimated the ERP in the range of 5.5 to 6.0 percent. From this analysis, we have determined that an appropriate ERP is 5.75 percent. SSRP — The small stock risk premium. Investors in small capitalization stocks have historically required a premium over large capitalization stocks. Based on the size of ntl South Hertfordshire’s market capitalization, on a stand-alone basis, Morningstar indicates that a small stock risk premium of 6.3 percent is applicable. ARP — This element of the cost of equity, additional risk premium, reflects the risk associated with an investment in ntl South Hertfordshire that is not otherwise included in the above rates of return. For the purposes of this analysis, we have applied a 1.5 percent premium to reflect appropriately the risk associated with the Company’s forecast, given the uncertainty related to investment returns generated by the Company based on its historical operating results. Country Risk Premium — Because ntl South Hertfordshire operates in the UK, its risk profile potentially includes an international cost of capital not present in a stand-alone U.S. investment. To capture this “extra” risk, we sourced UK bond ratings and related default spread data from Aswath Damodaran, Professor at the Stern School of Business at New York University. The country risk premium for the UK was estimated to be zero basis points above that of a U.S. investment, as of the valuation date.
Using the variables noted above, as shown in Schedule 5, we have derived the indicated discount rate for partners’ equity at 20.0 percent. To estimate the second component of the WACC (i.e., the cost of debt capital), we considered interest rates that would be reflective of those that a third-party purchaser would be able to obtain, in line with the definition of fair market value. In determining this rate, we considered Virgin Media’s long-term debt as of the valuation date as a starting point, ntl South Hertfordshire’s earnings variability, and the interest rate at which a potential borrower would be able to secure financing as of the valuation date. Historically, the Company’s debt has benefited from Virgin Media’s borrowing capacity and debt ratings with an estimated pre-tax cost of debt of 6.7 percent, which would not be available to ntl South Hertfordshire on a stand-alone basis. Based on the aforementioned, we considered a 300 basis point premium to Virgin Media’s estimated cost of debt to be an appropriate estimate for the pre-tax cost of debt for ntl South Hertfordshire, resulting in an estimated 9.7 percent pre-tax cost of debt. Since the capitalization rate is used on after-tax cash flows, a UK corporate tax rate of 24.0 percent was then utilized to estimate the after-tax cost of debt. The final component in estimating the WACC for ntl South Hertfordshire was to estimate the appropriate ratio of debt-to-equity. Since the ownership interest being valued represents a control ownership interest, the typical purchaser would have wide latitude in changing the firm’s capital structure. We compared the industry average debt-to-total invested capital with that of ntl South Hertfordshire. We utilized data from the same publicly traded guideline companies utilized in our cost
17
Page 20 of 76
11/04/2011http://www.sec.gov/Archives/edgar/data/857957/000110465911004017/a11-4882_1ex99dc3.htm
of equity analysis, and based on our analysis, a target capital structure of approximately 53.9 percent debt and 46.1 percent equity was applied, yielding a WACC of 13.2 percent, as shown in Schedule 5. Estimated Cash Flow Growth After calculating the Company’s discount rate, the expected cash flow growth rate must be subtracted to arrive at a capitalization rate to apply to the terminal cash flow of the Company. Based on discussions with management and a review of industry growth estimates, a growth rate that reflects the Company’s long-term prospects is reasonably estimated. In the case of ntl South Hertfordshire, the following assumptions were used in estimating the terminal year cash flow:
• A 2.0 percent perpetuity growth rate that reflects the Company’s long-term earnings growth prospects was considered reasonable, as well as consistent with overall Company growth expectations.
• Depreciation / capital allowances will be adequate to fund capital expenditure needs over the long term.
Subtracting this growth rate from the previously calculated WACC results in a capitalization rate applicable to ntl South Hertfordshire of 11.2 percent. With the appropriate discount rate and capitalization rate selected, future debt-free cash flow can be discounted to arrive at an estimate of the fair market value of the total invested capital in ntl South Hertfordshire. As Schedule 6 illustrates, the indicated value of the invested capital of ntl South Hertfordshire is £34,368,000, as of September 30, 2010. At this point, one additional adjustment was considered in order to arrive at the value of ntl South Hertfordshire’s equity, the subtraction of interest-bearing debt. The Company reported £19,158,000 in interest-bearing debt as of September 30, 2010, which required adjustment to fair market value as this debt has historically benefited from Virgin Media’s borrowing capacity and debt ratings, which would not be available to ntl South Hertfordshire on a stand-alone basis. Thus, based on the estimated cost of debt of 9.7 percent, as shown on Schedule 5, the fair market value of the Company’s debt is estimated at £17,432,000, as shown in Schedule 7; therefore, the indicated aggregate equity value on a control, marketable basis is £16,936,000, as shown on Schedule 6. In order to arrive at a controlling, non-marketable interest value, it would be necessary to apply a discount for lack of marketability, which is discussed more fully in the section entitled “Discount for Lack of Marketability” (beginning on page 22). Market Approach Guideline Public Company Method In implementing the guideline public company method, we searched for publicly traded companies within the SIC codes 4841 — Cable and Other Pay Television Services; and 4899 — Communication Services, Not Elsewhere Classified. This search identified numerous companies that were potentially comparable to the Company. We then screened these companies based on the full business description, location (UK, Western Europe and US operations) and financial position (not in
18
Page 21 of 76
11/04/2011http://www.sec.gov/Archives/edgar/data/857957/000110465911004017/a11-4882_1ex99dc3.htm
bankruptcy). Based upon the aforementioned screening criteria, we selected 15 companies that were deemed relevant under the guideline public company method to provide an indication of value for the Company. The publicly traded companies selected for our analysis are: UK Peers:
• BT Group PLC (LSE: BT.A) • British Sky Broadcasting Group PLC (LSE: BSY) • TalkTalk Telecom Group PLC (LSE: TALK) • KCOM Group PLC (LSE: KCOM)
Western European Peers:
• Liberty Global, Inc. (NASDAQ: LBTY.A) • Virgin Media, Inc. (NASDAQ: VMED) • Kabel Deutschland Holding AG (DB: KD8) • Telenet Holding NV (ENXTBR: TNET) • ZON Multimedia Servicos de Telecomunicacoes e Multimedia SGPS SA (ENXTLS: ZON)
U.S. Peers:
• Comcast Corporation (NASDAQ: CMCS.A) • Time Warner Cable, Inc. (NYSE: TWC) • Charter Communications, Inc. (NASDAQ: CHTR) • Cablevision Systems Corporation (NYSE: CVC) • Mediacom Communications Corporation (NASDAQ: MCCC) • Knology, Inc. (NASDAQ: KNOL)
Schedule 9 provides a detailed description of each of these public companies. In implementing the guideline public company method, we performed a comparative financial analysis of these companies, as shown on Schedules 10 and 11. Although there are differences between ntl South Hertfordshire and the selected guideline public companies in size, profitability, growth prospects, market demographics, condition of physical plant and its capacity, these guideline public companies’ pricing multiples generally reflect an investor’s assessment of the business and financial risks inherent in the cable television industry as of the valuation date. The data obtained for the guideline public companies was then converted to various valuation metrics or valuation multiples, as presented in Schedule 12. We focused on the selected guideline public companies’ enterprise value (“EV”) to EBITDA multiples as measures of value, due to the capital-intensive nature of the industry. For the forward multiples, we relied on Reuter’s consensus estimates as provided by Capital IQ. The range, mean and median guideline public companies’ enterprise value to trailing twelve months (“TTM”) and next twelve months (“NTM”) EBITDA multiples are as shown in Schedule 12 and the following table.
19
Page 22 of 76
11/04/2011http://www.sec.gov/Archives/edgar/data/857957/000110465911004017/a11-4882_1ex99dc3.htm
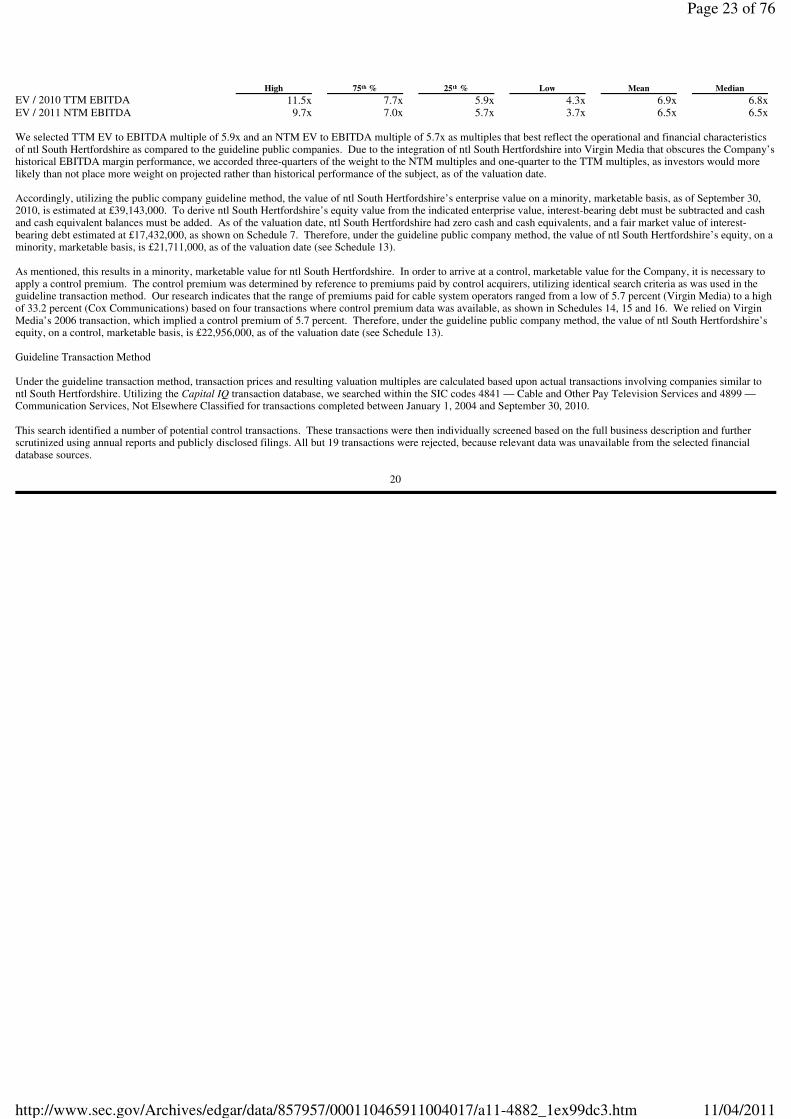
We selected TTM EV to EBITDA multiple of 5.9x and an NTM EV to EBITDA multiple of 5.7x as multiples that best reflect the operational and financial characteristics of ntl South Hertfordshire as compared to the guideline public companies. Due to the integration of ntl South Hertfordshire into Virgin Media that obscures the Company’s historical EBITDA margin performance, we accorded three-quarters of the weight to the NTM multiples and one-quarter to the TTM multiples, as investors would more likely than not place more weight on projected rather than historical performance of the subject, as of the valuation date. Accordingly, utilizing the public company guideline method, the value of ntl South Hertfordshire’s enterprise value on a minority, marketable basis, as of September 30, 2010, is estimated at £39,143,000. To derive ntl South Hertfordshire’s equity value from the indicated enterprise value, interest-bearing debt must be subtracted and cash and cash equivalent balances must be added. As of the valuation date, ntl South Hertfordshire had zero cash and cash equivalents, and a fair market value of interest-bearing debt estimated at £17,432,000, as shown on Schedule 7. Therefore, under the guideline public company method, the value of ntl South Hertfordshire’s equity, on a minority, marketable basis, is £21,711,000, as of the valuation date (see Schedule 13). As mentioned, this results in a minority, marketable value for ntl South Hertfordshire. In order to arrive at a control, marketable value for the Company, it is necessary to apply a control premium. The control premium was determined by reference to premiums paid by control acquirers, utilizing identical search criteria as was used in the guideline transaction method. Our research indicates that the range of premiums paid for cable system operators ranged from a low of 5.7 percent (Virgin Media) to a high of 33.2 percent (Cox Communications) based on four transactions where control premium data was available, as shown in Schedules 14, 15 and 16. We relied on Virgin Media’s 2006 transaction, which implied a control premium of 5.7 percent. Therefore, under the guideline public company method, the value of ntl South Hertfordshire’s equity, on a control, marketable basis, is £22,956,000, as of the valuation date (see Schedule 13). Guideline Transaction Method Under the guideline transaction method, transaction prices and resulting valuation multiples are calculated based upon actual transactions involving companies similar to ntl South Hertfordshire. Utilizing the Capital IQ transaction database, we searched within the SIC codes 4841 — Cable and Other Pay Television Services and 4899 — Communication Services, Not Elsewhere Classified for transactions completed between January 1, 2004 and September 30, 2010. This search identified a number of potential control transactions. These transactions were then individually screened based on the full business description and further scrutinized using annual reports and publicly disclosed filings. All but 19 transactions were rejected, because relevant data was unavailable from the selected financial database sources.
20
High 75 %
25 % Low
Mean Median
EV / 2010 TTM EBITDA
11.5x 7.7x
5.9x 4.3x
6.9x 6.8x
EV / 2011 NTM EBITDA
9.7x 7.0x
5.7x 3.7x
6.5x 6.5x
th th
Page 23 of 76
11/04/2011http://www.sec.gov/Archives/edgar/data/857957/000110465911004017/a11-4882_1ex99dc3.htm
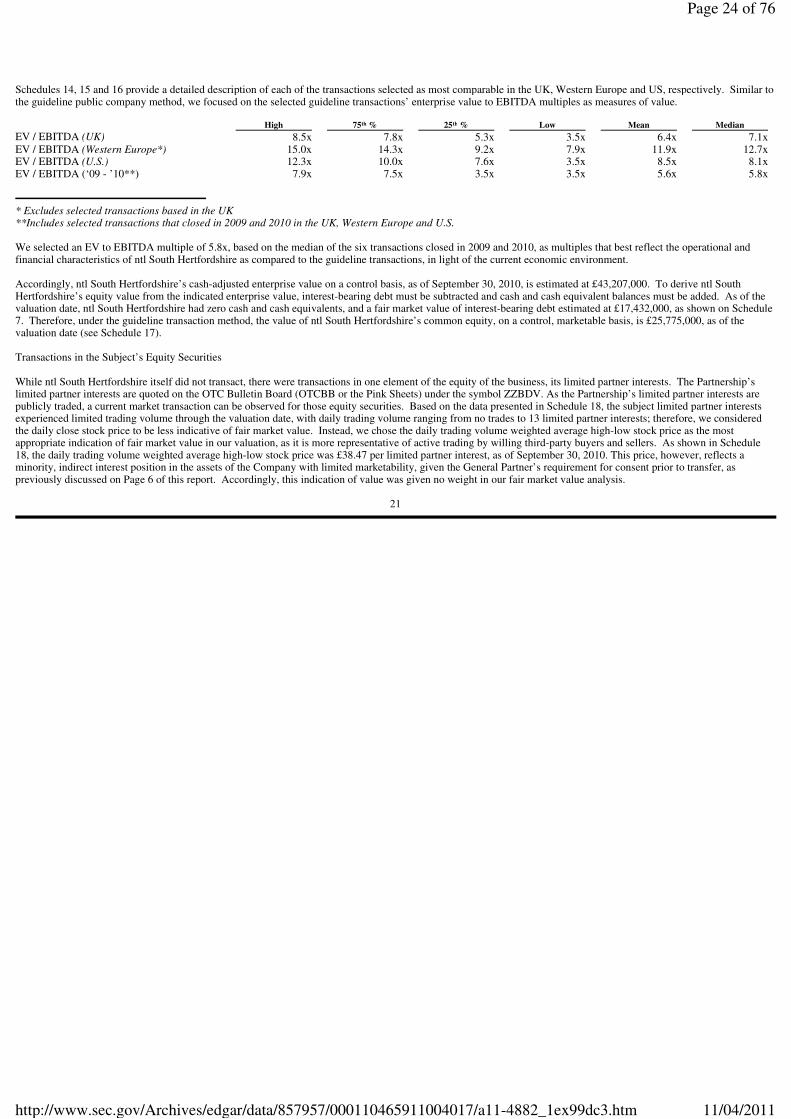
Schedules 14, 15 and 16 provide a detailed description of each of the transactions selected as most comparable in the UK, Western Europe and US, respectively. Similar to the guideline public company method, we focused on the selected guideline transactions’ enterprise value to EBITDA multiples as measures of value.
* Excludes selected transactions based in the UK **Includes selected transactions that closed in 2009 and 2010 in the UK, Western Europe and U.S. We selected an EV to EBITDA multiple of 5.8x, based on the median of the six transactions closed in 2009 and 2010, as multiples that best reflect the operational and financial characteristics of ntl South Hertfordshire as compared to the guideline transactions, in light of the current economic environment. Accordingly, ntl South Hertfordshire’s cash-adjusted enterprise value on a control basis, as of September 30, 2010, is estimated at £43,207,000. To derive ntl South Hertfordshire’s equity value from the indicated enterprise value, interest-bearing debt must be subtracted and cash and cash equivalent balances must be added. As of the valuation date, ntl South Hertfordshire had zero cash and cash equivalents, and a fair market value of interest-bearing debt estimated at £17,432,000, as shown on Schedule 7. Therefore, under the guideline transaction method, the value of ntl South Hertfordshire’s common equity, on a control, marketable basis, is £25,775,000, as of the valuation date (see Schedule 17). Transactions in the Subject’s Equity Securities While ntl South Hertfordshire itself did not transact, there were transactions in one element of the equity of the business, its limited partner interests. The Partnership’s limited partner interests are quoted on the OTC Bulletin Board (OTCBB or the Pink Sheets) under the symbol ZZBDV. As the Partnership’s limited partner interests are publicly traded, a current market transaction can be observed for those equity securities. Based on the data presented in Schedule 18, the subject limited partner interests experienced limited trading volume through the valuation date, with daily trading volume ranging from no trades to 13 limited partner interests; therefore, we considered the daily close stock price to be less indicative of fair market value. Instead, we chose the daily trading volume weighted average high-low stock price as the most appropriate indication of fair market value in our valuation, as it is more representative of active trading by willing third-party buyers and sellers. As shown in Schedule 18, the daily trading volume weighted average high-low stock price was £38.47 per limited partner interest, as of September 30, 2010. This price, however, reflects a minority, indirect interest position in the assets of the Company with limited marketability, given the General Partner’s requirement for consent prior to transfer, as previously discussed on Page 6 of this report. Accordingly, this indication of value was given no weight in our fair market value analysis.
21
High 75 %
25 % Low
Mean Median
EV / EBITDA (UK)
8.5x 7.8x
5.3x 3.5x
6.4x 7.1x
EV / EBITDA (Western Europe*)
15.0x 14.3x
9.2x 7.9x
11.9x 12.7x
EV / EBITDA (U.S.)
12.3x 10.0x
7.6x 3.5x
8.5x 8.1x
EV / EBITDA (‘09 - ’10**)
7.9x 7.5x
3.5x 3.5x
5.6x 5.8x
th th
Page 24 of 76
11/04/2011http://www.sec.gov/Archives/edgar/data/857957/000110465911004017/a11-4882_1ex99dc3.htm
Reconciliation of Value Having determined the Company’s equity value utilizing the income approach and the market approach, a reconciliation of its overall value is needed. The Company’s equity value, on a control, marketable basis, was estimated to be £16,936,000 (under the DCF method), £22,956,000 (under the guideline public company method), and £25,775,000 (under the guideline transaction method). Due to the integration of ntl South Hertfordshire into Virgin Media that obscures the Company’s historical performance, we accorded the most weight of 50.0 percent to the DCF method, and 25.0 percent to both the guideline public company and the guideline transaction methods, as investors would more likely than not place more weight on projected rather than historical performance of the subject, as of the valuation date. Therefore, the indicated value of ntl South Hertfordshire’ equity on a control, marketable basis, before a discount for lack of marketability, is £20,651,000, as shown on Schedule 19. DISCOUNT FOR LACK OF MARKETABILITY A discount for lack of marketability (“DLOM”) is required to reach fair market value, as privately-held businesses, such as the Company, have no access to an active public market for their equity securities or assets. Without market access, an investor’s ability to control the timing of potential gains, to avoid losses, and to minimize the opportunity cost associated with alternative investments is severely impaired. For two investment instruments identical in all other respects, the market will accord a considerable premium to the one that can be liquidated into cash instantly, especially without risk of loss in value. For this reason, an interest in a privately held company usually is worth less than an otherwise comparable interest in a publicly held company. We considered both qualitative and quantitative methods to estimate the discount for lack of marketability, including the following:
1. Qualitative assessment based on Company characteristics and restricted stock studies 2. Statistical regression analysis based on restricted stock studies (lookback option) 3. Protective put option analyses
Qualitative Assessment Two types of empirical studies have been undertaken that provide indications of the value of ready marketability to investors. Studies on restricted stock transactions compare the discounted prices paid for equity securities subject to trading restrictions with market prices for similar securities, which are freely tradable without such restrictions. Pre-IPO studies analyze private transactions in the stock of companies that were not publicly traded at the time, but subsequently “went public”. Both types of studies were reviewed for guidance as to the appropriate lack of marketability discount to apply to the subject interest. Pre-IPO Studies Two studies examine prices paid in private transactions for shares of companies that subsequently became publicly traded through an initial public offering (“IPO”). The Robert W. Baird & Company (“Emory”) studies and the Willamette Management Associates studies both consist of multi-year examinations of these price differentials. The pre-IPO studies show higher reported discounts than the restricted stock studies (see below), averaging approximately 45.0 percent versus 34.1 percent for applicable pre-1990 restricted stock studies.
22
Page 25 of 76
11/04/2011http://www.sec.gov/Archives/edgar/data/857957/000110465911004017/a11-4882_1ex99dc3.htm
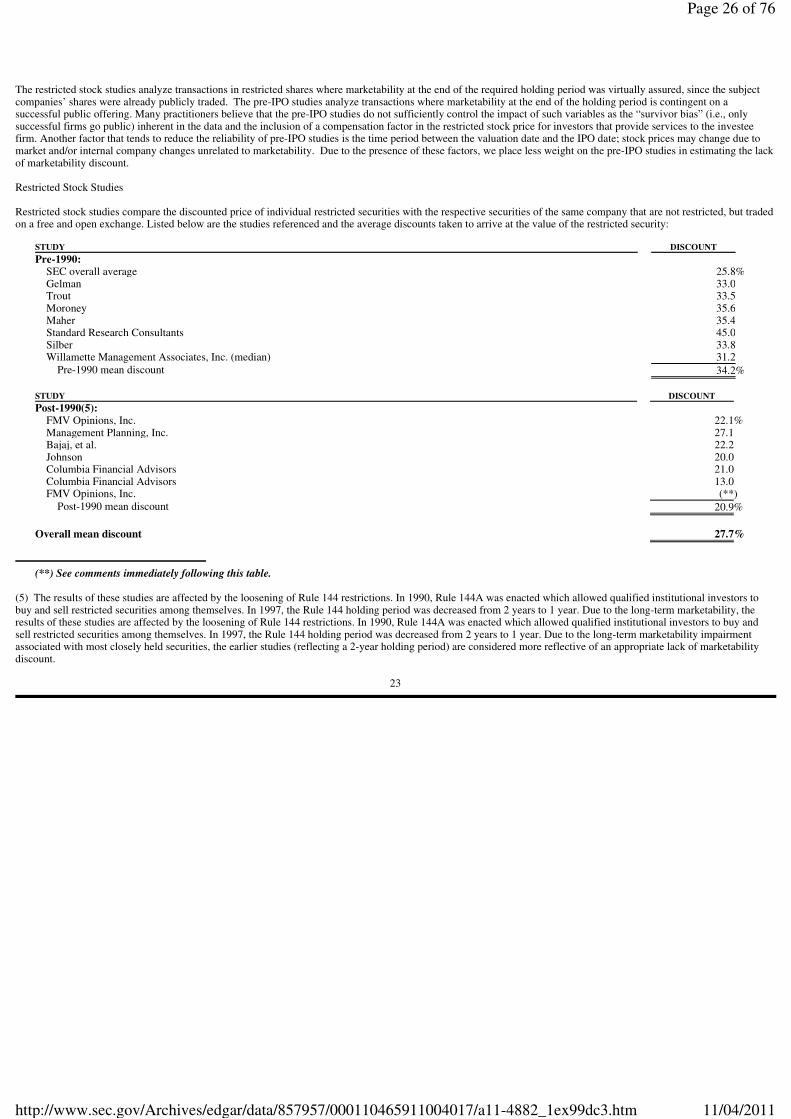
The restricted stock studies analyze transactions in restricted shares where marketability at the end of the required holding period was virtually assured, since the subject companies’ shares were already publicly traded. The pre-IPO studies analyze transactions where marketability at the end of the holding period is contingent on a successful public offering. Many practitioners believe that the pre-IPO studies do not sufficiently control the impact of such variables as the “survivor bias” (i.e., only successful firms go public) inherent in the data and the inclusion of a compensation factor in the restricted stock price for investors that provide services to the investee firm. Another factor that tends to reduce the reliability of pre-IPO studies is the time period between the valuation date and the IPO date; stock prices may change due to market and/or internal company changes unrelated to marketability. Due to the presence of these factors, we place less weight on the pre-IPO studies in estimating the lack of marketability discount. Restricted Stock Studies Restricted stock studies compare the discounted price of individual restricted securities with the respective securities of the same company that are not restricted, but traded on a free and open exchange. Listed below are the studies referenced and the average discounts taken to arrive at the value of the restricted security:
(**) See comments immediately following this table. (5) The results of these studies are affected by the loosening of Rule 144 restrictions. In 1990, Rule 144A was enacted which allowed qualified institutional investors to buy and sell restricted securities among themselves. In 1997, the Rule 144 holding period was decreased from 2 years to 1 year. Due to the long-term marketability, the results of these studies are affected by the loosening of Rule 144 restrictions. In 1990, Rule 144A was enacted which allowed qualified institutional investors to buy and sell restricted securities among themselves. In 1997, the Rule 144 holding period was decreased from 2 years to 1 year. Due to the long-term marketability impairment associated with most closely held securities, the earlier studies (reflecting a 2-year holding period) are considered more reflective of an appropriate lack of marketability discount.
23
STUDY DISCOUNT
Pre-1990:
SEC overall average
25.8%Gelman
33.0
Trout 33.5
Moroney
35.6
Maher 35.4
Standard Research Consultants
45.0
Silber 33.8
Willamette Management Associates, Inc. (median)
31.2
Pre-1990 mean discount 34.2%
STUDY DISCOUNT
Post-1990(5):
FMV Opinions, Inc.
22.1%
Management Planning, Inc. 27.1
Bajaj, et al.
22.2
Johnson 20.0
Columbia Financial Advisors
21.0
Columbia Financial Advisors 13.0
FMV Opinions, Inc.
(**) Post-1990 mean discount
20.9%
Overall mean discount
27.7%
Page 26 of 76
11/04/2011http://www.sec.gov/Archives/edgar/data/857957/000110465911004017/a11-4882_1ex99dc3.htm
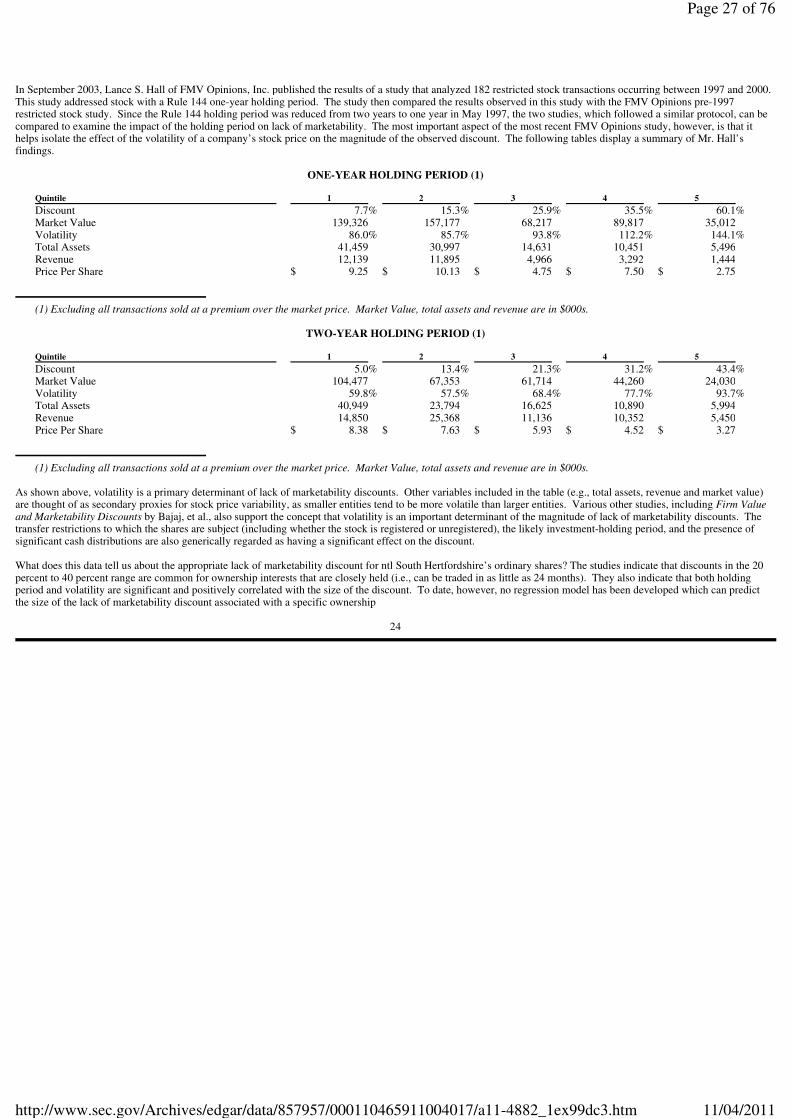
In September 2003, Lance S. Hall of FMV Opinions, Inc. published the results of a study that analyzed 182 restricted stock transactions occurring between 1997 and 2000. This study addressed stock with a Rule 144 one-year holding period. The study then compared the results observed in this study with the FMV Opinions pre-1997 restricted stock study. Since the Rule 144 holding period was reduced from two years to one year in May 1997, the two studies, which followed a similar protocol, can be compared to examine the impact of the holding period on lack of marketability. The most important aspect of the most recent FMV Opinions study, however, is that it helps isolate the effect of the volatility of a company’s stock price on the magnitude of the observed discount. The following tables display a summary of Mr. Hall’s findings.
ONE-YEAR HOLDING PERIOD (1)
(1) Excluding all transactions sold at a premium over the market price. Market Value, total assets and revenue are in $000s.
TWO-YEAR HOLDING PERIOD (1)
(1) Excluding all transactions sold at a premium over the market price. Market Value, total assets and revenue are in $000s.
As shown above, volatility is a primary determinant of lack of marketability discounts. Other variables included in the table (e.g., total assets, revenue and market value) are thought of as secondary proxies for stock price variability, as smaller entities tend to be more volatile than larger entities. Various other studies, including Firm Value and Marketability Discounts by Bajaj, et al., also support the concept that volatility is an important determinant of the magnitude of lack of marketability discounts. The transfer restrictions to which the shares are subject (including whether the stock is registered or unregistered), the likely investment-holding period, and the presence of significant cash distributions are also generically regarded as having a significant effect on the discount. What does this data tell us about the appropriate lack of marketability discount for ntl South Hertfordshire’s ordinary shares? The studies indicate that discounts in the 20 percent to 40 percent range are common for ownership interests that are closely held (i.e., can be traded in as little as 24 months). They also indicate that both holding period and volatility are significant and positively correlated with the size of the discount. To date, however, no regression model has been developed which can predict the size of the lack of marketability discount associated with a specific ownership
24
Quintile 1
2 3
4 5
Discount
7.7% 15.3% 25.9% 35.5% 60.1%Market Value
139,326 157,177
68,217 89,817
35,012
Volatility 86.0% 85.7% 93.8% 112.2% 144.1%
Total Assets 41,459
30,997 14,631
10,451 5,496
Revenue
12,139 11,895
4,966 3,292
1,444
Price Per Share $ 9.25
$ 10.13 $ 4.75
$ 7.50 $ 2.75
Quintile 1
2 3
4 5
Discount
5.0% 13.4% 21.3% 31.2% 43.4%Market Value
104,477 67,353
61,714 44,260
24,030
Volatility 59.8% 57.5% 68.4% 77.7% 93.7%
Total Assets 40,949
23,794 16,625
10,890 5,994
Revenue
14,850 25,368
11,136 10,352
5,450
Price Per Share $ 8.38
$ 7.63 $ 5.93
$ 4.52 $ 3.27
Page 27 of 76
11/04/2011http://www.sec.gov/Archives/edgar/data/857957/000110465911004017/a11-4882_1ex99dc3.htm
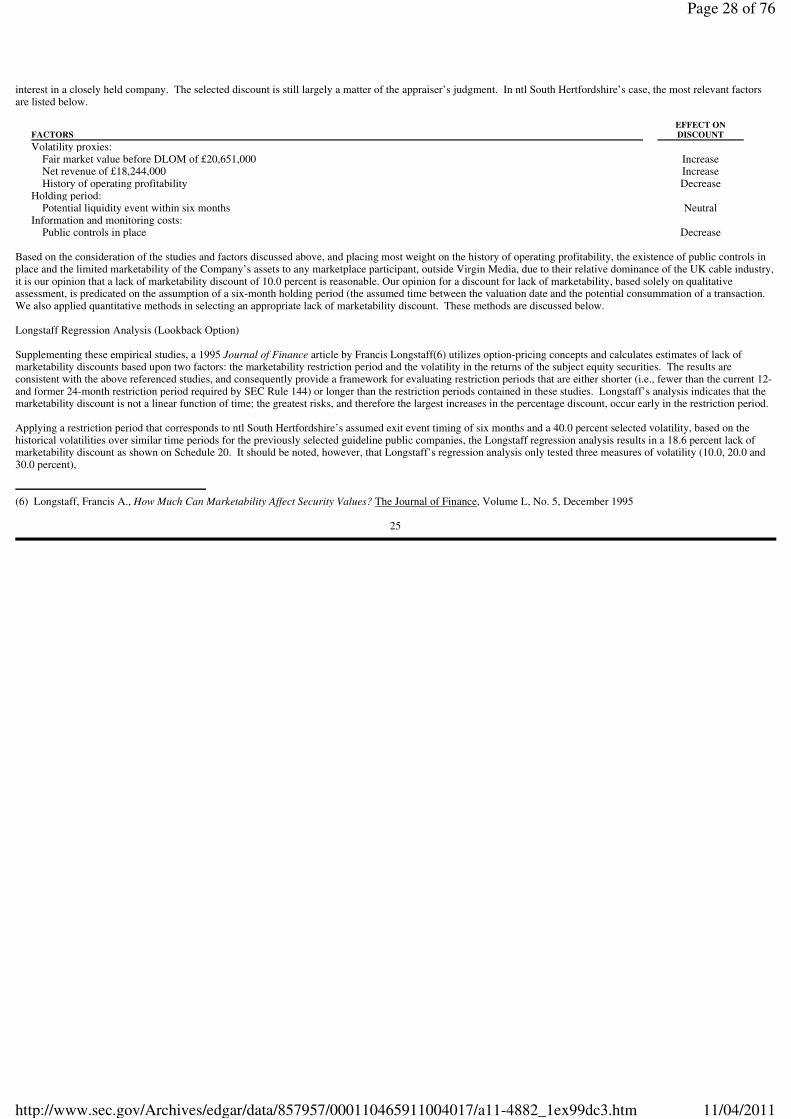
interest in a closely held company. The selected discount is still largely a matter of the appraiser’s judgment. In ntl South Hertfordshire’s case, the most relevant factors are listed below.
Based on the consideration of the studies and factors discussed above, and placing most weight on the history of operating profitability, the existence of public controls in place and the limited marketability of the Company’s assets to any marketplace participant, outside Virgin Media, due to their relative dominance of the UK cable industry, it is our opinion that a lack of marketability discount of 10.0 percent is reasonable. Our opinion for a discount for lack of marketability, based solely on qualitative assessment, is predicated on the assumption of a six-month holding period (the assumed time between the valuation date and the potential consummation of a transaction. We also applied quantitative methods in selecting an appropriate lack of marketability discount. These methods are discussed below. Longstaff Regression Analysis (Lookback Option) Supplementing these empirical studies, a 1995 Journal of Finance article by Francis Longstaff(6) utilizes option-pricing concepts and calculates estimates of lack of marketability discounts based upon two factors: the marketability restriction period and the volatility in the returns of the subject equity securities. The results are consistent with the above referenced studies, and consequently provide a framework for evaluating restriction periods that are either shorter (i.e., fewer than the current 12- and former 24-month restriction period required by SEC Rule 144) or longer than the restriction periods contained in these studies. Longstaff’s analysis indicates that the marketability discount is not a linear function of time; the greatest risks, and therefore the largest increases in the percentage discount, occur early in the restriction period. Applying a restriction period that corresponds to ntl South Hertfordshire’s assumed exit event timing of six months and a 40.0 percent selected volatility, based on the historical volatilities over similar time periods for the previously selected guideline public companies, the Longstaff regression analysis results in a 18.6 percent lack of marketability discount as shown on Schedule 20. It should be noted, however, that Longstaff’s regression analysis only tested three measures of volatility (10.0, 20.0 and 30.0 percent),
(6) Longstaff, Francis A., How Much Can Marketability Affect Security Values? The Journal of Finance, Volume L, No. 5, December 1995
25
FACTORS
EFFECT ON DISCOUNT
Volatility proxies:
Fair market value before DLOM of £20,651,000
Increase
Net revenue of £18,244,000 Increase
History of operating profitability
Decrease
Holding period:
Potential liquidity event within six months Neutral
Information and monitoring costs:
Public controls in place
Decrease
Page 28 of 76
11/04/2011http://www.sec.gov/Archives/edgar/data/857957/000110465911004017/a11-4882_1ex99dc3.htm
and we have chosen not to extrapolate Longstaff’s regression for volatilities greater than 30.0 percent, but have instead used the maximum volatility of 30.0 percent included by Longstaff in our analysis. As the assumed volatility for ntl South Hertfordshire was significantly greater than Longstaff’s maximum of 30.0 percent, this would suggest that an additional discount may be warranted above the maximum discounts cited in Longstaff’s article and shown in Schedule 20. Lookback options guarantee the option holder a distribution based on the maximum price the underlying security achieves during the life of the contract. In deriving a lack of marketability discount from a lookback option, such as Longstaff’s, it appears to be most relevant for strategic investors and/or insiders with asymmetrical information. Empirical evidence indicates that private information enables strategic investors and/or insiders to time the market and realize excess returns. Therefore, for strategic investors and/or insiders, resale restrictions (i.e., SEC Rule 144 / lock-up provisions) interfere with the investor’s ability to exploit their asymmetrical information advantage to time the market, and a greater lack of marketability discount may be warranted. For investors with symmetrical information (i.e., rank and file employees), however, the Longstaff regression analysis generally provides an upper bound for the lack of marketability indication. Protective Put Analyses A protective put on the indicated value would lock in the common shareholder’s price by providing protection from downside risk. If the stock price was lower than the indicated value at the liquidity date, the put would protect the investor from this downside risk since the common stock holder would be able to sell their shares at the put strike price. European put options are considered standard contracts; all that matters is the underlying share price at maturity and not how it got there. Schedule 21 presents the calculations of the discount for lack of marketability using a European protective put option model at 11.2 percent. A European protective put, however, only addresses the downside risk of the common stock price, allowing for upside appreciation in value, which potentially overstates the discount. Asian put options, however, offer some protection from price manipulations as the payoffs for these options are not determined by the underlying share price at maturity but by the average underlying price (aka average rate) or the average of the exercise price (aka average strike) over some pre-set period of time. Generally, the value of an Asian option is lower than a standard contract (i.e., European option) due to the fact that the averaging process reduces the impact of volatility of the stock or exercise price movement over its term (i.e., restriction period). While there are three methods to calculate Asian put options, only two are typically used in practice: geometric average and arithmetic average. To date, there are no known closed-form analytical solutions to arithmetic average options. As a result, simulations using Monte Carlo are typically used, whereby a set of underlying assumptions are allowed to vary from their expected values within prescribed limits. There are, however, closed-form analytical solutions to geometric average price options. Schedule 22 presents the calculation of the discount for lack of marketability using a Geometric Average Rate Put Model (“GARPM”) at 6.8 percent. It should be noted that there is no known published study that compares the discounts derived under GARPM to discounts observed empirically. Finally, unlike the protective put models by Chaffe, Longstaff and Finnerty (below), GARPM does not share the same framework, whereby the discount for lack of
26
Page 29 of 76
11/04/2011http://www.sec.gov/Archives/edgar/data/857957/000110465911004017/a11-4882_1ex99dc3.htm
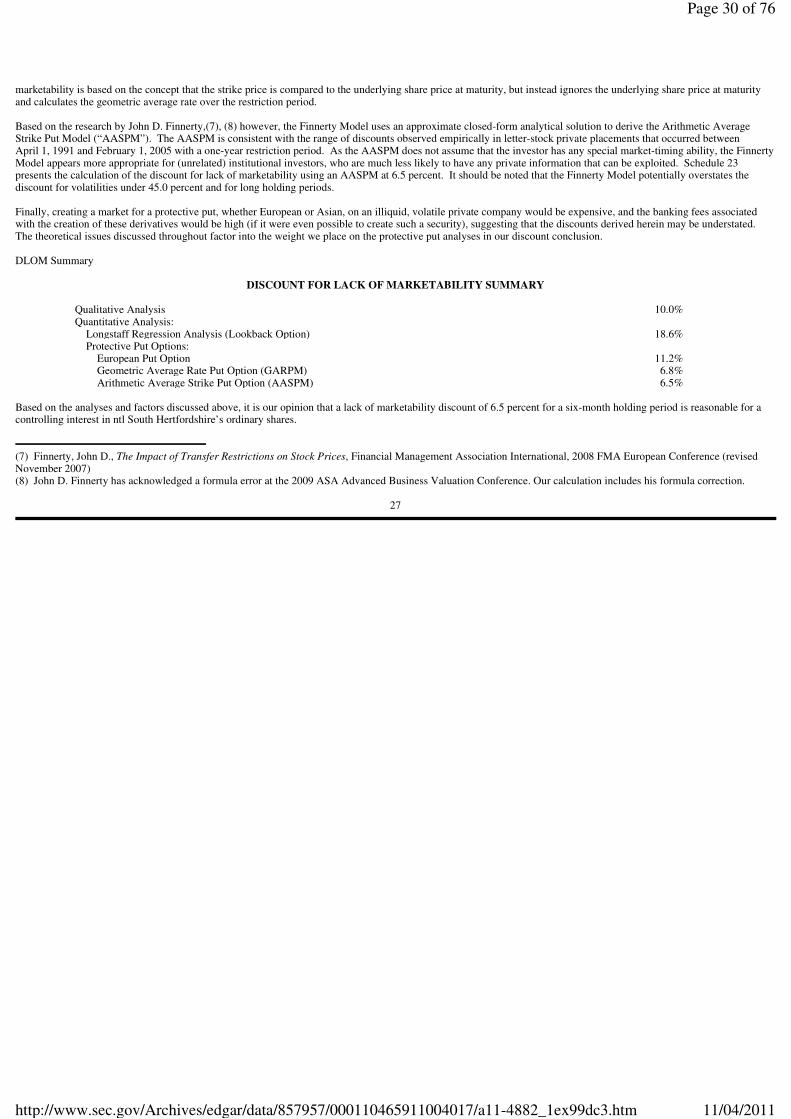
marketability is based on the concept that the strike price is compared to the underlying share price at maturity, but instead ignores the underlying share price at maturity and calculates the geometric average rate over the restriction period. Based on the research by John D. Finnerty,(7), (8) however, the Finnerty Model uses an approximate closed-form analytical solution to derive the Arithmetic Average Strike Put Model (“AASPM”). The AASPM is consistent with the range of discounts observed empirically in letter-stock private placements that occurred between April 1, 1991 and February 1, 2005 with a one-year restriction period. As the AASPM does not assume that the investor has any special market-timing ability, the Finnerty Model appears more appropriate for (unrelated) institutional investors, who are much less likely to have any private information that can be exploited. Schedule 23 presents the calculation of the discount for lack of marketability using an AASPM at 6.5 percent. It should be noted that the Finnerty Model potentially overstates the discount for volatilities under 45.0 percent and for long holding periods. Finally, creating a market for a protective put, whether European or Asian, on an illiquid, volatile private company would be expensive, and the banking fees associated with the creation of these derivatives would be high (if it were even possible to create such a security), suggesting that the discounts derived herein may be understated. The theoretical issues discussed throughout factor into the weight we place on the protective put analyses in our discount conclusion. DLOM Summary
DISCOUNT FOR LACK OF MARKETABILITY SUMMARY
Based on the analyses and factors discussed above, it is our opinion that a lack of marketability discount of 6.5 percent for a six-month holding period is reasonable for a controlling interest in ntl South Hertfordshire’s ordinary shares.
(7) Finnerty, John D., The Impact of Transfer Restrictions on Stock Prices, Financial Management Association International, 2008 FMA European Conference (revised November 2007) (8) John D. Finnerty has acknowledged a formula error at the 2009 ASA Advanced Business Valuation Conference. Our calculation includes his formula correction.
27
Qualitative Analysis 10.0%
Quantitative Analysis:
Longstaff Regression Analysis (Lookback Option) 18.6%
Protective Put Options:
European Put Option 11.2%
Geometric Average Rate Put Option (GARPM) 6.8%
Arithmetic Average Strike Put Option (AASPM) 6.5%
Page 30 of 76
11/04/2011http://www.sec.gov/Archives/edgar/data/857957/000110465911004017/a11-4882_1ex99dc3.htm

Conclusion of Value Based upon the information and financial data provided and management representations received, as well as the analyses performed, summarized and discussed herein, the fair market value of a controlling, for potential acquisition purposes, as of September 30, 2010, is £12,879,000 (or US $20,260,000 at the spot rate of $1.5731 per GBP £), as shown in Schedule 19.
28
Page 31 of 76
11/04/2011http://www.sec.gov/Archives/edgar/data/857957/000110465911004017/a11-4882_1ex99dc3.htm

Appraiser Representation/Certification We certify that, to the best of our knowledge and belief: • The statements of fact contained in this detailed valuation report are true and correct. • The reported analyses, opinions, and calculations are limited only by the reported assumptions and limiting conditions, and are our personal, impartial, independent,
unbiased, objective professional analyses, opinions, and calculations. • We have no present or prospective financial or other interest in the business or property that is the subject of this report, and we have no personal financial or other
interest with respect to the business, property or parties involved. • We have no bias with respect to the business or property that is the subject of this report or to the parties involved with this assignment. • Our engagement in this assignment was not contingent upon developing or reporting predetermined results. • Our compensation for completing this assignment is fee-based and is not contingent upon the development or reporting of a predetermined value or direction in
value that favors the cause of the client, the outcome of this calculation, the amount of the value calculation, the attainment of a stipulated result, or the occurrence of a subsequent event directly related to the intended use of this appraisal.
• The economic and industry data included in the valuation report have been obtained from various printed or electronic reference sources that the valuation analyst
believes to be reliable. The valuation analyst has not performed any corroborating procedures to substantiate that data. • Our analyses, opinions, calculations and this valuation report were developed in conformity with the 2008 American Institute of Certified Public Accountants’
Statement on Standards for Valuation Services No. 1 and the 2010-2011 Uniform Standards of Professional Appraisal Practice as promulgated by the Appraisal Foundation.
29
Page 32 of 76
11/04/2011http://www.sec.gov/Archives/edgar/data/857957/000110465911004017/a11-4882_1ex99dc3.htm

• The parties for which the information and use of the calculation report is restricted are identified; the calculation report is not intended to be and should not be used
by anyone other than such parties. • The valuation analyst has no obligation to update the report or the calculation of value for information that comes to his/her attention after the date of the report. • This report and analysis were prepared under the direction of Neil J. Beaton with significant professional assistance from Brent E. Sloan. Mr. Beaton is a Certified
Public Accountant licensed in the State of Washington and is accredited in business valuation by the American Institute of Certified Public Accountants. Mr. Beaton and Mr. Sloan are Accredited Senior Appraisers with the American Society of Appraisers, and Mr. Beaton is also a Chartered Financial Analyst.
• No one other than the staff of Grant Thornton LLP provided significant professional assistance to the individual(s) signing this report. Biographies of the
undersigned follow this certification.
Virgin Media Limited
Valuation of Fair Market Value in ntl (South Hertfordshire) Limited
As of September 30, 2010
November 24, 2010
30
Neil J. Beaton, CPA/ABV/CFF, CFA, ASA Brent E. Sloan, ASA
Partner in Charge, Advisory Services Senior Manager, Advisory Services
Page 33 of 76
11/04/2011http://www.sec.gov/Archives/edgar/data/857957/000110465911004017/a11-4882_1ex99dc3.htm
Neil J. Beaton CPA/ABV/CFF, CFA, ASA Partner in Charge, Advisory Services – Valuation As Partner in Charge of Grant Thornton LLP’s Valuation Services Group, Mr. Beaton specializes in the valuation of public and privately-held businesses and intangible assets for purposes of litigation support (marriage dissolutions, lost profits claims and others), acquisitions, sales, buy-sell agreements, ESOPs, incentive stock options, and estate planning and taxation. He also performs economic analysis for personal injury claims, wrongful termination and wrongful death actions. Experience Prior to joining Grant Thornton LLP, Mr. Beaton owned and operated a boutique valuation and litigation support firm in Seattle. He was also a National Business Analyst with Dun & Bradstreet Corporation, where he was responsible for analyzing large, publicly traded corporations and assisting in large-scale credit decisions. He specialized in the banking, insurance and financial services industries. Professional qualifications and memberships • Certified Public Accountant (CPA) • Accredited in Business Valuation (ABV) • Certified in Financial Forensics (CFF) • Chartered Financial Analyst (CFA) • Accredited Senior Appraiser (ASA) • American Institute of CPAs and Washington Society of CPAs • Member of the Business Valuation Update Editorial Advisory Board • Panel of Experts, Financial Valuation and Litigation Expert • Member of the AICPA Merger & Acquisition Disputes Task Force • Former Committee Member of AICPA Business Valuation Subcommittee • Co-Chair of the AICPA Valuation of Private Equity Securities Task Force • Former Chair of AICPA FASB 141/142 Task Force • Past President and Trustee of Seattle Society of Financial Analysts • Member of the CFA Institute • Former Member of the AICPA National Accreditation Commission • Former Member of the Financial Accounting Standards Board’s Valuation Resource Group
Education Mr. Beaton holds a Master of Business Administration in Finance from National University and a Bachelor of Arts Degree in Economics from Stanford University. He has also completed specific coursework covering the financial analysis of banks and insurance companies and numerous continuing education classes in the areas of accounting, taxation and business valuation. In addition, he has completed the American Society of Appraisers’ Business Valuation Courses, Levels I–IV. Contact details 520 Pike Street, Suite 2800 Seattle, WA 98101-1389 206.398.2487 Direct 206.223.4774 Fax [email protected] www.grantthornton.com
31
Page 34 of 76
11/04/2011http://www.sec.gov/Archives/edgar/data/857957/000110465911004017/a11-4882_1ex99dc3.htm
Brent E. Sloan ASA
Senior Manager, Advisory Services – Valuation
A Senior Manager at Grant Thornton LLP, Mr. Sloan specializes in the valuation of public and closely-held businesses and business segments, intangible assets, intellectual property and related matters for purposes of financial statement reporting, corporate planning, litigation support and other purposes. Mr. Sloan’s primary focus has been in providing intangible asset purchase price allocation and goodwill impairment testing analyses for financial statement reporting purposes (SFAS 141/141R and 144/142, IFRS 3 and IAS 38), and valuing securities (stock options and other equity-based awards) issued as deferred compensation subject to compliance with ASC 718 (SFAS 123R), IRC 409A and SEC/AICPA “cheap stock” regulations. Experience Mr. Sloan has a broad base of experience in a variety of industries, with specific focus in telecommunications sectors – including: multiple system operators (MSOs, aka cable broadband systems); domestic and emerging market wireless carriers; mobile satellite service; Internet Service Providers; and telecom equipment manufacturers for Next-Generation-Network deployments. Prior to joining Grant Thornton LLP, Mr. Sloan was a Financial Analyst at a boutique valuation and litigation support firm in Seattle. He began his valuation and consulting career at a boutique transaction advisory and management consulting services firm in the Pacific Northwest. Professional qualifications and memberships • Accredited Senior Appraiser (ASA), granted by the American Society of Appraisers Presentations and publications • Co-Author, Valuation of Contingencies under SFAS 141R, ASA BV 302 Special Topics in the Valuation of Intangible Assets course • Presenter, Business Valuation in the Delaware Chancery, 2008 AGN North American Regional Meeting • Presenter, SFAS 141, Business Combinations, 2007 WSCPA Business Valuation & Litigation Services Conference • Co-Presenter, Hi-Tech: Early Stage Valuation & IRC 409A Compliance, 2006 AICPA National Business Valuation Conference • Contributing author, Financial Valuation: Applications and Models (John Wiley & Sons, 2006, 2 Ed.) Education Mr. Sloan holds a Bachelor of Arts in Business Administration, with a major in Finance and a minor in Economics from Seattle University. Contact details 520 Pike Street, Suite 2800 Seattle, WA 98101-1389 206.398.2478 Direct 206.223.4774 Fax [email protected] www.grantthornton.com
32
nd
Page 35 of 76
11/04/2011http://www.sec.gov/Archives/edgar/data/857957/000110465911004017/a11-4882_1ex99dc3.htm
Assumptions and Limiting Conditions The primary assumptions and limiting conditions pertaining to the value estimate conclusion(s) stated in this valuation report (report) are summarized below. Other assumptions are cited elsewhere in this report.
1. The conclusions of value arrived at herein pertains only to the subject business, the stated value standard (fair market value), as of the stated valuation date, and only for the stated valuation purpose(s).
2. Financial statements and other related information provided by Virgin Media and the Company or their representatives, in the course of this engagement, have been
accepted without any verification as fully and correctly reflecting the enterprise’s business conditions and operating results for the respective periods, except as specifically noted herein. Grant Thornton has not audited, reviewed, or compiled the financial information provided to us and, accordingly, we express no audit opinion or any other form of assurance on this information.
3. While we have relied on the financial forecasts, as prepared by us, in our analysis, we have not examined the projected or forecast data or the underlying
assumptions in accordance with the standards prescribed by the AICPA and do not express an opinion or any other form of assurance on the projected or forecast data and related assumptions. The future may not occur as anticipated, and actual operating results may vary significantly from the estimates included in this report.
4. Public information and industry and statistical information have been obtained from sources we believe to be reliable. However, we make no representation as to
the accuracy or completeness of such information and have performed no procedures to corroborate the information. 5. If prospective financial information approved by Company management has been used in our work, we have not examined or compiled the prospective financial
information and therefore, do not express an audit opinion or any other form of assurance on the prospective financial information or the related assumptions. Events and circumstances frequently do not occur as expected; achievement of the forecast results is dependent on actions, plans, and assumptions of management.
33
Page 36 of 76
11/04/2011http://www.sec.gov/Archives/edgar/data/857957/000110465911004017/a11-4882_1ex99dc3.htm
6. The conclusion of value arrived at herein is based on the assumption that the current level of management expertise and effectiveness would continue to be
maintained and that the character and integrity of the enterprise through any sale, reorganization, exchange, or diminution of the owners’ participation would not be materially or significantly changed.
7. This report and the conclusion of value arrived at herein are for the exclusive use of our client for the sole and specific purposes as noted herein. The report may be
used internally by Company management and may be made available to the Company’s legal advisors, tax advisors, or regulatory authorities consistent with the purpose of this engagement. The report is not to be used for other purposes or be shared with other parties without our prior written consent.
8. Grant Thornton LLP will not provide consent to be a named expert in any filings, including, without limitation, any filings with the U.S. Securities and Exchange
Commission under the Securities Act of 1933 or the Securities Exchange Act of 1934, as amended. 9. Prior to the use of Grant Thornton’s name in any document, including, but not limited to, filings with any regulatory agency, Client will provide the relevant extract
in draft of the proposed disclosure and obtain written approval from Grant Thornton as to the use of Grant Thornton’s name. 10. The report and conclusion of value are not intended by the author and should not be construed by the reader to be investment advice in any manner whatsoever. The
conclusion of value represents the considered opinion of Grant Thornton, based on information furnished to them by the Company and other sources. 11. Neither all nor any part of the contents of this report (especially the calculation of value, the identity of any valuation specialist(s), or the firm with which such
valuation specialists are connected or any reference to any of their professional designations) should be disseminated to the public through advertising media, public relations, news media, sales media, mail, direct transmittal, or any other means of communication, including but not limited to the SEC or other governmental agency, without the prior written consent and approval of Grant Thornton.
12. Future services regarding the subject matter of this report, including, but not limited to testimony or attendance in court, shall not be required of Grant Thornton
unless previous arrangements have been made in writing. 13. Grant Thornton is not an environmental consultant or auditor, and it takes no responsibility for any actual or potential environmental liabilities. Any person entitled
to rely on this report, wishing to know whether such liabilities exist, or the scope and their effect on the value of the property, is encouraged to obtain a professional environmental assessment. Grant Thornton does not conduct or provide environmental assessments and has not performed one for the subject property.
14. Grant Thornton has not determined independently whether the Company is subject to any present or future liability relating to environmental matters (including, but
not limited to
34
Page 37 of 76
11/04/2011http://www.sec.gov/Archives/edgar/data/857957/000110465911004017/a11-4882_1ex99dc3.htm
CERCLA/Superfund liability) or the scope of any such liabilities. Grant Thornton’s valuation takes no such liabilities into account, except as they have been reported to Grant Thornton by the Company or by an environmental consultant working for the Company, and then only to the extent that the liability was reported to us in an actual or estimated dollar amount. Such matters, if any, are noted in the report. To the extent such information has been reported to us, Grant Thornton has relied on it without verification and offers no warranty or representation as to its accuracy or completeness.
15. Grant Thornton has not made a specific compliance survey or analysis of the subject property to determine whether it is subject to, or in compliance with, the
American Disabilities Act of 1990, and this valuation does not consider the effect, if any, of noncompliance. 16. No change of any item in this appraisal report shall be made by anyone other than Grant Thornton, and we shall have no responsibility for any such unauthorized
change. 17. Unless otherwise stated, no effort has been made to determine the possible effect, if any, on the subject business due to future Federal, state, or local legislation,
including any environmental or ecological matters or interpretations thereof. 18. We have conducted interviews with the current management of the Company concerning the past, present, and prospective operating results of the Company. 19. Except as noted, we have relied on the representations of the owners, management, and other third parties concerning the value and useful condition of all
equipment, real estate, investments used in the business, and any other assets or liabilities, except as specifically stated to the contrary in this report. We have not attempted to confirm whether or not all assets of the business are free and clear of liens and encumbrances or that the entity has good title to all assets.
20. Unless otherwise stated in the appraisal, the conclusion of the value of the business has not considered or incorporated the potential economic gain or loss resulting
from contingent assets, liabilities or events existing as of the valuation date.
21. We have no responsibility or obligation to update this report for events or circumstances occurring subsequent to the date of this report. 22. Unless stated otherwise in this report, we express no opinion as to: 1) the tax consequences of any transaction which may result, 2) the effect of the tax
consequences of any net value received or to be received as a result of a transaction, and 3) the possible impact on the market value resulting from any need to effect a transaction to pay taxes.
23. Our work was performed and this report is in compliance with the reporting standards under the AICPA’s Statement on Standards for Valuation Services No. 1.
35
Page 38 of 76
11/04/2011http://www.sec.gov/Archives/edgar/data/857957/000110465911004017/a11-4882_1ex99dc3.htm

Addenda
36
Page 39 of 76
11/04/2011http://www.sec.gov/Archives/edgar/data/857957/000110465911004017/a11-4882_1ex99dc3.htm

© Grant Thornton LLP All rights reserved U.S. member firm of Grant Thornton International Ltd This report is confidential. Unauthorized use of this report in whole or in part is strictly prohibited.
Page 40 of 76
11/04/2011http://www.sec.gov/Archives/edgar/data/857957/000110465911004017/a11-4882_1ex99dc3.htm
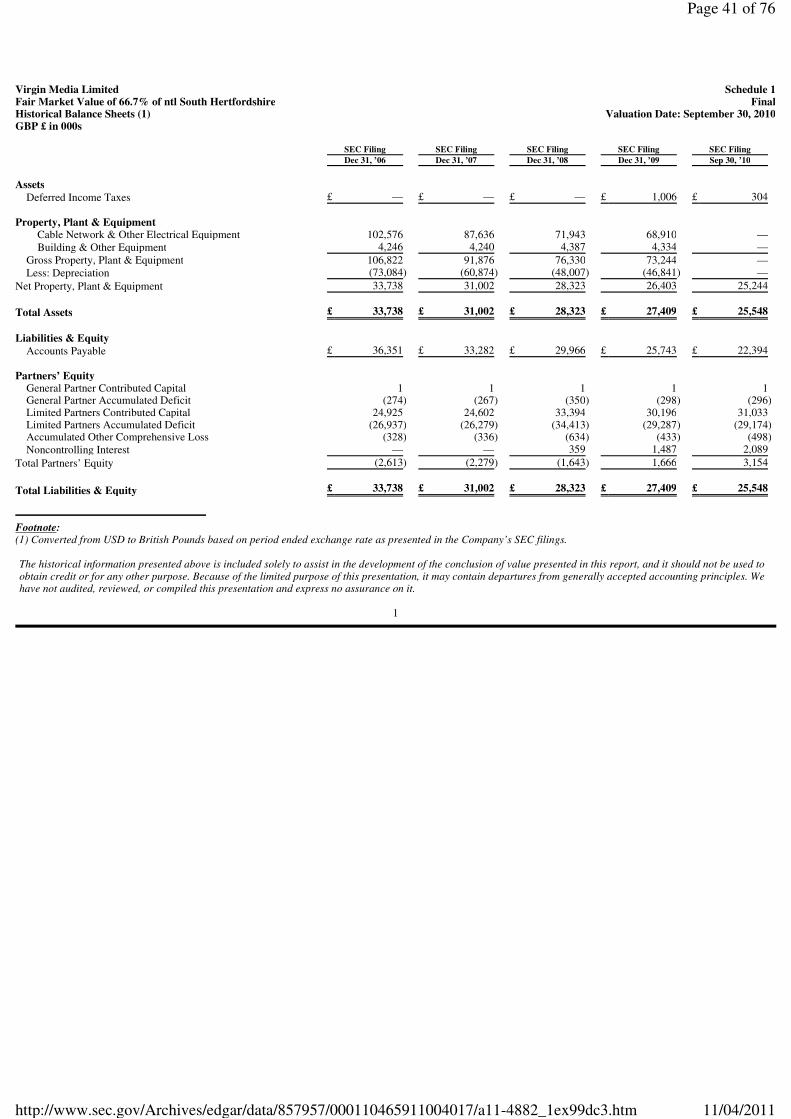
Footnote: (1) Converted from USD to British Pounds based on period ended exchange rate as presented in the Company’s SEC filings. The historical information presented above is included solely to assist in the development of the conclusion of value presented in this report, and it should not be used to obtain credit or for any other purpose. Because of the limited purpose of this presentation, it may contain departures from generally accepted accounting principles. We have not audited, reviewed, or compiled this presentation and express no assurance on it.
1
Virgin Media Limited Schedule 1Fair Market Value of 66.7% of ntl South Hertfordshire FinalHistorical Balance Sheets (1) Valuation Date: September 30, 2010GBP £ in 000s
SEC Filing SEC Filing
SEC Filing SEC Filing
SEC Filing
Dec 31, ’06 Dec 31, ’07
Dec 31, ’08 Dec 31, ’09
Sep 30, ’10
Assets
Deferred Income Taxes
£ — £ —
£ — £ 1,006
£ 304
Property, Plant & Equipment
Cable Network & Other Electrical Equipment
102,576 87,636
71,943 68,910
—
Building & Other Equipment 4,246
4,240 4,387
4,334 —
Gross Property, Plant & Equipment
106,822 91,876
76,330 73,244
—
Less: Depreciation (73,084) (60,874) (48,007) (46,841) —
Net Property, Plant & Equipment
33,738 31,002
28,323 26,403
25,244
Total Assets £ 33,738
£ 31,002 £ 28,323
£ 27,409 £ 25,548
Liabilities & Equity
Accounts Payable
£ 36,351 £ 33,282
£ 29,966 £ 25,743
£ 22,394
Partners’ Equity
General Partner Contributed Capital
1 1
1 1
1
General Partner Accumulated Deficit (274) (267) (350) (298) (296)
Limited Partners Contributed Capital 24,925
24,602 33,394
30,196 31,033
Limited Partners Accumulated Deficit
(26,937) (26,279) (34,413) (29,287) (29,174) Accumulated Other Comprehensive Loss
(328) (336) (634) (433) (498) Noncontrolling Interest
— —
359 1,487
2,089
Total Partners’ Equity (2,613) (2,279) (1,643) 1,666
3,154
Total Liabilities & Equity £ 33,738
£ 31,002 £ 28,323
£ 27,409 £ 25,548
Page 41 of 76
11/04/2011http://www.sec.gov/Archives/edgar/data/857957/000110465911004017/a11-4882_1ex99dc3.htm
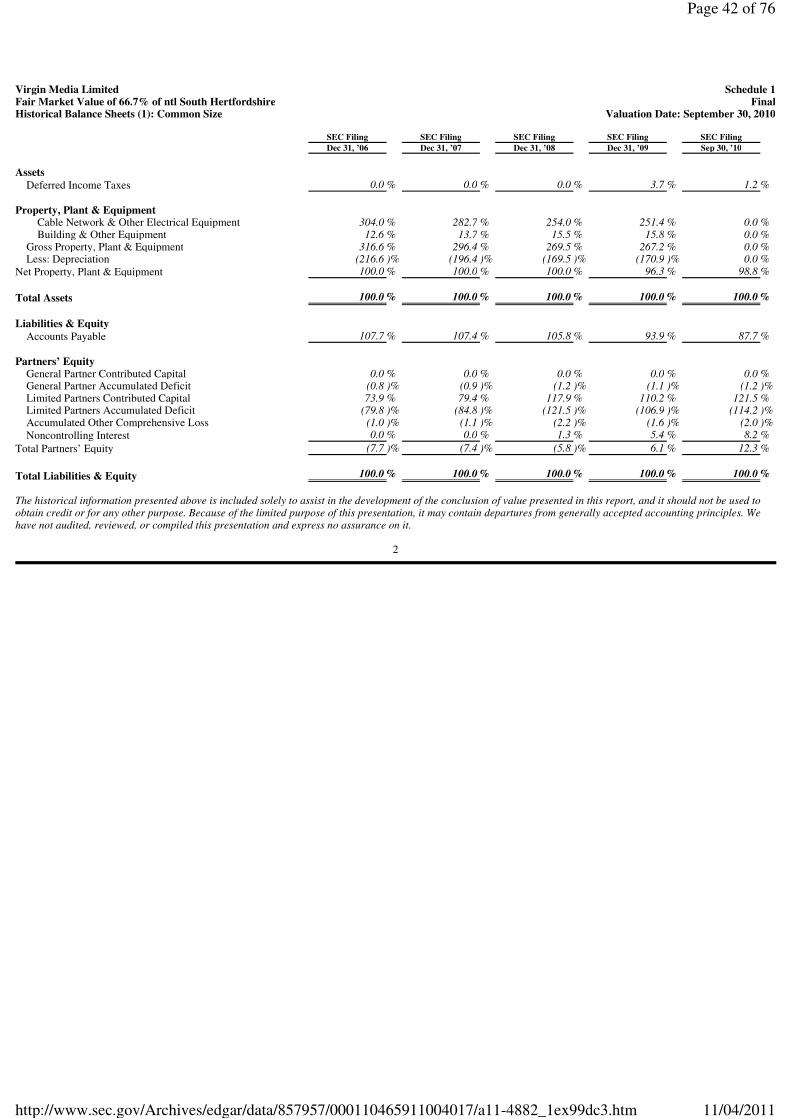
The historical information presented above is included solely to assist in the development of the conclusion of value presented in this report, and it should not be used to obtain credit or for any other purpose. Because of the limited purpose of this presentation, it may contain departures from generally accepted accounting principles. We have not audited, reviewed, or compiled this presentation and express no assurance on it.
2
Virgin Media Limited Schedule 1Fair Market Value of 66.7% of ntl South Hertfordshire FinalHistorical Balance Sheets (1): Common Size Valuation Date: September 30, 2010
SEC Filing SEC Filing
SEC Filing SEC Filing
SEC Filing
Dec 31, ’06 Dec 31, ’07
Dec 31, ’08 Dec 31, ’09
Sep 30, ’10
Assets
Deferred Income Taxes
0.0 % 0.0 % 0.0 % 3.7 % 1.2 %
Property, Plant & Equipment
Cable Network & Other Electrical Equipment
304.0 % 282.7 % 254.0 % 251.4 % 0.0 %
Building & Other Equipment 12.6 % 13.7 % 15.5 % 15.8 % 0.0 %
Gross Property, Plant & Equipment 316.6 % 296.4 % 269.5 % 267.2 % 0.0 %
Less: Depreciation (216.6 )% (196.4 )% (169.5 )% (170.9 )% 0.0 %
Net Property, Plant & Equipment 100.0 % 100.0 % 100.0 % 96.3 % 98.8 %
Total Assets 100.0 % 100.0 % 100.0 % 100.0 % 100.0 %
Liabilities & Equity
Accounts Payable
107.7 % 107.4 % 105.8 % 93.9 % 87.7 %
Partners’ Equity
General Partner Contributed Capital
0.0 % 0.0 % 0.0 % 0.0 % 0.0 % General Partner Accumulated Deficit
(0.8 )% (0.9 )% (1.2 )% (1.1 )% (1.2 )%
Limited Partners Contributed Capital 73.9 % 79.4 % 117.9 % 110.2 % 121.5 %
Limited Partners Accumulated Deficit (79.8 )% (84.8 )% (121.5 )% (106.9 )% (114.2 )%
Accumulated Other Comprehensive Loss (1.0 )% (1.1 )% (2.2 )% (1.6 )% (2.0 )%
Noncontrolling Interest 0.0 % 0.0 % 1.3 % 5.4 % 8.2 %
Total Partners’ Equity (7.7 )% (7.4 )% (5.8 )% 6.1 % 12.3 %
Total Liabilities & Equity 100.0 % 100.0 % 100.0 % 100.0 % 100.0 %
Page 42 of 76
11/04/2011http://www.sec.gov/Archives/edgar/data/857957/000110465911004017/a11-4882_1ex99dc3.htm
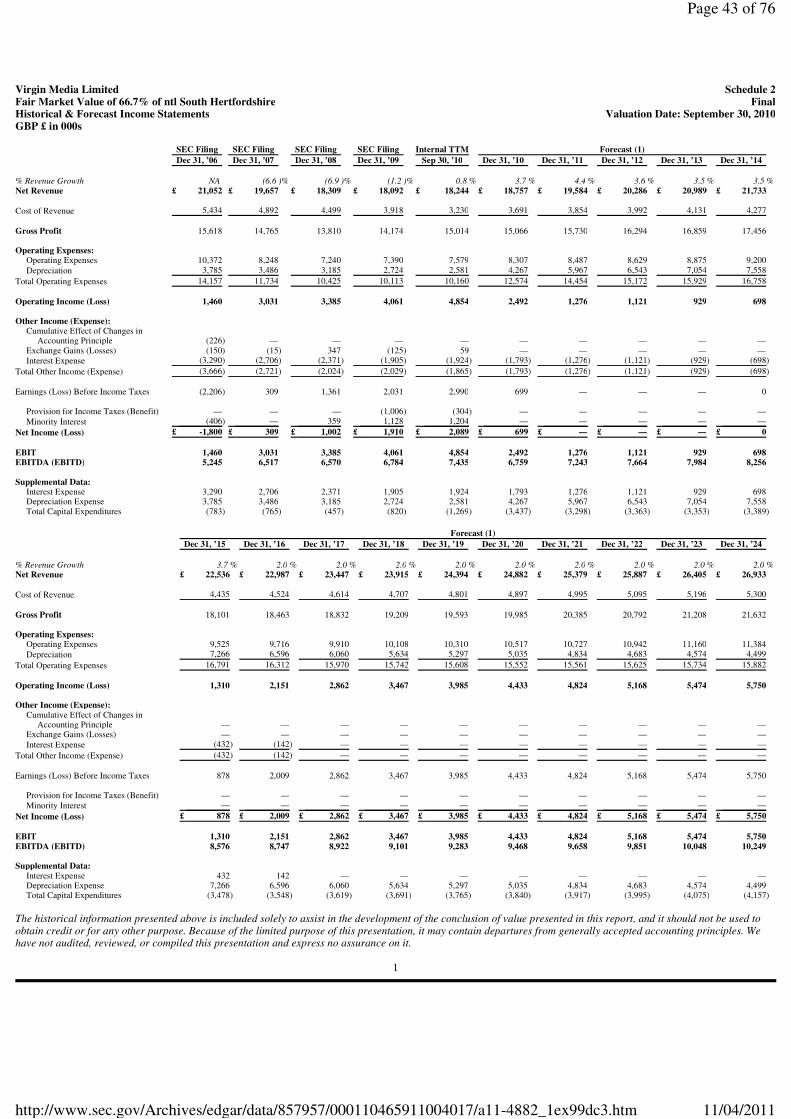
The historical information presented above is included solely to assist in the development of the conclusion of value presented in this report, and it should not be used to obtain credit or for any other purpose. Because of the limited purpose of this presentation, it may contain departures from generally accepted accounting principles. We have not audited, reviewed, or compiled this presentation and express no assurance on it.
1
Virgin Media Limited Schedule 2Fair Market Value of 66.7% of ntl South Hertfordshire FinalHistorical & Forecast Income Statements Valuation Date: September 30, 2010GBP £ in 000s
SEC Filing SEC Filing
SEC Filing SEC Filing
Internal TTM Forecast (1)
Dec 31, ’06
Dec 31, ’07 Dec 31, ’08
Dec 31, ’09 Sep 30, ’10
Dec 31, ’10 Dec 31, ’11
Dec 31, ’12 Dec 31, ’13
Dec 31, ’14
% Revenue Growth
NA (6.6 )% (6.9 )% (1.2 )% 0.8 % 3.7 % 4.4 % 3.6 % 3.5 % 3.5 %
Net Revenue £ 21,052
£ 19,657 £ 18,309
£ 18,092 £ 18,244
£ 18,757 £ 19,584
£ 20,286 £ 20,989
£ 21,733
Cost of Revenue
5,434 4,892
4,499 3,918
3,230 3,691
3,854 3,992
4,131 4,277
Gross Profit
15,618 14,765
13,810 14,174
15,014 15,066
15,730 16,294
16,859 17,456
Operating Expenses:
Operating Expenses
10,372 8,248
7,240 7,390
7,579 8,307
8,487 8,629
8,875 9,200
Depreciation
3,785 3,486
3,185 2,724
2,581 4,267
5,967 6,543
7,054 7,558
Total Operating Expenses
14,157 11,734
10,425 10,113
10,160 12,574
14,454 15,172
15,929 16,758
Operating Income (Loss)
1,460 3,031
3,385 4,061
4,854 2,492
1,276 1,121
929 698
Other Income (Expense):
Cumulative Effect of Changes in
Accounting Principle (226) —
— —
— —
— —
— —
Exchange Gains (Losses)
(150) (15) 347 (125) 59
— —
— —
—
Interest Expense (3,290) (2,706) (2,371) (1,905) (1,924) (1,793) (1,276) (1,121) (929) (698)
Total Other Income (Expense) (3,666) (2,721) (2,024) (2,029) (1,865) (1,793) (1,276) (1,121) (929) (698)
Earnings (Loss) Before Income Taxes
(2,206) 309 1,361
2,031 2,990
699 —
— —
0
Provision for Income Taxes (Benefit)
— —
— (1,006) (304) —
— —
— —
Minority Interest
(406) — 359
1,128 1,204
— —
— —
—
Net Income (Loss) £ -1,800
£ 309 £ 1,002
£ 1,910 £ 2,089
£ 699 £ —
£ — £ —
£ 0
EBIT
1,460 3,031
3,385 4,061
4,854 2,492
1,276 1,121
929 698
EBITDA (EBITD)
5,245 6,517
6,570 6,784
7,435 6,759
7,243 7,664
7,984 8,256
Supplemental Data:
Interest Expense
3,290 2,706
2,371 1,905
1,924 1,793
1,276 1,121
929 698
Depreciation Expense
3,785 3,486
3,185 2,724
2,581 4,267
5,967 6,543
7,054 7,558
Total Capital Expenditures
(783) (765) (457) (820) (1,269) (3,437) (3,298) (3,363) (3,353) (3,389)
Forecast (1)
Dec 31, ’15 Dec 31, ’16
Dec 31, ’17 Dec 31, ’18
Dec 31, ’19 Dec 31, ’20
Dec 31, ’21 Dec 31, ’22
Dec 31, ’23 Dec 31, ’24
% Revenue Growth
3.7 % 2.0 % 2.0 % 2.0 % 2.0 % 2.0 % 2.0 % 2.0 % 2.0 % 2.0 %
Net Revenue
£ 22,536 £ 22,987
£ 23,447 £ 23,915
£ 24,394 £ 24,882
£ 25,379 £ 25,887
£ 26,405 £ 26,933
Cost of Revenue
4,435
4,524 4,614
4,707 4,801
4,897 4,995
5,095 5,196
5,300
Gross Profit
18,101
18,463 18,832
19,209 19,593
19,985 20,385
20,792 21,208
21,632
Operating Expenses:
Operating Expenses
9,525 9,716
9,910 10,108
10,310 10,517
10,727 10,942
11,160 11,384
Depreciation
7,266
6,596 6,060
5,634 5,297
5,035 4,834
4,683 4,574
4,499
Total Operating Expenses
16,791 16,312
15,970 15,742
15,608 15,552
15,561 15,625
15,734 15,882
Operating Income (Loss)
1,310
2,151 2,862
3,467 3,985
4,433 4,824
5,168 5,474
5,750
Other Income (Expense):
Cumulative Effect of Changes in Accounting Principle
— —
— —
— —
— —
— —
Exchange Gains (Losses)
—
— —
— —
— —
— —
—
Interest Expense
(432) (142) — —
— —
— —
— —
Total Other Income (Expense)
(432) (142) —
— —
— —
— —
—
Earnings (Loss) Before Income Taxes
878
2,009 2,862
3,467 3,985
4,433 4,824
5,168 5,474
5,750
Provision for Income Taxes (Benefit)
—
— —
— —
— —
— —
—
Minority Interest
— —
— —
— —
— —
— —
Net Income (Loss)
£ 878
£ 2,009 £ 2,862
£ 3,467 £ 3,985
£ 4,433 £ 4,824
£ 5,168 £ 5,474
£ 5,750
EBIT
1,310
2,151 2,862
3,467 3,985
4,433 4,824
5,168 5,474
5,750
EBITDA (EBITD)
8,576 8,747
8,922 9,101
9,283 9,468
9,658 9,851
10,048 10,249
Supplemental Data:
Interest Expense
432 142
— —
— —
— —
— —
Depreciation Expense
7,266
6,596 6,060
5,634 5,297
5,035 4,834
4,683 4,574
4,499
Total Capital Expenditures
(3,478) (3,548) (3,619) (3,691) (3,765) (3,840) (3,917) (3,995) (4,075) (4,157)
Page 43 of 76
11/04/2011http://www.sec.gov/Archives/edgar/data/857957/000110465911004017/a11-4882_1ex99dc3.htm
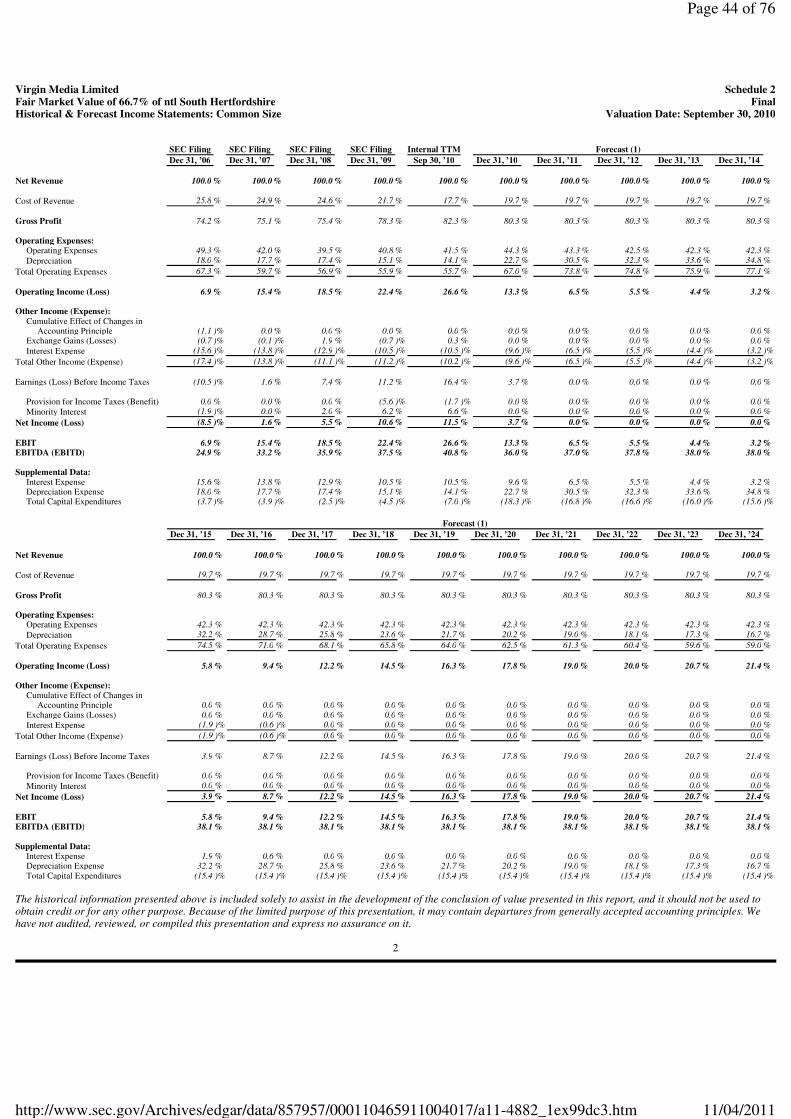
The historical information presented above is included solely to assist in the development of the conclusion of value presented in this report, and it should not be used to obtain credit or for any other purpose. Because of the limited purpose of this presentation, it may contain departures from generally accepted accounting principles. We have not audited, reviewed, or compiled this presentation and express no assurance on it.
2
Virgin Media Limited Schedule 2
Fair Market Value of 66.7% of ntl South Hertfordshire Final
Historical & Forecast Income Statements: Common Size Valuation Date: September 30, 2010
SEC Filing SEC Filing
SEC Filing SEC Filing
Internal TTM Forecast (1)
Dec 31, ’06
Dec 31, ’07 Dec 31, ’08
Dec 31, ’09 Sep 30, ’10
Dec 31, ’10 Dec 31, ’11
Dec 31, ’12 Dec 31, ’13
Dec 31, ’14
Net Revenue
100.0 % 100.0 % 100.0 % 100.0 % 100.0 % 100.0 % 100.0 % 100.0 % 100.0 % 100.0 % Cost of Revenue
25.8 % 24.9 % 24.6 % 21.7 % 17.7 % 19.7 % 19.7 % 19.7 % 19.7 % 19.7 % Gross Profit
74.2 % 75.1 % 75.4 % 78.3 % 82.3 % 80.3 % 80.3 % 80.3 % 80.3 % 80.3 % Operating Expenses:
Operating Expenses
49.3 % 42.0 % 39.5 % 40.8 % 41.5 % 44.3 % 43.3 % 42.5 % 42.3 % 42.3 % Depreciation
18.0 % 17.7 % 17.4 % 15.1 % 14.1 % 22.7 % 30.5 % 32.3 % 33.6 % 34.8 % Total Operating Expenses
67.3 % 59.7 % 56.9 % 55.9 % 55.7 % 67.0 % 73.8 % 74.8 % 75.9 % 77.1 % Operating Income (Loss)
6.9 % 15.4 % 18.5 % 22.4 % 26.6 % 13.3 % 6.5 % 5.5 % 4.4 % 3.2 % Other Income (Expense):
Cumulative Effect of Changes in
Accounting Principle (1.1 )% 0.0 % 0.0 % 0.0 % 0.0 % 0.0 % 0.0 % 0.0 % 0.0 % 0.0 %
Exchange Gains (Losses) (0.7 )% (0.1 )% 1.9 % (0.7 )% 0.3 % 0.0 % 0.0 % 0.0 % 0.0 % 0.0 %
Interest Expense (15.6 )% (13.8 )% (12.9 )% (10.5 )% (10.5 )% (9.6 )% (6.5 )% (5.5 )% (4.4 )% (3.2 )%
Total Other Income (Expense) (17.4 )% (13.8 )% (11.1 )% (11.2 )% (10.2 )% (9.6 )% (6.5 )% (5.5 )% (4.4 )% (3.2 )%
Earnings (Loss) Before Income Taxes
(10.5 )% 1.6 % 7.4 % 11.2 % 16.4 % 3.7 % 0.0 % 0.0 % 0.0 % 0.0 % Provision for Income Taxes (Benefit)
0.0 % 0.0 % 0.0 % (5.6 )% (1.7 )% 0.0 % 0.0 % 0.0 % 0.0 % 0.0 % Minority Interest
(1.9 )% 0.0 % 2.0 % 6.2 % 6.6 % 0.0 % 0.0 % 0.0 % 0.0 % 0.0 % Net Income (Loss)
(8.5 )% 1.6 % 5.5 % 10.6 % 11.5 % 3.7 % 0.0 % 0.0 % 0.0 % 0.0 % EBIT
6.9 % 15.4 % 18.5 % 22.4 % 26.6 % 13.3 % 6.5 % 5.5 % 4.4 % 3.2 % EBITDA (EBITD)
24.9 % 33.2 % 35.9 % 37.5 % 40.8 % 36.0 % 37.0 % 37.8 % 38.0 % 38.0 % Supplemental Data:
Interest Expense
15.6 % 13.8 % 12.9 % 10.5 % 10.5 % 9.6 % 6.5 % 5.5 % 4.4 % 3.2 % Depreciation Expense
18.0 % 17.7 % 17.4 % 15.1 % 14.1 % 22.7 % 30.5 % 32.3 % 33.6 % 34.8 % Total Capital Expenditures
(3.7 )% (3.9 )% (2.5 )% (4.5 )% (7.0 )% (18.3 )% (16.8 )% (16.6 )% (16.0 )% (15.6 )%
Forecast (1)
Dec 31, ’15 Dec 31, ’16
Dec 31, ’17 Dec 31, ’18
Dec 31, ’19 Dec 31, ’20
Dec 31, ’21 Dec 31, ’22
Dec 31, ’23 Dec 31, ’24
Net Revenue
100.0 % 100.0 % 100.0 % 100.0 % 100.0 % 100.0 % 100.0 % 100.0 % 100.0 % 100.0 %
Cost of Revenue
19.7 % 19.7 % 19.7 % 19.7 % 19.7 % 19.7 % 19.7 % 19.7 % 19.7 % 19.7 %
Gross Profit
80.3 % 80.3 % 80.3 % 80.3 % 80.3 % 80.3 % 80.3 % 80.3 % 80.3 % 80.3 %
Operating Expenses:
Operating Expenses
42.3 % 42.3 % 42.3 % 42.3 % 42.3 % 42.3 % 42.3 % 42.3 % 42.3 % 42.3 % Depreciation
32.2 % 28.7 % 25.8 % 23.6 % 21.7 % 20.2 % 19.0 % 18.1 % 17.3 % 16.7 %
Total Operating Expenses
74.5 % 71.0 % 68.1 % 65.8 % 64.0 % 62.5 % 61.3 % 60.4 % 59.6 % 59.0 % Operating Income (Loss)
5.8 % 9.4 % 12.2 % 14.5 % 16.3 % 17.8 % 19.0 % 20.0 % 20.7 % 21.4 %
Other Income (Expense):
Cumulative Effect of Changes in Accounting Principle
0.0 % 0.0 % 0.0 % 0.0 % 0.0 % 0.0 % 0.0 % 0.0 % 0.0 % 0.0 % Exchange Gains (Losses)
0.0 % 0.0 % 0.0 % 0.0 % 0.0 % 0.0 % 0.0 % 0.0 % 0.0 % 0.0 %
Interest Expense
(1.9 )% (0.6 )% 0.0 % 0.0 % 0.0 % 0.0 % 0.0 % 0.0 % 0.0 % 0.0 % Total Other Income (Expense)
(1.9 )% (0.6 )% 0.0 % 0.0 % 0.0 % 0.0 % 0.0 % 0.0 % 0.0 % 0.0 %
Earnings (Loss) Before Income Taxes
3.9 % 8.7 % 12.2 % 14.5 % 16.3 % 17.8 % 19.0 % 20.0 % 20.7 % 21.4 %
Provision for Income Taxes (Benefit)
0.0 % 0.0 % 0.0 % 0.0 % 0.0 % 0.0 % 0.0 % 0.0 % 0.0 % 0.0 %
Minority Interest
0.0 % 0.0 % 0.0 % 0.0 % 0.0 % 0.0 % 0.0 % 0.0 % 0.0 % 0.0 % Net Income (Loss)
3.9 % 8.7 % 12.2 % 14.5 % 16.3 % 17.8 % 19.0 % 20.0 % 20.7 % 21.4 %
EBIT
5.8 % 9.4 % 12.2 % 14.5 % 16.3 % 17.8 % 19.0 % 20.0 % 20.7 % 21.4 %
EBITDA (EBITD)
38.1 % 38.1 % 38.1 % 38.1 % 38.1 % 38.1 % 38.1 % 38.1 % 38.1 % 38.1 % Supplemental Data:
Interest Expense
1.9 % 0.6 % 0.0 % 0.0 % 0.0 % 0.0 % 0.0 % 0.0 % 0.0 % 0.0 % Depreciation Expense
32.2 % 28.7 % 25.8 % 23.6 % 21.7 % 20.2 % 19.0 % 18.1 % 17.3 % 16.7 %
Total Capital Expenditures
(15.4 )% (15.4 )% (15.4 )% (15.4 )% (15.4 )% (15.4 )% (15.4 )% (15.4 )% (15.4 )% (15.4 )%
Page 44 of 76
11/04/2011http://www.sec.gov/Archives/edgar/data/857957/000110465911004017/a11-4882_1ex99dc3.htm
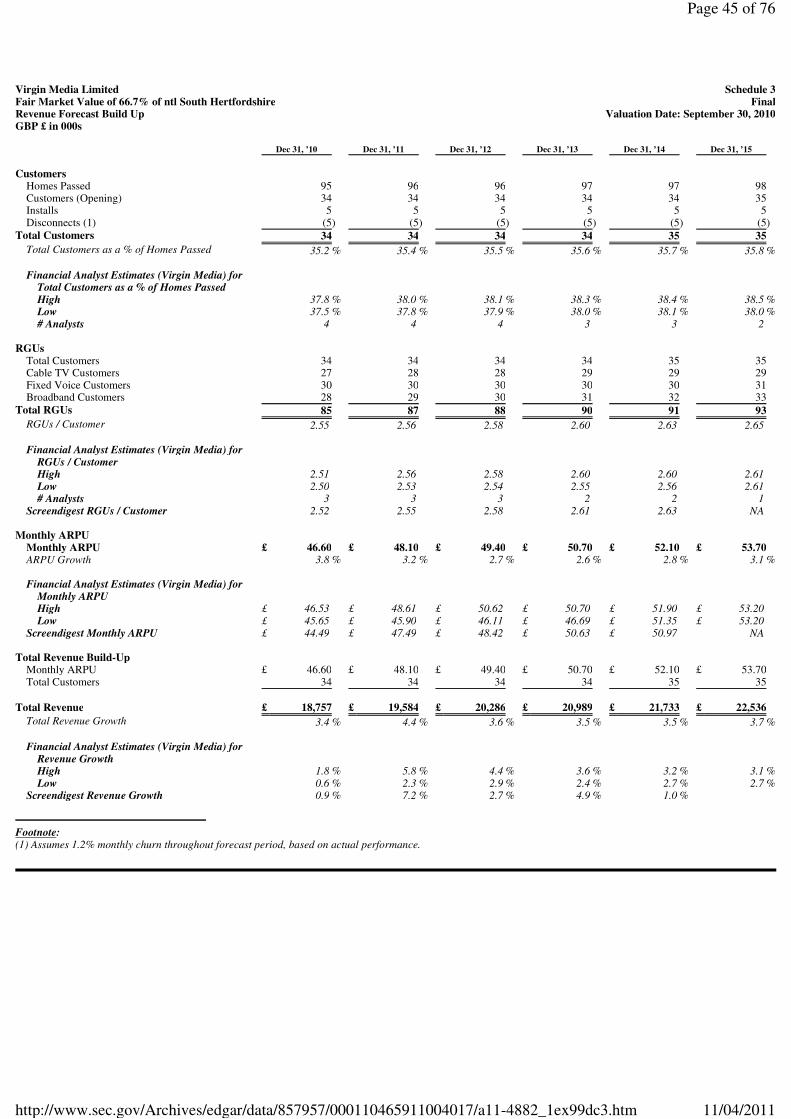
Footnote: (1) Assumes 1.2% monthly churn throughout forecast period, based on actual performance.
Virgin Media Limited Schedule 3Fair Market Value of 66.7% of ntl South Hertfordshire FinalRevenue Forecast Build Up Valuation Date: September 30, 2010GBP £ in 000s
Dec 31, ’10 Dec 31, ’11
Dec 31, ’12 Dec 31, ’13
Dec 31, ’14 Dec 31, ’15
Customers
Homes Passed
95 96
96 97
97 98
Customers (Opening)
34 34
34 34
34 35
Installs
5 5
5 5
5 5
Disconnects (1)
(5) (5) (5) (5) (5) (5) Total Customers
34 34
34 34
35 35
Total Customers as a % of Homes Passed
35.2 % 35.4 % 35.5 % 35.6 % 35.7 % 35.8 % Financial Analyst Estimates (Virgin Media) for
Total Customers as a % of Homes Passed
High 37.8 % 38.0 % 38.1 % 38.3 % 38.4 % 38.5 %
Low 37.5 % 37.8 % 37.9 % 38.0 % 38.1 % 38.0 %
# Analysts 4
4 4
3 3
2
RGUs
Total Customers
34 34
34 34
35 35
Cable TV Customers
27 28
28 29
29 29
Fixed Voice Customers
30 30
30 30
30 31
Broadband Customers
28 29
30 31
32 33
Total RGUs
85 87
88 90
91 93
RGUs / Customer
2.55 2.56
2.58 2.60
2.63 2.65
Financial Analyst Estimates (Virgin Media) for
RGUs / Customer
High 2.51
2.56 2.58
2.60 2.60
2.61
Low 2.50
2.53 2.54
2.55 2.56
2.61
# Analysts 3
3 3
2 2
1
Screendigest RGUs / Customer 2.52
2.55 2.58
2.61 2.63
NA
Monthly ARPU
Monthly ARPU
£ 46.60 £ 48.10
£ 49.40 £ 50.70
£ 52.10 £ 53.70
ARPU Growth
3.8 % 3.2 % 2.7 % 2.6 % 2.8 % 3.1 % Financial Analyst Estimates (Virgin Media) for
Monthly ARPU
High £ 46.53
£ 48.61 £ 50.62
£ 50.70 £ 51.90
£ 53.20
Low £ 45.65
£ 45.90 £ 46.11
£ 46.69 £ 51.35
£ 53.20
Screendigest Monthly ARPU £ 44.49
£ 47.49 £ 48.42
£ 50.63 £ 50.97
NA
Total Revenue Build-Up
Monthly ARPU
£ 46.60 £ 48.10
£ 49.40 £ 50.70
£ 52.10 £ 53.70
Total Customers
34 34
34 34
35 35
Total Revenue £ 18,757
£ 19,584 £ 20,286
£ 20,989 £ 21,733
£ 22,536
Total Revenue Growth 3.4 % 4.4 % 3.6 % 3.5 % 3.5 % 3.7 %
Financial Analyst Estimates (Virgin Media) for
Revenue Growth
High 1.8 % 5.8 % 4.4 % 3.6 % 3.2 % 3.1 %
Low 0.6 % 2.3 % 2.9 % 2.4 % 2.7 % 2.7 %
Screendigest Revenue Growth 0.9 % 7.2 % 2.7 % 4.9 % 1.0 %
Page 45 of 76
11/04/2011http://www.sec.gov/Archives/edgar/data/857957/000110465911004017/a11-4882_1ex99dc3.htm
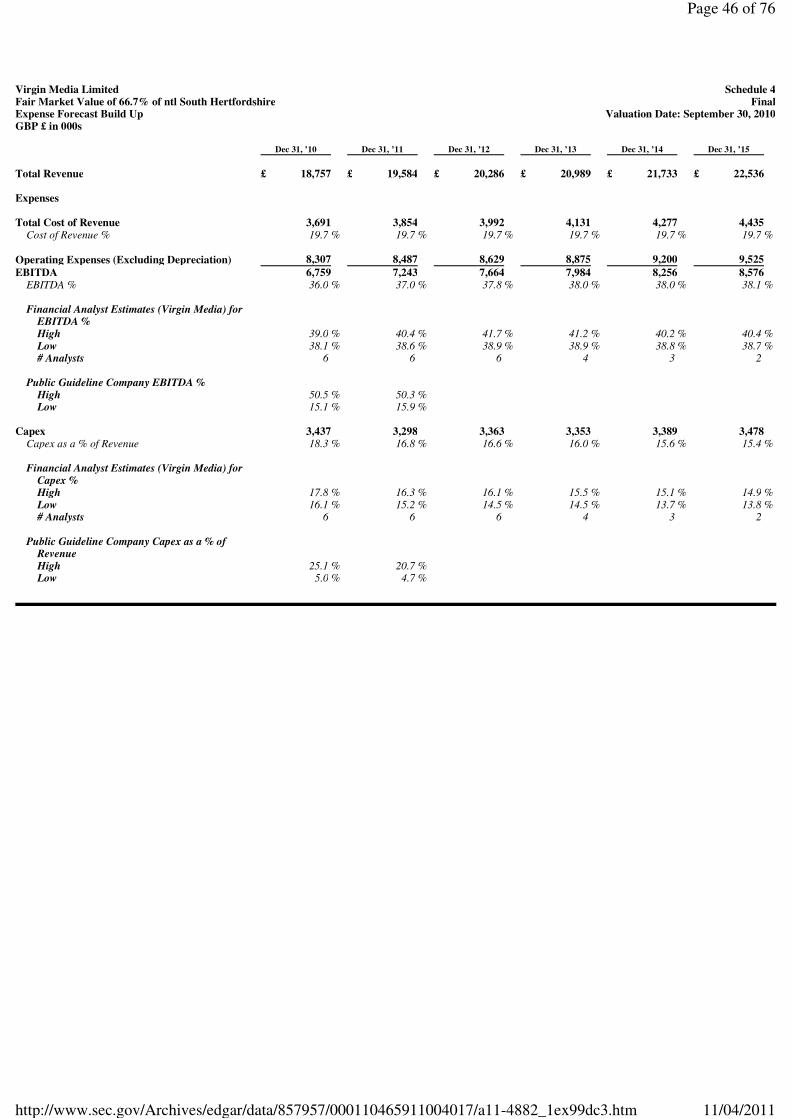
Virgin Media Limited Schedule 4Fair Market Value of 66.7% of ntl South Hertfordshire FinalExpense Forecast Build Up Valuation Date: September 30, 2010GBP £ in 000s
Dec 31, ’10 Dec 31, ’11
Dec 31, ’12 Dec 31, ’13
Dec 31, ’14 Dec 31, ’15
Total Revenue
£ 18,757 £ 19,584
£ 20,286 £ 20,989
£ 21,733 £ 22,536
Expenses
Total Cost of Revenue
3,691 3,854
3,992 4,131
4,277 4,435
Cost of Revenue %
19.7 % 19.7 % 19.7 % 19.7 % 19.7 % 19.7 % Operating Expenses (Excluding Depreciation)
8,307 8,487
8,629 8,875
9,200 9,525
EBITDA
6,759 7,243
7,664 7,984
8,256 8,576
EBITDA %
36.0 % 37.0 % 37.8 % 38.0 % 38.0 % 38.1 %
Financial Analyst Estimates (Virgin Media) for EBITDA %
High
39.0 % 40.4 % 41.7 % 41.2 % 40.2 % 40.4 %
Low 38.1 % 38.6 % 38.9 % 38.9 % 38.8 % 38.7 %
# Analysts 6
6 6
4 3
2
Public Guideline Company EBITDA %
High
50.5 % 50.3 %
Low 15.1 % 15.9 %
Capex
3,437 3,298
3,363 3,353
3,389 3,478
Capex as a % of Revenue
18.3 % 16.8 % 16.6 % 16.0 % 15.6 % 15.4 %
Financial Analyst Estimates (Virgin Media) for
Capex %
High 17.8 % 16.3 % 16.1 % 15.5 % 15.1 % 14.9 %
Low 16.1 % 15.2 % 14.5 % 14.5 % 13.7 % 13.8 %
# Analysts 6
6 6
4 3
2
Public Guideline Company Capex as a % of
Revenue
High 25.1 % 20.7 %
Low
5.0 % 4.7 %
Page 46 of 76
11/04/2011http://www.sec.gov/Archives/edgar/data/857957/000110465911004017/a11-4882_1ex99dc3.htm
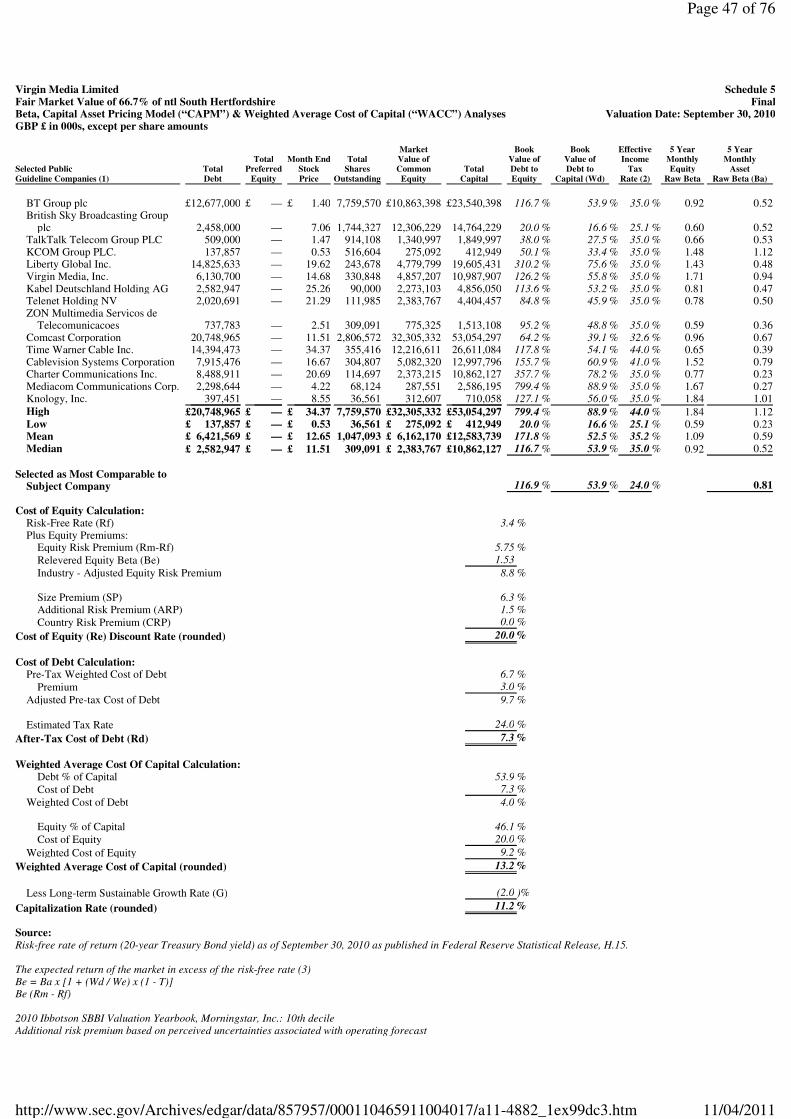
Source: Risk-free rate of return (20-year Treasury Bond yield) as of September 30, 2010 as published in Federal Reserve Statistical Release, H.15. The expected return of the market in excess of the risk-free rate (3) Be = Ba x [1 + (Wd / We) x (1 - T)] Be (Rm - Rf) 2010 Ibbotson SBBI Valuation Yearbook, Morningstar, Inc.: 10th decile Additional risk premium based on perceived uncertainties associated with operating forecast
Virgin Media Limited Schedule 5Fair Market Value of 66.7% of ntl South Hertfordshire FinalBeta, Capital Asset Pricing Model (“CAPM”) & Weighted Average Cost of Capital (“WACC”) Analyses Valuation Date: September 30, 2010GBP £ in 000s, except per share amounts
Market Book
Book Effective
5 Year 5 Year
Total
Month End Total
Value of Value of
Value of Income
Monthly Monthly
Selected Public
Total Preferred
Stock Shares
Common Total
Debt to Debt to
Tax Equity
Asset
Guideline Companies (1) Debt
Equity Price
Outstanding Equity
Capital Equity
Capital (Wd) Rate (2)
Raw Beta Raw Beta (Ba)
BT Group plc
£12,677,000 £ —
£ 1.40 7,759,570
£10,863,398 £23,540,398
116.7 % 53.9 % 35.0 % 0.92 0.52
British Sky Broadcasting Group
plc 2,458,000
— 7.06
1,744,327 12,306,229
14,764,229 20.0 % 16.6 % 25.1 % 0.60
0.52
TalkTalk Telecom Group PLC 509,000
— 1.47
914,108 1,340,997
1,849,997 38.0 % 27.5 % 35.0 % 0.66
0.53
KCOM Group PLC. 137,857
— 0.53
516,604 275,092
412,949 50.1 % 33.4 % 35.0 % 1.48
1.12
Liberty Global Inc. 14,825,633
— 19.62
243,678 4,779,799
19,605,431 310.2 % 75.6 % 35.0 % 1.43
0.48
Virgin Media, Inc. 6,130,700
— 14.68
330,848 4,857,207
10,987,907 126.2 % 55.8 % 35.0 % 1.71
0.94
Kabel Deutschland Holding AG 2,582,947
— 25.26
90,000 2,273,103
4,856,050 113.6 % 53.2 % 35.0 % 0.81
0.47
Telenet Holding NV 2,020,691
— 21.29
111,985 2,383,767
4,404,457 84.8 % 45.9 % 35.0 % 0.78
0.50
ZON Multimedia Servicos de
Telecomunicacoes 737,783
— 2.51
309,091 775,325
1,513,108 95.2 % 48.8 % 35.0 % 0.59
0.36
Comcast Corporation 20,748,965
— 11.51
2,806,572 32,305,332
53,054,297 64.2 % 39.1 % 32.6 % 0.96
0.67
Time Warner Cable Inc. 14,394,473
— 34.37
355,416 12,216,611
26,611,084 117.8 % 54.1 % 44.0 % 0.65
0.39
Cablevision Systems Corporation 7,915,476
— 16.67
304,807 5,082,320
12,997,796 155.7 % 60.9 % 41.0 % 1.52
0.79
Charter Communications Inc. 8,488,911
— 20.69
114,697 2,373,215
10,862,127 357.7 % 78.2 % 35.0 % 0.77
0.23
Mediacom Communications Corp. 2,298,644
— 4.22
68,124 287,551
2,586,195 799.4 % 88.9 % 35.0 % 1.67
0.27
Knology, Inc. 397,451
— 8.55
36,561 312,607
710,058 127.1 % 56.0 % 35.0 % 1.84
1.01
High £20,748,965
£ — £ 34.37
7,759,570 £32,305,332
£53,054,297 799.4 % 88.9 % 44.0 % 1.84
1.12
Low £ 137,857
£ — £ 0.53
36,561 £ 275,092
£ 412,949 20.0 % 16.6 % 25.1 % 0.59
0.23
Mean £ 6,421,569
£ — £ 12.65
1,047,093 £ 6,162,170
£12,583,739 171.8 % 52.5 % 35.2 % 1.09
0.59
Median £ 2,582,947
£ — £ 11.51
309,091 £ 2,383,767
£10,862,127 116.7 % 53.9 % 35.0 % 0.92
0.52
Selected as Most Comparable to
Subject Company 116.9 % 53.9 % 24.0 %
0.81
Cost of Equity Calculation:
Risk-Free Rate (Rf) 3.4 %
Plus Equity Premiums:
Equity Risk Premium (Rm-Rf) 5.75 %
Relevered Equity Beta (Be) 1.53
Industry - Adjusted Equity Risk Premium
8.8 %
Size Premium (SP)
6.3 %
Additional Risk Premium (ARP) 1.5 %
Country Risk Premium (CRP) 0.0 %
Cost of Equity (Re) Discount Rate (rounded) 20.0 %
Cost of Debt Calculation:
Pre-Tax Weighted Cost of Debt
6.7 %
Premium 3.0 %
Adjusted Pre-tax Cost of Debt 9.7 %
Estimated Tax Rate
24.0 %
After-Tax Cost of Debt (Rd) 7.3 %
Weighted Average Cost Of Capital Calculation:
Debt % of Capital
53.9 %
Cost of Debt 7.3 %
Weighted Cost of Debt 4.0 %
Equity % of Capital
46.1 %
Cost of Equity 20.0 %
Weighted Cost of Equity 9.2 %
Weighted Average Cost of Capital (rounded) 13.2 %
Less Long-term Sustainable Growth Rate (G)
(2.0 )%
Capitalization Rate (rounded) 11.2 %
Page 47 of 76
11/04/2011http://www.sec.gov/Archives/edgar/data/857957/000110465911004017/a11-4882_1ex99dc3.htm
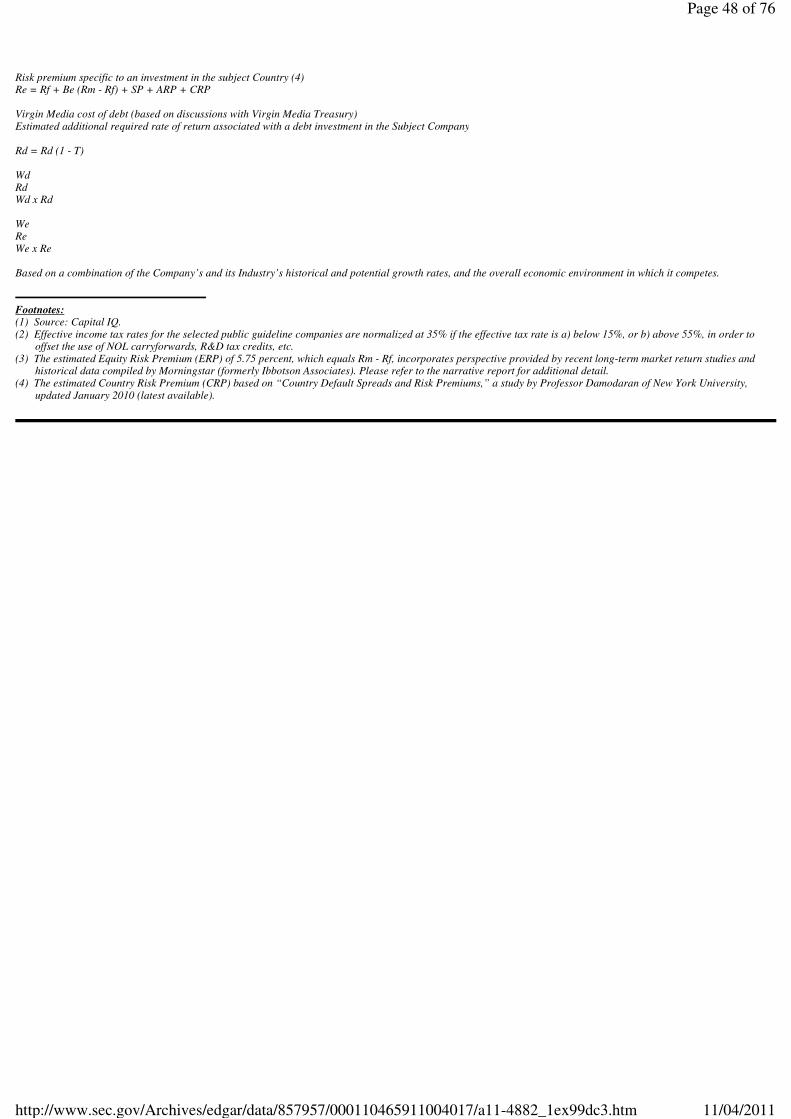
Risk premium specific to an investment in the subject Country (4) Re = Rf + Be (Rm - Rf) + SP + ARP + CRP Virgin Media cost of debt (based on discussions with Virgin Media Treasury) Estimated additional required rate of return associated with a debt investment in the Subject Company Rd = Rd (1 - T) Wd Rd Wd x Rd We Re We x Re Based on a combination of the Company’s and its Industry’s historical and potential growth rates, and the overall economic environment in which it competes.
Footnotes: (1) Source: Capital IQ. (2) Effective income tax rates for the selected public guideline companies are normalized at 35% if the effective tax rate is a) below 15%, or b) above 55%, in order to
offset the use of NOL carryforwards, R&D tax credits, etc. (3) The estimated Equity Risk Premium (ERP) of 5.75 percent, which equals Rm - Rf, incorporates perspective provided by recent long-term market return studies and
historical data compiled by Morningstar (formerly Ibbotson Associates). Please refer to the narrative report for additional detail. (4) The estimated Country Risk Premium (CRP) based on “Country Default Spreads and Risk Premiums,” a study by Professor Damodaran of New York University,
updated January 2010 (latest available).
Page 48 of 76
11/04/2011http://www.sec.gov/Archives/edgar/data/857957/000110465911004017/a11-4882_1ex99dc3.htm
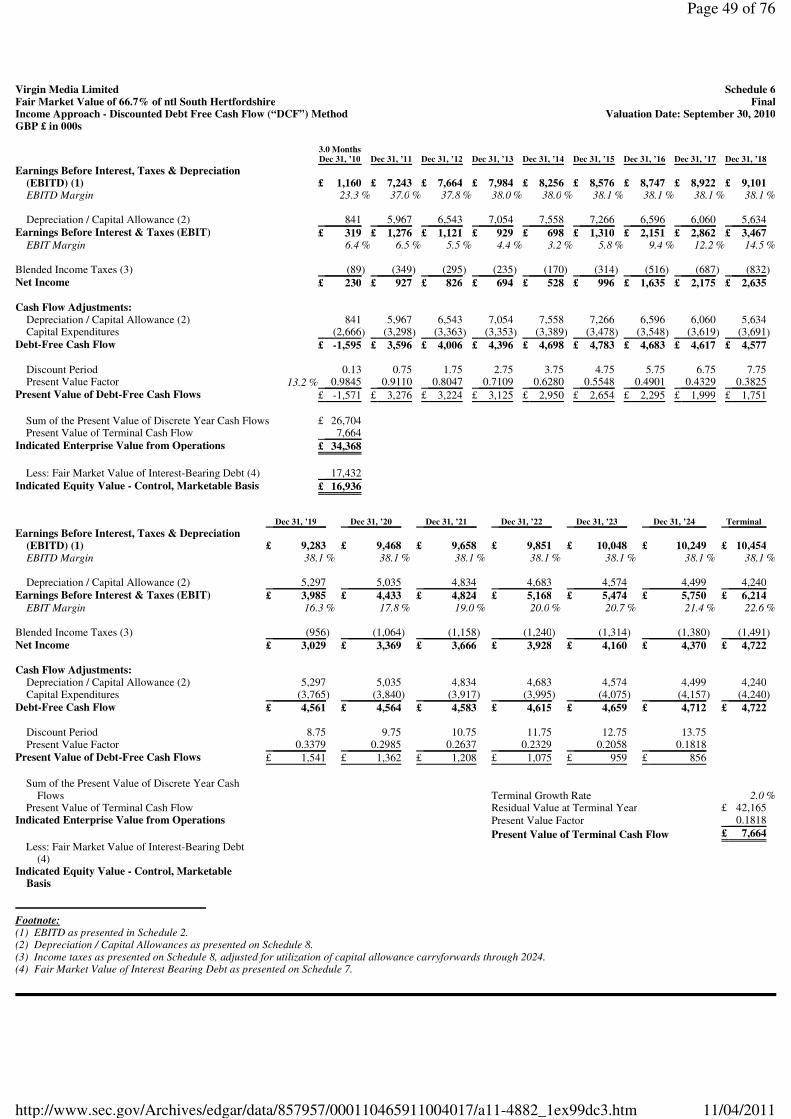
Footnote: (1) EBITD as presented in Schedule 2. (2) Depreciation / Capital Allowances as presented on Schedule 8. (3) Income taxes as presented on Schedule 8, adjusted for utilization of capital allowance carryforwards through 2024. (4) Fair Market Value of Interest Bearing Debt as presented on Schedule 7.
Virgin Media Limited Schedule 6Fair Market Value of 66.7% of ntl South Hertfordshire FinalIncome Approach - Discounted Debt Free Cash Flow (“DCF”) Method Valuation Date: September 30, 2010GBP £ in 000s
3.0 Months
Dec 31, ’10 Dec 31, ’11
Dec 31, ’12 Dec 31, ’13
Dec 31, ’14 Dec 31, ’15
Dec 31, ’16 Dec 31, ’17
Dec 31, ’18
Earnings Before Interest, Taxes & Depreciation (EBITD) (1)
£ 1,160 £ 7,243
£ 7,664 £ 7,984
£ 8,256 £ 8,576
£ 8,747 £ 8,922
£ 9,101
EBITD Margin 23.3 % 37.0 % 37.8 % 38.0 % 38.0 % 38.1 % 38.1 % 38.1 % 38.1 %
Depreciation / Capital Allowance (2)
841 5,967
6,543 7,054
7,558 7,266
6,596 6,060
5,634
Earnings Before Interest & Taxes (EBIT) £ 319
£ 1,276 £ 1,121
£ 929 £ 698
£ 1,310 £ 2,151
£ 2,862 £ 3,467
EBIT Margin
6.4 % 6.5 % 5.5 % 4.4 % 3.2 % 5.8 % 9.4 % 12.2 % 14.5 % Blended Income Taxes (3)
(89) (349) (295) (235) (170) (314) (516) (687) (832) Net Income
£ 230 £ 927
£ 826 £ 694
£ 528 £ 996
£ 1,635 £ 2,175
£ 2,635
Cash Flow Adjustments:
Depreciation / Capital Allowance (2)
841 5,967
6,543 7,054
7,558 7,266
6,596 6,060
5,634
Capital Expenditures (2,666) (3,298) (3,363) (3,353) (3,389) (3,478) (3,548) (3,619) (3,691)
Debt-Free Cash Flow £ -1,595
£ 3,596 £ 4,006
£ 4,396 £ 4,698
£ 4,783 £ 4,683
£ 4,617 £ 4,577
Discount Period 0.13
0.75 1.75
2.75 3.75
4.75 5.75
6.75 7.75
Present Value Factor
13.2 % 0.9845 0.9110
0.8047 0.7109
0.6280 0.5548
0.4901 0.4329
0.3825
Present Value of Debt-Free Cash Flows £ -1,571
£ 3,276 £ 3,224
£ 3,125 £ 2,950
£ 2,654 £ 2,295
£ 1,999 £ 1,751
Sum of the Present Value of Discrete Year Cash Flows £ 26,704
Present Value of Terminal Cash Flow
7,664
Indicated Enterprise Value from Operations £ 34,368
Less: Fair Market Value of Interest-Bearing Debt (4) 17,432
Indicated Equity Value - Control, Marketable Basis
£ 16,936
Dec 31, ’19
Dec 31, ’20 Dec 31, ’21
Dec 31, ’22 Dec 31, ’23
Dec 31, ’24 Terminal
Earnings Before Interest, Taxes & Depreciation
(EBITD) (1) £ 9,283
£ 9,468 £ 9,658
£ 9,851 £ 10,048
£ 10,249 £ 10,454
EBITD Margin
38.1 % 38.1 % 38.1 % 38.1 % 38.1 % 38.1 % 38.1 % Depreciation / Capital Allowance (2)
5,297 5,035
4,834 4,683
4,574 4,499
4,240
Earnings Before Interest & Taxes (EBIT) £ 3,985
£ 4,433 £ 4,824
£ 5,168 £ 5,474
£ 5,750 £ 6,214
EBIT Margin
16.3 % 17.8 % 19.0 % 20.0 % 20.7 % 21.4 % 22.6 % Blended Income Taxes (3)
(956) (1,064) (1,158) (1,240) (1,314) (1,380) (1,491) Net Income
£ 3,029 £ 3,369
£ 3,666 £ 3,928
£ 4,160 £ 4,370
£ 4,722
Cash Flow Adjustments:
Depreciation / Capital Allowance (2)
5,297 5,035
4,834 4,683
4,574 4,499
4,240
Capital Expenditures (3,765) (3,840) (3,917) (3,995) (4,075) (4,157) (4,240)
Debt-Free Cash Flow £ 4,561
£ 4,564 £ 4,583
£ 4,615 £ 4,659
£ 4,712 £ 4,722
Discount Period 8.75
9.75 10.75
11.75 12.75
13.75
Present Value Factor 0.3379
0.2985 0.2637
0.2329 0.2058
0.1818
Present Value of Debt-Free Cash Flows £ 1,541
£ 1,362 £ 1,208
£ 1,075 £ 959
£ 856
Sum of the Present Value of Discrete Year Cash
Flows Terminal Growth Rate
2.0 %Present Value of Terminal Cash Flow
Residual Value at Terminal Year £ 42,165
Indicated Enterprise Value from Operations
Present Value Factor 0.1818
Present Value of Terminal Cash Flow £ 7,664
Less: Fair Market Value of Interest-Bearing Debt
(4)
Indicated Equity Value - Control, Marketable Basis
Page 49 of 76
11/04/2011http://www.sec.gov/Archives/edgar/data/857957/000110465911004017/a11-4882_1ex99dc3.htm
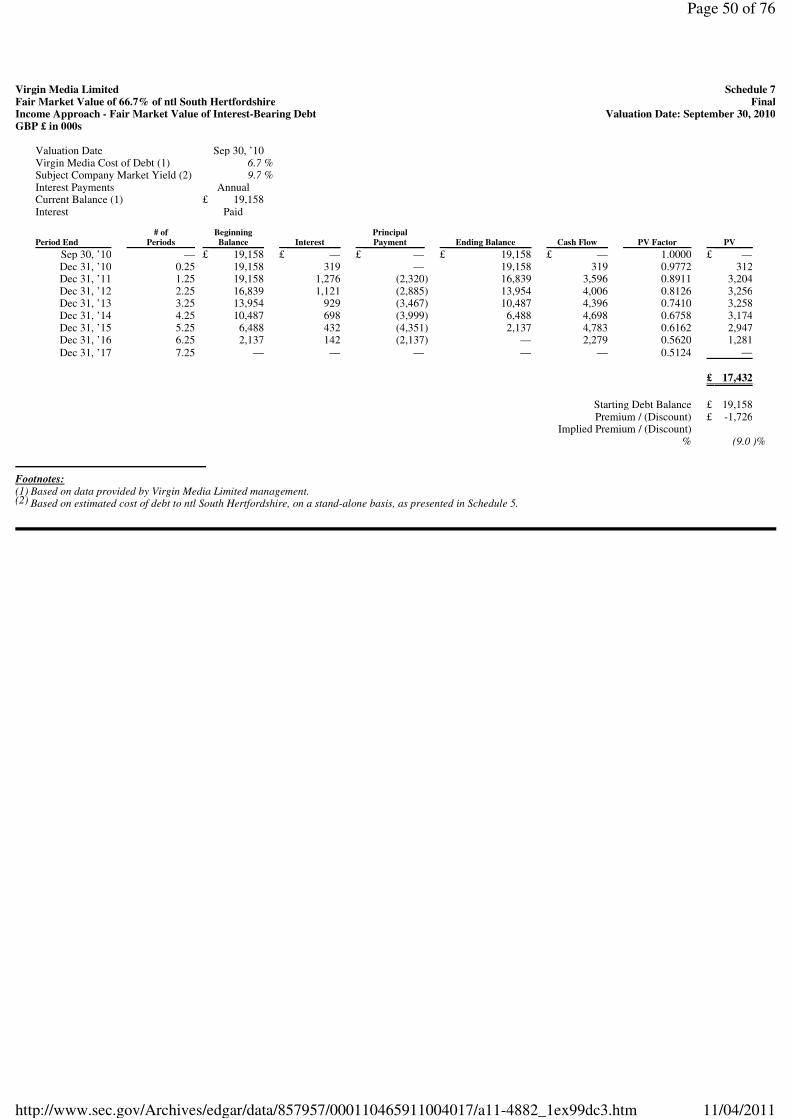
Footnotes:
Virgin Media Limited Schedule 7
Fair Market Value of 66.7% of ntl South Hertfordshire Final
Income Approach - Fair Market Value of Interest-Bearing Debt Valuation Date: September 30, 2010
GBP £ in 000s
Valuation Date Sep 30, ’10
Virgin Media Cost of Debt (1) 6.7 %
Subject Company Market Yield (2) 9.7 %
Interest Payments
Annual
Current Balance (1) £ 19,158
Interest
Paid
# of
Beginning Principal
Period End Periods
Balance Interest
Payment Ending Balance
Cash Flow PV Factor
PV
Sep 30, ’10 —
£
19,158 £
— £
— £
19,158 £
— 1.0000
£
—
Dec 31, ’10 0.25
19,158 319
— 19,158
319 0.9772
312
Dec 31, ’11 1.25
19,158 1,276
(2,320) 16,839 3,596
0.8911 3,204
Dec 31, ’12
2.25 16,839
1,121 (2,885) 13,954
4,006 0.8126
3,256
Dec 31, ’13 3.25
13,954 929
(3,467) 10,487 4,396
0.7410 3,258
Dec 31, ’14
4.25 10,487
698 (3,999) 6,488
4,698 0.6758
3,174
Dec 31, ’15 5.25
6,488 432
(4,351) 2,137 4,783
0.6162 2,947
Dec 31, ’16
6.25 2,137
142 (2,137) —
2,279 0.5620
1,281
Dec 31, ’17 7.25
— —
— —
— 0.5124
—
£
17,432
Starting Debt Balance £
19,158
Premium / (Discount) £
-1,726
Implied Premium / (Discount) %
(9.0 )%
(1) Based on data provided by Virgin Media Limited management. Based on estimated cost of debt to ntl South Hertfordshire, on a stand-alone basis, as presented in Schedule 5. (2)
Page 50 of 76
11/04/2011http://www.sec.gov/Archives/edgar/data/857957/000110465911004017/a11-4882_1ex99dc3.htm
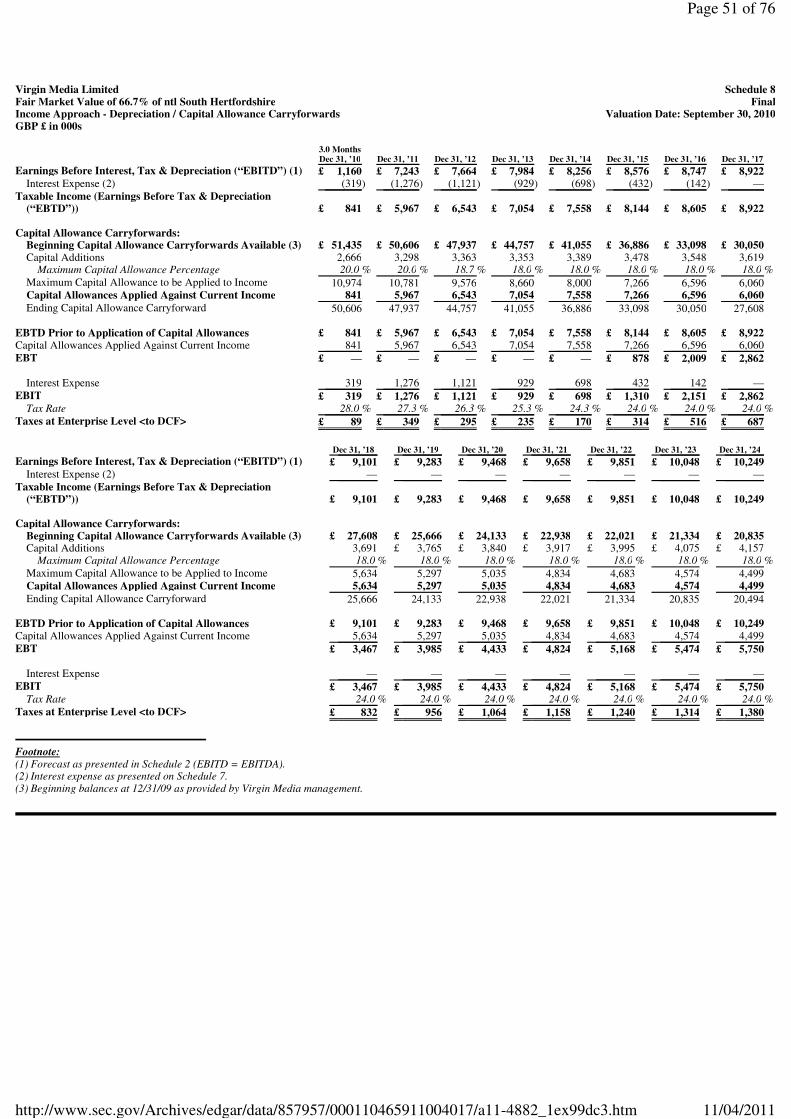
Footnote:
Virgin Media Limited Schedule 8
Fair Market Value of 66.7% of ntl South Hertfordshire Final
Income Approach - Depreciation / Capital Allowance Carryforwards Valuation Date: September 30, 2010
GBP £ in 000s
3.0 Months
Dec 31, ’10 Dec 31, ’11
Dec 31, ’12 Dec 31, ’13
Dec 31, ’14 Dec 31, ’15
Dec 31, ’16 Dec 31, ’17
Earnings Before Interest, Tax & Depreciation (“EBITD”) (1)
£ 1,160 £ 7,243
£ 7,664 £ 7,984
£ 8,256 £ 8,576
£ 8,747 £ 8,922
Interest Expense (2)
(319) (1,276) (1,121) (929) (698) (432) (142) —
Taxable Income (Earnings Before Tax & Depreciation (“EBTD”))
£ 841 £ 5,967
£ 6,543 £ 7,054
£ 7,558 £ 8,144
£ 8,605 £ 8,922
Capital Allowance Carryforwards:
Beginning Capital Allowance Carryforwards Available (3)
£ 51,435 £ 50,606
£ 47,937 £ 44,757
£ 41,055 £ 36,886
£ 33,098 £ 30,050
Capital Additions
2,666 3,298
3,363 3,353
3,389 3,478
3,548 3,619
Maximum Capital Allowance Percentage
20.0 % 20.0 % 18.7 % 18.0 % 18.0 % 18.0 % 18.0 % 18.0 %
Maximum Capital Allowance to be Applied to Income 10,974
10,781 9,576
8,660 8,000
7,266 6,596
6,060
Capital Allowances Applied Against Current Income 841
5,967 6,543
7,054 7,558
7,266 6,596
6,060
Ending Capital Allowance Carryforward 50,606
47,937 44,757
41,055 36,886
33,098 30,050
27,608
EBTD Prior to Application of Capital Allowances
£ 841 £ 5,967
£ 6,543 £ 7,054
£ 7,558 £ 8,144
£ 8,605 £ 8,922
Capital Allowances Applied Against Current Income
841 5,967
6,543 7,054
7,558 7,266
6,596 6,060
EBT
£ — £ —
£ — £ —
£ — £ 878
£ 2,009 £ 2,862
Interest Expense 319
1,276 1,121
929 698
432 142
—
EBIT £ 319
£ 1,276 £ 1,121
£ 929 £ 698
£ 1,310 £ 2,151
£ 2,862
Tax Rate 28.0 % 27.3 % 26.3 % 25.3 % 24.3 % 24.0 % 24.0 % 24.0 %
Taxes at Enterprise Level <to DCF> £ 89
£ 349 £ 295
£ 235 £ 170
£ 314 £ 516
£ 687
Dec 31, ’18 Dec 31, ’19
Dec 31, ’20 Dec 31, ’21
Dec 31, ’22 Dec 31, ’23
Dec 31, ’24
Earnings Before Interest, Tax & Depreciation (“EBITD”) (1) £ 9,101
£ 9,283 £ 9,468
£ 9,658 £ 9,851
£ 10,048 £ 10,249
Interest Expense (2)
— —
— —
— —
—
Taxable Income (Earnings Before Tax & Depreciation (“EBTD”))
£ 9,101 £ 9,283
£ 9,468 £ 9,658
£ 9,851 £ 10,048
£ 10,249
Capital Allowance Carryforwards:
Beginning Capital Allowance Carryforwards Available (3)
£ 27,608 £ 25,666
£ 24,133 £ 22,938
£ 22,021 £ 21,334
£ 20,835
Capital Additions 3,691
£ 3,765 £ 3,840
£ 3,917 £ 3,995
£ 4,075 £ 4,157
Maximum Capital Allowance Percentage
18.0 % 18.0 % 18.0 % 18.0 % 18.0 % 18.0 % 18.0 %
Maximum Capital Allowance to be Applied to Income 5,634
5,297 5,035
4,834 4,683
4,574 4,499
Capital Allowances Applied Against Current Income
5,634 5,297
5,035 4,834
4,683 4,574
4,499
Ending Capital Allowance Carryforward 25,666
24,133 22,938
22,021 21,334
20,835 20,494
EBTD Prior to Application of Capital Allowances £ 9,101
£ 9,283 £ 9,468
£ 9,658 £ 9,851
£ 10,048 £ 10,249
Capital Allowances Applied Against Current Income
5,634 5,297
5,035 4,834
4,683 4,574
4,499
EBT £ 3,467
£ 3,985 £ 4,433
£ 4,824 £ 5,168
£ 5,474 £ 5,750
Interest Expense —
— —
— —
— —
EBIT
£ 3,467 £ 3,985
£ 4,433 £ 4,824
£ 5,168 £ 5,474
£ 5,750
Tax Rate 24.0 % 24.0 % 24.0 % 24.0 % 24.0 % 24.0 % 24.0 %
Taxes at Enterprise Level <to DCF> £ 832
£ 956 £ 1,064
£ 1,158 £ 1,240
£ 1,314 £ 1,380
(1) Forecast as presented in Schedule 2 (EBITD = EBITDA). (2) Interest expense as presented on Schedule 7. (3) Beginning balances at 12/31/09 as provided by Virgin Media management.
Page 51 of 76
11/04/2011http://www.sec.gov/Archives/edgar/data/857957/000110465911004017/a11-4882_1ex99dc3.htm
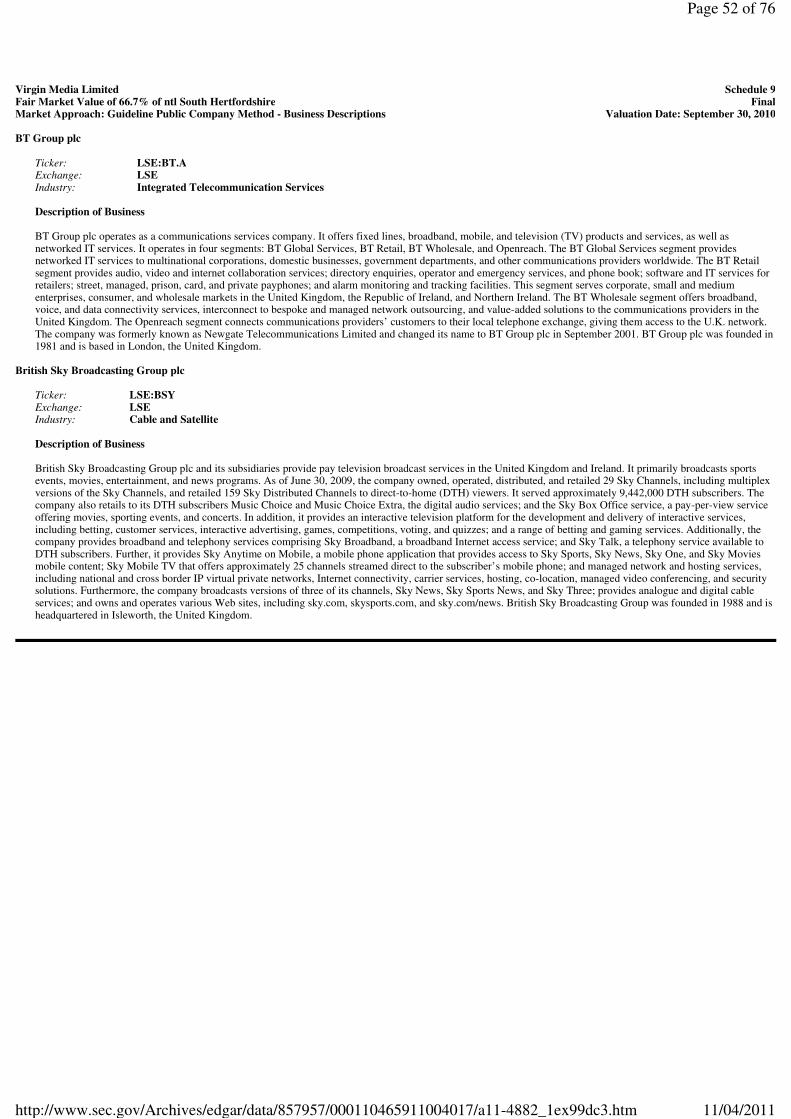
Description of Business BT Group plc operates as a communications services company. It offers fixed lines, broadband, mobile, and television (TV) products and services, as well as networked IT services. It operates in four segments: BT Global Services, BT Retail, BT Wholesale, and Openreach. The BT Global Services segment provides networked IT services to multinational corporations, domestic businesses, government departments, and other communications providers worldwide. The BT Retail segment provides audio, video and internet collaboration services; directory enquiries, operator and emergency services, and phone book; software and IT services for retailers; street, managed, prison, card, and private payphones; and alarm monitoring and tracking facilities. This segment serves corporate, small and medium enterprises, consumer, and wholesale markets in the United Kingdom, the Republic of Ireland, and Northern Ireland. The BT Wholesale segment offers broadband, voice, and data connectivity services, interconnect to bespoke and managed network outsourcing, and value-added solutions to the communications providers in the United Kingdom. The Openreach segment connects communications providers’ customers to their local telephone exchange, giving them access to the U.K. network. The company was formerly known as Newgate Telecommunications Limited and changed its name to BT Group plc in September 2001. BT Group plc was founded in 1981 and is based in London, the United Kingdom.
British Sky Broadcasting Group plc
Description of Business British Sky Broadcasting Group plc and its subsidiaries provide pay television broadcast services in the United Kingdom and Ireland. It primarily broadcasts sports events, movies, entertainment, and news programs. As of June 30, 2009, the company owned, operated, distributed, and retailed 29 Sky Channels, including multiplex versions of the Sky Channels, and retailed 159 Sky Distributed Channels to direct-to-home (DTH) viewers. It served approximately 9,442,000 DTH subscribers. The company also retails to its DTH subscribers Music Choice and Music Choice Extra, the digital audio services; and the Sky Box Office service, a pay-per-view service offering movies, sporting events, and concerts. In addition, it provides an interactive television platform for the development and delivery of interactive services, including betting, customer services, interactive advertising, games, competitions, voting, and quizzes; and a range of betting and gaming services. Additionally, the company provides broadband and telephony services comprising Sky Broadband, a broadband Internet access service; and Sky Talk, a telephony service available to DTH subscribers. Further, it provides Sky Anytime on Mobile, a mobile phone application that provides access to Sky Sports, Sky News, Sky One, and Sky Movies mobile content; Sky Mobile TV that offers approximately 25 channels streamed direct to the subscriber’s mobile phone; and managed network and hosting services, including national and cross border IP virtual private networks, Internet connectivity, carrier services, hosting, co-location, managed video conferencing, and security solutions. Furthermore, the company broadcasts versions of three of its channels, Sky News, Sky Sports News, and Sky Three; provides analogue and digital cable services; and owns and operates various Web sites, including sky.com, skysports.com, and sky.com/news. British Sky Broadcasting Group was founded in 1988 and is headquartered in Isleworth, the United Kingdom.
Virgin Media Limited Schedule 9
Fair Market Value of 66.7% of ntl South Hertfordshire Final
Market Approach: Guideline Public Company Method - Business Descriptions Valuation Date: September 30, 2010
BT Group plc
Ticker: LSE:BT.A
Exchange: LSE
Industry: Integrated Telecommunication Services
Ticker: LSE:BSY
Exchange: LSE
Industry: Cable and Satellite
Page 52 of 76
11/04/2011http://www.sec.gov/Archives/edgar/data/857957/000110465911004017/a11-4882_1ex99dc3.htm
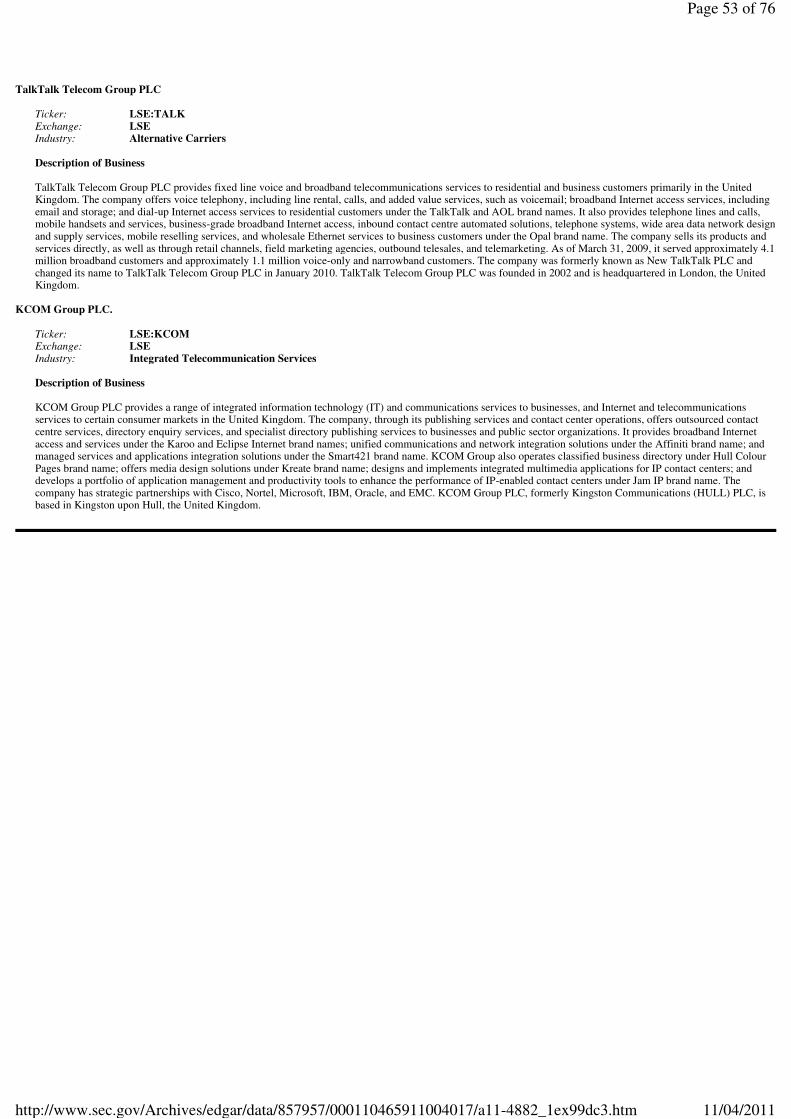
TalkTalk Telecom Group PLC
Description of Business TalkTalk Telecom Group PLC provides fixed line voice and broadband telecommunications services to residential and business customers primarily in the United Kingdom. The company offers voice telephony, including line rental, calls, and added value services, such as voicemail; broadband Internet access services, including email and storage; and dial-up Internet access services to residential customers under the TalkTalk and AOL brand names. It also provides telephone lines and calls, mobile handsets and services, business-grade broadband Internet access, inbound contact centre automated solutions, telephone systems, wide area data network design and supply services, mobile reselling services, and wholesale Ethernet services to business customers under the Opal brand name. The company sells its products and services directly, as well as through retail channels, field marketing agencies, outbound telesales, and telemarketing. As of March 31, 2009, it served approximately 4.1 million broadband customers and approximately 1.1 million voice-only and narrowband customers. The company was formerly known as New TalkTalk PLC and changed its name to TalkTalk Telecom Group PLC in January 2010. TalkTalk Telecom Group PLC was founded in 2002 and is headquartered in London, the United Kingdom.
KCOM Group PLC.
Description of Business KCOM Group PLC provides a range of integrated information technology (IT) and communications services to businesses, and Internet and telecommunications services to certain consumer markets in the United Kingdom. The company, through its publishing services and contact center operations, offers outsourced contact centre services, directory enquiry services, and specialist directory publishing services to businesses and public sector organizations. It provides broadband Internet access and services under the Karoo and Eclipse Internet brand names; unified communications and network integration solutions under the Affiniti brand name; and managed services and applications integration solutions under the Smart421 brand name. KCOM Group also operates classified business directory under Hull Colour Pages brand name; offers media design solutions under Kreate brand name; designs and implements integrated multimedia applications for IP contact centers; and develops a portfolio of application management and productivity tools to enhance the performance of IP-enabled contact centers under Jam IP brand name. The company has strategic partnerships with Cisco, Nortel, Microsoft, IBM, Oracle, and EMC. KCOM Group PLC, formerly Kingston Communications (HULL) PLC, is based in Kingston upon Hull, the United Kingdom.
Ticker: LSE:TALK
Exchange: LSE
Industry: Alternative Carriers
Ticker: LSE:KCOM
Exchange: LSE
Industry: Integrated Telecommunication Services
Page 53 of 76
11/04/2011http://www.sec.gov/Archives/edgar/data/857957/000110465911004017/a11-4882_1ex99dc3.htm
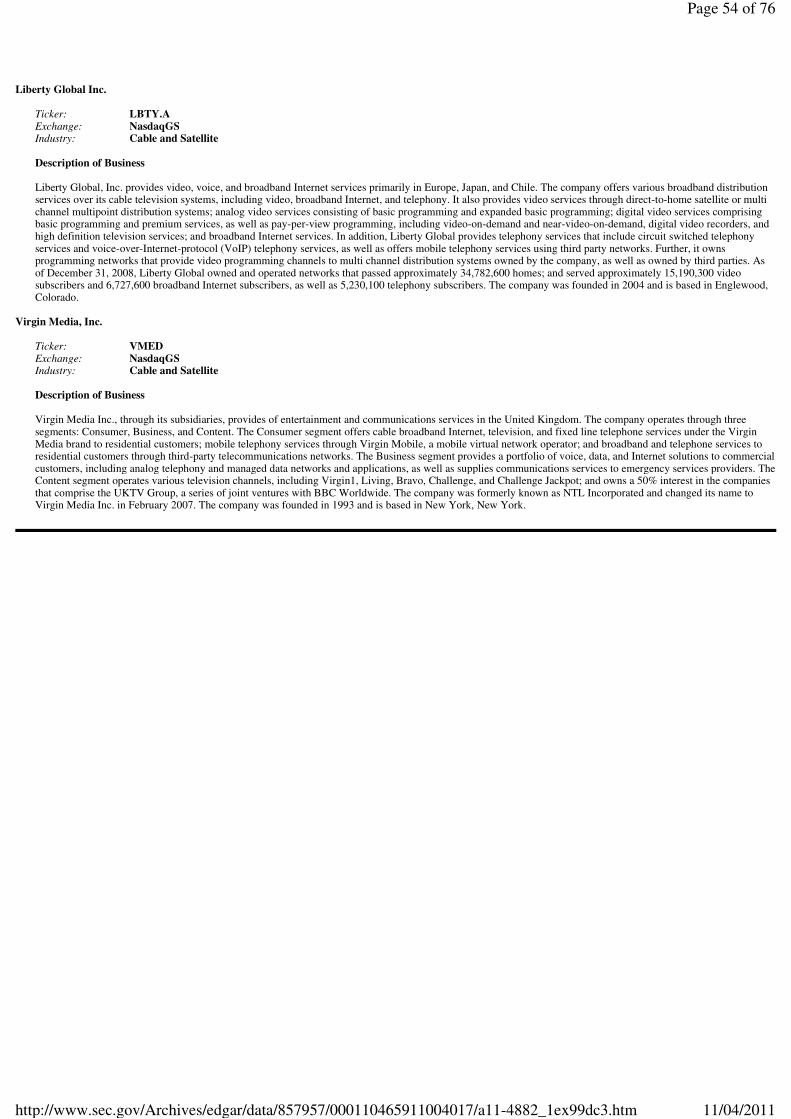
Liberty Global Inc.
Description of Business Liberty Global, Inc. provides video, voice, and broadband Internet services primarily in Europe, Japan, and Chile. The company offers various broadband distribution services over its cable television systems, including video, broadband Internet, and telephony. It also provides video services through direct-to-home satellite or multi channel multipoint distribution systems; analog video services consisting of basic programming and expanded basic programming; digital video services comprising basic programming and premium services, as well as pay-per-view programming, including video-on-demand and near-video-on-demand, digital video recorders, and high definition television services; and broadband Internet services. In addition, Liberty Global provides telephony services that include circuit switched telephony services and voice-over-Internet-protocol (VoIP) telephony services, as well as offers mobile telephony services using third party networks. Further, it owns programming networks that provide video programming channels to multi channel distribution systems owned by the company, as well as owned by third parties. As of December 31, 2008, Liberty Global owned and operated networks that passed approximately 34,782,600 homes; and served approximately 15,190,300 video subscribers and 6,727,600 broadband Internet subscribers, as well as 5,230,100 telephony subscribers. The company was founded in 2004 and is based in Englewood, Colorado.
Virgin Media, Inc.
Description of Business Virgin Media Inc., through its subsidiaries, provides of entertainment and communications services in the United Kingdom. The company operates through three segments: Consumer, Business, and Content. The Consumer segment offers cable broadband Internet, television, and fixed line telephone services under the Virgin Media brand to residential customers; mobile telephony services through Virgin Mobile, a mobile virtual network operator; and broadband and telephone services to residential customers through third-party telecommunications networks. The Business segment provides a portfolio of voice, data, and Internet solutions to commercial customers, including analog telephony and managed data networks and applications, as well as supplies communications services to emergency services providers. The Content segment operates various television channels, including Virgin1, Living, Bravo, Challenge, and Challenge Jackpot; and owns a 50% interest in the companies that comprise the UKTV Group, a series of joint ventures with BBC Worldwide. The company was formerly known as NTL Incorporated and changed its name to Virgin Media Inc. in February 2007. The company was founded in 1993 and is based in New York, New York.
Ticker: LBTY.A
Exchange: NasdaqGS
Industry: Cable and Satellite
Ticker: VMED
Exchange: NasdaqGS
Industry: Cable and Satellite
Page 54 of 76
11/04/2011http://www.sec.gov/Archives/edgar/data/857957/000110465911004017/a11-4882_1ex99dc3.htm
Kabel Deutschland Holding AG
Description of Business Kabel Deutschland Holding AG operates cable television business in Germany. It offers various television and telecommunications services, including basic cable services, premium TV services, broadband Internet access, fixed-line phone, and mobile phone services. The company provides its basic cable services in analog and digital spectrums. The analog cable access offering consists of 32 television channels and 36 radio channels; and the digital cable access offering comprises 107 free television channels and 71 radio channels. It offers basic cable services primarily via individual contracts with customers or collective contracts with landlords, housing associations, and contracts with level 4 network operators. The company also provides various pay TV packages, including 39 channels within 7 genres under the Kabel Digital Home brand name and 42 channels in 9 foreign languages under the Kabel Digital International brand name. In addition, it offers Kabel Digital+, a digital video recorder that allows for the recording of programs to be watched by the customers at their convenience; and broadcasting services for other public and private broadcasters. Further, the company provides broadband Internet access and fixed-line phone services, as well as mobile Internet access and mobile phone services. Additionally, it acts as a reseller for telecommunication products and provides other services to English speaking customers, such as generating phone bills in English. The company was founded in 2004 and is headquartered in Unterfoehring, Germany. Kabel Deutschland Holding AG is a subsidiary of Cable Holding S.A.
Telenet Holding NV
Description of Business Telenet Group Holding NV, through its subsidiaries, provides media and communication services in Belgium. The company offers cable television services; and interactive digital television services, including high definition channels and content, sports and film channels, various thematic channels, and on-demand and other services; and analog pay TV content, as well as digital set top boxes for sale or rental. It also provides residential broadband Internet services through its hybrid fiber coaxial upgraded network; and narrowband and wireless Internet services. In addition, the company offers local, national, and international long distance fixed line telephony services; and mobile telephony services. Further, it provides voice, data, and Internet products and services for small and medium size enterprises; larger corporations; public, healthcare, and educational institutions; and carrier customers that include international voice, data, and Internet service providers. The company has a strategic partnership with Mobistar NV to provide network services. As of December 31, 2008, it had 2,402,500 subscribers for analog and digital television services; 674,000 subscribers for digital television services; 985,000 broadband Internet subscribers; and 629,000 fixed telephony subscribers and 87,000 mobile subscribers. Telenet Group Holding NV was founded in 1996 and is headquartered in Mechelen, Belgium.
Ticker: DB:KD8
Exchange: DB
Industry: Cable and Satellite
Ticker: ENXTBR:TNET
Exchange: ENXTBR
Industry: Alternative Carriers
Page 55 of 76
11/04/2011http://www.sec.gov/Archives/edgar/data/857957/000110465911004017/a11-4882_1ex99dc3.htm
ZON Multimedia Servicos de Telecomunicacoes e Multimedia SGPS SA
Description of Business ZON Multimedia — Serviços de Telecomunicacoes e Multimedia, SGPS, S.A., together with its subsidiaries, provides cable and satellite television, Internet broadband access, fixed and mobile voice telecommunication, cable TV advertising, and cinema exhibition and distribution services in Portugal. The company also engages in purchase and management of movie broadcasting rights; video distribution business (DVD); the TV and cinema sale of movie distribution rights; and content wholesale business. As of December 31, 2008, it served approximately 1.525 million basic TV subscribers and 327 thousand voice subscribers, as well as operated 213 cinema exhibition screens. The company was formerly known as PT-Multimedia—Servicos de Telecomunicacoes e Multimedia, SGPS, SA and changed its name to ZON Multimedia—Servicos de Telecomunicacoes e Multimedia, SGPS, S.A. in January 2008. The company was founded in 1999 and is headquartered in Lisbon, Portugal.
Comcast Corporation
Description of Business Comcast Corporation, together with its subsidiaries, provides consumer entertainment, information, and communication products and services to the residential and commercial customers in the United States. The company operates in two segments, Cable and Programming. The Cable segment manages and operates cable systems, including video, high-speed Internet, and phone services, as well as regional sports and news networks. Its video services include analog, digital, on demand, and high-definition television and/or digital video recorders. This segment’s high-speed Internet service consists of an interactive portal, Comcast.net, which provides multiple email addresses and online storage, as well as various proprietary content, and value-added features and enhancements. Its phone services include voice over Internet protocol digital phone service that provides local and domestic long-distance calling with various features, such as voice mail, caller ID, and call waiting services. The Programming segment operates national programming networks consisting of E!, The Golf Channel, VERSUS, G4, and Style. The company also develops and operates Internet businesses focused on entertainment, information, and communication, including Comcast.net, Fancast, thePlatform, Fandango, Plaxo, and DailyCandy; and owns two professional sports teams and a multipurpose arena, as well as provides facilities management services, including food services, for sporting events, concerts, and other events. As of December 31, 2009, Comcast Corporation served approximately 23.6 million video customers, 15.9 million high-speed Internet customers, and 7.6 million phone customers, as well as approximately 50.6 million homes in 39 states and the District of Columbia. The company was founded in 1969 and is based in Philadelphia, Pennsylvania.
Ticker: ENXTLS:ZON
Exchange: ENXTLS
Industry: Cable and Satellite
Ticker: CMCS.A
Exchange: NasdaqGS
Industry: Cable and Satellite
Page 56 of 76
11/04/2011http://www.sec.gov/Archives/edgar/data/857957/000110465911004017/a11-4882_1ex99dc3.htm
Time Warner Cable Inc.
Description of Business Time Warner Cable Inc. provides video, data, and voice service over its broadband cable systems to residential and commercial customers in the United States. It offers a range of residential video services, including on-demand, high-definition (HD), and digital video recorder (DVR) services. The company also provides residential high-speed data services with connection to the Internet; wireless mobile broadband Internet services; and digital phone services. In addition, it offers a range of video programming tiers and music services; high-speed data, networking, and transport services; and commercial voice service to small- and medium-sized businesses under the Time Warner Cable Business Class brand. As of December 31, 2009, Time Warner Cable served approximately 14.6 million residential and commercial customers in the New York state, the Carolinas, Ohio, southern California, and Texas. The company is based in New York, New York. Time Warner Cable Inc. (NYSE:TWC) operate independently of Time Warner Inc. as of March 12, 2009.
Cablevision Systems Corporation
Description of Business Cablevision Systems Corporation, through its subsidiaries, operates as a telecommunications, media, and entertainment company. Its cable television operations serve approximately 5 million households and businesses in the New York metropolitan area. The company provides telephone services and high-speed Internet access services, including iO TV digital television, Optimum Voice digital voice, Optimum Online high-speed Internet, and Optimum WiFi wireless Internet, as well as Optimum Lightpath integrated business communications solutions. Its media and programming properties include News 12 Networks, a local news; MSG Varsity, a suite of television and online services covering high school sports and activities; Newsday and Newsday.com, a daily newspaper; amNewYork, a free daily serving New York City; and Star Community Publishing, a weekly shopper publications. The company also produces content for multiple media platforms; and owns and operates various entertainment brands, including programming networks, such as AMC, IFC, Sundance Channel, WE tv, and Wedding Central, as well as operates IFC Entertainment business engaging in the film distribution and video-on-demand exhibition under the IFC in Theaters, IFC Festival Direct, and Sundance Selects names. In addition, it owns and operates Clearview Cinemas, which includes Ziegfeld Theatre, a venue for film premieres and events. The company was founded in 1973 and is headquartered in Bethpage, New York.
Ticker: TWC
Exchange: NYSE
Industry: Cable and Satellite
Ticker: CVC
Exchange: NYSE
Industry: Cable and Satellite
Page 57 of 76
11/04/2011http://www.sec.gov/Archives/edgar/data/857957/000110465911004017/a11-4882_1ex99dc3.htm
Charter Communications Inc.
Description of Business Charter Communications, Inc. provides cable services to residential and commercial customers in the United States. The company offers a range of entertainment, information, and communications solutions, as well as traditional video cable programming; high-speed Internet access; advanced broadband cable services, such as high definition television, OnDemand video programming, and digital video recorder service; and telephone service. It provides broadband communications solutions, such as business-to-business Internet access, data networking, fiber connectivity to cellular towers, video and music entertainment services, and business telephone under the Charter Business brand name to business organizations, including small-and medium-sized commercial customers. As of December 31, 2009, Charter Communications served approximately 4.8 million video customers; approximately 3.1 million high-speed Internet customers; approximately 1.6 million telephone customers; and approximately 224,300 business customers. The company was founded in 1999 and is based in St. Louis, Missouri.
Mediacom Communications Corp.
Description of Business Mediacom Communications Corporation develops cable systems to provide entertainment, information, and telecommunications services in the United States. It offers an array of products and services, including video services, such as broadcast basic services, family basic services, digital services, pay-per-view services, video-on-demand services, high-definition television services, and digital video recorders; and high-speed data (HSD) services. The company also provides phone services that offer local, regional, and long-distance calling within the United States, Puerto Rico, the U.S. Virgin Islands, and Canada, as well as offer calling features, such as caller ID with name and number, call waiting, three-way calling, emergency dialing, directory assistance and voice mail, and international calling services. In addition, it offers various advanced data services for the commercial markets; point-to-point circuit solutions for wireless communications providers, and other carrier and wholesale customers; Mediacom Online Ultra, a high-speed Internet service; and multi-line business phone services to small- and medium-sized businesses. As of December 31, 2009, its cable systems passed approximately 2.80 million homes and served 1.24 million basic subscribers. The company provided digital video services to 678,000 customers; HSD services to 778,000 customers; and telephone services to 287,000 customers. Mediacom Communications Corporation was founded in 1995 and is based in Middletown, New York.
Ticker: CHTR
Exchange: NasdaqGS
Industry: Cable and Satellite
Ticker: MCCC
Exchange: NasdaqGS
Industry: Cable and Satellite
Page 58 of 76
11/04/2011http://www.sec.gov/Archives/edgar/data/857957/000110465911004017/a11-4882_1ex99dc3.htm
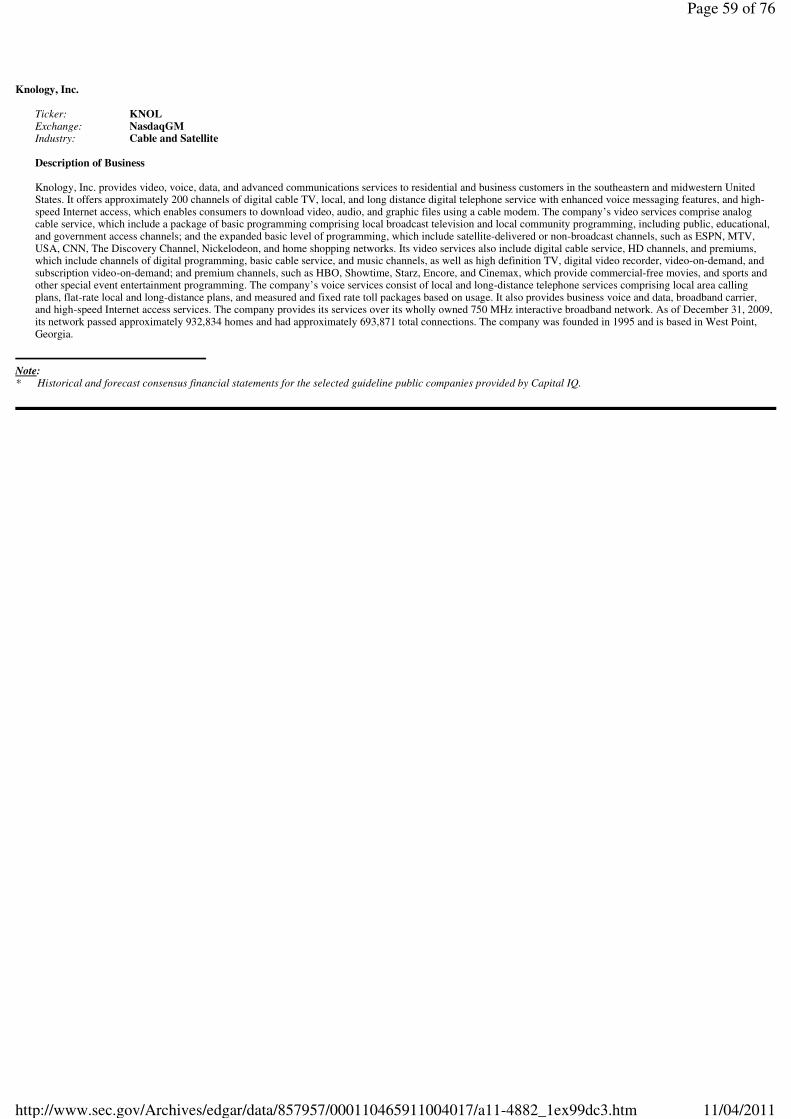
Knology, Inc.
Description of Business Knology, Inc. provides video, voice, data, and advanced communications services to residential and business customers in the southeastern and midwestern United States. It offers approximately 200 channels of digital cable TV, local, and long distance digital telephone service with enhanced voice messaging features, and high-speed Internet access, which enables consumers to download video, audio, and graphic files using a cable modem. The company’s video services comprise analog cable service, which include a package of basic programming comprising local broadcast television and local community programming, including public, educational, and government access channels; and the expanded basic level of programming, which include satellite-delivered or non-broadcast channels, such as ESPN, MTV, USA, CNN, The Discovery Channel, Nickelodeon, and home shopping networks. Its video services also include digital cable service, HD channels, and premiums, which include channels of digital programming, basic cable service, and music channels, as well as high definition TV, digital video recorder, video-on-demand, and subscription video-on-demand; and premium channels, such as HBO, Showtime, Starz, Encore, and Cinemax, which provide commercial-free movies, and sports and other special event entertainment programming. The company’s voice services consist of local and long-distance telephone services comprising local area calling plans, flat-rate local and long-distance plans, and measured and fixed rate toll packages based on usage. It also provides business voice and data, broadband carrier, and high-speed Internet access services. The company provides its services over its wholly owned 750 MHz interactive broadband network. As of December 31, 2009, its network passed approximately 932,834 homes and had approximately 693,871 total connections. The company was founded in 1995 and is based in West Point, Georgia.
Note: * Historical and forecast consensus financial statements for the selected guideline public companies provided by Capital IQ.
Ticker: KNOL
Exchange: NasdaqGM
Industry: Cable and Satellite
Page 59 of 76
11/04/2011http://www.sec.gov/Archives/edgar/data/857957/000110465911004017/a11-4882_1ex99dc3.htm
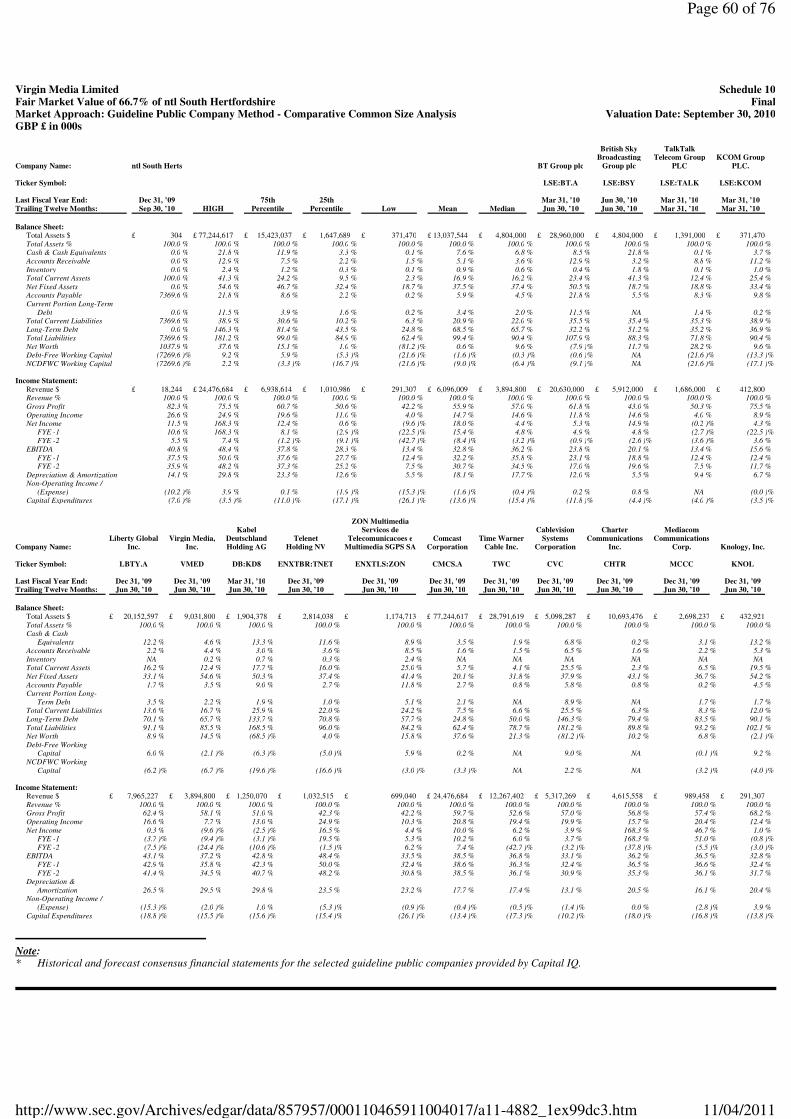
GBP £ in 000s
Note: * Historical and forecast consensus financial statements for the selected guideline public companies provided by Capital IQ.
Virgin Media Limited Schedule 10Fair Market Value of 66.7% of ntl South Hertfordshire FinalMarket Approach: Guideline Public Company Method - Comparative Common Size Analysis Valuation Date: September 30, 2010
British Sky
TalkTalk
Broadcasting
Telecom Group KCOM Group
Company Name:
ntl South Herts BT Group plc
Group plc PLC
PLC.
Ticker Symbol:
LSE:BT.A LSE:BSY
LSE:TALK LSE:KCOM
Last Fiscal Year End:
Dec 31, ’09 75th
25th Mar 31, ’10
Jun 30, ’10 Mar 31, ’10
Mar 31, ’10
Trailing Twelve Months: Sep 30, ’10
HIGH Percentile
Percentile Low
Mean Median
Jun 30, ’10 Jun 30, ’10
Mar 31, ’10 Mar 31, ’10
Balance Sheet:
Total Assets $
£ 304 £ 77,244,617
£ 15,423,037 £ 1,647,689
£ 371,470 £ 13,037,544
£ 4,804,000 £ 28,960,000
£ 4,804,000 £ 1,391,000
£ 371,470
Total Assets % 100.0 % 100.0 % 100.0 % 100.0 % 100.0 % 100.0 % 100.0 % 100.0 % 100.0 % 100.0 % 100.0 %
Cash & Cash Equivalents 0.0 % 21.8 % 11.9 % 3.3 % 0.1 % 7.6 % 6.8 % 8.5 % 21.8 % 0.1 % 3.7 %
Accounts Receivable 0.0 % 12.9 % 7.5 % 2.2 % 1.5 % 5.1 % 3.6 % 12.9 % 3.2 % 8.8 % 11.2 %
Inventory 0.0 % 2.4 % 1.2 % 0.3 % 0.1 % 0.9 % 0.6 % 0.4 % 1.8 % 0.1 % 1.0 %
Total Current Assets 100.0 % 41.3 % 24.2 % 9.5 % 2.3 % 16.9 % 16.2 % 23.4 % 41.3 % 12.4 % 25.4 %
Net Fixed Assets 0.0 % 54.6 % 46.7 % 32.4 % 18.7 % 37.5 % 37.4 % 50.5 % 18.7 % 18.8 % 33.4 %
Accounts Payable 7369.6 % 21.8 % 8.6 % 2.2 % 0.2 % 5.9 % 4.5 % 21.8 % 5.5 % 8.3 % 9.8 %
Current Portion Long-Term Debt
0.0 % 11.5 % 3.9 % 1.6 % 0.2 % 3.4 % 2.0 % 11.5 % NA 1.4 % 0.2 %
Total Current Liabilities 7369.6 % 38.9 % 30.6 % 10.2 % 6.3 % 20.9 % 22.0 % 35.5 % 35.4 % 35.3 % 38.9 %
Long-Term Debt 0.0 % 146.3 % 81.4 % 43.5 % 24.8 % 68.5 % 65.7 % 32.2 % 51.2 % 35.2 % 36.9 %
Total Liabilities 7369.6 % 181.2 % 99.0 % 84.9 % 62.4 % 99.4 % 90.4 % 107.9 % 88.3 % 71.8 % 90.4 %
Net Worth 1037.9 % 37.6 % 15.1 % 1.0 % (81.2 )% 0.6 % 9.6 % (7.9 )% 11.7 % 28.2 % 9.6 %
Debt-Free Working Capital (7269.6 )% 9.2 % 5.9 % (5.3 )% (21.6 )% (1.6 )% (0.3 )% (0.6 )% NA
(21.6 )% (13.3 )% NCDFWC Working Capital
(7269.6 )% 2.2 % (3.3 )% (16.7 )% (21.6 )% (9.0 )% (6.4 )% (9.1 )% NA (21.6 )% (17.1 )%
Income Statement:
Revenue $
£ 18,244 £ 24,476,684
£ 6,938,614 £ 1,010,986
£ 291,307 £ 6,096,009
£ 3,894,800 £ 20,630,000
£ 5,912,000 £ 1,686,000
£ 412,800
Revenue % 100.0 % 100.0 % 100.0 % 100.0 % 100.0 % 100.0 % 100.0 % 100.0 % 100.0 % 100.0 % 100.0 %
Gross Profit 82.3 % 75.5 % 60.7 % 50.6 % 42.2 % 55.9 % 57.0 % 61.8 % 43.0 % 50.3 % 75.5 %
Operating Income 26.6 % 24.9 % 19.6 % 11.0 % 4.0 % 14.7 % 14.6 % 11.8 % 14.6 % 4.0 % 8.9 %
Net Income 11.5 % 168.3 % 12.4 % 0.6 % (9.6 )% 18.0 % 4.4 % 5.3 % 14.9 % (0.2 )% 4.3 %
FYE -1 10.6 % 168.3 % 8.1 % (2.9 )% (22.5 )% 15.4 % 4.8 % 4.9 % 4.8 % (2.7 )% (22.5 )%
FYE -2 5.5 % 7.4 % (1.2 )% (9.1 )% (42.7 )% (8.4 )% (3.2 )% (0.9 )% (2.6 )% (3.6 )% 3.6 %
EBITDA 40.8 % 48.4 % 37.8 % 28.3 % 13.4 % 32.8 % 36.2 % 23.8 % 20.1 % 13.4 % 15.6 %
FYE -1 37.5 % 50.0 % 37.6 % 27.7 % 12.4 % 32.2 % 35.8 % 23.1 % 18.8 % 12.4 % 12.4 %
FYE -2 35.9 % 48.2 % 37.3 % 25.2 % 7.5 % 30.7 % 34.5 % 17.0 % 19.6 % 7.5 % 11.7 %
Depreciation & Amortization 14.1 % 29.8 % 23.3 % 12.6 % 5.5 % 18.1 % 17.7 % 12.0 % 5.5 % 9.4 % 6.7 %
Non-Operating Income / (Expense)
(10.2 )% 3.9 % 0.1 % (1.9 )% (15.3 )% (1.6 )% (0.4 )% 0.2 % 0.8 % NA (0.0 )%
Capital Expenditures (7.0 )% (3.5 )% (11.0 )% (17.1 )% (26.1 )% (13.6 )% (15.4 )% (11.8 )% (4.4 )% (4.0 )% (3.5 )%
ZON Multimedia
Kabel Servicos de
Cablevision Charter
Mediacom
Liberty Global
Virgin Media, Deutschland
Telenet Telecomunicacoes e
Comcast Time Warner
Systems Communications
Communications
Company Name: Inc.
Inc. Holding AG
Holding NV Multimedia SGPS SA
Corporation Cable Inc.
Corporation Inc.
Corp. Knology, Inc.
Ticker Symbol:
LBTY.A VMED
DB:KD8 ENXTBR:TNET
ENXTLS:ZON CMCS.A
TWC CVC
CHTR MCCC
KNOL
Last Fiscal Year End:
Dec 31, ’09 Dec 31, ’09
Mar 31, ’10 Dec 31, ’09
Dec 31, ’09 Dec 31, ’09
Dec 31, ’09 Dec 31, ’09
Dec 31, ’09 Dec 31, ’09
Dec 31, ’09
Trailing Twelve Months: Jun 30, ’10
Jun 30, ’10 Jun 30, ’10
Jun 30, ’10 Jun 30, ’10
Jun 30, ’10 Jun 30, ’10
Jun 30, ’10 Jun 30, ’10
Jun 30, ’10 Jun 30, ’10
Balance Sheet:
Total Assets $
£ 20,152,597 £ 9,031,800
£ 1,904,378 £ 2,814,038
£ 1,174,713 £ 77,244,617
£ 28,791,619 £ 5,098,287
£ 10,693,476 £ 2,698,237
£ 432,921
Total Assets % 100.0 % 100.0 % 100.0 % 100.0 % 100.0 % 100.0 % 100.0 % 100.0 % 100.0 % 100.0 % 100.0 %
Cash & Cash Equivalents
12.2 % 4.6 % 13.3 % 11.6 % 8.9 % 3.5 % 1.9 % 6.8 % 0.2 % 3.1 % 13.2 % Accounts Receivable
2.2 % 4.4 % 3.0 % 3.6 % 8.5 % 1.6 % 1.5 % 6.5 % 1.6 % 2.2 % 5.3 % Inventory
NA 0.2 % 0.7 % 0.3 % 2.4 % NA
NA NA
NA NA
NA
Total Current Assets 16.2 % 12.4 % 17.7 % 16.0 % 25.0 % 5.7 % 4.1 % 25.5 % 2.3 % 6.5 % 19.5 %
Net Fixed Assets 33.1 % 54.6 % 50.3 % 37.4 % 41.4 % 20.1 % 31.8 % 37.9 % 43.1 % 36.7 % 54.2 %
Accounts Payable 1.7 % 3.5 % 9.0 % 2.7 % 11.8 % 2.7 % 0.8 % 5.8 % 0.8 % 0.2 % 4.5 %
Current Portion Long-Term Debt
3.5 % 2.2 % 1.9 % 1.0 % 5.1 % 2.1 % NA 8.9 % NA
1.7 % 1.7 % Total Current Liabilities
13.6 % 16.7 % 25.9 % 22.0 % 24.2 % 7.5 % 6.6 % 25.5 % 6.3 % 8.3 % 12.0 % Long-Term Debt
70.1 % 65.7 % 133.7 % 70.8 % 57.7 % 24.8 % 50.0 % 146.3 % 79.4 % 83.5 % 90.1 % Total Liabilities
91.1 % 85.5 % 168.5 % 96.0 % 84.2 % 62.4 % 78.7 % 181.2 % 89.8 % 93.2 % 102.1 % Net Worth
8.9 % 14.5 % (68.5 )% 4.0 % 15.8 % 37.6 % 21.3 % (81.2 )% 10.2 % 6.8 % (2.1 )% Debt-Free Working
Capital 6.0 % (2.1 )% (6.3 )% (5.0 )% 5.9 % 0.2 % NA
9.0 % NA (0.1 )% 9.2 %
NCDFWC Working Capital
(6.2 )% (6.7 )% (19.6 )% (16.6 )% (3.0 )% (3.3 )% NA 2.2 % NA
(3.2 )% (4.0 )% Income Statement:
Revenue $
£ 7,965,227 £ 3,894,800
£ 1,250,070 £ 1,032,515
£ 699,040 £ 24,476,684
£ 12,267,402 £ 5,317,269
£ 4,615,558 £ 989,458
£ 291,307
Revenue % 100.0 % 100.0 % 100.0 % 100.0 % 100.0 % 100.0 % 100.0 % 100.0 % 100.0 % 100.0 % 100.0 %
Gross Profit 62.4 % 58.1 % 51.0 % 42.3 % 42.2 % 59.7 % 52.6 % 57.0 % 56.8 % 57.4 % 68.2 %
Operating Income 16.6 % 7.7 % 13.0 % 24.9 % 10.3 % 20.8 % 19.4 % 19.9 % 15.7 % 20.4 % 12.4 %
Net Income 0.3 % (9.6 )% (2.5 )% 16.5 % 4.4 % 10.0 % 6.2 % 3.9 % 168.3 % 46.7 % 1.0 %
FYE -1 (3.7 )% (9.4 )% (3.1 )% 19.5 % 5.3 % 10.2 % 6.0 % 3.7 % 168.3 % 51.0 % (0.8 )%
FYE -2 (7.5 )% (24.4 )% (10.6 )% (1.5 )% 6.2 % 7.4 % (42.7 )% (3.2 )% (37.8 )% (5.5 )% (3.0 )%
EBITDA 43.1 % 37.2 % 42.8 % 48.4 % 33.5 % 38.5 % 36.8 % 33.1 % 36.2 % 36.5 % 32.8 %
FYE -1 42.9 % 35.8 % 42.3 % 50.0 % 32.4 % 38.6 % 36.3 % 32.4 % 36.5 % 36.6 % 32.4 %
FYE -2 41.4 % 34.5 % 40.7 % 48.2 % 30.8 % 38.5 % 36.1 % 30.9 % 35.3 % 36.1 % 31.7 %
Depreciation & Amortization
26.5 % 29.5 % 29.8 % 23.5 % 23.2 % 17.7 % 17.4 % 13.1 % 20.5 % 16.1 % 20.4 % Non-Operating Income /
(Expense) (15.3 )% (2.0 )% 1.0 % (5.3 )% (0.9 )% (0.4 )% (0.5 )% (1.4 )% 0.0 % (2.8 )% 3.9 %
Capital Expenditures (18.8 )% (15.5 )% (15.6 )% (15.4 )% (26.1 )% (13.4 )% (17.3 )% (10.2 )% (18.0 )% (16.8 )% (13.8 )%
Page 60 of 76
11/04/2011http://www.sec.gov/Archives/edgar/data/857957/000110465911004017/a11-4882_1ex99dc3.htm
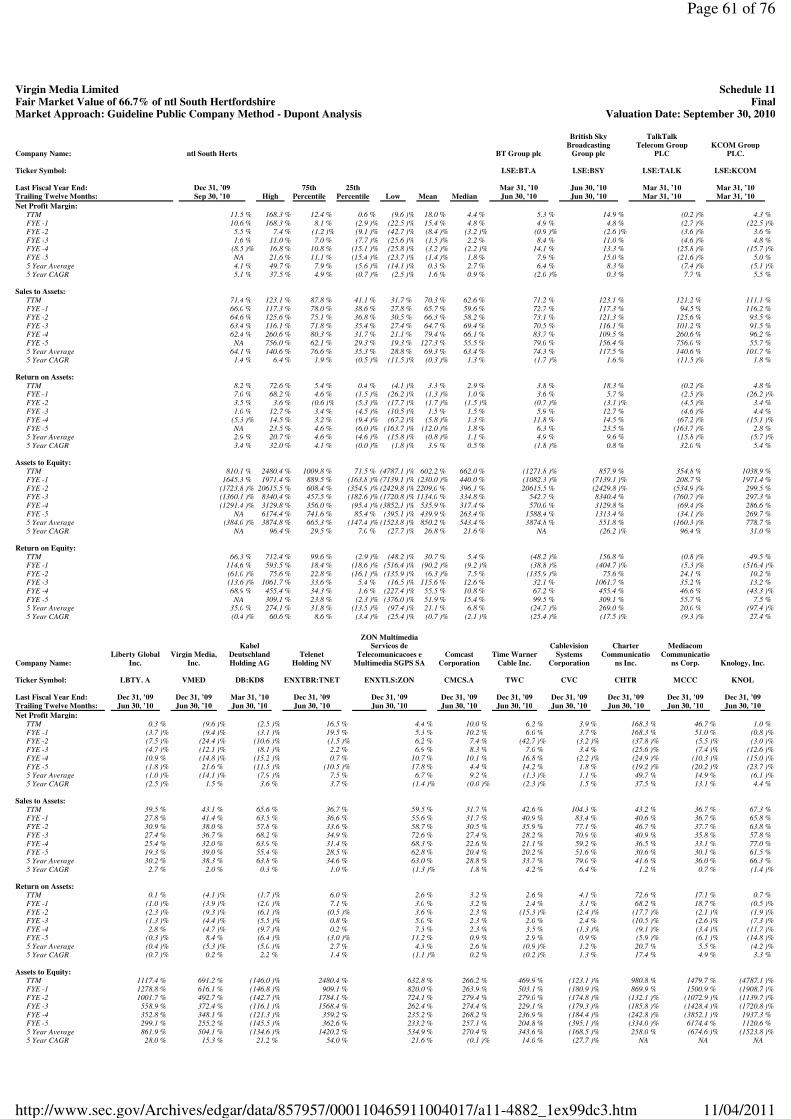
Virgin Media Limited Schedule 11
Fair Market Value of 66.7% of ntl South Hertfordshire Final
Market Approach: Guideline Public Company Method - Dupont Analysis Valuation Date: September 30, 2010
Company Name: Ticker Symbol: Last Fiscal Year End: Trailing Twelve Months:
ntl South Herts
Dec 31, ’09 Sep 30, ’10
High
75th Percentile
25th
Percentile Low
Mean Median
BT Group plc
LSE:BT.A
Mar 31, ’10 Jun 30, ’10
British Sky Broadcasting
Group plc
LSE:BSY
Jun 30, ’10 Jun 30, ’10
TalkTalk Telecom Group
PLC
LSE:TALK
Mar 31, ’10 Mar 31, ’10
KCOM Group PLC.
LSE:KCOM
Mar 31, ’10 Mar 31, ’10
Net Profit Margin:
TTM
11.5 % 168.3 % 12.4 % 0.6 % (9.6 )% 18.0 % 4.4 % 5.3 % 14.9 % (0.2 )% 4.3 % FYE -1
10.6 % 168.3 % 8.1 % (2.9 )% (22.5 )% 15.4 % 4.8 % 4.9 % 4.8 % (2.7 )% (22.5 )% FYE -2
5.5 % 7.4 % (1.2 )% (9.1 )% (42.7 )% (8.4 )% (3.2 )% (0.9 )% (2.6 )% (3.6 )% 3.6 % FYE -3
1.6 % 11.0 % 7.0 % (7.7 )% (25.6 )% (1.5 )% 2.2 % 8.4 % 11.0 % (4.6 )% 4.8 % FYE -4
(8.5 )% 16.8 % 10.8 % (15.1 )% (25.8 )% (3.2 )% (2.2 )% 14.1 % 13.3 % (25.8 )% (15.7 )% FYE -5
NA 21.6 % 11.1 % (15.4 )% (23.7 )% (1.4 )% 1.8 % 7.9 % 15.0 % (21.6 )% 5.0 %
5 Year Average 4.1 % 49.7 % 7.9 % (5.6 )% (14.1 )% 0.3 % 2.7 % 6.4 % 8.3 % (7.4 )% (5.1 )%
5 Year CAGR 5.1 % 37.5 % 4.9 % (0.7 )% (2.5 )% 1.6 % 0.9 % (2.0 )% 0.3 % 7.7 % 5.5 %
Sales to Assets:
TTM
71.4 % 123.1 % 87.8 % 41.1 % 31.7 % 70.3 % 62.6 % 71.2 % 123.1 % 121.2 % 111.1 % FYE -1
66.0 % 117.3 % 78.0 % 38.6 % 27.8 % 65.7 % 59.6 % 72.7 % 117.3 % 94.5 % 116.2 % FYE -2
64.6 % 125.6 % 75.1 % 36.8 % 30.5 % 66.3 % 58.2 % 73.1 % 121.3 % 125.6 % 93.5 % FYE -3
63.4 % 116.1 % 71.8 % 35.4 % 27.4 % 64.7 % 69.4 % 70.5 % 116.1 % 101.2 % 91.5 % FYE -4
62.4 % 260.6 % 80.3 % 31.7 % 21.1 % 79.4 % 66.1 % 83.7 % 109.5 % 260.6 % 96.2 % FYE -5
NA 756.0 % 62.1 % 29.3 % 19.3 % 127.3 % 55.5 % 79.0 % 156.4 % 756.0 % 55.7 %
5 Year Average 64.1 % 140.6 % 76.6 % 35.3 % 28.8 % 69.3 % 63.4 % 74.3 % 117.5 % 140.6 % 101.7 %
5 Year CAGR 1.4 % 6.4 % 1.9 % (0.5 )% (11.5 )% (0.3 )% 1.3 % (1.7 )% 1.6 % (11.5 )% 1.8 %
Return on Assets:
TTM
8.2 % 72.6 % 5.4 % 0.4 % (4.1 )% 3.3 % 2.9 % 3.8 % 18.3 % (0.2 )% 4.8 % FYE -1
7.0 % 68.2 % 4.6 % (1.5 )% (26.2 )% (1.3 )% 1.0 % 3.6 % 5.7 % (2.5 )% (26.2 )% FYE -2
3.5 % 3.6 % (0.6 )% (5.3 )% (17.7 )% (1.7 )% (1.5 )% (0.7 )% (3.1 )% (4.5 )% 3.4 % FYE -3
1.0 % 12.7 % 3.4 % (4.5 )% (10.5 )% 1.5 % 1.5 % 5.9 % 12.7 % (4.6 )% 4.4 % FYE -4
(5.3 )% 14.5 % 3.2 % (9.4 )% (67.2 )% (5.8 )% 1.3 % 11.8 % 14.5 % (67.2 )% (15.1 )% FYE -5
NA 23.5 % 4.6 % (6.0 )% (163.7 )% (12.0 )% 1.8 % 6.3 % 23.5 % (163.7 )% 2.8 %
5 Year Average 2.9 % 20.7 % 4.6 % (4.6 )% (15.8 )% (0.8 )% 1.1 % 4.9 % 9.6 % (15.8 )% (5.7 )%
5 Year CAGR 3.4 % 32.0 % 4.1 % (0.0 )% (1.8 )% 3.9 % 0.5 % (1.8 )% 0.8 % 32.0 % 5.4 %
Assets to Equity:
TTM
810.1 % 2480.4 % 1009.8 % 71.5 % (4787.1 )% 602.2 % 662.0 % (1271.8 )% 857.9 % 354.8 % 1038.9 % FYE -1
1645.3 % 1971.4 % 889.5 % (163.8 )% (7139.1 )% (230.0 )% 440.0 % (1082.3 )% (7139.1 )% 208.7 % 1971.4 % FYE -2
(1723.8 )% 20615.5 % 608.4 % (354.9 )% (2429.8 )% 2209.0 % 396.1 % 20615.5 % (2429.8 )% (534.9 )% 299.5 % FYE -3
(1360.1 )% 8340.4 % 457.5 % (182.6 )% (1720.8 )% 1134.0 % 334.8 % 542.7 % 8340.4 % (760.7 )% 297.3 % FYE -4
(1291.4 )% 3129.8 % 356.0 % (95.4 )% (3852.1 )% 535.9 % 317.4 % 570.0 % 3129.8 % (69.4 )% 286.6 % FYE -5
NA 6174.4 % 741.6 % 85.4 % (395.1 )% 439.9 % 263.4 % 1588.4 % 1313.4 % (34.1 )% 269.7 %
5 Year Average (384.0 )% 3874.8 % 665.3 % (147.4 )% (1523.8 )% 850.2 % 543.4 % 3874.8 % 551.8 % (160.3 )% 778.7 %
5 Year CAGR NA
96.4 % 29.5 % 7.0 % (27.7 )% 26.8 % 21.6 % NA (26.2 )% 96.4 % 31.0 %
Return on Equity:
TTM
66.3 % 712.4 % 99.6 % (2.9 )% (48.2 )% 30.7 % 5.4 % (48.2 )% 156.8 % (0.8 )% 49.5 % FYE -1
114.6 % 593.5 % 18.4 % (18.6 )% (516.4 )% (90.2 )% (9.2 )% (38.8 )% (404.7 )% (5.3 )% (516.4 )% FYE -2
(61.0 )% 75.6 % 22.8 % (16.1 )% (135.9 )% (6.3 )% 7.5 % (135.9 )% 75.6 % 24.1 % 10.2 % FYE -3
(13.6 )% 1061.7 % 33.6 % 5.4 % (16.5 )% 115.6 % 12.6 % 32.1 % 1061.7 % 35.2 % 13.2 % FYE -4
68.9 % 455.4 % 34.3 % 1.6 % (227.4 )% 55.5 % 10.8 % 67.2 % 455.4 % 46.6 % (43.3 )% FYE -5
NA 309.1 % 23.8 % (2.3 )% (376.0 )% 51.9 % 15.4 % 99.5 % 309.1 % 55.7 % 7.5 %
5 Year Average 35.0 % 274.1 % 31.8 % (13.5 )% (97.4 )% 21.1 % 6.8 % (24.7 )% 269.0 % 20.0 % (97.4 )%
5 Year CAGR (0.4 )% 60.6 % 8.6 % (3.4 )% (25.4 )% (0.7 )% (2.1 )% (25.4 )% (17.5 )% (9.3 )% 27.4 %
Company Name: Ticker Symbol: Last Fiscal Year End: Trailing Twelve Months:
Liberty GlobalInc.
LBTY. A
Dec 31, ’09 Jun 30, ’10
Virgin Media,Inc.
VMED
Dec 31, ’09 Jun 30, ’10
Kabel Deutschland Holding AG
DB:KD8
Mar 31, ’10 Jun 30, ’10
Telenet Holding NV
ENXTBR:TNET
Dec 31, ’09 Jun 30, ’10
ZON Multimedia Servicos de
Telecomunicacoes e Multimedia SGPS SA
ENXTLS:ZON
Dec 31, ’09 Jun 30, ’10
Comcast Corporation
CMCS.A
Dec 31, ’09 Jun 30, ’10
Time WarnerCable Inc.
TWC
Dec 31, ’09 Jun 30, ’10
Cablevision Systems
Corporation
CVC
Dec 31, ’09 Jun 30, ’10
Charter Communicatio
ns Inc.
CHTR
Dec 31, ’09 Jun 30, ’10
Mediacom Communicatio
ns Corp.
MCCC
Dec 31, ’09 Jun 30, ’10
Knology, Inc.
KNOL
Dec 31, ’09 Jun 30, ’10
Net Profit Margin:
TTM
0.3 % (9.6 )% (2.5 )% 16.5 % 4.4 % 10.0 % 6.2 % 3.9 % 168.3 % 46.7 % 1.0 % FYE -1
(3.7 )% (9.4 )% (3.1 )% 19.5 % 5.3 % 10.2 % 6.0 % 3.7 % 168.3 % 51.0 % (0.8 )% FYE -2
(7.5 )% (24.4 )% (10.6 )% (1.5 )% 6.2 % 7.4 % (42.7 )% (3.2 )% (37.8 )% (5.5 )% (3.0 )% FYE -3
(4.7 )% (12.1 )% (8.1 )% 2.2 % 6.9 % 8.3 % 7.0 % 3.4 % (25.6 )% (7.4 )% (12.6 )% FYE -4
10.9 % (14.8 )% (15.2 )% 0.7 % 10.7 % 10.1 % 16.8 % (2.2 )% (24.9 )% (10.3 )% (15.0 )% FYE -5
(1.8 )% 21.6 % (11.5 )% (10.5 )% 17.8 % 4.4 % 14.2 % 1.8 % (19.2 )% (20.2 )% (23.7 )% 5 Year Average
(1.0 )% (14.1 )% (7.9 )% 7.5 % 6.7 % 9.2 % (1.3 )% 1.1 % 49.7 % 14.9 % (6.1 )% 5 Year CAGR
(2.5 )% 1.5 % 3.6 % 3.7 % (1.4 )% (0.0 )% (2.3 )% 1.5 % 37.5 % 13.1 % 4.4 % Sales to Assets:
TTM
39.5 % 43.1 % 65.6 % 36.7 % 59.5 % 31.7 % 42.6 % 104.3 % 43.2 % 36.7 % 67.3 % FYE -1
27.8 % 41.4 % 63.5 % 36.6 % 55.6 % 31.7 % 40.9 % 83.4 % 40.6 % 36.7 % 65.8 % FYE -2
30.9 % 38.0 % 57.8 % 33.6 % 58.7 % 30.5 % 35.9 % 77.1 % 46.7 % 37.7 % 63.8 % FYE -3
27.4 % 36.7 % 68.2 % 34.9 % 72.6 % 27.4 % 28.2 % 70.9 % 40.9 % 35.8 % 57.8 % FYE -4
25.4 % 32.0 % 63.9 % 31.4 % 68.3 % 22.6 % 21.1 % 59.2 % 36.5 % 33.1 % 77.0 % FYE -5
19.3 % 39.0 % 55.4 % 28.5 % 62.8 % 20.4 % 20.2 % 51.6 % 30.6 % 30.1 % 61.5 % 5 Year Average
30.2 % 38.3 % 63.8 % 34.6 % 63.0 % 28.8 % 33.7 % 79.0 % 41.6 % 36.0 % 66.3 % 5 Year CAGR
2.7 % 2.0 % 0.3 % 1.0 % (1.3 )% 1.8 % 4.2 % 6.4 % 1.2 % 0.7 % (1.4 )% Return on Assets:
TTM
0.1 % (4.1 )% (1.7 )% 6.0 % 2.6 % 3.2 % 2.6 % 4.1 % 72.6 % 17.1 % 0.7 % FYE -1
(1.0 )% (3.9 )% (2.0 )% 7.1 % 3.0 % 3.2 % 2.4 % 3.1 % 68.2 % 18.7 % (0.5 )% FYE -2
(2.3 )% (9.3 )% (6.1 )% (0.5 )% 3.6 % 2.3 % (15.3 )% (2.4 )% (17.7 )% (2.1 )% (1.9 )% FYE -3
(1.3 )% (4.4 )% (5.5 )% 0.8 % 5.0 % 2.3 % 2.0 % 2.4 % (10.5 )% (2.6 )% (7.3 )% FYE -4
2.8 % (4.7 )% (9.7 )% 0.2 % 7.3 % 2.3 % 3.5 % (1.3 )% (9.1 )% (3.4 )% (11.7 )% FYE -5
(0.3 )% 8.4 % (6.4 )% (3.0 )% 11.2 % 0.9 % 2.9 % 0.9 % (5.9 )% (6.1 )% (14.8 )% 5 Year Average
(0.4 )% (5.3 )% (5.0 )% 2.7 % 4.3 % 2.6 % (0.9 )% 1.2 % 20.7 % 5.5 % (4.2 )% 5 Year CAGR
(0.7 )% 0.2 % 2.2 % 1.4 % (1.1 )% 0.2 % (0.2 )% 1.3 % 17.4 % 4.9 % 3.3 % Assets to Equity:
TTM
1117.4 % 691.2 % (146.0 )% 2480.4 % 632.8 % 266.2 % 469.9 % (123.1 )% 980.8 % 1479.7 % (4787.1 )% FYE -1
1278.8 % 616.1 % (146.8 )% 909.1 % 820.0 % 263.9 % 503.1 % (180.9 )% 869.9 % 1500.9 % (1908.7 )% FYE -2
1001.7 % 492.7 % (142.7 )% 1784.1 % 724.1 % 279.4 % 279.0 % (174.8 )% (132.1 )% (1072.9 )% (1139.7 )% FYE -3
558.9 % 372.4 % (116.1 )% 1568.4 % 262.4 % 274.4 % 229.1 % (179.3 )% (185.8 )% (1428.4 )% (1720.8 )% FYE -4
352.8 % 348.1 % (121.3 )% 359.2 % 235.2 % 268.2 % 236.9 % (184.4 )% (242.8 )% (3852.1 )% 1937.3 % FYE -5
299.1 % 255.2 % (145.5 )% 362.6 % 233.2 % 257.1 % 204.8 % (395.1 )% (334.0 )% 6174.4 % 1120.6 % 5 Year Average
861.9 % 504.1 % (134.6 )% 1420.2 % 534.9 % 270.4 % 343.6 % (168.5 )% 258.0 % (674.6 )% (1523.8 )% 5 Year CAGR
28.0 % 15.3 % 21.2 % 54.0 % 21.6 % (0.1 )% 14.0 % (27.7 )% NA NA
NA
Page 61 of 76
11/04/2011http://www.sec.gov/Archives/edgar/data/857957/000110465911004017/a11-4882_1ex99dc3.htm

Note: * Historical and forecast consensus financial statements for the selected guideline public companies provided by Capital IQ.
Return on Equity:
TTM
1.1 % (28.7 )% 2.4 % 149.8 % 16.7 % 8.4 % 12.5 % (5.0 )% 712.4 % 253.5 % (32.2 )% FYE -1
(13.2 )% (24.0 )% 2.9 % 64.7 % 24.4 % 8.5 % 12.3 % (5.5 )% 593.5 % 280.8 % 10.1 % FYE -2
(23.3 )% (45.6 )% 8.7 % (8.9 )% 26.2 % 6.3 % (42.8 )% 4.2 % 23.3 % 22.4 % 21.5 % FYE -3
(7.2 )% (16.5 )% 6.4 % 12.2 % 13.1 % 6.3 % 4.5 % (4.3 )% 19.4 % 37.6 % 125.7 % FYE -4
9.7 % (16.5 )% 11.8 % 0.8 % 17.2 % 6.2 % 8.4 % 2.4 % 22.0 % 131.8 % (227.4 )% FYE -5
(1.0 )% 21.5 % 9.3 % (10.8 )% 26.0 % 2.3 % 5.9 % (3.6 )% 19.7 % (376.0 )% (165.3 )% 5 Year Average
(6.6 )% (26.3 )% 6.4 % 43.7 % 19.5 % 7.1 % (1.0 )% (1.6 )% 274.1 % 145.2 % (20.5 )% 5 Year CAGR
(2.0 )% (3.9 )% (2.2 )% 25.5 % (0.1 )% 0.5 % 0.9 % (1.9 )% 60.6 % 11.1 % NA
Page 62 of 76
11/04/2011http://www.sec.gov/Archives/edgar/data/857957/000110465911004017/a11-4882_1ex99dc3.htm
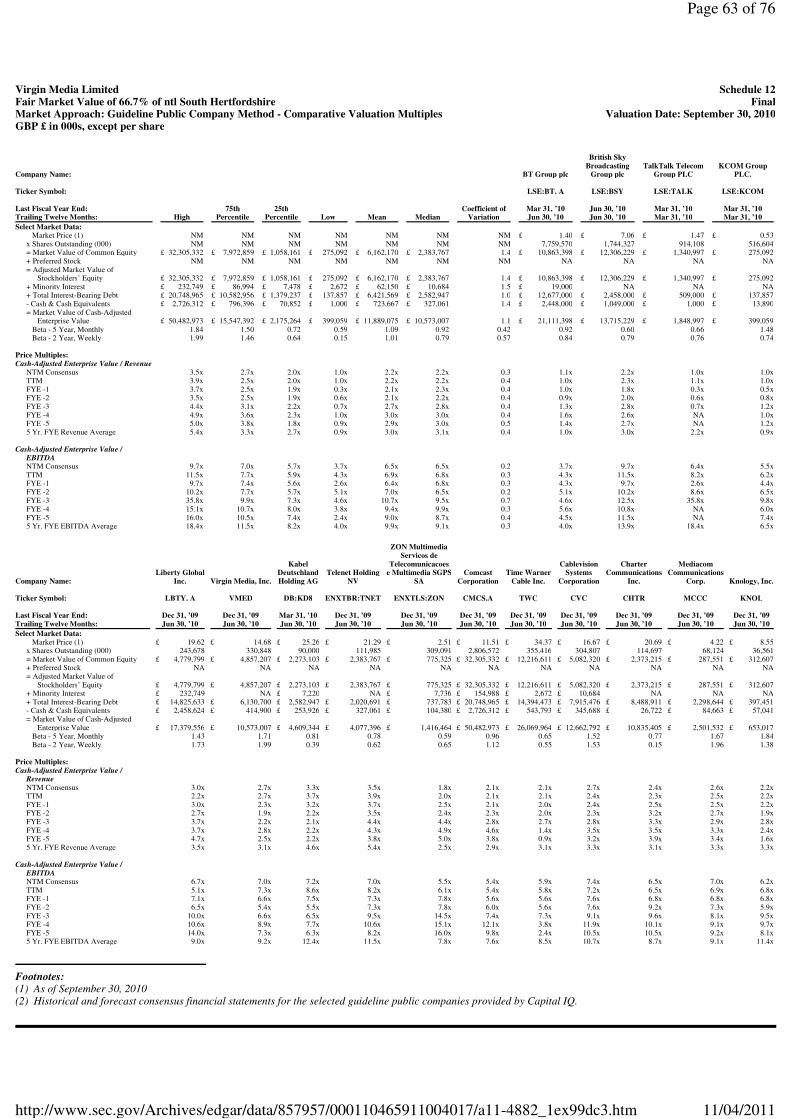
Footnotes: (1) As of September 30, 2010 (2) Historical and forecast consensus financial statements for the selected guideline public companies provided by Capital IQ.
Virgin Media Limited Schedule 12
Fair Market Value of 66.7% of ntl South Hertfordshire Final
Market Approach: Guideline Public Company Method - Comparative Valuation Multiples Valuation Date: September 30, 2010
GBP £ in 000s, except per share
British Sky
Broadcasting
TalkTalk Telecom KCOM Group
Company Name:
BT Group plc Group plc
Group PLC PLC.
Ticker Symbol:
LSE:BT. A LSE:BSY
LSE:TALK LSE:KCOM
Last Fiscal Year End:
75th 25th
Coefficient of Mar 31, ’10
Jun 30, ’10 Mar 31, ’10
Mar 31, ’10
Trailing Twelve Months: High
Percentile Percentile
Low Mean
Median Variation
Jun 30, ’10 Jun 30, ’10
Mar 31, ’10 Mar 31, ’10
Select Market Data:
Market Price (1)
NM NM
NM NM
NM NM
NM £ 1.40
£ 7.06 £ 1.47
£ 0.53
x Shares Outstanding (000) NM
NM NM
NM NM
NM NM
7,759,570 1,744,327
914,108 516,604
= Market Value of Common Equity
£ 32,305,332 £ 7,972,859
£ 1,058,161 £ 275,092
£ 6,162,170 £ 2,383,767
1.4 £ 10,863,398
£ 12,306,229 £ 1,340,997
£ 275,092
+ Preferred Stock NM
NM NM
NM NM
NM NM
NA NA
NA NA
= Adjusted Market Value of
Stockholders’ Equity £ 32,305,332
£ 7,972,859 £ 1,058,161
£ 275,092 £ 6,162,170
£ 2,383,767 1.4
£ 10,863,398 £ 12,306,229
£ 1,340,997 £ 275,092
+ Minority Interest
£ 232,749 £ 86,994
£ 7,478 £ 2,672
£ 62,150 £ 10,684
1.5 £ 19,000
NA NA
NA
+ Total Interest-Bearing Debt £ 20,748,965
£ 10,582,956 £ 1,379,237
£ 137,857 £ 6,421,569
£ 2,582,947 1.0
£ 12,677,000 £ 2,458,000
£ 509,000 £ 137,857
- Cash & Cash Equivalents
£ 2,726,312 £ 796,396
£ 70,852 £ 1,000
£ 723,667 £ 327,061
1.4 £ 2,448,000
£ 1,049,000 £ 1,000
£ 13,890
= Market Value of Cash-Adjusted Enterprise Value
£ 50,482,973 £ 15,547,392
£ 2,175,264 £ 399,059
£ 11,889,075 £ 10,573,007
1.1 £ 21,111,398
£ 13,715,229 £ 1,848,997
£ 399,059
Beta - 5 Year, Monthly 1.84
1.50 0.72
0.59 1.09
0.92 0.42
0.92 0.60
0.66 1.48
Beta - 2 Year, Weekly
1.99 1.46
0.64 0.15
1.01 0.79
0.57 0.84
0.79 0.76
0.74
Price Multiples:
Cash-Adjusted Enterprise Value / Revenue
NTM Consensus
3.5x 2.7x
2.0x 1.0x
2.2x 2.2x
0.3 1.1x
2.2x 1.0x
1.0x
TTM 3.9x
2.5x 2.0x
1.0x 2.2x
2.2x 0.4
1.0x 2.3x
1.1x 1.0x
FYE -1
3.7x 2.5x
1.9x 0.3x
2.1x 2.3x
0.4 1.0x
1.8x 0.3x
0.5x
FYE -2 3.5x
2.5x 1.9x
0.6x 2.1x
2.2x 0.4
0.9x 2.0x
0.6x 0.8x
FYE -3
4.4x 3.1x
2.2x 0.7x
2.7x 2.8x
0.4 1.3x
2.8x 0.7x
1.2x
FYE -4 4.9x
3.6x 2.3x
1.0x 3.0x
3.0x 0.4
1.6x 2.6x
NA 1.0x
FYE -5
5.0x 3.8x
1.8x 0.9x
2.9x 3.0x
0.5 1.4x
2.7x NA
1.2x
5 Yr. FYE Revenue Average 5.4x
3.3x 2.7x
0.9x 3.0x
3.1x 0.4
1.0x 3.0x
2.2x 0.9x
Cash-Adjusted Enterprise Value / EBITDA
NTM Consensus
9.7x 7.0x
5.7x 3.7x
6.5x 6.5x
0.2 3.7x
9.7x 6.4x
5.5x
TTM 11.5x
7.7x 5.9x
4.3x 6.9x
6.8x 0.3
4.3x 11.5x
8.2x 6.2x
FYE -1
9.7x 7.4x
5.6x 2.6x
6.4x 6.8x
0.3 4.3x
9.7x 2.6x
4.4x
FYE -2 10.2x
7.7x 5.7x
5.1x 7.0x
6.5x 0.2
5.1x 10.2x
8.6x 6.5x
FYE -3
35.8x 9.9x
7.3x 4.6x
10.7x 9.5x
0.7 4.6x
12.5x 35.8x
9.8x
FYE -4 15.1x
10.7x 8.0x
3.8x 9.4x
9.9x 0.3
5.6x 10.8x
NA 6.0x
FYE -5
16.0x 10.5x
7.4x 2.4x
9.0x 8.7x
0.4 4.5x
11.5x NA
7.4x
5 Yr. FYE EBITDA Average 18.4x
11.5x 8.2x
4.0x 9.9x
9.1x 0.3
4.0x 13.9x
18.4x 6.5x
ZON Multimedia
Servicos de
Kabel
Telecomunicacoes Cablevision
Charter Mediacom
Liberty Global Deutschland
Telenet Holding e Multimedia SGPS
Comcast Time Warner
Systems Communications
Communications
Company Name:
Inc. Virgin Media, Inc.
Holding AG NV
SA Corporation
Cable Inc. Corporation
Inc. Corp.
Knology, Inc.
Ticker Symbol:
LBTY. A
VMED DB:KD8
ENXTBR:TNET ENXTLS:ZON
CMCS.A TWC
CVC CHTR
MCCC KNOL
Last Fiscal Year End:
Dec 31, ’09 Dec 31, ’09
Mar 31, ’10 Dec 31, ’09
Dec 31, ’09 Dec 31, ’09
Dec 31, ’09 Dec 31, ’09
Dec 31, ’09 Dec 31, ’09
Dec 31, ’09
Trailing Twelve Months: Jun 30, ’10
Jun 30, ’10 Jun 30, ’10
Jun 30, ’10 Jun 30, ’10
Jun 30, ’10 Jun 30, ’10
Jun 30, ’10 Jun 30, ’10
Jun 30, ’10 Jun 30, ’10
Select Market Data:
Market Price (1)
£ 19.62 £ 14.68
£ 25.26 £ 21.29
£ 2.51 £ 11.51
£ 34.37 £ 16.67
£ 20.69 £ 4.22
£ 8.55
x Shares Outstanding (000)
243,678 330,848
90,000 111,985
309,091 2,806,572
355,416 304,807
114,697 68,124
36,561
= Market Value of Common Equity
£ 4,779,799 £ 4,857,207
£ 2,273,103 £ 2,383,767
£ 775,325 £ 32,305,332
£ 12,216,611 £ 5,082,320
£ 2,373,215 £ 287,551
£ 312,607
+ Preferred Stock
NA NA
NA NA
NA NA
NA NA
NA NA
NA
= Adjusted Market Value of Stockholders’ Equity
£ 4,779,799 £ 4,857,207
£ 2,273,103 £ 2,383,767
£ 775,325 £ 32,305,332
£ 12,216,611 £ 5,082,320
£ 2,373,215 £ 287,551
£ 312,607
+ Minority Interest
£ 232,749 NA
£ 7,220 NA
£ 7,736 £ 154,988
£ 2,672 £ 10,684
NA NA
NA
+ Total Interest-Bearing Debt
£ 14,825,633 £ 6,130,700
£ 2,582,947 £ 2,020,691
£ 737,783 £ 20,748,965
£ 14,394,473 £ 7,915,476
£ 8,488,911 £ 2,298,644
£ 397,451
- Cash & Cash Equivalents
£ 2,458,624 £ 414,900
£ 253,926 £ 327,061
£ 104,380 £ 2,726,312
£ 543,793 £ 345,688
£ 26,722 £ 84,663
£ 57,041
= Market Value of Cash-Adjusted Enterprise Value
£ 17,379,556 £ 10,573,007
£ 4,609,344 £ 4,077,396
£ 1,416,464 £ 50,482,973
£ 26,069,964 £ 12,662,792
£ 10,835,405 £ 2,501,532
£ 653,017
Beta - 5 Year, Monthly
1.43 1.71
0.81 0.78
0.59 0.96
0.65 1.52
0.77 1.67
1.84
Beta - 2 Year, Weekly
1.73 1.99
0.39 0.62
0.65 1.12
0.55 1.53
0.15 1.96
1.38
Price Multiples:
Cash-Adjusted Enterprise Value /
Revenue
NTM Consensus
3.0x
2.7x 3.3x
3.5x 1.8x
2.1x 2.1x
2.7x 2.4x
2.6x 2.2x
TTM
2.2x
2.7x 3.7x
3.9x 2.0x
2.1x 2.1x
2.4x 2.3x
2.5x 2.2x
FYE -1
3.0x
2.3x 3.2x
3.7x 2.5x
2.1x 2.0x
2.4x 2.5x
2.5x 2.2x
FYE -2
2.7x
1.9x 2.2x
3.5x 2.4x
2.3x 2.0x
2.3x 3.2x
2.7x 1.9x
FYE -3
3.7x
2.2x 2.1x
4.4x 4.4x
2.8x 2.7x
2.8x 3.3x
2.9x 2.8x
FYE -4
3.7x
2.8x 2.2x
4.3x 4.9x
4.6x 1.4x
3.5x 3.5x
3.3x 2.4x
FYE -5
4.7x
2.5x 2.2x
3.8x 5.0x
3.8x 0.9x
3.2x 3.9x
3.4x 1.6x
5 Yr. FYE Revenue Average
3.5x
3.1x 4.6x
5.4x 2.5x
2.9x 3.1x
3.3x 3.1x
3.3x 3.3x
Cash-Adjusted Enterprise Value /
EBITDA
NTM Consensus
6.7x 7.0x
7.2x 7.0x
5.5x 5.4x
5.9x 7.4x
6.5x 7.0x
6.2x
TTM
5.1x 7.3x
8.6x 8.2x
6.1x 5.4x
5.8x 7.2x
6.5x 6.9x
6.8x
FYE -1
7.1x 6.6x
7.5x 7.3x
7.8x 5.6x
5.6x 7.6x
6.8x 6.8x
6.8x
FYE -2
6.5x 5.4x
5.5x 7.3x
7.8x 6.0x
5.6x 7.6x
9.2x 7.3x
5.9x
FYE -3
10.0x 6.6x
6.5x 9.5x
14.5x 7.4x
7.3x 9.1x
9.6x 8.1x
9.5x
FYE -4
10.6x 8.9x
7.7x 10.6x
15.1x 12.1x
3.8x 11.9x
10.1x 9.1x
9.7x
FYE -5
14.0x 7.3x
6.3x 8.2x
16.0x 9.8x
2.4x 10.5x
10.5x 9.2x
8.1x
5 Yr. FYE EBITDA Average
9.0x 9.2x
12.4x 11.5x
7.8x 7.6x
8.5x 10.7x
8.7x 9.1x
11.4x
Page 63 of 76
11/04/2011http://www.sec.gov/Archives/edgar/data/857957/000110465911004017/a11-4882_1ex99dc3.htm
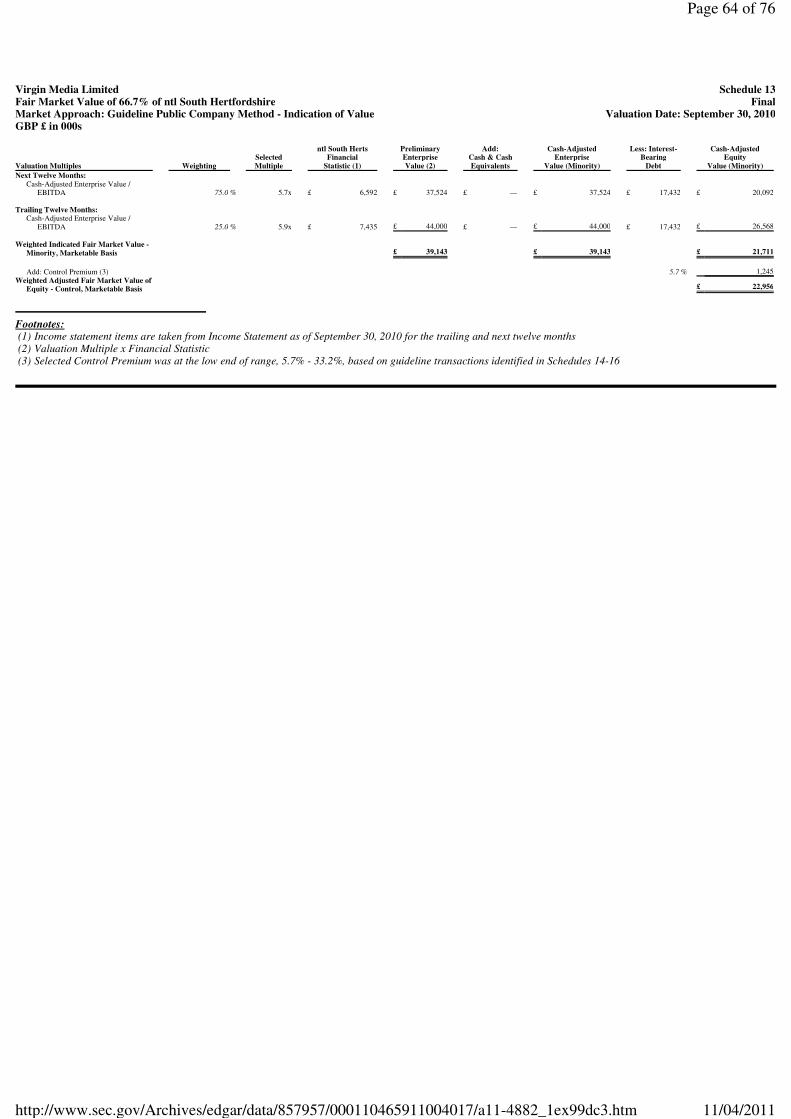
GBP £ in 000s
Footnotes: (1) Income statement items are taken from Income Statement as of September 30, 2010 for the trailing and next twelve months (2) Valuation Multiple x Financial Statistic (3) Selected Control Premium was at the low end of range, 5.7% - 33.2%, based on guideline transactions identified in Schedules 14-16
Virgin Media Limited Schedule 13
Fair Market Value of 66.7% of ntl South Hertfordshire Final
Market Approach: Guideline Public Company Method - Indication of Value Valuation Date: September 30, 2010
ntl South Herts Preliminary
Add: Cash-Adjusted
Less: Interest- Cash-Adjusted
Selected
Financial Enterprise
Cash & Cash Enterprise
Bearing Equity
Valuation Multiples
Weighting Multiple
Statistic (1) Value (2)
Equivalents Value (Minority)
Debt Value (Minority)
Next Twelve Months:
Cash-Adjusted Enterprise Value /
EBITDA 75.0 % 5.7x
£ 6,592 £ 37,524
£ — £ 37,524
£ 17,432 £ 20,092
Trailing Twelve Months:
Cash-Adjusted Enterprise Value / EBITDA
25.0 % 5.9x £ 7,435
£ 44,000 £ —
£ 44,000 £ 17,432
£ 26,568
Weighted Indicated Fair Market Value -
Minority, Marketable Basis £ 39,143
£ 39,143 £ 21,711
Add: Control Premium (3) 5.7 % 1,245
Weighted Adjusted Fair Market Value of
Equity - Control, Marketable Basis £ 22,956
Page 64 of 76
11/04/2011http://www.sec.gov/Archives/edgar/data/857957/000110465911004017/a11-4882_1ex99dc3.htm
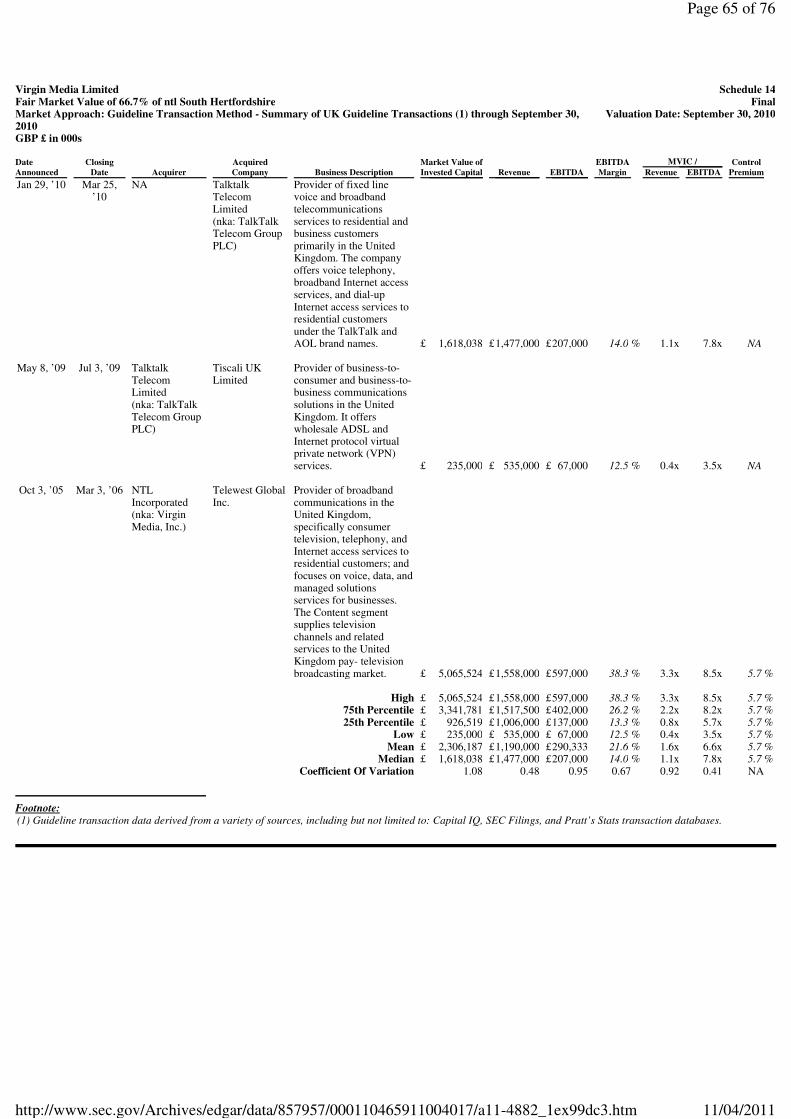
GBP £ in 000s
Footnote: (1) Guideline transaction data derived from a variety of sources, including but not limited to: Capital IQ, SEC Filings, and Pratt’s Stats transaction databases.
Virgin Media Limited Schedule 14
Fair Market Value of 66.7% of ntl South Hertfordshire Final
Market Approach: Guideline Transaction Method - Summary of UK Guideline Transactions (1) through September 30, 2010
Valuation Date: September 30, 2010
Date Closing
Acquired Market Value of
EBITDA MVIC /
Control
Announced Date
Acquirer Company
Business Description Invested Capital
Revenue EBITDA
Margin Revenue
EBITDA Premium
Jan 29, ’10
Mar 25,
’10
NA
Talktalk Telecom Limited (nka: TalkTalk Telecom Group PLC)
Provider of fixed line voice and broadband telecommunications services to residential and business customers primarily in the United Kingdom. The company offers voice telephony, broadband Internet access services, and dial-up Internet access services to residential customers under the TalkTalk and AOL brand names.
£ 1,618,038 £ 1,477,000
£ 207,000 14.0 % 1.1x
7.8x NA
May 8, ’09
Jul 3, ’09
Talktalk Telecom Limited (nka: TalkTalk Telecom Group PLC)
Tiscali UK Limited
Provider of business-to-consumer and business-to-business communications solutions in the United Kingdom. It offers wholesale ADSL and Internet protocol virtual private network (VPN) services.
£ 235,000 £ 535,000
£ 67,000 12.5 % 0.4x
3.5x NA
Oct 3, ’05
Mar 3, ’06
NTL Incorporated (nka: Virgin Media, Inc.)
Telewest Global Inc.
Provider of broadband communications in the United Kingdom, specifically consumer television, telephony, and Internet access services to residential customers; and focuses on voice, data, and managed solutions services for businesses. The Content segment supplies television channels and related services to the United Kingdom pay- television broadcasting market.
£ 5,065,524 £ 1,558,000
£ 597,000 38.3 % 3.3x
8.5x 5.7 %
High £ 5,065,524
£ 1,558,000 £ 597,000
38.3 % 3.3x 8.5x
5.7 %
75th Percentile £ 3,341,781
£ 1,517,500 £ 402,000
26.2 % 2.2x 8.2x
5.7 %
25th Percentile £ 926,519
£ 1,006,000 £ 137,000
13.3 % 0.8x 5.7x
5.7 %
Low £ 235,000
£ 535,000 £ 67,000
12.5 % 0.4x 3.5x
5.7 %
Mean £ 2,306,187
£ 1,190,000 £ 290,333
21.6 % 1.6x 6.6x
5.7 %
Median £ 1,618,038
£ 1,477,000 £ 207,000
14.0 % 1.1x 7.8x
5.7 %
Coefficient Of Variation 1.08
0.48 0.95
0.67 0.92
0.41 NA
Page 65 of 76
11/04/2011http://www.sec.gov/Archives/edgar/data/857957/000110465911004017/a11-4882_1ex99dc3.htm
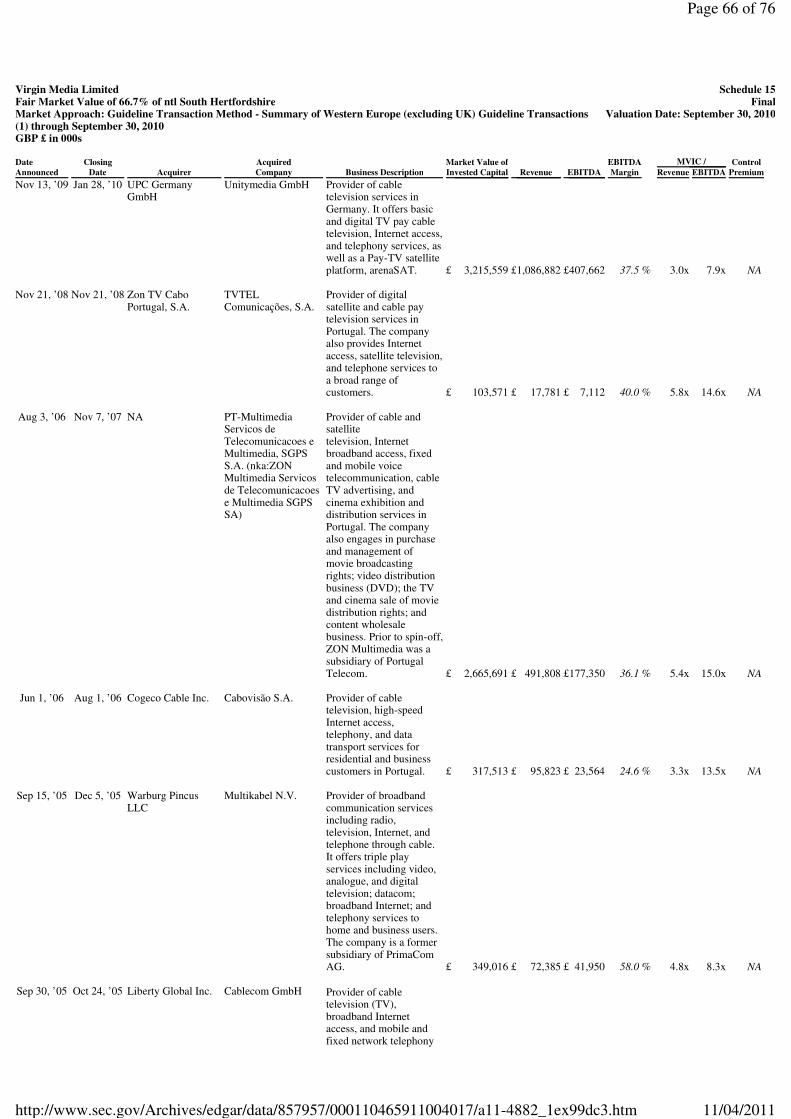
GBP £ in 000s
Virgin Media Limited
Schedule 15Fair Market Value of 66.7% of ntl South Hertfordshire
FinalMarket Approach: Guideline Transaction Method - Summary of Western Europe (excluding UK) Guideline Transactions (1) through September 30, 2010
Valuation Date: September 30, 2010
Date Closing
Acquired Market Value of
EBITDA MVIC /
Control
Announced Date
Acquirer Company
Business Description Invested Capital
Revenue EBITDA
Margin Revenue
EBITDA Premium
Nov 13, ’09
Jan 28, ’10
UPC Germany GmbH
Unitymedia GmbH
Provider of cable television services in Germany. It offers basic and digital TV pay cable television, Internet access, and telephony services, as well as a Pay-TV satellite platform, arenaSAT.
£ 3,215,559 £1,086,882
£407,662 37.5 % 3.0x
7.9x NA
Nov 21, ’08 Nov 21, ’08
Zon TV Cabo Portugal, S.A.
TVTEL Comunicações, S.A.
Provider of digital satellite and cable pay television services in Portugal. The company also provides Internet access, satellite television, and telephone services to a broad range of customers.
£ 103,571 £ 17,781
£ 7,112 40.0 % 5.8x
14.6x NA
Aug 3, ’06 Nov 7, ’07
NA
PT-Multimedia Servicos de Telecomunicacoes e Multimedia, SGPS S.A. (nka:ZON Multimedia Servicos de Telecomunicacoes e Multimedia SGPS SA)
Provider of cable and satellite television, Internet broadband access, fixed and mobile voice telecommunication, cable TV advertising, and cinema exhibition and distribution services in Portugal. The company also engages in purchase and management of movie broadcasting rights; video distribution business (DVD); the TV and cinema sale of movie distribution rights; and content wholesale business. Prior to spin-off, ZON Multimedia was a subsidiary of Portugal Telecom.
£ 2,665,691 £ 491,808
£177,350 36.1 % 5.4x
15.0x NA
Jun 1, ’06 Aug 1, ’06
Cogeco Cable Inc.
Cabovisão S.A.
Provider of cable television, high-speed Internet access, telephony, and data transport services for residential and business customers in Portugal.
£ 317,513 £ 95,823
£ 23,564 24.6 % 3.3x
13.5x NA
Sep 15, ’05 Dec 5, ’05
Warburg Pincus LLC
Multikabel N.V.
Provider of broadband communication services including radio, television, Internet, and telephone through cable. It offers triple play services including video, analogue, and digital television; datacom; broadband Internet; and telephony services to home and business users. The company is a former subsidiary of PrimaCom AG.
£ 349,016 £ 72,385
£ 41,950 58.0 % 4.8x
8.3x NA
Sep 30, ’05 Oct 24, ’05
Liberty Global Inc.
Cablecom GmbH Provider of cable
television (TV), broadband Internet access, and mobile and fixed network telephony
Page 66 of 76
11/04/2011http://www.sec.gov/Archives/edgar/data/857957/000110465911004017/a11-4882_1ex99dc3.htm
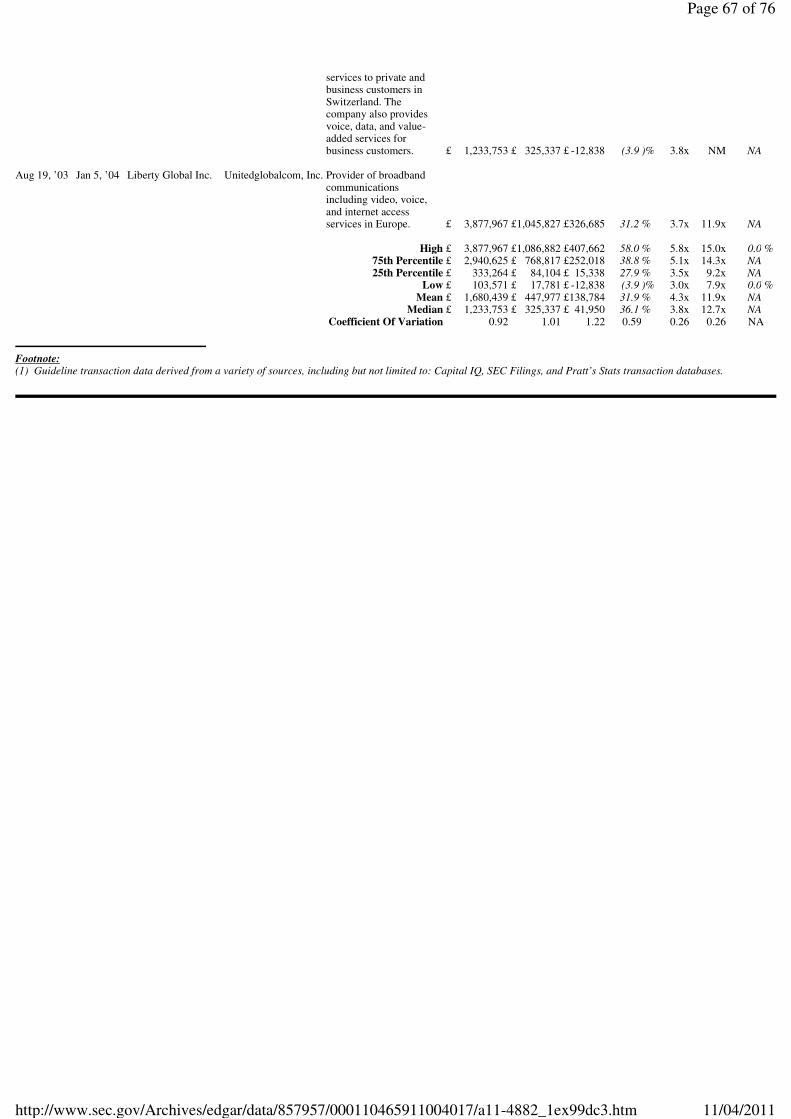
Footnote: (1) Guideline transaction data derived from a variety of sources, including but not limited to: Capital IQ, SEC Filings, and Pratt’s Stats transaction databases.
services to private and business customers in Switzerland. The company also provides voice, data, and value-added services for business customers.
£ 1,233,753 £ 325,337
£ -12,838 (3.9 )% 3.8x
NM NA
Aug 19, ’03
Jan 5, ’04 Liberty Global Inc.
Unitedglobalcom, Inc.
Provider of broadband communications including video, voice, and internet access services in Europe.
£ 3,877,967 £1,045,827
£326,685 31.2 % 3.7x
11.9x NA
High
£ 3,877,967 £1,086,882
£407,662 58.0 % 5.8x
15.0x 0.0 %
75th Percentile
£ 2,940,625 £ 768,817
£252,018 38.8 % 5.1x
14.3x NA
25th Percentile £ 333,264
£ 84,104 £ 15,338
27.9 % 3.5x 9.2x
NA
Low
£ 103,571 £ 17,781
£ -12,838 (3.9 )% 3.0x
7.9x 0.0 %
Mean
£ 1,680,439 £ 447,977
£138,784 31.9 % 4.3x
11.9x NA
Median £ 1,233,753
£ 325,337 £ 41,950
36.1 % 3.8x 12.7x
NA
Coefficient Of Variation
0.92 1.01
1.22 0.59
0.26 0.26
NA
Page 67 of 76
11/04/2011http://www.sec.gov/Archives/edgar/data/857957/000110465911004017/a11-4882_1ex99dc3.htm
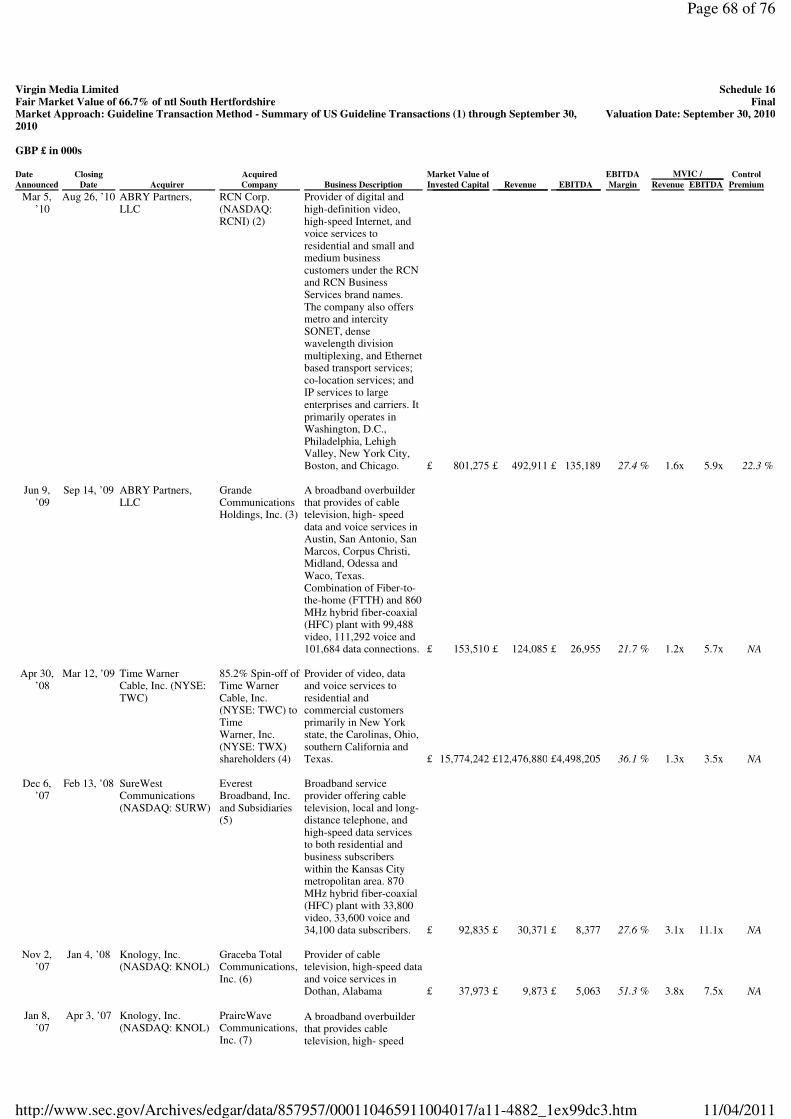
GBP £ in 000s
Virgin Media Limited Schedule 16
Fair Market Value of 66.7% of ntl South Hertfordshire Final
Market Approach: Guideline Transaction Method - Summary of US Guideline Transactions (1) through September 30, 2010
Valuation Date: September 30, 2010
Date Closing
Acquired Market Value of
EBITDA MVIC /
Control
Announced Date
Acquirer Company
Business Description Invested Capital
Revenue EBITDA
Margin Revenue
EBITDA Premium
Mar 5,
’10
Aug 26, ’10 ABRY Partners, LLC
RCN Corp. (NASDAQ: RCNI) (2)
Provider of digital and high-definition video, high-speed Internet, and voice services to residential and small and medium business customers under the RCN and RCN Business Services brand names. The company also offers metro and intercity SONET, dense wavelength division multiplexing, and Ethernet based transport services; co-location services; and IP services to large enterprises and carriers. It primarily operates in Washington, D.C., Philadelphia, Lehigh Valley, New York City, Boston, and Chicago.
£ 801,275 £ 492,911
£ 135,189 27.4 % 1.6x
5.9x 22.3 %
Jun 9,
’09
Sep 14, ’09 ABRY Partners, LLC
Grande Communications Holdings, Inc. (3)
A broadband overbuilder that provides of cable television, high- speed data and voice services in Austin, San Antonio, San Marcos, Corpus Christi, Midland, Odessa and Waco, Texas. Combination of Fiber-to-the-home (FTTH) and 860 MHz hybrid fiber-coaxial (HFC) plant with 99,488 video, 111,292 voice and 101,684 data connections.
£ 153,510 £ 124,085
£ 26,955 21.7 % 1.2x
5.7x NA
Apr 30, ’08
Mar 12, ’09 Time Warner Cable, Inc. (NYSE: TWC)
85.2% Spin-off of Time Warner Cable, Inc. (NYSE: TWC) to Time Warner, Inc. (NYSE: TWX) shareholders (4)
Provider of video, data and voice services to residential and commercial customers primarily in New York state, the Carolinas, Ohio, southern California and Texas.
£ 15,774,242 £12,476,880
£4,498,205 36.1 % 1.3x
3.5x NA
Dec 6, ’07
Feb 13, ’08 SureWest Communications (NASDAQ: SURW)
Everest Broadband, Inc. and Subsidiaries (5)
Broadband service provider offering cable television, local and long-distance telephone, and high-speed data services to both residential and business subscribers within the Kansas City metropolitan area. 870 MHz hybrid fiber-coaxial (HFC) plant with 33,800 video, 33,600 voice and 34,100 data subscribers.
£ 92,835 £ 30,371
£ 8,377 27.6 % 3.1x
11.1x NA
Nov 2, ’07
Jan 4, ’08 Knology, Inc. (NASDAQ: KNOL)
Graceba Total Communications, Inc. (6)
Provider of cable television, high-speed data and voice services in Dothan, Alabama
£ 37,973 £ 9,873
£ 5,063 51.3 % 3.8x
7.5x NA
Jan 8, ’07
Apr 3, ’07 Knology, Inc. (NASDAQ: KNOL)
PraireWave Communications, Inc. (7)
A broadband overbuilder that provides cable television, high- speed
Page 68 of 76
11/04/2011http://www.sec.gov/Archives/edgar/data/857957/000110465911004017/a11-4882_1ex99dc3.htm
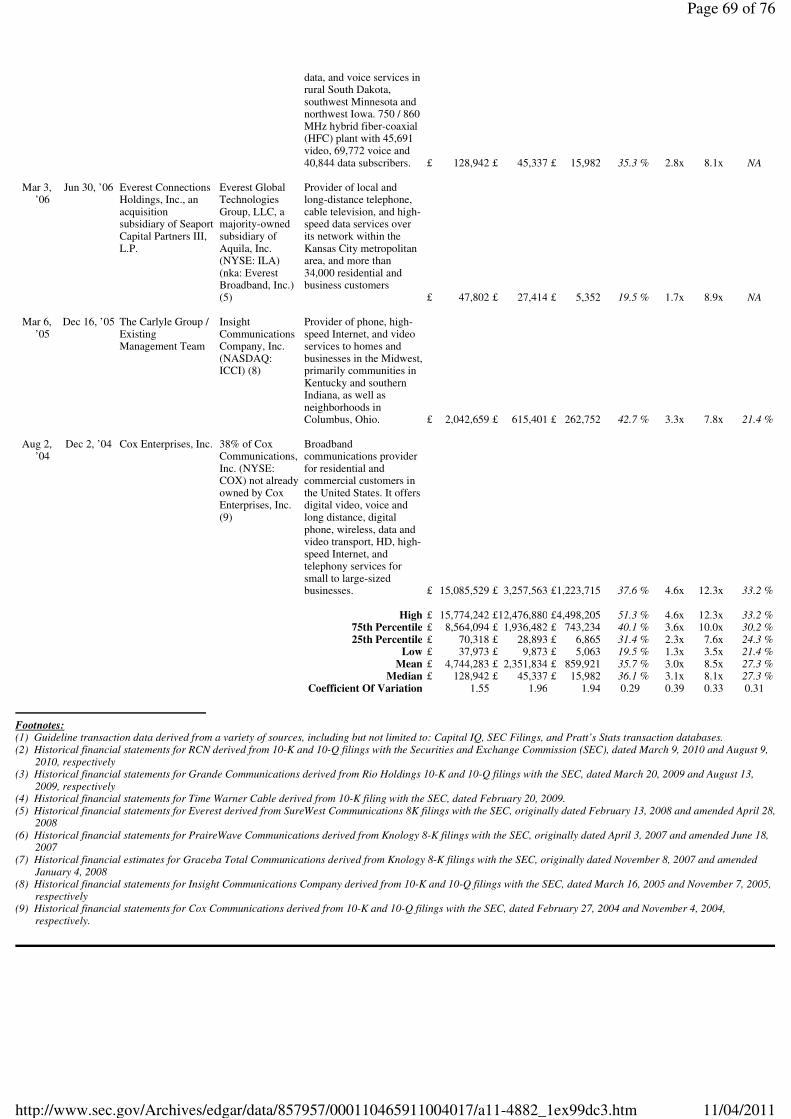
Footnotes: (1) Guideline transaction data derived from a variety of sources, including but not limited to: Capital IQ, SEC Filings, and Pratt’s Stats transaction databases. (2) Historical financial statements for RCN derived from 10-K and 10-Q filings with the Securities and Exchange Commission (SEC), dated March 9, 2010 and August 9,
2010, respectively (3) Historical financial statements for Grande Communications derived from Rio Holdings 10-K and 10-Q filings with the SEC, dated March 20, 2009 and August 13,
2009, respectively (4) Historical financial statements for Time Warner Cable derived from 10-K filing with the SEC, dated February 20, 2009. (5) Historical financial statements for Everest derived from SureWest Communications 8K filings with the SEC, originally dated February 13, 2008 and amended April 28,
2008 (6) Historical financial statements for PraireWave Communications derived from Knology 8-K filings with the SEC, originally dated April 3, 2007 and amended June 18,
2007 (7) Historical financial estimates for Graceba Total Communications derived from Knology 8-K filings with the SEC, originally dated November 8, 2007 and amended
January 4, 2008 (8) Historical financial statements for Insight Communications Company derived from 10-K and 10-Q filings with the SEC, dated March 16, 2005 and November 7, 2005,
respectively (9) Historical financial statements for Cox Communications derived from 10-K and 10-Q filings with the SEC, dated February 27, 2004 and November 4, 2004,
respectively.
data, and voice services in rural South Dakota, southwest Minnesota and northwest Iowa. 750 / 860 MHz hybrid fiber-coaxial (HFC) plant with 45,691 video, 69,772 voice and 40,844 data subscribers.
£ 128,942 £ 45,337
£ 15,982 35.3 % 2.8x
8.1x NA
Mar 3, ’06
Jun 30, ’06 Everest Connections Holdings, Inc., an acquisition subsidiary of Seaport Capital Partners III, L.P.
Everest Global Technologies Group, LLC, a majority-owned subsidiary of Aquila, Inc. (NYSE: ILA) (nka: Everest Broadband, Inc.) (5)
Provider of local and long-distance telephone, cable television, and high-speed data services over its network within the Kansas City metropolitan area, and more than 34,000 residential and business customers
£ 47,802 £ 27,414
£ 5,352 19.5 % 1.7x
8.9x NA
Mar 6, ’05
Dec 16, ’05 The Carlyle Group / Existing Management Team
Insight Communications Company, Inc. (NASDAQ: ICCI) (8)
Provider of phone, high-speed Internet, and video services to homes and businesses in the Midwest, primarily communities in Kentucky and southern Indiana, as well as neighborhoods in Columbus, Ohio.
£ 2,042,659 £ 615,401
£ 262,752 42.7 % 3.3x
7.8x 21.4 %
Aug 2,
’04
Dec 2, ’04 Cox Enterprises, Inc.
38% of Cox Communications, Inc. (NYSE: COX) not already owned by Cox Enterprises, Inc. (9)
Broadband communications provider for residential and commercial customers in the United States. It offers digital video, voice and long distance, digital phone, wireless, data and video transport, HD, high-speed Internet, and telephony services for small to large-sized businesses.
£ 15,085,529 £ 3,257,563
£1,223,715 37.6 % 4.6x
12.3x 33.2 %
High £ 15,774,242
£12,476,880 £4,498,205
51.3 % 4.6x 12.3x
33.2 %
75th Percentile £ 8,564,094
£ 1,936,482 £ 743,234
40.1 % 3.6x 10.0x
30.2 %
25th Percentile £ 70,318
£ 28,893 £ 6,865
31.4 % 2.3x 7.6x
24.3 %
Low £ 37,973
£ 9,873 £ 5,063
19.5 % 1.3x 3.5x
21.4 %
Mean £ 4,744,283
£ 2,351,834 £ 859,921
35.7 % 3.0x 8.5x
27.3 %
Median £ 128,942
£ 45,337 £ 15,982
36.1 % 3.1x 8.1x
27.3 %
Coefficient Of Variation 1.55
1.96 1.94
0.29 0.39
0.33 0.31
Page 69 of 76
11/04/2011http://www.sec.gov/Archives/edgar/data/857957/000110465911004017/a11-4882_1ex99dc3.htm
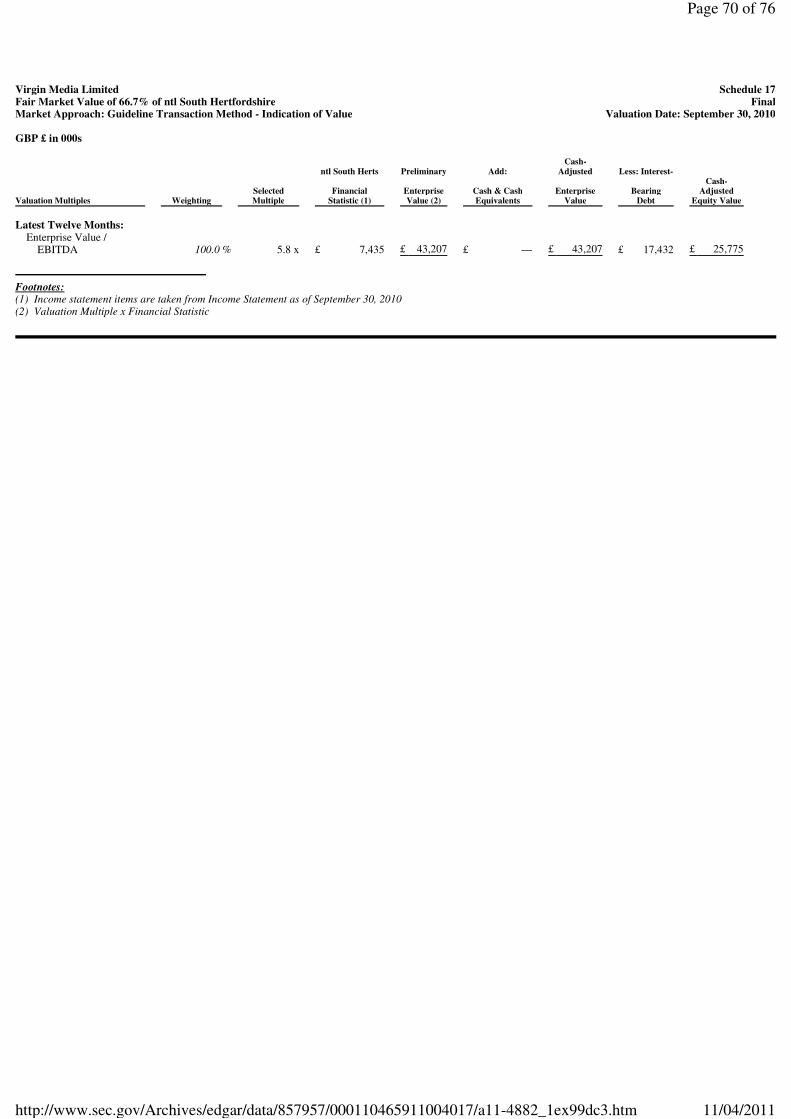
GBP £ in 000s
Footnotes: (1) Income statement items are taken from Income Statement as of September 30, 2010 (2) Valuation Multiple x Financial Statistic
Virgin Media Limited Schedule 17
Fair Market Value of 66.7% of ntl South Hertfordshire Final
Market Approach: Guideline Transaction Method - Indication of Value Valuation Date: September 30, 2010
ntl South Herts Preliminary
Add:
Cash-Adjusted
Less: Interest-
Selected Financial
Enterprise Cash & Cash
Enterprise Bearing
Cash-
Adjusted
Valuation Multiples Weighting
Multiple Statistic (1)
Value (2) Equivalents
Value Debt
Equity Value
Latest Twelve Months:
Enterprise Value /
EBITDA 100.0 % 5.8 x
£ 7,435 £ 43,207
£ — £ 43,207
£ 17,432 £ 25,775
Page 70 of 76
11/04/2011http://www.sec.gov/Archives/edgar/data/857957/000110465911004017/a11-4882_1ex99dc3.htm
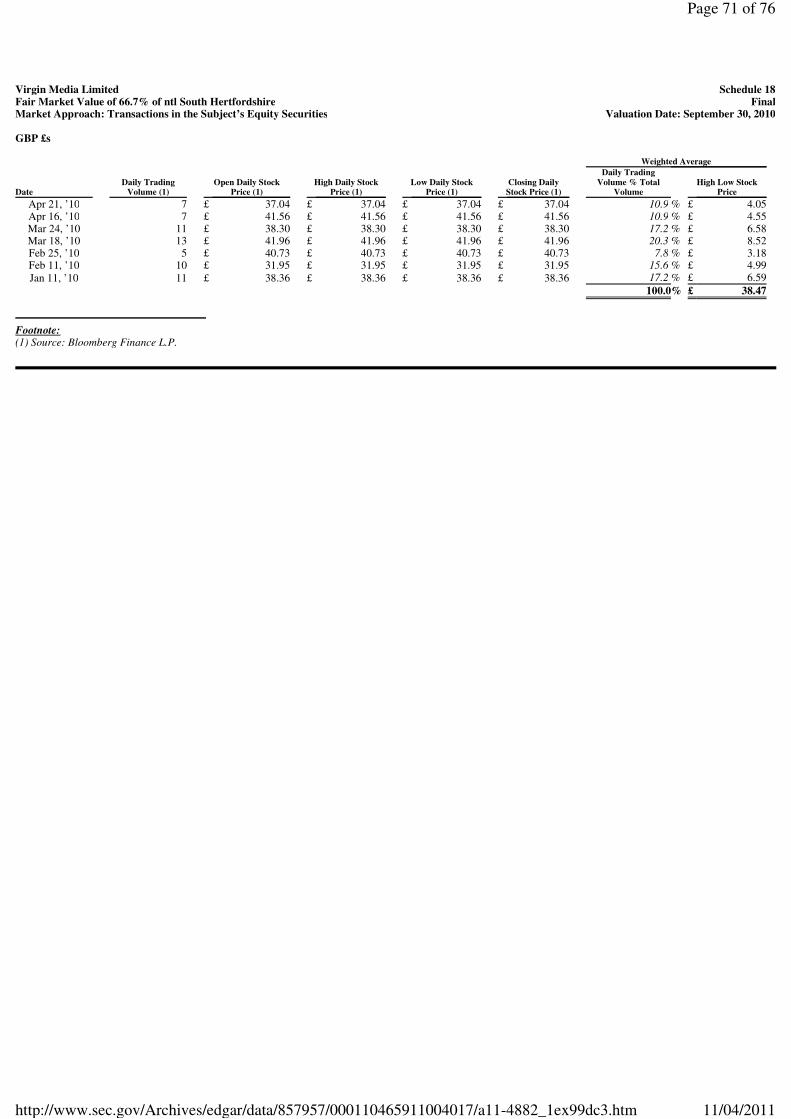
GBP £s
Footnote: (1) Source: Bloomberg Finance L.P.
Virgin Media Limited Schedule 18
Fair Market Value of 66.7% of ntl South Hertfordshire Final
Market Approach: Transactions in the Subject’s Equity Securities Valuation Date: September 30, 2010
Weighted Average
Daily Trading
Daily Trading Open Daily Stock
High Daily Stock Low Daily Stock
Closing Daily Volume % Total
High Low Stock
Date Volume (1)
Price (1) Price (1)
Price (1) Stock Price (1)
Volume Price
Apr 21, ’10
7 £ 37.04
£ 37.04 £ 37.04
£ 37.04 10.9 % £ 4.05
Apr 16, ’10
7 £ 41.56
£ 41.56 £ 41.56
£ 41.56 10.9 % £ 4.55
Mar 24, ’10
11 £ 38.30
£ 38.30 £ 38.30
£ 38.30 17.2 % £ 6.58
Mar 18, ’10
13 £ 41.96
£ 41.96 £ 41.96
£ 41.96 20.3 % £ 8.52
Feb 25, ’10
5 £ 40.73
£ 40.73 £ 40.73
£ 40.73 7.8 % £ 3.18
Feb 11, ’10
10 £ 31.95
£ 31.95 £ 31.95
£ 31.95 15.6 % £ 4.99
Jan 11, ’10
11 £ 38.36
£ 38.36 £ 38.36
£ 38.36 17.2 % £ 6.59
100.0% £ 38.47
Page 71 of 76
11/04/2011http://www.sec.gov/Archives/edgar/data/857957/000110465911004017/a11-4882_1ex99dc3.htm
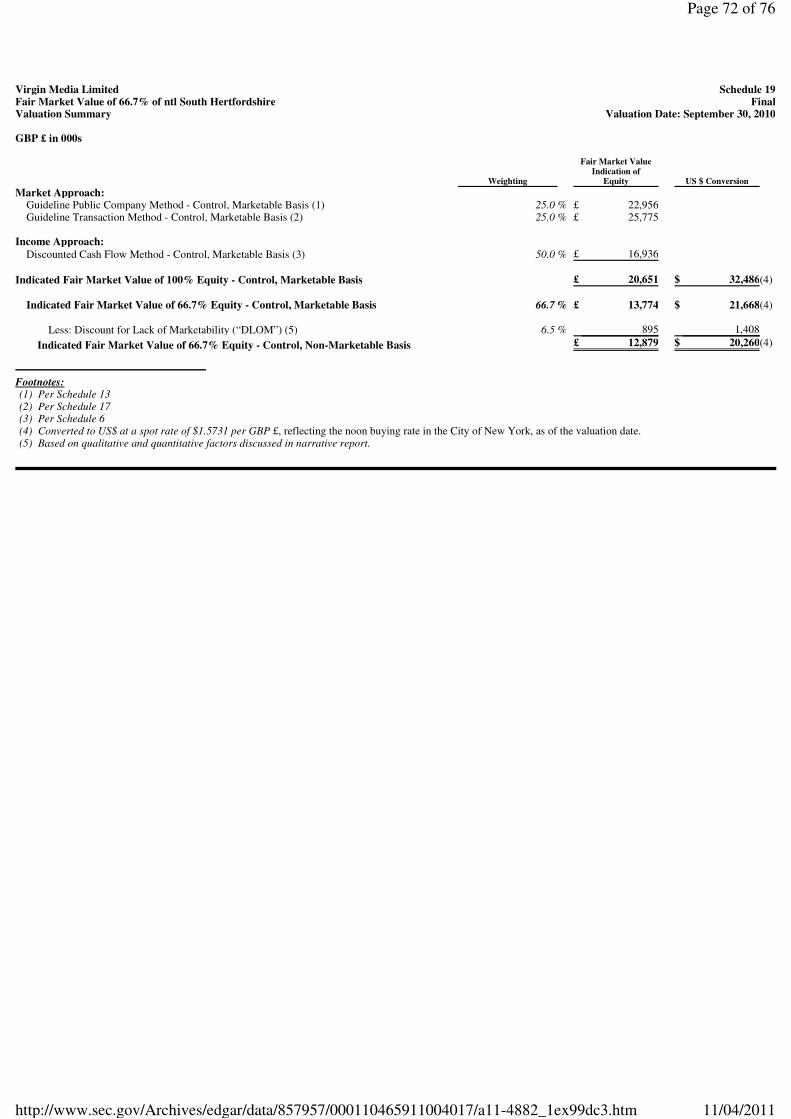
GBP £ in 000s
Footnotes: (1) Per Schedule 13 (2) Per Schedule 17 (3) Per Schedule 6 (4) Converted to US$ at a spot rate of $1.5731 per GBP £, reflecting the noon buying rate in the City of New York, as of the valuation date. (5) Based on qualitative and quantitative factors discussed in narrative report.
Virgin Media Limited Schedule 19
Fair Market Value of 66.7% of ntl South Hertfordshire Final
Valuation Summary Valuation Date: September 30, 2010
Fair Market Value
Indication of
Weighting Equity
US $ Conversion
Market Approach:
Guideline Public Company Method - Control, Marketable Basis (1) 25.0 % £ 22,956
Guideline Transaction Method - Control, Marketable Basis (2)
25.0 % £ 25,775
Income Approach:
Discounted Cash Flow Method - Control, Marketable Basis (3)
50.0 % £ 16,936
Indicated Fair Market Value of 100% Equity - Control, Marketable Basis
£ 20,651 $ 32,486(4)
Indicated Fair Market Value of 66.7% Equity - Control, Marketable Basis
66.7 % £ 13,774 $ 21,668(4)
Less: Discount for Lack of Marketability (“DLOM”) (5)
6.5 % 895 1,408
Indicated Fair Market Value of 66.7% Equity - Control, Non-Marketable Basis
£ 12,879 $ 20,260(4)
Page 72 of 76
11/04/2011http://www.sec.gov/Archives/edgar/data/857957/000110465911004017/a11-4882_1ex99dc3.htm
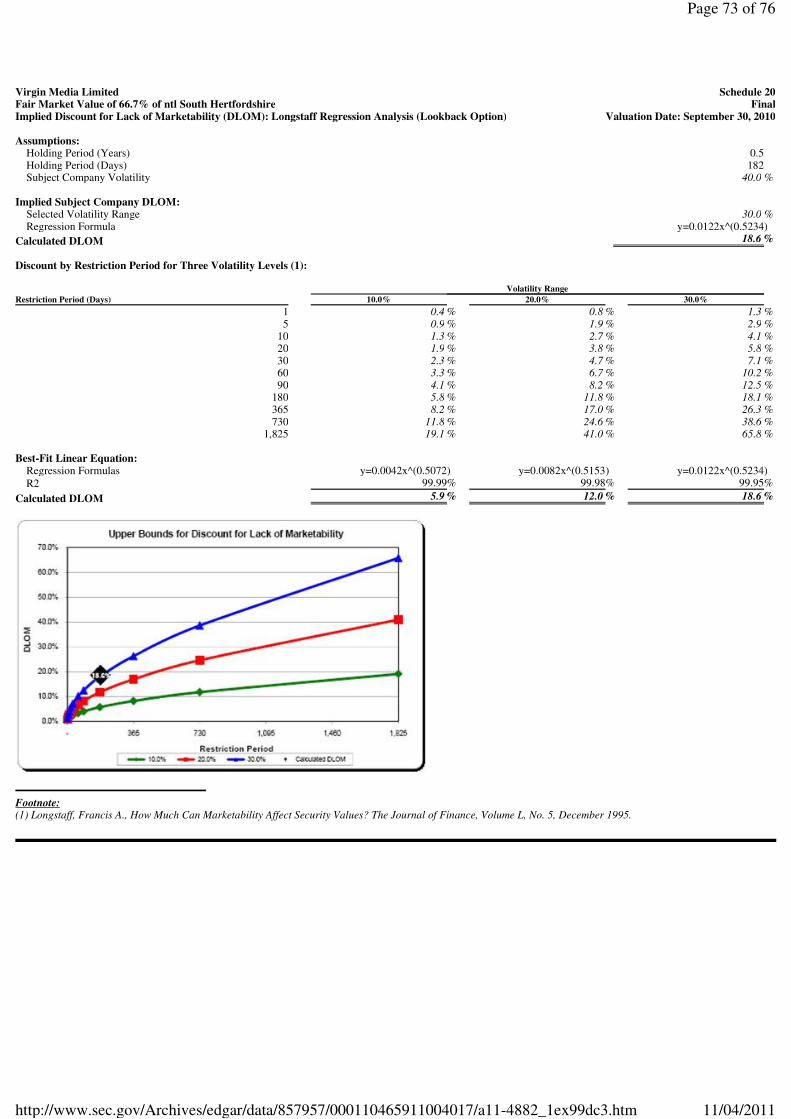
Discount by Restriction Period for Three Volatility Levels (1):
Footnote: (1) Longstaff, Francis A., How Much Can Marketability Affect Security Values? The Journal of Finance, Volume L, No. 5, December 1995.
Virgin Media Limited Schedule 20
Fair Market Value of 66.7% of ntl South Hertfordshire Final
Implied Discount for Lack of Marketability (DLOM): Longstaff Regression Analysis (Lookback Option) Valuation Date: September 30, 2010
Assumptions:
Holding Period (Years) 0.5
Holding Period (Days)
182
Subject Company Volatility 40.0 %
Implied Subject Company DLOM:
Selected Volatility Range
30.0 % Regression Formula
y=0.0122x^(0.5234) Calculated DLOM
18.6 %
Volatility Range
Restriction Period (Days) 10.0%
20.0% 30.0%
1
0.4 % 0.8 % 1.3 % 5
0.9 % 1.9 % 2.9 % 10
1.3 % 2.7 % 4.1 % 20
1.9 % 3.8 % 5.8 % 30
2.3 % 4.7 % 7.1 % 60
3.3 % 6.7 % 10.2 % 90
4.1 % 8.2 % 12.5 % 180
5.8 % 11.8 % 18.1 % 365
8.2 % 17.0 % 26.3 % 730
11.8 % 24.6 % 38.6 % 1,825
19.1 % 41.0 % 65.8 %
Best-Fit Linear Equation:
Regression Formulas y=0.0042x^(0.5072) y=0.0082x^(0.5153) y=0.0122x^(0.5234)
R2 99.99% 99.98% 99.95%
Calculated DLOM 5.9 % 12.0 % 18.6 %
Page 73 of 76
11/04/2011http://www.sec.gov/Archives/edgar/data/857957/000110465911004017/a11-4882_1ex99dc3.htm

Footnotes: (1) Risk-free rate derived from U.S. government securities with the same term as the option, as of the grant date. (2) Dividends are assumed to be accrued and paid continuously.
Virgin Media Limited Schedule 21
Fair Market Value of 66.7% of ntl South Hertfordshire Final
Implied Discount for Lack of Marketability (DLOM): European Protective Put Model Valuation Date: September 30, 2010
Grant Stock
Exercise Date Of
Term Estimate of
Risk-Free Dividend
Value of
Date Price
Price Liquidity Event
(In Years) Volatility
Rate (1) Yield (2)
Put Option
Sep 30, ’10 £
20,651 £
20,651 Mar 31, ’11
0.5 40.0 % 0.2 % 0.0 % £
2,308
Implied DLOM 11.2 %
Page 74 of 76
11/04/2011http://www.sec.gov/Archives/edgar/data/857957/000110465911004017/a11-4882_1ex99dc3.htm

Footnotes: (1) Risk-free rate derived from U.S. government securities with the same term as the option, as of the grant date. (2) Dividends are assumed to be accrued and paid continuously. (3) Kolb, Robert W., Futures, Options and Swaps (4th Ed.); and Paul Wilmott, Wilmott On Qualitative Finance, Volume 1.
Virgin Media Limited Schedule 22
Fair Market Value of 66.7% of ntl South Hertfordshire Final
Implied Discount for Lack of Marketability (DLOM): Asian Protective Put Model (“GARPM”) Valuation Date: September 30, 2010
Grant Stock
Exercise Date Of
Term Estimate of
Risk-Free Dividend
Value of
Date Price
Price Liquidity Event
(In Years) Volatility
Rate (1) Yield (2)
Put Option (3)
Sep 30, ’10 £
20,651 £
20,651 Mar 31, ’11
0.5 40.0 % 0.2 % 0.0 % £
1,400
Implied DLOM 6.8 %
Page 75 of 76
11/04/2011http://www.sec.gov/Archives/edgar/data/857957/000110465911004017/a11-4882_1ex99dc3.htm

Footnotes: (1) Risk-free rate derived from U.S. government securities with the same term as the option, as of the grant date. (2) Dividends are assumed to be accrued and paid continuously. (3) Finnerty, John D., “The Impact of Transfer Restrictions on Stock Prices,” Financial Management Association International, 2008 FMA European Conference (revised
November 2007 and corrected October 2009)
Virgin Media Limited Schedule 23
Fair Market Value of 66.7% of ntl South Hertfordshire Final
Implied Discount for Lack of Marketability (DLOM): Asian Protective Put Model (“AASPM”) Valuation Date: September 30, 2010
Grant Stock
Date Of Term
Estimate of Risk-Free
Dividend Value of
Date
Price Liquidity Event
(In Years) Volatility
Rate (2) Yield (3)
Put Option (3)
Sep 30, ’10 £
20,651 Mar 31, ’11
0.5 40.0 % 0.2 % 0.0 % £
1,344
Implied DLOM
6.5 %
Page 76 of 76
11/04/2011http://www.sec.gov/Archives/edgar/data/857957/000110465911004017/a11-4882_1ex99dc3.htm


![On the DVD - Linux Magazine · On the DVD [1] Ubuntu: http:// www. ubuntu. com/ [2] Kubuntu: http:// www. kubuntu. org/ [3] KDE: http:// www. kde. org](https://static.fdocuments.in/doc/165x107/5f8a643396fdc071807ea7db/on-the-dvd-linux-on-the-dvd-1-ubuntu-http-www-ubuntu-com-2-kubuntu.jpg)