HTSO
23
Legal Framework, Investment Opportunities and Technical Innovation in the Electricity Sector Security of Supply through competitive markets: Design of the regulatory and economic environment for infrastructure development Dr. Evangelos Lekatsas Chairman of the Board of Directors, HTSO Athens, October 23 rd 2009 HTSO 1
-
Upload
kylan-alexander -
Category
Documents
-
view
17 -
download
0
description
HTSO. - PowerPoint PPT Presentation
Transcript of HTSO
Legal Framework, Investment Opportunities and Technical Innovation in the Electricity Sector
Security of Supply through competitive markets:
Design of the regulatory and economic environment for infrastructure development
Dr. Evangelos Lekatsas
Chairman of the Board of Directors, HTSO Athens, October 23rd 2009
HTSO
1
2
Reliability of Supply
"the degree to whichthe performance of the elements of the technical
system results in power being delivered to consumers within
accepted standards and in the amount desired”
Security Adequacy
3
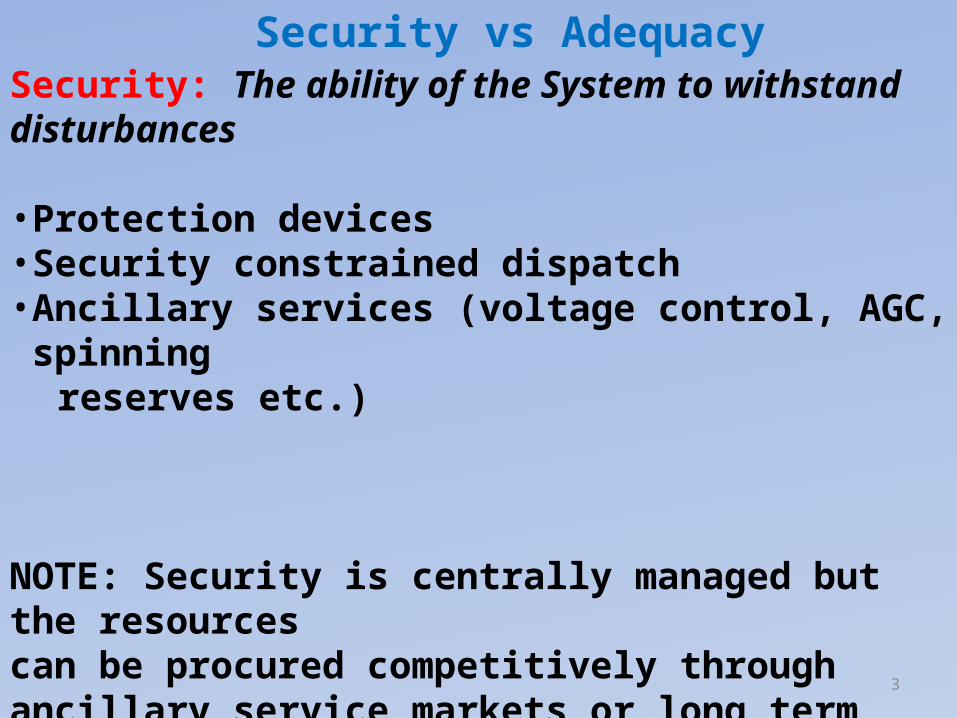
Security vs AdequacySecurity: The ability of the System to withstand disturbances
• Protection devices• Security constrained dispatch• Ancillary services (voltage control, AGC, spinning
reserves etc.)
NOTE: Security is centrally managed but the resourcescan be procured competitively through ancillary service markets or long term contracts (Public good)
4
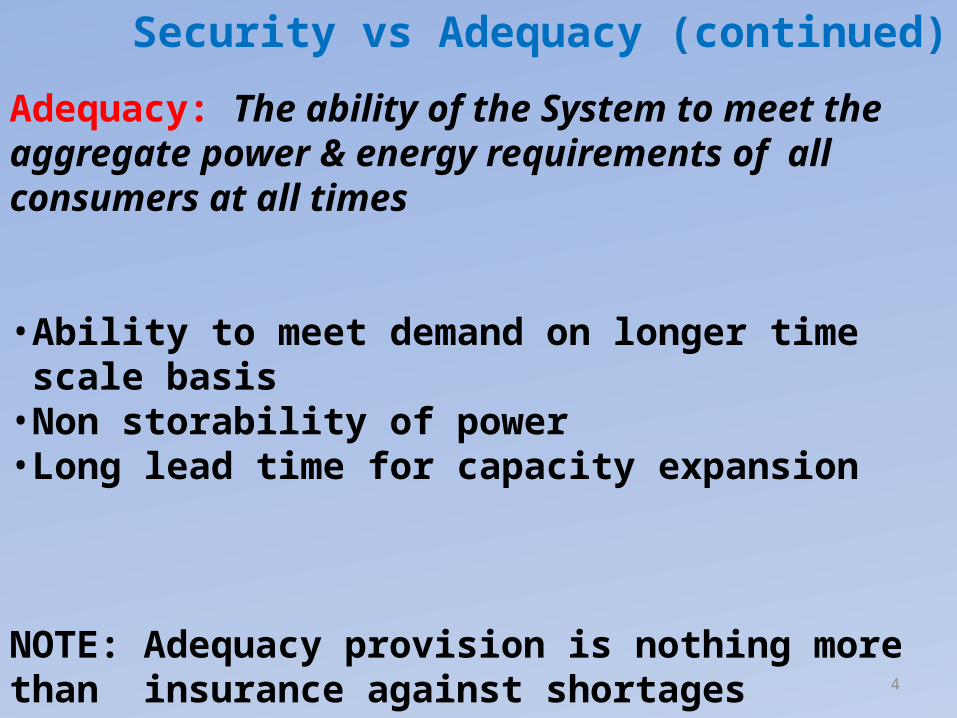
Security vs Adequacy (continued)
Adequacy: The ability of the System to meet the aggregate power & energy requirements of all consumers at all times
• Ability to meet demand on longer time scale basis• Non storability of power• Long lead time for capacity expansion
NOTE: Adequacy provision is nothing more than insurance against shortages
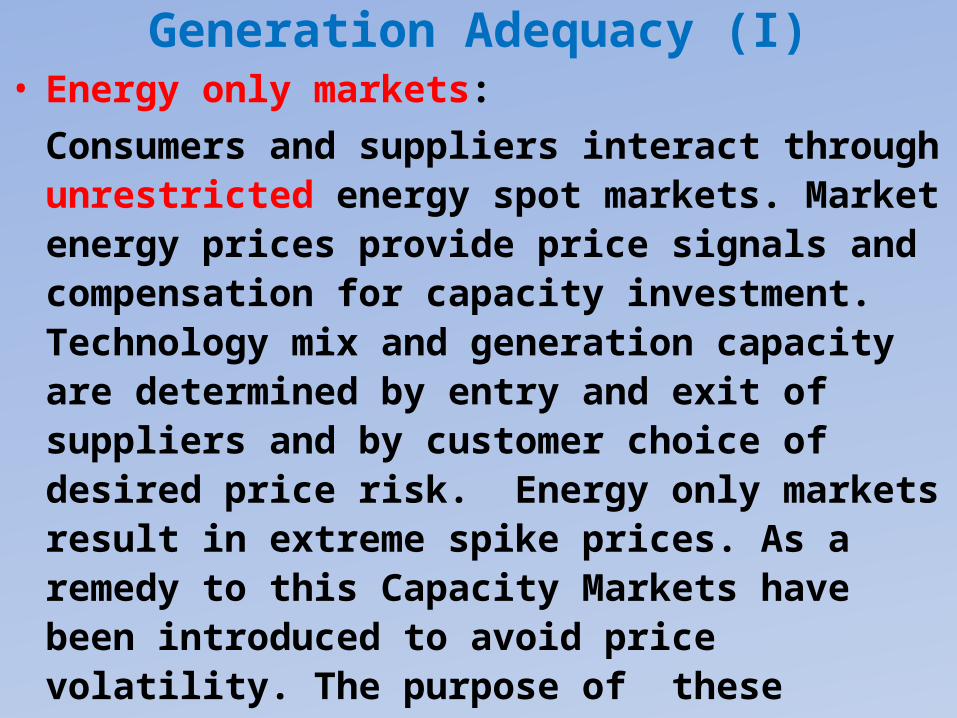
Generation Adequacy (I)• Energy only markets:
Consumers and suppliers interact through unrestricted energy spot markets. Market energy prices provide price signals and compensation for capacity investment. Technology mix and generation capacity are determined by entry and exit of suppliers and by customer choice of desired price risk. Energy only markets result in extreme spike prices. As a remedy to this Capacity Markets have been introduced to avoid price volatility. The purpose of these markets is to ensure that there is sufficient capacity in the System to cover peak demand and at the same time avoid price volatility.
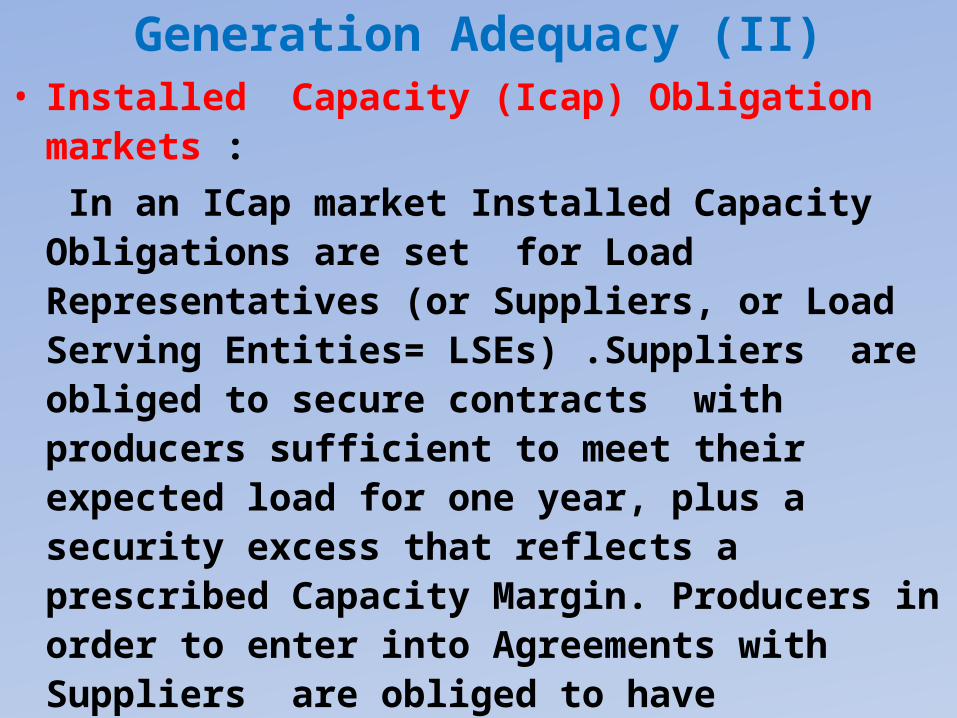
Generation Adequacy (II)• Installed Capacity (Icap) Obligation markets :
In an ICap market Installed Capacity Obligations are set for Load Representatives (or Suppliers, or Load Serving Entities= LSEs) .Suppliers are obliged to secure contracts with producers sufficient to meet their expected load for one year, plus a security excess that reflects a prescribed Capacity Margin. Producers in order to enter into Agreements with Suppliers are obliged to have sufficient capacity by issuing, for each MW, annual Capacity Availability Certificates (CACs) when commissioning new generating capacity. This method does not provide any signal to the Consumers.
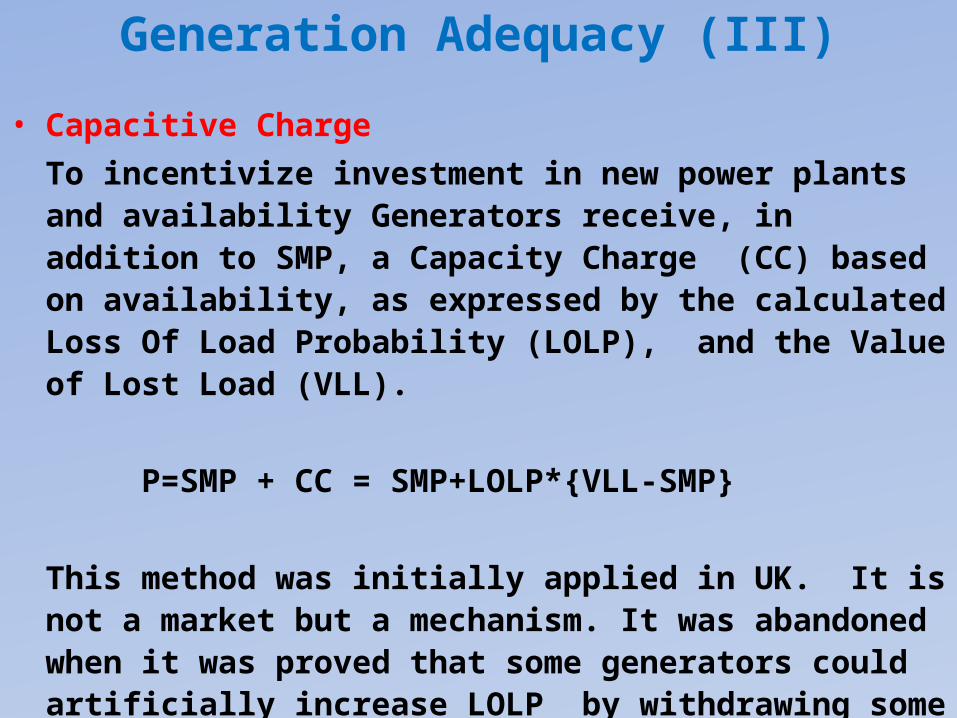
Generation Adequacy (III)
• Capacitive Charge
To incentivize investment in new power plants and availability Generators receive, in addition to SMP, a Capacity Charge (CC) based on availability, as expressed by the calculated Loss Of Load Probability (LOLP), and the Value of Lost Load (VLL).
P=SMP + CC = SMP+LOLP*{VLL-SMP}
This method was initially applied in UK. It is not a market but a mechanism. It was abandoned when it was proved that some generators could artificially increase LOLP by withdrawing some of their units.
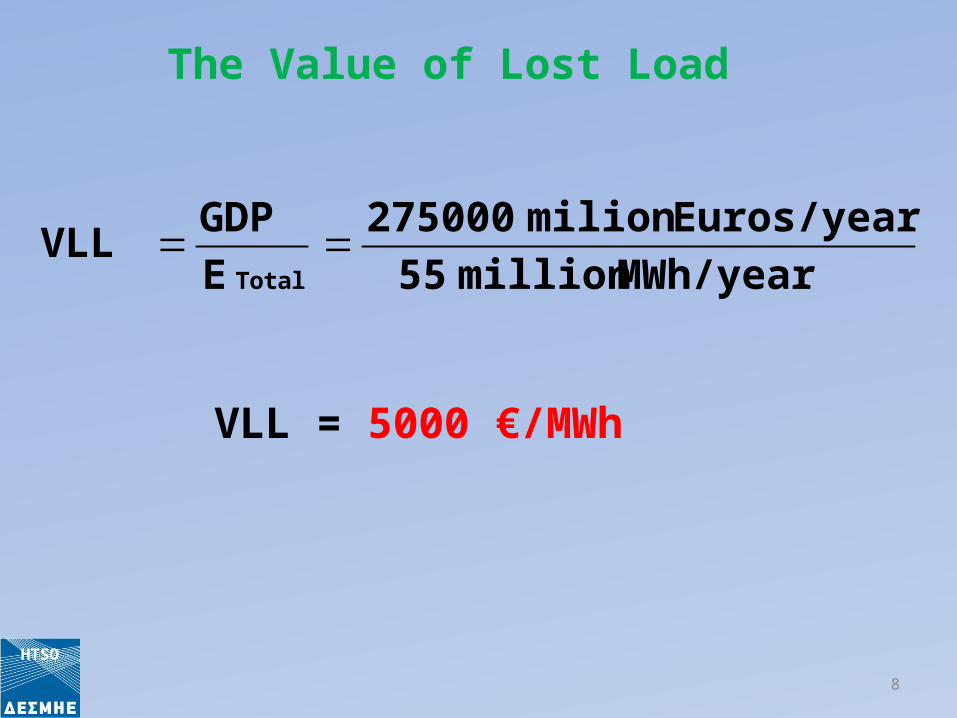
MWh/year million 55
Euros/year milion 275000
Ε
GDPVLL
Total
The Value of Lost Load
VLL = 5000 €/MWh
8
HTSO

9
Load Variations: Summer 2007- January 2009
10,0k
10
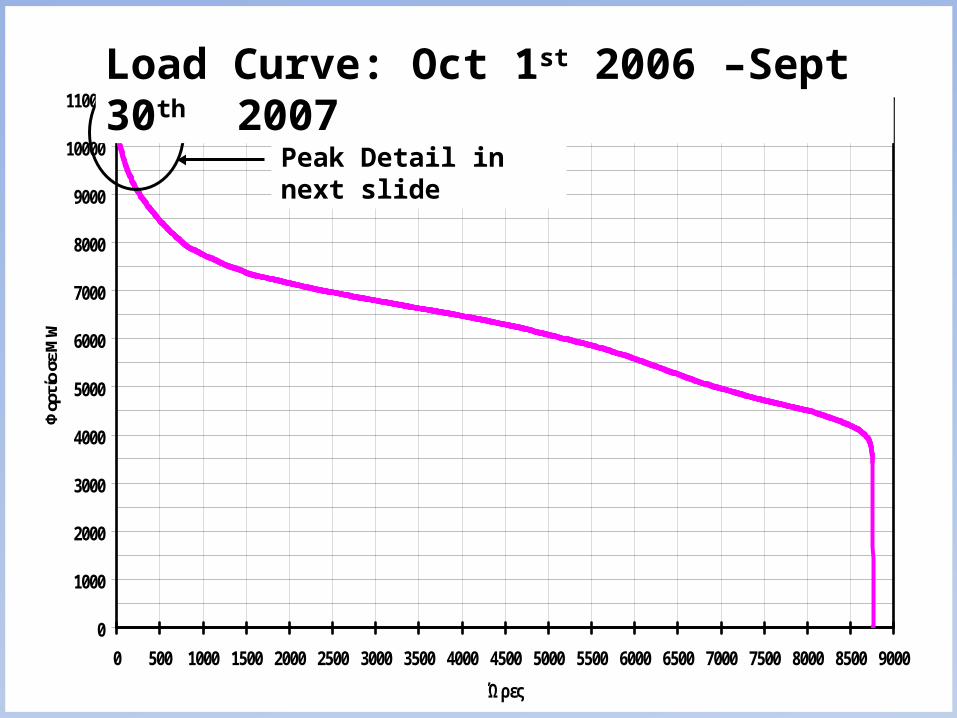
Σχ. 1α: Ετήσια Καμπύλη Διαρκείας Φορτίου (περιόδου 1.10.2006 -30.9.2007)
0
1000
2000
3000
4000
5000
6000
7000
8000
9000
10000
11000
0 500 1000 1500 2000 2500 3000 3500 4000 4500 5000 5500 6000 6500 7000 7500 8000 8500 9000
Ώρες
Φορ
τίο
σε M
W
Λεπτομέρεια Αιχμής στα Σχ. 1β και 1γ
Load Curve: Oct 1st 2006 –Sept 30th 2007
Peak Detail in next slide

LOAD DURATION CURVE (period 1.10.2006 -30.9.2007)
Peak Details above 10000MW
9800
9900
10000
10100
10200
10300
10400
10500
10600
10700
10800
10900
11000
0 10 20 30 40 50
Hours
LO
AD
in
M
W
7300MWh/year To supply the 1000MW of the peak an investment of 1000MW*400000 €/MW
=400 million € which amounts to 56 million €/yearor to 56000000/7300 =7671 €/MWhAdding the fuel cost of an open cycleGas Turbine 112 €/MWh we obtain a total cost of the peak MWh equal to
b=7783 €/MWh
11
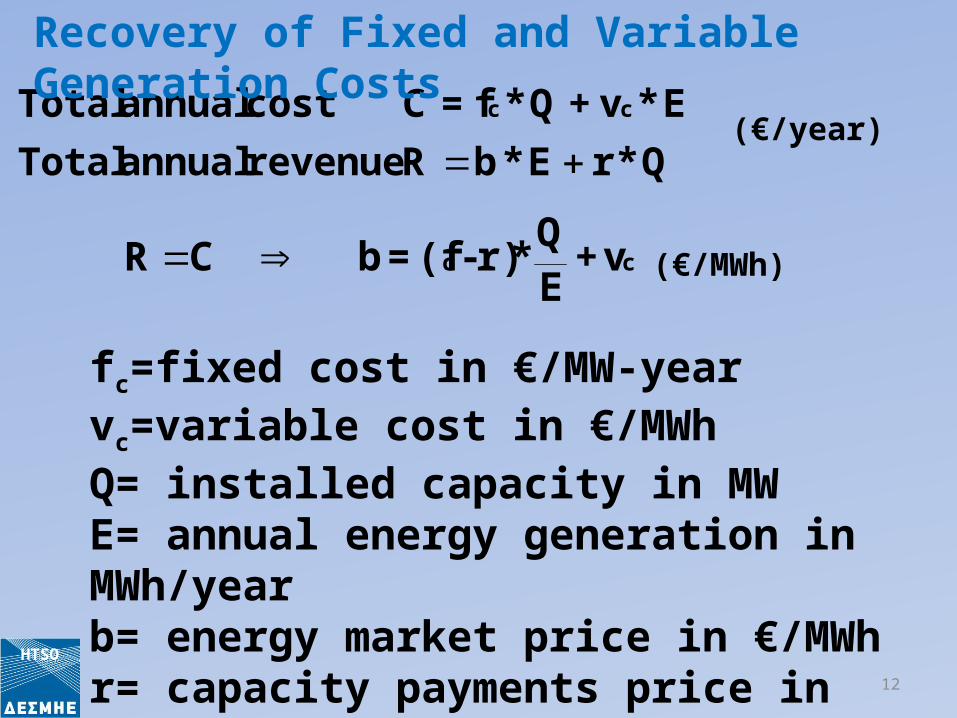
Q*r E*bR revenue annual Total
E*v+Q*f=C cost annual Total cc
cc v+EQ
*r)-(f=b CR
(€/year)
(€/MWh)
fc=fixed cost in €/MW-yearvc=variable cost in €/MWhQ= installed capacity in MWE= annual energy generation in MWh/yearb= energy market price in €/MWh r= capacity payments price in €/MW-year
Recovery of Fixed and Variable Generation Costs
12
HTSO
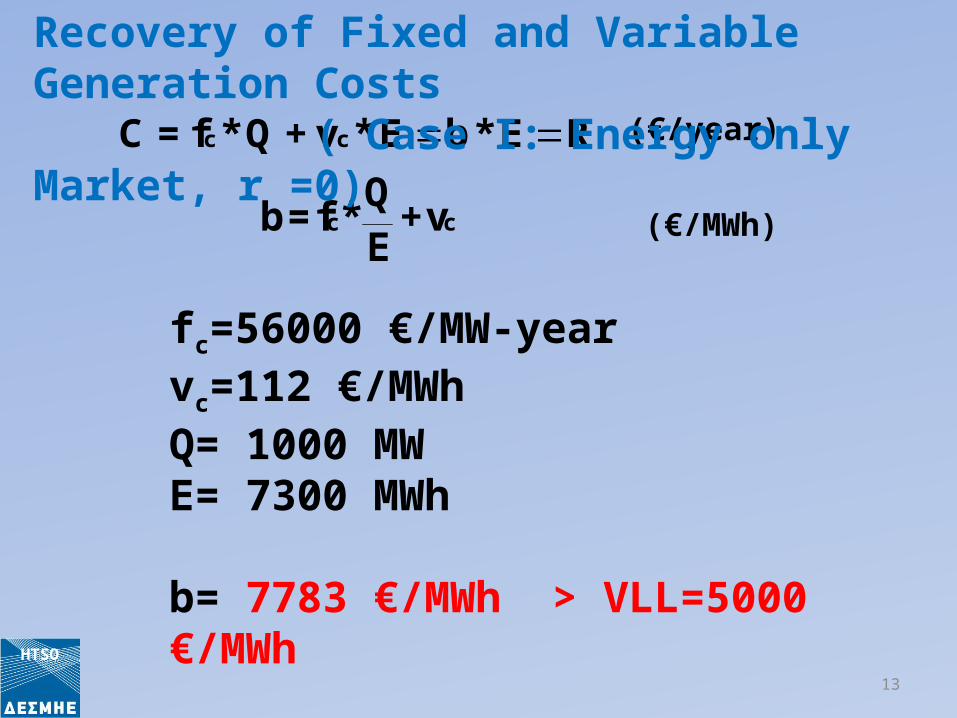
R E*b E*v+Q*f=C cc
cc v+EQ
*f=b
(€/year)
(€/MWh)
fc=56000 €/MW-yearvc=112 €/MWhQ= 1000 MWE= 7300 MWh
b= 7783 €/MWh > VLL=5000 €/MWh
Decision= Curtail Peak 1000MW !!!!!
Recovery of Fixed and Variable Generation Costs ( Case I: Energy only Market, r =0)
13
HTSO
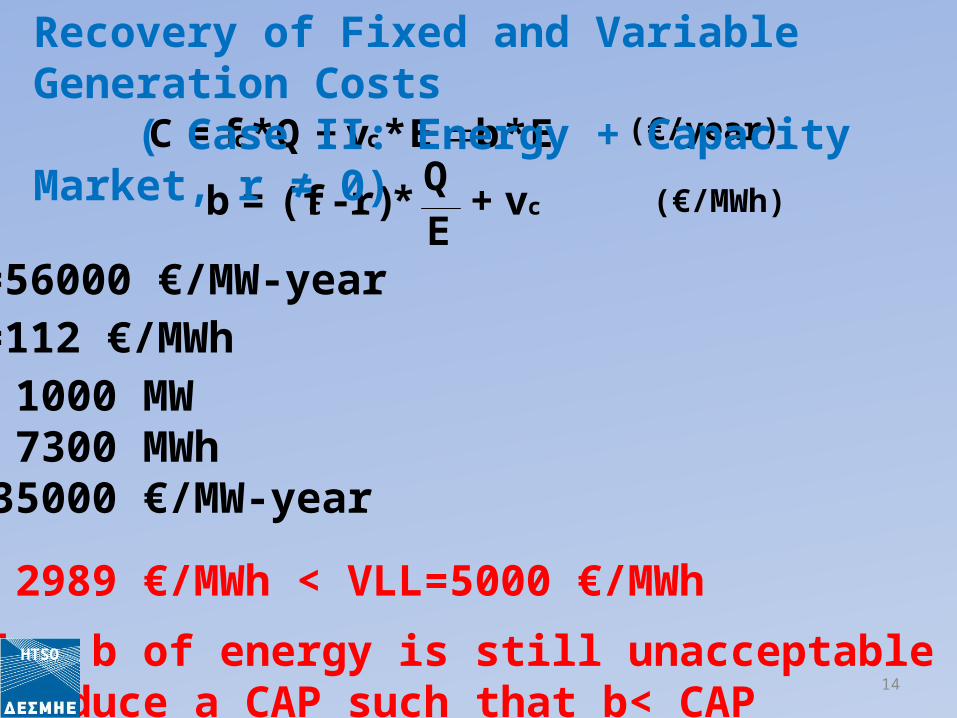
E*b E*v+Q*f=C cc
cc v+EQ
*r)-(f=b
(€/year)
(€/MWh)
fc=56000 €/MW-yearvc=112 €/MWhQ= 1000 MWE= 7300 MWhr=35000 €/MW-year
b= 2989 €/MWh < VLL=5000 €/MWh
Value b of energy is still unacceptable (high)Introduce a CAP such that b< CAP
Recovery of Fixed and Variable Generation Costs ( Case II: Energy + Capacity Market, r ≠ 0)
14
HTSO
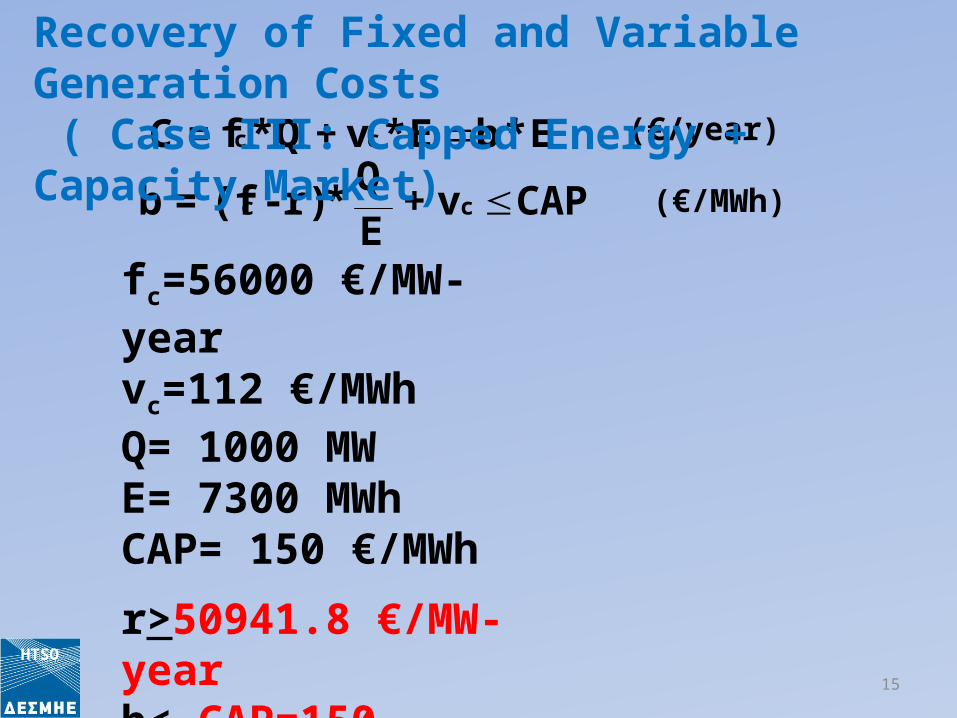
E*b E*v+Q*f=C cc
CAPv+EQ
*r)-(f=b cc
(€/year)
(€/MWh)
fc=56000 €/MW-yearvc=112 €/MWhQ= 1000 MWE= 7300 MWhCAP= 150 €/MWh
r>50941.8 €/MW-yearb< CAP=150 €/MWh
Recovery of Fixed and Variable Generation Costs ( Case III: Capped Energy + Capacity Market)
15
HTSO
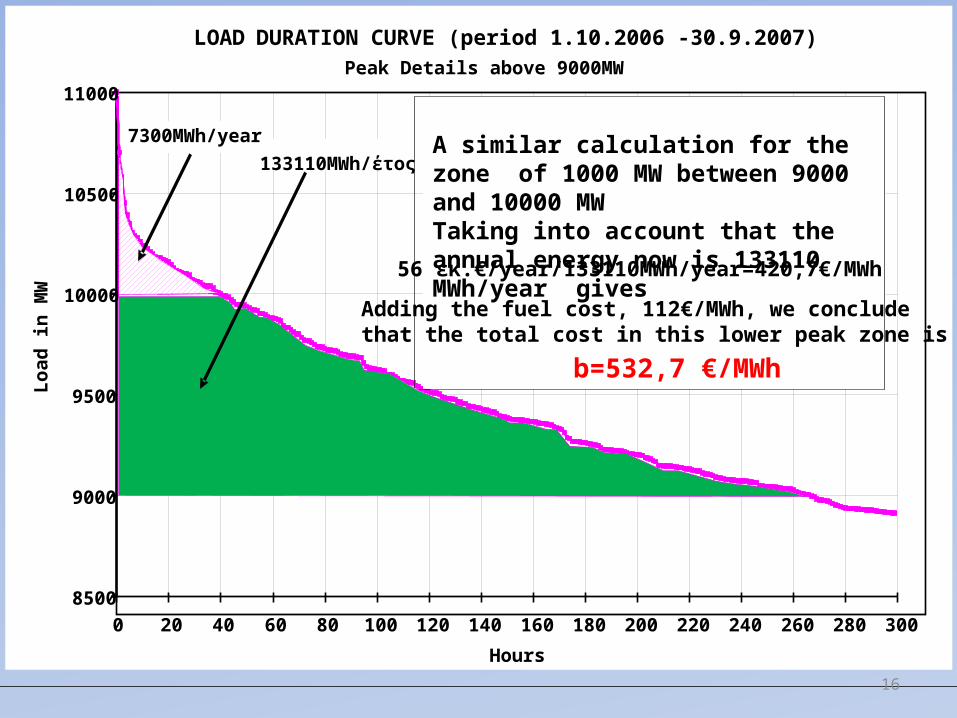
LOAD DURATION CURVE (period 1.10.2006 -30.9.2007)Peak Details above 9000MW
8500
9000
9500
10000
10500
11000
0 20 40 60 80 100 120 140 160 180 200 220 240 260 280 300
Hours
Lo
ad i
n M
W
133110MWh/έτοςA similar calculation for the zone of 1000 MW between 9000 and 10000 MWTaking into account that the annual energy now is 133110 MWh/year gives
56 εκ.€/year/133110MWh/year=420,7€/MWh
Adding the fuel cost, 112€/MWh, we concludethat the total cost in this lower peak zone is
b=532,7 €/MWh
7300MWh/year
16
17
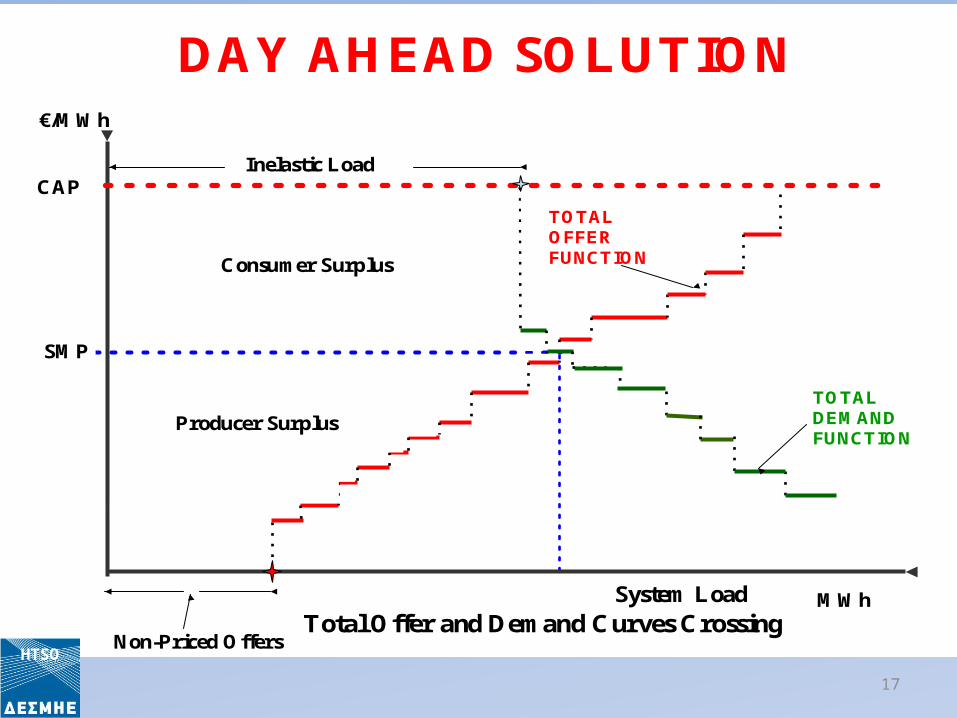
DAY AHEAD SOLUTION
MWh
€/MWh
CAP
System Load
TOTAL OFFER FUNCTION
TOTAL DEMAND FUNCTION
SMP
Non-Priced Offers
Inelastic Load
Consumer Surplus
Producer Surplus
Total Offer and Demand Curves CrossingHTSO
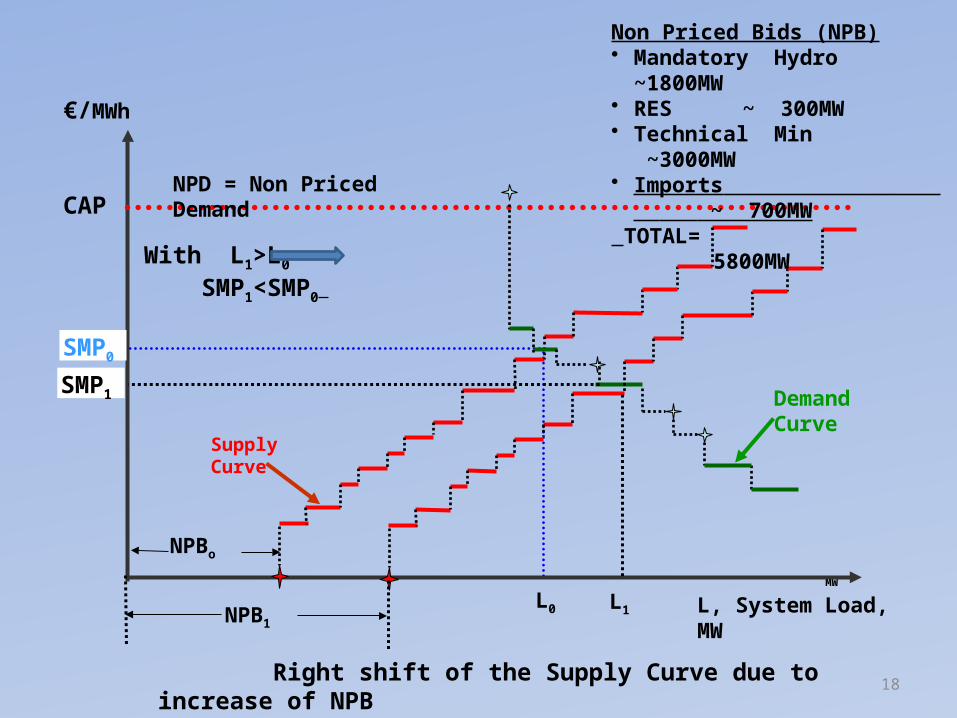
18 Right shift of the Supply Curve due to increase of NPB
€/MWh
CAP
L, System Load, MWMW
Supply Curve
Demand Curve
SMP0
NPD = Non Priced Demand
SMP1
NPBο
NPB1L0 L1
With L1>L0 SMP1<SMP0
Non Priced Bids (NPB)• Mandatory Hydro ~1800MW• RES ~ 300MW• Technical Min ~3000MW• Imports ~ 700MW TOTAL= 5800MW
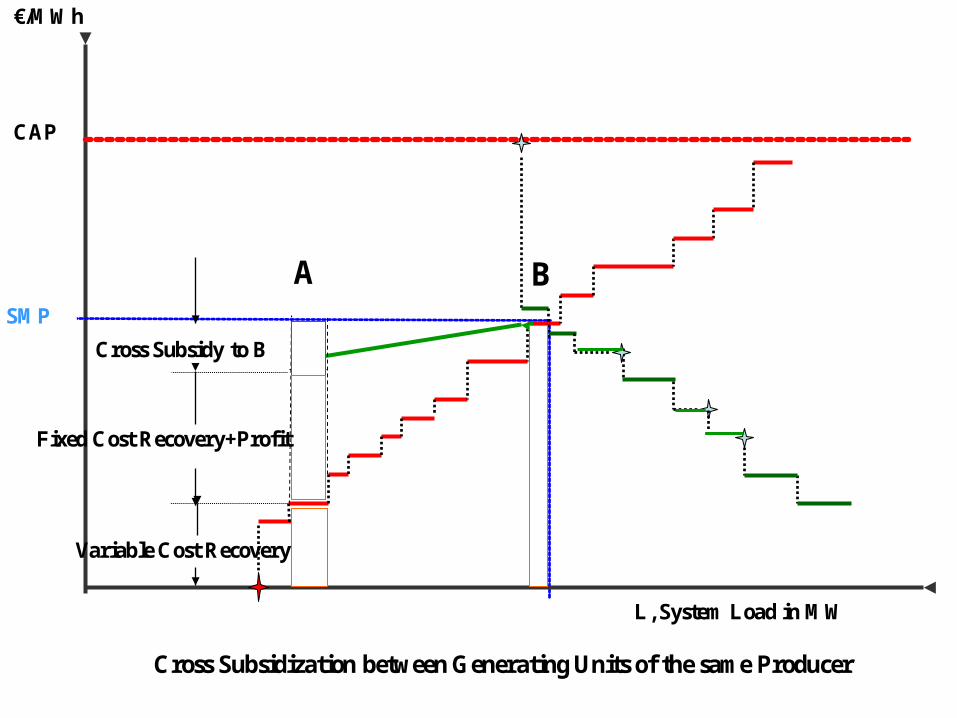
19Cross Subsidization between Generating Units of the same Producer
€/MWh
CAP
L, System Load in MW
SMP
Variable Cost Recovery
Fixed Cost Recovery+Profit
Α Β
Cross Subsidy to Β
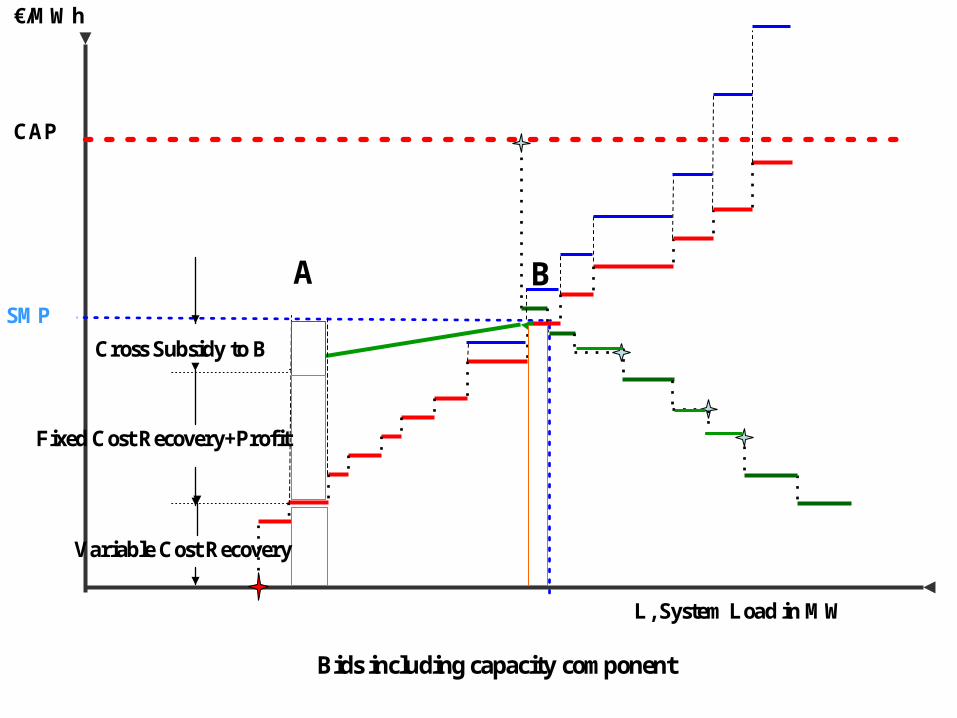
20Bids including capacity component
€/MWh
CAP
L, System Load in MW
SMP
Variable Cost Recovery
Fixed Cost Recovery+Profit
Α Β
Cross Subsidy to Β

214
b1,Q1
LmLkLΔ
WHOLESALEMARKET
min Σ(bj.Qj)
ΣQj-ΣLj=0
b2,Q2 bn,Qnbn+1,Qn+1 bm,Qm…
Imports
Exports
RETAILMARKET
Suppliers
Gen/tors
End Users
SMP*{ΣQj-ΣLj}=0
Tariffs
22
EPILOGUE
The market expresses the will of human beings to meet at the point of equilibrium of supply with demand by maximizing the, so called, Social Surplus. But the will of human beings, especially when expressed in terms of conflicting economic interests, may lead the power system to risky levels of operation. Indeed, following the liberalisation over the past 2 decades, some power systems have been pushed towards their stability limits in order to maximize profit in energy trading, thus endangering the operation of the power system. It is very important to understand that power systems must operate within safe physical limits and with adequate reserves in order to maintain high standards of supply. This creates a cost we must not forget!

Acknowledgments
I would like to thank my colleagues in HTSO for their valuable discussions in preparing this
presentation
THANK YOU FOR YOUR ATTENTION
23
HTSO