HTLV-1 bZIP Factor Suppresses Apoptosis by Attenuating the ...
54
Title HTLV-1 bZIP Factor Suppresses Apoptosis by Attenuating the Function of FoxO3a and Altering its Localization( Dissertation_全文 ) Author(s) Tanaka, Azusa Citation 京都大学 Issue Date 2014-01-23 URL https://doi.org/10.14989/doctor.k17979 Right Type Thesis or Dissertation Textversion ETD Kyoto University
Transcript of HTLV-1 bZIP Factor Suppresses Apoptosis by Attenuating the ...
TitleHTLV-1 bZIP Factor Suppresses Apoptosis by Attenuating theFunction of FoxO3a and Altering its Localization(Dissertation_全文 )
Author(s) Tanaka, Azusa
Citation 京都大学
Issue Date 2014-01-23
URL https://doi.org/10.14989/doctor.k17979
Right
Type Thesis or Dissertation
Textversion ETD
Kyoto University
1
HTLV-1 bZIP Factor Suppresses Apoptosis by Attenuating the Function of FoxO3a
and Altering its Localization
Azusa Tanaka-Nakanishi1, Jun-ichirou Yasunaga1 Ken Takai1, and Masao Matsuoka1*
1 Laboratory of Virus Control, Institute for Virus Research, Kyoto University, 53 Shogoin
Kawahara-cho, Sakyo-ku, Kyoto 606-8507, Japan
Running title: HBZ Mediated Inhibition of Apoptosis
Keywords: HTLV-1, HBZ, Apoptosis, FoxO3a, Bim
*Corresponding author. Mailing address for M. Matsuoka: Institute for Virus Research,
Kyoto University, 53 Shogoin Kawahara-cho, Sakyo-ku, Kyoto 606-8507, Japan. Phone:
+81-75-751-4048, FAX: +81-75-751-4049.
E-mail: [email protected]
Word count for text: 5726
Total number of figures and tables: 5 figures and 1 table
Disclosure of Potential Conflicts of Interest
The authors have declared that no competing interests exist.
2
Abstract
As the infectious agent causing human adult T cell leukemia (ATL), the HTLV-1 virus
spreads in vivo primarily by cell-to-cell transmission. However, the factors that
determine its transmission efficiency are not fully understood. The viral genome encodes
the HTLV-1 bZIP factor (HBZ) which is expressed in all ATL cases and is known to
promote T cell proliferation. In this study, we investigated the hypothesis that HBZ also
influences the survival of T cells. Through analyzing the transcriptional profile of
HBZ-expressing cells, we learned that HBZ suppressed transcription of the proapoptotic
gene Bim (Bcl2l11) and that HBZ-expressing cells were resistant to activation-induced
apoptosis. Mechanistic investigations into how HBZ suppresses Bim expression revealed
that HBZ perturbs the localization and function of FoxO3a, a critical transcriptional
activator of the genes encoding Bim and also Fas ligand (FasL). By interacting with
FoxO3a, HBZ not only attenuated DNA binding by FoxO3a but also sequestered the
inactive form of FoxO3a in the nucleus. In a similar manner, HBZ also inhibited FasL
transcription induced by T cell activation. Further study of ATL cells identified other Bim
perturbations by HBZ, including at the level of epigenetic alteration, histone modification
in the promoter region of the Bim gene. Collectively, our results indicated that HBZ
impairs transcription of the Bim and FasL genes by disrupting FoxO3a function,
broadening understanding of how HBZ acts to promote proliferation of HTLV-1-infected
T cells by blocking their apoptosis.
3
Introduction
HTLV-1 is estimated to infect 10-20 million people in the world (1). This virus causes
not only a neoplastic disease of CD4+ T cells, ATL, but also chronic inflammatory
diseases of the central nervous system, lung, or skin (2). HTLV-1 can be transmitted
efficiently in a cell-to-cell fashion (3, 4), while free virus shows poor infectivity (5, 6),
and virions are not detected in infected individuals. To increase the number of infected
cells and facilitate transmission, HTLV-1 increases its copy number primarily by
triggering the proliferation of infected cells -- replicating within the host genome instead
of undergoing viral replication (7, 8). Thus, HTLV-1 promotes proliferation and
suppresses apoptosis of infected cells via complex interactions of viral proteins with host
factors.
Among the viral genes encoded in HTLV-1, the tax gene has been extensively studied.
Tax can activate various signal pathways like NF-κB, AP-1, and SRF (9). However, Tax
expression is frequently undetectable in ATL cases. Importantly, the nonsense mutations
in the tax gene are often observed in not only ATL cases but also infected cells of
asymptomatic HTLV-1 carriers (10). These findings suggest that other mechanisms
suppress the apoptosis of HTLV-1 infected cells in the absence of Tax expression (2). We
have reported that the HBZ gene is expressed in all ATL cases (11). Furthermore, HBZ
promotes the proliferation of T-cells and induces development of T-cell lymphomas and
inflammatory diseases in transgenic mice (12). Therefore, we speculated that HBZ might
also influence apoptosis.

4
There are two major pathways for apoptosis: the extrinsic and intrinsic apoptotic
pathways, which are mediated by Fas and Bim respectively (13). ATL cells are known
to express high levels of Fas antigen, and are susceptible to Fas-mediated signaling (14).
However, Fas ligand expression is suppressed in ATL cells by silencing of the early
growth response 3 (EGR3) gene transcription, a phenomenon which enables ATL cells to
escape activation-induced cell death (15). In addition, Tax increases expression of
c-FLIP, which confers resistance to Fas-mediated apoptosis (16, 17). Furthermore,
activation of NF-κB by Tax also enables HTLV-1 infected cells to be resistant to
apoptosis (18). To date, the effects of HTLV-1 infection on Bim-mediated apoptosis
remain unknown.
In this study, we analyzed transcriptional changes induced by HBZ expression in T
cells, and found that transcription of a proapoptotic gene, Bim, was hindered by HBZ.
This suppression led to decreased activation-induced cell death. We found that HBZ
suppressed Bim transcription by targeting FoxO3a, a critical transcription factor for the
Bim and FasL gene. In some ATL cell lines and ATL cases, the Bim gene transcription
was also silenced by epigenetic mechanisms, but this phenomenon appeared to be
secondary to HBZ-mediated suppression of transcription. Thus, it is suggested that HBZ
suppresses both intrinsic and extrinsic apoptotic pathways and contributes to the
proliferation of ATL cells.

5
Materials and Methods
Cell lines and clinical samples
HTLV-1 immortalized cell lines (MT-4), ATL cell lines (ED, TL-Om1, and MT-1), T
cell lines not infected with HTLV-1 (Jurkat, SupT1, and CCRF-CEM) were cultured in
RPMI 1640 medium supplemented with 10% fetal bovine serum (FBS) and antibiotics at
37°C under a 5% CO2 atmosphere. Jurkat cells stably expressing spliced form of HBZ
(sHBZ), Jurkat-HBZ ,were maintained as described previously (19). To construct
CCRF-CEM cells stably expressing HBZ, CEM-HBZ, the coding sequence of HBZ was
subcloned into pME18Sneo vector and then the expression vector or its empty vector
were transfected into CCRF-CEM cells by using Neon (Invitrogen) according to the
manufacturer’s instructions. Stable transfectants were selected in G418 (1mg / ml).
293T cells were cultured in Dulbecco modified Eagle medium supplemented with 10%
FBS and antibiotics and when 293FT cells were cultured, 500 μg/mL G418 was added.
Fas blocking antibody was purchased from Alexis.
This study was conducted according to the principles expressed in the Declaration of
Helsinki. The study was approved by the Institutional Review Board of Kyoto
University (G204). All patients provided written informed consent for the collection of
samples and subsequent analysis.
Plasmid constructs
Wild-type form of FoxO3a was generated by PCR amplification using Jurkat cDNA
6
library and constitutively active form of FoxO3a (FoxO3aAAA) was also generated by
PCR amplification with mutated primers (20). These PCR fragments were then
subcloned into pCMV-Tag2B vector and pIRES-hrGFP-1a (Stratagene). The vectors
encoding the myc-His-tagged form of HBZ and its mutants used in this study have been
described previously (19, 21). We modified pLKO.1-EGFP vector for delivery of
anti-FoxO3 short hairpin RNAs to Jurkat, Jurkat-control and Jurkat-HBZ. shRNA
sequence used was 5’- GCACAACCTGTCCTGCATAG -3’. The 6xDBE-Luc construct
that contains six FOXO-binding sites known as DAF-16 binding elements (DBEs) was
kindly provided by Dr. Furuyama (Kagawa Prefectural University of Health Sciences)
and the backbone of this vector was pGL3-basic (Promega) (22).
Luciferase assay
Jurkat cells were transfected with 0.2 μg/well of luciferase reporter plasmid, 1
ng/well of Renilla luciferase control vector (phRL-TK), 0.2 μg/well of FoxO3aAAA
expression plasmid or its empty vector and 0.6 μg/well of HBZ expression plasmid or its
empty vector with caspase inhibitor Z-VAD-FMK (MBL). Plasmids were transfected
using Neon (Invitrogen) according to the manufacturer’s instructions. After 24 hours,
cells were collected and luciferase activities were measured using the Dual-Luciferase
Reporter Assay (Promega). Relative luciferase activity was calculated as the ratio of
firefly to Renilla luciferase activity. Three independent experiments, each with triplicate
transfections, were performed and typical results are shown.
7
Microarray analysis
Jurkat-control and Jurkat-HBZ were stimulated with phorbol myristate acetate (PMA)
(50 ng/ml) and ionomycin (1 μg/ml) for 9 hrs. After the stimulation, cells were collected
and total RNA was isolated using Trizol Reagent (Invitrogen) according to the
manufacturer’s instructions. We then digested DNA using deoxyribonuclease I
(Invitrogen) and cleaned up RNA using RNeasy Mini Kit (Qiagen) according to the
manufacturer’s instructions. We then synthesized cDNA and performed microarray
processing according to the GeneChip Expression Analysis Technical Manual
(Affymetrix). All data were analyzed by using GeneSpring GX (Agilent Technologies).
The microarray data related to this paper have been submitted to the Gene Expression
Omnibus under the accession number GSE48029.
Immunofluorescence analysis
293FT cells were transfected with expression vectors using Lipofectamine LTX
(Invitrogen) or TransIT (TAKARA). Twenty-four hours after transfection, cells were
re-seeded on the poly-L-lysine coated glass (Matsunami-glass) or poly-D-lysine (SIGMA)
coated glass. Twenty-four hours after the re-seeding, cells were fixed with 4%
paraformaldehyde for 15 min and permeabilized with 0.2% Triton X-100 for 15min, and
blocked by incubation in 5% BSA/PBS for 30 min. For immunostaining, the cells were
incubated with anti-Foxo3a, anti-p-Foxo3a (Cell Signaling technology), Cy3-conjugated
anti-c-Myc (SIGMA) or biotinylated anti-FLAG (SIGMA) antibodies for 1h or in case of
observation of endogenous expression, cells were incubated overnight at 4°C. Primary
8
antibodies were visualized by incubating the cells with AlexaFluor 488-conjugated goat
anti-rabbit IgG antibody (Invitrogen) or Alexa Fluor 488 conjugated streptavidin
(Invitrogen). Nuclei were stained and mounted with ProLong Gold antifade reagent with
DAPI (Invitrogen). To concentrate non-adherent cells onto a microscope slide, Cytofuge
(Statspin) was used. Fixation and blocking were performed as described above.
Assessment of apoptosis
Apoptotic cells were routinely identified by Annexin V-APC (eBioscience) or PE or
FITC (BioVision) staining according to the manufacturer’s instructions and analyzed
with a flow cytometer (BD FACSCanto II, BD Biosciences). Data files were analyzed by
using FlowJo software (Treestar).
Real-time PCR
Total RNA was isolated for the analysis using Trizol reagent. RNA was treated with
DNase I to eliminate the genomic DNA. Reverse transcription was performed using
random primer and SuperScript III reverse transcriptase (Invitrogen). CD25-CD4+ cells
from healthy donor were obtained by using human CD4 T Lymphocyte enrichment kit
(BD Pharmingen). Then cells were stimulated with PMA/Io for 9 hrs and RNA was
isolated and reverse transcription were performed as described above. cDNA products
were analyzed by real-time PCR using the Taqman Universal PCR Master Mix (PE
Applied Biosystems) or Fast Start Universal SYBR Green master (Roche) and Applied
Biosystems StepOnePlus real-time PCR system according to the manufacturer’s
9
instructions. Specific primers and Taqman probes for the Bim gene, FasL gene and
GAPDH internal control gene were purchased from Applied Biosystems. Primer
sequences for the HBZ gene and GAPDH gene used for the evaluation of the knock
down efficiency in MT-1 cells are described previously (11, 23). Primer sequences for
the HBZ gene used for another experiment to evaluate the HBZ expression in
Jurkat-HBZ, MT-1, TL-Om1, and ED cells were 5’- ATGGCGGCCTCAGGGCTGTT-3’
and 5’- GCGGCTTTCCTCTTCTAAGG-3’. Primer sequences for the FoxO3a gene
used were 5’- ACAAACGGCTCACTCTGTCCCAG -3’ and 5’-
AGCTCTTGCCAGTTCCCTCATTCTG -3’. All amplifications were conducted in
triplicates. The relative quantification was calculated according to the method described
in Applied Biosystems ABI prism 7700 SDS User Bulletin #2.
Chromatin immunoprecipitation (ChIP) analysis
Chromatin immunoprecipitation (ChIP) assay was performed according to the
protocol recommended by Millipore. Cells were fixed with 1% formaldehyde for 10
minutes at room temperature, washed twice with ice-cold PBS, treated with SDS-lysis
buffer [1% SDS, 50 mM EDTA and 200 mM Tris-HCl] for 10 minutes on ice and then
sonicated. Thereafter, the DNA/protein complexes were immunoprecipitated with
antibodies specific for acetylated-Histone H3, acetylated-Histone H4,
dimethylated-Histone H3 (Lys4), RNA polymerase II clone CTD4H8 (Millipore),
trimethylated-Histone H3 (Lys27), anti-trimethyl-Histone H3 (Lys9) antibodies (Cell
Signaling technology), or normal rabbit IgG (Santa Cruz technology) overnight at 4°C .

10
Immune complexes were collected with salmon sperm DNA-protein A and G Sepharose
slurry, washed, and eluted with freshly prepared elution buffer (1% SDS, 100 mM
NaHCO3). Protein-DNA complexes were de-crosslinked at 65°C for 4 hours. DNA was
purified and subjected to real-time PCR for quantification of the target fragments.
Sequences for the primer set are described previously (24, 25). For the evaluation of
binding of FoxO3a to the FOXO-binding sites, 293T cells were transfected with the 5
μg of 6xDBE-Luc construct, 5 μg of FoxO3aAAA expression plasmid together with or
without 5 μg of HBZ plasmid using TransIT in 10-cm dishes. Anti-Flag (SIGMA)
antibody was used for the immunoprecipitation. Primers used were
5’-AGTGCAGGTGCCAGAACATT-3’ and 5’-GCCTTATGCAGTTGCTCTCC-3’
which were constructed inside of the pGL3-basic vector. For the evaluation of the DNA
binding capacity of FoxO3a with or without HBZ, expression vectors for the HA-tagged
FoxO3a and Flag-tagged HBZ were transiently cotransfected into 293T cells using the
TransIT reagent. 24 hours after the transfection, cells were collected and chromatin
immunoprecipitation assay was performed as described above. For the
immunoprecipitation, anti-HA (SIGMA) antibody was used. Primers used for Bim gene
promoter were 5’- CCACCACTTGATTCTTGCAG-3’ and 5’-
TCCAGCGCTAGTCTTCCTTC-3’ which were constructed to contain the
FOXO-binding sequence located in intron1. Primers used for FasL gene promoter were
5’- ACGATAGCACCACTGCACTCC -3’ and 5’- GGCTGCAAACCAGTGGAAC
-3’which were also constructed to contain the three FOXO-binding sequences.
Individual PCRs were carried out in triplicate to control for PCR variation and mean
11
Ct values were collected. Fold difference of the antibody-bound fraction (IP) versus a
fixed amount of input (In) was calculated as ⁄ 2 ∆∆C 2 C C
Then, the fold difference value for a target antibody (t) was subtracted by the
nonspecific value derived from mouse or rabbit IgG (t0) ; ⁄ ⁄ .
Bisulfite genomic sequencing
Sodium bisulfite treatment of genomic DNA was performed as described previously
(26). DNA regions were amplified using bisulfite-treated genomic DNA by nested PCR.
To amplify promoter region (promoter 1) of Bim, primers used in the first PCR were
5’-TTTAGAGGGAGGAGAGTTTAAAG-3’ and
5’-CCCTACAACCCAACTCTAACTA-3’. Primers for the second PCR were
5’-AGGGTATAGTGAGAGCGTAGG-3’ and 5’-CAACTCTAACTAACGACCCC-3’.
For promoter 2 primers used in the first PCR were 5’-
GTGTGATTGTTTTTTGAGGG-3’ and 5’- AAAATACCCCCAAACAAAATAC-3’.
Primers for the second PCR were 5’- GCGGATTTAGTTGTAGATTTTG-3’ and 5’-
ACTCTTTACCCAAAACAAACTTC-3’. PCR products were purified, cloned into
pGEM-T Easy vector (Promega), and sequenced using the ABI PRISM 3130 genetic
analyzer. For CpG methylation analysis, web-based bisulfite sequencing analysis tool
called QUMA (quantification tool for methylation analysis) was used (27).

12
Coimmunoprecipitation assay, analysis of the p-FoxO3a localization and
immunoblotting
Expression vectors for the relevant genes were transiently cotransfected into 293T
cells using the TransIT reagent. 48 hours later, cells were collected and
coimmunoprecipitation assays were performed as described previously (28). For the
analysis of the p-FoxO3a localization, nuclear and cytoplasmic proteins were extracted
using Nuclear Complex Co-IP Kit (Active motif). The proteins were subjected to
SDS-PAGE analysis followed by immunoblotting with various antibodies. Antibodies
used were anti-p-FoxO3a, anti-α-tublin (SIGMA), anti-Flag, anti-HA (SIGMA), and
anti- His (MBL).
Lentiviral vector construction and transfection of the recombinant lentivirus
Lentiviral vector expressing shRNA against HBZ was constructed and recombinant
lentivirus was infected as described previously (11). When > 90% of cells expressed
EGFP, the HBZ and Bim genes expressions were analyzed by real-time PCR.
13
Results
The Bim gene transcription is suppressed in HBZ-expressing Jurkat and
CCRF-CEM cells
To determine the effects of HBZ on gene expression, we first performed microarray
analysis. Jurkat cells with or without expression of spliced form of HBZ (Jurkat-HBZ and
Jurkat-control, respectively) were stimulated with PMA and ionomycin (Io) for 9 hrs.
Gene expression profiles were then analyzed by DNA microarray. Table 1 shows the
apoptosis-associated genes that were down-regulated or up-regulated in stimulated
Jurkat-HBZ cells. Transcription of the Bim gene was prominently down-regulated in
HBZ-expressing Jurkat cells. To confirm the effect of HBZ on the Bim gene expression,
we evaluated Bim mRNA levels in Jurkat-control and Jurkat-HBZ cells with or without
PMA/Io stimulation using real-time PCR. As reported in the previous studies showing
that treatment by PMA/Io or other stimulators induced Bim expression (29, 30), the Bim
mRNA level of stimulated Jurkat-control cells was three-times higher than that of
unstimulated cells, but that of Jurkat-HBZ cells did not change after stimulation (Figure
1A). Similarly, increased Bim transcription by stimulation was also inhibited by HBZ in
CCRF-CEM cells (Figure 1A).
HBZ inhibits apoptosis
It has been reported that Bim plays an important role in activation induced cell death
and T cell homeostasis (31). Since the above data demonstrated that HBZ inhibits
14
stimulation-induced Bim expression, we next investigated whether HBZ inhibits
apoptosis in response to PMA/Io stimulation. To test this, Jurkat-control and Jurkat-HBZ
were each incubated with or without PMA/Io for 9 hours, and then apoptosis was
measured using Annexin V. The percentages of apoptotic cells in Jurkat-control and
Jurkat-HBZ were 40.2 % and 15 % respectively, indicating that HBZ suppressed
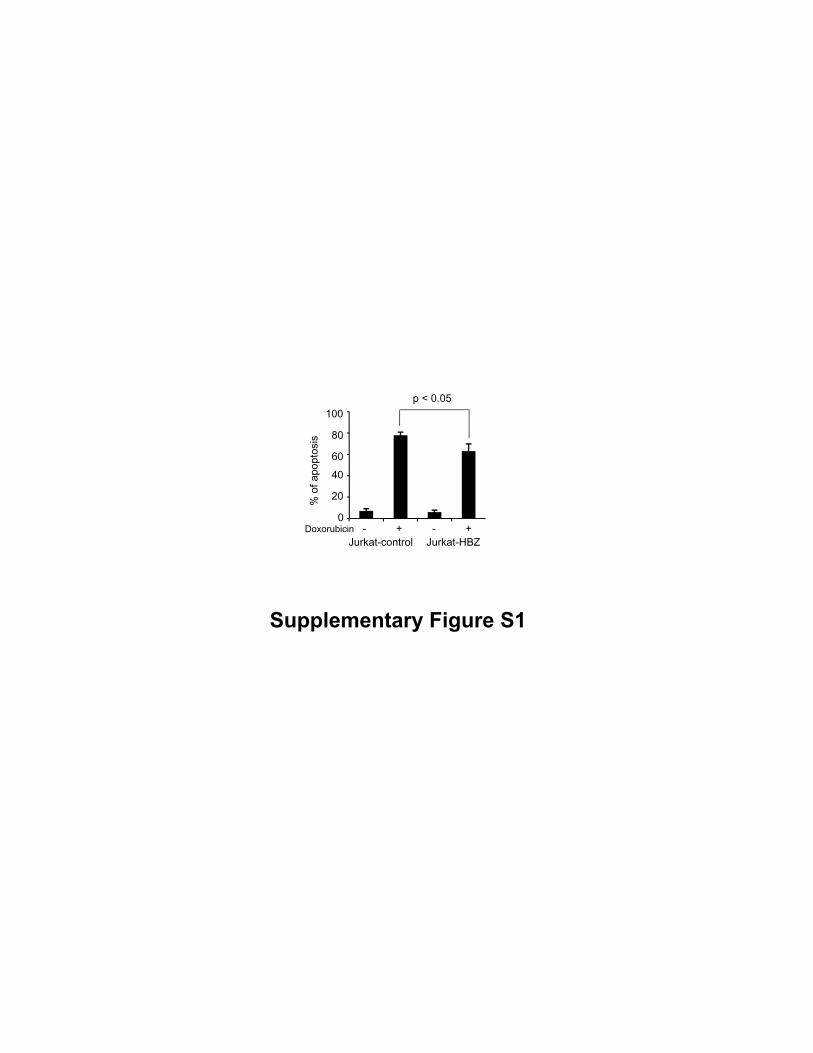
activation-induced apoptosis (Figure 1B). We also treated cells with doxorubicin and
found that HBZ slightly inhibited doxorubicin-induced apoptosis (Supplementary Fig.
S1). Fas-mediated apoptotic pathway might be involved in anti-apoptotic effect by HBZ.
In order to assess the effect of Fas-mediated signaling on the activation-induced
apoptosis, cells were also treated with or without Fas blocking antibody (0.5 μg/ml) 30
min before the PMA/Io stimulation. The percentage of apoptotic cells without Fas
blocking antibody in Jurkat-control and Jurkat-HBZ were 36.9 % and 22.4 %,
respectively. When cells were treated with Fas blocking antibody, the percentage of
apoptotic cells reduced and those were 24 % and 13.2 % in Jurkat-control and
Jurkat-HBZ, respectively (Figure 1C). Thus, Fas blocking antibody partially inhibited
apoptosis in Jurkat-HBZ, which indicates that Fas-mediated signals are also implicated in
activation-induced cell death. Indeed, we found that the transcription level of FasL was
suppressed in stimulated Jurkat-HBZ and CEM-HBZ cells compared with Jurkat-control
and CEM-control cells (Figure 1D), suggesting that down-regulation of FasL by HBZ
was also associated with inhibition of apoptosis.
HBZ suppresses Bim expression through attenuation of FoxO3a
15
We analyzed how HBZ suppresses the expression of Bim and FasL. It has been
reported that a Forkhead factor, FoxO3a, and p73 are important for the transcription of
Bim and FasL (32, 33). FoxO3a and other FOXO family members are phosphorylated by
protein kinases such as Akt or SGK on highly conserved serine and threonine residues
(especially Thr32, Ser253, Ser315 in FoxO3a), resulting in impaired DNA binding
activity and increased binding to the chaperone protein, 14-3-3 (20, 34, 35). Newly
formed 14-3-3-FOXO complexes are then exported from the nucleus, thereby inhibiting
FOXO-dependent transcription of key target genes such as Bim, FasL and TRAIL (36).
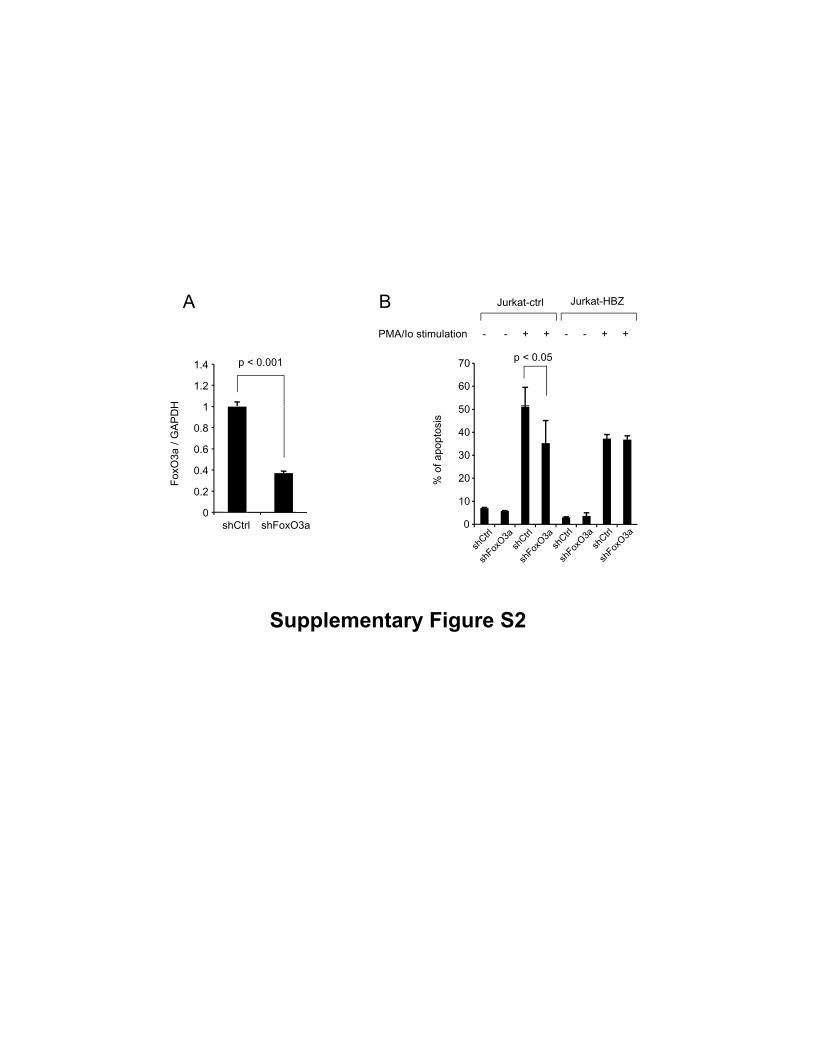
First, we investigated whether FoxO3a is implicated for the activation induced cell
death. As shown in supplementary Fig. S2, the knockdown of FoxO3a resulted in the
decreased apoptotic rate in Jurkat-control cells (p < 0.05). Furthermore, inhibition of
Foxo3a did not influence activation-induced cell death in Jurkat-HBZ cells, suggesting
that inhibitory effect of HBZ on Foxo3a function. To investigate whether HBZ affects
FoxO3a function, Jurkat cells were transiently transfected with a plasmid expressing
FoxO3aAAA, the constitutive active mutant of FoxO3a, which is no longer
phosphorylated by Akt and is localized in the nucleus. The FoxO3aAAA was expressed
together with hrGFP using an internal ribosome entry site (IRES)
(FoxO3aAAA-IREShrGFP). Jurkat cells were transiently transfected with full-length
HBZ or its mutants. HBZ has 3 domains, an activation domain (AD), a central domain
(CD), and a basic leucine zipper domain (bZIP) (12). In this study the deletion mutants
(HBZ-ΔAD, HBZ- ΔbZIP, and HBZ-ΔCD) were used. The percentage of FoxO3aAAA
induced apoptotic cells in the absence of HBZ was 69.6 % while it was suppressed by
16
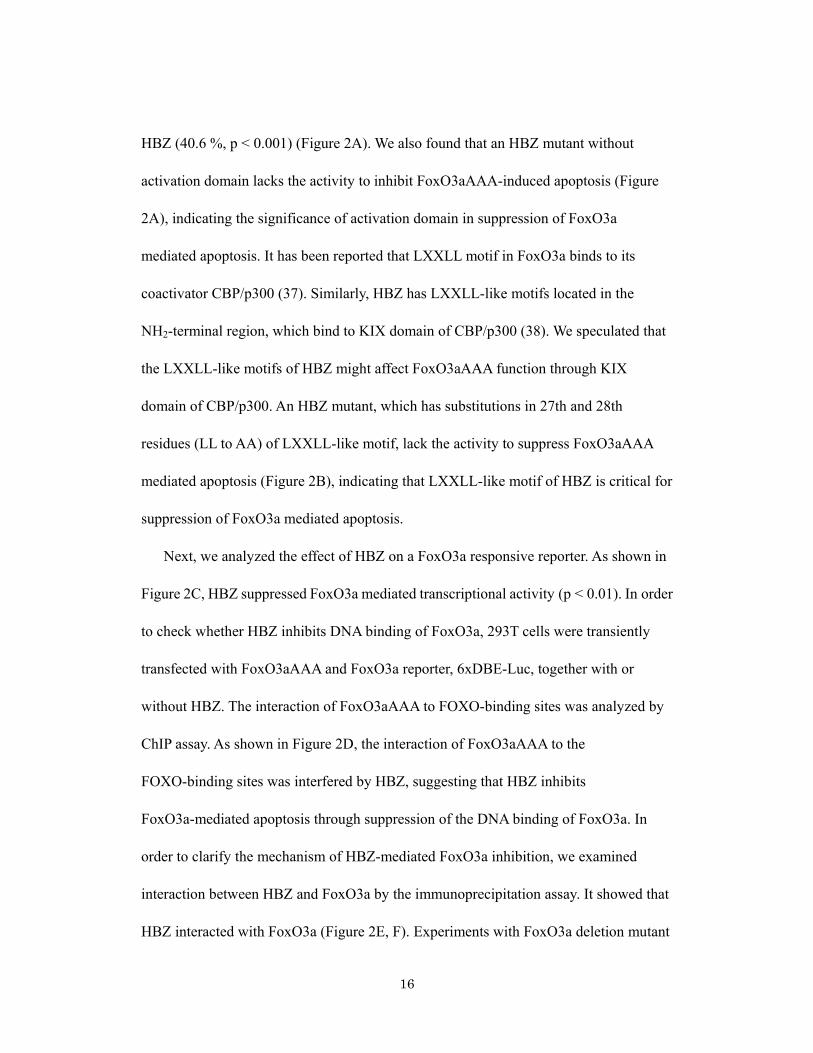
HBZ (40.6 %, p < 0.001) (Figure 2A). We also found that an HBZ mutant without
activation domain lacks the activity to inhibit FoxO3aAAA-induced apoptosis (Figure
2A), indicating the significance of activation domain in suppression of FoxO3a
mediated apoptosis. It has been reported that LXXLL motif in FoxO3a binds to its
coactivator CBP/p300 (37). Similarly, HBZ has LXXLL-like motifs located in the
NH2-terminal region, which bind to KIX domain of CBP/p300 (38). We speculated that
the LXXLL-like motifs of HBZ might affect FoxO3aAAA function through KIX
domain of CBP/p300. An HBZ mutant, which has substitutions in 27th and 28th
residues (LL to AA) of LXXLL-like motif, lack the activity to suppress FoxO3aAAA
mediated apoptosis (Figure 2B), indicating that LXXLL-like motif of HBZ is critical for
suppression of FoxO3a mediated apoptosis.
Next, we analyzed the effect of HBZ on a FoxO3a responsive reporter. As shown in
Figure 2C, HBZ suppressed FoxO3a mediated transcriptional activity (p < 0.01). In order
to check whether HBZ inhibits DNA binding of FoxO3a, 293T cells were transiently
transfected with FoxO3aAAA and FoxO3a reporter, 6xDBE-Luc, together with or
without HBZ. The interaction of FoxO3aAAA to FOXO-binding sites was analyzed by
ChIP assay. As shown in Figure 2D, the interaction of FoxO3aAAA to the
FOXO-binding sites was interfered by HBZ, suggesting that HBZ inhibits
FoxO3a-mediated apoptosis through suppression of the DNA binding of FoxO3a. In
order to clarify the mechanism of HBZ-mediated FoxO3a inhibition, we examined
interaction between HBZ and FoxO3a by the immunoprecipitation assay. It showed that
HBZ interacted with FoxO3a (Figure 2E, F). Experiments with FoxO3a deletion mutant
17
revealed that HBZ interacted with the forkhead domain (FH) of FoxO3a (Figure 2E).
Analysis using HBZ deletion mutants showed that the central domain of HBZ interacted
with FoxO3a (Figure 2F).
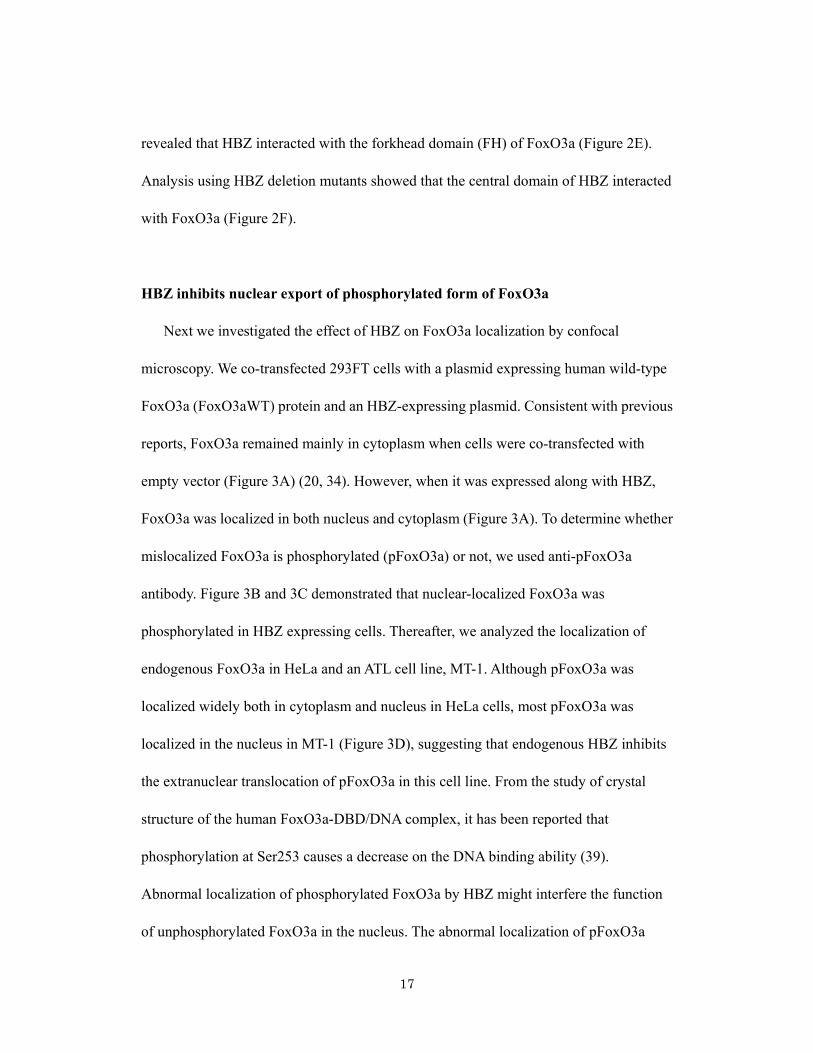
HBZ inhibits nuclear export of phosphorylated form of FoxO3a
Next we investigated the effect of HBZ on FoxO3a localization by confocal
microscopy. We co-transfected 293FT cells with a plasmid expressing human wild-type
FoxO3a (FoxO3aWT) protein and an HBZ-expressing plasmid. Consistent with previous
reports, FoxO3a remained mainly in cytoplasm when cells were co-transfected with
empty vector (Figure 3A) (20, 34). However, when it was expressed along with HBZ,
FoxO3a was localized in both nucleus and cytoplasm (Figure 3A). To determine whether
mislocalized FoxO3a is phosphorylated (pFoxO3a) or not, we used anti-pFoxO3a
antibody. Figure 3B and 3C demonstrated that nuclear-localized FoxO3a was
phosphorylated in HBZ expressing cells. Thereafter, we analyzed the localization of
endogenous FoxO3a in HeLa and an ATL cell line, MT-1. Although pFoxO3a was
localized widely both in cytoplasm and nucleus in HeLa cells, most pFoxO3a was
localized in the nucleus in MT-1 (Figure 3D), suggesting that endogenous HBZ inhibits
the extranuclear translocation of pFoxO3a in this cell line. From the study of crystal
structure of the human FoxO3a-DBD/DNA complex, it has been reported that
phosphorylation at Ser253 causes a decrease on the DNA binding ability (39).
Abnormal localization of phosphorylated FoxO3a by HBZ might interfere the function
of unphosphorylated FoxO3a in the nucleus. The abnormal localization of pFoxO3a
18
prompted us to investigate whether HBZ bound to 14-3-3 along with FoxO3a, since
14-3-3 is a chaperon protein involved in nuclear-cytoplasm shuttling of FOXO family.
As shown in Figure 3E, HBZ, FoxO3a and 14-3-3 form a ternary complex. However,
the binding of FoxO3a and 14-3-3 was not affected by HBZ (result of IP with anti-Flag
Ab and detected with anti-HA Ab).
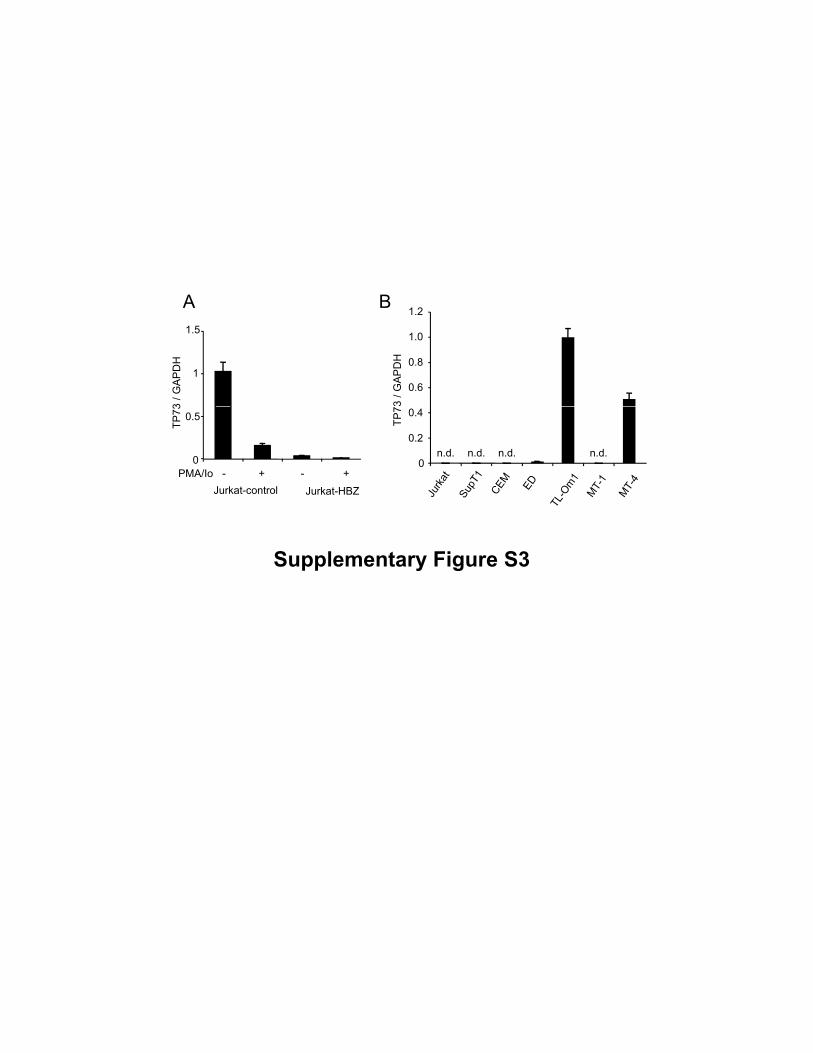
As another possible mechanism for down-regulation of Bim and FasL, we compared
the transcription level of p73 in Jurkat cells with and without HBZ expression. Activation
of HBZ expressing cells reduced transcription of p73, but the expression level of p73 was
variable among ATL cell lines (Supplementary Fig. S3A, B). We conclude that p73 is not
responsible for suppression of Bim expression in ATL cells.
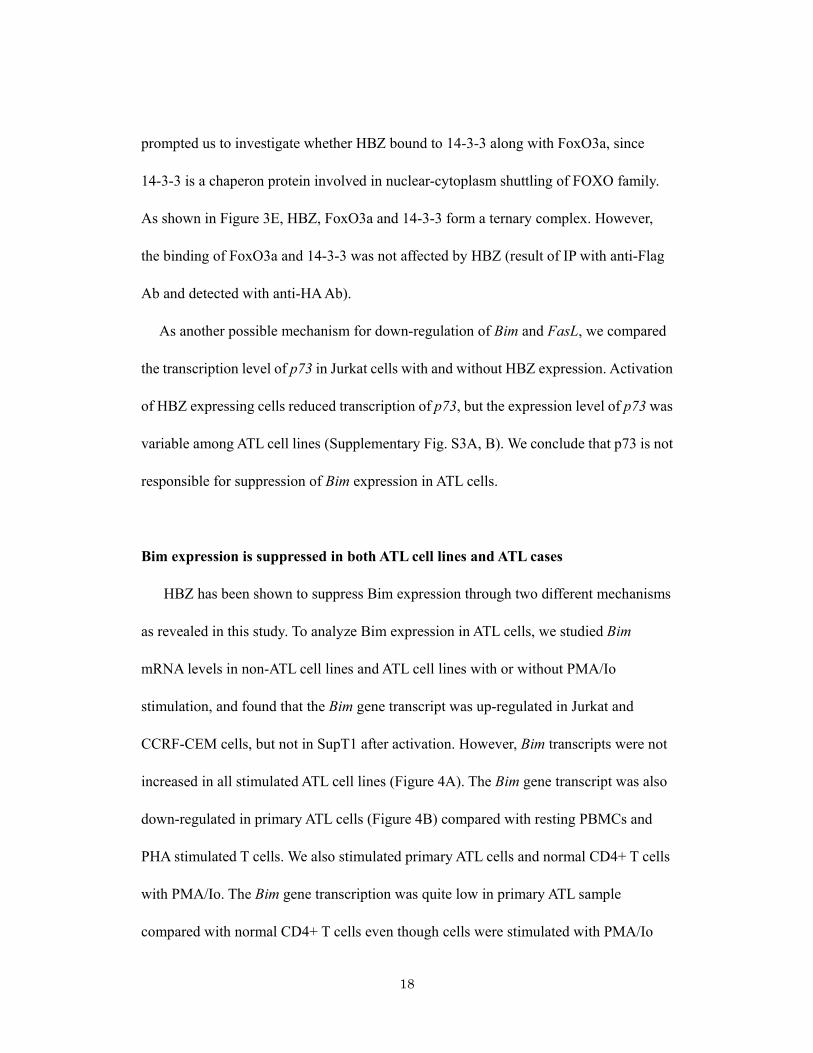
Bim expression is suppressed in both ATL cell lines and ATL cases
HBZ has been shown to suppress Bim expression through two different mechanisms
as revealed in this study. To analyze Bim expression in ATL cells, we studied Bim
mRNA levels in non-ATL cell lines and ATL cell lines with or without PMA/Io
stimulation, and found that the Bim gene transcript was up-regulated in Jurkat and
CCRF-CEM cells, but not in SupT1 after activation. However, Bim transcripts were not
increased in all stimulated ATL cell lines (Figure 4A). The Bim gene transcript was also
down-regulated in primary ATL cells (Figure 4B) compared with resting PBMCs and
PHA stimulated T cells. We also stimulated primary ATL cells and normal CD4+ T cells
with PMA/Io. The Bim gene transcription was quite low in primary ATL sample
compared with normal CD4+ T cells even though cells were stimulated with PMA/Io

19
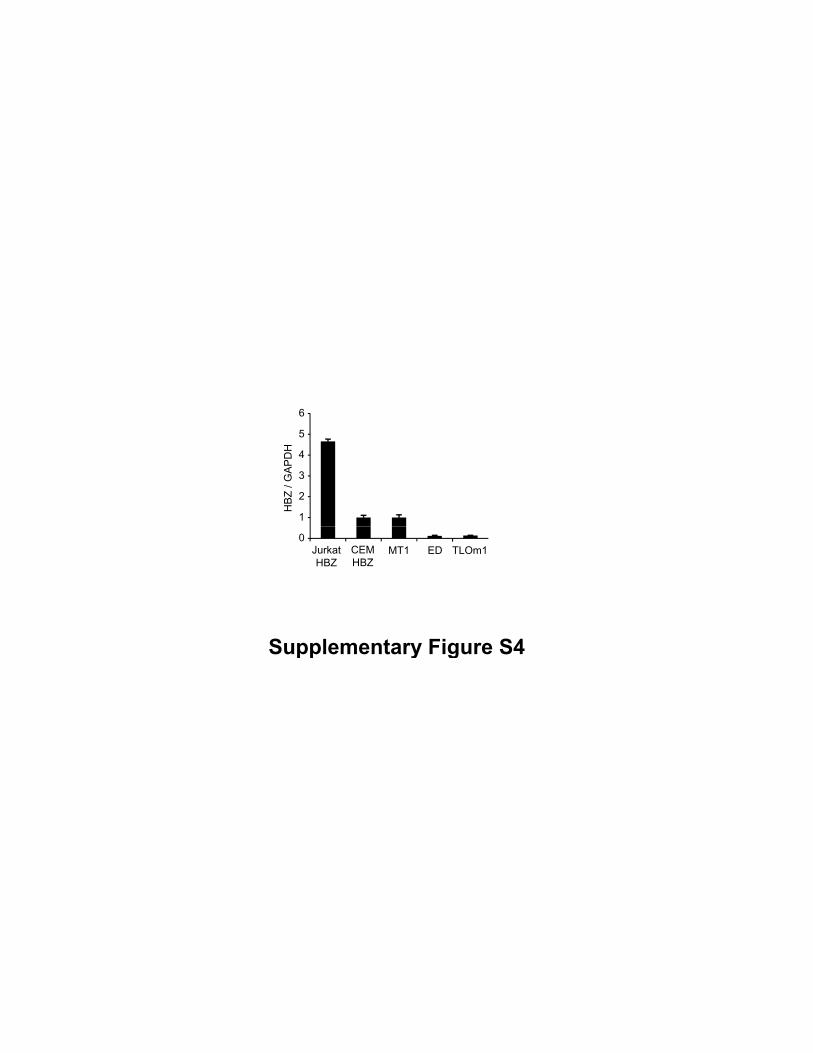
(Figure 4C). In order to confirm HBZ expression in representative ATL cell lines, we
quantified the level of the HBZ mRNA transcription in Jurkat-HBZ, CEM-HBZ, MT-1,
ED and TL-Om1 by real-time PCR and confirmed that HBZ is expressed in these ATL
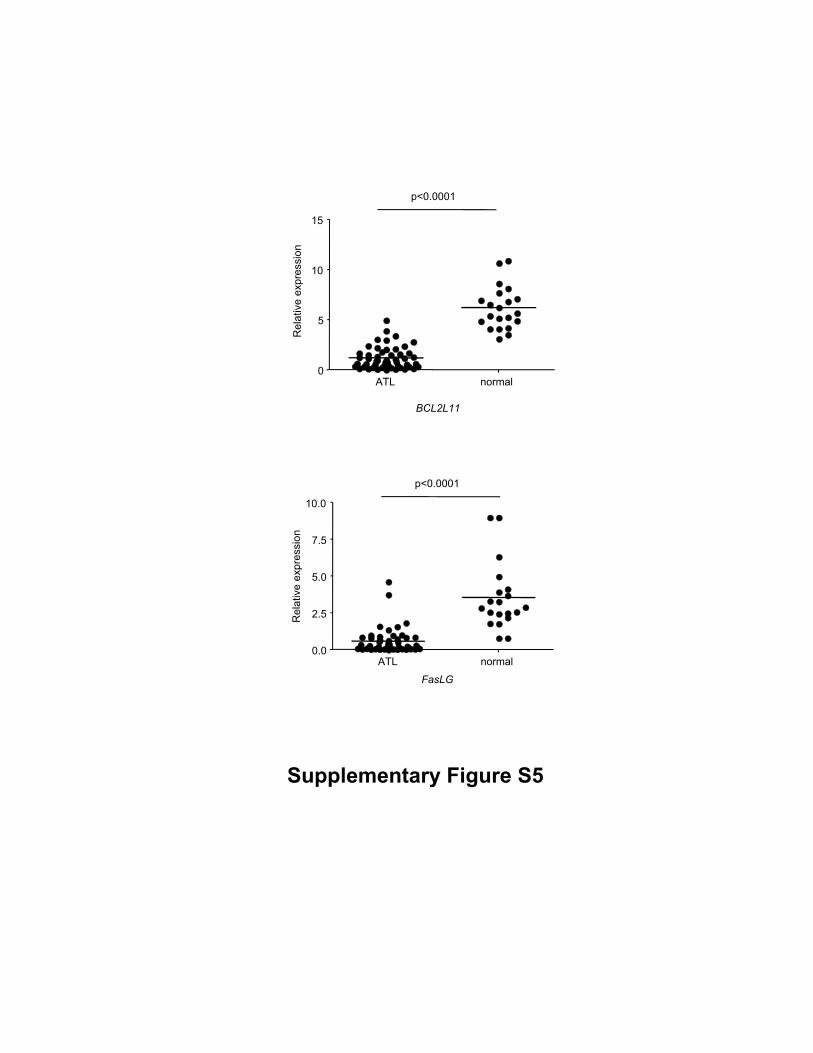
cell lines (Supplementary Fig. S4). A microarray data obtained from Gene Expression
Omnibus (GEO), shows that both Bim and FasL transcription levels are lower in ATL
cases than healthy donors (accession number: GSE33615, Supplementary Fig. S5),
supporting our data that Bim expression was suppressed in ATL cells.
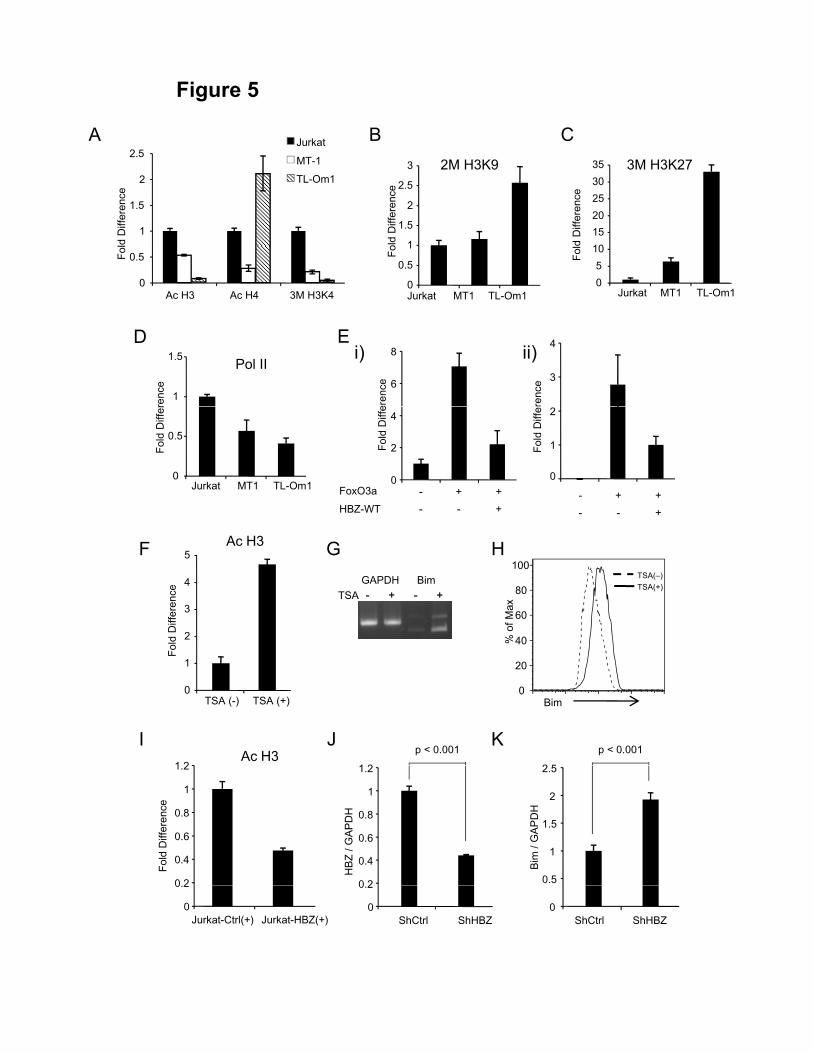
Bim expression is silenced by epigenetic mechanisms
Since the Bim gene transcription was severely suppressed in ATL cells, we
investigated the epigenetic status (DNA methylation and histone modification) of the
promoter region of the Bim gene in ATL cells. A previous study showed that the 0.8 kb
region immediately upstream of exon 1 contains the important elements for the control of
Bim expression (promoter 1). The Bim promoter does not contain a TATA or CAAT box
and has the characteristics of a 'TATA-less' promoter (40). Additionally, the alternative
promoter has been reported to exist in intron 1 (promoter 2) (41, 42). These two promoter
regions are highly GC-rich and contain the binding sites for several transcription factors
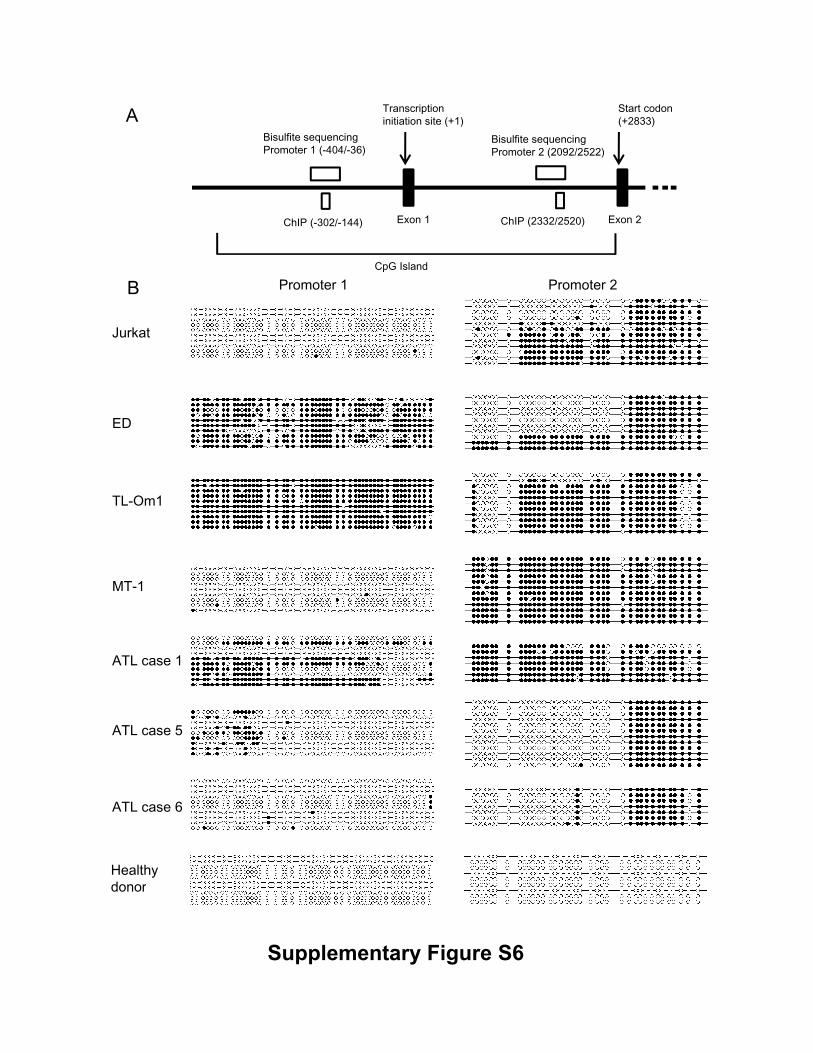
including FoxO3a. To determine whether CpG sites in these Bim gene promoter regions
are methylated in ATL cell lines, their methylation status was analyzed by
bisulfite-mediated methylcytosine mapping (Supplementary Fig. S6A, B). The promoter
1 of Bim was hypermethylated in two ATL cell lines (ED and TL-Om1), and ATL case 1
while this region was not so methylated in MT-1 cells and two ATL cases. On the other

20
hand, the promoter 2 was heavily methylated in two ATL cell lines (TL-Om1 and MT-1)
and ATL case 1 and partially methylated in Jurkat cells (Supplementary Fig. S6B).
These results suggest that in some cases, heavily methylated CpG sites of promoter 1 and
2 are associated with silencing of Bim transcription but these methylations can not
account for suppressed Bim expression in all ATL cell lines and ATL cases.
Therefore, we next focused on the histone modification in the promoter region of
Bim. It is well known that deacetylation of the histones are also common features of
cancer, which results in transcriptional silencing of tumor suppressor genes (43). First, we
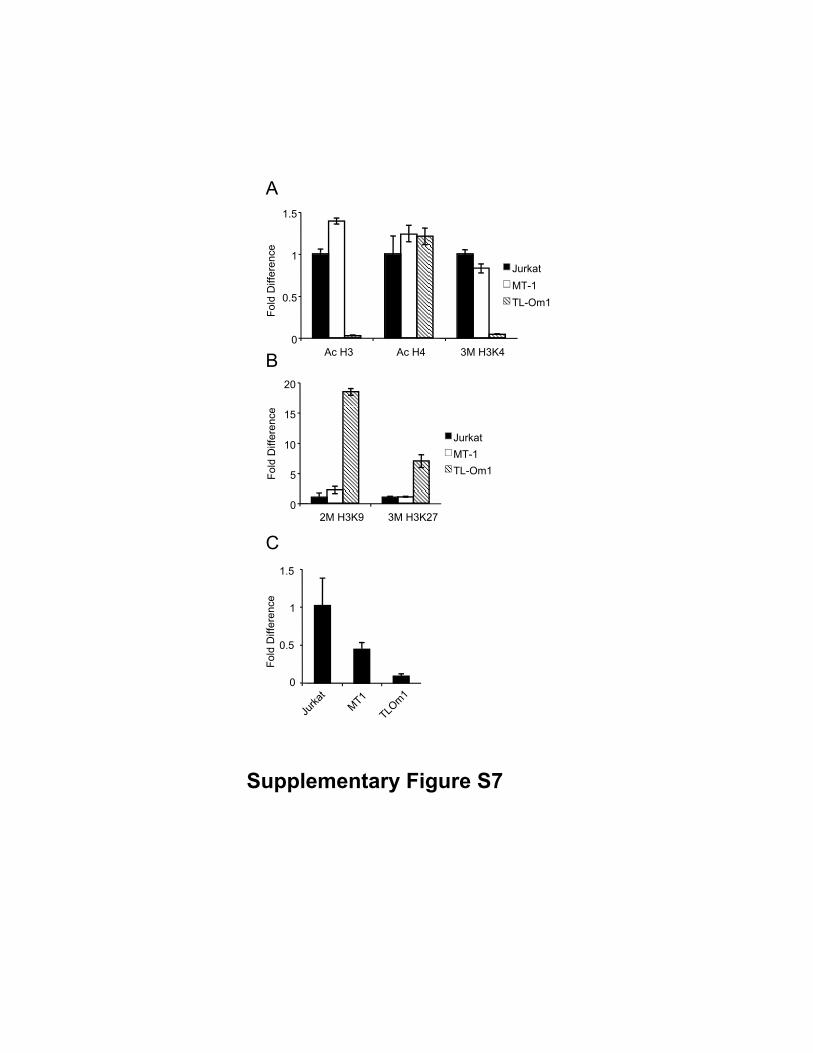
analyzed the histone H3 and H4 acetylation and H3K4 trimethylation, which are all
permissive marks (44), in promoter 1 of Jurkat, MT-1, and TL-Om1 cells. Contrary to our
speculation, neither H3, H4 acetylation nor H3K4 trimethylation did not differ between
MT-1 and Jurkat cells (Supplementary Fig. S7). We next analyzed the histone
modification status in promoter 2. As shown in Figure 5A, MT-1 and TL-Om1 cells
exhibited decreased level of histone H3 acetylation and H3K4 trimethylation but not
histone H4 acetylation. Since methylation of DNA is often preceded by dimethylation of
H3K9 or trimethylation of H3K27 (both repressive marks) in oncogenesis (44), we asked
whether there were differences in these epigenetic chromatin marks on the Bim gene
promoter in ATL cell lines. TL-Om1 cells exhibited upregulated level of H3K9
dimethylation and H3K27 trimethylation compared to Jurkat cells (Figure 5B, C) while
MT-1 exhibited a little upregulated level of H3K27 trimethylation (Figure 5C) in the
promoter 2. These data suggest that histone modifications of promoter 2 are critical for
the suppressed Bim gene transcription. We also performed ChIP analysis using anti-RNA

21
polymerase II antibody (Figure 5D) and revealed that Pol II binding was decreased in
MT-1 and TL-Om1 cells, confirming suppressed transcription of the Bim gene. To
further investigate the mechanisms involved in FoxO3a-mediated Bim gene
transcription in the promoter 2, we transfected HA-tagged FoxO3a expression vector
together with or without a HBZ expression vector into 293T cells and
immunoprecipitated with anti-HA antibody. Then the DNA binding capacity of FoxO3a
was quantified by real-time PCR. Figure 5E shows that HBZ attenuated the DNA
binding capacity of FoxO3a in the promoter 2 of Bim (i) and FasL promoter (ii),
suggesting that the suppressed binding of FoxO3a to the promoter regions leads to
inhibition of the Bim and FasL genes transcription by HBZ.
Next we treated MT-1 cells with trichostatin A (TSA), a cell-permeable chemical
inhibitor of class I/II HDACs. Treatment of TSA resulted in a clear up-regulation of
acetylation of histone H3 (Figure 5F) followed by Bim expression both at the mRNA
(Figure 5G) and protein levels (Figure 5H), indicating that histone modification is
associated with suppressed Bim transcription in MT-1. We also performed ChIP assay
using Jurkat-control and Jurkat-HBZ cells, which were stimulated with PMA and
ionomycin for 9h, and found that acetylation of histone H3 decreased in Jurkat-HBZ
cells (Figure 5I), suggesting that HBZ is implicated in histone deacetylation in T-cells.
To verify whether HBZ inhibits transcription of the Bim gene, we suppressed the HBZ
gene transcription by shRNA as reported previously (11). Efficiencies of lentivirus vector
transduction, which were determined by EGFP expression, were 90.5 % and 90.3 % for
control MT-1 cells and HBZ-knockdown MT-1 cells, respectively. Suppressed HBZ

22
expression led to increased the Bim gene transcription (Figure 5J, K), indicating that HBZ
expression is linked to suppression of Bim expression in ATL cells.
23
Discussion
Human immunodeficiency virus type 1 (HIV-1) replicates vigorously, and the
generated virus infects target cells in vivo. Unlike HIV-1, HTLV-1 induces proliferation to
increase the number of infected cells, since this virus is transmitted primarily by
cell-to-cell contact (5). Therefore, HTLV-1-encoded proteins promote proliferation of
infected cells and inhibit their apoptosis, resulting in an increased number of infected
cells in vivo (2). In this study, we show that HBZ inhibits both the intrinsic and extrinsic
apoptotic pathways via targeting FoxO3a, which leads to suppressed transcriptions of
Bim and FasL. We demonstrated two mechanisms for perturbation of FoxO3a by HBZ;
interaction of HBZ with FoxO3a and interference of nuclear export of phosphorylated
FoxO3a. HBZ suppresses DNA binding ability of active form of FoxO3a through
interaction between central domain of HBZ and FH domain of FoxO3a. In addition,
LXXLL-like motif of HBZ is implicated in inhibition of FoxO3a mediated apoptosis,
suggesting that HBZ interferes interaction of CBP/p300 and FoxO3a. Furthermore,
HBZ retains inactive form of FoxO3a in the nucleus through interaction with 14-3-3,
leading to transcriptional repression of the target genes. Interestingly, accumulation of
phosphorylated form of FoxO3a in the nucleus has been observed in HIV
Vpr-expressing cells, which might be implicated in HIV-mediated resistance against
insulin (28). Thus, FoxO3a is a target of both human retroviruses.
In this study, we showed that central domain of HBZ interacts with FoxO3a while
LXXLL-like motif in activation domain of HBZ is responsible for suppressed apoptosis.
24
LXXLL-like motif of HBZ has been reported to interact with KIX domain of p300 (38).
The central domain of HBZ interacts with the FH domain of FoxO3a, which binds to
the target sequence (35). This is mechanism how HBZ inhibits DNA binding of FoxO3a.
However, inhibitory effect of HBZ on apoptosis largely depends on LXXLL-like motif
of activation domain (Figure 2A and B). FoxO3a is also reported to interact with KIX
domain of CBP/p300 (37). FH domain of FoxO3a intramolecularly interacts with its
conserved regions (CR) 3, and binding of FH to DNA releases CR3, allowing it to bind
KIX of CBP/p300 (45). These findings suggest that HBZ interferes the complex
interaction between FoxO3a and CBP/p300, which is likely important to induce
apoptosis.
It has been reported that Bim has a tumor suppressor function in various cancers.
Hemizygous loss of the Bim gene promoted development of B-cell leukemia in
Myc-transgenic mice in which c-myc expression was driven by the immunoglobulin gene
intron-enhancer (46). Insulin-like growth factor 1 (IGF-1), an important growth factor for
myeloma cells, has been reported to suppress Bim expression by epigenetic and
posttranslational mechanisms (25). In Epstein-Barr virus infected B cells Bim
transcription is silenced by DNA methylation of the Bim gene promoter (47). Thus,
impaired expression of Bim is associated with the various cancers including the
virus-related malignancies. FoxO3a is also a target of oncogenesis. BCR-ABL induces
phosphorylation of FoxO3a, which leads to suppressed expression of Bim in Ph1+
chronic myelogenous leukemia cells (32). In breast cancer, IκB kinase interacts with,
phosphorylates FoxO3a, which causes proteolysis of FoxO3a (48). In this study, we
25
revealed that HBZ hinders nuclear export of phosphorylated FoxO3a, and impairs
function of FoxO3a likely through interaction of FoxO3a and p300. Thus, suppressed
Bim and FasL expression through inhibition of FoxO3a by HBZ is a new mechanism
for oncogenesis.
Besides of FoxO3a perturbation by HBZ, we also have identified the epigenetic
aberrations in the promoter region of the Bim gene in ATL cells, and found that Bim
expression is suppressed by DNA methylation and histone modification. ATL cell lines
exhibited upregulated level of H3K27 trimethylation in the promoter regions of Bim. It
has been reported that enhancer of zeste (EZH) 2, a methyltransferase and component of
the polycomb repressive complex 2 (PRC2), expression is increased in ATL cell lines
(42). Since EZH2 plays an essential role in the epigenetic maintenance of H3K27
trimethylation, upregulated H3K27 trimethylation of the Bim gene promoter might be
associated with increased expression of EZH2 in ATL cells. In addition, HBZ seems to
be associated with histone deacetylation in MT-1 cells. According to the previous
studies, it is known that both HBZ and FoxO3a bind to the histone acetyltransferase
p300/CBP through the LXXLL motif (38). In this study, we found that the same motif is
important for FoxO3a suppression and resulting inhibition of apoptosis. It is likely that
HBZ decreases histone acetylation level on Bim promoter through the interaction with
FoxO3a and dissociation of p300/CBP from the promoter. In addition to histone
modifications, hypermethylation of CpGs in Bim promoter was observed in some ATL
cells. These epigenetic aberrations likely occur as the secondary changes following long
time silencing of Bim by HBZ, although the further investigations will be required.
26
In this study, we demonstrated that HBZ suppresses activation-induced apoptosis by
down-regulation of pro-apoptotic genes, Bim and FasL. HBZ perturbs the function of
FoxO3a by interaction, and induces epigenetic aberrations in the promoter region of the
Bim gene. It has been shown that HBZ induces not only cancer but also inflammation in
vivo. Since inflammatory diseases are essentially caused by failure to negatively regulate
unnecessary immune responses by apoptosis, suppression of apoptosis by HBZ might be
associated with HTLV-1-induced inflammation as well. Collectively, HBZ-mediated
inhibition of apoptosis is likely implicated in both neoplastic and inflammatory diseases
caused by HTLV-1.

27
Author Contributions
Conception and design: A. T. Nakanishi, K. Takai, J. Yasunaga, M. Matsuoka
Development of methodology: A. T. Nakanishi, K. Takai, J. Yasunaga, M. Matsuoka
Acquisition of data (provided animals, acquired and managed patients, provided
facilities, etc.): A. T. Nakanishi, K. Takai
Analysis and interpretation of data (e.g., statistical analysis, biostatistics,
computational analysis): A. T. Nakanishi, K. Takai, J. Yasunaga, M. Matsuoka
Writing, review, and/or revision of the manuscript: A. T. Nakanishi, J. Yasunaga, M.
Matsuoka
Administrative, technical, or material support (i.e., reporting or organizing data,
constructing databases): A. T. Nakanishi, K. Takai, J. Yasunaga, M. Matsuoka
Study supervision: M. Matsuoka
Acknowledgements
We thank T. Furuyama (Kagawa Prefectural University of Health Science) for the
6xDBE-Luc plasmid DNA, P. Bouillet for valuable comments on this study, and L.
Kingsbury for proofreading of this manuscript.
Grant Support: This study was supported by a Grant-in-aid for Scientific Research from
the Ministry of Education, Science, Sports, and Culture of Japan, to M. M. (MEXT grant
number 221S0001) a grant from Japan Leukemia Research Fund to M.M. and a grant
from the Takeda Science Foundation to J.Y.
28
Referenses
1. Proietti FA, Carneiro-Proietti AB, Catalan-Soares BC, Murphy EL. Global
epidemiology of HTLV-I infection and associated diseases. Oncogene.
2005;24:6058-68.
2. Matsuoka M, Jeang KT. Human T-cell leukaemia virus type 1 (HTLV-1)
infectivity and cellular transformation. Nat Rev Cancer. 2007;7:270-80.
3. Igakura T, Stinchcombe JC, Goon PK, Taylor GP, Weber JN, Griffiths GM,
et al. Spread of HTLV-I between lymphocytes by virus-induced polarization of the
cytoskeleton. Science. 2003;299:1713-6.
4. Pais-Correia AM, Sachse M, Guadagnini S, Robbiati V, Lasserre R, Gessain
A, et al. Biofilm-like extracellular viral assemblies mediate HTLV-1 cell-to-cell
transmission at virological synapses. Nat Med. 2010;16:83-9.
5. Derse D, Hill SA, Lloyd PA, Chung H, Morse BA. Examining human
T-lymphotropic virus type 1 infection and replication by cell-free infection with
recombinant virus vectors. J Virol. 2001;75:8461-8.
6. Mazurov D, Ilinskaya A, Heidecker G, Lloyd P, Derse D. Quantitative
comparison of HTLV-1 and HIV-1 cell-to-cell infection with new replication dependent
vectors. PLoS pathogens. 2010;6:e1000788.
7. Cavrois M, Leclercq I, Gout O, Gessain A, Wain-Hobson S, Wattel E.
Persistent oligoclonal expansion of human T-cell leukemia virus type 1-infected
circulating cells in patients with Tropical spastic paraparesis/HTLV-1 associated
29
myelopathy. Oncogene. 1998;17:77-82.
8. Etoh K, Tamiya S, Yamaguchi K, Okayama A, Tsubouchi H, Ideta T, et al.
Persistent clonal proliferation of human T-lymphotropic virus type I-infected cells in
vivo. Cancer Res. 1997;57:4862-7.
9. Grassmann R, Aboud M, Jeang KT. Molecular mechanisms of cellular
transformation by HTLV-1 Tax. Oncogene. 2005;24:5976-85.
10. Fan J, Ma G, Nosaka K, Tanabe J, Satou Y, Koito A, et al. APOBEC3G
Generates Nonsense Mutations in HTLV-1 Proviral Genomes In Vivo. J Virol. 2010.
11. Satou Y, Yasunaga J, Yoshida M, Matsuoka M. HTLV-I basic leucine zipper
factor gene mRNA supports proliferation of adult T cell leukemia cells. Proc Natl Acad
Sci U S A. 2006;103:720-5.
12. Satou Y, Yasunaga J, Zhao T, Yoshida M, Miyazato P, Takai K, et al.
HTLV-1 bZIP Factor Induces T-Cell Lymphoma and Systemic Inflammation In Vivo.
PLoS pathogens. 2011;7:e1001274.
13. Bouillet P, O'Reilly LA. CD95, BIM and T cell homeostasis. Nat Rev
Immunol. 2009;9:514-9.
14. Debatin KM, Goldman CK, Waldmann TA, Krammer PH. APO-1-induced
apoptosis of leukemia cells from patients with adult T-cell leukemia. Blood.
1993;81:2972-7.
15. Yasunaga J, Taniguchi Y, Nosaka K, Yoshida M, Satou Y, Sakai T, et al.
Identification of aberrantly methylated genes in association with adult T-cell leukemia.
Cancer Res. 2004;64:6002-9.
30
16. Krueger A, Fas SC, Giaisi M, Bleumink M, Merling A, Stumpf C, et al.
HTLV-1 Tax protects against CD95-mediated apoptosis by induction of the cellular
FLICE-inhibitory protein (c-FLIP). Blood. 2006;107:3933-9.
17. Okamoto K, Fujisawa J, Reth M, Yonehara S. Human T-cell leukemia virus
type-I oncoprotein Tax inhibits Fas-mediated apoptosis by inducing cellular FLIP
through activation of NF-kappaB. Genes to cells : devoted to molecular & cellular
mechanisms. 2006;11:177-91.
18. Sun SC, Yamaoka S. Activation of NF-kappaB by HTLV-I and implications
for cell transformation. Oncogene. 2005;24:5952-64.
19. Zhao T, Yasunaga J, Satou Y, Nakao M, Takahashi M, Fujii M, et al. Human
T-cell leukemia virus type 1 bZIP factor selectively suppresses the classical pathway of
NF-kappaB. Blood. 2009;113:2755-64.
20. Brunet A, Bonni A, Zigmond MJ, Lin MZ, Juo P, Hu LS, et al. Akt promotes
cell survival by phosphorylating and inhibiting a Forkhead transcription factor. Cell.
1999;96:857-68.
21. Zhao T, Satou Y, Sugata K, Miyazato P, Green PL, Imamura T, et al.
HTLV-1 bZIP factor enhances TGF-{beta} signaling through p300 coactivator. Blood.
2011;118:1865-76.
22. Furuyama T, Nakazawa T, Nakano I, Mori N. Identification of the differential
distribution patterns of mRNAs and consensus binding sequences for mouse DAF-16
homologues. The Biochemical journal. 2000;349:629-34.
23. Ponchel F, Toomes C, Bransfield K, Leong FT, Douglas SH, Field SL, et al.
31
Real-time PCR based on SYBR-Green I fluorescence: an alternative to the TaqMan
assay for a relative quantification of gene rearrangements, gene amplifications and
micro gene deletions. BMC Biotechnol. 2003;3:18.
24. Richter-Larrea JA, Robles EF, Fresquet V, Beltran E, Rullan AJ, Agirre X, et
al. Reversion of epigenetically mediated BIM silencing overcomes chemoresistance in
Burkitt lymphoma. Blood. 2010;116:2531-42.
25. De Bruyne E, Bos TJ, Schuit F, Van Valckenborgh E, Menu E, Thorrez L, et
al. IGF-1 suppresses Bim expression in multiple myeloma via epigenetic and
posttranslational mechanisms. Blood. 2010;115:2430-40.
26. Fan J, Kodama E, Koh Y, Nakao M, Matsuoka M. Halogenated thymidine
analogues restore the expression of silenced genes without demethylation. Cancer Res.
2005;65:6927-33.
27. Kumaki Y, Oda M, Okano M. QUMA: quantification tool for methylation
analysis. Nucleic Acids Res. 2008;36:W170-5.
28. Kino T, De Martino MU, Charmandari E, Ichijo T, Outas T, Chrousos GP.
HIV-1 accessory protein Vpr inhibits the effect of insulin on the Foxo subfamily of
forkhead transcription factors by interfering with their binding to 14-3-3 proteins:
potential clinical implications regarding the insulin resistance of HIV-1-infected
patients. Diabetes. 2005;54:23-31.
29. Cante-Barrett K, Gallo EM, Winslow MM, Crabtree GR. Thymocyte negative
selection is mediated by protein kinase C- and Ca2+-dependent transcriptional induction
of bim [corrected]. Journal of immunology. 2006;176:2299-306.

32
30. Snow AL, Oliveira JB, Zheng L, Dale JK, Fleisher TA, Lenardo MJ. Critical
role for BIM in T cell receptor restimulation-induced death. Biol Direct. 2008;3:34.
31. Green DR, Droin N, Pinkoski M. Activation-induced cell death in T cells.
Immunological reviews. 2003;193:70-81.
32. Essafi A, Fernandez de Mattos S, Hassen YA, Soeiro I, Mufti GJ, Thomas NS,
et al. Direct transcriptional regulation of Bim by FoxO3a mediates STI571-induced
apoptosis in Bcr-Abl-expressing cells. Oncogene. 2005;24:2317-29.
33. Busuttil V, Droin N, McCormick L, Bernassola F, Candi E, Melino G, et al.
NF-kappaB inhibits T-cell activation-induced, p73-dependent cell death by induction of
MDM2. Proc Natl Acad Sci U S A. 2010;107:18061-6.
34. Brunet A, Park J, Tran H, Hu LS, Hemmings BA, Greenberg ME. Protein
kinase SGK mediates survival signals by phosphorylating the forkhead transcription
factor FKHRL1 (FOXO3a). Molecular and cellular biology. 2001;21:952-65.
35. Obsil T, Obsilova V. Structure/function relationships underlying regulation of
FOXO transcription factors. Oncogene. 2008;27:2263-75.
36. Modur V, Nagarajan R, Evers BM, Milbrandt J. FOXO proteins regulate
tumor necrosis factor-related apoptosis inducing ligand expression. Implications for
PTEN mutation in prostate cancer. J Biol Chem. 2002;277:47928-37.
37. Wang F, Marshall CB, Yamamoto K, Li GY, Gasmi-Seabrook GM, Okada H,
et al. Structures of KIX domain of CBP in complex with two FOXO3a transactivation
domains reveal promiscuity and plasticity in coactivator recruitment. Proc Natl Acad
Sci U S A. 2012;109:6078-83.
33
38. Clerc I, Polakowski N, Andre-Arpin C, Cook P, Barbeau B, Mesnard JM, et
al. An interaction between the human T cell leukemia virus type 1 basic leucine zipper
factor (HBZ) and the KIX domain of p300/CBP contributes to the down-regulation of
tax-dependent viral transcription by HBZ. J Biol Chem. 2008;283:23903-13.
39. Tsai KL, Sun YJ, Huang CY, Yang JY, Hung MC, Hsiao CD. Crystal
structure of the human FOXO3a-DBD/DNA complex suggests the effects of
post-translational modification. Nucleic Acids Res. 2007;35:6984-94.
40. Bouillet P, Zhang LC, Huang DC, Webb GC, Bottema CD, Shore P, et al.
Gene structure alternative splicing, and chromosomal localization of pro-apoptotic
Bcl-2 relative Bim. Mamm Genome. 2001;12:163-8.
41. Gilley J, Ham J. Evidence for increased complexity in the regulation of Bim
expression in sympathetic neurons: involvement of novel transcriptional and
translational mechanisms. DNA Cell Biol. 2005;24:563-73.
42. Gilley J, Coffer PJ, Ham J. FOXO transcription factors directly activate bim
gene expression and promote apoptosis in sympathetic neurons. The Journal of cell
biology. 2003;162:613-22.
43. Marks P, Rifkind RA, Richon VM, Breslow R, Miller T, Kelly WK. Histone
deacetylases and cancer: causes and therapies. Nature reviews Cancer. 2001;1:194-202.
44. Fullgrabe J, Kavanagh E, Joseph B. Histone onco-modifications. Oncogene.
2011;30:3391-403.
45. Wang F, Marshall CB, Li GY, Yamamoto K, Mak TW, Ikura M. Synergistic
interplay between promoter recognition and CBP/p300 coactivator recruitment by

34
FOXO3a. ACS chemical biology. 2009;4:1017-27.
46. Egle A, Harris AW, Bouillet P, Cory S. Bim is a suppressor of Myc-induced
mouse B cell leukemia. Proc Natl Acad Sci U S A. 2004;101:6164-9.
47. Paschos K, Smith P, Anderton E, Middeldorp JM, White RE, Allday MJ.
Epstein-barr virus latency in B cells leads to epigenetic repression and CpG methylation
of the tumour suppressor gene Bim. PLoS pathogens. 2009;5:e1000492.
48. Hu MC, Lee DF, Xia W, Golfman LS, Ou-Yang F, Yang JY, et al. IkappaB
kinase promotes tumorigenesis through inhibition of forkhead FOXO3a. Cell.
2004;117:225-37.

35
Table 1
Gene Fold change Gene ontology
API5 2.18 anti-apoptosis
BCL2L11 (Bim) -9.93 induction of apoptosis
CARD11 2.87 regulation of apoptosis
CASP1 2.97 apoptosis
CD28 4.60 positive regulation of
anti-apoptosis
COP1 9.41 regulation of apoptosis
DEDD2 2.01 induction of apoptosis via death
domain receptors
DYRK2 2.16 induction of apoptosis
GZMB -5.90 apoptosis
HIPK2 2.19 induction of apoptosis by
intracellular signals
NLRP1 3.08 induction of apoptosis
PI3KR2 -2.68 negative regulation of
anti-apoptosis
PLEKHF1 2.99 induction of apoptosis
PRDX2 -2.10 anti-apoptosis
PRF1 3.95 virus-infected cell apoptosis
RFFL 2.20 apoptosis
SPHK1 -4.26 anti-apoptosis
TNFRSF9 -2.61 induction of apoptosis
TP53INP1 2.32 apoptosis
VEGFA -6.96 negative regulation of apoptosis
36
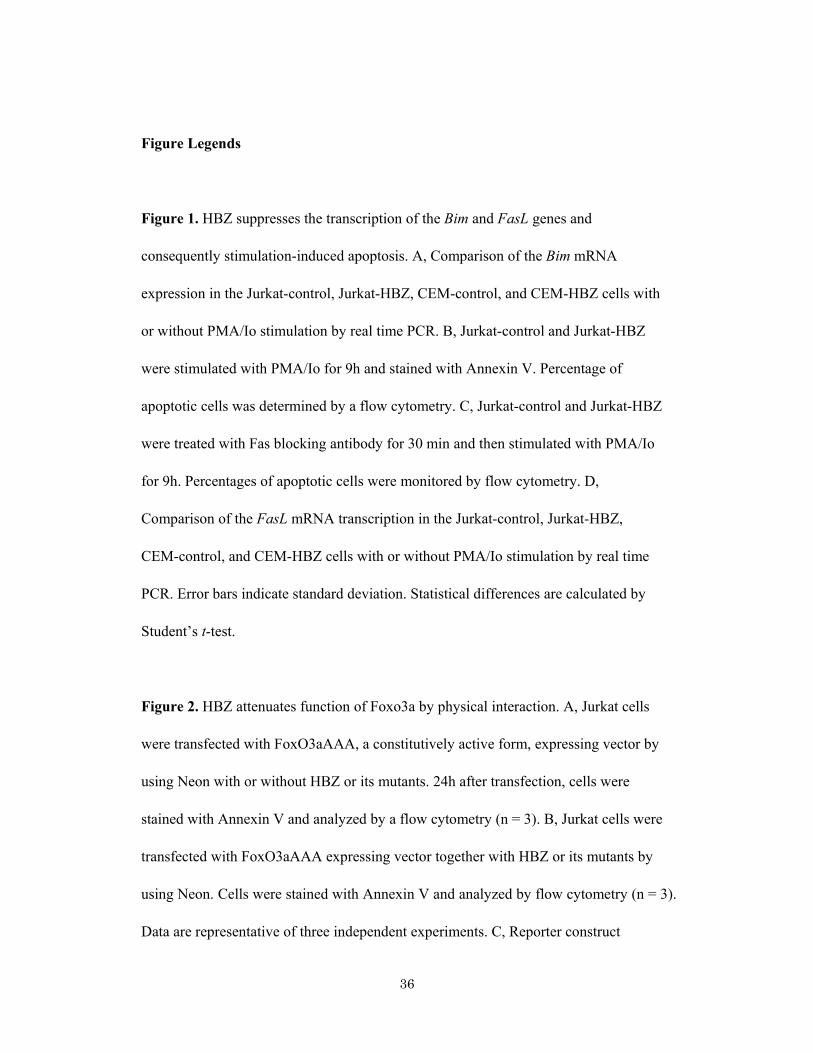
Figure Legends
Figure 1. HBZ suppresses the transcription of the Bim and FasL genes and
consequently stimulation-induced apoptosis. A, Comparison of the Bim mRNA
expression in the Jurkat-control, Jurkat-HBZ, CEM-control, and CEM-HBZ cells with
or without PMA/Io stimulation by real time PCR. B, Jurkat-control and Jurkat-HBZ
were stimulated with PMA/Io for 9h and stained with Annexin V. Percentage of
apoptotic cells was determined by a flow cytometry. C, Jurkat-control and Jurkat-HBZ
were treated with Fas blocking antibody for 30 min and then stimulated with PMA/Io
for 9h. Percentages of apoptotic cells were monitored by flow cytometry. D,
Comparison of the FasL mRNA transcription in the Jurkat-control, Jurkat-HBZ,
CEM-control, and CEM-HBZ cells with or without PMA/Io stimulation by real time
PCR. Error bars indicate standard deviation. Statistical differences are calculated by
Student’s t-test.
Figure 2. HBZ attenuates function of Foxo3a by physical interaction. A, Jurkat cells
were transfected with FoxO3aAAA, a constitutively active form, expressing vector by
using Neon with or without HBZ or its mutants. 24h after transfection, cells were
stained with Annexin V and analyzed by a flow cytometry (n = 3). B, Jurkat cells were
transfected with FoxO3aAAA expressing vector together with HBZ or its mutants by
using Neon. Cells were stained with Annexin V and analyzed by flow cytometry (n = 3).
Data are representative of three independent experiments. C, Reporter construct

37
containing the 6 x DBE and FoxO3aAAA expressing vector was transiently transfected
with or without HBZ into Jurkat cells in the presence of Z-VAD-FMK and luciferase
activities were measured. D, 293T cells were transfected with 6xDBE-Luc construct,
and Flag-tagged FoxO3aAAA expression vector together with or without HBZ
expression vector. Cells were immunoprecipitated with anti-Flag antibody and
quantified by real-time PCR. Three independent ChIP experiments have been done and
a representative data is shown. Error bars indicate experimental variation. E and F, The
expression vectors of the indicated proteins were co-transfected into 293T cells, and
their interactions were analyzed by immunoprecipitation assay. Data are representative
of three independent experiments. Statistical differences are calculated by Student’s
t-test.
Figure 3. HBZ interferes normal localization of FoxO3a by forming ternary complex
with FoxO3a and 14-3-3. 293FT cells were transfected with FoxO3aWT-Flag together
with or without mycHis-HBZ. FoxO3a was detected using anti-Flag-biotin and
secondary Streptavidin-Alexa 488 (A), and p-FoxO3a was detected using
anti-p-FoxO3a (ser253) and secondary anti-rabbit IgG-Alexa 488 antibody (B). DAPI
was used to counterstain the nucleus. C, 293FT cells were transfected with HA-tagged
FoxO3aWT together with or without Flag-tagged HBZ. Cytoplasmatic and nuclear
fraction were extracted and p-FoxO3a was detected by western-blotting. D, Endogenous
localizations of p-FoxO3a (ser253) in HeLa and MT-1 cells were examined using
anti-p-FoxO3a. E, The interactions among HBZ, FoxO3a and 14-3-3 were analyzed by

38
immunoprecipitation.
Figure 4. Bim expression is also suppressed in ATL cell lines and ATL cases.
Comparison of the Bim mRNA expression in non-ATL cell lines and ATL cell lines
with or without PMA/Io stimulation (A) and in PBMCs and PHA-blasts from healthy
donor samples and fresh ATL samples (B) by real time PCR. C, Comparison of the Bim
mRNA expression in healthy donor sample and ATL fresh sample with or without
PMA/Io stimulation.
Figure 5. Epigenetic status of the promoter regions of the Bim gene. A- C, The
presented diagram shows the fold difference of acetylated histone H3, acetylated
histone H4, trimethylated H3K4, dimethylated H3K9, or trimethylated H3K27 where
the data from Jurkat cells was arbitrarily set as 1.0. D, Quantitative ChIP assay using
RNA polymerase II (Pol II) antibody in Jurkat, MT-1and TL-Om1 cells. E, 293T cells
were transfected with HA-tagged FoxO3a expression vector together with or without
HBZ expression vector. Cells were immunoprecipitated with anti-HA antibody and
DNA binding ability at promoter 2 was quantified by real-time PCR. F, The presented
diagram shows the fold difference of acetylated histone H3 in MT-1 cells, which were
treated with or without 0.4 mM TSA for 15h. The data from MT-1 cells without TSA
treatment was arbitrarily set as 1.0. G and H, MT-1 cells were treated with 0.4 mM TSA
for 15h and Bim expression level was analyzed by qRT-PCR and flow cytometry. I, The
presented diagram shows the fold difference of acetylated histone H3 in the Bim
39
promoter in the Jurkat-control and Jurkat-HBZ cells 9h after the stimulation with
PMA/Io. J, HBZ transcript in shRNA transfectant of MT-1 was quantified by real-time
PCR. K, Comparison of the Bim mRNA expression in control MT-1 cells and HBZ-KD
MT-1 cells. Error bars indicate experimental variation. The data shown are
representative of two or three independent experiments. Statistical differences are
calculated by Student’s t-test.
Table 1. Apoptosis-associated genes that are up- or downregulated by HBZ. A list of
apoptosis-associated genes that were down-regulated or up-regulated (by > 2-fold) in
stimulated Jurkat-HBZ cells identified by microarray analysis.
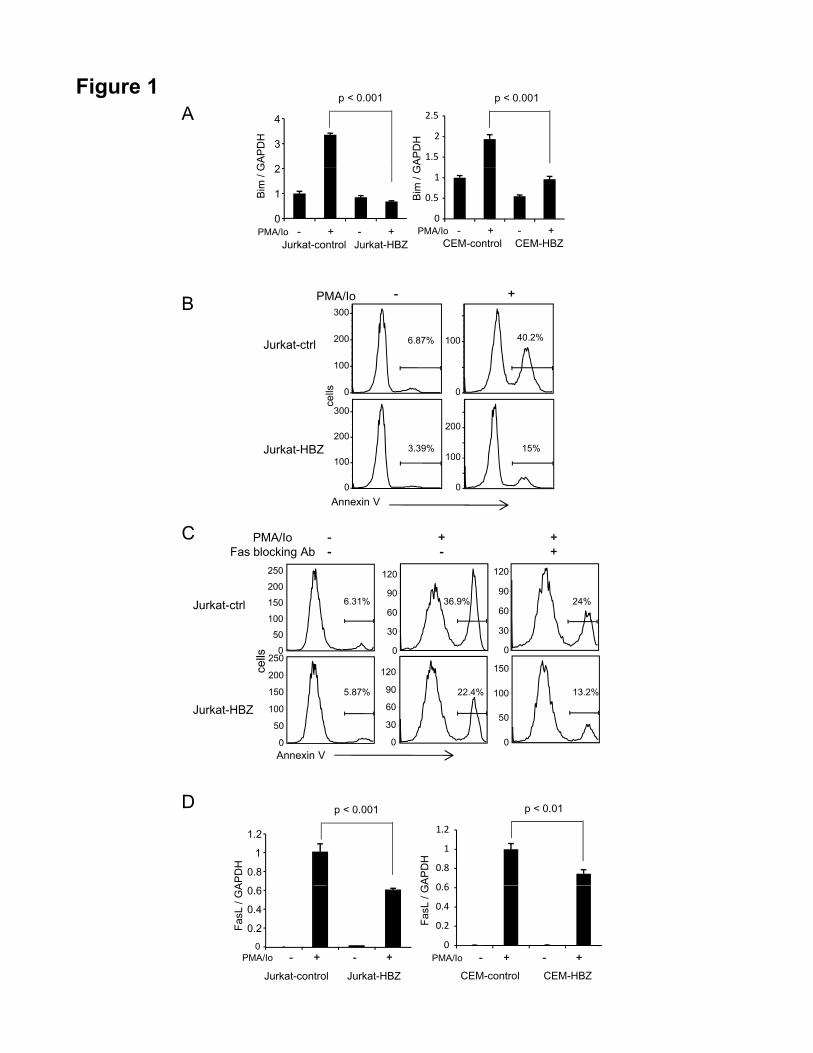
Figure 1A
GA
PD
H
2
3
4
1.5
2
2.5
GA
PD
H
p < 0.001 p < 0.001
Bim
/ G
0
1
2
Jurkat-control Jurkat-HBZPMA/Io - + - +
0
0.5
1
CEM-control CEM-HBZPMA/Io - + - +
Bim
/ G
Bce
lls
PMA/Io - +
0
100
200
300
6.87%
0
100 40.2%Jurkat-ctrl
Annexin V0
100
200
300
3.39%
0
100
200
15%Jurkat-HBZ
C PMA/IoFas blocking Ab
--
+-
++
Jurkat-ctrl
30
60
90
120
24%
30
60
90
120
36.9%
50
100
150
200
250
6.31%
C
Jurkat-HBZ
0
0
50
100
150
200
250
5.87%
0
50
100
150
13.2%
0
30
60
90
120
22.4%
00
cells
Annexin V
D p < 0.001 p < 0.01
0.8
1
1.2
APD
H
0 6
0.8
1
1.2
APD
H
0
0.2
0.4
0.6
Jurkat-control Jurkat-HBZPMA/Io - + - +
FasL
/ G
A
0
0.2
0.4
0.6
CEM-control CEM-HBZPMA/Io - + - +
FasL
/ G
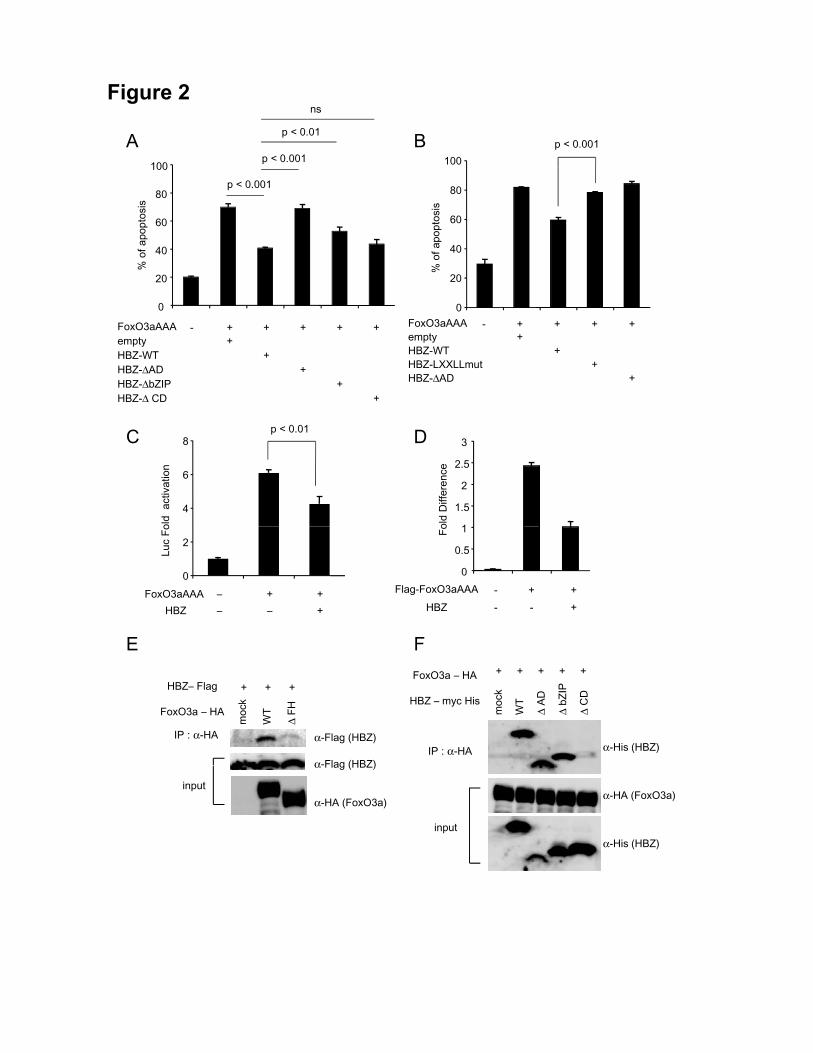
Figure 2
BA100100
p < 0.001
p < 0.01
ns
p < 0.001
20
40
60
80
% o
f apo
ptos
is
20
40
60
80
100
% o
f apo
ptos
is
p < 0.001
0FoxO3aAAA empty HBZ-WT HBZ-LXXLLmut HBZ-ΔAD
++
++
+ + + +-FoxO3aAAA empty HBZ-WT HBZ-ΔAD HBZ-ΔbZIP HBZ-Δ CD
++
++
+
- + + + + +
0
4
6
8p < 0.01
old
act
ivat
ion
C D
1
1.5
2
2.5
3ol
d D
iffer
ence
FoxO3aAAA HBZ
――
+―
++
0
2
Luc
Fo
E F
0
0.5
1
Flag-FoxO3aAAAHBZ
- + +- - +
Fo
IP : α-HA α-His (HBZ)
FoxO3a – HA
HBZ – myc His
+ + + + +
ΔC
D
ΔbZ
IP
ΔAD
WT
moc
k
α-Flag (HBZ)
α-Flag (HBZ)
IP : α-HA
HBZ– Flag
FoxO3a – HA
+ + +
ΔFH
WT
moc
k
E F
input
α-HA (FoxO3a)
α-His (HBZ)
input
α Flag (HBZ)
α-HA (FoxO3a)

Figure 3
HBZ FoxO3a Merge DAPI
HBZ
HBZ p-FoxO3a Merge DAPI
HBZ
A B
HBZuntransfected
HBZ
HBZuntransfected
HBZHBZtransfected
HBZtransfected
C D p-FoxO3a Merge DAPI
MT-1
FoxO3a – HA
HBZ – Flag
+ + + +- + - +
p-FoxO3a
Cytosol Nuclear
HeLa
FoxO3a
α-Tubulin
HistonH1
FoxO3a – HA14-3-3 – Flag
HBZ – myc His
+ + + + ++ + + + +
ΔC
D
ΔbZ
IP
ΔAD
WT
moc
k
E
IP : α-Flag
α-HA (FoxO3a)
α-His (HBZ)
α-HA (FoxO3a)
inputα-Flag (14-3-3)
α-His (HBZ)
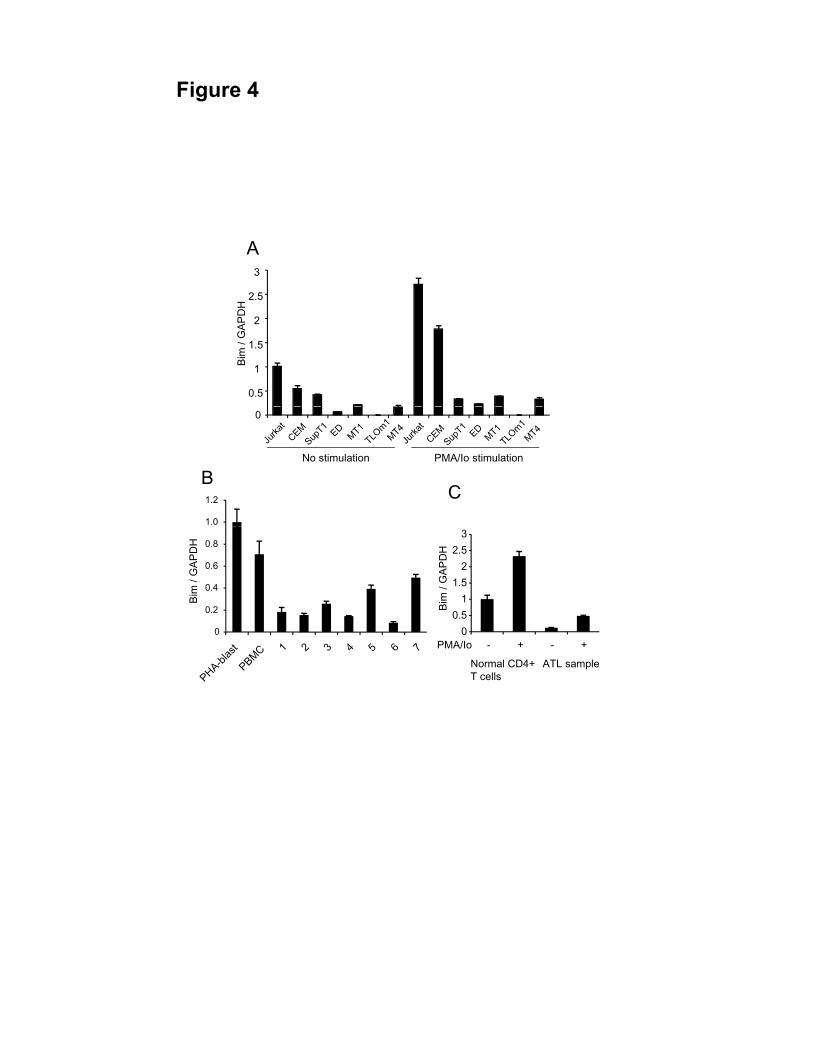
Figure 4
A3
0.5
1
1.5
2
2.5
Bim
/ G
APD
H
B
1.0
1.2
No stimulation PMA/Io stimulation
0
C
0
0.2
0.4
0.6
0.8
Bim
/ G
AP
DH
00.5
11.5
22.5
3
Bim
/ G
APD
H
PMA/Io - + - +
Normal CD4+ T cells
ATL sample
PMA/Io - + - +
A B
Figure 5
3 2M H3K9
C35 3M H3K27
2.5Jurkat
MT-1
0
0.5
1
1.5
2
2.5
3
Fold
Diff
eren
ce
2M H3K9
05
101520253035 3M H3K27
Fold
Diff
eren
ce
0
0.5
1
1.5
2
Fold
Diff
eren
ce
TL-Om1
D
0Jurkat MT1 TL-Om1 Jurkat MT1 TL-Om1
1
1.5 Pol II
renc
e
Ac H3 Ac H4 3M H3K4
6
8
eren
ce
E
3
4
renc
e
i) ii)
0
0.5
Jurkat MT1 TL-Om1
Fold
Diff
er
0
2
4
Fold
Diff
e
FoxO3a HBZ-WT
- + +- - +
1
2
0
- + +- - +
Fold
Diff
e
GAPDH BimTSA - + - +
Ac H3F
40
60
80
100
% o
f Max
TSA(–)TSA(+)
G H
2
3
4
5
old
Diff
eren
ce
0
20
Bim
I1 2 2 5
J K1 2
Ac H3
0
1
TSA (-) TSA (+)
Fo
p < 0.001 p < 0.001
HBZ
/ G
APD
H
0 2
0.4
0.6
0.8
1
1.2
0.5
1
1.5
2
2.5
Bim
/ G
APD
H
0 2
0.4
0.6
0.8
1
1.2
Fold
Diff
eren
ce
0
0.2
ShCtrl ShHBZ0
ShCtrl ShHBZ0
0.2
Jurkat-Ctrl(+) Jurkat-HBZ(+)
Supplementary Data
Supplementary Figure S1
HBZ also inhibited Doxorubicin-induced cell death. Jurkat-control and Jurkat-HBZ
were treated with Doxorubicin (1μΜ) for 24h and the percentages of apoptotic cells
were monitored by flow cytometry.
Supplementary Figure S2
(A) FoxO3a transcript in shRNA transfectant of Jurkat was quantified by real-time PCR.
(B) Percentage of apoptotic cells in Jurkat-control and Jurkat-HBZ which were
transfected with shRNA plasmid and 48h after the transfection, stimulated with PMA/Io
for 9h. Cells were then stained with Annexin V and monitored by flow cytometry.
Supplementary Figure S3
Expression of the TP73 gene mRNA. (A) Comparison of the TP73 mRNA expression in
the Jurkat-control and Jurkat-HBZ with or without PMA/Io stimulation. (B) Comparison
of the TP73 mRNA expression between non ATL cell lines and ATL cell lines.
Supplementary Figure S4
Comparison of the HBZ mRNA expression in Jurkat-HBZ, CEM-HBZ and ATL cell
lines.
Supplementary Figure S5
The results of GSE33615 affymetrix microarray data in Bim (ID 32463) and FasL (ID
6706) genes, which were normalized to GAPDH (ID 40390).
Supplementary Figure S6
DNA methylation in the promoter region of the Bim gene. (A) Schematic of the Bim
promoter and CpG island. (B) Bisulfite-mediated methylcytosine mapping of ATL cell
lines, fresh samples, and healthy donor samples. Nonmethylated CpG dinucleotides are
shown by an empty circle, whereas methyl-CpG is shown by filled circles.
Supplementary Figure S7
Epigenetic status of the promoter1 of the Bim gene. Epigenetic status of just upstream of
the transcriptional start site was analyzed. (A, B) The presented diagram shows the fold
difference of acetylated histone H3, acetylated histone H4, trimethylated H3K4,
dimethylated H3K9, or trimethylated H3K27 where the data from Jurkat cells was
arbitrarily set as 1.0. (C) Quantitative ChIP assay using RNA polymerase II (Pol II)
antibody in Jurkat, MT-1, and TL-Om1 cells.
p < 0.05
0
20
4060
80
100
D bi i + +
% o
f apo
ptos
is
Jurkat-control Jurkat-HBZDoxorubicin - + - +
Supplementary Figure S1
1
1.2
1.4
H
A B
50
60
70
Jurkat-ctrl Jurkat-HBZ
p < 0.05
PMA/Io stimulation - - + + - - + +
p < 0.001
0
0.2
0.4
0.6
0.8
1
shCtrl shFoxO3a
FoxO
3a /
GA
PD
H
0
10
20
30
40
50
% o
f apo
ptos
is
shCtrl shFoxO3a
Supplementary Figure S2
0
3 / G
AP
DH
A B
0.6
0.8
1.0
1.2
1
1.5
3 / G
AP
DH
TP73
Jurkat-control Jurkat-HBZPMA/Io - + - +
0
0.2
0.4
0
0.5 TP7
n.d. n.d. n.d. n.d.
Supplementary Figure S3
1
2
3
4
5
6
HBZ
/ G
APD
H
Supplementary Figure S4
0JurkatHBZ
CEMHBZ
ED TLOm1MT1
Supplementary Figure S4
xpre
ssio
n
p<0.0001
10
15
Rel
ativ
e ex
ATL normal0
5
BCL2L11
10.0
p<0.0001
BCL2L11
Rel
ativ
e ex
pres
sion
2.5
5.0
7.5
ATL normal0.0
FasLG
Supplementary Figure S5
A Transcription initiation site (+1)
Start codon(+2833)
Bisulfite sequencingPromoter 1 (-404/-36)
Bisulfite sequencingPromoter 2 (2092/2522)
B
ChIP (-302/-144) ChIP (2332/2520)
CpG Island
Exon 1 Exon 2
Promoter 1 Promoter 2
Jurkat
B Promoter 1 Promoter 2
ED
TL-Om1
MT-1
ATL case 1
ATL case 5
ATL case 6
Healthy donordonor
Supplementary Figure S6
A
1
1.5
JurkatMT-1D
iffer
ence
B0
0.5
Ac H3 Ac H4 3M H3K4
MT-1TL-Om1
20
Fold
D
0
5
10
15
2M H3K9 3M H3K27
JurkatMT-1TL-Om1Fo
ld D
iffer
ence
C
0 5
1
1.5
Diff
eren
ce
0
0.5
Fold
Supplementary Figure S7