HTGR Plant Design - International Atomic Energy Agency · PDF filePlant load factor 90%...
24
HTGR Plant Design Hiroyuki Sato Japan Atomic Energy Agency Training Course on High Temperature Gas-cooled Reactor Technology October 19-23, Serpong, Indonesia
Transcript of HTGR Plant Design - International Atomic Energy Agency · PDF filePlant load factor 90%...
HTGR Plant Design
Hiroyuki Sato
Japan Atomic Energy Agency
Training Course on
High Temperature Gas-cooled Reactor Technology
October 19-23, Serpong, Indonesia

p.2
General features
• A Generation IV system
• Cooperative design of JAEA and domestic
industries (MHI, Fuji electric, KHI, etc.)
• Multiple applications, passive safety,
compelling economics, flexible plant siting
• Near-term deployable
Plant Design
• Plant is designed to minimize R&D and to
obtain compelling economics
• Original design features of conventional
steel pressure vessel, non-intercooled
direct cycle, horizontal gas turbine
• Water or air coolable
Reactor power plant H2 plant
Reactor
Helium gas
turbine
Thermal rating: 600 MW
Net electricity: up to 300MWe
Hydrogen rate: up to 5.2 t/hr
Non-intercooled,
horizontal gas turbine
Turbine Compressor
Inherent RPV
cooling scheme
140oC
0.5% of
main flow
Dry cooling configuration
Gas turbine
Reactor
Recuperator
Air cooler Precooler
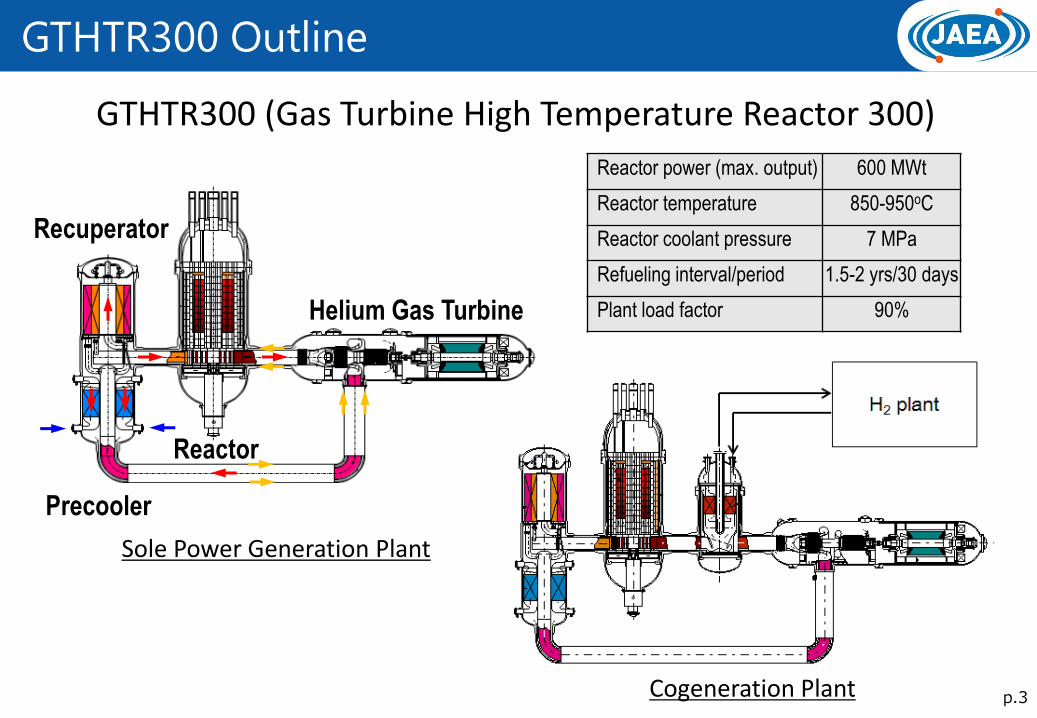
GTHTR300: JAEA’s Commercial HTGR
p.3
GTHTR300 Outline
Reactor
Helium Gas Turbine
Recuperator
Precooler
Reactor power (max. output) 600 MWt
Reactor temperature 850-950oC
Reactor coolant pressure 7 MPa
Refueling interval/period 1.5-2 yrs/30 days
Plant load factor 90%
GTHTR300 (Gas Turbine High Temperature Reactor 300)
Sole Power Generation Plant
Cogeneration Plant
p.4
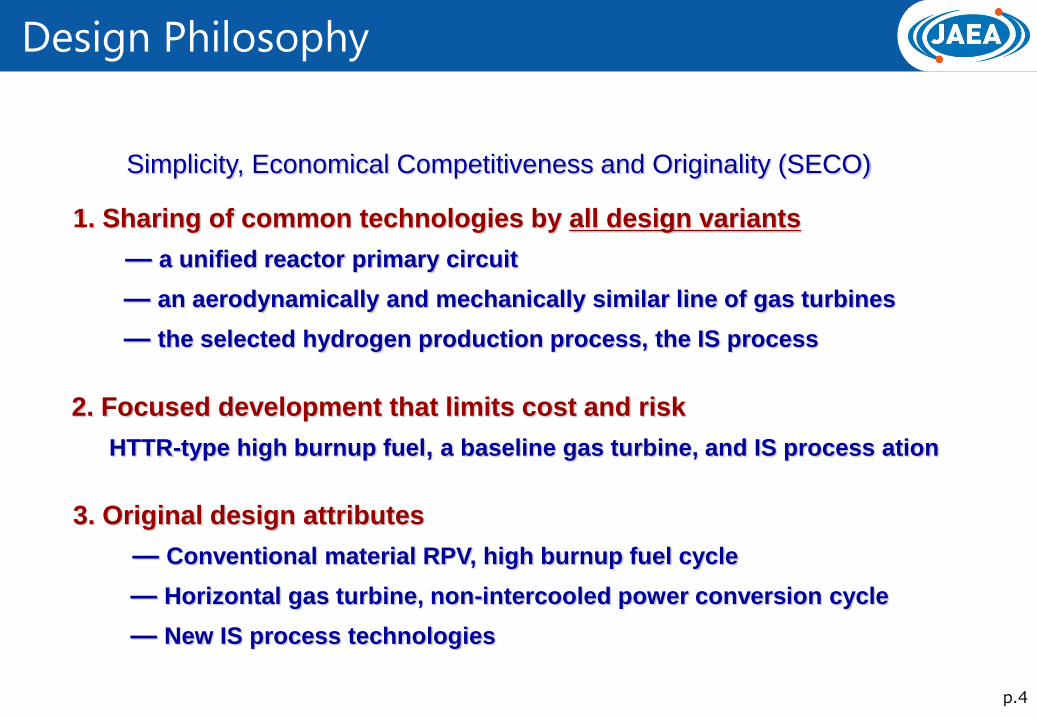
Design Philosophy
Simplicity, Economical Competitiveness and Originality (SECO)
1. Sharing of common technologies by all design variants
— a unified reactor primary circuit
— an aerodynamically and mechanically similar line of gas turbines
— the selected hydrogen production process, the IS process
2. Focused development that limits cost and risk
HTTR-type high burnup fuel, a baseline gas turbine, and IS process ation
3. Original design attributes
— Conventional material RPV, high burnup fuel cycle
— Horizontal gas turbine, non-intercooled power conversion cycle
— New IS process technologies

p.5
Design Features
K. Kunitomi, JAEA-Conference 2007-005 (2007).
p.6
System Configuration, Reactor
Turbine Compressor
Generator
Reactor
Recuperator
Precooler
588oC
136oC, 7.0 MPa
850oC
28oC, 3.5 MPa
22oC
Reactor bird’s eye view (GTHTR300)
Plant Layout (GTHTR300)
RPV
Standpipe
Core barrel
Hot plenum block
Control rod guide tube
Core support plate
Upper shroud

p.7
Core, Fuel Element
Permanent side reflector
Fuel block
Control rod guide block
Outer replaceable reflector
Control rod insertion hole
Reserve shut down channel
Inner replaceable reflector
Core horizontal cross section (GTHTR300)
Fuel block & fuel rod cross sections (GTHTR300)
Fuel block
Fuel compact
Coolant channel
Bottom plate
Upper plate
Center rod
Helium coolant
Spacerダウエル
A
Fuel channel
Dowel pin
Fuel brock handling hole
Fuel rod vertical cross section
Fuel brock horizontal cross section

p.8
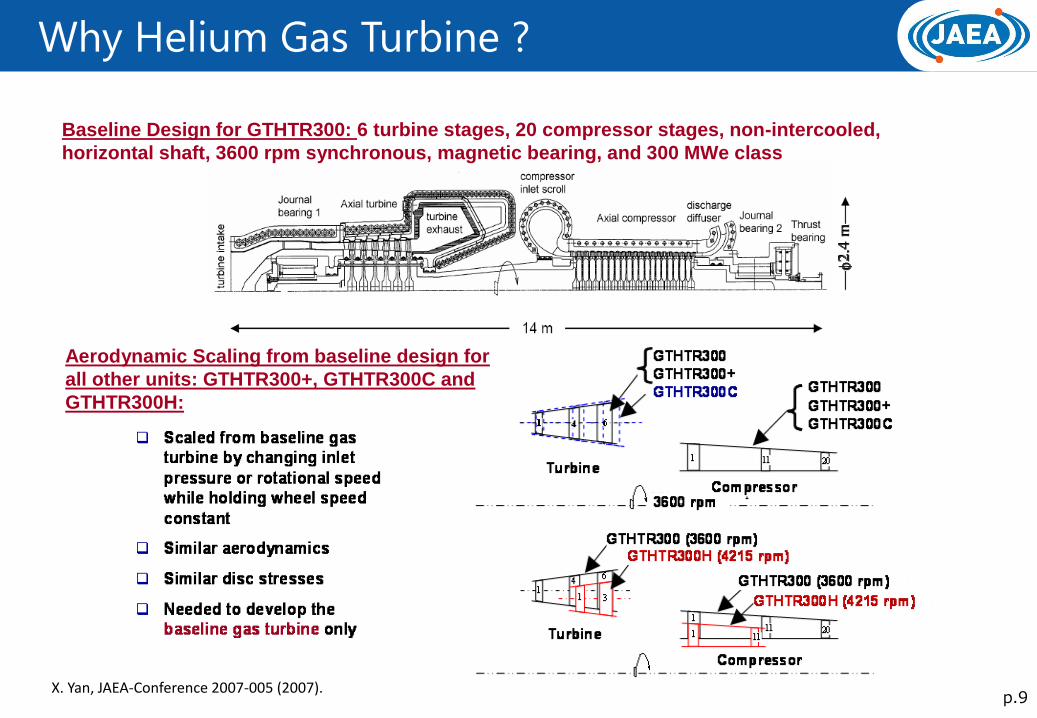
Why Helium Gas Turbine ?
Most efficient and economical power generation possible by HTGR
Direct Brayton cycle helium turbine enables 50% efficiency at
least count of components
Wide range of heat application without drawbacks in efficiency
Cogeneration of desalination, which utilizes sensible waste heat
rejected of Brayton power generation cycle can attain overall energy
efficiency of 88%
Exclusion of water related safety events
High temperature waste heat rejection enables efficient dry cooling
which can eliminate core water ingress accident and
allow inland installation
1
2
3
p.9
Why Helium Gas Turbine ?
Aerodynamic Scaling from baseline design for
all other units: GTHTR300+, GTHTR300C and
GTHTR300H:
Baseline Design for GTHTR300: 6 turbine stages, 20 compressor stages, non-intercooled,
horizontal shaft, 3600 rpm synchronous, magnetic bearing, and 300 MWe class
X. Yan, JAEA-Conference 2007-005 (2007).

p.10
Helium Gas Turbine Outline
3. Helium compressor
aerodynamics R&D:
Program nearly
completed
2. Helium turbine
aerodynamics R&D:
Designed and
partially built
4. Magnetic bearing
design and control:
Test rig under
commissioning
1. Brayton cycle
helium gas loop:
Designed and
partially constructed
Only R&D on the baseline design is necessary (see design philosOnly R&D on the baseline design is necessary (see design philosophy)ophy)
JAEAJAEA’’ss R&D activities:R&D activities:
11
X. Yan, JAEA-Conference 2007-005 (2007).
p.11
Compressor Aerodynamics R&D
The R&D Goal
Development of high performance helium compressor for VHTR
The Results
1. Proposal of original design techniques
The Background
Neither successful helium compressor nor proven design existed, prior
to the present program !
2. 1/3 of full scale compressor tests
3. Establishment of performance evaluation methods
X. Yan, JAEA-Conference 2007-005 (2007).
p.12
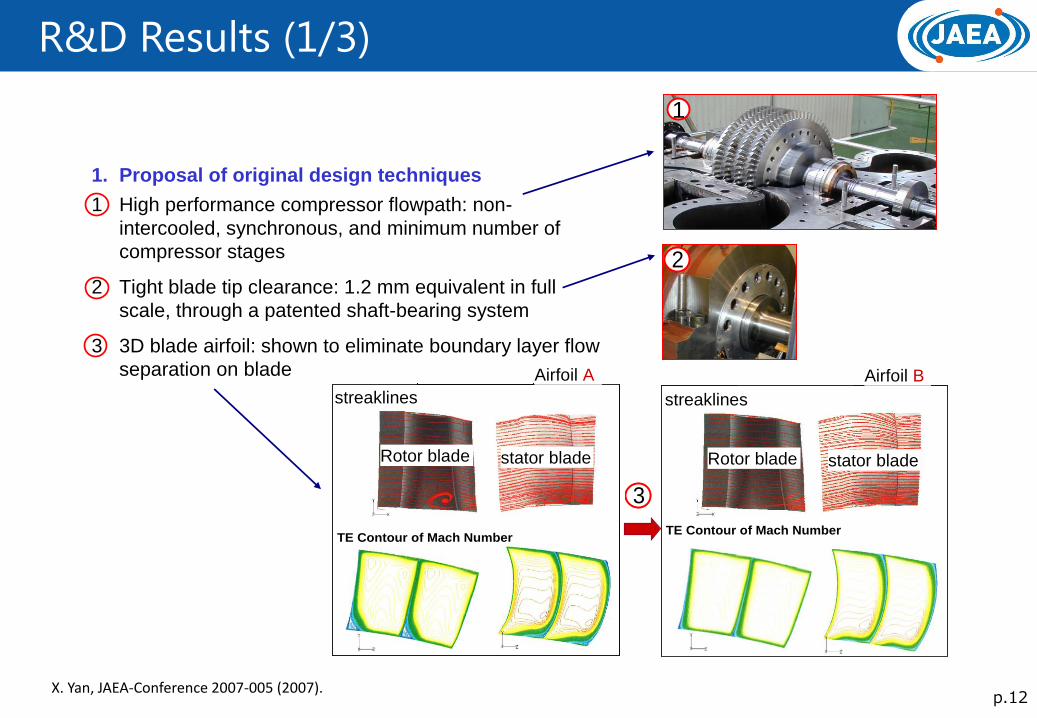
R&D Results (1/3)
1. Proposal of original design techniques
1 High performance compressor flowpath: non-
intercooled, synchronous, and minimum number of
compressor stages
2 Tight blade tip clearance: 1.2 mm equivalent in full
scale, through a patented shaft-bearing system
3 3D blade airfoil: shown to eliminate boundary layer flow
separation on blade
11
Steaklines
TE Contour of Mach Number
1S 1C
CASE-1 0.539MPa
Steaklines
TE Contour of Mach Number
1S 1C
CASE-1 0.539MPa
Steaklines1S 1C
CASE-2 0.539MPa
TE Contour of Mach Number
Steaklines1S 1C
CASE-2 0.539MPa
TE Contour of Mach Number
Airfoil Case-A Airfoil Case-B
The Results (1/3)
streaklines streaklines
Rotor blade stator blade Rotor blade stator blade
Airfoil A Airfoil B
33
3322
X. Yan, JAEA-Conference 2007-005 (2007).

p.13
R&D Results (2/3)
2. 1/3 of full scale compressor tests
1) Internal flowpath boundary layer measurements
2) Airfoil performance measurements
3) Inlet/outlet casing geometry performance measurements
4) Compressor efficiency and surge margin
Helium compressor test rig
Detailed internal flowpath
measurement of aerodynamic variables
X. Yan, JAEA-Conference 2007-005 (2007).

Correlation of efficiency with
Reynolds number, Re-n, subject
to critical Reynolds number
Extensive test measurements
Viscous CFD analytical insights to
identify flow regimes
Efficiency vs. Reynolds Number Correlation
for Blade Section (from Case-1 all runs & Case-2 run1 measurement)
Reynolds number
Airfoil Case 1: Inlet A
Airfoil Case 1: Inlet B
Airfoil Case 2: Inlet B
Airfoil Case 2: Inlet C
1-ηp ~ Re-0.35
80
82
84
86
88
90
92
94
105
Re,critcal=1.2x10⁶ for full scale
Re,critcal=4x10⁵ for 1/3 scale
Re extrapolation
(full scale, 4 stages)
Throughflow prediction
(full scale, 20 stages)
Efficiency
pinch point
Po
lytr
op
ic E
ffic
ien
cy (
ηp,
%)
2 106
1074 6 8 2 4 6 8
Existing methods
New method
87%
92%
Efficiency vs. Reynolds Number Correlation
for Blade Section (from Case-1 all runs & Case-2 run1 measurement)
Reynolds number
Airfoil Case 1: Inlet A
Airfoil Case 1: Inlet B
Airfoil Case 2: Inlet B
Airfoil Case 2: Inlet C
1-ηp ~ Re-0.35
80
82
84
86
88
90
92
94
105
Re,critcal=1.2x10⁶ for full scale
Re,critcal=4x10⁵ for 1/3 scale
Re extrapolation
(full scale, 4 stages)
Throughflow prediction
(full scale, 20 stages)
Efficiency
pinch point
Po
lytr
op
ic E
ffic
ien
cy (
ηp,
%)
2 106
1074 6 8 2 4 6 8
Existing methodsExisting methods
New method
87%
92%3. Establishment of performance
evaluation methods
The Results (3/3 B)
B. Reynolds Correlation method
87%
92% 46.0%
43.5%
Compressor
efficiencyOverall plant
efficiency
Compressor performance
impact on plant efficiency
87%
92% 46.0%
43.5%
Compressor
efficiencyOverall plant
efficiency
Compressor performance
impact on plant efficiency
87%
92% 46.0%
43.5%
Compressor
efficiencyOverall plant
efficiency
Compressor performance
impact on plant efficiency
new method
existing method
p.14
R&D Results (3/3)
X. Yan, JAEA-Conference 2007-005 (2007).
Poly
tro
ph
ic e
ffic
ien
cyη
p, %
90
95
100
85
80105 106 107
92%
88%
n
p
Re1 ~
Critical Re in 1/3 scale test
Reynolds number
Correlation of efficiency based on test data
Efficiency pinch point for commercial GT
Efficiency pinch point for 1/3 scale test
Critical Re in commercial GT
Chord Re in commercial GT

p.15
Building Size Comparison
GTHTR300 (275MWe×4) BWR-5 (1100MWe)
★Building Capacity:674,000 m3
・Reactor + Affiliation:354,000 m3
・Turbine:320,000 m3
24 m
47 m
119 m
11 m
Turbine Building
45 m
68.5 m
80 m
53 m
76 m
A
A
Reactor Building Turbine Building
A-A断面
22 m
93.7 m
★建屋容積:485,000 m3
109.2 m
84.0 m
★Building capacity:533,000 m3
79 % of BWR-5
K. Kunitomi, JAEA-Conference 2007-005 (2007).

p.16
Safety Analysis (1/2)
-6
-5
-4
-3
-2
-1
0
1
2
3
4
5
200 400 600 800 1000 1200 1400 1600 1800 2000 2200Temperature (℃)
Axi
al d
ista
nce (
m)
0hr30hr70hr120hr200hr1000hr5000hr10000hr系列2系列3系列4系列5
Fuel region
Lower reflector
Upper reflector
Air inlet
Air outlet
Stack
Downward air flow(natural circulation)
Concrete biological shield
Insulator
Cooling panels
Reactorpressurevessel
Upward air flow(natural circulation)
Heat removal by radiation and natural circulation
Max. fuel temp. < Limit temp. (1600oC)
Decay heat is removed passively from the outside of RPV
Temperature distribution in GTHTR300 during DLOFC
K Katanishi et al., Nucl. Eng. Des.,237, 1372-1380 (2007).
p.17
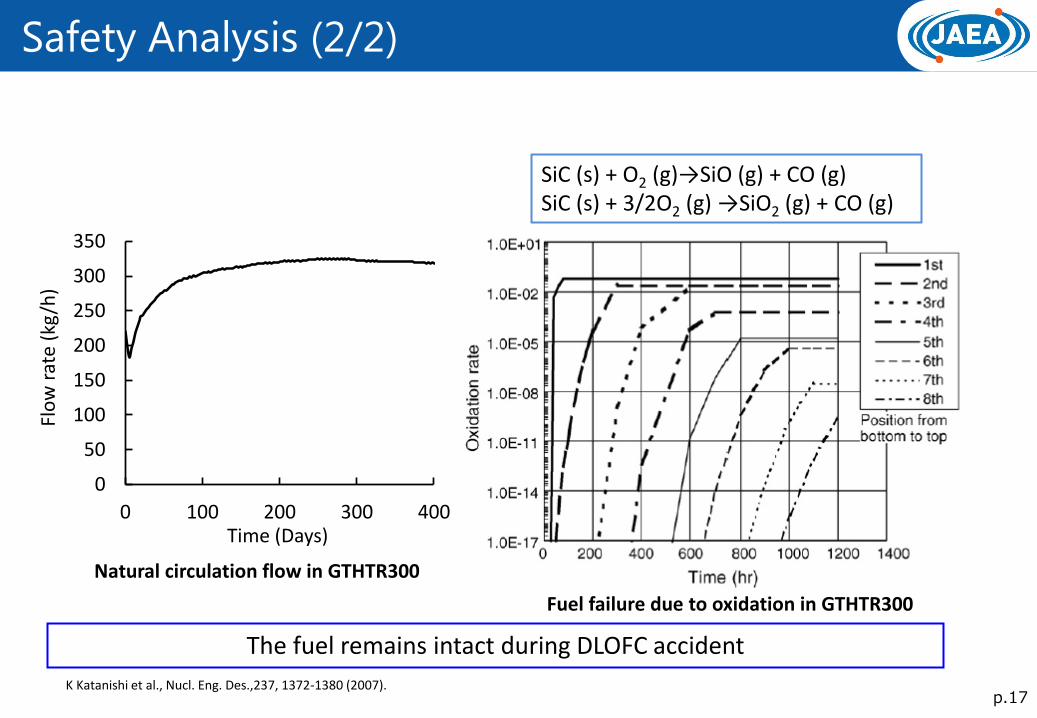
Safety Analysis (2/2)
SiC (s) + O2 (g)→SiO (g) + CO (g) SiC (s) + 3/2O2 (g) →SiO2 (g) + CO (g)
The fuel remains intact during DLOFC accident
Fuel failure due to oxidation in GTHTR300
0
50
100
150
200
250
300
350
0 100 200 300 400
Natural circulation flow in GTHTR300
Time (Days)
Flo
w r
ate
(kg
/h)
K Katanishi et al., Nucl. Eng. Des.,237, 1372-1380 (2007).

p.18
Economics (1/2)
Analysis condition (plant specifications) GTHTR3001): Commercial HTGR designed by JAEA in cooperation with reactor vendors
- plant unit: 4 units/plant - plant power: thermal power 600MWt/unit
electric power ~275MWe/unit (gross) ~269MWe/unit (net)
- average burn-up: 120GWd/ton
Key assumption – Construct at current LWR site – Take into account standardization of design,
related codes & standards, operation & maintenance practices, components, regulatory, and project management
– equipment directly carried from an on-site exclusive port
– a reactor building and structures based on those of the HTTR – seismic condition same as that of the HTTR – including design and fabrication of facilities, plant construction cost and test operations
p.19
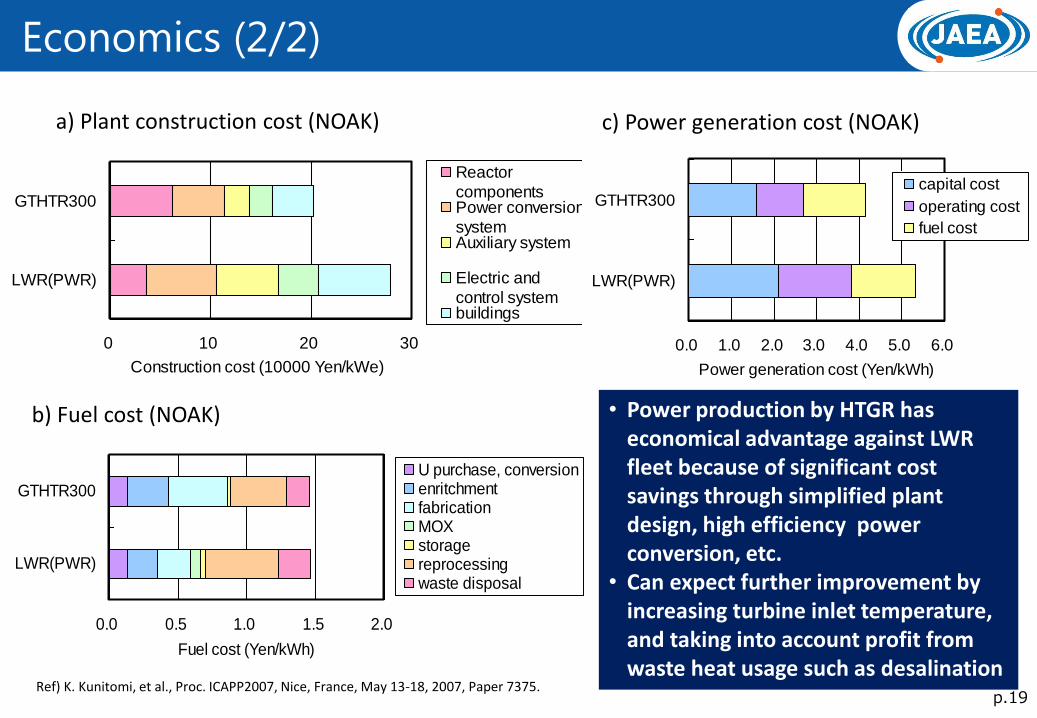
Economics (2/2)
19
a) Plant construction cost (NOAK)
b) Fuel cost (NOAK)
c) Power generation cost (NOAK)
0 10 20 30
LWR(PWR)
GTHTR300
Construction cost (10000 Yen/kWe)
Reactor
componentsPower conversion
systemAuxiliary system
Electric and
control systembuildings
0.0 1.0 2.0 3.0 4.0 5.0 6.0
LWR(PWR)
GTHTR300
Power generation cost (Yen/kWh)
capital cost
operating cost
fuel cost
0.0 0.5 1.0 1.5 2.0
LWR(PWR)
GTHTR300
Fuel cost (Yen/kWh)
U purchase, conversionenritchmentfabricationMOXstoragereprocessingwaste disposal
Ref) K. Kunitomi, et al., Proc. ICAPP2007, Nice, France, May 13-18, 2007, Paper 7375.
• Power production by HTGR has economical advantage against LWR fleet because of significant cost savings through simplified plant design, high efficiency power conversion, etc.
• Can expect further improvement by increasing turbine inlet temperature, and taking into account profit from waste heat usage such as desalination
p.20
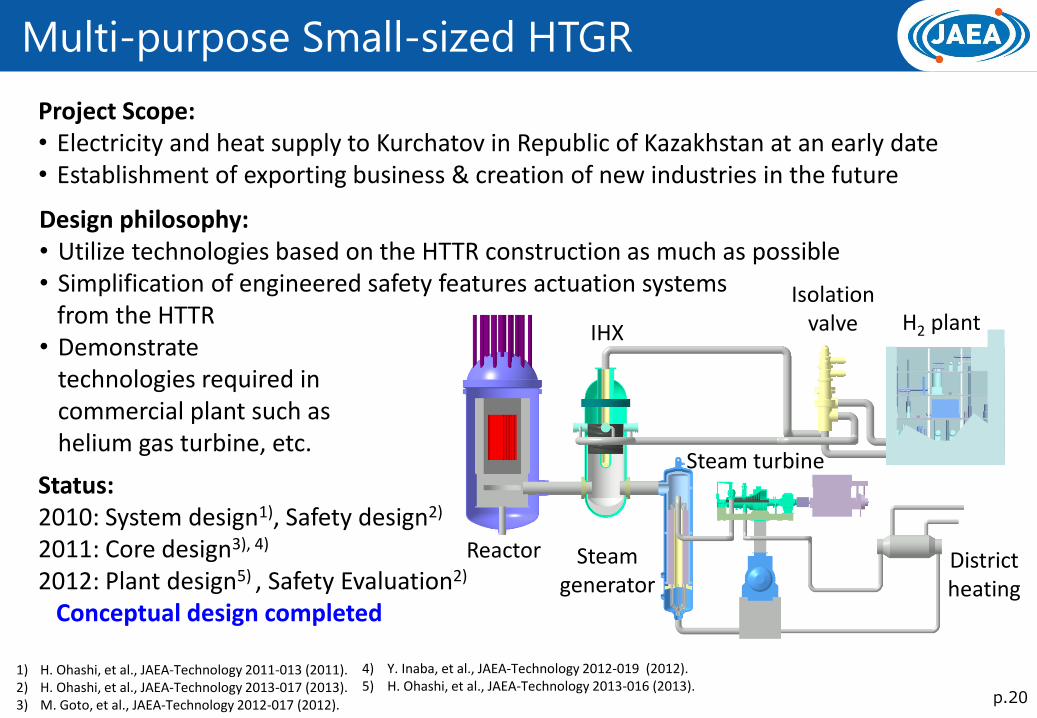
Multi-purpose Small-sized HTGR
Reactor
IHX
Steam generator
Steam turbine
Isolation valve H2 plant
District heating
Project Scope: • Electricity and heat supply to Kurchatov in Republic of Kazakhstan at an early date • Establishment of exporting business & creation of new industries in the future
Status: 2010: System design1), Safety design2)
2011: Core design3), 4)
2012: Plant design5) , Safety Evaluation2)
Conceptual design completed
1) H. Ohashi, et al., JAEA-Technology 2011-013 (2011). 2) H. Ohashi, et al., JAEA-Technology 2013-017 (2013). 3) M. Goto, et al., JAEA-Technology 2012-017 (2012).
4) Y. Inaba, et al., JAEA-Technology 2012-019 (2012). 5) H. Ohashi, et al., JAEA-Technology 2013-016 (2013).
Design philosophy: • Utilize technologies based on the HTTR construction as much as possible • Simplification of engineered safety features actuation systems from the HTTR • Demonstrate
technologies required in commercial plant such as helium gas turbine, etc.
p.21
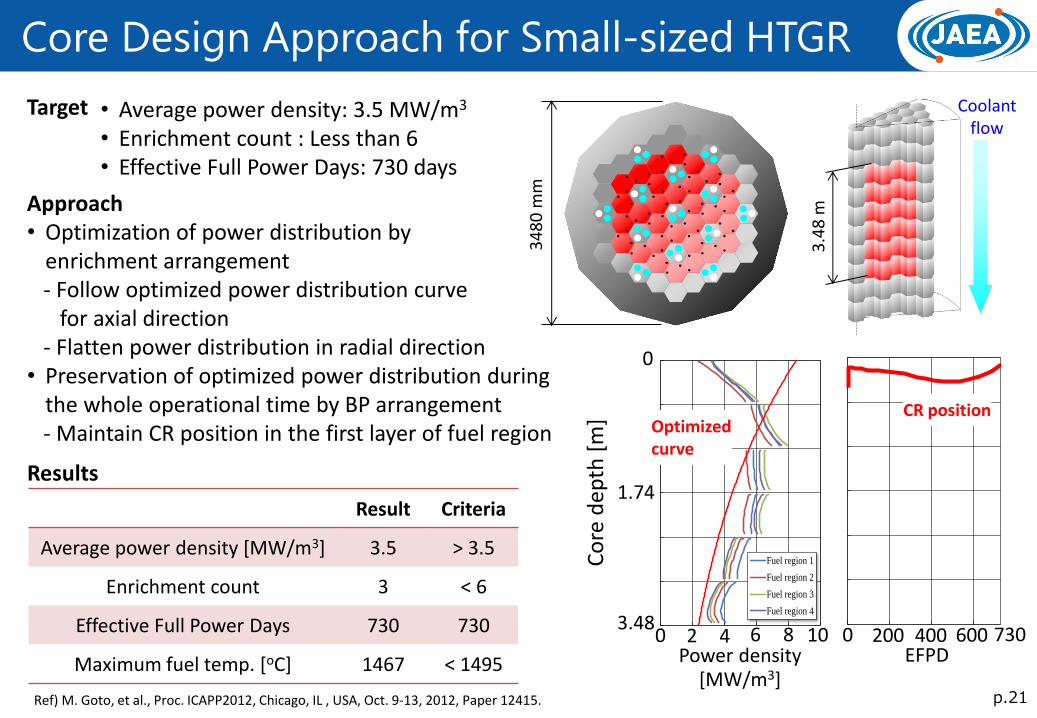
Core Design Approach for Small-sized HTGR
Result Criteria
Average power density [MW/m3] 3.5 > 3.5
Enrichment count 3 < 6
Effective Full Power Days 730 730
Maximum fuel temp. [oC] 1467 < 1495
Target
Approach • Optimization of power distribution by
enrichment arrangement - Follow optimized power distribution curve for axial direction - Flatten power distribution in radial direction • Preservation of optimized power distribution during
the whole operational time by BP arrangement - Maintain CR position in the first layer of fuel region
• Average power density: 3.5 MW/m3
• Enrichment count : Less than 6 • Effective Full Power Days: 730 days
Coolant flow
Results
3.4
8 m
34
80
mm
0
58
116
174
232
290
348
0 200 400 600
Core
heig
ht
(cm
)
Burn-up (EFPD)
Co
re d
ep
th [
m]
0
3.48
1.74
CR position
EFPD 0 730
0
58
116
174
232
290
348
0 2 4 6 8 10C
ore
heig
ht
(cm
)
Power density (W/cc)
Fuel region 1
Fuel region 2
Fuel region 3
Fuel region 4
400 200 Power density
[MW/m3]
0 10 8 6 4 2 600
Optimized curve
Ref) M. Goto, et al., Proc. ICAPP2012, Chicago, IL , USA, Oct. 9-13, 2012, Paper 12415.

p.22
Business Model for Small-sized HTGR (1/2)
Gas to liquids (GTL) is a refinery process to convert natural gas into liquid synthetic fuels such as gasoline or diesel fuel.
Manufacturing cost highly depends on raw material cost, i.e. natural gas price.
HTGR can contribute to reduce natural gas consumption by 30% by replacing its use for fuel with high temperature heat & steam from HTGR.
Air Separation Gas processing
Gas Synthesis
FT(Fischer-Tropsch) process
Upgrading Process
Natural Gas Air
Diesel Naphtha Parafin
High temperature heat
Steam
HTGR GTL process
850oC
200oC - 350oC
0
10
20
30
40
50
1.0 2.0 3.0 4.0 Natural gas price [$/MMBTu]
44% 61%
70% 76%
Man
ufa
ctu
rin
g co
st [
$/b
bl]
Plant size: 15,000 bbl/day Construction cost: 488 M$ Lifetime: 15 years
*Pertamania & JOGMEC, Feasibility study of Gas to Liquid technology (2003).
Natural gas Synthetic fuel
Fuel use / Loss
Material 70%
30% Replace by heat supplied from HTGR
Raw material cost
Operation cost
Capex

p.23
Business Model for Small-sized HTGR (2/2)
Analysis condition - Reactor thermal power: 200MW - Construction cost: $2B (Conservative
assumption) - Fuel & O&M cost: Based on literature*
- Heat utilization: 90%
*INL, TEV-1196 (2012)
0
20
40
60
80
100
120
140
HTGR+GTL general GTL Diesel
Natural gas export loss
Diesel
HTGR (Fuel)
HTGR (O&M)
HTGR (Capital)
GTL (Non gas O&M)
GTL (Capital)
GTL (Gas usage)HTGR+GTL GTL Diesel
Man
ufa
ctu
rin
g co
st [
$/b
bl]
0
20
40
60
80
100
120
140
Analysis results • Manufacturing cost of HTGR-GTL
combined process becomes low considering export loss of natural gas even the construction cost of HTGR becomes high.
• The break-even point of natural gas price is 8.8 USD/MMBtu considering export loss.
Natural gas price: 10 USD/MMBtu
HTGR-GTL combined process would be economically competitive against conventional oil refinery & general GTL process
Man
ufa
ctu
rin
g c
ost
[$
/bb
l]
0
50
100
150
200
250
2 4 6 8 10 12 14 16 18 20 Natural gas price [$/MMBTu]
HTGR+GTL
GTL w export loss
$8.8/MMBTu
p.24
Nuclear Renewable Hybrid System
Time
Short time-scale (seconds/minitues)
Adjust power generation rate by
coolant flow rate control corresponding
to renewable output variation.
Nuclear
Solar,
Wind
Nuclear renewable hybrid system with HTGR cogeneration system for electricity and hydrogen
Constant
power
+ Constant power
Hydrogen
Ele
ctr
ic p
ow
er
H2 plant
Precooler
Recuperator
Power generation
rate control
Heat supply
rate control
Control flow
Coolant flow
IHX
Renewable energy power plant
Reactor
Core
Allowable core thermal capacitance: 850 MJ/oC
Power
synthesisConstant
power
Electric grid
Coolant inventory Bypass flow rate
Power
output
Power
output
Generator
Gas turbine