Pupil mapping Exoplanet Coronagraphic Observer caao.as.arizona/PECO
A&A 365, 78–89 (2001)DOI: 10.1051/0004-6361:20000328c© ESO 2001
Astronomy&
Astrophysics
HST/NICMOS2 coronagraphic observations of the circumstellarenvironment of three old PMS stars: HD 100546, SAO 206462
and MWC 480?
J. C. Augereau1, A. M. Lagrange1, D. Mouillet1, and F. Menard1,2
1 Laboratoire d’Astrophysique de l’Observatoire de Grenoble, Universite J. Fourier, CNRS, BP 53,38041 Grenoble Cedex 9, France
2 Canada-France-Hawaii Telescope Corporation, PO Box 1597, Kamuela, HI 96743, USA
Received 16 August 2000 / Accepted 29 September 2000
Abstract. The close environment of four old Pre-Main Sequence stars has been observed thanks to the corona-graphic mode of the HST/NICMOS2 camera at λ = 1.6µm. In the course of this program, a circumstellar annulusaround HD 141569 was detected and has already been presented in Augereau et al. (1999b). In this paper, wereport the detection of an elliptical structure around the Herbig Be star HD 100546 extending from the very closeedge of the coronagraphic mask (∼50 AU) to 350–380 AU (3.5–3.8′′) from the star. The axis ratio gives a diskinclination of 51◦ ± 3◦ to the line-of-sight and a position angle of 161◦ ± 5◦, measured east of north. At 50 AU,the disk has a surface brightness between 10.5 and 11 mag/arcsec2 , then follows a −2.92 ± 0.04 radial powerlaw up to 250–270 AU and finally falls as r−5.5±0.2. The inferred optical thickness suggests that the disk is atleast marginally optically thick inside 80 AU and optically thin further out. Combined with anisotropic scatteringproperties, this could explain the shape of a brightness asymmetry observed along the minor axis of the disk.This asymmetry needs to be confirmed. The circumstellar disks around SAO 206462 and MWC 480 are not re-solved, leading to constraints on the dust distribution. A tight binary system separated by only 0.32′′ ± 0.04′′ isnevertheless detected in the close vicinity of SAO 206462.
Key words. stars: circumstellar matter – stars: HD 100546, SAO 206462, MWC 480 – stars: pre-main sequence
1. Introduction
Dust is present around a large fraction of Main Sequence(MS) stars, as shown by IRAS (Aumann et al. 1984).Moreover, spectroscopic (e.g. Queloz et al. 2000) and pho-tometric (Charbonneau et al. 2000) detections indicatethat planetary systems are quite common. In some cases,the dust lifetime is so short compared to the star’s agethat it has to be replenished, probably through collisionsbetween planetesimals or through evaporation (Backman& Paresce 1993). The best example so far of these sec-ond generation disks is the one surrounding β Pictorisaged more than 20 Myr (Barrado y Navascues et al.1999). Recently, submillimeter images were used to resolvethe dust emission around a few isolated MS stars with
Send offprint requests to: J. C. Augereau,e-mail: [email protected]? Based on observations with the NASA/ESA Hubble
Space Telescope, obtained at the Space Telescope ScienceInstitute, which is operated by the Association of Universitiesfor Research in Astronomy, Inc. under NASA contractNo. NAS5-26555.
different spectral types and older than 0.1 Gyr (Hollandet al. 1998; Greaves et al. 1998).
Circumstellar disks are also present around young ob-jects, as clearly demonstrated by HST (Padgett et al. 1999,for instance), and by ground-based observations (Dutreyet al. 1996). The latter detected circumstellar disks arounda sample of CTTs in the Taurus cloud, but not yet aroundpost T Tauri stars. This is in general agreement withZuckerman & Becklin (1993) and more recently Habinget al. (1999) who have shown the rapid decrease of thecircumstellar dust mass as the stars evolve to the MainSequence (see also Holland et al. 1998). Gas infall is alsoobserved towards a few Herbig Ae/Be (hereafter HAeBe)stars (e.g. Grady et al. 1996; de Winter et al. 1999),tentatively interpreted as the result of comet evapora-tion. In this scheme, this could indicate that planetesimalformation in the nebula is quite common and rapid, astheoretically expected.
Very few disks have been detected around HAeBeand more evolved Pre Main-Sequence (PMS) stars(HD 163296 and MWC 480, Mannings & Sargent 1997a;Mannings et al. 1997b). A recent study of HR 4796,
J. C. Augereau et al.: HST/NICMOS2 coronagraphic observations of HD 100546, SAO 206462 and MWC 480 79
an 8 Myr star, has evidenced that the disk is at least partlysecond generation and that meter-size bodies should al-ready be present (Augereau et al. 1999a). Similar con-clusions could apply for the HD 141569 disk (Augereauet al. 1999b). In both cases, the analysis relies on detailedstudies of the resolved images and spectral energy distri-butions (SEDs). From a general point of view, the natureof transient disks, the role of replenishing planetesimalsif any, and the most relevant physical processes in theseenvironments are still to be clarified.
The general evolutionary scenario to be tested andrefined is then that:1) the protoplanetary disks around young, embedded starsdisperse out before the star reaches the main sequencethrough dynamical activity and interaction with stellarradiation, and that;2) new optically thin circumstellar disks may be sustainedaround older MS stars by destruction processes amongplanetesimals (collisions, evaporation), formed during thePre-Main Sequence (PMS) phase.Analysis of the transition between these two phases, whenthe original young disk is eroded, is critical to validate theabove scenario. Such a study can be performed on disksaround evolved PMS stars. Critical points for this studyare the analysis of opacity to stellar radiation and thetime-scales of collisional processes. Both of these points re-quire detailed information on the spatial distribution andamount of circumstellar dust.During HST/Cycle 7, we probed in coronagraphic modethe environment of four evolved PMS stars with theNICMOS2 camera. As part of this program, we reportedthe positive detection of an extended (>400 AU in radius)structure around HD 141569 in Augereau et al. (1999b).The detection was confirmed by Weinberger et al. (1999).We address in the present paper our results for three othersources of large interest among old PMS stars: HD 100546,SAO 206462 and MWC 480. After a brief description of theobserving strategy, journal of observation and reductionprocedure (Sect. 2), we present in Sect. 3 the results forHD 100546. An extended structure is detected and inter-preted in terms of circumstellar dust arranged within aninclined disk. Detection limits are derived from unresolvedstructures around SAO 206462 and MWC 480 (Sects. 4and 5) and in each case we discuss the implications onthe dust distribution. We also detail the close vicinity ofSAO 206462 which exhibits a tight binary system.
2. HST/NICMOS2 observations and data analysis
2.1. Target selection
Our aim was to image the circumstellar environmentsof transition (old PMS) objects to establish the miss-ing link between disks around young embedded objectsand β Pic-like stars. We compare the optically thick disksof young stars with the optically thin disk of β Picto-ris. Our four targets (HD 100546, SAO 206462, MWC 480
and HD 141569) were selected according to the followingcriteria:- a PMS star close to the MS, which can be characterizedby a large IRAS excess, together with an age estimation(via photometry or spectroscopy) of about 106–107 years;- surrounded by circumstellar dust (IR excess) and CO.CO detection indeed provides a good indication for thegas to be extended;- must have been observed at various wavelengths to allowcomprehensive investigation.
2.2. Observing strategy
The high level of contrast between the investigated cir-cumstellar environments and their central star implies theuse of coronagraphic techniques. The subtraction of resid-ual Point Spread Fonction (PSF) wings is required to takefull benefit of the coronagraph’s high contrast capabilities.For that, we observed in the same optical configuration acomparison star within a few degrees of the science target,of similar or slightly higher brightness, with similar spec-tral type and thought to be free of circumstellar matter.
Comparison stars need to be observed close in time toeach corresponding science target observation because ofthe slight possible variation of the PSF with time. Thismethod has proved to be efficient for ground-based coro-nagraphic data with adaptive optics, especially because itis still efficient if the PSF is not perfectly symmetrical. Italso allows the detection of circumstellar disks far fromedge-on orientation.
2.3. NICMOS2 data
We obtained coronagraphic images of our four targetswith the HST/NICMOS2 camera between February andNovember, 1998. All the observations were performed inFilter F160W (λc = 1.6µm, ∆λ = 0.4µm). For the threetargets presented in this paper, the observing log is sum-marized in Table 1. The individual integration times weredetermined so as to stay below the saturation limit of thedetector on the brightest pixels (near the central hole edgearea). Filter F160W was selected for optimum detectabil-ity: the PSF is well sampled and the background (zodiacallight and thermal background) remains low.
2.4. Reduction procedure, photometry and astrometry
For each observed star, the calibrated files (in counts/s)provided by the STScI are co-added to form a single imageof the star during a same orbit. The reduction procedurethen consists in subtracting the comparison star carefullyscaled to the star of interest. The determination of thescaling factor is critical since a small change can signifi-cantly modify the photometry or in the worst case induceartifacts. It is assessed by azimuthally averaging the profileresulting from the division between the star of interest bythe reference star images (see also Augereau et al. 1999b).

80 J. C. Augereau et al.: HST/NICMOS2 coronagraphic observations of HD 100546, SAO 206462 and MWC 480
Table 1. Observing log. Note that SAO 206462 and SAO 206463 form a visual binary system (HD 135344). References:(a) Waelkens et al. (1990a,b), (b) Coulson et al. 1995, (c) Simbad (CDS), (d) Myers et al. (1998)
Star Name Spectral Type V mag Date Integration Time Same Orbit?
Object: HD 100546 B9Vne 6.68 Nov. 09, 1998 16× 47.958 s = 12 m 47 sReference: HD 106797 A0V 6.07 Nov. 09, 1998 16× 47.958 s = 12 m 47 s Yes
Object: SAO 206462 F4Ve(a) ; F8V(b) 8.65 Aug. 22, 1998 7× 111.931 s = 13 m 03 sReference: SAO 206463 F2(c) ; A2(d) 7.9 Aug. 22, 1998 7× 191.961 s = 22 m 24 s Yes
Object: MWC 480 A2 7.72 Feb. 24, 1998 11× 39.953 s = 7 m 20 sReference: HD 29646 A2V 5.73 Feb. 24, 1998 11× 31.959 s = 5 m 52 s Yes
Table 2. Some known astrophysical parameters of the target sources presented in this paper. References: (a) van den Anckeret al. (1997), (b) Sylvester et al. (1996), (c) Zuckerman et al. (1995), (d) Coulson et al. (1995), (e) Dunkin et al. (1997), (f) vanden ancker et al. (1998), (g) Mannings et al. (1997b)
Star Name Distance [pc] Luminosity [L�] Mass [M�] Teff [K] Age [Myr] Other Name
HD 100546 103+7−6
(a) 32.4+4.5−3.5
(a) 2.4± 0.1(a) 10470(a) > 10(a) SAO 251457SAO 206462 84(b) ; 100(c) 6250(d) ; 6660(e) HD 135344MWC 480 131+24
−18(f) 32.4+13.3
−8.4(f) 2.2± 0.3(f) ; 2.3+0.1
−0.3(g) 8710(f) 2.5+1.5
−0.9(f) ; 6(g) HD 31648
We use the 2.077 10−6 Jy s/counts factor to con-vert NICMOS count rates to absolute fluxes and a zeropoint flux density of 1040.7Jy to convert to magnitudes(NICMOS data handbook, version 4.0, dated december1999). Point source photometry is obtained by integratingthe total flux within a 0.5′′ radius circular aperture, thenapplying a 1.15 correcting factor to compensate for theflux which fell out of this aperture (NICMOS photometryupdate web page).
The pixel scale slowly varies with time but stays withinthe range 0.075′′–0.076′′ in average.
3. HD 100546
3.1. A Herbig Be star close to the ZAMS
The HD 100546 star has been intensively studied sinceit was identified as a member of the HAeBe group (Huet al. 1989). Indeed, HD 100546 is a B9Vne star showinga strong infrared excess peaked at about 25µm (IRAS)due to circumstellar material and then fulfills the crite-rions proposed by Waters & Waelkens (1998) to iden-tify HAeBe stars. Some astrophysical parameters aresummarized in Table 2.
The position of the star in the HR diagram indicatesthat HD 100546 is close to the ZAMS leading to an es-timated age larger than 10 Myr (van den Ancker et al.1997). This star, associated with the dark cloud DC 296.2-7.9 (Hu et al. 1989; Vieira et al. 1999), is surrounded bya large amount of dust: between a few tens (Bouwmanet al. 2000) and a few hundred Earth masses (Henninget al. 1998). The dust is rich in C and O and in particularPAH and silicates (Malfait et al. 1998). The latter are veryvaluable since they constrain the dust optical properties.ISO observations also evidenced similarities between the
10µm emission of the circumstellar dust and that of cometHale-Bopp (Crovisier et al.1997; Malfait et al. 1998).
As commonly observed for other HAeBe stars,HD 100546 exhibits photometric, polarization and spec-troscopic variability (Grady et al. 1996, 1997; van denAncker et al. 1998; Yudin & Evans 1998; Clarke et al.1999; Vieira et al. 1999). The interpretation of suchevents in particular in terms of star-grazing comets (Gradyet al. 1997; Vieira et al. 1999) remains however uncertain(Lagrange et al. 2000; Beust et al. 2000).
Another issue concerns the very distribution of the ma-terial surrounding HD 100546. The disk detection in scat-tered light between 40 (0.4′′) and 200 AU (2′′) by Pantinet al. (2000) reveals a ∼ 50◦ inclined disk almost in theSE-NW direction. At λ = 1.3 mm, an extension as largeas 15–20′′ in radius and close to the detection limit is alsoreported by Henning et al. (1998) in the same direction.From the theoretical point of view, it is unclear whetherthe circumstellar material arranges within a single disk.For instance, the presence of an additional envelope isproposed to reproduce the full spectral energy distribution(Henning et al. 1994) and to explain specific spectroscopicevents (Vieira et al. 1999).
3.2. Results
3.2.1. Resolved disk and vicinity
The azimuthally averaged radial profile of the ratio be-tween HD 100546 and the reference star HD 106797 showstwo basic distinct regimes: up to 3.5–3.8′′, the profile de-creases with distance from the star then reaches a plateaufurther out. The same behavior arises using the A2 andA1 reference stars dedicated to MWC 480 and HD 141569respectively. A resolved structure around HD 100546 isthen detected below 3.5–3.8′′. A 3σ uncertainty of 2%

J. C. Augereau et al.: HST/NICMOS2 coronagraphic observations of HD 100546, SAO 206462 and MWC 480 81
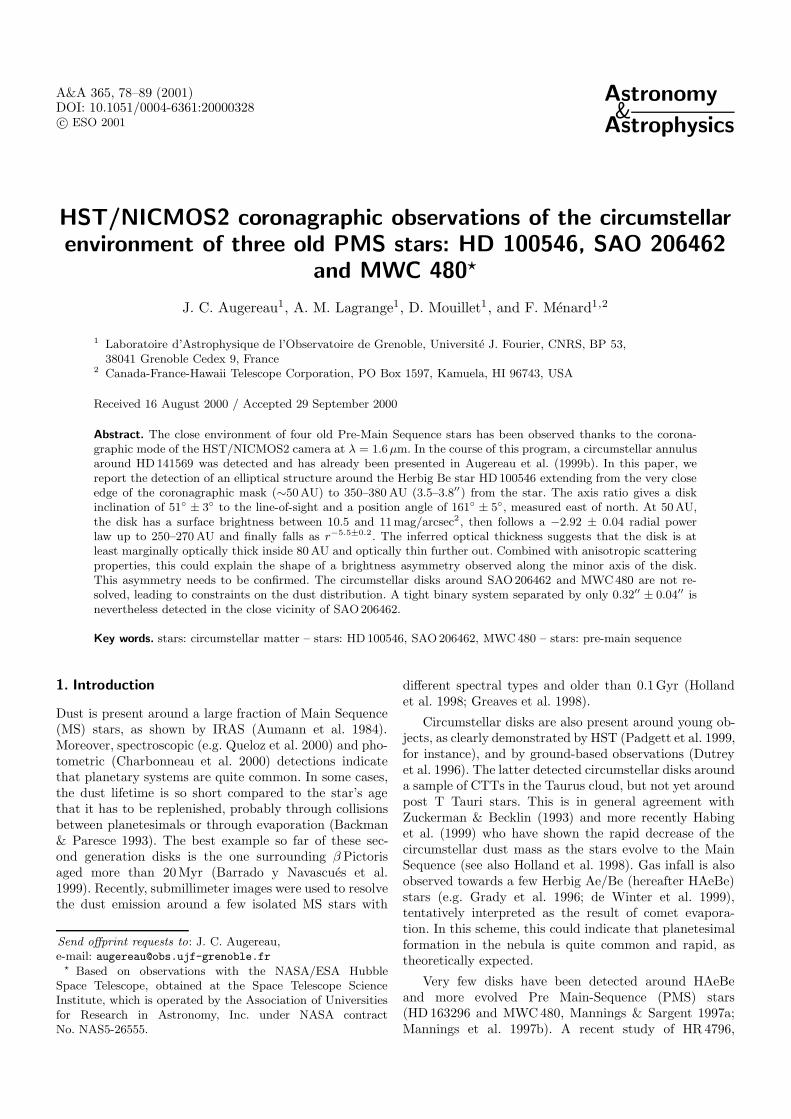
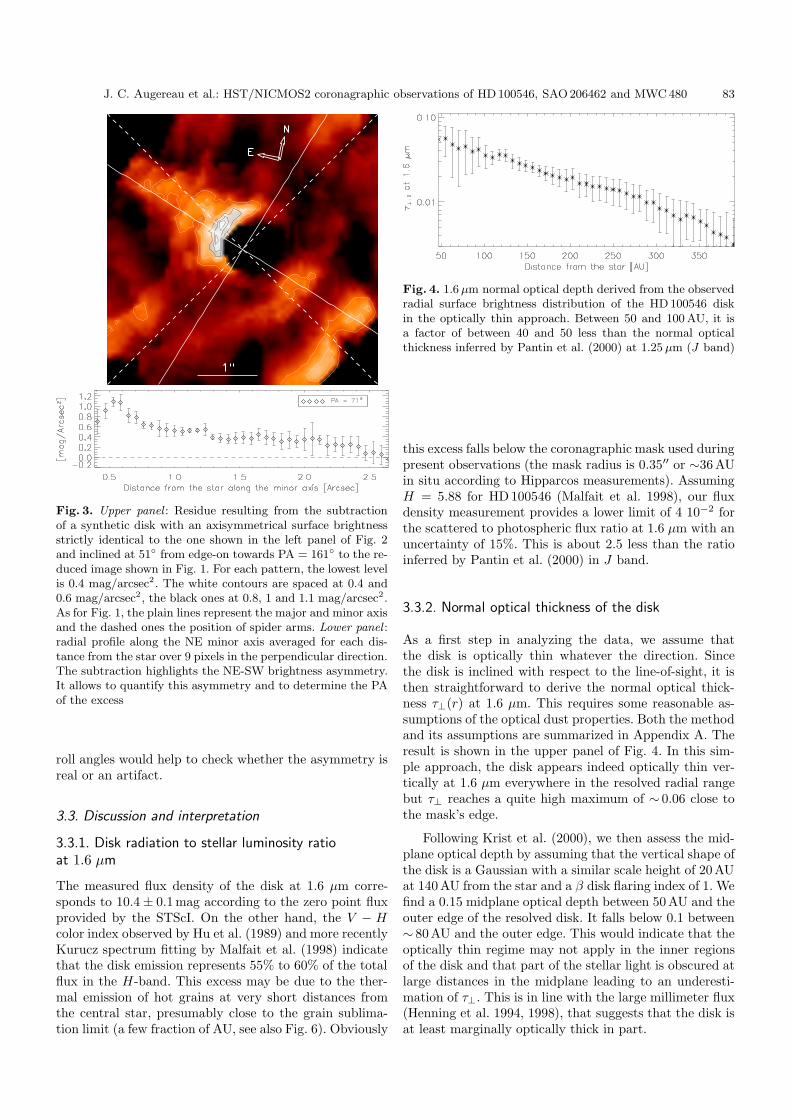
Fig. 1. Reduced image of the HD 100546 disk observed in coronagraphic mode at 1.6 µm with the HST/NICMOS2 camera.The coronagraphic mask is 0.7′′ in diameter (∼ 9 pixels) whereas the numerical mask in the figure is 0.9′′. Isophotes from11 mag/arcsec2 to 17 mag/arcsec2 are indicated. The dashed lines give the width and the position of the spider arms. The smallpanel in the upper right corner shows the result of isophotes ellipse fitting. Inhomogeneities due to the detector or to secondaryspider diffraction spikes (which produce some kinds of fingers) are responsible for black spots. The most noticeable are labeled(a) to (i). In the same small panel, the plain lines represent the major and minor axis of the observed structure and the dashedones represent the position of the spider arms
is obtained on the scaling factor used to subtract the ref-erence star to HD 100546 which directly impacts on theprecision of photometric measurements.
The final calibrated image is shown in Fig. 1 and re-veals an extended elliptical structure centered on the star.We interpret this structure as circumstellar material lo-cated in an inclined disk. Visual inspection suggests thedirection subtended by the spider arm at a position angle(PA, measured east of north) of ∼ 148◦ as an axis of sym-metry for the inclined disk, at least at large distances. Amore robust method (ellipse-fitting to the isophotes) leadsto a PA of 161◦ ± 5◦ but the result might be affected bydifferent noise sources. Whatever the method, the globaldirection of the disk is consistent with the observations ofPantin et al. (2000) but the precise PA is found to be atleast 20◦ larger than their measurements. The axis ratiocorresponds to a disk inclination of 51◦ ± 3◦ with respectto the line of sight, assuming that the disk is axisymmet-ric, and agrees with the results of Pantin et al. (2000). Wemeasure a total flux density of 73±7 mJy (the uncertaintyis dominated by uncertainty in the scaling factor used tosubtract the PSF star).
Table 3. Projected distances, position angles (PAs) and mag-nitudes in filter F160W (λc ' 1.6µm) of the 3 brightest visualcompanion stars detected in the vicinity of HD 100546. Thelabels refer to Fig. 1. 3σ uncertainties in the positions and PAsare mainly due to the uncertainty in the central star positionbelow the mask but also to the uncertainty in the companionstar centroid. The 3σ photometric uncertainty is induced bythe uncertainty on the scaling factor used to subtract the PSFstar to the star of interest (Sect. 2.4)
Label Projected distance PA magnitude[Arcsec] [degrees] filter F160W
B 4.50 ± 0.15 197.7 ± 1.1 15.74 ± 0.04C 10.80 ± 0.15 277.1 ± 0.5 15.79 ± 0.11D 5.09 ± 0.15 156.3 ± 0.9 16.09 ± 0.08
Some companion stars are also detected in the closevicinity of HD 100546. The three brightest ones are shownin Fig. 1 and their measured astronomical parameters(projected separations, PAs and magnitudes) are summa-rized in Table 3.
82 J. C. Augereau et al.: HST/NICMOS2 coronagraphic observations of HD 100546, SAO 206462 and MWC 480
Fig. 2. The HD 100546 disk radial surface brightness profiles azimuthally averaged on elliptical contours assuming PA = 161◦
for the major axis and an eccentricity of e = 0.63. The left panel shows the major axis profile and the right ones the minor axisprofiles. The dark grey areas in the small boxes in the legend mimic the angular sectors centered on the star used in each case.These results are discussed in Sects. 3.2.2 and 3.2.3
3.2.2. Radial surface brightness profiles
The radial brightness profiles of the disk are assessed byazimuthally averaging the surface brightness on ellipticalcontours. The radial profile measured towards the majoraxis of the disk is shown in the left panel of Fig. 2. Itreveals a smooth and continuous decrease of the surfacebrightness with the distance from the star from the veryclose edge of the coronagraphic mask up to 2.5′′. Beyond2.5′′, the profile is steeper and reaches the detection limit(grey area in Fig. 2) at 3.5–3.8′′. Basic radial power-lawsproperly fit this measured surface brightness profile withindexes −2.92± 0.04 in the radial range [0.5′′, 2.5′′] and−5.5± 0.2 outside of 2.7′′.
The surface brightness profiles along the minor axis(NE and SW sides of the disk) are shown in the rightpanels of Fig. 2. To allow direct comparison with the re-sults along the major axis, we plot the profiles versusdeprojected distances. They correspond to the observeddistances along the minor axis over sin(51◦). As a confir-mation of the isophote ellipse fitting procedure, the mainshape of the minor axis profiles superimposes well on themajor axis one.
3.2.3. NE-SW brightness asymmetry
However, a significant brightness enhancement arises inthe NE direction mainly below 0.7–0.8′′ in projected dis-tances but not in the opposite direction. Also in the sameradial range, the behavior of the SW profile better fol-lows the major axis profile down to ∼0.5′′. Below this dis-tance, the SW side of the disk is slightly fainter but with apoor level of confidence (very close to the detection limit).This NE-SW brightness asymmetry is clearly evidencedin Fig. 1.
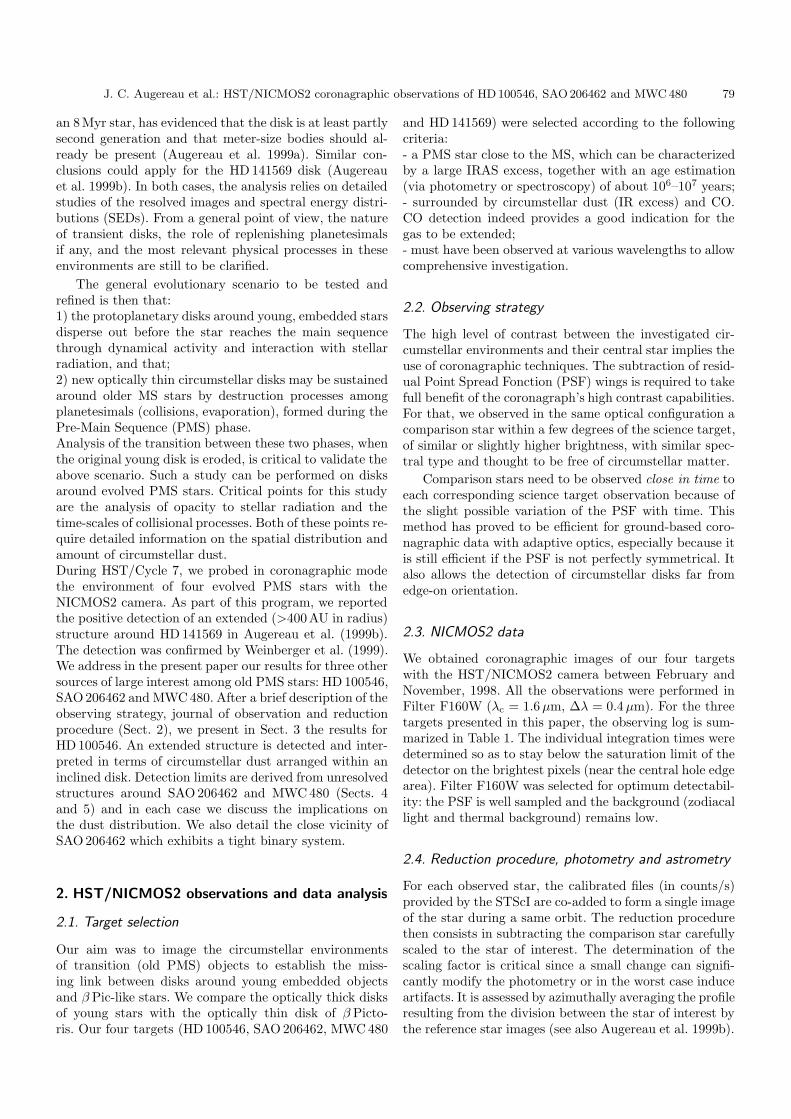
To emphasize the asymmetry, we subtract a syntheticdisk which fits the disk isophotes to the observed diskof HD 100546. In the NE side, the subtraction shown inFig. 3 reveals an excess of flux up to 1.1 mag/arcsec2 at0.5′′–0.6′′ collimated in a direction close to the minor axisof the disk (plain line). In the SW side, the systematicpattern at about 2.2′′, responsible for the shape of theradial profile shown in the bottom right panel of Fig. 2, isclearly seen.
We first checked whether this asymmetry could resultfrom a bad centering of the PSF star during the reductionprocedure. To significantly decrease the inner brightnessasymmetry, the reference star has to be shifted by morethan 1.5 pixel in the NE direction. This leads to unreal-istic strong asymmetries in the rest of the image whichcharacterize an obvious bad centering of the subtractedPSF star. The asymmetry arises close to the position ofa diffraction spike which might seem suspicious. However,due to a good alignment, the diffraction spikes were com-pletely removed during PSF subtraction and did not re-quire any further processing which might directly causethe effect.
Could the effect then be due to instrumental effects?HD 100546 and the reference star have been observed dur-ing the same orbit. Therefore, orbit-to-orbit variations,such as the migration (∼ 0.25 pixel) of the coronagraphichole on the detector or defocus (Schultz et al. 1999) can-not account for the observed effect. Another issue concernsthe mis-centering of the star behind the mask during tar-get acquisition. An accuracy of a few tenths of pixel isreached when centering PSF on the occulting mask buta mis-centering of the star by only a third of pixel canproduce brightness asymmetries mainly within a radius of0.4′′–0.5′′ (Schultz et al. 1999). Observations at different
J. C. Augereau et al.: HST/NICMOS2 coronagraphic observations of HD 100546, SAO 206462 and MWC 480 83
Fig. 3. Upper panel : Residue resulting from the subtractionof a synthetic disk with an axisymmetrical surface brightnessstrictly identical to the one shown in the left panel of Fig. 2and inclined at 51◦ from edge-on towards PA = 161◦ to the re-duced image shown in Fig. 1. For each pattern, the lowest levelis 0.4 mag/arcsec2 . The white contours are spaced at 0.4 and0.6 mag/arcsec2 , the black ones at 0.8, 1 and 1.1 mag/arcsec2 .As for Fig. 1, the plain lines represent the major and minor axisand the dashed ones the position of spider arms. Lower panel :radial profile along the NE minor axis averaged for each dis-tance from the star over 9 pixels in the perpendicular direction.The subtraction highlights the NE-SW brightness asymmetry.It allows to quantify this asymmetry and to determine the PAof the excess
roll angles would help to check whether the asymmetry isreal or an artifact.
3.3. Discussion and interpretation
3.3.1. Disk radiation to stellar luminosity ratioat 1.6 µm
The measured flux density of the disk at 1.6 µm corre-sponds to 10.4± 0.1 mag according to the zero point fluxprovided by the STScI. On the other hand, the V − Hcolor index observed by Hu et al. (1989) and more recentlyKurucz spectrum fitting by Malfait et al. (1998) indicatethat the disk emission represents 55% to 60% of the totalflux in the H-band. This excess may be due to the ther-mal emission of hot grains at very short distances fromthe central star, presumably close to the grain sublima-tion limit (a few fraction of AU, see also Fig. 6). Obviously
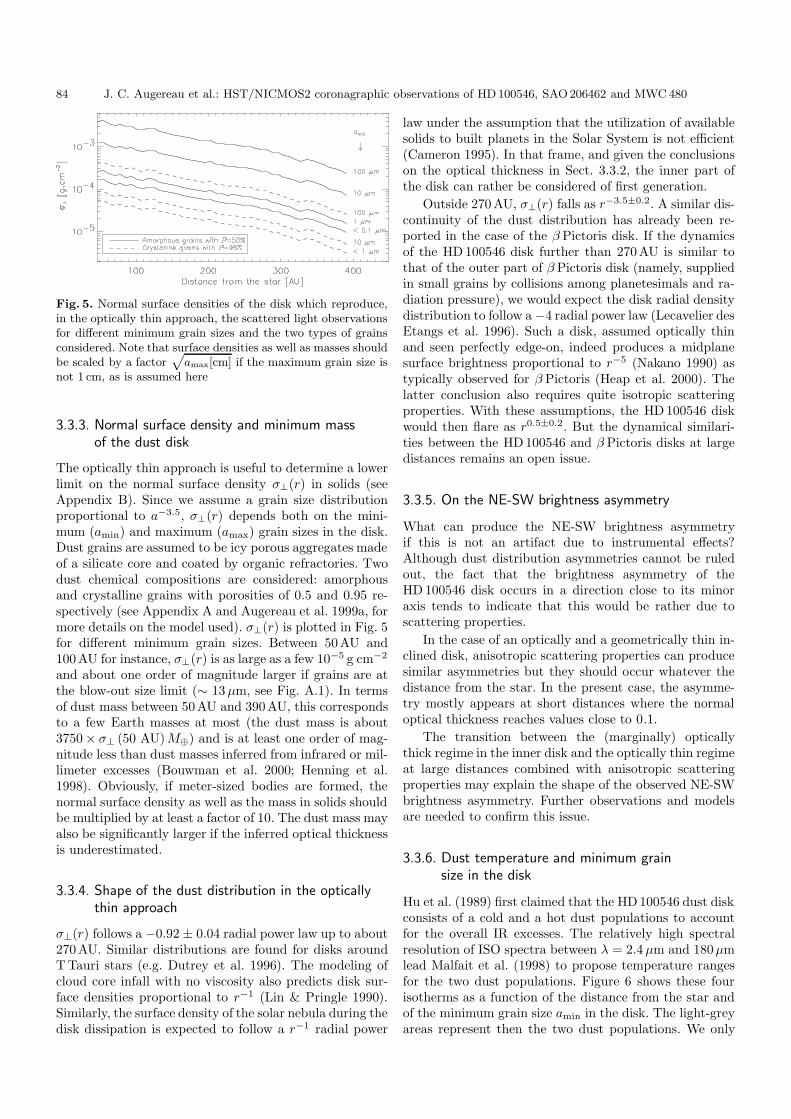
Fig. 4. 1.6µm normal optical depth derived from the observedradial surface brightness distribution of the HD 100546 diskin the optically thin approach. Between 50 and 100 AU, it isa factor of between 40 and 50 less than the normal opticalthickness inferred by Pantin et al. (2000) at 1.25 µm (J band)
this excess falls below the coronagraphic mask used duringpresent observations (the mask radius is 0.35′′ or ∼36 AUin situ according to Hipparcos measurements). AssumingH = 5.88 for HD 100546 (Malfait et al. 1998), our fluxdensity measurement provides a lower limit of 4 10−2 forthe scattered to photospheric flux ratio at 1.6 µm with anuncertainty of 15%. This is about 2.5 less than the ratioinferred by Pantin et al. (2000) in J band.
3.3.2. Normal optical thickness of the disk
As a first step in analyzing the data, we assume thatthe disk is optically thin whatever the direction. Sincethe disk is inclined with respect to the line-of-sight, it isthen straightforward to derive the normal optical thick-ness τ⊥(r) at 1.6 µm. This requires some reasonable as-sumptions of the optical dust properties. Both the methodand its assumptions are summarized in Appendix A. Theresult is shown in the upper panel of Fig. 4. In this sim-ple approach, the disk appears indeed optically thin ver-tically at 1.6 µm everywhere in the resolved radial rangebut τ⊥ reaches a quite high maximum of ∼ 0.06 close tothe mask’s edge.
Following Krist et al. (2000), we then assess the mid-plane optical depth by assuming that the vertical shape ofthe disk is a Gaussian with a similar scale height of 20 AUat 140 AU from the star and a β disk flaring index of 1. Wefind a 0.15 midplane optical depth between 50 AU and theouter edge of the resolved disk. It falls below 0.1 between∼ 80 AU and the outer edge. This would indicate that theoptically thin regime may not apply in the inner regionsof the disk and that part of the stellar light is obscured atlarge distances in the midplane leading to an underesti-mation of τ⊥. This is in line with the large millimeter flux(Henning et al. 1994, 1998), that suggests that the disk isat least marginally optically thick in part.
84 J. C. Augereau et al.: HST/NICMOS2 coronagraphic observations of HD 100546, SAO 206462 and MWC 480
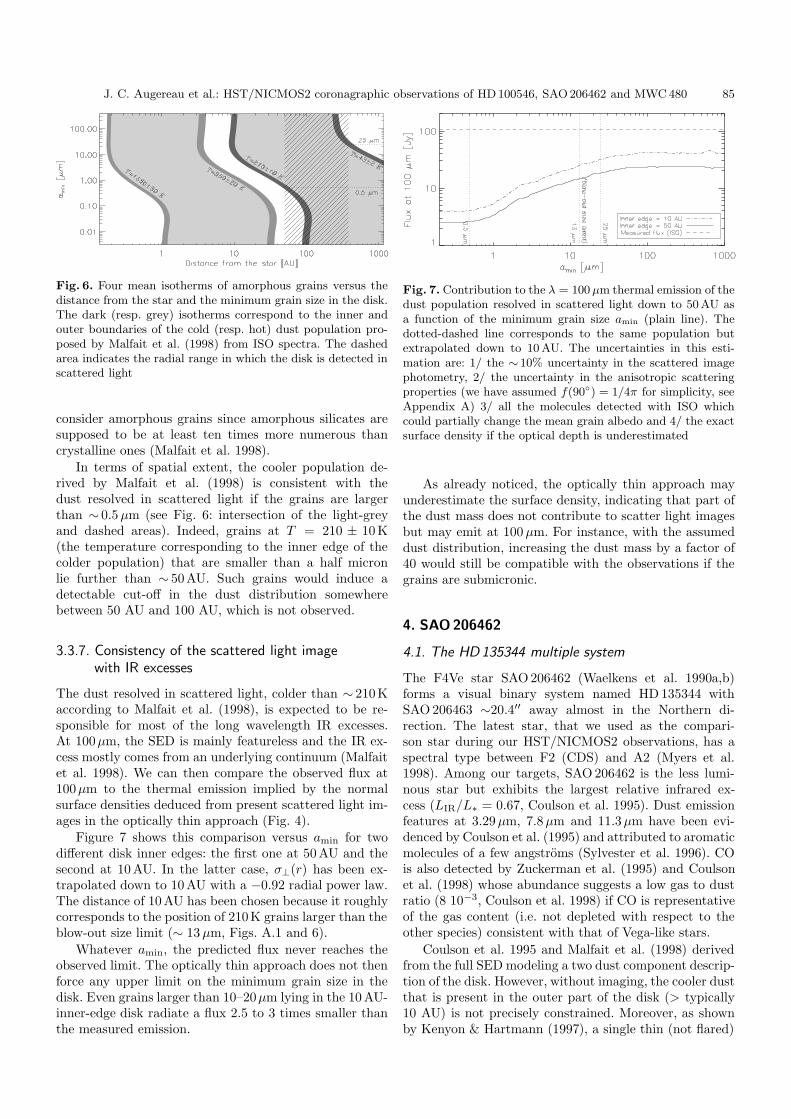
Fig. 5. Normal surface densities of the disk which reproduce,in the optically thin approach, the scattered light observationsfor different minimum grain sizes and the two types of grainsconsidered. Note that surface densities as well as masses shouldbe scaled by a factor
√amax[cm] if the maximum grain size is
not 1 cm, as is assumed here
3.3.3. Normal surface density and minimum massof the dust disk
The optically thin approach is useful to determine a lowerlimit on the normal surface density σ⊥(r) in solids (seeAppendix B). Since we assume a grain size distributionproportional to a−3.5, σ⊥(r) depends both on the mini-mum (amin) and maximum (amax) grain sizes in the disk.Dust grains are assumed to be icy porous aggregates madeof a silicate core and coated by organic refractories. Twodust chemical compositions are considered: amorphousand crystalline grains with porosities of 0.5 and 0.95 re-spectively (see Appendix A and Augereau et al. 1999a, formore details on the model used). σ⊥(r) is plotted in Fig. 5for different minimum grain sizes. Between 50 AU and100 AU for instance, σ⊥(r) is as large as a few 10−5 g cm−2
and about one order of magnitude larger if grains are atthe blow-out size limit (∼ 13µm, see Fig. A.1). In termsof dust mass between 50 AU and 390 AU, this correspondsto a few Earth masses at most (the dust mass is about3750× σ⊥ (50 AU)M⊕) and is at least one order of mag-nitude less than dust masses inferred from infrared or mil-limeter excesses (Bouwman et al. 2000; Henning et al.1998). Obviously, if meter-sized bodies are formed, thenormal surface density as well as the mass in solids shouldbe multiplied by at least a factor of 10. The dust mass mayalso be significantly larger if the inferred optical thicknessis underestimated.
3.3.4. Shape of the dust distribution in the opticallythin approach
σ⊥(r) follows a −0.92± 0.04 radial power law up to about270 AU. Similar distributions are found for disks aroundT Tauri stars (e.g. Dutrey et al. 1996). The modeling ofcloud core infall with no viscosity also predicts disk sur-face densities proportional to r−1 (Lin & Pringle 1990).Similarly, the surface density of the solar nebula during thedisk dissipation is expected to follow a r−1 radial power
law under the assumption that the utilization of availablesolids to built planets in the Solar System is not efficient(Cameron 1995). In that frame, and given the conclusionson the optical thickness in Sect. 3.3.2, the inner part ofthe disk can rather be considered of first generation.
Outside 270 AU, σ⊥(r) falls as r−3.5±0.2. A similar dis-continuity of the dust distribution has already been re-ported in the case of the β Pictoris disk. If the dynamicsof the HD 100546 disk further than 270 AU is similar tothat of the outer part of β Pictoris disk (namely, suppliedin small grains by collisions among planetesimals and ra-diation pressure), we would expect the disk radial densitydistribution to follow a−4 radial power law (Lecavelier desEtangs et al. 1996). Such a disk, assumed optically thinand seen perfectly edge-on, indeed produces a midplanesurface brightness proportional to r−5 (Nakano 1990) astypically observed for β Pictoris (Heap et al. 2000). Thelatter conclusion also requires quite isotropic scatteringproperties. With these assumptions, the HD 100546 diskwould then flare as r0.5±0.2. But the dynamical similari-ties between the HD 100546 and β Pictoris disks at largedistances remains an open issue.
3.3.5. On the NE-SW brightness asymmetry
What can produce the NE-SW brightness asymmetryif this is not an artifact due to instrumental effects?Although dust distribution asymmetries cannot be ruledout, the fact that the brightness asymmetry of theHD 100546 disk occurs in a direction close to its minoraxis tends to indicate that this would be rather due toscattering properties.
In the case of an optically and a geometrically thin in-clined disk, anisotropic scattering properties can producesimilar asymmetries but they should occur whatever thedistance from the star. In the present case, the asymme-try mostly appears at short distances where the normaloptical thickness reaches values close to 0.1.
The transition between the (marginally) opticallythick regime in the inner disk and the optically thin regimeat large distances combined with anisotropic scatteringproperties may explain the shape of the observed NE-SWbrightness asymmetry. Further observations and modelsare needed to confirm this issue.
3.3.6. Dust temperature and minimum grainsize in the disk
Hu et al. (1989) first claimed that the HD 100546 dust diskconsists of a cold and a hot dust populations to accountfor the overall IR excesses. The relatively high spectralresolution of ISO spectra between λ = 2.4µm and 180µmlead Malfait et al. (1998) to propose temperature rangesfor the two dust populations. Figure 6 shows these fourisotherms as a function of the distance from the star andof the minimum grain size amin in the disk. The light-greyareas represent then the two dust populations. We only
J. C. Augereau et al.: HST/NICMOS2 coronagraphic observations of HD 100546, SAO 206462 and MWC 480 85
Fig. 6. Four mean isotherms of amorphous grains versus thedistance from the star and the minimum grain size in the disk.The dark (resp. grey) isotherms correspond to the inner andouter boundaries of the cold (resp. hot) dust population pro-posed by Malfait et al. (1998) from ISO spectra. The dashedarea indicates the radial range in which the disk is detected inscattered light
consider amorphous grains since amorphous silicates aresupposed to be at least ten times more numerous thancrystalline ones (Malfait et al. 1998).
In terms of spatial extent, the cooler population de-rived by Malfait et al. (1998) is consistent with thedust resolved in scattered light if the grains are largerthan ∼ 0.5µm (see Fig. 6: intersection of the light-greyand dashed areas). Indeed, grains at T = 210 ± 10 K(the temperature corresponding to the inner edge of thecolder population) that are smaller than a half micronlie further than ∼ 50 AU. Such grains would induce adetectable cut-off in the dust distribution somewherebetween 50 AU and 100 AU, which is not observed.
3.3.7. Consistency of the scattered light imagewith IR excesses
The dust resolved in scattered light, colder than ∼ 210 Kaccording to Malfait et al. (1998), is expected to be re-sponsible for most of the long wavelength IR excesses.At 100µm, the SED is mainly featureless and the IR ex-cess mostly comes from an underlying continuum (Malfaitet al. 1998). We can then compare the observed flux at100µm to the thermal emission implied by the normalsurface densities deduced from present scattered light im-ages in the optically thin approach (Fig. 4).
Figure 7 shows this comparison versus amin for twodifferent disk inner edges: the first one at 50 AU and thesecond at 10 AU. In the latter case, σ⊥(r) has been ex-trapolated down to 10 AU with a −0.92 radial power law.The distance of 10 AU has been chosen because it roughlycorresponds to the position of 210 K grains larger than theblow-out size limit (∼ 13µm, Figs. A.1 and 6).
Whatever amin, the predicted flux never reaches theobserved limit. The optically thin approach does not thenforce any upper limit on the minimum grain size in thedisk. Even grains larger than 10–20µm lying in the 10 AU-inner-edge disk radiate a flux 2.5 to 3 times smaller thanthe measured emission.
Fig. 7. Contribution to the λ = 100µm thermal emission of thedust population resolved in scattered light down to 50 AU asa function of the minimum grain size amin (plain line). Thedotted-dashed line corresponds to the same population butextrapolated down to 10 AU. The uncertainties in this esti-mation are: 1/ the ∼ 10% uncertainty in the scattered imagephotometry, 2/ the uncertainty in the anisotropic scatteringproperties (we have assumed f(90◦) = 1/4π for simplicity, seeAppendix A) 3/ all the molecules detected with ISO whichcould partially change the mean grain albedo and 4/ the exactsurface density if the optical depth is underestimated
As already noticed, the optically thin approach mayunderestimate the surface density, indicating that part ofthe dust mass does not contribute to scatter light imagesbut may emit at 100µm. For instance, with the assumeddust distribution, increasing the dust mass by a factor of40 would still be compatible with the observations if thegrains are submicronic.
4. SAO 206462
4.1. The HD 135344 multiple system
The F4Ve star SAO 206462 (Waelkens et al. 1990a,b)forms a visual binary system named HD 135344 withSAO 206463 ∼20.4′′ away almost in the Northern di-rection. The latest star, that we used as the compari-son star during our HST/NICMOS2 observations, has aspectral type between F2 (CDS) and A2 (Myers et al.1998). Among our targets, SAO 206462 is the less lumi-nous star but exhibits the largest relative infrared ex-cess (LIR/L∗ = 0.67, Coulson et al. 1995). Dust emissionfeatures at 3.29µm, 7.8µm and 11.3µm have been evi-denced by Coulson et al. (1995) and attributed to aromaticmolecules of a few angstroms (Sylvester et al. 1996). COis also detected by Zuckerman et al. (1995) and Coulsonet al. (1998) whose abundance suggests a low gas to dustratio (8 10−3, Coulson et al. 1998) if CO is representativeof the gas content (i.e. not depleted with respect to theother species) consistent with that of Vega-like stars.
Coulson et al. 1995 and Malfait et al. (1998) derivedfrom the full SED modeling a two dust component descrip-tion of the disk. However, without imaging, the cooler dustthat is present in the outer part of the disk (> typically10 AU) is not precisely constrained. Moreover, as shownby Kenyon & Hartmann (1997), a single thin (not flared)

86 J. C. Augereau et al.: HST/NICMOS2 coronagraphic observations of HD 100546, SAO 206462 and MWC 480
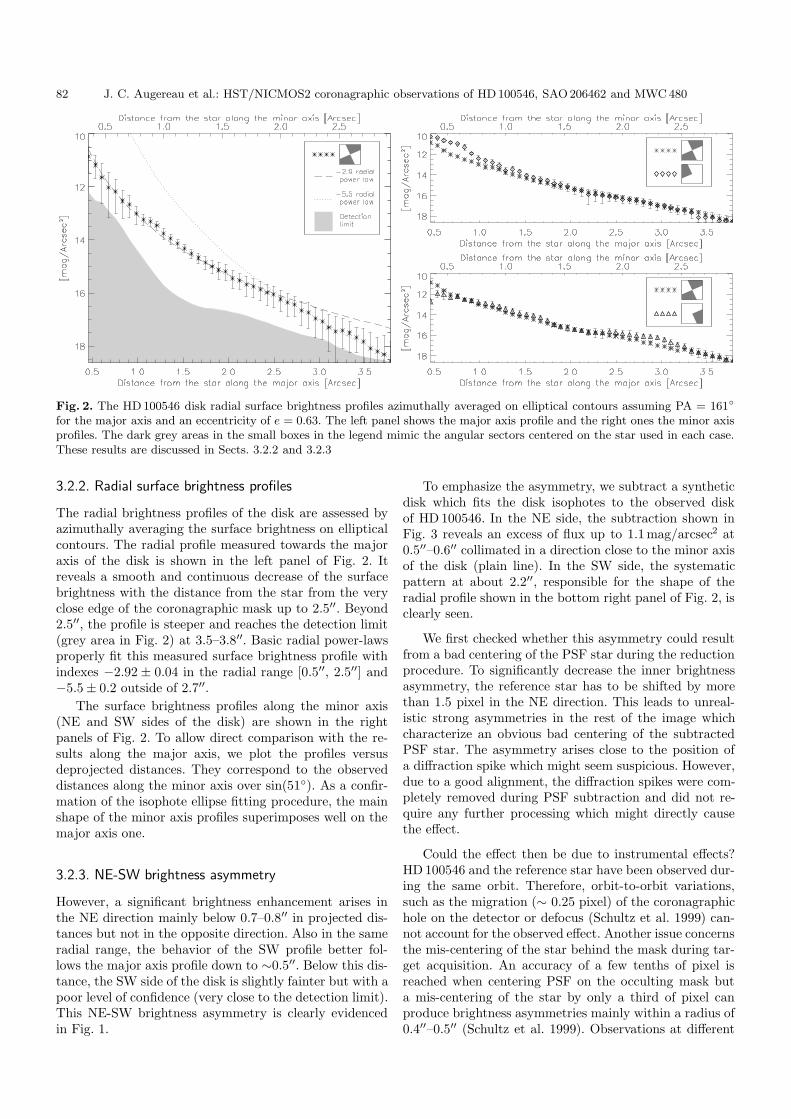
Fig. 8. SAO 206462 detection limit at 1.6µm with theHST/NICMOS2 camera
disk cannot account for the observed infrared excess andleads Sylvester et al. (1997) to propose either the presenceof an envelope or accretion activity.
4.2. Results
4.2.1. Disk detection limit
No obvious feature that could be attributed to circumstel-lar dust is detected in the 1.6µm images of SAO 206462(Fig. 10). The corresponding detection limit (Fig. 8)shows that at 1.6µm the disk is fainter than 13.5–14 mag arcsec−2 further than 0.4′′ (∼35 AU) and fainterthan 16 mag arcsec−2 at 93 AU (1.1′′), i.e. close to the in-ner disk edge derived by Sylvester et al. (1997) from SEDmodeling. In the optically thin approach, this can be in-terpreted in terms of an upper limit on the normal opticalthickness of about 10−2 (Fig. 9) outside of 0.4′′ in radius(35 AU). The dust material further than 35 AU (if any)then is either optically thin at 1.6µm or does not con-tribute at this wavelength due to starlight occultation bythe dust closer to the star.
4.2.2. Implications for the dust distribution
With the rough assumption that the dust surface den-sity is proportional to r−1.2 (as typically observed foryoung stars and which implies the larger mass), the dustmass between 35 AU and 420 AU would be less than:2270 × σupper limit
⊥ , r=35AUM⊕. It corresponds to ∼ 0.25M⊕assuming σupper limit
⊥ , r=35AU ∼ 10−4 g cm−2. This must be com-pared to the few Earth masses required to reproduce thefull SED (Sylvester et al. 1997; Coulson et al. 1998) as-suming moreover a maximum grain size at least 10 timessmaller than for present work.
A large fraction of the dust mass (optically thin ap-proach) or at least a large amount of dust (optically thickapproach) is then certainly confined within the first fewtens of AU. This is consistent with the mean cold popula-tion position of 23 AU derived by Coulson et al. (1995) butnot with Sylvester et al. (1997) (who assume very smallgrains in the disk, ∼ 50 A). Present results agree with the
Fig. 9. Upper limits on the disk normal optical thickness atλ = 1.6µm (upper panel) and on the dust surface density asa function of the minimum grain size amin (lower panel) forSAO 206462 assuming that the disk is optically thin
Fig. 10. The close binary system detected in the vicinity ofSAO 206462 at 1.6µm with the HST/NICMOS2 camera
disk size limit of ∼ 60 AU inferred by Jayawardhana et al.(2000) from their unresolved 10 and 18µm images.
4.2.3. A tight binary system close to SAO 206462
A close binary system in the SW direction is detected inthe vicinity of SAO 206462 (Fig. 10). The brightest com-panion is 5.8′′ ± 0.15′′ away from SAO 206462 at PA =129.8◦±0.8◦. The two close companion stars are separatedby only 0.32′′ ± 0.04′′ almost aligned along the NS axis;we find a PA of 352◦± 7 for the third companion with re-spect to the brightest one. In Filter F160W, the secondarycompanion has a magnitude of 15.2 ± 0.1 and the thirdcompanion is about 6.3 times fainter (mag = 17.2± 0.1).
J. C. Augereau et al.: HST/NICMOS2 coronagraphic observations of HD 100546, SAO 206462 and MWC 480 87
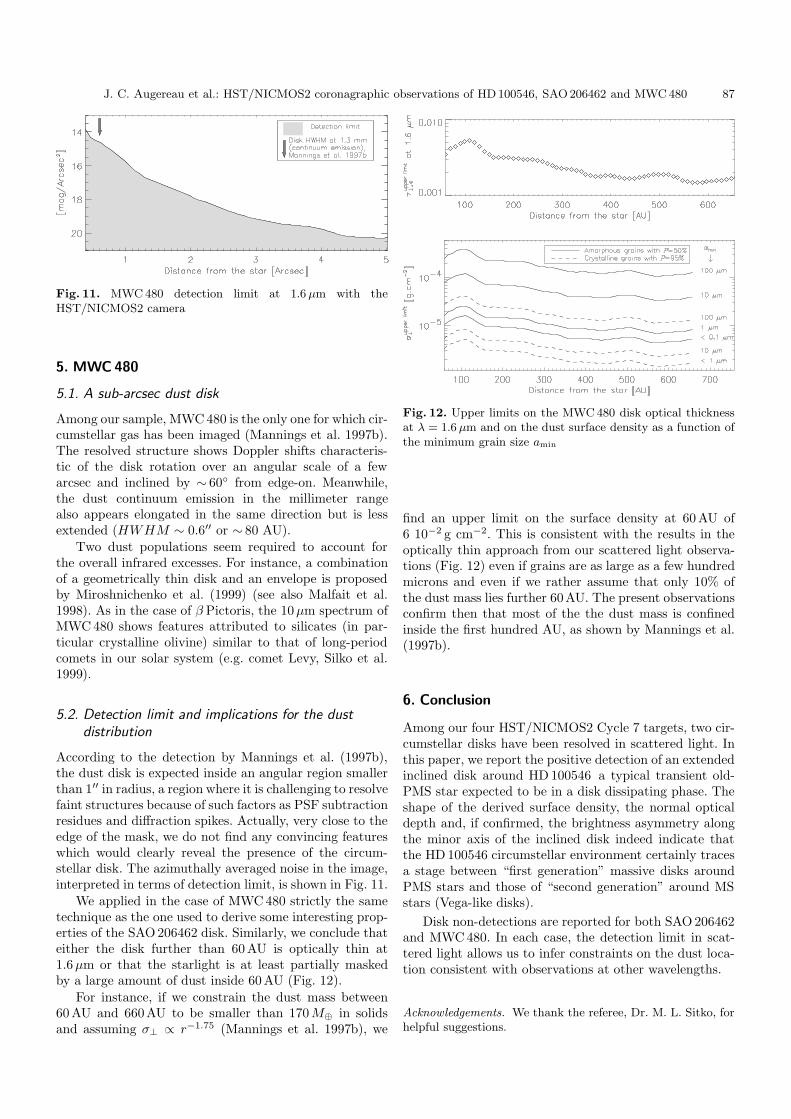
Fig. 11. MWC 480 detection limit at 1.6µm with theHST/NICMOS2 camera
5. MWC 480
5.1. A sub-arcsec dust disk
Among our sample, MWC 480 is the only one for which cir-cumstellar gas has been imaged (Mannings et al. 1997b).The resolved structure shows Doppler shifts characteris-tic of the disk rotation over an angular scale of a fewarcsec and inclined by ∼ 60◦ from edge-on. Meanwhile,the dust continuum emission in the millimeter rangealso appears elongated in the same direction but is lessextended (HWHM ∼ 0.6′′ or ∼ 80 AU).
Two dust populations seem required to account forthe overall infrared excesses. For instance, a combinationof a geometrically thin disk and an envelope is proposedby Miroshnichenko et al. (1999) (see also Malfait et al.1998). As in the case of β Pictoris, the 10µm spectrum ofMWC 480 shows features attributed to silicates (in par-ticular crystalline olivine) similar to that of long-periodcomets in our solar system (e.g. comet Levy, Silko et al.1999).
5.2. Detection limit and implications for the dustdistribution
According to the detection by Mannings et al. (1997b),the dust disk is expected inside an angular region smallerthan 1′′ in radius, a region where it is challenging to resolvefaint structures because of such factors as PSF subtractionresidues and diffraction spikes. Actually, very close to theedge of the mask, we do not find any convincing featureswhich would clearly reveal the presence of the circum-stellar disk. The azimuthally averaged noise in the image,interpreted in terms of detection limit, is shown in Fig. 11.
We applied in the case of MWC 480 strictly the sametechnique as the one used to derive some interesting prop-erties of the SAO 206462 disk. Similarly, we conclude thateither the disk further than 60 AU is optically thin at1.6µm or that the starlight is at least partially maskedby a large amount of dust inside 60 AU (Fig. 12).
For instance, if we constrain the dust mass between60 AU and 660 AU to be smaller than 170M⊕ in solidsand assuming σ⊥ ∝ r−1.75 (Mannings et al. 1997b), we
Fig. 12. Upper limits on the MWC 480 disk optical thicknessat λ = 1.6µm and on the dust surface density as a function ofthe minimum grain size amin
find an upper limit on the surface density at 60 AU of6 10−2 g cm−2. This is consistent with the results in theoptically thin approach from our scattered light observa-tions (Fig. 12) even if grains are as large as a few hundredmicrons and even if we rather assume that only 10% ofthe dust mass lies further 60 AU. The present observationsconfirm then that most of the the dust mass is confinedinside the first hundred AU, as shown by Mannings et al.(1997b).
6. Conclusion
Among our four HST/NICMOS2 Cycle 7 targets, two cir-cumstellar disks have been resolved in scattered light. Inthis paper, we report the positive detection of an extendedinclined disk around HD 100546 a typical transient old-PMS star expected to be in a disk dissipating phase. Theshape of the derived surface density, the normal opticaldepth and, if confirmed, the brightness asymmetry alongthe minor axis of the inclined disk indeed indicate thatthe HD 100546 circumstellar environment certainly tracesa stage between “first generation” massive disks aroundPMS stars and those of “second generation” around MSstars (Vega-like disks).
Disk non-detections are reported for both SAO 206462and MWC 480. In each case, the detection limit in scat-tered light allows us to infer constraints on the dust loca-tion consistent with observations at other wavelengths.
Acknowledgements. We thank the referee, Dr. M. L. Sitko, forhelpful suggestions.

88 J. C. Augereau et al.: HST/NICMOS2 coronagraphic observations of HD 100546, SAO 206462 and MWC 480
Fig. A.1. Correcting factor ε at λ = 1.6µm as a function ofminimum grain size amin (see text). The ratios of radiationpressure to gravitational forces βpr have been computed forgrains with size amin in the vicinity of HD 100546, MWC 480and SAO 206462 (assumed to be a F4V star with L∗ ' 2.5L�and M∗ ' 1.2M�, Allen 1973)
Appendix A: Disk normal optical thickness
The disk normal optical thickness can be straightforwardlyderived from the normal surface brightness if we assumethat the disk is axisymmetrical and optically thin.
More precisely, the disk normal surface brightness inscattered light is:
SB⊥(r) ' Φλ r−2 f(90◦)× 〈σsca〉a n⊥(r)
where: Φλ is the total received flux (star+disk) at theconsidered wavelength λ, r is the distance from the star,f is the scattering phase function, 〈σsca〉a is the scatter-ing cross-section averaged over the grain size distributionand n⊥(r) is the grain normal surface density distribu-tion. This equation assumes that grain properties do notstrongly depend on r.
On the other hand, the normal optical thickness isgiven by:
τ⊥(r) = 〈σext〉a n⊥(r) = ω−1 × 〈σsca〉a n⊥(r)
with: ω =〈σsca〉a〈σext〉a
where 〈σext〉a is the averaged extinction cross-section.Finally, we have:
τ⊥(r) ' ω−1 Φ−1λ f(90◦)−1 r2 SB⊥(r).
The ω ratio depends on the wavelength, on the grainsize distribution and on grain properties (shape, chemical
Fig. B.1. Correcting factor ζ at λ = 1.6µm as a function ofminimum grain size amin (see text)
composition...). In the following, we assume λ = 1.6µmand a collisional grain size distribution proportional toa−3.5 between amin and amax. Grains are assumed to bespherical (a is the radius) and amax is fixed to 1 cm. Weadopt the two types of grains proposed in Augereau et al.(1999a), namely: amorphous “ISM-like grains” with poros-ity P of about 50% and crystalline “comet-like grains”with large porosity (P ∼ 95%). Grains are assumed tobe made of silicates, organic refractories and a smallamount of water ice (10%). We use the Maxwell-Garnetteffective medium theory to compute the complex indexof refraction of the aggregate and the Mie theory toderive the optical properties.
For amin � λ, the ω ratio reaches a constant value ω0
close to 0.5 (Bohren & Huffman 1983). Then if we note:
τ⊥,0(r) = 2 Φ−1λ f(90◦)−1 r2 SB⊥(r)
and ε = ω0 × ω−1
we have:
τ⊥(r) ' ε τ⊥,0(r)
where ε represents a correcting factor which must be ap-plied for the smallest amin, where the geometric opticsapproximation does not apply. ε versus amin is shownin Fig. A.1 for the two types of grains. Note that foramin larger than a few λ
2π(1−P )1/3 , ω is very close to thealbedo of the smallest grains. For simplicity, we assumethat grains scatter isotropically, then: f(90◦) ' 1/4π.
Appendix B: Disk normal surface density
The normal surface density of the disk is obtained by:
σ⊥(r) = 〈43πρ a3〉a × n⊥(r) ' ζ σ⊥,0(r)
with: σ⊥,0(r) =23ρgτ⊥,0(r)
√aminamax
and: ζ =〈πa2〉a〈σsca〉a
,
assuming ω0 ' 0.5. The grain density ρg depends on thegrain properties. It is about 1.2 g cm−3 for amorphous

J. C. Augereau et al.: HST/NICMOS2 coronagraphic observations of HD 100546, SAO 206462 and MWC 480 89
grains and ten times smaller for crystalline grains due tothe large porosity.
The ζ ratio plotted in Fig. B.1 is the correcting factor(as ε for the normal optical thickness). It must be appliedfor the smallest amin, i.e. where the more numerous grains(those with sizes close to amin) are not efficient scatter-ers. But in the same time (for the same smallest amin), ζis proportional to 1/
√amin and then the normal surface
density does not depend any more on the minimum grainsize.
The normal surface density σ⊥(r) can therefore be in-ferred from the observed surface brightness if the disk isseen almost pole-on. If the disk is not resolved, it is alsopossible to derive an upper limit on σ⊥(r) from the de-tection limit. Obviously, the main uncertainty on σ⊥(r)comes from the lack of strong constraints on the minimumand maximum grain sizes in the disk.
References
Allen, C. W. 1973, Astrophys. Quant., Third edition (TheAthlone Press LTD)
Augereau, J. C., Lagrange, A. M., Mouillet, D., Papaloizou,J. C. B., & Grorod, P. A. 1999a, A&A, 348, 557
Augereau, J. C., Lagrange, A. M., Mouillet, D., & Menard, F.1999b, A&AL, 350, 51
Aumann, H. H., Gillett, F. C., Beichman, C. A., et al. 1984,ApJL, 278, 23
Backman, D., & Paresce, F. 1993, in Protostars and PlanetsIII, ed. E. H. Levy, & Lunine (Tucson: University ofArizona Press) 1253
Barrado y Navascues, D., Stauffer, J. R., Song, I., & Caillault,J.-P. 1999, ApJL, 520, 123
Beust, H., Karmann, C., & Lagrange, A. M. 2000, A&A,submitted
Bohren, C. F., & Huffman, D. R. 1983, Absorption and scat-tering of light by small particles (Wiley, New-York)
Bouwman, J., et al. 2000, IAU Symp. S202 Manchester, UKCameron, A. G. W. 1995, Meteoritics, 30, 133Charbonneau, D. B., Brown, T. M., Latham, D. W., & Mayor,
M. 2000, ApJL, 529, 45Clarke, D., Smith, R. A., & Yudin, R. V. 1999, A&A, 347, 590Coulson, I. M., & Walther, D. M. 1995, MNRAS, 274, 977Coulson, I. M., Walther, D. M., & Dent, W. R. F. 1998,
MNRAS, 296, 934Crovisier, J., Leech, K., Bockelee-Morvan, D., et al. 1997, Sci,
275, 1904de Winter, D., Grady, C. A., van den Ancker, M. E., Perez,
M. R., & Eiroa, C. 1999, A&A, 343, 137Dunkin, S. K., Barlow, M. J., & Ryan, S. G. 1997, MNRAS,
286, 604Dutrey, A., Guilloteau, S., Duvert, G., et al. 1996, A&A, 309,
493Grady, C. A., Perez, M. R., Talavera, A., et al. 1996, A&AS,
120, 157Grady, C. A., Sitko, M. L., Bjorkman, K. S., et al. 1997, ApJ,
483, 449Greaves, J. S., Holland, W. S., Moriarty-Schieven, G., et al.
1998, ApJL, 506, 133Habing, H. J., Dominik, C., Jourdain de Muizon, M., et al.
1999, Nat, 401, 456Heap, S. R., Lindler, D. J., Lanz, T. M., et al. 2000, ApJ, 530
Henning, Th., Launhardt, R., Steinacker, J., & Thamm, E.1994
Henning, Th., Burkert, A., Launhardt, R., Leinert, C., &Stecklum, B. 1998, A&A, 336, 565
Holland, W. S., Greaves, J. S., Zuckerman, B., et al. 1998, Nat,392, 788
Hu, J. Y., The, P. S., & de Winter, D. 1989, A&A, 208, 213Jayawardhana, R., Fisher, R. S., & Telesco, C. M. 2000, Ph.D.
ThesisKenyon, S. J., & Hartmann, L. 1997, ApJ, 323, 714Krist, J. E., Stapelfeldt, K., Menard, F., Padgett, D., &
Burrows, C. 2000, ApJ, 538, 793Lagrange, A. M., Backman, D., & Artymowicz, P. 2000, in
PPIV, 639-672Lecavelier des Etangs, A., Vidal-Madjar, A., & Ferlet, R. 1996,
A&A, 307, 542Lin, D. N. C., & Pringle, J. E. 1990, ApJ, 358, 515Malfait, K., Waelkens, C., Waters, L. B. F. M., et al. 1998,
A&AL, 332, 25Mannings, V., & Sargent, A. I. 1997a, ApJ, 490, 792Mannings, V., Koerner, D. W., & Sargent, A. I. 1997b, Nat,
388, 555Miroshnichenko, A., Ivezic, Z., & Elitzur, M. 1997, ApJL, 475,
41Miroshnichenko, A., Ivezic, Z., Vinkovic, D., & Elitzur, M.
1999, ApJL, 520, 115Myers, J. R., Sande, C. B., Miller, A. C., Warren Jr., W. H., &
Tracewell, D. A. 1998, Sky2000 Master Catalog, GoddardSpace Flight Center, Flight Dynamics Division
Nakano, T. 1990, ApJL, 355, 43Padgett, D. L., Brandner, W., Stapelfeldt, K. R., et al. 1999,
AJ, 117, 1490-1504Pantin, E., Waelkens, C., & Lagage, P. O. 2000, A&AL, in
pressQueloz, D., Mayor, M., Weber, L., et al. 2000, A&A, 354, 99Schultz, A. B., Storrs, A. D., & Fraquelli, D., Instrument
Science Report NICMOS-99-006Sitko, M. L., Grady, C. A., Lynch, D. K., Russell, R. W., &
Hanner, M. S. 1999, ApJ, 510, 408Sylvester, R. J., Skinner, C. J., Barlow, M. J., & Mannings, V.
1996, MNRAS, 279, 915Sylvester, R. J., Skinner, C. J., & Barlow, M. J. 1997, MNRAS,
289, 831van den Ancker, M. E., The, P. S., Tjin A Djie, H. R. E., et al.
1997, A&A, 324, L33van den Ancker, M. E., de Winter, D., & Tjin A Djie, H. R. E.
1998, A&A, 330, 145Vieira, S. L. A., Pogodin, M. A., & Franco, G. A. P. 1999,
A&A, 345, 559Waelkens, C., Engelsman, E., Waters, L. B. F. M., Van der
Veen, W. E. C. J., & Trams, N. R. 1990a, in From Mirasto Planetary Nebulae: Wich Path for Stellar Evolution?,ed. M. O. Menessier, & A. Omont (Editions Frontieres,France) 470
Waelkens, C., Van Winckel, H., & Trams, N. R. 1990b, inIAU Symp. 145, Evolution of stars: The PhotosphericAbundance Connection (Poster Papers) 21, ed. Michaud,Tutukov, & Bergevin (Montreal, Canada)
Waters, L. B., & Waelkens, C. 1998, ARA&A, 36, 233Weinberger, A. J., Becklin, E. E., Schneider, G., et al. 1999,
ApJL, 525, 53Yudin, R. V., & Evans, A. 1998, A&AS, 131, 401Zuckerman, B., & Becklin, E. E. 1993, ApJ, 414, 793Zuckerman, B., Forveille, T., & Kastner, J. H. 1995, Nat, 373,
494