HSM: Celebrating 5 Years Together Brian Ray, PE Casey Bergh, PE.
22
M O VING TH IN KING FORWARD HSM: Celebrating 5 Years Together Brian Ray, PE Casey Bergh, PE
-
Upload
geoffrey-brassfield -
Category
Documents
-
view
219 -
download
0
Transcript of HSM: Celebrating 5 Years Together Brian Ray, PE Casey Bergh, PE.

M OVING THINK INGFORWARD
HSM: Celebrating 5 Years Together
Brian Ray, PECasey Bergh, PE

M OVING THINK INGFORWARD
HSM Promotes Quantitative Safety Methods
0 2 4 6 8 10 12 14 160
4
8
12
16
20
Crashes Expected Average
Years
Cra
sh
es

M OVING THINK INGFORWARD
HSM Promotes Quantitative Safety Methods
Source: NCHRP 480

M OVING THINK INGFORWARD
HSM: A Multipurpose Toolbox
• Planning, design, construction, operation, and maintenance
• System Planning– HSM Part B
• Project Planning & Preliminary Engineering– HSM Part B and Part C
• Design and Construction– HSM Part C and Part D
• Operations and Maintenance– HSM Part B, C and D
M OVING THINK INGFORWARD
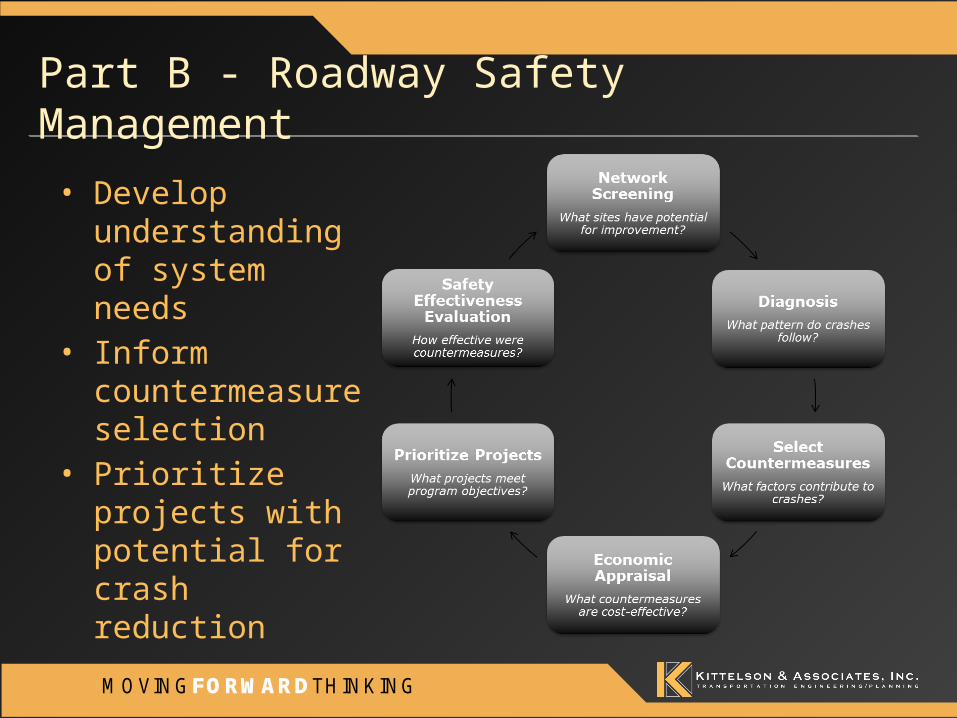
• Develop understanding of system needs
• Inform countermeasure selection
• Prioritize projects with potential for crash reduction
Part B - Roadway Safety Management

M OVING THINK INGFORWARD
• Multiple performance measures available– Simple to rigorous– Data has limited most
agencies
Part B Performance Measures
M OVING THINK INGFORWARD
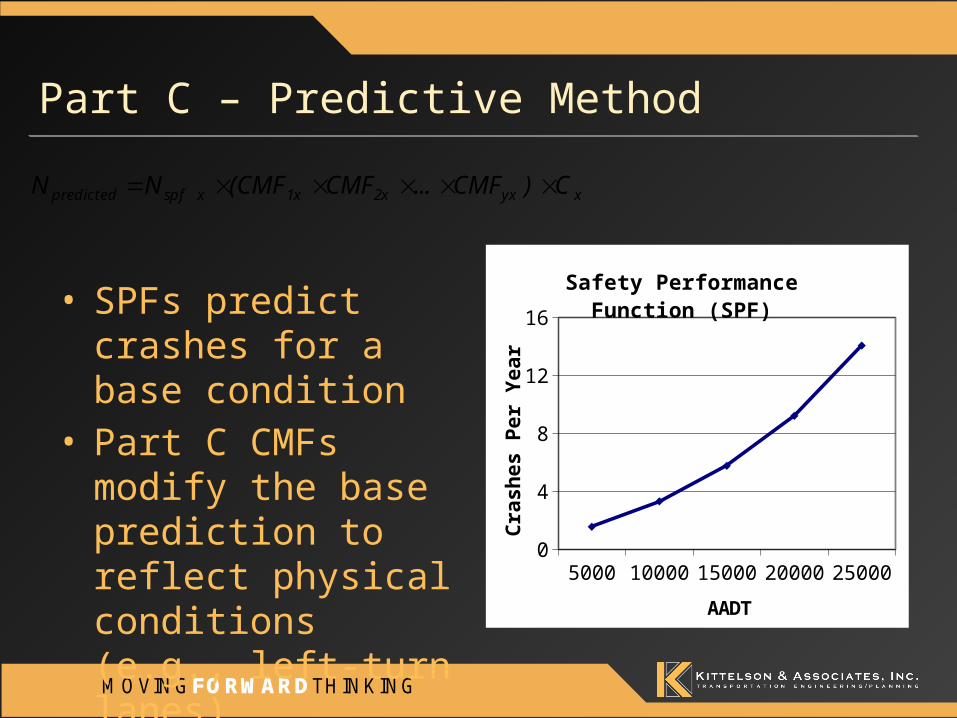
• SPFs predict crashes for a base condition
• Part C CMFs modify the base prediction to reflect physical conditions (e.g., left-turn lanes)
Part C – Predictive Method
5000 10000 15000 20000 250000
4
8
12
16
Safety Performance Function (SPF)
AADT
Cra
shes
Per
Yea
r
xyx2x1xx spfpredicted C)CMF...CMF(CMFN N

M OVING THINK INGFORWARD
• Provided in Part D and online in FHWA Clearinghouse• Estimate change in crash frequency associated with a
proposed modification
Location - ImprovementExpected
Crashes/Yr
Estimated Percent
Reduction
Planning Level Cost Estimate
$/Crash Mitigated Over
Design LifeAnderson Road Int. - FHWA Lane Narrowing 2.2 31% $45,000 $13,196
Anderson Road Int. - FHWA Splitter Island 2.2 68% $112,500 $15,040
Moon Road- Access Restriction / Right Turn Lane 1.9 26% $610,000 $61,741
Anderson Road- Single Lane Roundabout 2.2 71% $3.15 million $100,832
Part D - Crash Modification Factors

M OVING THINK INGFORWARD
• ODOT Pedestrian and Bike Safety Plan
• ODOT ARTS• TSPs
State/Region
• Clark County• Bend• Clackamas County
City/County
• Road Safety Audits• Intersection Traffic Control Evaluations• US 97 Corridor Safety Study
Intersection/Segment
HSM Applications in OR

M OVING THINK INGFORWARD
State/Region Network Screening Identifies Sites with Potential for Crash Reduction
• Segment screening based on sliding window
• ODOT ARTS systemic safety network screening focus areas– Roadway Departure– Bicycle and Pedestrian– Intersection
Milepost: 0 0.2 0.4 0.6 0.8 1.0
Segment #1
Segment #2
Segment #3
Segment #4
Segment #5
Segment #6

M OVING THINK INGFORWARD
ODOT Region 1 ARTS: Data-informed 300% Systemic Project Locations
• HSM Performance Measure: Equivalent Property Damage Only (EPDO) average crash frequency– Selected to reflect the severity of reported crashes
• Applied independently to intersections and segments
– Weighting Factors (consistent with SPIS):• 100 for Fatal or Injury A• 10 for Injury B or C• 1 for PDO
M OVING THINK INGFORWARD
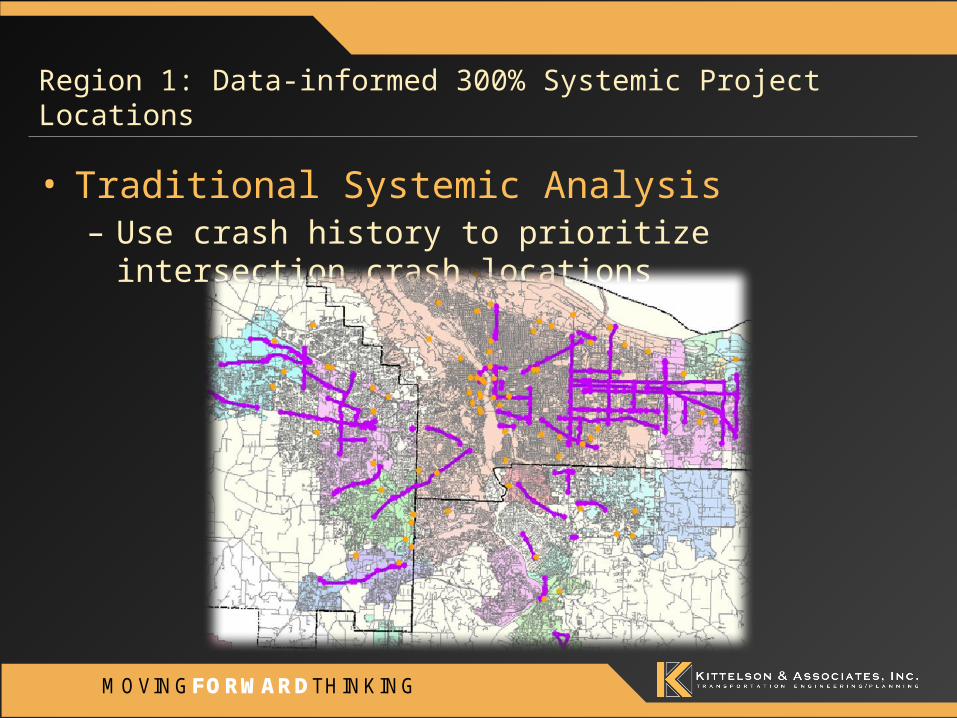
Region 1: Data-informed 300% Systemic Project Locations
• Traditional Systemic Analysis – Use crash history to prioritize intersection crash locations
M OVING THINK INGFORWARD
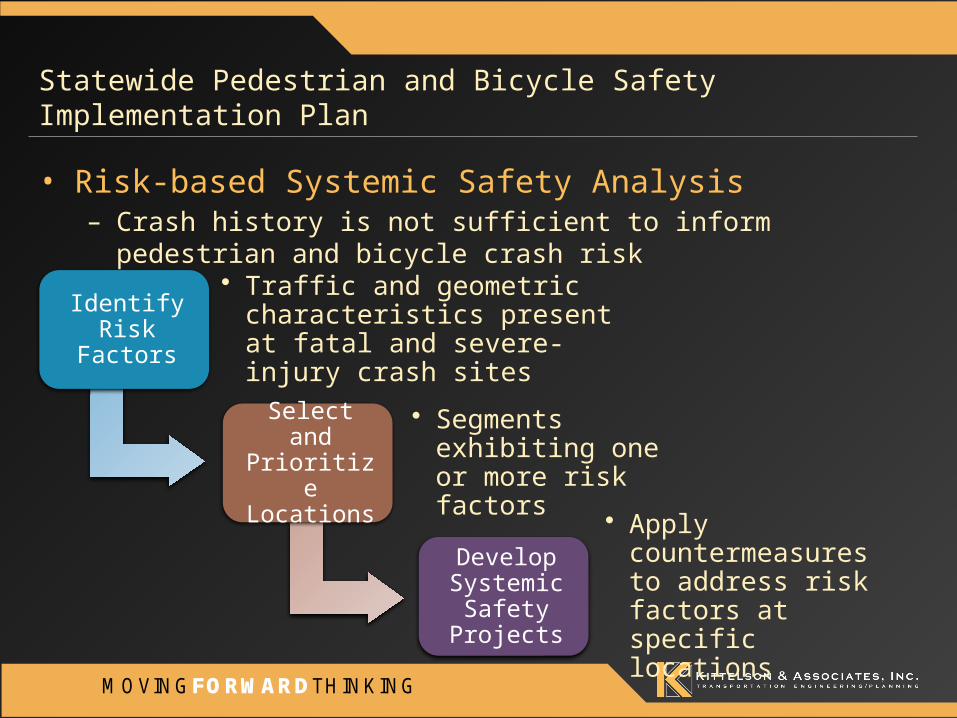
Statewide Pedestrian and Bicycle Safety Implementation Plan
• Risk-based Systemic Safety Analysis – Crash history is not sufficient to inform pedestrian and bicycle crash risk
Identify Risk Factors
• Traffic and geometric characteristics present at fatal and severe-injury crash sites
Select and Prioritize Locations
• Segments exhibiting one or more risk factors
Develop Systemic
Safety Projects
• Apply countermeasures to address risk factors at specific locations

M OVING THINK INGFORWARD
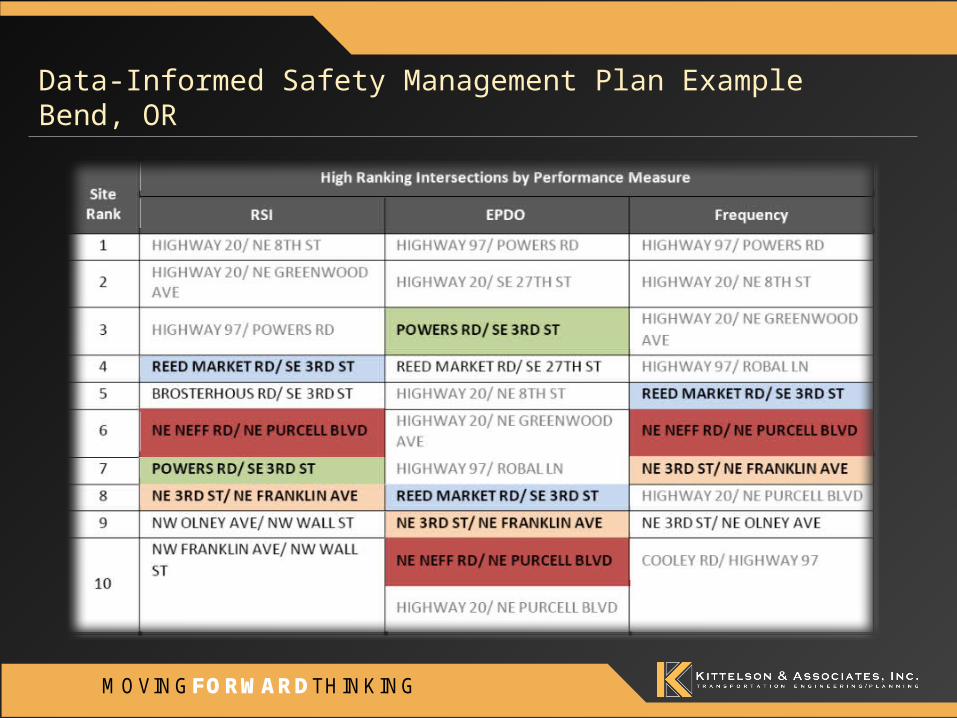
• Goal: Establish a safety management program– Understand crash
patterns– Prioritize safety projects– Improve collaboration
with other agencies
Data-Informed Safety Management Plan Example Bend, OR
Current Limitations
Perceived Safety
Reactive
One-time
Individual Efforts
Opportunities
Objective Safety
Proactive
Repeatable
Coordinated Efforts
M OVING THINK INGFORWARD
Data-Informed Safety Management Plan Example Bend, OR
M OVING THINK INGFORWARD
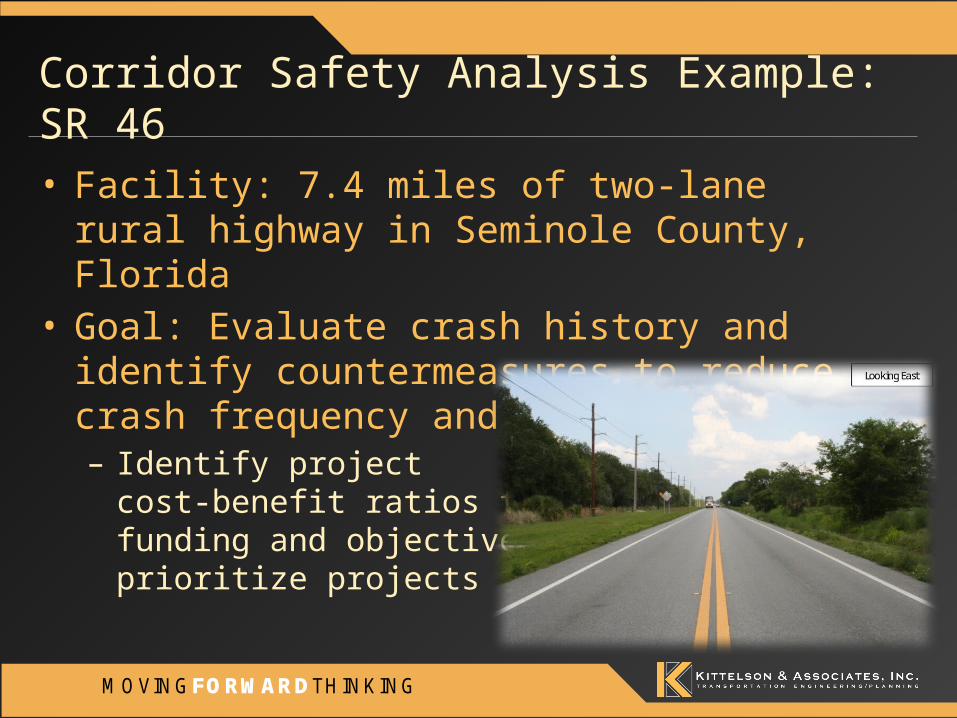
Corridor Safety Analysis Example: SR 46
• Facility: 7.4 miles of two-lane rural highway in Seminole County, Florida
• Goal: Evaluate crash history and identify countermeasures to reduce crash frequency and severity– Identify project
cost-benefit ratios to justify funding and objectively prioritize projects

M OVING THINK INGFORWARD
• Corridor crash trends– 30% rear-end– 24% run-off-road– 45% at night
• Contributing Factors– Careless Driving– Failure to Yield ROW– Speed
Corridor Safety Study Example: SR 46

M OVING THINK INGFORWARD
Corridor Safety Study Example: SR 46
LocationObserved Annual
Number of CrashesPredicted Number
of Crashes per Year
Expected Number of Crashes per
YearSR 415 to Richmond Ave 0.2 0.8 0.6
SR 46 / Richmond Avenue 1.8 1.1 1.4Richmond Ave to
Mullet Lake Park Road 6.2 12.7 10.4
SR 46 / Mullet Lake Park Road 0.2 1.6 0.9
Mullet Lake Park Rd to Avenue C 5.2 7.3 6.4
SR 46 / Avenue C 0.2 2.8 1.7Avenue C to CR 426 2.0 2.3 2.2
SR 46 / CR 426 5.0 3.1 3.6Total 20.8 31.7 26.8
M OVING THINK INGFORWARD
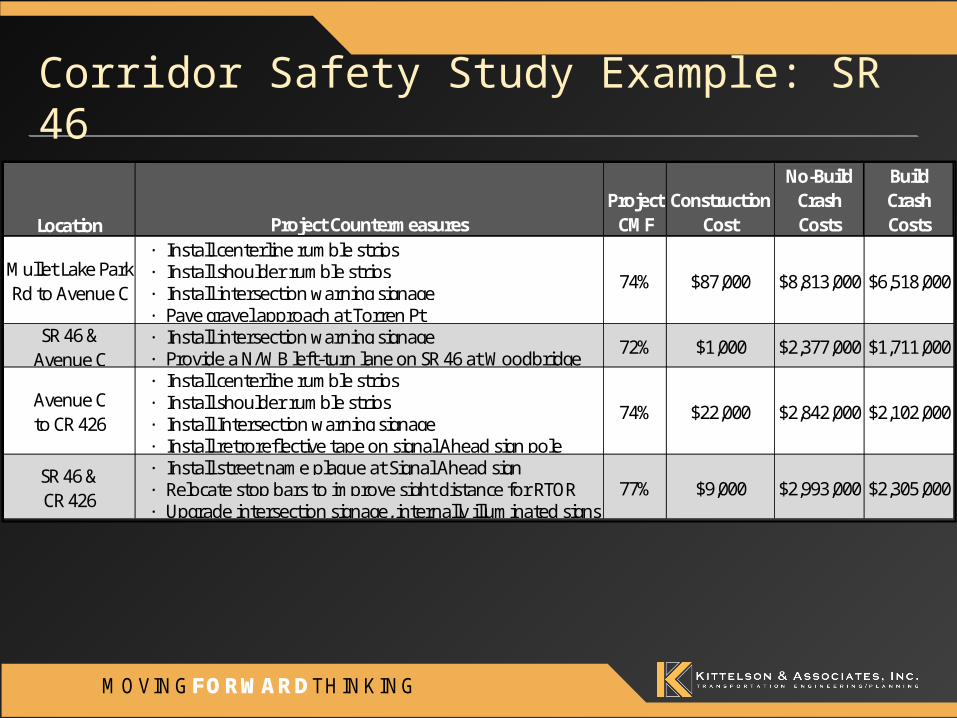
Corridor Safety Study Example: SR 46
Location Project CountermeasuresProject
CMFConstruction
Cost
No-Build Crash Costs
Build Crash Costs
Project Benefit
· Install centerline rumble strips· Install shoulder rumble strips· Install intersection warning signage· Pave gravel approach at Torren Pt· Install intersection warning signage· Provide a N/WB left-turn lane on SR 46 at Woodbridge · Install centerline rumble strips· Install shoulder rumble strips· Install Intersection warning signage· Install retroreflective tape on signal Ahead sign pole· Install street name plaque at Signal Ahead sign· Relocate stop bars to improve sight distance for RTOR· Upgrade intersection signage, internally illuminated signs
SR 46 &CR 426
77%
74%Avenue Cto CR 426
Mullet Lake Park Rd to Avenue C
74%
72%SR 46 &
Avenue C
$87,000 $8,813,000 $6,518,000 $2,295,000
$1,000 $2,377,000 $1,711,000 $666,000
$22,000 $2,842,000 $2,102,000 $740,000
$9,000 $2,993,000 $2,305,000 $688,000

M OVING THINK INGFORWARD
Corridor Safety Study Example: SR 46
• Tier I Projects• Low-cost rumble strips, signs
• Tier II Projects• Moderate-cost shoulder widening, turn lanes, intersection
lighting, etc.• Tier III Projects
• High-cost passing lane, access management
Project TierTotal
Project CostProject Cost Thru 2020
Project Benefit Thru 2020
Average B/C Ratio
I $472,000 $258,000 $7,495,000 29.1II $1,164,000 $636,000 $1,452,000 2.3III $2,870,000 $1,570,000 $1,769,000 1.1

M OVING THINK INGFORWARD
What’s Next?
• 2nd Edition Production through NCHRP 17-73– Incorporates Freeway and Ramp Prediction Models
(Available now)– Additional Models (e.g., arterials with six or more lanes and
one-way arterial streets)– Increased statistical rigor– Exclude Part D CMFs
M OVING THINK INGFORWARD
Questions?
• Brian Ray– [email protected] – 503-228-5230
• Casey Bergh– [email protected]– 541-312-8300