
HSESep2012
48
Monthly Safety Meeting for September 2012 Habshan 5 IGD Project, Abu Dhabi JGC-Tecnimont Joint Venture
-
Upload
habshan-igd-project -
Category
Documents
-
view
212 -
download
0
description
http://www.h5jvhse.com/Safety/Presentation/HSESep2012.pdf
Transcript of HSESep2012

Monthly Safety Meeting for September 2012
Habshan 5 IGD Project, Abu Dhabi JGC-Tecnimont Joint Venture

Presentation Agenda Project Lost Time Injury Frequency Rate & Recordable Frequency Rate;
Days and Man-hours without LTI and Days and Man-hours without RI;
JV Monthly Medical Consultation for September 2012;
JV Medical Examination for High Risk Workers for September 2012;
Cumulative Up to September 2012, FAC Body Part for the Month of September 2012;
Weather Report for September 2012;
Noncompliance with safe work Issues for the Month of September 2012;
Poor Housekeeping Issues for the Month of September 2012;
Equipment & Tool Issues for the Month of September 2012;
PPE Issues for the Month of September 2012;
JV Risk Assessment Graph, High Medium & Low Risk Analysis;
NM, UC & UA Observation Report and Trend Analysis for JV;
High Risk Summary for September 2012;
Area Violation, Incident Violation for the Month of September 2012;
Safety Moment, Toolbox Meeting, and Safety Alert;
Manpower & Observation Up to September 2012;
Training Man-Hours Up to September 2012;
Action Tracking Register Up to September 2012;
Environmental Implementation for September 2012
Traffic Management for September 2012
Monthly KPI and Target 2010 – 2012;
Safety Achievement for September 2012
Safety Campaign for October 2012

0.00
0.05
0.10
0.15
0.20
2010 2011 2012 PTD
0.13 0.10
0.06 0.06
TOTAL RECORDABLE INJURY RATE
- PROJECT YEARLY STATISTICS
0
5
10
158 7
11
7
FIRST AID CASE
COMPARISON TABLE
Lost Time Injury Frequency Rate
Construction Period To Date
Man-Hours 4,620,331 104,684,846
LTI 0 1
LTIR 0.00 0.002 0.01
Days w/o LTI 437 Up to 28/09/2012
Date of Last LTI Case 19-Jul-11
Man-Hours Worked Since Last LTI 70,064,185
Total Recordable Injury Rate
Construction Period To Date
Man-Hours 4,620,331 104,684,846
Recorable Case 0 32
TRIR 0.00 0.00 0.06 0.31
Days w/o Rec.
Case 162
Up to
28/09/2012
Date of Last Rec. Case 19-Apr-12
Man-Hours Worked Since Last RI 26,521,270
0.002
0.01
0
0.02
0.04
LTIR
MONTH
Lost Time Injury Frequency Rate Target LTIR = 0.02
0.06
0.32
0.00
0.20
0.40
0.60
0.80
1.00
1.20
TR
IR
MONTH
Total Recordable Injury Rate Target TRIR = 0.20
RIR, LTI x 1,000,000/man-hours - Company
RIR, LTI x 200,000/man-hours - JV
-0.01
0.00
0.01
0.02
20102011 2012 PTD
0.003 0.002 0.002
LOST TIME INJURY
FREQUENCY RATE - PROJECT
YEARLY STATISTICS

0
0
20,000,000
40,000,000
60,000,000
80,000,000
JV Days & Man-Hours without LTI
Up to September 2012
January 7, 2010
Starting Project
up to
Sep. 28, 2012
70,064,185
Date of Last LTI Case : 19th July 2011

0
0
10,000,000
20,000,000
30,000,000
JV Days & Man-Hours without Recordable
Up to September 2012
January 7, 2010
Starting Project
up to Sep. 28,
2012
26,521,270
Date of Last RI Case : 19th April 2012

JV Monthly Medical Consultation
For the Month of September 2012
1,151
247
442
23
385
499
1
0
1
1,608
390
43
165
46
317
275
4
0
1
1,045
0 500 1000 1500 2000
Respiratory Problem (Cold,Cough etc.)
Urinary Tract Infection
Gastro-Intestinal Disorder (Diarrhea Abdominal Pain)
Etc.
Systemic Problem Hypertension Etc.
EENT (Eyes, Ear, Nose and Throat)
Skin Infection / Allergy
First Aid Minor Scratches, Bruises, Laceration,
Abrassions, Insect Bites, Etc.
Major Accident/Injury
Heat Stress
Others, Backache, Muscular Pain, Toothache, Etc.
JGC TCM

Cumulative
Up to September 2012
MTC,
24
RWC, 7
LTI, 1
Recordable
FAC
474
Reportable
FAC-First Aid Case | MTC-Medical Treatment | RWC-Restricted Work Case
LTI-Lost Injury Incident

FAC by Body Part
For the Month of September 2012
Forehead,
3, 43%
Finger, 1,
15%
Hand, 1,
14%
Knee, 1,
14%
Wrist, 1,
14%

59 57
55 59
60
50
47
44
46
51
55
59 54
42 42
49 50
51 50
43
49 47
42
48 48
41
42 43 42
1.0
6.0
11.0
16.0
21.0
26.0
31.0
36.0
41.0
46.0
51.0
56.0
61.0
66.0
Habshan 5 PJ | Daily Weather Report
> 54 Heat Index (Temperature+Humidity)- Heat Stroke
or sunstroke immintent
Extreme Danger
41 - 53 Heat Index (Temperature Humidity)- Sunstroke, Heat Cramps,
or Heat Exhaustion likely Heatstroke possible with prolonged
exposure and physical activity
Danger
September 2012
0
030 2 5 8 2 17
Heat Related Illness Heat Stress Campaign Success 1. Training 2. Poster & Banner "BEAT the HEAT”
3. Water Station and Rest Shelter 4. 5 Minutes Response Team.
30 17
2011
2012


JV Observation Table
for September 2012
Equipment & Tool
PPE
Poor House Keeping
Noncompliance with safe work

Noncompliance with safe work (A)
4 2 25 16 30 19 12 7 94 109 137
198 154
212 180 170
983
677
0
200
400
600
800
1000
1200
September 2012-1,410 August 2012-1,619

6
1
18
5
2
12
8
9
11
36
5
46
36
29
58
47
68
84
93
214
195
0 100 200 300
Security
No Banksman
Grating
Falling Object
Restricted Area
STARRT CARD Violation
Signage
Confined Space
Hot Work
Hygiene
Worker Behavior
illumination
Trip/Slip/Fall
No Flagman
Health
Open Hole
Environmental
Cable Management
Access and egress
Barricade
Scaffolding
Noncompliance with safe work (A) – Others
September 2012 - 677 August 2012 - 983
8
2
17
4
14
13
19
7
10
49
20
33
29
26
27
45
28
63
50
120
93
0 50 100 150
Security
No Banksman
Grating
Falling Object
Restricted Area
STARRT CARD Violation
Signage
Confined Space
Hot Work
Hygiene
Worker Behavior
illumination
Trip/Slip/Fall
No Flagman
Health
Open Hole
Environmental
Cable Management
Access and egress
Barricade
Scaffolding

Poor House Keeping (B)
13 7
36 30 29 23 30 42
194
67
89 77
174
132
0
50
100
150
200
250
September 2012 - 378 August 2012 - 565
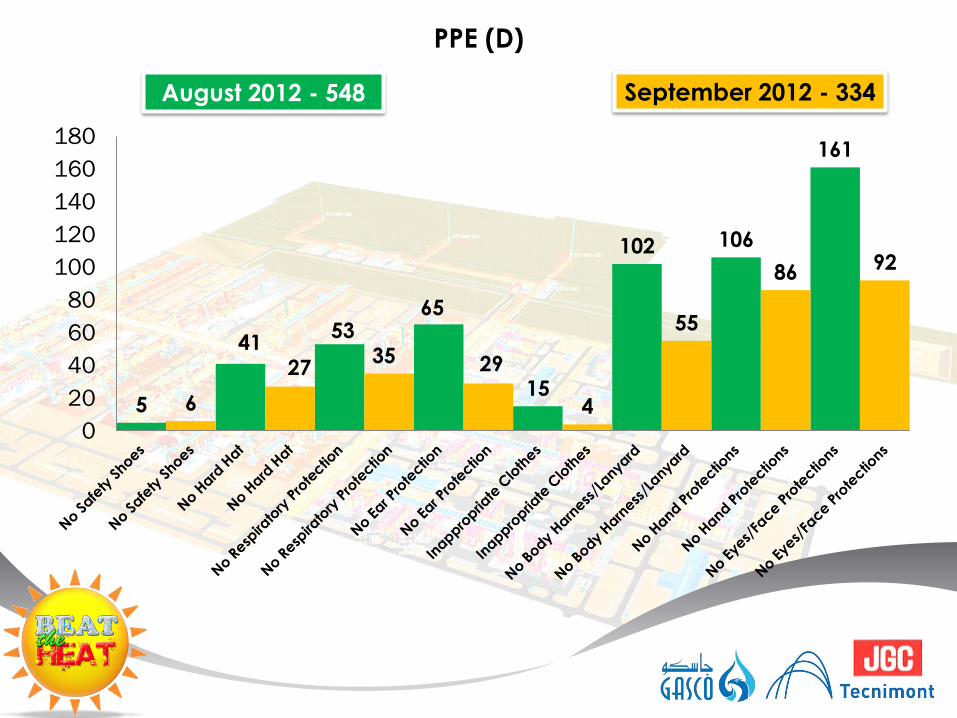
PPE (D)
5 6
41 27
53 35
65
29 15
4
102
55
106
86
161
92
0
20
40
60
80
100
120
140
160
180
September 2012 - 334 August 2012 - 548

Equipment & Tool (C)
5 0
74 64
27 22
58
135
25
69
32
48 40
55
30
54
0
20
40
60
80
100
120
140
160
September 2012 - 447 August 2012 - 291

768
1,562
693 702
1,118
749
0
200
400
600
800
1000
1200
1400
1600
1800
Low Medium High
August 2012 September 2012
August 2012 – 3,023
September 2012 – 2,569
JV Risk Assessment Graph

High Risk Summary
for September 2012 Equipment & Tool 83 Noncompliance with safe Work 414
Inappropriate safety device 45 Electrical Safety rule 84
Incorrect Usage 14 Excavation Safety 3
No Inspection with tag/sticker 2 Fire Prevention 108
No/wrong colour code 2 Lifting and rigging 68
Poor Maintenance 17 No JSA 1
Unauthorized Operation 2 PTW 9
Wrong equipment/tool 1 Traffic rule 14
Miscellaneous 216 Work at height 127
Access and egress 8 Poor House Keeping 22
Barricade 38 Cleaning of rubbish on site 2
Cable Management 8 Hazardous material storage 2
Confined Space 2 Material arrangement 9
Environmental 6 Material on access 4
Falling Object 2 Protruding Nails 2
Grating 15 Waste disposal 3
Health 4 PPE 14
Hot Work 2 No Body Harness/Lanyard 9
Hygiene 13 No Eyes/Face Protections 3
illumination 4 No Hand Protections 1
No Banksman 1 No Respiratory Protection 1
No Flagman 2
Open Hole 36
Restricted Area 8
Scaffolding 34
Security 4
Signage 2
STARRT CARD Violation 6
Trip/Slip/Fall 18
Worker Behavior 3
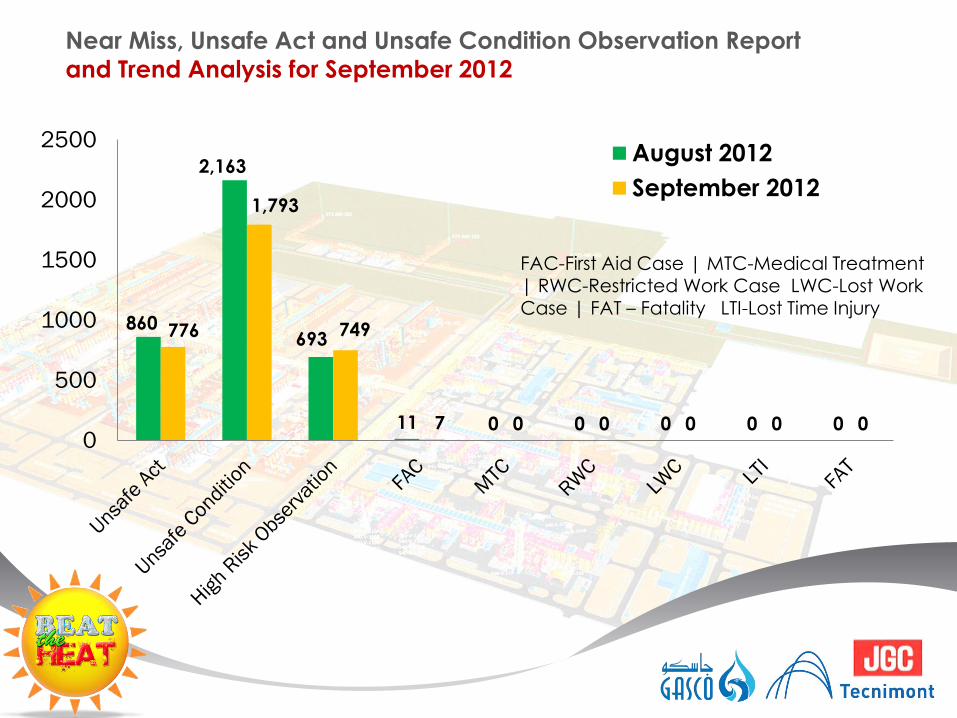
Near Miss, Unsafe Act and Unsafe Condition Observation Report
and Trend Analysis for September 2012
860
2,163
693
11 0 0 0 0 0
776
1,793
749
7 0 0 0 0 0 0
500
1000
1500
2000
2500August 2012
September 2012
FAC-First Aid Case | MTC-Medical Treatment | RWC-Restricted Work Case LWC-Lost Work Case | FAT – Fatality LTI-Lost Time Injury

Area Violation by Issues for the Month of September 2012
4
510 Observation Issues
238 Observation Issues
171 Observation Issues
2
1,273 Observation Issues
1 ADS
204 Observation Issues
1 Near Miss
173 Observation Issues
1 Near Miss
5 AD
1
1 AD

September-20-2012
Falling Object @ F100
Incident Violation Indicator Area Focus
for the Month of September 2012
Sept-25-2012
Scaffolding Violation
@ Unit 556
1st 1st

Safety Moment for September 2012

Toolbox Meeting for September 2012

Safety Alert for September 2012

17,783
2,569
Manpower Observation
Manpower and Observation
for September 2012

129,340
Total Training Man-Hours 1,874,654
Up to September 2012

Training Man-hours Completed 129,340
for September 2012
HOUR CRAFT
INDUCTION
Induction
Training
TCM JGC
1,132
1,140
100 100
PERMIT TO WORK, LOCKOUT TAG OUT
& SUPERVISOR SKILL LEADERSHIP
WORKSHOP
Supervisor Training
TCM JGC
STARRT/TOOLBOX
MEETING/COACHING
Site Training
TCM JGC
51,839
64,935
WORK AT HEIGHT
STARRT & JSA
CONFINED SPACE ENTRY
SAFE DRIVING
FIRE FIGHTING
IIF Orientation
Heat Stress
SAFE USE OF HAND GRINDER
Inert GAS
ELECTRICAL SAFETY
HAZARD IDENTIFICATION…
Specific
Training
TCM JGC
4,850
5,245


0
0.01
0.02
0.03
Lost time Injury Frequency Rate
Actual LTIR Target LTIR
0.00
0.20
0.40
0.60
0.80
1.00
1.20
Total Recordable Injuries Rate
Actual RIR Target RIR
Monthly KPI and Target 2010 – 2012 Up to September 2012
0
1
Fatality Rate
Actual Fatality Target Fatality
0500
1000150020002500300035004000
Observation + Near Misses Cases
Actual (Observation + Near Misses)
Target (Observation + Near Misses)
Target 0
Target 0.02
Target 0.20 Target >1000
1
0.002
0.06
2,569


Safety Campaign “Barricade” For September 2012
8,991 Tool Box Talk


Garbage Bin on All Areas


60 Million Safe Man-hours Achieved July 26, 2012
40 Million Safe Man-hours Achieved March 30, 2012
20 Million Safe Man-hours Achieved December 09, 2011
10 Million Safe Man-hours Achieved October 07, 2011
Safe Man-hours Target
2011 - 2012

Corporate HSE Audit Result 2011-2012
82.7%
87.2%
92%
86.1% 87.1%
93%
86.4%
88.6%
96%
94.3% 95.3%
94.8%
Health Safety Environmental
Mar 2011 Sep 2011 Mar 2012 Sep 2012

Understand Safety Rule at Site and
Follow them for Your Safety.
STOP UNSAFE WORK!!
Help your Friend and his Family
THANKS to your Friend
if he STOP your UNSAFEWORK!!


Safety Campaign
“Smoking on Designate Area Only”

JV Smoking & Flammables
Management Campaign
JV to immediately commence a campaign utilizing, Red Border Alert;
Tool Box Talk Topic;
Posters & Banners;
In Bus Flyers.
Proposed Anti Smoking Health Campaign.
Effective date for No Smoking on SITE is Saturday November 03rd Disciplinary Verbal Warning until Friday November 16th
Removal from SITE to Camp from Friday November 16th until Friday 23RD
Dismissal from project from date of gas in (To Be Confirmed)
Area Management; Complete process plant SITE, No Smoking except in designated locations, no
naked flame without PTW from Saturday November 03rd
Commissioning Areas, no smoking or smoking material, ignition sources, mobile
phones or cameras from Saturday November 03rd
Designated smoking shelters will be placed on the battery limits and in
construction areas (none will be provided in commissioning areas)

SAFETY FOR LIFE


