
HSEMar2012
38
Monthly Safety Meeting for March 2012 Habshan 5 IGD Project, Abu Dhabi JGC-Tecnimont Joint Venture
-
Upload
habshan-igd-project -
Category
Documents
-
view
212 -
download
0
description
http://www.h5jvhse.com/Safety/Documents/HSEMar2012.pdf
Transcript of HSEMar2012

Monthly Safety Meeting for March 2012
Habshan 5 IGD Project, Abu Dhabi JGC-Tecnimont Joint Venture

Presentation Agenda Project Lost Time Injury Frequency Rate & Recordable Frequency Rate;
Days and Man-hours without LTI and Days and Man-hours without RI;
JV Monthly Medical Consultation for March 2012;
Cumulative Up to March 2012;
FAC Body Part for the Month of March 2012;
Recordable Incidents for the Month of March 2012;
Noncompliance with safe work Issues for the Month of March 2012;
Poor Housekeeping Issues for the Month of March 2012;
Equipment & Tool Issues for the Month of March 2012;
PPE Issues for the Month of March 2012;
JV Risk Assessment Graph, High Medium & Low Risk Analysis;
NM, UC & UA Observation Report and Trend Analysis for JV;
Area Violation, Incident Violation for the Month of March 2012;
Safety Moment, Toolbox Meeting, and Safety Alert;
Manpower & Observation Up to March 2012;
Training Man-Hours Up to March 2012;
Action Tracking Register Up to March 2012;
JSO Register Up to March 2012
Monthly KPI and Target 2010 – 2012;
Traffic Management for March 2012;
IIF Culture;
HSE Campaign for April 2012 and Achievements

0.00
0.01
0.02
20102011 2012 PTD
0.003 0.003 0.003
LOST TIME INJURY
FREQUENCY RATE - PROJECT
YEARLY STATISTICS
0.00
0.05
0.10
0.15
0.20
2010 2011 2012 PTD
0.13 0.10
0.08 0.08
TOTAL RECORDABLE INJURY RATE
- PROJECT YEARLY STATISTICS
0
10
20
30
11 10 8
21
FIRST AID CASE
COMPARISON TABLE
Lost Time Injury Frequency Rate
Construction Period To Date
Man-Hours 6,317,220 74,677,591
LTI 0 1
LTIR 0.00 0.003 0.01
Days w/o LTI 255 Up to 30/03/2012
Date of Last LTI Case 19-Jul-11
Man-Hours Worked Since Last LTI 40,056,930
Total Recordable Injury Rate
Construction Period To Date
Man-Hours 6,317,220 74,677,591
Recorable Case 1 31
TRIR 0.03 0.11 0.08 0.42
Days w/o Rec.
Case 10
Up to
30/03/2012
Date of Last Rec. Case 20-Mar-12
Man-Hours Worked Since Last RI 1,817,628
0.003
0.01
0
0.02
0.04
LTIR
MONTH
Lost Time Injury Frequency Rate Target LTIR = 0.02
0.08
0.42
0.00
0.20
0.40
0.60
0.80
1.00
1.20
LTIR
MONTH
Total Recordable Injury Rate Target TRIR = 0.20
RIR, LTI x 1,000,000/man-hours - Company
RIR, LTI x 200,000/man-hours - JV

0
0
10,000,000
20,000,000
30,000,000
40,000,000
JV Days & Man-Hours without LTI
Up to March 2012
January 7, 2010
Starting Project
up to
Mar. 30, 2012
40,056,930
Date of Last LTI Case : 19th July 2011

0
0
5,000,000
10,000,000
15,000,000
JV Days & Man-Hours without Recordable
Up to March 2012
January 7, 2010
Starting Project
up to
Mar. 30,
2012
1,817,628
Date of Last RI Case : 20th March 2012


JV Monthly Medical Consultation
For the Month of March 2012
1,386
159
483
26
294
450
10
0
0
1,147
523
34
215
104
228
186
11
1
0
971
0 200 400 600 800 1000120014001600
Respiratory Problem (Cold,Cough etc.)
Urinary Tract Infection
Gastro-Intestinal Disorder (Diarrhea Abdominal Pain)
Etc.
Systemic Problem Hypertension Etc.
EENT (Eyes, Ear, Nose and Throat)
Skin Infection / Allergy
First Aid Minor Scratches, Bruises, Laceration,
Abrassions, Insect Bites, Etc.
Major Accident/Injury
Heat Stress
Others, Backache, Muscular Pain, Toothache, Etc.
JGC TCM

Cumulative
Up to March 2012
MTC,
23
RWC, 7
LTI, 1
Recordable
FAC
424
Reportable
FAC-First Aid Case | MTC-Medical Treatment | RWC-Restricted Work Case
LTI-Lost Injury Incident

FAC by Body Part
For the Month of March 2012
Head, 3,
14%
Eye, 1, 5%
Fingers, 9,
43%
Thigh, 2,
9%
Knee, 1,
5%
Legs, 3,
14%
Foot, 2,
10%


JV Observation Table
for March 2012
PPE
Equipment & Tool
Poor House Keeping
Noncompliance
with safe work

Noncompliance with safe work (B)
Confined Space Campaign| Argon Training
Housekeeping | Segregation of Waste
Internal HSE Audit| Audit Commence
February 2012-1,056
2
21
55
56
146
172
288
316
658
0 200 400 600 800
No JSA
PTW
Traffic rule
Excavation Safety
Lifting and rigging
Electrical Safety rule
Fire Prevention
Work at height
Others
6
31
47
54
121
150
153
244
736
0 200 400 600 800
No JSA
PTW
Traffic rule
Excavation Safety
Lifting and rigging
Electrical Safety rule
Fire Prevention
Work at height
Others
March 2012-1,542

Noncompliance with safe work (B) – Others
1
5 7
7
10
12
14
17 17
19
20
22
25
36
37
44
48
81
114
122
0 50 100 150
Security
No Banksman
No Flagman
Falling Object
Restricted Area
Trip/Slip/Fall
Hygiene
Confined Space
Health
Grating
Signage
illumination
Hot Work
Environmental
Open Hole
Worker Behavior
Cable Management
Access and egress
Barricade
Scaffolding
February 2012-658
1
3 3
11
12
14
16
17 18
23
24
25
26
36
38
38
76
93
119
143
0 50 100 150 200
No Banksman
Worker Behavior
Falling Object
Fall Prevention
Restricted Area
No Flagman
Confined Space
Signage
Trip/Slip/Fall
Hygiene
Hot Work
Health
Grating
illumination
Environmental
Open Hole
Access and egress
Cable Management
Scaffolding
Barricade
March 2012-736

Poor House Keeping (D)
February 2012-492
15
25
31
73
78
96
174
0 50 100 150 200
Hazardous material
storage
Segregation of waste
Protruding Nails
Waste disposal
Material on access
Material arrangement
Cleaning of rubbish
on site
42
48
96
113
125
141
212
0 100 200 300
Hazardous material
storage
Protruding Nails
Segregation of waste
Material on access
Material arrangement
Waste disposal
Cleaning of rubbish
on site
March 2012-777

Equipment & Tool (C)
February 2012-362
8
12
38
40
41
54
58
111
0 50 100 150
Inappropriate safety
device
Unauthorized Operation
Unauthorized
equipment/tool
No/wrong colour code
Incorrect Usage
Poor Maintenance
Wrong equipment/tool
No Inspection with
tag/sticker
15
16
43
44
52
54
65
91
0 50 100
Inappropriate safety
device
Unauthorized
equipment/tool
Unauthorized Operation
Wrong equipment/tool
Incorrect Usage
No/wrong colour code
Poor Maintenance
No Inspection with
tag/sticker
March 2012-380

PPE (A)
February 2012-352
8
16
33
37
41
44
69
104
0 50 100 150
No Safety Shoes
No Respiratory Protection
Inappropriate Clothes
No Hard Hat
No Ear Protection
No Body
Harness/Lanyard
No Hand Protections
No Eyes/Face Protections
14
23
26
48
58
61
132
154
0 50 100 150 200
No Safety Shoes
Inappropriate Clothes
No Respiratory Protection
No Hard Hat
No Ear Protection
No Body
Harness/Lanyard
No Hand Protections
No Eyes/Face Protections
March 2012-516

687
959
1274
819
1485
911
0
200
400
600
800
1000
1200
1400
1600
Low Medium High
February 2012 March 2012
February 2012 – 2,920
March 2012 – 3,215
JV Risk Assessment Graph

Near Miss, Unsafe Act and Unsafe Condition Observation Report
and Trend Analysis for March 2012
950
1,970
1,274
8 0 0 0 0 0
917
2,298
911
21 1 0 0 0 0 0
500
1000
1500
2000
2500February 2012
March 2012
FAC-First Aid Case | MTC-Medical Treatment
| RWC-Restricted Work Case LWC-Lost Work
Case | FAT – Fatality LTI-Lost Time Injury

Area Violation by Issues
for the Month of March 2012
5*
6
628 Observation Issues
611 Observation Issues
262 Observation Issues
3 Near Miss
9
1,714 Observation Issues
3 Near Miss
1 Near Miss
1 MTC 1

Mar-13-2012
Falling Object
Violation @ Unit 532
3rd
Mar-20-2012
Falling Object
Violation @ Temp.
1st
Incident Violation Indicator Area Focus
for the Month of March 2012
2nd
3rd
Mar-21-2012
Falling Object
Violation @ C200
Mar-27-2012
Falling Object
Violation @ C200
Mar-18-2012
Falling Object
Violation @ Unit 531
Mar-05-2012
Grating Violation @
Unit 532 1st 2nd
1st Mar-03-2012
Falling Object
Violation @ C200
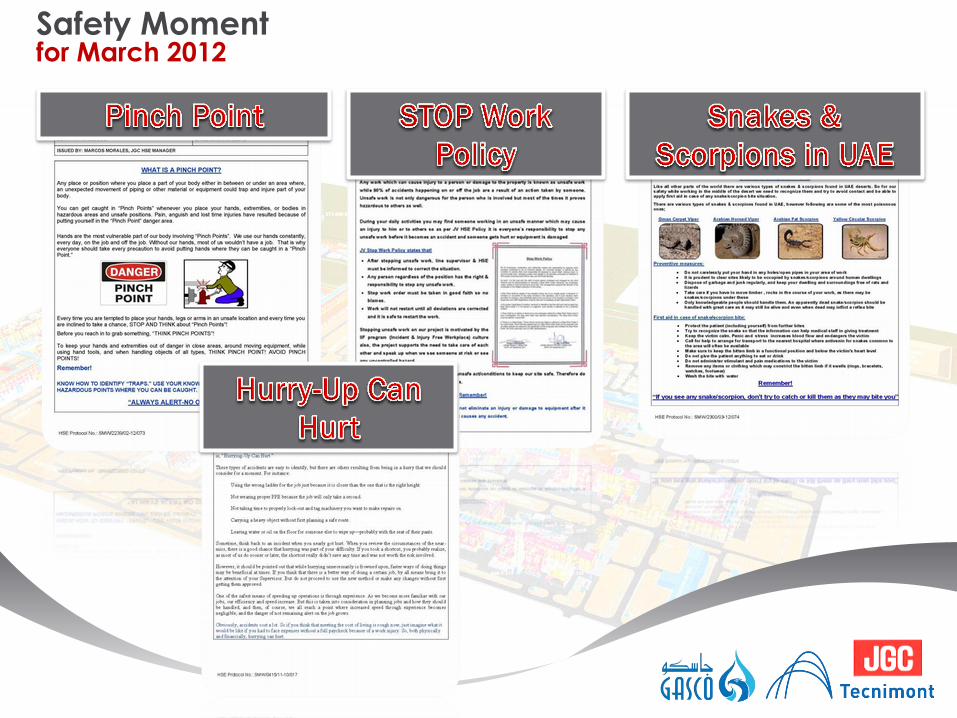
Safety Moment for March 2012

Toolbox Meeting for March 2012

21,186
3,215
Manpower Observation
Manpower and Observation
for March 2012

264,447
Total Training Man-Hours 800,836
Up to March 2012

Action Tracking Register Up to March 2012
5,907
399 298 95 153 22 37
5,882
388 298
76 137 22 35 25 11 0 19 16 0 2 0
1000
2000
3000
4000
5000
6000
7000
Safety
Walkdown
JV Site Audit GASCO
Observation
JV HSE Meeting JV Food Audit Corporate Audit Hygiene and
Sanitary
Facilities
Raised Closed Open
6,911 6,838
73
Total Action Tracking
Register

JSO Observation Register Up to March 2012
http://www.h5jvhse.com/index2.php


Monthly KPI and Target 2010 – 2012 Up to March 2012
0
1
Fatality Rate
Actual Fatality Target Fatality
0
0.01
0.02
0.03
Lost time Injury Frequency Rate
Actual LTIR Target LTIR
0.000.200.400.600.801.001.20
Total Recordable Injuries Rate
Actual RIR Target RIR
0
500
1000
1500
2000
2500
3000
Observation + Near Misses Cases
Actual (Observation + Near Misses)
Target (Observation + Near Misses)
Target 0
Target 0.02
Target 0.20
Target >1000
1
0.003
0.08
3,215

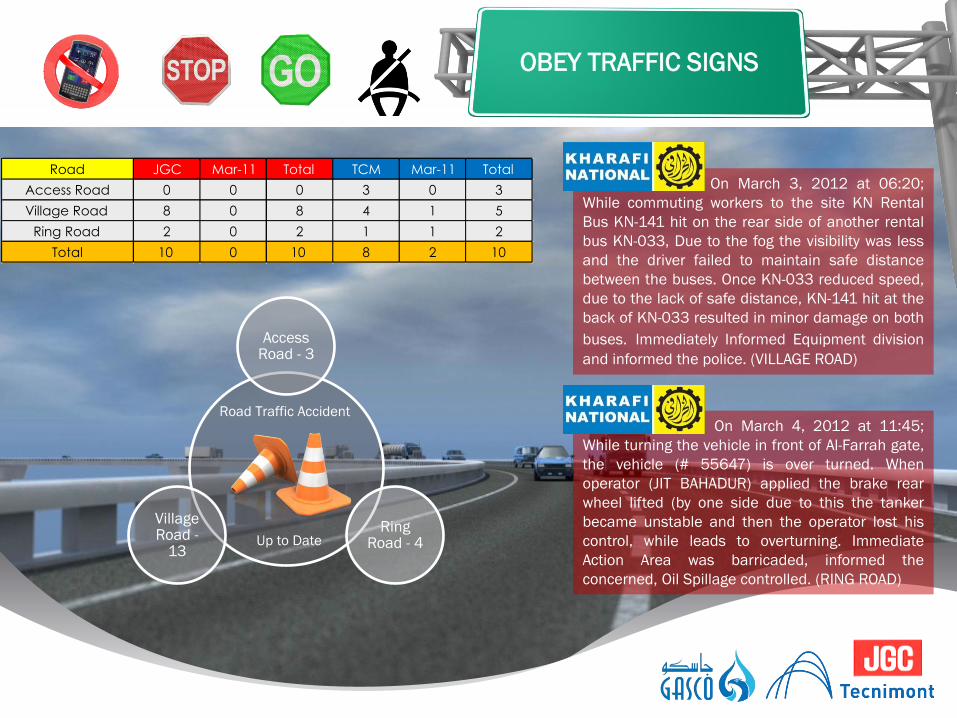
On March 3, 2012 at 06:20;
While commuting workers to the site KN Rental
Bus KN-141 hit on the rear side of another rental
bus KN-033, Due to the fog the visibility was less
and the driver failed to maintain safe distance
between the buses. Once KN-033 reduced speed,
due to the lack of safe distance, KN-141 hit at the
back of KN-033 resulted in minor damage on both
buses. Immediately Informed Equipment division
and informed the police. (VILLAGE ROAD)
Access Road - 3
Ring Road - 4
Village Road -
13
Road Traffic Accident
OBEY TRAFFIC SIGNS
Up to Date
Road JGC Mar-11 Total TCM Mar-11 Total
Access Road 0 0 0 3 0 3
Village Road 8 0 8 4 1 5
Ring Road 2 0 2 1 1 2
Total 10 0 10 8 2 10
On March 4, 2012 at 11:45;
While turning the vehicle in front of Al-Farrah gate,
the vehicle (# 55647) is over turned. When
operator (JIT BAHADUR) applied the brake rear
wheel lifted (by one side due to this the tanker
became unstable and then the operator lost his
control, while leads to overturning. Immediate
Action Area was barricaded, informed the
concerned, Oil Spillage controlled. (RING ROAD)


HSE Campaign Falling Object & Heat Stress

HSE Posters

Target 60 Millions Safe Man-hours
40 Millions Safe Man-hours Achieved March 30, 2012
20 Millions Safe Man-hours Achieved December 09, 2011
10 Millions Safe Man-hours Achieved October 07, 2011
Safe Man-hours Target
2011 - 2012
255 Days without Lost Time Injury

Corporate HSE Audit Result For March 2012

SAFETY FOR LIFE


