HSBC Holdings plc Pillar 3 Disclosures at 30 June 2021
56
HSBC Holdings plc Pillar 3 Disclosures at 30 June 2021
Transcript of HSBC Holdings plc Pillar 3 Disclosures at 30 June 2021

HSBC Holdings plcPillar 3 Disclosures at 30 June 2021

ContentsPage
Introduction 2
Highlights 2
Regulatory framework for disclosures 2
Pillar 3 disclosures 2
Key metrics 3
Regulatory developments 4
Linkage to the Interim Report 5
Treasury risk 7
Own funds 7
Leverage ratio 9
Capital buffers 10
Pillar 1 minimum capital requirements and RWA flow 10
Minimum requirement for own funds and eligible liabilities 13
Credit risk 20
Credit quality of assets 21
Non-performing and forborne exposures 24
Defaulted exposures 30
Risk mitigation 31
Counterparty credit risk 40
Securitisation 45
Market risk 49
Other information 52
Abbreviations 52
Cautionary statement regarding forward-looking statements 53
Contacts 54
.
Tables Ref Page
1 Key metrics (KM1/IFRS9-FL) a 3
2 Reconciliation of balance sheets – financial accounting to regulatory scope of consolidation 6
3 Own funds disclosure b 7
4 Leverage ratio common disclosure (LRCom) a 9
5 Summary reconciliation of accounting assets and leverage ratio exposures (LRSum) b 9
6 Leverage ratio – split of on-balance sheet exposures (excluding derivatives, SFTs and exempted exposures) (LRSpl) a 10
7 Overview of RWAs (OV1) b 11
8 RWA flow statements of credit risk exposures under IRB (CR8) 11
9 RWA flow statements of CCR exposures under IMM (CCR7) 12
10 RWA flow statements of market risk exposures under IMA (MR2-B) 12
11.i Key metrics of the European resolution group (KM2) a 14
11.ii Key metrics of the Asian resolution group (KM2) 14
11.iii Key metrics of the US resolution group (KM2) 15
12 TLAC composition (TLAC1) a 16
13 HSBC Holdings plc creditor ranking (TLAC3) 17
14 HSBC UK Bank plc creditor ranking (TLAC2) 17
15 HSBC Bank plc creditor ranking (TLAC2) 18
16 HSBC Asia Holdings Ltd creditor ranking (TLAC3) 18
17 The Hongkong and Shanghai Banking Corporation Ltd creditor ranking (TLAC2) 18
18 Hang Seng Bank Ltd creditor ranking (TLAC2) 19
19 HSBC North America Holdings Inc. creditor ranking (TLAC3) 19
20 Credit risk summary by approach 20
21 Credit quality of exposures by exposure class and instrument¹,² (CR1-A) 21
22 Credit quality of exposures by industry or counterparty types¹,²,³ (CR1-B) 23
23 Credit quality of exposures by geography¹,²,³ (CR1-C) 24
24 Credit quality of forborne exposures 25
25 Collateral obtained by taking possession and execution processes 25
26 Credit quality of performing and non-performing exposures by past due days 26
27 Performing and non-performing exposures and related provisions 27
28 Loans and advances subject to legislative and non-legislative moratoria 29
29 Loans and advances subject to legislative and non-legislative moratoria by residual maturity 29
30 Newly originated loans and advances provided under newly applicable public guarantee schemes 30
31 Changes in stock of general and specific credit risk adjustments (CR2-A) 30
32 Changes in stock of defaulted loans and debt securities (CR2-B) 30
33 Credit risk mitigation techniques – overview (CR3) 31
34 Standardised approach – CCF and CRM effects (CR4) b 31
35 Standardised approach – exposures by asset classes and risk weights (CR5) b 32
36 IRB – Credit risk exposures by portfolio and PD range (CR6) a 33
37 IRB – Effect on RWA of credit derivatives used as CRM techniques (CR7) 39
38 Specialised lending on slotting approach (CR10) 39
39 Analysis of counterparty credit risk exposure by approach (excluding centrally cleared exposures) (CCR1) 40
40 Credit valuation adjustment capital charge (CCR2) 40
41 Standardised approach – CCR exposures by regulatory portfolio and risk weights (CCR3) 40
42 IRB – CCR exposures by portfolio and PD scale (CCR4) 41
43 Impact of netting and collateral held on exposure values (CCR5-A) 43
44 Composition of collateral for CCR exposure (CCR5-B) 43
45 Exposures to central counterparties (CCR8) 44
46 Credit derivatives exposures (CCR6) 44
47 Securitisation exposures in the non-trading book (SEC1) 46
48 Securitisation exposures in the trading book (SEC2) 47
49 Securitisation exposures in the non-trading book and associated regulatory capital requirements – bank acting as originator or as sponsor (SEC3) 47
50 Securitisation exposures in the non-trading book and associated capital requirements – bank acting as investor (SEC4) 48
51 Market risk under standardised approach (MR1) 49
52 Market risk under IMA (MR2-A) 49
53 IMA values for trading portfolios (MR3) 50
54 Comparison of VaR estimates with gains/losses (MR4) 51
The Group has adopted the EU’s regulatory transitional arrangements for IFRS 9 ‘Financial Instruments’.The application of the transitional arrangements to the disclosures is indicated in the table of contents as follows:
a. Some figures have been prepared on an IFRS 9 transitional basis. Details are provided in the table footnotes.
b. All figures have been prepared on an IFRS 9 transitional basis.
All other tables report numbers on the basis of the full adoption of IFRS 9.
This document should be read in conjunction with the Interim Report 2021, which has been published on our website www.hsbc.com
Certain defined terms
Unless the context requires otherwise, ‘HSBC Holdings’ means HSBC Holdings plc and ‘HSBC’, the ‘Group’, ‘we’, ‘us’ and ‘our’ refer to HSBC Holdings together with its subsidiaries. Within this document the Hong Kong Special Administrative Region of the People’s Republic of China is referred to as ‘Hong Kong’. When used in the terms ‘shareholders’ equity’ and ‘total shareholders’ equity’, ‘shareholders’ means holders of HSBC Holdings ordinary shares and those preference shares and capital securities issued by HSBC Holdings classified as equity. The abbreviations ‘$m’, ‘$bn’ and ‘$tn’ represent millions, billions (thousands of millions) and trillions of US dollars, respectively.
Pillar 3 Disclosures at 30 June 2021
1 HSBC Holdings plc 2Q21 Pillar 3

Introduction
Highlights
Common equity tier 1 (‘CET1’) capital ratio of 15.6%, down 0.3 percentage points from 31 December 2020, reflecting an increase in risk-weighted assets (‘RWAs’) from lending growth and a decrease in CET1 capital including the impact of foreseeable dividends.
CET1 capital ($bn) and CET1 ratio (%)
128.4136.1 134.6
15.0%
15.9%15.6%
30 Jun 2020 31 Dec 2020 30 Jun 2021
Risk-weighted assets by risk type and global business ($bn)
$862.3bn
702.9
39.3
25.5
94.6
Credit risk
Counterparty credit risk
Market risk
Operational risk
Regulatory framework for disclosures
We are supervised on a consolidated basis in the UK by the Prudential Regulation Authority (‘PRA’), which receives information on the capital adequacy of, and sets capital requirements for, the Group as a whole. Individual banking subsidiaries are directly regulated by their local banking supervisors, which set and monitor their local capital adequacy
requirements. In most jurisdictions, non-banking financial subsidiaries are also subject to the supervision and capital requirements of local regulatory authorities.
At a consolidated Group level, capital is calculated for prudential regulatory reporting purposes using the Basel III framework of the Basel Committee on Banking Supervision (‘Basel’), as implemented by the European Union (‘EU’) in the revisions to the Capital Requirements Regulation as implemented (‘CRR II’), and in the PRA Rulebook for the UK banking industry. The regulators of Group banking entities outside the EU are at varying stages of implementing the Basel III framework, so the Group may have been subject to local regulations in the first half of 2021 that were on the basis of the Basel I, II or III frameworks.
The Basel Committee’s framework is structured around three ‘pillars’: Pillar 1, minimum capital requirements; Pillar 2, supervisory review process; and Pillar 3, market discipline. The aim of Pillar 3 is to produce disclosures that allow market participants to assess the scope of banks’ application of the Basel Committee’s framework. It also aims to assess their application of the rules in their jurisdiction, capital conditions, risk exposures and risk management processes, and hence their capital adequacy.
All European legislation that was in place on 31 December 2020 was onshored into UK law, subject to certain amendments. The PRA granted a transitional provision to allow the delay of implementation of those changes, subject to certain exemptions, until 31 March 2022.
Therefore, following the end of the transition period following the UK’s withdrawal from the EU, any reference to EU regulations and directives, including European Banking Authority (‘EBA’) technical standards, should be read as a reference to the UK’s version of such regulation and/or directive, onshored into UK law under the European Union (Withdrawal) Act 2018, as amended.
EU regulations and directives (including EBA technical standards) will continue to be relevant for HSBC’s EU subsidiaries.
Pillar 3 disclosures
Our Pillar 3 Disclosures at 30 June 2021 comprises quantitative and qualitative information required under Pillar 3. These disclosures are made in accordance with the requirements of CRR II and associated European guidance. They are supplemented by specific additional requirements of the PRA and discretionary disclosures on our part.
The Pillar 3 disclosures are governed by the disclosure policy framework approved by the Group Audit Committee.
To give insight into movements during the year, we provide comparative figures, commentary on variances and flow tables for capital requirements. In all tables where the term ‘capital requirements’ is used, this represents the minimum total capital charge set at 8% of RWAs by article 92 of the Capital Requirements Regulation.
Where disclosures have been enhanced, or are new, we do not generally restate or provide comparatives. Wherever specific rows and columns in the tables prescribed by the EBA or Basel are not applicable or immaterial to our activities, we omit them and follow the same approach for comparatives.
Pillar 3 requirements may be met by inclusion in other disclosure media. Where we adopt this approach, references are provided to the relevant pages of the Interim Report 2021 or to other documents.
HSBC Holdings plc 2Q21 Pillar 3 2

Key metrics
Table 1: Key metrics (KM1/IFRS9-FL)
At
30 Jun 31 Mar 31 Dec 30 Sep 30 Jun
Ref* 2021 2021 2020 2020 2020
Available capital ($bn)1,2
1 Common equity tier 1 (‘CET1’) capital^ 134.6 134.5 136.1 133.4 128.4
2 CET1 capital as if IFRS 9 transitional arrangements had not been applied 133.8 133.6 134.9 132.2 127.4
3 Tier 1 capital^ 158.3 160.2 160.2 157.4 152.5
4 Tier 1 capital as if IFRS 9 transitional arrangements had not been applied 157.5 159.3 159.0 156.2 151.4
5 Total capital^ 181.1 183.1 184.4 181.8 177.2
6 Total capital as if IFRS 9 transitional arrangements had not been applied 180.3 182.2 183.2 180.7 176.1
Risk-weighted assets ($bn)
7 Total RWAs^ 862.3 846.8 857.5 857.0 854.6
8 Total RWAs as if IFRS 9 transitional arrangements had not been applied 861.5 846.1 856.6 856.6 854.1
Capital ratios (%)2
9 CET1^ 15.6 15.9 15.9 15.6 15.0
10 CET1 as if IFRS 9 transitional arrangements had not been applied 15.5 15.8 15.7 15.4 14.9
11 Tier 1^ 18.4 18.9 18.7 18.4 17.8
12 Tier 1 as if IFRS 9 transitional arrangements had not been applied 18.3 18.8 18.6 18.2 17.7
13 Total capital^ 21.0 21.6 21.5 21.2 20.7
14 Total capital as if IFRS 9 transitional arrangements had not been applied 20.9 21.5 21.4 21.1 20.6
Additional CET1 buffer requirements as a percentage of RWA (%)
Capital conservation buffer requirement 2.5 2.5 2.5 2.5 2.5
Countercyclical buffer requirement 0.2 0.2 0.2 0.2 0.2
Bank G-SIB and/or D-SIB additional requirements 2.0 2.0 2.0 2.0 2.0
Total of bank CET1 specific buffer requirements 4.7 4.7 4.7 4.7 4.7
Total capital requirement (%)3
Total capital requirement 10.9 11.0 11.0 11.1 11.1
CET1 available after meeting the bank’s minimum capital requirements 9.5 9.7 9.7 9.3 8.8
Leverage ratio4
15 Total leverage ratio exposure measure ($bn)^ 2,968.5 2,930.2 2,897.1 2,857.4 2,801.4
16 Leverage ratio (%)^ 5.3 5.4 5.5 5.4 5.3
17 Leverage ratio as if IFRS 9 transitional arrangements had not been applied (%) 5.3 5.4 5.4 5.4 5.3
Liquidity coverage ratio (‘LCR’)5
Total high-quality liquid assets ($bn) 659.3 695.1 677.9 654.2 654.4
Total net cash outflow ($bn) 493.7 487.0 487.3 446.3 442.9
LCR ratio (%) 133.5 142.7 139.1 146.6 147.8
* The references in this and subsequent tables identify lines prescribed in the relevant EBA template where applicable and where there is a value.^ Figures have been prepared on an IFRS 9 transitional basis.1 Where applicable, our reporting throughout this document also reflects government relief schemes intended to mitigate the impact of the
Covid-19 outbreak.2 Capital figures and ratios are reported on a CRR II transitional basis for capital instruments. 3 Total capital requirement is defined as the sum of Pillar 1 and Pillar 2A capital requirements set by the PRA. The minimum requirements represent
the total capital requirement to be met by CET1.4 Leverage ratio is calculated using the CRR II end point basis for capital. 5 The EU's regulatory transitional arrangements for IFRS 9 ‘Financial Instruments’ in article 473a of the Capital Requirements Regulation do not
apply to liquidity coverage measures. LCR is calculated as at the end of each period rather than using average values. For further details, refer to page 90 of the Interim Report 2021.
We have adopted the regulatory transitional arrangements for IFRS 9 ‘Financial Instruments’, including paragraph four within article 473a of the Capital Requirements Regulation. These transitional arrangements permit banks to add back to their capital base a proportion of the impact that IFRS 9 has upon their loan loss allowances during the first five years of use. The impact of IFRS 9 on loan loss allowances is defined as:
• the increase in loan loss allowances on day one of IFRS 9 adoption; and
• any subsequent increase in expected credit losses (‘ECL’) in the non-credit-impaired book thereafter.
Any add-back must be tax affected and accompanied by a recalculation of deferred tax, exposure and RWAs. The impact is
calculated separately for portfolios using the standardised (‘STD’) and internal ratings-based (‘IRB’) approaches. For IRB portfolios, there is no add-back to capital unless loan loss allowances exceed regulatory 12-month expected losses.
The EU’s CRR ‘Quick Fix’ relief package enacted in June 2020 increased from 70% to 100% the relief that banks may take for loan loss allowances recognised since 1 January 2020 on the non-credit-impaired book.
In the current period, the add-back to CET1 capital amounted to $1.0bn under the STD approach with a tax impact of $0.2bn. At31 December 2020, the add-back to the capital base under the STD approach was $1.6bn with a tax impact of $0.4bn.
Pillar 3 Disclosures at 30 June 2021
3 HSBC Holdings plc 2Q21 Pillar 3

Regulatory developments
Amendments to the Capital Requirements Regulation (‘CRR II’) and the Basel III Reforms
The Basel Committee on Banking Supervision (‘Basel’) completed the Basel III Reforms in July 2020 when it published the final revisions to the CVA framework. The package is scheduled to be implemented on 1 January 2023, with a five-year transitional provision for the output floor. The final standards will need to be transposed into the relevant local law before coming into effect.
The CRR II represents the first tranche of changes to the regulatory framework to implement the Basel III Reforms, including the changes to the market risk rules under the Fundamental Review of the Trading Book (‘FRTB’), the standardised approach for measuring counterparty risk, the equity investments in funds rules, amendments to the large exposures rules, the new leverage ratio rules and the implementation of the net stable funding ratio.
The CRR II rules were originally drafted when the UK was a member of the EU. However, since parts of the CRR II were not in force before the UK’s withdrawal from the EU, the UK will implement its own rules. Her Majesty’s Treasury (‘HMT’) and the PRA recently finalised the UK’s version of the CRR II for implementation on 1 January 2022. In relation to equity investments in funds, HMT has removed the equivalence provisions that were embedded in the EU’s original version of the CRR II. As a result, firms will be able to determine the RWAs using a look-through approach for funds outside of the UK without the need for equivalence. In addition, HMT has delayed the requirement for reporting to commence on the standardised approach to the FRTB until it becomes a binding capital requirement.
In June 2021, the Bank of England's ('BoE') Financial Policy Committee ('FPC') and the PRA published consultations outlining the CRR II changes to the leverage ratio framework. The UK’s minimum leverage ratio requirement will be 3.25%, plus buffers based upon a firm’s countercyclical and global systemically important bank (‘G-SIB’) buffers. The minimum tier 1 requirement must be met by at least 75% CET1, with the buffers being met with 100% of CET1. Central bank reserves will continue to be excluded from the leverage ratio exposure measure, as will the Bounce Back Loan Schemes loans. However, the PRA has not chosen to adopt many of the EU’s exemptions from the measure, such as those in relation to government guaranteed export credits. There are also no plans to introduce mandatory capital distribution restrictions for firms that breach their leverage ratio buffers. Broadly, the rules will be implemented on 1 January 2022.
In addition to the final rules on CRR II, the PRA has also reversed the beneficial changes to the treatment of software assets that were implemented as part of the EU’s response to Covid-19. From 1 January 2022, software assets must be deducted in full from CET1 capital.
The PRA will consult on the implementation of the remaining elements of the Basel III Reforms later in the year. There remains a significant degree of uncertainty in the impact due to the number of national discretions and the need for further supporting technical standards to be developed. The UK’s implementation of the remaining elements of the Basel III Reforms is currently scheduled to be on 1 January 2023, consistent with Basel’s timeline.
Credit risk
In order to address concerns about the variability and comparability of RWAs under the IRB approach, the EU developed a series of amendments to the framework, known as the IRB repair package. The majority of these were developed and finalised while the UK was a member of the EU and therefore are being implemented in the UK by the PRA on 1 January 2022. However, there were some elements of the EU’s package that were not in force when the UK ceased to be subject to EU law. These include the EU’s technical standards on economic downturns, the EBA’s
guidelines on credit risk mitigation for the advanced IRB (‘A-IRB’) approach, and the EU’s final technical standards on risk weighting specialised lending exposures.
The PRA has confirmed that it would not be implementing the technical standards on specialised lending. Similarly, it will not implement the EU’s guidelines on credit risk mitigation in the A-IRB approach in 2022, although it will may consider reflecting the guidelines as part of its implementation of the Basel III Reforms. In March 2021, the PRA consulted on the implementation of the technical standards on economic downturn.
In June 2021, the PRA published rules for when a firm could use models approved by overseas regulators in the calculation of a UK group’s consolidated capital requirements. Such models may only be used for exposures to retail customers and to small and medium-sized enterprises up to a limit of 7.5% of total group exposure and RWAs.
In July 2021, the PRA published its final policy on the flooring of risk weights of UK mortgages subject to the IRB approach. Exposures to UK residential mortgages, excluding those in default, will be subject to an exposure-weighted average portfolio risk weight of at least 10% from 1 January 2022.
Capital buffers
The FPC in its July 2021 Financial Stability Report reconfirmed its guidance on the path for the UK countercyclical capital buffer rate. It expects to maintain this rate at 0% until at least December 2021. Due to the usual 12‑month implementation lag, any subsequent increase would therefore not be expected to take effect until the end of 2022 at the earliest.
Environmental, social and governance (‘ESG’) risk
Globally, regulators and standard setters continue to publish multiple proposals and discussion papers on ESG topics. These include publications in the UK by HMT, the Department for Business, Energy and Industrial Strategy and the Financial Conduct Authority (‘FCA’) on the potential implementation of climate-related financial disclosures that are aligned to the Taskforce on Climate-related Financial Disclosure (‘TCFD’). This work is supported by the development of green taxonomies by bodies, such as the newly-formed Green Technical Advisory Group in the UK. Further work by the TCFD included proposed new disclosure guidance on metrics, targets and transition plans.
In June, the BoE launched the 2021 climate biennial exploratory scenario exercise. This aims to test the resilience of financial institutions and their business models to transition and physical risks depending upon the speed of government policy action. The impact is based on an end-2020 static balance sheet and is assumed to take place over the period 2021 to 2050 focusing on credit risk.
In July, the Financial Stability Board ('FSB') published a roadmap on climate-related financial risks that focuses on four key policy areas: firm-level disclosures; data; vulnerabilities analysis; and regulatory and supervisory tools. The roadmap includes steps and indicative timeframes towards implementation and has been delivered to the G20 finance ministers and central bank governors for endorsement.
HSBC Holdings plc 2Q21 Pillar 3 4

Other developments
In July 2021, the PRA confirmed it had reassessed its approach to shareholder distributions in light of developments in the economic outlook, including the evolution of the Covid-19 pandemic. It announced that the extraordinary guardrails within which it had asked banks’ boards to determine the level of distributions for full-year 2020 results were no longer necessary and, therefore, it removed them with immediate effect. The PRA did note, however, that bank boards should continue to exercise an appropriate degree of caution around the level of any shareholder distributions.
In February 2021, the BoE published a letter to the CEOs of the eight major UK banks in scope of the first Resolvability Assessment Framework (‘RAF’) reporting and disclosure cycle. The RAF sets out what firms need to do in order to be considered resolvable by the BoE. The first set of RAF report submissions are due in October 2021.
In parallel with similar developments in Europe, the PRA is reviewing the requirements for the capitalisation of structural foreign exchange risk to align to a Pillar 1 approach.
Capital impacts
We have evaluated the impact of the Basel III reforms and IRB repair in conjunction with other changes, including the reversal of the CRR II treatment for software assets and the capitalisation of strategic foreign exchange risk, as part of our scenario analysis of capital and liquidity risks (discussed in the ‘Treasury risk’ section on page 7).
The reversal of the beneficial treatment for software assets was anticipated and is expected to reduce our capital resources by $2.6bn, with a corresponding adjustment in RWAs.
There remains a significant degree of uncertainty in the impact of the regulatory changes around structural foreign exchange risk due to the number of national discretions and the need for further supporting technical standards to be developed. Furthermore, the impact does not take into consideration the possibility of offsets against Pillar 2, which may arise as shortcomings within Pillar 1 are addressed.
Overall we expect RWAs to increase by up to 5% as a result of these developments during 2022 and 2023.
Further impacts will occur with the introduction of a modelled RWA output floor under the Basel III reforms that will commence in 2023 with a five-year transitional provision. We estimate that there will be an additional RWA impact as a result of the output floor with effect from 2027.
Linkage to the Interim Report
Structure of the regulatory group
Assets, liabilities and post-acquisition reserves of subsidiaries engaged in insurance activities are excluded from the regulatory consolidation. Our investments in these insurance subsidiaries are recorded at cost and deducted from CET1 capital, subject to thresholds.
The regulatory consolidation also excludes special purpose entities (‘SPEs’) where significant risk has been transferred to third parties. Exposures to these SPEs are risk weighted as securitisation positions for regulatory purposes. Participating interests in banking associates are proportionally consolidated for regulatory purposes by including our share of assets, liabilities, profits and losses, and RWAs in accordance with the PRA’s application of EU legislation. Non-participating significant investments are deducted from capital, subject to thresholds.
For further explanation of the differences between the accounting and regulatory scope of consolidation and their definition of exposure, see pages 10 to 13 of the Pillar 3 Disclosures at 31 December 2020.
Pillar 3 Disclosures at 30 June 2021
5 HSBC Holdings plc 2Q21 Pillar 3

Table 2: Reconciliation of balance sheets – financial accounting to regulatory scope of consolidation
Accountingbalance
sheet
Deconsolidationof insurance/other entities
Consolidationof bankingassociates
Regulatorybalance
sheet
Ref † $m $m $m $m
Assets
Cash and balances at central banks 393,559 (1) 290 393,848
Items in the course of collection from other banks 9,406 — — 9,406
Hong Kong Government certificates of indebtedness 41,880 — — 41,880
Trading assets 260,250 (2,917) — 257,333
Financial assets designated and otherwise mandatorily measured at fair value through profit or loss 49,120 (40,718) 890 9,292
– of which: debt securities eligible as tier 2 issued by Group financial sector entities (‘FSEs’) that are outside the regulatory scope of consolidation s — 633 — 633
Derivatives 209,516 6 118 209,640
Loans and advances to banks k 86,886 (2,276) 1,538 86,148
Loans and advances to customers k 1,059,511 (1,066) 13,135 1,071,580
– of which: lending eligible as tier 2 to Group FSEs outside the regulatory scope of consolidation s — 410 — 410
expected credit losses on IRB portfolios h (10,392) — — (10,392)
Reverse repurchase agreements – non-trading 201,714 2,203 723 204,640
Financial investments 434,576 (72,846) 5,111 366,841
– of which: lending eligible as tier 2 to Group FSEs outside the regulatory scope of consolidation s — 368 — 368
Capital invested in insurance and other entities — 2,586 — 2,586
Prepayments, accrued income and other assets1 175,155 (7,301) 665 168,519
– of which: retirement benefit assets j 9,747 — — 9,747
Current tax assets 405 (6) 11 410
Interests in associates and joint ventures 28,709 (418) (5,253) 23,038
– of which: positive goodwill on acquisition e 523 (12) — 511
Goodwill and intangible assets e 20,703 (9,777) 916 11,842
Deferred tax assets f 4,615 189 123 4,927
Total assets at 30 Jun 2021 2,976,005 (132,342) 18,267 2,861,930
Liabilities and equity
Hong Kong currency notes in circulation 41,880 — — 41,880
Deposits by banks 100,448 — 1,471 101,919
Customer accounts 1,669,091 4,056 15,183 1,688,330
Repurchase agreements – non-trading 112,798 — 46 112,844
Items in the course of transmission to other banks 15,100 — — 15,100
Trading liabilities 89,637 — — 89,637
Financial liabilities designated at fair value 151,686 (4,582) — 147,104
– of which: included in tier 2 p, r, i 10,544 — — 10,544
Derivatives 200,156 66 166 200,388
– of which: debt valuation adjustment i 76 — — 76
Debt securities in issue 84,218 (1,654) — 82,564
Accruals, deferred income and other liabilities 164,800 (3,808) 898 161,890
Current tax liabilities 929 (297) 24 656
Liabilities under insurance contracts 110,572 (110,572) — —
Provisions 2,814 (22) 64 2,856
– of which: credit-related contingent liabilities and contractual commitments on IRB portfolios h 549 — — 549
Deferred tax liabilities 4,338 (1,380) — 2,958
Subordinated liabilities 20,774 — 415 21,189
– of which:
included in tier 1 m, o 1,868 — — 1,868
included in tier 2 p, r 18,555 — — 18,555
Total liabilities at 30 Jun 2021 2,769,241 (118,193) 18,267 2,669,315
Equity
Called up share capital a 10,376 — — 10,376
Share premium account a, m 14,600 — — 14,600
Other equity instruments l 22,414 — — 22,414
Other reserves c, g 6,509 1,785 — 8,294
Retained earnings b, c 144,319 (14,641) — 129,678
Total shareholders’ equity 198,218 (12,856) — 185,362
Non-controlling interests d, n, o, q 8,546 (1,293) — 7,253
Total equity at 30 Jun 2021 206,764 (14,149) — 192,615
Total liabilities and equity at 30 Jun 2021 2,976,005 (132,342) 18,267 2,861,930
† The references (a)–(s) identify balance sheet components that are used in the calculation of regulatory capital in ‘Table 3: Own funds disclosure’.This table shows such items at their accounting values, which may be subject to analysis or adjustment in the calculation of regulatory capital shown in Table 3.
1 Other assets include held for sale loans and advances within the US retail banking business. For RWA calculation, the accounting classification as held for sale does not change the regulatory treatment.
HSBC Holdings plc 2Q21 Pillar 3 6

Treasury riskTreasury risk is the risk of having insufficient capital, liquidity or funding resources to meet financial obligations and satisfy regulatory requirements, together with the financial risks arising from the provision of pensions and other post-employment benefits to staff and their dependents. Treasury risk also includes the risk to our earnings or capital due to non-trading book foreign exchange exposures and changes in market interest rates.
Our approach to treasury management is driven by our strategic and organisational requirements, taking into account the regulatory, economic and commercial environment. We aim to maintain a strong capital and liquidity base to support the risks inherent in our business and invest in accordance with our strategy, meeting both consolidated and local regulatory requirements at all times.
A list of the main features of our capital instruments, in accordance with Annex III of Commission Implementing Regulation 1423/2013, is also published on our website at www.hsbc.com. The full terms and conditions of our securities are also available on our website at www.hsbc.com.
For further details on our management of treasury risk, see page 85 of the Interim Report 2021.
Regulatory reporting processes and controls
There is an ongoing focus on the quality of regulatory reporting by the PRA and other regulators globally. We continue to strengthen our processes and controls, following the commissioning of independent external reviews of various aspects of regulatory reporting, including at the request of our regulators. As part of the strengthening of our control environment, we are improving global consistency and control standards across a number of our processes. There may be an impact on some of our regulatory
ratios such as the CET1 and liquidity coverage ratio (’LCR’) as a result. We are keeping the PRA and other relevant regulators informed of adverse findings from external and internal reviews.
During the first half of 2021, HSBC implemented a revised approach to the application of the requirements under the EC Delegated Act. This approach was used to assess the limitations in the fungibility of entity liquidity around the Group and resulted in an adjustment of $185bn to LCR HQLA and $4bn to LCR inflows. This reflected an increase in the adjustment of $42bn compared with the approach used for the disclosure in the Annual Report and Accounts 2020. The change in methodology was designed to better incorporate local regulatory restrictions on the transferability of liquidity.
Risk to capital and liquidity
Outside the stress testing framework, other risks may be identified that have the potential to affect our RWAs and/or capital position. Downside and Upside scenarios are assessed against our capital management objectives and mitigating actions are assigned as necessary.
Regulatory developments
We closely monitor future regulatory changes and continue to evaluate the impact of these upon our capital requirements. These are discussed in the ‘Regulatory developments’ section on page 4.
Potential disposal of retail banking business in France
In relation to the potential sale of our retail banking business in France, we expect a reduction in the Group’s CET1 ratio in the range of 15bps to 20bps overall, driven by the estimated write-down of the disposal group on classification to held-for-sale, which is anticipated to be in 2022. This will be partly offset by the reduction in RWAs upon the estimated completion in 2023.
Own funds
Table 3: Own funds disclosure
At
30 Jun 31 Dec
2021 2020
Ref † $m $m
Common equity tier 1 (‘CET1’) capital: instruments and reserves1
1 Capital instruments and the related share premium accounts 23,571 23,219
– ordinary shares a 23,571 23,219
2 Retained earnings2 b 125,905 126,314
3 Accumulated other comprehensive income (and other reserves) c 7,171 9,768
5 Minority interests (amount allowed in consolidated CET1) d 4,250 4,079
5a Independently reviewed interim net profits net of any foreseeable charge or dividend b 2,808 (252)
6 Common equity tier 1 capital before regulatory adjustments2 163,705 163,128
Common equity tier 1 capital: regulatory adjustments
7 Additional value adjustments3 (1,337) (1,175)
8 Intangible assets (net of related deferred tax liability) e (9,484) (9,590)
10 Deferred tax assets that rely on future profitability excluding those arising from temporary differences (net of related tax liability) f (1,727) (1,741)
11 Fair value reserves related to gains or losses on cash flow hedges g (184) (365)
12 Negative amounts resulting from the calculation of expected loss amounts h (1,816) (1,462)
14 Gains or losses on liabilities valued at fair value resulting from changes in own credit standing i 1,959 2,101
15 Defined-benefit pension fund assets j (6,770) (7,885)
16 Direct and indirect holdings of own CET1 instruments4 (40) (40)
19 Direct, indirect and synthetic holdings by the institution of the CET1 instruments of financial sector entities where the institution has a significant investment in those entities (amount above 10% threshold and net of eligible short positions)5 (10,868) (9,272)
UK-27a Other regulatory adjustments to CET1 capital (including IFRS 9 transitional adjustments when relevant)2,6 k 1,168 2,351
28 Total regulatory adjustments to common equity tier 12 (29,099) (27,078)
29 Common equity tier 1 capital 134,606 136,050
Additional tier 1 (‘AT1’) capital: instruments
30 Capital instruments and the related share premium accounts 22,414 22,414
31 – classified as equity under IFRSs l 22,414 22,414
33 Amount of qualifying items and the related share premium accounts subject to phase out from AT1 m 900 900
34 Qualifying tier 1 capital included in consolidated AT1 capital (including minority interests not included in CET1) issued by subsidiaries and held by third parties n,o 475 869
35 – of which: instruments issued by subsidiaries subject to phase out n 406 812
Pillar 3 Disclosures at 30 June 2021
7 HSBC Holdings plc 2Q21 Pillar 3

Table 3: Own funds disclosure (continued)
At
30 Jun 31 Dec
2021 2020
Ref † $m $m
36 Additional tier 1 capital before regulatory adjustments 23,789 24,183
Additional tier 1 capital: regulatory adjustments
37 Direct and indirect holdings of own AT1 instruments4 (60) (60)
43 Total regulatory adjustments to additional tier 1 capital (60) (60)
44 Additional tier 1 capital 23,729 24,123
45 Tier 1 capital (T1 = CET1 + AT1) 158,335 160,173
Tier 2 capital: instruments and provisions
46 Capital instruments and the related share premium accounts p 19,885 20,987
– of which: instruments grandfathered under CRR II 7,179 7,357
48 Qualifying own funds instruments included in consolidated T2 capital (including minority interests and AT1 instruments not included in CET1 or AT1) issued by subsidiaries and held by third parties q,r 4,353 4,735
49 – of row 48: instruments issued by subsidiaries subject to phase out r 1,946 2,150
– of row 48: instruments issued by subsidiaries grandfathered under CRR II 1,330 1,427
51 Tier 2 capital before regulatory adjustments 24,238 25,722
Tier 2 capital: regulatory adjustments
52 Direct and indirect holdings of own T2 instruments4 (40) (40)
55 Direct and indirect holdings by the institution of the T2 instruments and subordinated loans of financial sector entities where the institution has a significant investment in those entities (net of eligible short positions) s (1,411) (1,432)
57 Total regulatory adjustments to tier 2 capital (1,451) (1,472)
58 Tier 2 capital 22,787 24,250
59 Total capital (TC = T1 + T2) 181,122 184,423
60 Total risk-weighted assets 862,292 857,520
Capital ratios and buffers (%)
61 Common equity tier 1 15.6 15.9
62 Tier 1 18.4 18.7
63 Total capital 21.0 21.5
64 Institution specific buffer requirement 4.7 4.7
65 – capital conservation buffer requirement 2.5 2.5
66 – countercyclical buffer requirement 0.2 0.2
67a – Global systemically important institution (‘G-SII’) buffer 2.0 2.0
68 Common equity tier 1 available to meet buffers 9.5 9.7%Amounts below the threshold for deduction (before risk weighting)
72 Direct and indirect holdings of the capital of financial sector entities where the institution does not have a significant investment in those entities (amount below 10% threshold and net of eligible short positions) 3,747 2,485
73 Direct and indirect holdings by the institution of the CET1 instruments of financial sector entities where the institution has a significant investment in those entities (amount below 10% threshold and net of eligible short positions) 14,468 14,409
75 Deferred tax assets arising from temporary differences (amount below 10% threshold, net of related tax liability) 4,897 4,418
Applicable caps on the inclusion of provisions in tier 2
77 Cap on inclusion of credit risk adjustments in T2 under standardised approach 2,140 2,022
79 Cap for inclusion of credit risk adjustments in T2 under IRB approach 3,251 3,262
Capital instruments subject to phase out arrangements (only applicable between 1 Jan 2013 and 1 Jan 2022)
82 Current cap on AT1 instruments subject to phase out arrangements 1,730 3,461
83 Amount excluded from AT1 due to cap (excess over cap after redemptions and maturities) 562 144
84 Current cap on T2 instruments subject to phase out arrangements 894 1,792
† The references (a)–(s) identify balance sheet components in ‘Table 2: Reconciliation of balance sheets – financial accounting to regulatory scope of consolidation ’, which is used in the calculation of regulatory capital. This table shows how they contribute to the regulatory capital calculation. Their contribution may differ from their accounting value in Table 2 as a result of adjustment or analysis to apply regulatory definitions of capital.
1 Since the publication of our 31 December 2020 results we have made certain reclassifications to align with our regulatory reporting submission. These did not impact the capital ratios.
2 We now report the IFRS 9 transitional arrangement as a regulatory adjustment in row 27a. We have restated rows 2, 6, 27a and 28 for31 December 2020 for comparison.
3 Additional value adjustments are calculated on assets measured at fair value.4 The minimum deductions for holdings of own CET1, AT1 and T2 instruments are set by the PRA.5 The threshold deduction for significant investments relates to balances recorded on numerous lines on the balance sheet and includes:
investments in insurance subsidiaries and non-consolidated associates, other CET1 equity held in financial institutions, and connected funding of a capital nature etc.
6 From 1H21, the deduction for insufficient coverage for non-performing exposures is reported in row 27a.
At 30 June 2021, our CET1 capital ratio decreased to 15.6% from 15.9% at 31 December 2020, reflecting an increase in RWAs and a decrease in CET1 capital of $1.5bn including the impact of foreseeable dividends of $3.5bn. The fall in CET1 also includes:
• a $1.4bn decrease in the fair value through other comprehensive income reserve;
• a $1.3bn higher threshold deduction for investment in financial sector entities;
• a $1.2bn decline in IFRS 9 transitional add-back; and
• $0.6bn unfavourable foreign currency translation differences.
These decreases were partly offset by:
• $2.8bn capital generation through profits, net of foreseeable dividend and dividend paid on other equity instruments.
The dividend accrual, equal to 47.5% of 1H21 basic earnings per ordinary share (‘EPS’) of $0.36, is not a forecast and represents the mid-point of our target payout ratio of 40% to 55% of reported EPS. Alongside this, the Board has announced an interim dividend
HSBC Holdings plc 2Q21 Pillar 3 8

for 1H21 of $0.07 per ordinary share, to be paid in cash with no scrip alternative.
At 30 June 2021, our Pillar 2A requirement, in accordance with the PRA’s Individual Capital Requirement based on a point-in-time assessment, was equivalent to 2.9% of RWAs, of which 1.7% was met by CET1.
Leverage ratio
The risk of excessive leverage is managed as part of HSBC’s global risk appetite framework and monitored using a leverage ratio metric within our risk appetite statement (‘RAS’). The RAS articulates the aggregate level and types of risk that HSBC is
willing to accept in its business activities in order to achieve its strategic business objectives.
The RAS is monitored via the risk appetite profile report, which includes comparisons of actual performance against the risk appetite and tolerance thresholds assigned to each metric. This is to ensure that any excessive risk is highlighted, assessed and mitigated appropriately. The risk appetite profile report is presented monthly to the Risk Management Meeting of the Group Executive Committee and the Group Risk Committee.
Our approach to risk appetite is described on page 107 of the Annual Report and Accounts 2020.
Table 4: Leverage ratio common disclosure (LRCom)
At
30 Jun 31 Dec
2021 2020
$bn $bn
On-balance sheet exposures (excluding derivatives and securities financing transactions (‘SFTs’))
1 On-balance sheet items (excluding derivatives, SFTs and fiduciary assets, but including collateral) 2,391.9 2,317.1
2 (Asset amounts deducted in determining tier 1 capital) (29.6) (27.7)
3 Total on-balance sheet exposures (excluding derivatives, SFTs and fiduciary assets) 2,362.3 2,289.4
Derivative exposures
4 Replacement cost associated with all derivatives transactions (i.e. net of eligible cash variation margin) 62.8 82.4
5 Add-on amounts for potential future exposure associated with all derivatives transactions (mark-to-market method) 146.1 146.4
6 Gross-up for derivatives collateral provided where deducted from the balance sheet assets pursuant to IFRSs 10.1 18.0
7 (Deductions of receivables assets for cash variation margin provided in derivatives transactions) (41.2) (64.5)
8 (Exempted central counterparty (‘CCP’) leg of client-cleared trade exposures) (74.4) (86.5)
9 Adjusted effective notional amount of written credit derivatives 101.5 127.6
10 (Adjusted effective notional offsets and add-on deductions for written credit derivatives) (96.5) (121.3)
11 Total derivative exposures 108.4 102.1
SFT exposures
12 Gross SFT assets (with no recognition of netting), after adjusting for sales accounting transactions 422.0 434.0
13 (Netted amounts of cash payables and cash receivables of gross SFT assets) (179.6) (174.1)
14 Counterparty credit risk exposure for SFT assets 11.6 11.4
16 Total securities financing transaction exposures 254.0 271.3
Other off-balance sheet exposures
17 Off-balance sheet exposures at gross notional amount 904.9 893.9
18 (Adjustments for conversion to credit equivalent amounts) (661.1) (659.6)
19 Total off-balance sheet exposures 243.8 234.3
Capital and total exposures
20 Tier 1 capital1 157.0 158.5
21 Total leverage ratio exposure 2,968.5 2,897.1
22 Leverage ratio (%)1 5.3 5.5
EU-23 Choice of transitional arrangements for the definition of the capital measure Fully phased-in Fully phased-in
1 Leverage ratio is calculated using the CRR II end point basis for capital.
Table 5: Summary reconciliation of accounting assets and leverage ratio exposures (LRSum)
At
30 Jun 31 Dec
2021 2020
$bn $bn
1 Total assets as per published financial statements 2,976.0 2,984.2
Adjustments for:
2 – entities which are consolidated for accounting purposes but are outside the scope of regulatory consolidation (114.1) (109.1)
4 – derivative financial instruments (101.2) (205.6)
5 – SFTs 20.3 15.2
6 – off-balance sheet items (i.e. conversion to credit equivalent amounts of off-balance sheet exposures) 243.8 234.3
7 – other (56.3) (21.9)
8 Total leverage ratio exposure 2,968.5 2,897.1
Pillar 3 Disclosures at 30 June 2021
9 HSBC Holdings plc 2Q21 Pillar 3
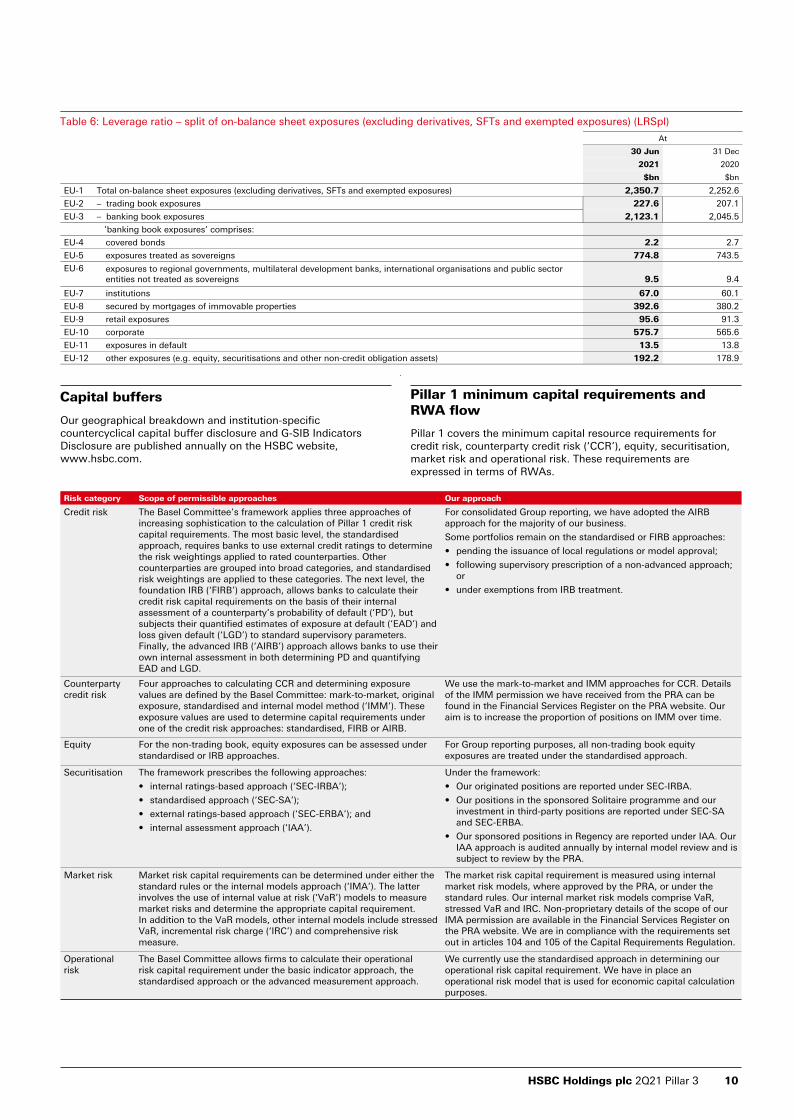
Table 6: Leverage ratio – split of on-balance sheet exposures (excluding derivatives, SFTs and exempted exposures) (LRSpl)
At
30 Jun 31 Dec
2021 2020
$bn $bn
EU-1 Total on-balance sheet exposures (excluding derivatives, SFTs and exempted exposures) 2,350.7 2,252.6
EU-2 – trading book exposures 227.6 207.1
EU-3 – banking book exposures 2,123.1 2,045.5
’banking book exposures’ comprises:
EU-4 covered bonds 2.2 2.7
EU-5 exposures treated as sovereigns 774.8 743.5
EU-6 exposures to regional governments, multilateral development banks, international organisations and public sector entities not treated as sovereigns 9.5 9.4
EU-7 institutions 67.0 60.1
EU-8 secured by mortgages of immovable properties 392.6 380.2
EU-9 retail exposures 95.6 91.3
EU-10 corporate 575.7 565.6
EU-11 exposures in default 13.5 13.8
EU-12 other exposures (e.g. equity, securitisations and other non-credit obligation assets) 192.2 178.9
.
Capital buffers
Our geographical breakdown and institution-specific countercyclical capital buffer disclosure and G-SIB Indicators Disclosure are published annually on the HSBC website, www.hsbc.com.
Pillar 1 minimum capital requirements and RWA flow
Pillar 1 covers the minimum capital resource requirements for credit risk, counterparty credit risk (‘CCR’), equity, securitisation, market risk and operational risk. These requirements are expressed in terms of RWAs.
Risk category Scope of permissible approaches Our approach
Credit risk The Basel Committee’s framework applies three approaches of increasing sophistication to the calculation of Pillar 1 credit risk capital requirements. The most basic level, the standardised approach, requires banks to use external credit ratings to determine the risk weightings applied to rated counterparties. Other counterparties are grouped into broad categories, and standardised risk weightings are applied to these categories. The next level, the foundation IRB (‘FIRB’) approach, allows banks to calculate their credit risk capital requirements on the basis of their internal assessment of a counterparty’s probability of default (‘PD’), but subjects their quantified estimates of exposure at default (‘EAD’) and loss given default (‘LGD’) to standard supervisory parameters. Finally, the advanced IRB (‘AIRB’) approach allows banks to use their own internal assessment in both determining PD and quantifying EAD and LGD.
For consolidated Group reporting, we have adopted the AIRB approach for the majority of our business.
Some portfolios remain on the standardised or FIRB approaches:
• pending the issuance of local regulations or model approval;
• following supervisory prescription of a non-advanced approach; or
• under exemptions from IRB treatment.
Counterparty credit risk
Four approaches to calculating CCR and determining exposure values are defined by the Basel Committee: mark-to-market, original exposure, standardised and internal model method (‘IMM’). These exposure values are used to determine capital requirements under one of the credit risk approaches: standardised, FIRB or AIRB.
We use the mark-to-market and IMM approaches for CCR. Details of the IMM permission we have received from the PRA can be found in the Financial Services Register on the PRA website. Our aim is to increase the proportion of positions on IMM over time.
Equity For the non-trading book, equity exposures can be assessed under standardised or IRB approaches.
For Group reporting purposes, all non-trading book equity exposures are treated under the standardised approach.
Securitisation The framework prescribes the following approaches:
• internal ratings-based approach (‘SEC-IRBA’);
• standardised approach (‘SEC-SA’);
• external ratings-based approach (‘SEC-ERBA’); and
• internal assessment approach (‘IAA’).
Under the framework:
• Our originated positions are reported under SEC-IRBA.
• Our positions in the sponsored Solitaire programme and our investment in third-party positions are reported under SEC-SA and SEC-ERBA.
• Our sponsored positions in Regency are reported under IAA. Our IAA approach is audited annually by internal model review and is subject to review by the PRA.
Market risk Market risk capital requirements can be determined under either the standard rules or the internal models approach (‘IMA’). The latter involves the use of internal value at risk (‘VaR’) models to measure market risks and determine the appropriate capital requirement. In addition to the VaR models, other internal models include stressed VaR, incremental risk charge (‘IRC’) and comprehensive risk measure.
The market risk capital requirement is measured using internal market risk models, where approved by the PRA, or under the standard rules. Our internal market risk models comprise VaR, stressed VaR and IRC. Non-proprietary details of the scope of our IMA permission are available in the Financial Services Register on the PRA website. We are in compliance with the requirements set out in articles 104 and 105 of the Capital Requirements Regulation.
Operational risk
The Basel Committee allows firms to calculate their operational risk capital requirement under the basic indicator approach, the standardised approach or the advanced measurement approach.
We currently use the standardised approach in determining our operational risk capital requirement. We have in place an operational risk model that is used for economic capital calculation purposes.
HSBC Holdings plc 2Q21 Pillar 3 10

Table 7: Overview of RWAs (OV1)
At
30 Jun 31 Mar 30 Jun
2021 2021 2021
RWAs RWAsCapital
requirements
$bn $bn $bn
1 Credit risk (excluding counterparty credit risk) 645.0 630.6 51.6
2 – standardised approach 120.8 113.4 9.7
3 – foundation IRB approach 101.2 101.0 8.1
4 – advanced IRB approach 423.0 416.2 33.8
6 Counterparty credit risk 39.2 41.4 3.1
7 – mark-to-market 21.6 22.0 1.8
10 – internal model method 14.3 15.7 1.1
11 – risk exposure amount for contributions to the default fund of a central counterparty 0.6 0.5 —
12 – credit valuation adjustment 2.7 3.2 0.2
13 Settlement risk 0.1 —
14 Securitisation exposures in the non-trading book 9.3 9.5 0.7
14a – internal ratings-based approach (‘SEC-IRBA’) 1.9 2.0 0.2
14b – external ratings-based approach (‘SEC-ERBA’) 3.1 3.3 0.2
14c – internal assessment approach (‘IAA’) 1.5 1.6 0.1
14d – standardised approach (‘SEC-SA’) 2.8 2.6 0.2
19 Market risk 25.5 24.7 2.0
20 – standardised approach 6.8 7.2 0.5
21 – internal models approach 18.7 17.5 1.5
23 Operational risk 94.6 93.7 7.6
25 – standardised approach 94.6 93.7 7.6
27 Amounts below the thresholds for deduction (subject to 250% risk weight) 48.6 46.9 3.9
29 Total 862.3 846.8 68.9
Credit risk, including amounts below the thresholds for deduction
Excluding an increase due to foreign currency translation differences of $1.7bn, RWAs rose by $14.4bn.
A $13.0bn increase in RWAs due to asset size movements was largely caused by an increase in short-term lending to Wealth and Personal Banking (‘WPB’) customers in Hong Kong, to fund subscription to initial public offerings, and corporate loan growth in Asia under Commercial Banking (‘CMB’).
An increase of $2.8bn was due to changes in asset quality. This was mostly due to portfolio mix changes across Global Banking and Markets (‘GBM’) clients in North America and Europe.
Changes to methodology and policy led to an RWA decrease of $3.1bn. This was mostly the result of risk parameter refinements in Corporate Centre, GBM and CMB, mainly in Asia and Europe. These movements were partly offset in CMB by a $1.0bn increase relating to updates to the treatment of small and medium-sized enterprises.
A $1.7bn rise in RWAs due to model updates was mostly as a result of an update to our Australian mortgages model in WPB.
Counterparty credit risk
Counterparty credit risk (including settlement risk) RWAs decreased by $2.1bn, largely due to management initiatives and reduced market volatility.
Securitisation
Securitisation RWAs fell by $0.2bn, primarily due to asset size reduction, mostly in North America and Asia.
Market risk
Market risk RWAs increased by $0.8bn, mostly due to higher stressed value at risk, reflecting raised volatility in the quarterly recalibration.
Operational risk
Operational risk RWAs increased by $0.9bn due to a change in methodology and policy and foreign exchange translation differences.
Table 8: RWA flow statements of credit risk exposures under IRB¹ (CR8)
RWAsCapital
requirements
$bn $bn
1 RWAs at 1 Apr 2021 517.2 41.3
2 Asset size 3.5 0.3
3 Asset quality 2.4 0.2
4 Model updates 1.8 0.2
5 Methodology and policy (1.9) (0.2)
7 Foreign exchange movements 1.2 0.1
9 RWAs at 30 Jun 2021 524.2 41.9
1 Securitisation positions are not included in this table.
Excluding foreign currency translation differences, IRB RWAs increased by $5.8bn in 1H21. A $3.5bn RWA rise due to asset size movements included WPB and CMB lending growth in Asia, partly offset by reduced lending in Europe and North America. A further increase of $2.4bn was due to asset quality movement, mostly in the form of unfavourable portfolio mix changes in Europe and
North America. Model updates increased RWAs by $1.8bn, mainly due to an update to our Australian mortgages model. Changes to methodology and policy led to an RWA decrease of $1.9bn, largely due to risk parameter refinements, partly offset by an increase relating to updates to the treatment of small and medium-sized enterprises.
Pillar 3 Disclosures at 30 June 2021
11 HSBC Holdings plc 2Q21 Pillar 3

Table 9: RWA flow statements of CCR exposures under IMM (CCR7)
RWAsCapital
requirements
$bn $bn
1 RWAs at 1 Apr 2021 18.3 1.5
2 Asset size (1.8) (0.2)
3 Asset quality (0.1) —
5 Methodology and policy — —
9 RWAs at 30 Jun 2021 16.4 1.3
IMM RWAs fell by $1.9bn in 2Q21 predominantly due to management initiatives and lower market volatility.
Table 10: RWA flow statements of market risk exposures under IMA (MR2-B)
VaRStressed
VaR IRC OtherTotal
RWAsTotal capital
requirements
$bn $bn $bn $bn $bn $bn
1 RWAs at 1 Apr 2021 5.3 6.0 4.6 1.6 17.5 1.4
2 Movement in risk levels (0.1) 2.6 (1.0) — 1.5 0.1
3 Model updates/changes — — — — — —
4 Methodology and policy (0.1) (0.2) — — (0.3) —
8 RWAs at 30 Jun 2021 5.1 8.4 3.6 1.6 18.7 1.5
RWAs under IMA increased by $1.2bn in 2Q21, reflecting a $2.4bn increase in stressed VaR largely due to higher volatility following quarterly recalibration of stressed VaR. This was partly offset by a $1.0bn fall in IRC RWAs following a reduction in exposures and increased risk mitigation.
HSBC Holdings plc 2Q21 Pillar 3 12
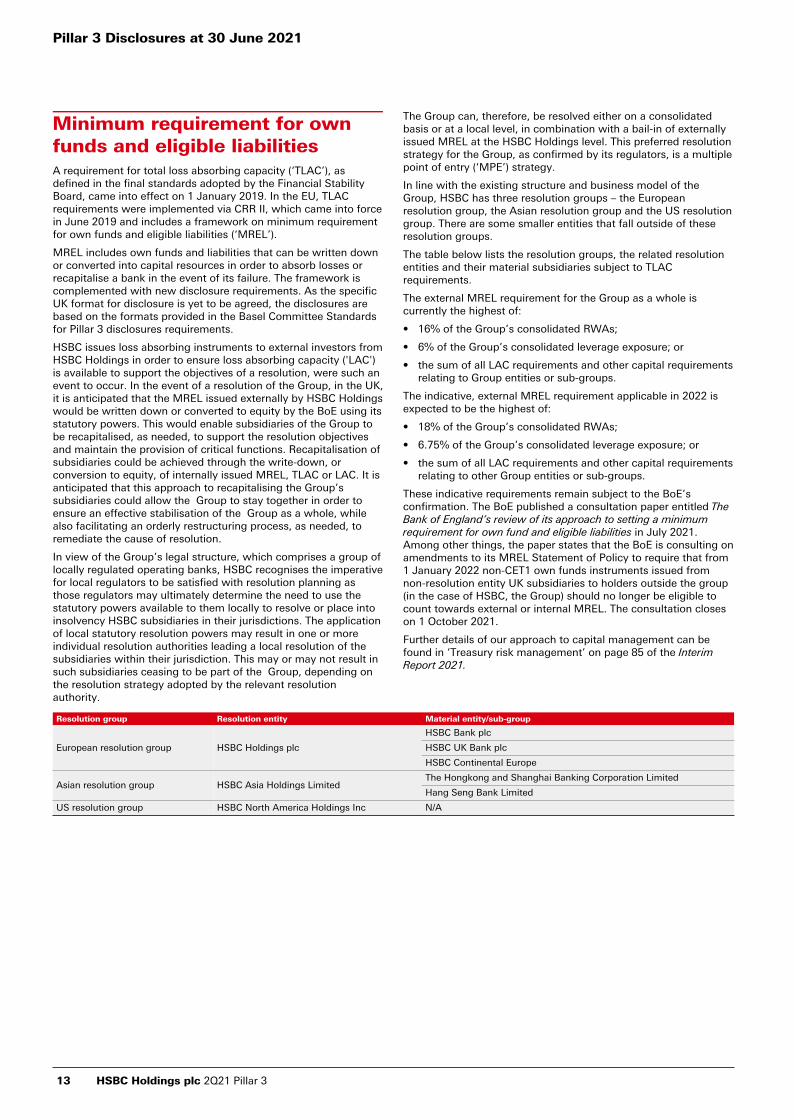
Minimum requirement for ownfunds and eligible liabilities A requirement for total loss absorbing capacity (‘TLAC’), as defined in the final standards adopted by the Financial Stability Board, came into effect on 1 January 2019. In the EU, TLAC requirements were implemented via CRR II, which came into force in June 2019 and includes a framework on minimum requirement for own funds and eligible liabilities (‘MREL’).
MREL includes own funds and liabilities that can be written down or converted into capital resources in order to absorb losses or recapitalise a bank in the event of its failure. The framework is complemented with new disclosure requirements. As the specific UK format for disclosure is yet to be agreed, the disclosures are based on the formats provided in the Basel Committee Standards for Pillar 3 disclosures requirements.
HSBC issues loss absorbing instruments to external investors from HSBC Holdings in order to ensure loss absorbing capacity ('LAC') is available to support the objectives of a resolution, were such an event to occur. In the event of a resolution of the Group, in the UK, it is anticipated that the MREL issued externally by HSBC Holdings would be written down or converted to equity by the BoE using its statutory powers. This would enable subsidiaries of the Group to be recapitalised, as needed, to support the resolution objectives and maintain the provision of critical functions. Recapitalisation of subsidiaries could be achieved through the write-down, or conversion to equity, of internally issued MREL, TLAC or LAC. It is anticipated that this approach to recapitalising the Group’s subsidiaries could allow the Group to stay together in order to ensure an effective stabilisation of the Group as a whole, while also facilitating an orderly restructuring process, as needed, to remediate the cause of resolution.
In view of the Group’s legal structure, which comprises a group of locally regulated operating banks, HSBC recognises the imperative for local regulators to be satisfied with resolution planning as those regulators may ultimately determine the need to use the statutory powers available to them locally to resolve or place into insolvency HSBC subsidiaries in their jurisdictions. The application of local statutory resolution powers may result in one or more individual resolution authorities leading a local resolution of the subsidiaries within their jurisdiction. This may or may not result in such subsidiaries ceasing to be part of the Group, depending on the resolution strategy adopted by the relevant resolution authority.
The Group can, therefore, be resolved either on a consolidated basis or at a local level, in combination with a bail-in of externally issued MREL at the HSBC Holdings level. This preferred resolution strategy for the Group, as confirmed by its regulators, is a multiple point of entry (‘MPE’) strategy.
In line with the existing structure and business model of the Group, HSBC has three resolution groups – the European resolution group, the Asian resolution group and the US resolution group. There are some smaller entities that fall outside of these resolution groups.
The table below lists the resolution groups, the related resolution entities and their material subsidiaries subject to TLAC requirements.
The external MREL requirement for the Group as a whole is currently the highest of:
• 16% of the Group’s consolidated RWAs;
• 6% of the Group’s consolidated leverage exposure; or
• the sum of all LAC requirements and other capital requirements relating to Group entities or sub-groups.
The indicative, external MREL requirement applicable in 2022 is expected to be the highest of:
• 18% of the Group’s consolidated RWAs;
• 6.75% of the Group’s consolidated leverage exposure; or
• the sum of all LAC requirements and other capital requirements relating to other Group entities or sub-groups.
These indicative requirements remain subject to the BoE’s confirmation. The BoE published a consultation paper entitled The Bank of England’s review of its approach to setting a minimum requirement for own fund and eligible liabilities in July 2021. Among other things, the paper states that the BoE is consulting on amendments to its MREL Statement of Policy to require that from 1 January 2022 non-CET1 own funds instruments issued from non-resolution entity UK subsidiaries to holders outside the group (in the case of HSBC, the Group) should no longer be eligible to count towards external or internal MREL. The consultation closes on 1 October 2021.
Further details of our approach to capital management can be found in ‘Treasury risk management’ on page 85 of the Interim Report 2021.
Resolution group Resolution entity Material entity/sub-group
European resolution group HSBC Holdings plc
HSBC Bank plc
HSBC UK Bank plc
HSBC Continental Europe
Asian resolution group HSBC Asia Holdings Limited The Hongkong and Shanghai Banking Corporation Limited
Hang Seng Bank Limited
US resolution group HSBC North America Holdings Inc N/A
Pillar 3 Disclosures at 30 June 2021
13 HSBC Holdings plc 2Q21 Pillar 3

The tables below summarise the key metrics for the Group's three resolution groups.
Table 11.i: Key metrics of the European resolution group¹ (KM2)
At
30 Jun 31 Mar 31 Dec 30 Sep 30 Jun
2021 2021 2020 2020 2020
1 Total loss absorbing capacity ('TLAC') available ($bn) 98.2 97.3 97.9 96.9 94.3
1a Fully loaded ECL accounting model TLAC available ($bn) 98.2 97.3 97.8 96.8 94.2
2 Total RWA at the level of the resolution group ($bn) 286.9 290.3 302.5 298.5 295.7
3 TLAC as a percentage of RWA (row1/row2) (%) 34.2 33.5 32.4 32.5 31.9
3a Fully loaded ECL accounting model TLAC as a percentage of fully loaded ECL accounting model RWA (%) 34.2 33.5 32.3 32.4 31.9
4 Leverage exposure measure at the level of the resolution group ($bn) 1,293.6 1,285.2 1,265.2 1,219.0 1,166.3
5 TLAC as a percentage of leverage exposure measure (row1/row4) (%) 7.6 7.6 7.7 7.9 8.1
5a Fully loaded ECL accounting model TLAC as a percentage of fully loaded ECL accounting model Leverage exposure measure (%) 7.6 7.6 7.7 7.9 8.1
6a Does the subordination exemption in the antepenultimate paragraph of Section 11 of the FSB TLAC Term Sheet apply? No No No No No
6b Does the subordination exemption in the penultimate paragraph of Section 11 of the FSB TLAC Term Sheet apply? No No No No No
6c If the capped subordination exemption applies, the amount of funding issued that ranks pari passu with excluded liabilities and that is recognised as external TLAC, divided by funding issued that ranks pari passu with excluded liabilities and that would be recognised as external TLAC if no cap was applied (%) N/A N/A N/A N/A N/A
Footnotes can be found at the end of the table.
Table 11.ii: Key metrics of the Asian resolution group² (KM2)
At
30 Jun 31 Mar 31 Dec 30 Sep 30 Jun
2021 2021 2020 2020 2020
1 Total loss absorbing capacity ('TLAC') available ($bn) 102.1 96.9 102.2 101.6 99.8
1a Fully loaded ECL accounting model TLAC available ($bn) 102.1 96.9 102.2 101.6 99.8
2 Total RWA at the level of the resolution group ($bn) 401.5 387.3 381.4 390.8 379.7
3 TLAC as a percentage of RWA (row1/row2) (%) 25.4 25.0 26.8 26.0 26.3
3a Fully loaded ECL accounting model TLAC as a percentage of fully loaded ECL accounting model RWA (%) 25.4 25.0 26.8 26.0 26.3
4 Leverage exposure measure at the level of the resolution group ($bn) 1,166.7 1,143.3 1,121.8 1,116.3 1,092.4
5 TLAC as a percentage of leverage exposure measure (row1/row4) (%) 8.8 8.5 9.1 9.1 9.1
5a Fully loaded ECL accounting model TLAC as a percentage of fully loaded ECL accounting model Leverage exposure measure (%) 8.8 8.5 9.1 9.1 9.1
6a Does the subordination exemption in the antepenultimate paragraph of Section 11 of the FSB TLAC Term Sheet apply? No No No No No
6b Does the subordination exemption in the penultimate paragraph of Section 11 of the FSB TLAC Term Sheet apply? No No No No No
6c If the capped subordination exemption applies, the amount of funding issued that ranks pari passu with excluded liabilities and that is recognised as external TLAC, divided by funding issued that ranks pari passu with excluded liabilities and that would be recognised as external TLAC if no cap was applied (%) N/A N/A N/A N/A N/A
Footnotes can be found at the end of the table.
HSBC Holdings plc 2Q21 Pillar 3 14
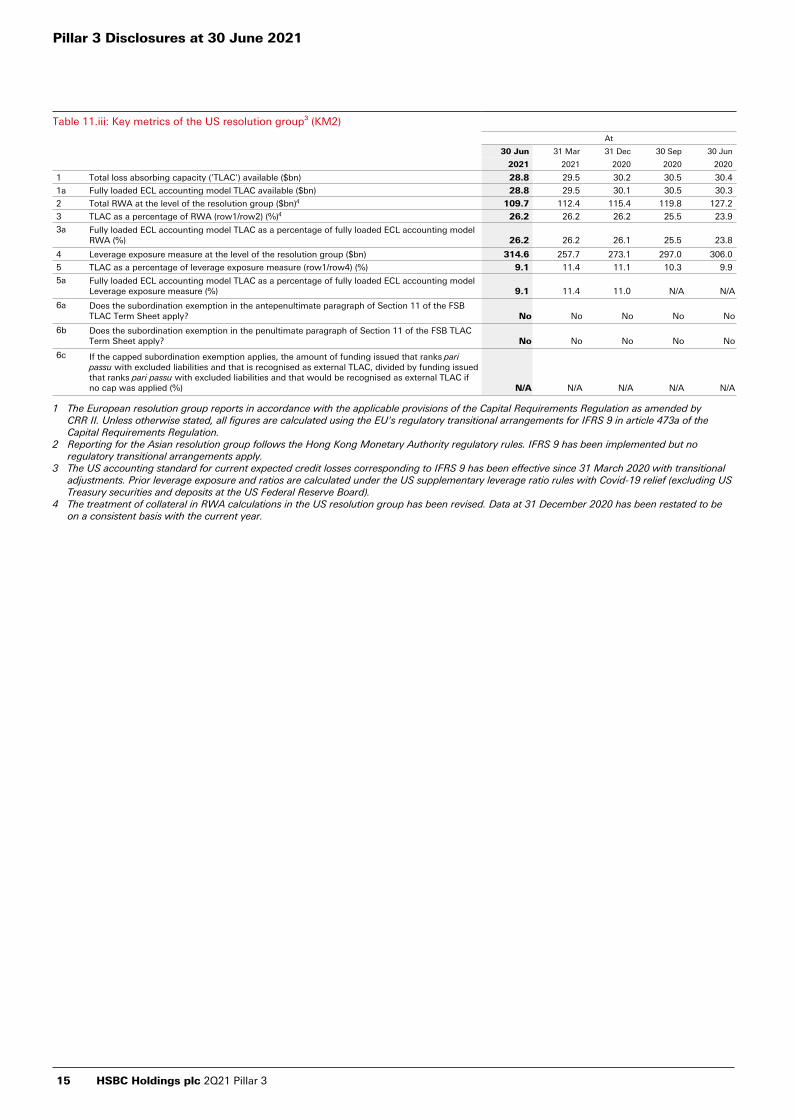
Table 11.iii: Key metrics of the US resolution group³ (KM2)
At
30 Jun 31 Mar 31 Dec 30 Sep 30 Jun
2021 2021 2020 2020 2020
1 Total loss absorbing capacity ('TLAC') available ($bn) 28.8 29.5 30.2 30.5 30.4
1a Fully loaded ECL accounting model TLAC available ($bn) 28.8 29.5 30.1 30.5 30.3
2 Total RWA at the level of the resolution group ($bn)4 109.7 112.4 115.4 119.8 127.2
3 TLAC as a percentage of RWA (row1/row2) (%)4 26.2 26.2 26.2 25.5 23.9
3a Fully loaded ECL accounting model TLAC as a percentage of fully loaded ECL accounting model RWA (%) 26.2 26.2 26.1 25.5 23.8
4 Leverage exposure measure at the level of the resolution group ($bn) 314.6 257.7 273.1 297.0 306.0
5 TLAC as a percentage of leverage exposure measure (row1/row4) (%) 9.1 11.4 11.1 10.3 9.9
5a Fully loaded ECL accounting model TLAC as a percentage of fully loaded ECL accounting model Leverage exposure measure (%) 9.1 11.4 11.0 N/A N/A
6a Does the subordination exemption in the antepenultimate paragraph of Section 11 of the FSB TLAC Term Sheet apply? No No No No No
6b Does the subordination exemption in the penultimate paragraph of Section 11 of the FSB TLAC Term Sheet apply? No No No No No
6c If the capped subordination exemption applies, the amount of funding issued that ranks pari passu with excluded liabilities and that is recognised as external TLAC, divided by funding issued that ranks pari passu with excluded liabilities and that would be recognised as external TLAC if no cap was applied (%) N/A N/A N/A N/A N/A
1 The European resolution group reports in accordance with the applicable provisions of the Capital Requirements Regulation as amended by CRR II. Unless otherwise stated, all figures are calculated using the EU's regulatory transitional arrangements for IFRS 9 in article 473a of the Capital Requirements Regulation.
2 Reporting for the Asian resolution group follows the Hong Kong Monetary Authority regulatory rules. IFRS 9 has been implemented but no regulatory transitional arrangements apply.
3 The US accounting standard for current expected credit losses corresponding to IFRS 9 has been effective since 31 March 2020 with transitional adjustments. Prior leverage exposure and ratios are calculated under the US supplementary leverage ratio rules with Covid-19 relief (excluding US Treasury securities and deposits at the US Federal Reserve Board).
4 The treatment of collateral in RWA calculations in the US resolution group has been revised. Data at 31 December 2020 has been restated to be on a consistent basis with the current year.
Pillar 3 Disclosures at 30 June 2021
15 HSBC Holdings plc 2Q21 Pillar 3

As the Bank of England framework includes requirements set on the basis of the Group consolidated position, we present data for both the consolidated Group and the resolution groups in the table
below. The difference between Group CET1 and the aggregate of resolution groups’ CET1 is driven by entities that fall outside of the resolution groups and by differences in regulatory frameworks.
Table 12: TLAC composition (TLAC1)
At 30 Jun 2021 At 31 Dec 2020
Group1
Resolution group
Group1
Resolution group
European1 Asian2 US3 European1 Asian2 US3
Regulatory capital elements of TLAC and adjustments ($bn)
Common equity tier 1 capital before adjustments 134.6 117.5 63.0 17.3 136.1 116.1 65.8 17.1
Deduction of CET1 exposures between MPE resolution groups and other group entities — 100.7 — — — 99.4 — —
1 Common equity tier 1 capital ('CET1') 134.6 16.8 63.0 17.3 136.1 16.7 65.8 17.1
2 Additional tier 1 capital ('AT1') before TLAC adjustments 23.7 23.4 5.9 2.2 24.1 23.6 5.9 2.2
4 Other adjustments — 6.1 — — — 6.7 — —
5 AT1 instruments eligible under the TLAC framework (row 2 minus row 3 minus row 4) 23.7 17.3 5.9 2.2 24.1 16.9 5.9 2.2
6 Tier 2 capital ('T2') before TLAC adjustments 22.8 23.6 7.7 3.3 24.2 25.0 7.6 5.7
7 Amortised portion of T2 instruments where remaining maturity >1 year 2.0 2.0 — — 1.4 1.4 — —
8 T2 capital ineligible as TLAC as issued out of subsidiaries to third parties — — 0.4 — — — 0.4 —
9 Other adjustments — 7.3 — 2.3 — 9.2 — 2.8
10 T2 instruments eligible under the TLAC framework (row 6 plus row 7 minus row 8 minus row 9) 24.8 18.3 7.3 1.0 25.6 17.2 7.2 2.9
11 TLAC arising from regulatory capital 183.1 52.4 76.2 20.5 185.8 50.8 78.9 22.2
Non-regulatory capital elements of TLAC ($bn)
12 External TLAC instruments issued directly by the bank and subordinated to excluded liabilities 80.8 45.8 25.9 8.3 79.4 47.1 23.3 8.0
17 TLAC arising from non-regulatory capital instruments before adjustments 80.8 45.8 25.9 8.3 79.4 47.1 23.3 8.0
Non-regulatory capital elements of TLAC: adjustments ($bn)
18 TLAC before deductions 263.9 98.2 102.1 28.8 265.2 97.9 102.2 30.2
20 Deduction of investments in own other TLAC liabilities 0.1 — — — — — — —
22 TLAC after deductions (row 18 minus row 19 minus row 20 minus row 21) 263.8 98.2 102.1 28.8 265.2 97.9 102.2 30.2
Risk-weighted assets and leverage exposure measure for TLAC purposes ($bn)
23 Total risk-weighted assets5 862.3 286.9 401.5 109.7 857.5 302.5 381.4 115.4
24 Leverage exposure measure 2,968.5 1,293.6 1,166.7 314.6 2,897.1 1,265.2 1,121.8 273.1
TLAC ratios and buffers (%)
25 TLAC (as a percentage of risk-weighted assets) 30.6 34.2 25.4 26.2 30.9 32.4 26.8 26.2
26 TLAC (as a percentage of leverage exposure) 8.9 7.6 8.8 9.1 9.2 7.7 9.1 11.1
27 CET1 (as a percentage of risk-weighted assets) available after meeting the resolution group’s minimum capital and TLAC requirements4 9.5 N/A N/A 8.2 9.7 N/A N/A 8.2
28 Institution-specific buffer requirement (capital conservation buffer plus countercyclical buffer requirements plus higher loss absorbency requirement, expressed as a percentage of risk-weighted assets) 4.7 N/A N/A 2.5 4.7 N/A N/A 2.5
29 – of which: capital conservation buffer requirement 2.5 N/A N/A 2.5 2.5 N/A N/A 2.5
30 – of which: bank specific countercyclical buffer requirement 0.2 N/A N/A N/A 0.2 N/A N/A N/A
31 – of which: higher loss absorbency (G-SIB) requirement 2.0 N/A N/A N/A 2.0 N/A N/A N/A
1 The European resolution group reports in accordance with the applicable provisions of the Capital Requirements Regulation as amended by CRR II. Unless otherwise stated, all figures are calculated using the EU's regulatory transitional arrangements for IFRS 9 in article 473a of the Capital Requirements Regulation.
2 Reporting for the Asian resolution group follows the Hong Kong Monetary Authority regulatory rules. IFRS 9 has been implemented but no regulatory transitional arrangements apply.
3 The US accounting standard for current expected credit losses corresponding to IFRS 9 has been effective since 31 March 2020 with transitional adjustments.Prior leverage exposure and ratio are calculated under the US supplementary leverage ratios rules with Covid-19 relief (excluding US Treasury securities and deposits at the US Federal Reserve Board).
4 For the Group, minimum capital requirement is defined as the sum of Pillar 1 and Pillar 2A capital requirements set by the PRA. The minimum requirements represent the total capital requirement to be met by CET1.
5 The treatment of collateral in RWA calculations in the US resolution group has been revised. Data at 31 December 2020 has been restated to be on a consistent basis with the current year.
HSBC Holdings plc 2Q21 Pillar 3 16

Creditor ranking at legal entity level
The following tables present information regarding the ranking of creditors in the liability structure of legal entities at 30 June 2021. The tables present the ranking of creditors of HSBC Holdings plc, its resolution entities, and their material sub-group entities. Nominal values are disclosed.
The main features of capital instruments disclosure for the Group, Asia and US resolution groups is published on our website, www.hsbc.com/investors/fixed-income-investors/regulatory-capital-securities.
European resolution group
The European resolution group comprises HSBC Holdings plc, the designated resolution entity, together with its material operating entities – namely HSBC Bank plc and its subsidiaries, and HSBC UK Bank plc and its subsidiaries. The following tables present information regarding the ranking of creditors of HSBC Holdings plc, HSBC Bank plc and HSBC UK Bank plc.
Table 13: HSBC Holdings plc creditor ranking (TLAC3)
Creditor ranking ($m)
Sum of 1 to 4
1 2 3 4
(most junior) (most senior)
1 Description of creditor rankingOrdinary shares1
Preference shares and
AT1 instruments
Subordinated notes
Senior notes and other
pari passu liabilities
2 Total capital and liabilities net of credit risk mitigation 10,376 23,381 20,252 84,471 138,480
3 – of row 2 that are excluded liabilities2 — — — 51 51
4 Total capital and liabilities less excluded liabilities (row 2 minus row 3)3 10,376 23,381 20,252 84,420 138,429
5 – of row 4 that are potentially eligible as TLAC3 10,376 23,381 20,252 78,550 132,559
6 – of row 5 with 1 year ≤ residual maturity < 2 years — — — 6,986 6,986
7 – of row 5 with 2 years ≤ residual maturity < 5 years — — 5,279 31,531 36,810
8 – of row 5 with 5 years ≤ residual maturity < 10 years — — 4,483 31,597 36,080
9 – of row 5 with residual maturity ≥ 10 years, but excluding perpetual securities — — 10,490 8,436 18,926
10 – of row 5 that are perpetual securities 10,376 23,381 — — 33,757
1 Excludes the value of share premium and reserves attributable to ordinary shareholders.2 Excluded liabilities are defined in CRR II Article 72a (2). The current balance mainly relates to accruals for retirement benefits and service company
recharges.3 The difference between rows 4 and 5 relates to TLAC eligible securities of $4,507m which are maturing within one year and pari passu liabilities of
$1,364m.
Table 14: HSBC UK Bank plc creditor ranking (TLAC2)
Creditor ranking ($m)
Sum of 1 to 4
1 2 3 4
(most junior) (most senior)
1 Is the resolution entity the creditor/investor?1 Yes Yes Yes Yes
2 Description of creditor rankingOrdinary shares2
AT1 instruments
Subordinated loans
Senior subordinated
loans
3 Total capital and liabilities net of credit risk mitigation — 3,035 4,128 12,256 19,419
4 – of row 3 that are excluded liabilities — — — — —
5 Total capital and liabilities less excluded liabilities (row 3 minus row 4) — 3,035 4,128 12,256 19,419
6 – of row 5 that are eligible as TLAC — 3,035 4,128 12,256 19,419
7 – of row 6 with 1 year ≤ residual maturity < 2 years — — — — —
8 – of row 6 with 2 years ≤ residual maturity < 5 years — — — 2,691 2,691
9 – of row 6 with 5 years ≤ residual maturity < 10 years — — 3,230 9,565 12,795
10 – of row 6 with residual maturity ≥ 10 years, but excluding perpetual securities — — 898 — 898
11 – of row 6 that are perpetual securities — 3,035 — — 3,035
1 The entity’s capital and TLAC are owned by HSBC Holdings plc.2 The nominal value of ordinary shares is £50,002. This excludes the value of share premium and reserves attributable to ordinary shareholders.
Pillar 3 Disclosures at 30 June 2021
17 HSBC Holdings plc 2Q21 Pillar 3

Table 15: HSBC Bank plc creditor ranking (TLAC2)
Creditor ranking ($m)
Sum of 1 to 4
1 2 3 4
(most junior) (most senior)
1 Is the resolution entity the creditor/investor?1 Yes Yes No Partially3
2 Description of creditor rankingOrdinary shares2
Third dollar preference shares and
AT1 instruments
Undated primary
capital notes
Subordinated notes and
subordinated loans
3 Total capital and liabilities net of credit risk mitigation 1,102 5,476 1,550 18,269 26,397
4 – of row 3 that are excluded liabilities — — — — —
5 Total capital and liabilities less excluded liabilities (row 3 minus row 4) 1,102 5,476 1,550 18,269 26,397
6 – of row 5 that are eligible as TLAC 1,102 5,476 1,550 17,519 25,647
7 – of row 6 with 1 year ≤ residual maturity < 2 years — — — — —
8 – of row 6 with 2 years ≤ residual maturity < 5 years — — — 4,272 4,272
9 – of row 6 with 5 years ≤ residual maturity < 10 years — — — 10,448 10,448
10 – of row 6 with residual maturity ≥ 10 years, but excluding perpetual securities — — — 1,831 1,831
11 – of row 6 that are perpetual securities 1,102 5,476 1,550 968 9,096
1 The entity’s ordinary shares are owned by HSBC Holdings plc. Other instruments are either owned by HSBC Holdings plc or by third parties.2 Excludes the value of share premium and reserves attributable to ordinary shareholders.3 $4bn has been issued to third parties; the remaining instruments are owned by HSBC Holdings plc.
Asian resolution group
The Asian resolution group comprises HSBC Asia Holdings Ltd, The Hongkong and Shanghai Banking Corporation Limited, Hang Seng Bank Limited and their subsidiaries. HSBC Asia Holdings Ltd
is the designated resolution entity. The following table presents information regarding the ranking of creditors of HSBC Asia Holdings Limited.
Table 16: HSBC Asia Holdings Ltd creditor ranking¹ (TLAC3)Creditor ranking ($m)
Sum of 1 to 4
1 2 3 4
(most junior) (most senior)
1 Description of creditor rankingOrdinary shares2
AT1 instruments
Tier 2 instruments LAC loans
2 Total capital and liabilities net of credit risk mitigation 56,587 5,700 1,780 24,312 88,379
3 – of row 2 that are excluded liabilities — — — — —
4 Total capital and liabilities less excluded liabilities (row 2 minus row 3) 56,587 5,700 1,780 24,312 88,379
5 – of row 4 that are potentially eligible as TLAC 56,587 5,700 1,780 24,312 88,379
6 – of row 5 with 1 year ≤ residual maturity < 2 years — — — 2,320 2,320
7 – of row 5 with 2 years ≤ residual maturity < 5 years — — — 7,540 7,540
8 – of row 5 with 5 years ≤ residual maturity < 10 years — — 1,180 9,452 10,632
9 – of row 5 with residual maturity ≥ 10 years, but excluding perpetual securities — — 600 5,000 5,600
10 – of row 5 that are perpetual securities 56,587 5,700 — — 62,287
1 The entity’s capital and TLAC are held by HSBC Holdings plc.2 Excludes the value of share premium and reserves attributable to ordinary shareholders.
Within the Asian resolution group, the identified material sub-group entities are The Hongkong and Shanghai Banking Corporation Ltd and Hang Seng Bank Ltd. The following tables
present the make-up of their issued MREL and its ranking on a legal entity basis.
Table 17: The Hongkong and Shanghai Banking Corporation Ltd creditor ranking (TLAC2)
Creditor ranking ($m)
Sum of 1 to 5
1 2 3 4 5
(most junior) (most senior)
1 Is the resolution entity the creditor/investor? Yes Yes No1 Yes Yes
2 Description of creditor rankingOrdinary shares2
AT1 instruments
Primary capital notes
Tier 2 instruments LAC loans
3 Total capital and liabilities net of credit risk mitigation 22,192 5,700 400 1,780 24,312 54,384
4 – of row 3 that are excluded liabilities — — — — — —
5 Total capital and liabilities less excluded liabilities (row 3 minus row 4) 22,192 5,700 400 1,780 24,312 54,384
6 – of row 5 that are eligible as TLAC 22,192 5,700 — 1,780 24,312 53,984
7 – of row 6 with 1 year ≤ residual maturity < 2 years — — — — 2,320 2,320
8 – of row 6 with 2 years ≤ residual maturity < 5 years — — — — 7,540 7,540
9 – of row 6 with 5 years ≤ residual maturity < 10 years — — — 1,180 9,452 10,632
10 – of row 6 with residual maturity ≥ 10 years, but excluding perpetual securities — — — 600 5,000 5,600
11 – of row 6 that are perpetual securities 22,192 5,700 — — — 27,892
1 The company’s primary capital notes are held by third parties.2 Excludes the value of share premium and reserves attributable to ordinary shareholders.
HSBC Holdings plc 2Q21 Pillar 3 18
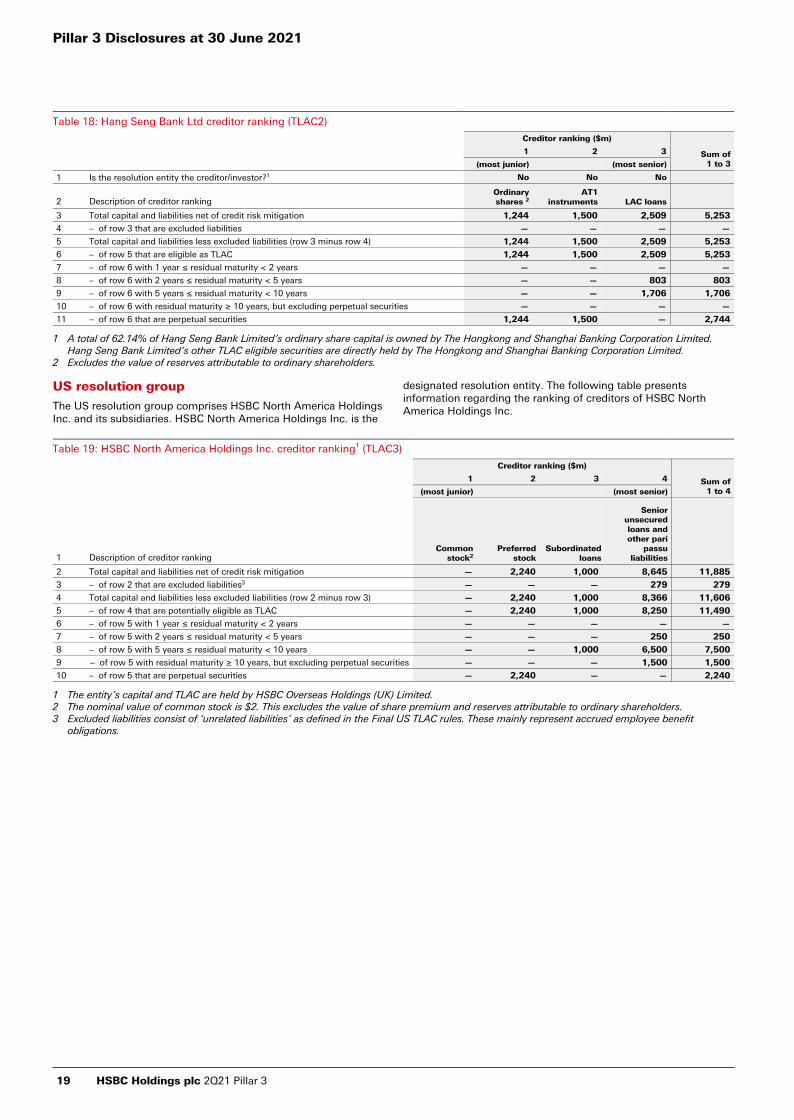
Table 18: Hang Seng Bank Ltd creditor ranking (TLAC2)
Creditor ranking ($m)
Sum of 1 to 3
1 2 3
(most junior) (most senior)
1 Is the resolution entity the creditor/investor?1 No No No
2 Description of creditor rankingOrdinary shares 2
AT1 instruments LAC loans
3 Total capital and liabilities net of credit risk mitigation 1,244 1,500 2,509 5,253
4 – of row 3 that are excluded liabilities — — — —
5 Total capital and liabilities less excluded liabilities (row 3 minus row 4) 1,244 1,500 2,509 5,253
6 – of row 5 that are eligible as TLAC 1,244 1,500 2,509 5,253
7 – of row 6 with 1 year ≤ residual maturity < 2 years — — — —
8 – of row 6 with 2 years ≤ residual maturity < 5 years — — 803 803
9 – of row 6 with 5 years ≤ residual maturity < 10 years — — 1,706 1,706
10 – of row 6 with residual maturity ≥ 10 years, but excluding perpetual securities — — — —
11 – of row 6 that are perpetual securities 1,244 1,500 — 2,744
1 A total of 62.14% of Hang Seng Bank Limited’s ordinary share capital is owned by The Hongkong and Shanghai Banking Corporation Limited. Hang Seng Bank Limited’s other TLAC eligible securities are directly held by The Hongkong and Shanghai Banking Corporation Limited.
2 Excludes the value of reserves attributable to ordinary shareholders.
US resolution group
The US resolution group comprises HSBC North America Holdings Inc. and its subsidiaries. HSBC North America Holdings Inc. is the
designated resolution entity. The following table presents information regarding the ranking of creditors of HSBC North America Holdings Inc.
Table 19: HSBC North America Holdings Inc. creditor ranking¹ (TLAC3)
Creditor ranking ($m)
Sum of 1 to 4
1 2 3 4
(most junior) (most senior)
1 Description of creditor rankingCommon
stock2Preferred
stockSubordinated
loans
Senior unsecured loans and other pari
passu liabilities
2 Total capital and liabilities net of credit risk mitigation — 2,240 1,000 8,645 11,885
3 – of row 2 that are excluded liabilities3 — — — 279 279
4 Total capital and liabilities less excluded liabilities (row 2 minus row 3) — 2,240 1,000 8,366 11,606
5 – of row 4 that are potentially eligible as TLAC — 2,240 1,000 8,250 11,490
6 – of row 5 with 1 year ≤ residual maturity < 2 years — — — — —
7 – of row 5 with 2 years ≤ residual maturity < 5 years — — — 250 250
8 – of row 5 with 5 years ≤ residual maturity < 10 years — — 1,000 6,500 7,500
9 – of row 5 with residual maturity ≥ 10 years, but excluding perpetual securities — — — 1,500 1,500
10 – of row 5 that are perpetual securities — 2,240 — — 2,240
1 The entity’s capital and TLAC are held by HSBC Overseas Holdings (UK) Limited.2 The nominal value of common stock is $2. This excludes the value of share premium and reserves attributable to ordinary shareholders.3 Excluded liabilities consist of ‘unrelated liabilities’ as defined in the Final US TLAC rules. These mainly represent accrued employee benefit
obligations.
Pillar 3 Disclosures at 30 June 2021
19 HSBC Holdings plc 2Q21 Pillar 3
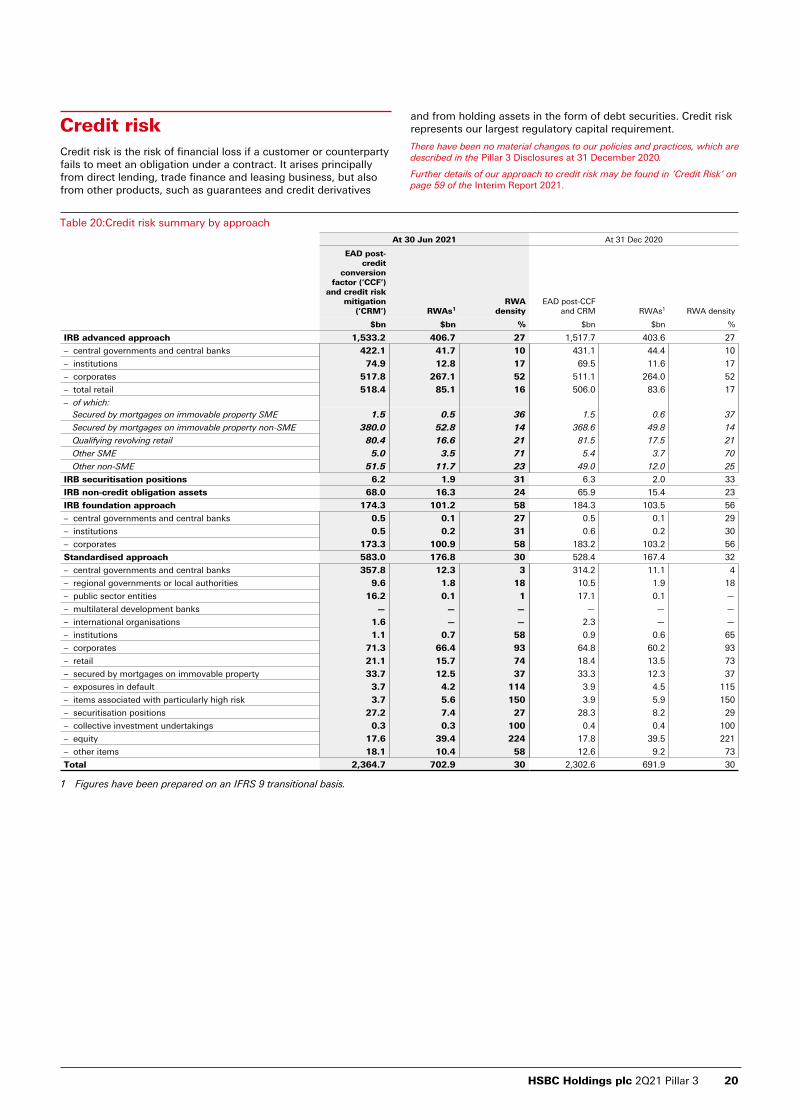
Credit riskCredit risk is the risk of financial loss if a customer or counterparty fails to meet an obligation under a contract. It arises principally from direct lending, trade finance and leasing business, but also from other products, such as guarantees and credit derivatives
and from holding assets in the form of debt securities. Credit risk represents our largest regulatory capital requirement.
There have been no material changes to our policies and practices, which are described in the Pillar 3 Disclosures at 31 December 2020.
Further details of our approach to credit risk may be found in ‘Credit Risk’ on page 59 of the Interim Report 2021.
Table 20:Credit risk summary by approach
At 30 Jun 2021 At 31 Dec 2020
EAD post-credit
conversion factor (‘CCF’)
and credit risk mitigation
(‘CRM’) RWAs1RWA
densityEAD post-CCF
and CRM RWAs1 RWA density
$bn $bn % $bn $bn %
IRB advanced approach 1,533.2 406.7 27 1,517.7 403.6 27
– central governments and central banks 422.1 41.7 10 431.1 44.4 10
– institutions 74.9 12.8 17 69.5 11.6 17
– corporates 517.8 267.1 52 511.1 264.0 52
– total retail 518.4 85.1 16 506.0 83.6 17
– of which:Secured by mortgages on immovable property SME 1.5 0.5 36 1.5 0.6 37
Secured by mortgages on immovable property non-SME 380.0 52.8 14 368.6 49.8 14
Qualifying revolving retail 80.4 16.6 21 81.5 17.5 21
Other SME 5.0 3.5 71 5.4 3.7 70
Other non-SME 51.5 11.7 23 49.0 12.0 25
IRB securitisation positions 6.2 1.9 31 6.3 2.0 33
IRB non-credit obligation assets 68.0 16.3 24 65.9 15.4 23
IRB foundation approach 174.3 101.2 58 184.3 103.5 56
– central governments and central banks 0.5 0.1 27 0.5 0.1 29
– institutions 0.5 0.2 31 0.6 0.2 30
– corporates 173.3 100.9 58 183.2 103.2 56
Standardised approach 583.0 176.8 30 528.4 167.4 32
– central governments and central banks 357.8 12.3 3 314.2 11.1 4
– regional governments or local authorities 9.6 1.8 18 10.5 1.9 18
– public sector entities 16.2 0.1 1 17.1 0.1 —
– multilateral development banks — — — — — —
– international organisations 1.6 — — 2.3 — —
– institutions 1.1 0.7 58 0.9 0.6 65
– corporates 71.3 66.4 93 64.8 60.2 93
– retail 21.1 15.7 74 18.4 13.5 73
– secured by mortgages on immovable property 33.7 12.5 37 33.3 12.3 37
– exposures in default 3.7 4.2 114 3.9 4.5 115
– items associated with particularly high risk 3.7 5.6 150 3.9 5.9 150
– securitisation positions 27.2 7.4 27 28.3 8.2 29
– collective investment undertakings 0.3 0.3 100 0.4 0.4 100
– equity 17.6 39.4 224 17.8 39.5 221
– other items 18.1 10.4 58 12.6 9.2 73
Total 2,364.7 702.9 30 2,302.6 691.9 30
1 Figures have been prepared on an IFRS 9 transitional basis.
HSBC Holdings plc 2Q21 Pillar 3 20

Credit quality of assets
Our credit risk profile is diversified across a number of asset classes and geographies with a credit quality profile concentrated
in the higher quality bands. The following tables present information on the credit quality of exposures by exposure class, industry and geography.
Table 21: Credit quality of exposures by exposure class and instrument¹,² (CR1-A)
Gross carrying values of
Specific credit risk
adjustmentsWrite-offs in
the year2
Credit risk adjustment charges of the period2
Net carrying values
Defaulted exposures
Non-defaulted
exposures
$bn $bn $bn $bn $bn $bn
1 Central governments and central banks 0.2 424.3 — — — 424.5
2 Institutions — 87.7 0.1 — — 87.6
3 Corporates 12.5 1,053.3 7.2 0.5 (0.9) 1,058.6
4 – of which: specialised lending 1.0 48.3 0.5 — — 48.8
6 Retail 3.9 610.4 3.0 0.5 0.2 611.3
7 – secured by real estate property 2.7 378.5 0.4 — — 380.8
8 – of which:
SMEs 0.1 1.4 — — — 1.5
9 Non-SMEs 2.6 377.1 0.4 — — 379.3
10 – qualifying revolving retail 0.3 143.0 1.3 0.3 0.1 142.0
11 – other retail 0.9 88.9 1.3 0.2 0.1 88.5
12 – of which:
SMEs 0.5 14.9 0.6 — — 14.8
13 Non-SMEs 0.4 74.0 0.7 0.2 0.1 73.7
15 Total IRB approach 16.6 2,175.7 10.3 1.0 (0.7) 2,182.0
16 Central governments and central banks — 335.2 — — — 335.2
17 Regional governments or local authorities — 8.9 — — — 8.9
18 Public sector entities — 17.3 — — — 17.3
19 Multilateral development banks — — — — — —
20 International organisations — 1.6 — — — 1.6
21 Institutions — 1.1 — — — 1.1
22 Corporates 3.9 141.1 2.4 0.1 — 142.6
24 Retail 0.8 75.8 1.4 0.3 — 75.2
25 – of which: SMEs — 1.0 0.1 — — 0.9
26 Secured by mortgages on immovable property 1.1 34.5 0.4 — 0.1 35.2
28 Exposures in default 5.8 — 2.2 0.4 0.5 3.6
29 Items associated with particularly high risk — 4.7 — — — 4.7
32 Collective investment undertakings (‘CIU’) — 0.3 — — — 0.3
33 Equity exposures — 17.6 — — — 17.6
34 Other exposures — 18.1 — — — 18.1
35 Total standardised approach 5.8 656.2 4.2 0.4 0.1 657.8
36 Total at 30 Jun 2021 22.4 2,831.9 14.5 1.4 (0.6) 2,839.8
– of which: loans 19.9 1,552.8 13.5 1.4 (0.2) 1,559.2
– of which: debt securities 0.3 365.8 0.1 — (0.1) 366.0
– of which: off-balance sheet exposures 2.2 870.7 0.9 — (0.3) 872.0
Pillar 3 Disclosures at 30 June 2021
21 HSBC Holdings plc 2Q21 Pillar 3
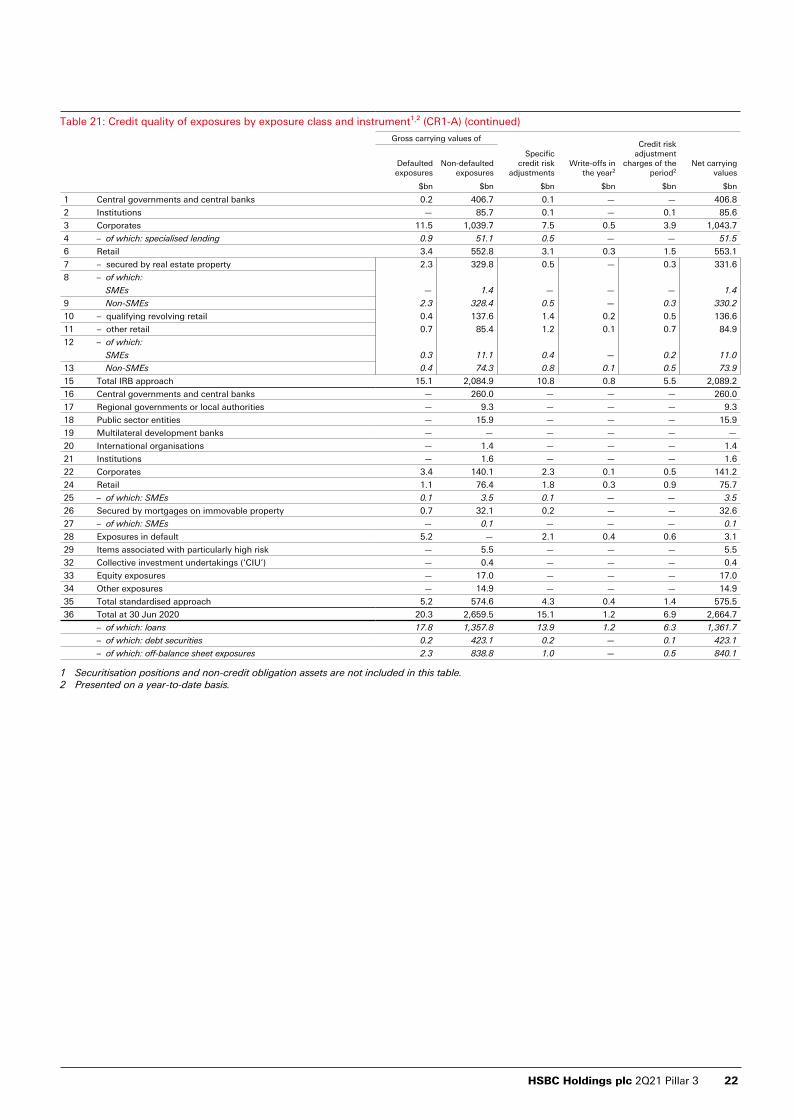
Table 21: Credit quality of exposures by exposure class and instrument¹,² (CR1-A) (continued)
Gross carrying values of
Specificcredit risk
adjustmentsWrite-offs in
the year2
Credit risk adjustment
charges of the period2
Net carrying values
Defaulted exposures
Non-defaulted exposures
$bn $bn $bn $bn $bn $bn
1 Central governments and central banks 0.2 406.7 0.1 — — 406.8
2 Institutions — 85.7 0.1 — 0.1 85.6
3 Corporates 11.5 1,039.7 7.5 0.5 3.9 1,043.7
4 – of which: specialised lending 0.9 51.1 0.5 — — 51.5
6 Retail 3.4 552.8 3.1 0.3 1.5 553.1
7 – secured by real estate property 2.3 329.8 0.5 — 0.3 331.6
8 – of which:
SMEs — 1.4 — — — 1.4
9 Non-SMEs 2.3 328.4 0.5 — 0.3 330.2
10 – qualifying revolving retail 0.4 137.6 1.4 0.2 0.5 136.6
11 – other retail 0.7 85.4 1.2 0.1 0.7 84.9
12 – of which:
SMEs 0.3 11.1 0.4 — 0.2 11.0
13 Non-SMEs 0.4 74.3 0.8 0.1 0.5 73.9
15 Total IRB approach 15.1 2,084.9 10.8 0.8 5.5 2,089.2
16 Central governments and central banks — 260.0 — — — 260.0
17 Regional governments or local authorities — 9.3 — — — 9.3
18 Public sector entities — 15.9 — — — 15.9
19 Multilateral development banks — — — — — —
20 International organisations — 1.4 — — — 1.4
21 Institutions — 1.6 — — — 1.6
22 Corporates 3.4 140.1 2.3 0.1 0.5 141.2
24 Retail 1.1 76.4 1.8 0.3 0.9 75.7
25 – of which: SMEs 0.1 3.5 0.1 — — 3.5
26 Secured by mortgages on immovable property 0.7 32.1 0.2 — — 32.6
27 – of which: SMEs — 0.1 — — — 0.1
28 Exposures in default 5.2 — 2.1 0.4 0.6 3.1
29 Items associated with particularly high risk — 5.5 — — — 5.5
32 Collective investment undertakings (‘CIU’) — 0.4 — — — 0.4
33 Equity exposures — 17.0 — — — 17.0
34 Other exposures — 14.9 — — — 14.9
35 Total standardised approach 5.2 574.6 4.3 0.4 1.4 575.5
36 Total at 30 Jun 2020 20.3 2,659.5 15.1 1.2 6.9 2,664.7
– of which: loans 17.8 1,357.8 13.9 1.2 6.3 1,361.7
– of which: debt securities 0.2 423.1 0.2 — 0.1 423.1
– of which: off-balance sheet exposures 2.3 838.8 1.0 — 0.5 840.1
1 Securitisation positions and non-credit obligation assets are not included in this table.2 Presented on a year-to-date basis.
HSBC Holdings plc 2Q21 Pillar 3 22

Table 22: Credit quality of exposures by industry or counterparty types¹,²,³ (CR1-B)
Gross carrying values of
Specific credit risk
adjustmentsWrite-offs
in the year3
Credit risk adjustment charges of the period3
Net carrying values
Defaulted exposures
Non-defaulted
exposures
$bn $bn $bn $bn $bn $bn
1 Agriculture 0.4 10.8 0.1 — — 11.1
2 Mining and oil extraction 0.5 37.1 0.4 — (0.2) 37.2
3 Manufacturing 2.8 243.4 2.0 0.3 0.1 244.2
4 Utilities 0.1 33.8 0.1 — — 33.8
5 Water supply — 3.4 — — — 3.4
6 Construction 1.2 43.3 0.6 — — 43.9
7 Wholesale and retail trade 3.7 199.9 2.6 0.1 — 201.0
8 Transportation and storage 0.8 52.4 0.4 — — 52.8
9 Accommodation and food services 0.9 30.1 0.6 — 0.2 30.4
10 Information and communication 0.7 19.7 0.2 — — 20.2
11 Financial and insurance 0.4 797.2 0.3 — (0.1) 797.3
12 Real estate 1.9 196.2 1.1 — (0.1) 197.0
13 Professional activities 0.3 31.4 0.1 — (0.1) 31.6
14 Administrative service 2.4 148.9 1.2 — (0.6) 150.1
15 Public administration and defence 0.4 260.9 0.2 — (0.1) 261.1
16 Education — 4.2 — — — 4.2
17 Human health and social work 0.2 11.2 0.1 0.1 — 11.3
18 Arts and entertainment 0.2 8.3 0.2 — — 8.3
19 Other services 0.2 15.2 0.1 — — 15.3
20 Personal 5.3 676.1 4.2 0.9 0.3 677.2
21 Extraterritorial bodies — 8.4 — — — 8.4
22 Total at 30 Jun 2021 22.4 2,831.9 14.5 1.4 (0.6) 2,839.8
1 Agriculture 0.4 9.1 0.2 — — 9.3
2 Mining and oil extraction 1.4 39.4 0.7 — 0.4 40.1
3 Manufacturing 2.3 255.9 1.9 0.4 0.8 256.3
4 Utilities 0.1 33.4 0.1 — — 33.4
5 Water supply — 3.2 — — — 3.2
6 Construction 1.0 42.8 0.7 — 0.1 43.1
7 Wholesale and retail trade 3.6 194.2 2.5 0.1 1.3 195.3
8 Transportation and storage 0.9 47.4 0.4 — 0.2 47.9
9 Accommodation and food services 0.3 29.8 0.3 — 0.2 29.8
10 Information and communication 0.2 15.3 0.2 — 0.1 15.3
11 Financial and insurance 0.9 645.1 0.4 — 0.2 645.6
12 Real estate 1.1 196.3 1.0 — 0.3 196.4
13 Professional activities 0.3 27.2 0.2 — 0.1 27.3
14 Administrative service 1.9 158.2 1.3 — 0.5 158.8
15 Public administration and defence 0.4 292.1 0.2 — — 292.3
16 Education — 3.9 — — — 3.9
17 Human health and social work 0.3 7.2 0.2 — 0.1 7.3
18 Arts and entertainment — 7.7 0.1 — 0.1 7.6
19 Other services 0.2 15.6 0.1 — 0.1 15.7
20 Personal 5.0 626.6 4.6 0.7 2.4 627.0
21 Extraterritorial bodies — 9.1 — — — 9.1
22 Total at 30 Jun 2020 20.3 2,659.5 15.1 1.2 6.9 2,664.7
1 Securitisation positions and non-credit obligation assets are not included in this table.2 The industry classifications of this disclosure have been revised. Data for 30 June 2020 has been restated to be on a consistent basis with the
current year.3 Presented on a year-to-date basis.
Pillar 3 Disclosures at 30 June 2021
23 HSBC Holdings plc 2Q21 Pillar 3

Table 23: Credit quality of exposures by geography¹,²,³ (CR1-C)
Gross carrying values of
Specific credit risk
adjustmentsWrite-offs
in the year3
Credit risk adjustment charges of the period3
Net carrying
valuesDefaulted exposures
Non-defaulted
exposures
$bn $bn $bn $bn $bn $bn
1 Europe 9.3 1,008.6 5.7 0.6 (0.8) 1,012.2
2 – UK 5.8 650.3 4.2 0.6 (0.7) 651.9
3 – France 1.3 175.1 0.7 — — 175.7
4 – Other countries 2.2 183.2 0.8 — (0.1) 184.6
5 Asia 5.2 1,144.8 3.8 0.3 0.3 1,146.2
6 – Hong Kong 1.9 572.2 1.4 0.2 0.1 572.7
7 – mainland China 0.3 185.3 0.3 — — 185.3
8 – Singapore 1.0 89.6 0.9 — — 89.7
9 – Australia 0.5 66.7 0.1 — — 67.1
10 – Other countries 1.5 231.0 1.1 0.1 0.2 231.4
11 Middle East and North Africa (‘MENA’) 4.0 149.2 2.4 0.1 (0.1) 150.8
12 North America 2.5 462.2 1.2 0.1 (0.1) 463.5
13 – US 1.5 323.8 0.7 0.1 (0.1) 324.6
14 – Canada 0.3 126.2 0.3 — — 126.2
15 – Other countries 0.7 12.2 0.2 — — 12.7
16 Latin America 1.4 52.2 1.4 0.3 0.1 52.2
17 Other geographical areas — 14.9 — — — 14.9
18 Total at 30 Jun 2021 22.4 2,831.9 14.5 1.4 (0.6) 2,839.8
1 Europe 9.3 883.8 6.1 0.4 2.9 887.0
2 – UK 5.4 532.0 4.4 0.4 2.3 533.0
3 – France 1.4 167.5 0.7 — 0.2 168.2
4 – Other countries 2.5 184.3 1.0 — 0.4 185.8
5 Asia 4.0 1,095.0 3.7 0.3 1.8 1,095.3
6 – Hong Kong 1.1 556.9 1.2 0.2 0.5 556.8
7 – mainland China 0.3 167.0 0.5 — 0.1 166.8
8 – Singapore 1.0 85.8 0.9 — 0.8 85.9
9 – Australia 0.2 62.1 0.2 — 0.1 62.1
10 – Other countries 1.4 223.2 0.9 0.1 0.3 223.7
11 MENA 3.3 146.8 2.5 0.1 0.6 147.6
12 North America 2.5 463.7 1.5 0.2 1.0 464.7
13 – US 1.6 328.3 0.8 0.2 0.7 329.1
14 – Canada 0.3 120.4 0.4 — 0.2 120.3
15 – Other countries 0.6 15.0 0.3 — 0.1 15.3
16 Latin America 1.2 52.7 1.3 0.2 0.6 52.6
17 Other geographical areas — 17.5 — — — 17.5
18 Total at 30 Jun 2020 20.3 2,659.5 15.1 1.2 6.9 2,664.7
1 Amounts shown by geographical region and country/territory in this table are based on the country/territory of residence of the counterparty.2 Securitisation positions and non-credit obligation assets are not included in this table.3 Presented on a year-to-date basis.
Non-performing and forborne exposures
Tables 24 to 27 are presented in accordance with the EBA’s 'Guidelines on disclosure of non-performing and forborne exposures'.
The EBA defines non-performing exposures as exposures with material amounts that are more than 90 days past due or exposures where the debtor is assessed as unlikely to pay its credit obligations in full without the realisation of collateral, regardless of the existence of any past due amounts or number days past due. Any debtors that are in default for regulatory purposes or impaired under the applicable accounting framework are always considered as non-performing exposures. The Annual Report and Accounts 2020 does not define non-performing exposures, although the definition of credit impaired (stage 3) is aligned to the EBA's definition of non-performing exposures.
Forborne exposures are defined by the EBA as exposures where the bank has made concessions toward a debtor that is experiencing or about to experience financial difficulties in meeting its financial commitments. In the Annual Report and Accounts 2020, forborne exposures are reported as ‘renegotiated loans’. We classify loans as ‘renegotiated’/EBA forborne when we modify the contractual payment terms because we have significant concerns about the borrowers’ ability to meet the contractual payments when due. While non-payment-related
concessions such as covenant waivers are potential indicators of impairment, they do not trigger identification as ‘renegotiated’/EBA forborne loans.
Under the EBA definition, exposures cease to be reported as forborne if they pass three tests:
• The forborne exposure must have been considered to beperforming for a probation period of at least two years.
• Regular payments of more than an insignificant aggregateamount of principal or interest have been made during at leasthalf of the probation period.
• No exposure to the debtor is more than 30 days past due at theend of the probation period.
In the Annual Report and Accounts 2020, renegotiated loans retain this classification until maturity or derecognition.
Under EBA and PRA guidelines, the use of support measures introduced as a result of the Covid-19 outbreak does not in itself trigger identification as non-performing or forborne. Borrower-specific support measures are assessed under the existing rules to determine whether forbearance has been granted.
HSBC Holdings plc 2Q21 Pillar 3 24
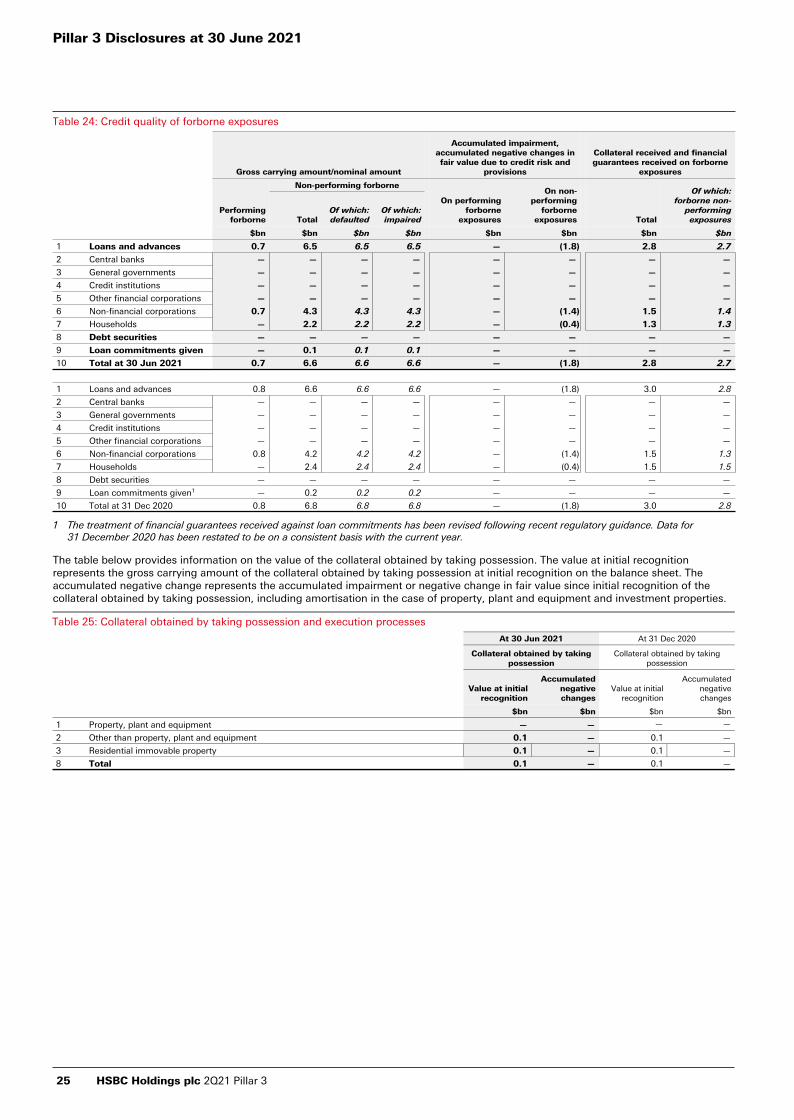
Table 24: Credit quality of forborne exposures
Gross carrying amount/nominal amount
Accumulated impairment, accumulated negative changes in fair value due to credit risk and
provisions
Collateral received and financial guarantees received on forborne
exposures
Performing forborne
Non-performing forborne
On performing forborne
exposures
On non-performing
forborne exposures Total
Of which: forborne non-
performing exposures Total
Of which: defaulted
Of which: impaired
$bn $bn $bn $bn $bn $bn $bn $bn
1 Loans and advances 0.7 6.5 6.5 6.5 — (1.8) 2.8 2.7
2 Central banks — — — — — — — —
3 General governments — — — — — — — —
4 Credit institutions — — — — — — — —
5 Other financial corporations — — — — — — — —
6 Non-financial corporations 0.7 4.3 4.3 4.3 — (1.4) 1.5 1.4
7 Households — 2.2 2.2 2.2 — (0.4) 1.3 1.3
8 Debt securities — — — — — — — —
9 Loan commitments given — 0.1 0.1 0.1 — — — —
10 Total at 30 Jun 2021 0.7 6.6 6.6 6.6 — (1.8) 2.8 2.7
1 Loans and advances 0.8 6.6 6.6 6.6 — (1.8) 3.0 2.8
2 Central banks — — — — — — — —
3 General governments — — — — — — — —
4 Credit institutions — — — — — — — —
5 Other financial corporations — — — — — — — —
6 Non-financial corporations 0.8 4.2 4.2 4.2 — (1.4) 1.5 1.3
7 Households — 2.4 2.4 2.4 — (0.4) 1.5 1.5
8 Debt securities — — — — — — — —
9 Loan commitments given1 — 0.2 0.2 0.2 — — — —
10 Total at 31 Dec 2020 0.8 6.8 6.8 6.8 — (1.8) 3.0 2.8
1 The treatment of financial guarantees received against loan commitments has been revised following recent regulatory guidance. Data for31 December 2020 has been restated to be on a consistent basis with the current year.
The table below provides information on the value of the collateral obtained by taking possession. The value at initial recognition represents the gross carrying amount of the collateral obtained by taking possession at initial recognition on the balance sheet. The accumulated negative change represents the accumulated impairment or negative change in fair value since initial recognition of the collateral obtained by taking possession, including amortisation in the case of property, plant and equipment and investment properties.
Table 25: Collateral obtained by taking possession and execution processes
At 30 Jun 2021 At 31 Dec 2020
Collateral obtained by taking possession
Collateral obtained by taking possession
Value at initial recognition
Accumulated negative changes
Value at initial recognition
Accumulated negative changes
$bn $bn $bn $bn
1 Property, plant and equipment — — — —
2 Other than property, plant and equipment 0.1 — 0.1 —
3 Residential immovable property 0.1 — 0.1 —
8 Total 0.1 — 0.1 —
Pillar 3 Disclosures at 30 June 2021
25 HSBC Holdings plc 2Q21 Pillar 3
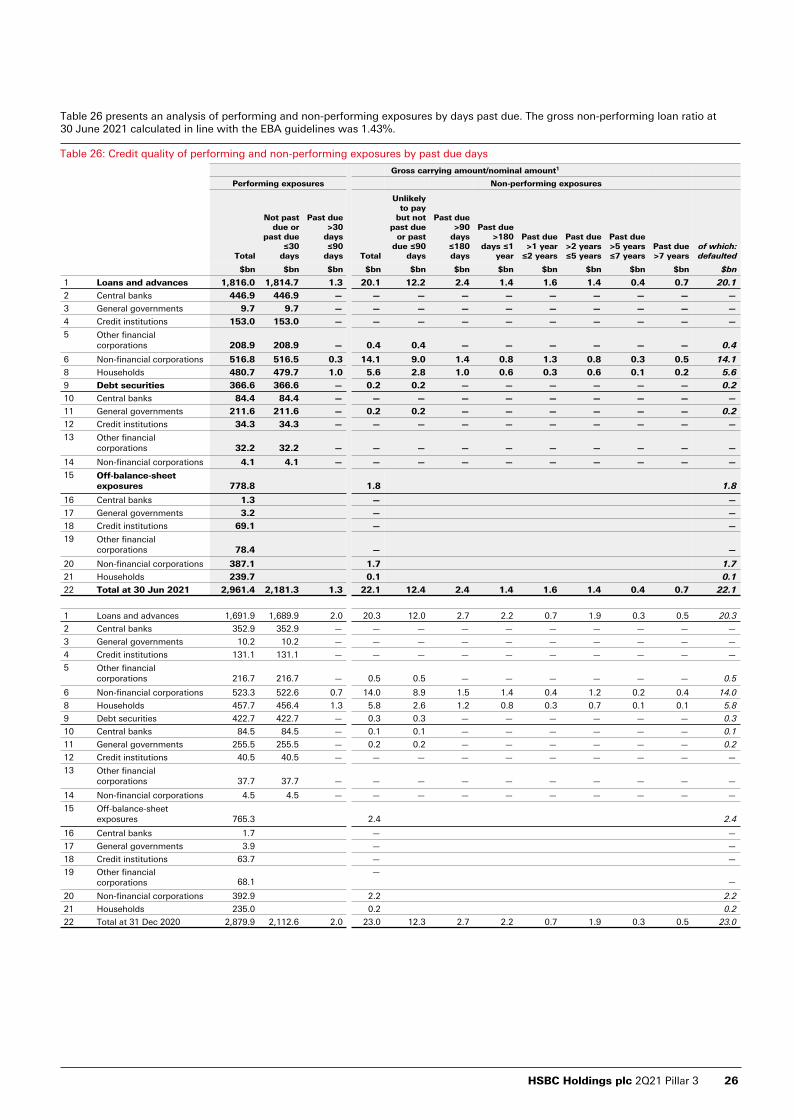
Table 26 presents an analysis of performing and non-performing exposures by days past due. The gross non-performing loan ratio at 30 June 2021 calculated in line with the EBA guidelines was 1.43%.
Table 26: Credit quality of performing and non-performing exposures by past due days
Gross carrying amount/nominal amount1
Performing exposures Non-performing exposures
Total
Not past due or
past due ≤30
days
Past due >30
days≤90
days Total
Unlikely to pay
but not past due
or past due ≤90
days
Past due >90
days ≤180 days
Past due >180
days ≤1 year
Past due >1 year
≤2 years
Past due >2 years ≤5 years
Past due >5 years ≤7 years
Past due >7 years
of which: defaulted
$bn $bn $bn $bn $bn $bn $bn $bn $bn $bn $bn $bn
1 Loans and advances 1,816.0 1,814.7 1.3 20.1 12.2 2.4 1.4 1.6 1.4 0.4 0.7 20.1
2 Central banks 446.9 446.9 — — — — — — — — — —
3 General governments 9.7 9.7 — — — — — — — — — —
4 Credit institutions 153.0 153.0 — — — — — — — — — —
5 Other financial corporations 208.9 208.9 — 0.4 0.4 — — — — — — 0.4
6 Non-financial corporations 516.8 516.5 0.3 14.1 9.0 1.4 0.8 1.3 0.8 0.3 0.5 14.1
8 Households 480.7 479.7 1.0 5.6 2.8 1.0 0.6 0.3 0.6 0.1 0.2 5.6
9 Debt securities 366.6 366.6 — 0.2 0.2 — — — — — — 0.2
10 Central banks 84.4 84.4 — — — — — — — — — —
11 General governments 211.6 211.6 — 0.2 0.2 — — — — — — 0.2
12 Credit institutions 34.3 34.3 — — — — — — — — — —
13 Other financial corporations 32.2 32.2 — — — — — — — — — —
14 Non-financial corporations 4.1 4.1 — — — — — — — — — —
15 Off-balance-sheet exposures 778.8 1.8 1.8
16 Central banks 1.3 — —
17 General governments 3.2 — —
18 Credit institutions 69.1 — —
19 Other financial corporations 78.4 — —
20 Non-financial corporations 387.1 1.7 1.7
21 Households 239.7 0.1 0.1
22 Total at 30 Jun 2021 2,961.4 2,181.3 1.3 22.1 12.4 2.4 1.4 1.6 1.4 0.4 0.7 22.1
1 Loans and advances 1,691.9 1,689.9 2.0 20.3 12.0 2.7 2.2 0.7 1.9 0.3 0.5 20.3
2 Central banks 352.9 352.9 — — — — — — — — — —
3 General governments 10.2 10.2 — — — — — — — — — —
4 Credit institutions 131.1 131.1 — — — — — — — — — —
5 Other financial corporations 216.7 216.7 — 0.5 0.5 — — — — — — 0.5
6 Non-financial corporations 523.3 522.6 0.7 14.0 8.9 1.5 1.4 0.4 1.2 0.2 0.4 14.0
8 Households 457.7 456.4 1.3 5.8 2.6 1.2 0.8 0.3 0.7 0.1 0.1 5.8
9 Debt securities 422.7 422.7 — 0.3 0.3 — — — — — — 0.3
10 Central banks 84.5 84.5 — 0.1 0.1 — — — — — — 0.1
11 General governments 255.5 255.5 — 0.2 0.2 — — — — — — 0.2
12 Credit institutions 40.5 40.5 — — — — — — — — — —
13 Other financial corporations 37.7 37.7 — — — — — — — — — —
14 Non-financial corporations 4.5 4.5 — — — — — — — — — —
15 Off-balance-sheet exposures 765.3 2.4 2.4
16 Central banks 1.7 — —
17 General governments 3.9 — —
18 Credit institutions 63.7 — —
19 Other financial corporations 68.1
— —
20 Non-financial corporations 392.9 2.2 2.2
21 Households 235.0 0.2 0.2
22 Total at 31 Dec 2020 2,879.9 2,112.6 2.0 23.0 12.3 2.7 2.2 0.7 1.9 0.3 0.5 23.0
HSBC Holdings plc 2Q21 Pillar 3 26
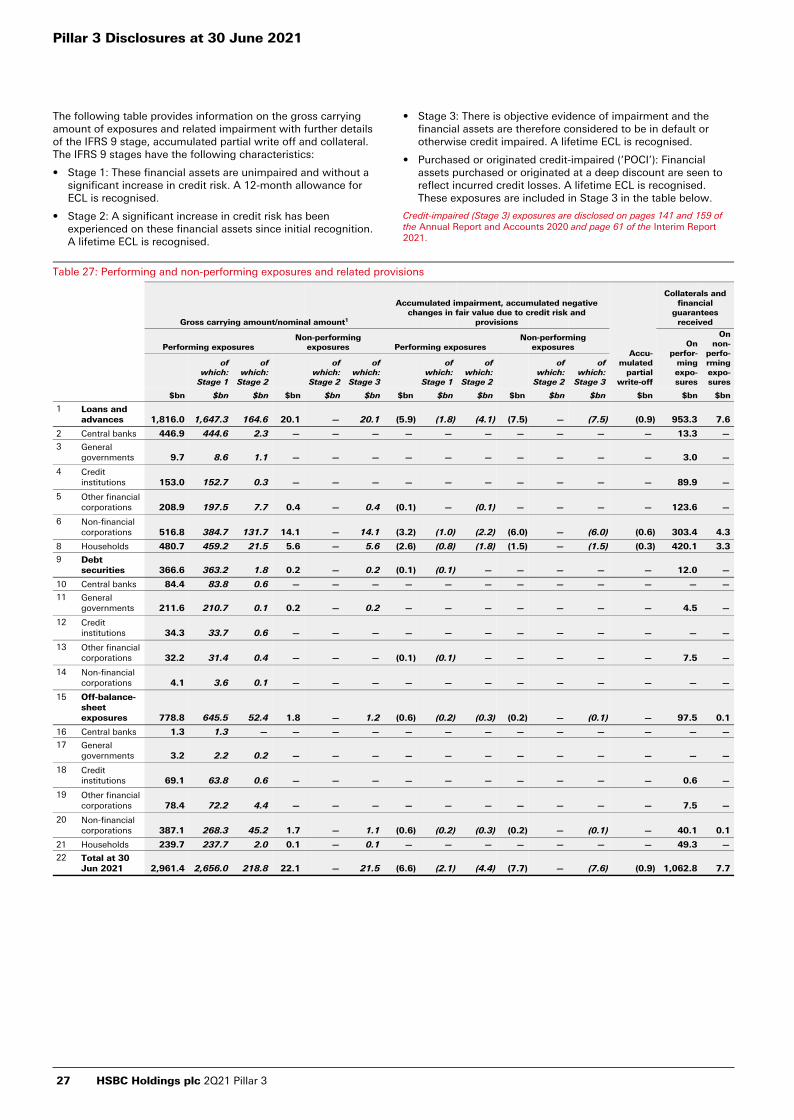
The following table provides information on the gross carrying amount of exposures and related impairment with further details of the IFRS 9 stage, accumulated partial write off and collateral. The IFRS 9 stages have the following characteristics:
• Stage 1: These financial assets are unimpaired and without a significant increase in credit risk. A 12-month allowance for ECL is recognised.
• Stage 2: A significant increase in credit risk has been experienced on these financial assets since initial recognition.A lifetime ECL is recognised.
• Stage 3: There is objective evidence of impairment and the financial assets are therefore considered to be in default or otherwise credit impaired. A lifetime ECL is recognised.
• Purchased or originated credit-impaired (‘POCI’): Financial assets purchased or originated at a deep discount are seen to reflect incurred credit losses. A lifetime ECL is recognised. These exposures are included in Stage 3 in the table below.
Credit-impaired (Stage 3) exposures are disclosed on pages 141 and 159 of the Annual Report and Accounts 2020 and page 61 of the Interim Report 2021.
Table 27: Performing and non-performing exposures and related provisions
Gross carrying amount/nominal amount1
Accumulated impairment, accumulated negative changes in fair value due to credit risk and
provisions
Accu-mulated
partial write-off
Collaterals and financial
guarantees received
Performing exposures Non-performing
exposures Performing exposures Non-performing
exposures On perfor-
ming expo-sures
On non-
perfo-rming expo-sures
of which:
Stage 1
of which:
Stage 2
of which:
Stage 2
of which:
Stage 3
of which:
Stage 1
of which:
Stage 2
of which:
Stage 2
of which:
Stage 3
$bn $bn $bn $bn $bn $bn $bn $bn $bn $bn $bn $bn $bn $bn $bn
1 Loans and advances 1,816.0 1,647.3 164.6 20.1 — 20.1 (5.9) (1.8) (4.1) (7.5) — (7.5) (0.9) 953.3 7.6
2 Central banks 446.9 444.6 2.3 — — — — — — — — — — 13.3 —
3 General governments 9.7 8.6 1.1 — — — — — — — — — — 3.0 —
4 Credit institutions 153.0 152.7 0.3 — — — — — — — — — — 89.9 —
5 Other financial corporations 208.9 197.5 7.7 0.4 — 0.4 (0.1) — (0.1) — — — — 123.6 —
6 Non-financial corporations 516.8 384.7 131.7 14.1 — 14.1 (3.2) (1.0) (2.2) (6.0) — (6.0) (0.6) 303.4 4.3
8 Households 480.7 459.2 21.5 5.6 — 5.6 (2.6) (0.8) (1.8) (1.5) — (1.5) (0.3) 420.1 3.3
9 Debt securities 366.6 363.2 1.8 0.2 — 0.2 (0.1) (0.1) — — — — — 12.0 —
10 Central banks 84.4 83.8 0.6 — — — — — — — — — — — —
11 General governments 211.6 210.7 0.1 0.2 — 0.2 — — — — — — — 4.5 —
12 Credit institutions 34.3 33.7 0.6 — — — — — — — — — — — —
13 Other financial corporations 32.2 31.4 0.4 — — — (0.1) (0.1) — — — — — 7.5 —
14 Non-financial corporations 4.1 3.6 0.1 — — — — — — — — — — — —
15 Off-balance-sheet exposures 778.8 645.5 52.4 1.8 — 1.2 (0.6) (0.2) (0.3) (0.2) — (0.1) — 97.5 0.1
16 Central banks 1.3 1.3 — — — — — — — — — — — — —
17 General governments 3.2 2.2 0.2 — — — — — — — — — — — —
18 Credit institutions 69.1 63.8 0.6 — — — — — — — — — — 0.6 —
19 Other financial corporations 78.4 72.2 4.4 — — — — — — — — — — 7.5 —
20 Non-financial corporations 387.1 268.3 45.2 1.7 — 1.1 (0.6) (0.2) (0.3) (0.2) — (0.1) — 40.1 0.1
21 Households 239.7 237.7 2.0 0.1 — 0.1 — — — — — — — 49.3 —
22 Total at 30 Jun 2021 2,961.4 2,656.0 218.8 22.1 — 21.5 (6.6) (2.1) (4.4) (7.7) — (7.6) (0.9) 1,062.8 7.7
Pillar 3 Disclosures at 30 June 2021
27 HSBC Holdings plc 2Q21 Pillar 3
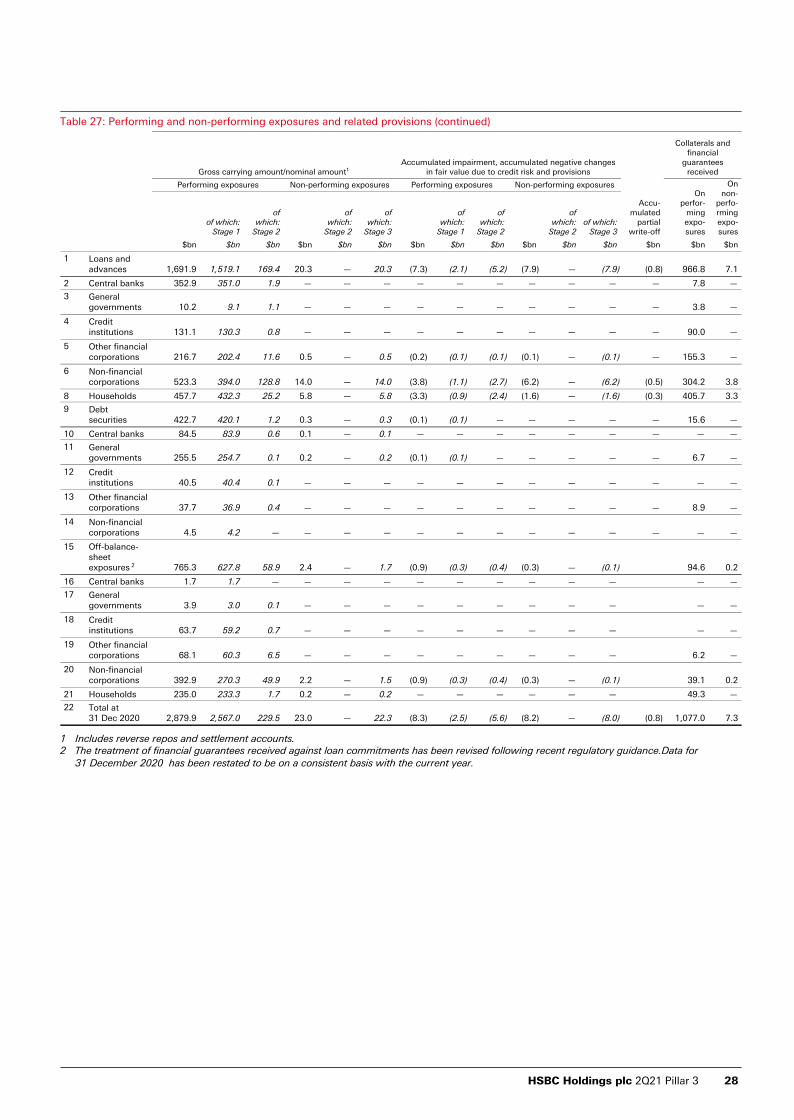
Table 27: Performing and non-performing exposures and related provisions (continued)
Gross carrying amount/nominal amount1Accumulated impairment, accumulated negative changes
in fair value due to credit risk and provisions
Accu-mulated
partial write-off
Collaterals and financial
guarantees received
Performing exposures Non-performing exposures Performing exposures Non-performing exposures On
perfor-ming expo-sures
On non-
perfo-rming expo-sures
of which: Stage 1
of which:
Stage 2
of which:
Stage 2
of which:
Stage 3
of which:
Stage 1
of which:
Stage 2
of which:
Stage 2of which:
Stage 3
$bn $bn $bn $bn $bn $bn $bn $bn $bn $bn $bn $bn $bn $bn $bn
1 Loans and advances 1,691.9 1,519.1 169.4 20.3 — 20.3 (7.3) (2.1) (5.2) (7.9) — (7.9) (0.8) 966.8 7.1
2 Central banks 352.9 351.0 1.9 — — — — — — — — — — 7.8 —
3 General governments 10.2 9.1 1.1 — — — — — — — — — — 3.8 —
4 Credit institutions 131.1 130.3 0.8 — — — — — — — — — — 90.0 —
5 Other financial corporations 216.7 202.4 11.6 0.5 — 0.5 (0.2) (0.1) (0.1) (0.1) — (0.1) — 155.3 —
6 Non-financial corporations 523.3 394.0 128.8 14.0 — 14.0 (3.8) (1.1) (2.7) (6.2) — (6.2) (0.5) 304.2 3.8
8 Households 457.7 432.3 25.2 5.8 — 5.8 (3.3) (0.9) (2.4) (1.6) — (1.6) (0.3) 405.7 3.3
9 Debt securities 422.7 420.1 1.2 0.3 — 0.3 (0.1) (0.1) — — — — — 15.6 —
10 Central banks 84.5 83.9 0.6 0.1 — 0.1 — — — — — — — — —
11 General governments 255.5 254.7 0.1 0.2 — 0.2 (0.1) (0.1) — — — — — 6.7 —
12 Credit institutions 40.5 40.4 0.1 — — — — — — — — — — — —
13 Other financial corporations 37.7 36.9 0.4 — — — — — — — — — — 8.9 —
14 Non-financial corporations 4.5 4.2 — — — — — — — — — — — — —
15 Off-balance-sheet exposures 2 765.3 627.8 58.9 2.4 — 1.7 (0.9) (0.3) (0.4) (0.3) — (0.1) 94.6 0.2
16 Central banks 1.7 1.7 — — — — — — — — — — — —
17 General governments 3.9 3.0 0.1 — — — — — — — — — — —
18 Credit institutions 63.7 59.2 0.7 — — — — — — — — — — —
19 Other financial corporations 68.1 60.3 6.5 — — — — — — — — — 6.2 —
20 Non-financial corporations 392.9 270.3 49.9 2.2 — 1.5 (0.9) (0.3) (0.4) (0.3) — (0.1) 39.1 0.2
21 Households 235.0 233.3 1.7 0.2 — 0.2 — — — — — — 49.3 —
22 Total at 31 Dec 2020 2,879.9 2,567.0 229.5 23.0 — 22.3 (8.3) (2.5) (5.6) (8.2) — (8.0) (0.8) 1,077.0 7.3
1 Includes reverse repos and settlement accounts.2 The treatment of financial guarantees received against loan commitments has been revised following recent regulatory guidance.Data for
31 December 2020 has been restated to be on a consistent basis with the current year.
HSBC Holdings plc 2Q21 Pillar 3 28

The following tables provide information on payment moratoria and forbearance measures on existing loans and public guarantees to new lending in the context of Covid-19.
Table 28: Loans and advances subject to legislative and non-legislative moratoria
Gross carrying amountAccumulated impairment, accumulated negative changes
in fair value due to credit risk
Gross carrying amount
Performing exposures Non-performing exposures Performing exposures Non-performing exposures
Inflows to non-
performing exposures
ofwhich:
forborne
ofwhich:stage 2
ofwhich:
forborne
Unlikely to pay
but not past due
or past due ≤90
days
ofwhich:
forborne
ofwhich:stage 2
ofwhich:
forborne
Unlikely to pay
but not past due
or past due ≤90
days
$bn $bn $bn $bn $bn $bn $bn $bn $bn $bn $bn $bn $bn
1 Loans and advances 8.1 — 5.5 0.5 0.1 0.4 (0.1) — (0.1) — — — 0.3
2 – of which: households 1.3 — 0.8 0.4 0.1 0.3 — — — — — — 0.2
3 – of which: collateralised by residential immovable property 1.0 — 0.7 0.3 0.1 0.2 — — — — — — 0.2
4 – of which: non-financial corporations 6.8 — 4.7 0.1 — 0.1 (0.1) — (0.1) — — — 0.1
6 – of which: collateralised by commercial immovable property 2.9 — 2.2 — — — — — — — — — —
Table 29: Loans and advances subject to legislative and non-legislative moratoria by residual maturity
Number of obligors
Gross carrying amount/nominal amount
of which: legislative moratoria
of which: expired
Residual maturity of moratoria
≤3 months>3 months ≤6 months
>6 months ≤9 months
>9 months ≤12 months >1 year
$bn $bn $bn $bn $bn $bn $bn $bn
1 Loans and advances for which moratorium was offered 527.0 68.9
2 Loans and advances subject to moratorium (granted) 522.0 67.8 32.4 59.2 2.6 5.2 0.4 0.1 0.3
3 – of which: households 28.0 19.5 26.3 1.1 0.4 0.1 — 0.1
4 – of which: collateralised by residential immovable property 23.7 16.5 22.4 1.0 0.2 0.1 — —
5 – of which: non-financial corporations 39.7 12.8 32.8 1.5 4.8 0.3 0.1 0.2
7 – of which: collateralised by commercial immovable property 19.0 7.8 16.1 0.5 2.4 — — —
Pillar 3 Disclosures at 30 June 2021
29 HSBC Holdings plc 2Q21 Pillar 3

Table 30: Newly originated loans and advances provided under newly applicable public guarantee schemes
Gross carrying amount
Public guarantees
received
Inflows to non-
performing exposures
of which:forborne
Maximum amount that
can be considered
Gross carrying amount
$bn $bn $bn $bn
1 Newly originated loans and advances subject to public guarantee schemes 20 — 18.5 0.2
2 – of which: Households 0.1 —
3 – of which: Collateralised by residential immovable property — —
4 – of which: Non-financial corporations 19.8 — 18.3 0.2
6 – of which: Collateralised by commercial immovable property 1.1 —
.
Defaulted exposures
The accounting definition of impairment and the regulatory definition of default are generally aligned. For specific retail exposures, regulatory default is identified at 180 days past due,
while the exposures are identified as impaired at 90 days past due.
In the retail portfolio in the US, a renegotiation would normally trigger identification as ‘impaired’ for accounting purposes. For regulatory purposes, default is identified mainly based on the 180 days past due criterion.
Table 31: Changes in stock of general and specific credit risk adjustments (CR2-A)
Half-year to 30 Jun
2021 2020
Accumulated specific
credit risk adjustments
Accumulated specific
credit risk adjustments
$bn $bn
1 Opening balance at the beginning of the period 16.5 10.0
2 Increases due to amounts set aside for estimated loan losses during the period1 — 6.9
3 Decreases due to amounts reversed for estimated loan losses during the period1 (0.6) —
4 Decreases due to amounts taken against accumulated credit risk adjustments (1.4) (1.2)
6 Impact of exchange rate differences — (0.6)
9 Closing balance at the end of the period 14.5 15.1
10 Recoveries on credit risk adjustments recorded directly to the statement of profit or loss 0.2 0.1
1 Following adoption of IFRS 9 ‘Financial Instruments’, the movement due to amounts set aside for estimated loan losses during the period has been reported on a net basis.
Table 32: Changes in stock of defaulted loans and debt securities (CR2-B)
Half-year to 30 Jun
2021 2020
Gross carrying value
Gross carrying value
$bn $bn
1 Defaulted loans and debt securities at the beginning of the period 20.9 14.6
2 Loans and debt securities that have defaulted since the last reporting period 3.9 6.7
3 Returned to non-defaulted status (0.8) (0.8)
4 Amounts written off (1.4) (1.2)
5 Other changes1 (0.5) (0.9)
7 Repayments (1.9) (0.4)
6 Defaulted loans and debt securities at the end of the period 20.2 18.0
1 Other changes include foreign exchange movements and changes in assets held for sale in default.
HSBC Holdings plc 2Q21 Pillar 3 30
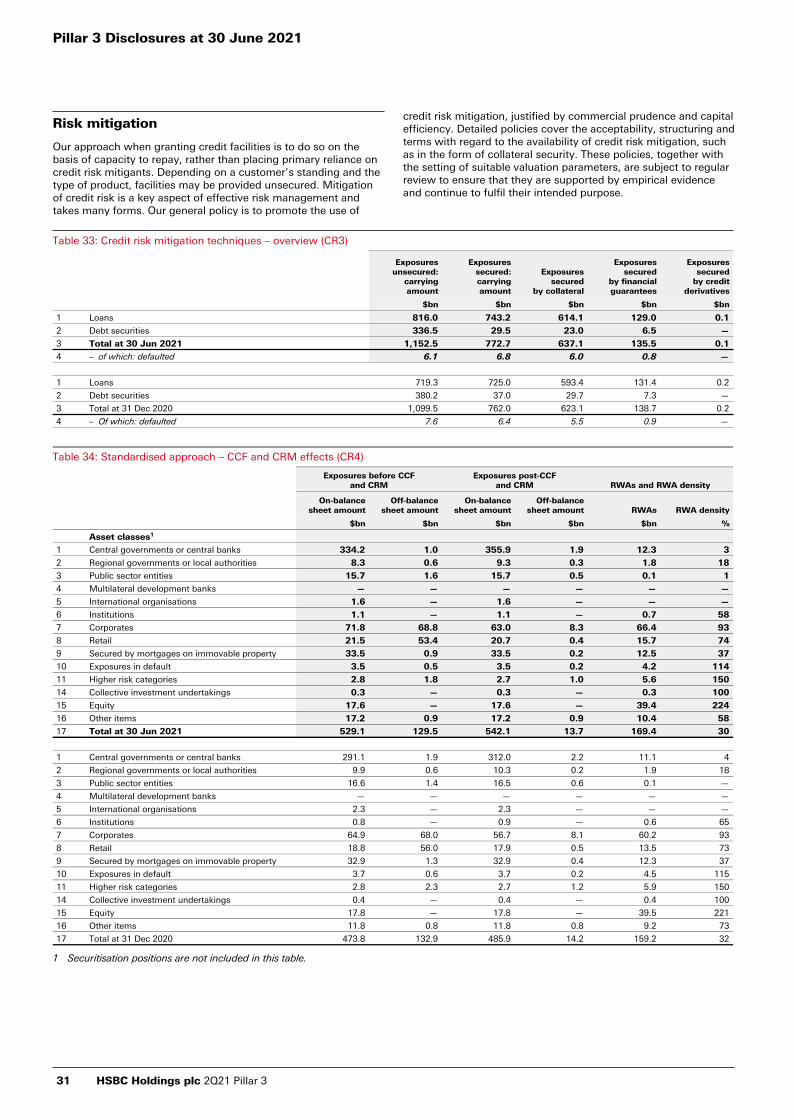
Risk mitigation
Our approach when granting credit facilities is to do so on the basis of capacity to repay, rather than placing primary reliance on credit risk mitigants. Depending on a customer’s standing and the type of product, facilities may be provided unsecured. Mitigation of credit risk is a key aspect of effective risk management and takes many forms. Our general policy is to promote the use of
credit risk mitigation, justified by commercial prudence and capital efficiency. Detailed policies cover the acceptability, structuring and terms with regard to the availability of credit risk mitigation, such as in the form of collateral security. These policies, together with the setting of suitable valuation parameters, are subject to regular review to ensure that they are supported by empirical evidence and continue to fulfil their intended purpose.
Table 33: Credit risk mitigation techniques – overview (CR3)
Exposures unsecured:
carrying amount
Exposures secured: carrying amount
Exposures secured
by collateral
Exposures secured
by financial guarantees
Exposures secured
by credit derivatives
$bn $bn $bn $bn $bn
1 Loans 816.0 743.2 614.1 129.0 0.1
2 Debt securities 336.5 29.5 23.0 6.5 —
3 Total at 30 Jun 2021 1,152.5 772.7 637.1 135.5 0.1
4 – of which: defaulted 6.1 6.8 6.0 0.8 —
1 Loans 719.3 725.0 593.4 131.4 0.2
2 Debt securities 380.2 37.0 29.7 7.3 —
3 Total at 31 Dec 2020 1,099.5 762.0 623.1 138.7 0.2
4 – Of which: defaulted 7.6 6.4 5.5 0.9 —
Table 34: Standardised approach – CCF and CRM effects (CR4)
Exposures before CCFand CRM
Exposures post-CCFand CRM RWAs and RWA density
On-balance sheet amount
Off-balance sheet amount
On-balance sheet amount
Off-balance sheet amount RWAs RWA density
$bn $bn $bn $bn $bn %
Asset classes1
1 Central governments or central banks 334.2 1.0 355.9 1.9 12.3 3
2 Regional governments or local authorities 8.3 0.6 9.3 0.3 1.8 18
3 Public sector entities 15.7 1.6 15.7 0.5 0.1 1
4 Multilateral development banks — — — — — —
5 International organisations 1.6 — 1.6 — — —
6 Institutions 1.1 — 1.1 — 0.7 58
7 Corporates 71.8 68.8 63.0 8.3 66.4 93
8 Retail 21.5 53.4 20.7 0.4 15.7 74
9 Secured by mortgages on immovable property 33.5 0.9 33.5 0.2 12.5 37
10 Exposures in default 3.5 0.5 3.5 0.2 4.2 114
11 Higher risk categories 2.8 1.8 2.7 1.0 5.6 150
14 Collective investment undertakings 0.3 — 0.3 — 0.3 100
15 Equity 17.6 — 17.6 — 39.4 224
16 Other items 17.2 0.9 17.2 0.9 10.4 58
17 Total at 30 Jun 2021 529.1 129.5 542.1 13.7 169.4 30
1 Central governments or central banks 291.1 1.9 312.0 2.2 11.1 4
2 Regional governments or local authorities 9.9 0.6 10.3 0.2 1.9 18
3 Public sector entities 16.6 1.4 16.5 0.6 0.1 —
4 Multilateral development banks — — — — — —
5 International organisations 2.3 — 2.3 — — —
6 Institutions 0.8 — 0.9 — 0.6 65
7 Corporates 64.9 68.0 56.7 8.1 60.2 93
8 Retail 18.8 56.0 17.9 0.5 13.5 73
9 Secured by mortgages on immovable property 32.9 1.3 32.9 0.4 12.3 37
10 Exposures in default 3.7 0.6 3.7 0.2 4.5 115
11 Higher risk categories 2.8 2.3 2.7 1.2 5.9 150
14 Collective investment undertakings 0.4 — 0.4 — 0.4 100
15 Equity 17.8 — 17.8 — 39.5 221
16 Other items 11.8 0.8 11.8 0.8 9.2 73
17 Total at 31 Dec 2020 473.8 132.9 485.9 14.2 159.2 32
1 Securitisation positions are not included in this table.
Pillar 3 Disclosures at 30 June 2021
31 HSBC Holdings plc 2Q21 Pillar 3

Table 35: Standardised approach – exposures by asset classes and risk weights (CR5)
Risk weight (‘RW%’) 0% 2% 20% 35% 50% 70% 75% 100% 150% 250% Deducted
Total credit exposure
amount (post-CCF and CRM)
Of which:
unrated
$bn $bn $bn $bn $bn $bn $bn $bn $bn $bn $bn $bn $bn
Asset classes1
1 Central governments or central banks 352.8 — — — — — — 0.1 — 4.9 — 357.8 4.9
2 Regional governments or local authorities 3.0 — 5.8 — 0.4 — — 0.4 — — — 9.6 0.4
3 Public sector entities 16.0 — 0.2 — — — — — — — — 16.2 —
4 Multilateral development banks — — — — — — — — — — — — —
5 International organisations 1.6 — — — — — — — — — — 1.6 —
6 Institutions — — 0.1 — 0.8 — — 0.2 — — — 1.1 0.2
7 Corporates — — 4.1 0.4 2.0 0.3 — 63.3 1.2 — — 71.3 61.2
8 Retail — — — — — — 21.1 — — — — 21.1 21.1
9 Secured by mortgages on immovable property — — — 31.4 1.6 — — 0.7 — — — 33.7 33.7
10 Exposures in default — — — — — — — 2.6 1.1 — — 3.7 3.7
11 Higher risk categories — — — — — — — — 3.7 — — 3.7 3.7
14 Collective investment undertakings — — — — — — — 0.3 — — — 0.3 0.3
15 Equity — — — — — — — 3.1 — 14.5 — 17.6 17.6
16 Other items 0.1 — 9.4 — — — — 8.6 — — — 18.1 18.1
17 Total at 30 Jun 2021 373.5 — 19.6 31.8 4.8 0.3 21.1 79.3 6.0 19.4 — 555.8 164.9
1 Central governments or central banks 309.7 — — — — — — 0.1 — 4.4 — 314.2 4.4
2 Regional governments or local authorities 3.8 — 5.9 — 0.3 — — 0.5 — — — 10.5 0.5
3 Public sector entities 16.9 — 0.2 — — — — — — — — 17.1 —
4 Multilateral development banks — — — — — — — — — — — — —
5 International organisations 2.3 — — — — — — — — — — 2.3 —
6 Institutions — — 0.1 — 0.5 — — 0.3 — — — 0.9 0.3
7 Corporates — — 4.1 0.2 1.6 0.4 — 57.1 1.4 — — 64.8 55.4
8 Retail — — — — — — 18.4 — — — — 18.4 18.4
9 Secured by mortgages on immovable property — — — 31.0 1.4 — — 0.9 — — — 33.3 33.3
10 Exposures in default — — — — — — — 2.7 1.2 — — 3.9 3.9
11 Higher risk categories — — — — — — — — 3.9 — — 3.9 3.9
14 Collective investment undertakings — — — — — — — 0.4 — — — 0.4 0.4
15 Equity — — — — — — — 3.4 — 14.4 — 17.8 17.8
16 Other items 0.1 — 4.2 — — — — 8.3 — — — 12.6 12.6
17 Total at 31 Dec 2020 332.8 — 14.5 31.2 3.8 0.4 18.4 73.7 6.5 18.8 — 500.1 150.9
1 Securitisation positions are not included in this table.
HSBC Holdings plc 2Q21 Pillar 3 32

Table 36: IRB – Credit risk exposures by portfolio and PD range¹ (CR6)
Original on-
balance sheet gross
exposure
Off-balance
sheet exposures
pre-CCFAverage
CCF
EAD post-CRM and post-CCF
Average PD
Number of obligors
Average LGD
Average maturity RWAs
RWA density
Expected loss
Value adjustments
and provisions4
PD scale $bn $bn % $bn % % years $bn % $bn $bn
AIRB – Central government and central banks
0.00 to <0.15 397.5 2.6 38.6 398.5 0.02 434 43.2 1.70 25.1 6 —
0.15 to <0.25 7.3 — 40.0 7.3 0.22 11 44.8 2.60 3.6 50 —
0.25 to <0.50 1.1 — 43.3 1.2 0.37 10 45.0 1.30 0.6 50 —
0.50 to <0.75 5.1 0.1 65.4 5.2 0.63 73 44.5 1.30 3.4 65 —
0.75 to <2.50 7.2 — 54.2 7.1 1.25 33 42.2 1.20 5.8 82 —
2.50 to <10.00 1.6 0.3 21.0 1.1 4.23 14 38.0 1.70 1.2 107 —
10.00 to <100.00 1.5 — — 1.5 75.00 1 45.0 1.00 2.0 130 0.6
100.00 (Default) 0.2 — — 0.2 100.00 1 45.0 1.30 — — 0.1
Sub-total 421.5 3.0 40.0 422.1 0.38 577 43.2 1.70 41.7 10 0.7 —
AIRB – Institutions
0.00 to <0.15 65.0 13.6 29.0 68.4 0.05 2,977 38.8 1.20 9.1 13 —
0.15 to <0.25 3.2 1.5 33.7 3.7 0.22 342 47.4 1.00 1.6 44 —
0.25 to <0.50 0.5 0.2 22.6 0.5 0.37 104 42.4 0.90 0.3 51 —
0.50 to <0.75 1.2 0.4 67.5 1.4 0.63 133 43.3 1.10 1.0 71 —
0.75 to <2.50 0.8 0.5 28.5 0.8 1.27 137 45.0 1.50 0.7 89 —
2.50 to <10.00 0.1 0.1 38.8 0.1 4.74 41 25.3 1.90 0.1 79 —
10.00 to <100.00 — — 20.1 — 25.78 14 44.8 1.30 — 191 —
100.00 (Default) — — 6.8 — 100.00 6 48.8 2.40 — 51 —
Sub-total 70.8 16.3 30.3 74.9 0.13 3,754 39.3 1.20 12.8 17 — 0.1
AIRB – Corporate – specialised lending (excluding slotting)2
0.00 to <0.15 2.4 0.5 57.0 2.7 0.09 41 18.8 4.00 0.4 15 —
0.15 to <0.25 1.4 0.8 46.6 1.7 0.22 38 25.4 3.70 0.5 28 —
0.25 to <0.50 1.2 1.1 39.1 1.6 0.37 32 19.9 3.80 0.6 34 —
0.50 to <0.75 0.7 0.7 40.8 1.0 0.63 20 31.1 3.60 0.6 63 —
0.75 to <2.50 2.0 1.0 39.0 2.0 1.45 53 23.4 3.50 1.3 57 —
2.50 to <10.00 0.2 — — 0.1 3.71 9 24.8 3.30 0.1 72 —
10.00 to <100.00 0.2 — 100.0 0.1 20.91 5 29.1 3.60 0.2 153 —
100.00 (Default) 0.2 — 97.1 0.2 100.00 11 21.0 4.50 — 9 0.1
Sub-total 8.3 4.1 43.8 9.4 3.38 209 22.8 3.80 3.7 38 0.1 0.1
AIRB – Corporate – Other
0.00 to <0.15 80.8 134.1 32.4 156.6 0.08 6,606 41.3 2.00 32.8 21 0.1
0.15 to <0.25 31.7 52.9 31.1 54.9 0.22 4,970 42.6 1.70 21.2 39 0.1
0.25 to <0.50 28.6 43.7 28.4 47.2 0.37 4,886 41.1 1.70 23.0 49 0.1
0.50 to <0.75 40.8 40.9 28.7 53.2 0.63 6,310 37.8 1.80 30.9 58 0.1
0.75 to <2.50 126.4 99.1 29.1 121.5 1.34 24,819 36.1 1.70 90.0 74 0.6
2.50 to <10.00 33.4 29.5 28.4 30.1 4.28 9,462 37.1 2.00 33.1 110 0.5
10.00 to <100.00 5.4 4.1 33.3 5.4 17.51 1,468 28.8 2.30 7.3 137 0.3
100.00 (Default) 5.3 0.5 27.7 5.5 100.00 1,291 40.9 1.40 4.4 81 2.8
Sub-total 352.4 404.8 30.5 474.4 2.12 59,812 39.3 1.80 242.7 51 4.6 3.9
Wholesale AIRB – Total at 30 Jun 20213 921.0 428.2 30.7 1,048.8 1.23 64,352 40.8 1.70 317.2 31 5.4 4.1
Pillar 3 Disclosures at 30 June 2021
33 HSBC Holdings plc 2Q21 Pillar 3

Table 36: IRB – Credit risk exposures by portfolio and PD range¹ (CR6) (continued)
Original on-
balance sheet gross
exposure
Off-balance
sheet exposures
pre-CCFAverage
CCF
EAD post-CRM and
post-CCF
Average PD
Number of obligors
Average LGD
Average maturity RWAs
RWA density
Expected loss
Value adjustments
and provisions4
PD scale $bn $bn % $bn % % years $bn % $bn $bn
AIRB – Secured by mortgages on immovable property SME
0.00 to <0.15 0.3 — 100.0 0.3 0.06 1,071 11.5 — — 4 —
0.15 to <0.25 — — — — 0.18 79 20.4 — — 8 —
0.25 to <0.50 0.5 — — 0.4 0.38 2,160 16.5 — — 9 —
0.50 to <0.75 0.1 — 116.5 0.1 0.62 387 26.2 — — 21 —
0.75 to <2.50 0.2 — 163.4 0.2 1.56 1,006 25.3 — 0.1 41 —
2.50 to <10.00 0.3 — 90.3 0.4 4.81 1,608 24.8 — 0.2 66 —
10.00 to <100.00 — — 26.7 — 17.80 480 32.1 — 0.1 138 —
100.00 (Default) 0.1 — 333.1 0.1 100.00 857 38.0 — 0.1 143 —
Sub-total 1.5 — 115.2 1.5 6.37 7,648 20.6 — 0.5 36 — —
AIRB – Secured by mortgages on immovable property non-SME
0.00 to <0.15 221.5 10.8 82.9 234.9 0.07 854,792 15.4 — 19.2 8 —
0.15 to <0.25 47.0 2.3 95.5 49.4 0.20 197,571 15.6 — 7.1 14 —
0.25 to <0.50 41.9 3.6 49.2 43.7 0.36 196,873 16.7 — 8.2 19 —
0.50 to <0.75 13.3 0.6 63.9 13.8 0.59 66,196 11.8 — 3.0 22 —
0.75 to <2.50 24.7 1.4 71.9 25.7 1.31 133,542 12.7 — 7.2 28 0.1
2.50 to <10.00 6.7 0.4 77.0 7.0 4.32 35,173 11.0 — 2.4 35 —
10.00 to <100.00 2.8 0.1 98.5 2.9 22.85 19,636 15.7 — 3.5 119 0.1
100.00 (Default) 2.6 — 19.2 2.6 100.00 19,652 23.8 — 2.2 87 0.6
Sub-total 360.5 19.2 76.6 380.0 1.15 1,523,435 15.2 — 52.8 14 0.8 0.4
AIRB – Qualifying revolving retail exposures
0.00 to <0.15 5.7 79.2 50.2 45.4 0.06 10,629,244 88.9 — 1.9 4 —
0.15 to <0.25 1.2 15.7 49.9 9.0 0.20 3,555,179 93.1 — 1.2 13 —
0.25 to <0.50 2.2 14.4 43.8 8.4 0.35 2,381,561 91.0 — 1.6 19 —
0.50 to <0.75 2.3 5.0 51.5 4.8 0.59 919,387 88.2 — 1.3 27 —
0.75 to <2.50 4.4 7.9 47.8 8.1 1.41 1,909,857 87.3 — 4.1 50 0.1
2.50 to <10.00 2.4 1.6 67.7 3.5 4.85 900,878 84.3 — 4.0 113 0.3
10.00 to <100.00 0.7 0.3 63.6 0.9 30.52 304,211 84.1 — 1.8 211 0.2
100.00 (Default) 0.3 — 53.8 0.3 100.00 125,218 85.3 — 0.7 213 0.2
Sub-total 19.2 124.1 49.6 80.4 1.20 20,725,535 89.1 — 16.6 21 0.8 1.2
AIRB – Other SME
0.00 to <0.15 0.1 0.1 71.4 0.1 0.10 55,590 51.4 — — 11 —
0.15 to <0.25 — 0.1 50.9 0.1 0.21 35,936 94.8 — — 32 —
0.25 to <0.50 0.1 0.3 63.7 0.3 0.38 99,232 79.2 — 0.1 39 —
0.50 to <0.75 0.2 0.3 82.9 0.4 0.61 77,745 64.9 — 0.2 42 —
0.75 to <2.50 5.2 1.5 51.9 1.9 1.56 276,370 67.5 — 1.3 70 —
2.50 to <10.00 4.0 0.8 52.3 1.6 5.01 141,350 47.4 — 1.1 65 —
10.00 to <100.00 2.2 0.1 47.8 0.3 19.10 80,519 56.6 — 0.4 132 0.1
100.00 (Default) 0.4 — 21.8 0.3 100.00 26,774 43.8 — 0.4 159 0.2
Sub-total 12.2 3.2 55.7 5.0 9.05 793,516 59.3 — 3.5 71 0.3 0.5
AIRB – Other non-SME
0.00 to <0.15 11.5 16.3 10.6 13.7 0.06 718,643 8.4 — 0.3 2 —
0.15 to <0.25 5.5 2.8 32.9 6.8 0.22 518,076 30.1 — 1.0 15 —
0.25 to <0.50 9.3 4.1 24.5 10.5 0.37 459,614 13.6 — 1.0 10 —
0.50 to <0.75 5.4 2.0 18.3 5.8 0.61 259,736 34.1 — 1.7 29 —
0.75 to <2.50 11.0 2.8 5.2 11.3 1.30 470,308 29.0 — 4.3 37 —
2.50 to <10.00 2.3 0.7 36.4 2.6 4.33 227,162 52.0 — 2.2 86 0.1
10.00 to <100.00 0.4 — 18.2 0.5 34.89 87,472 62.6 — 0.6 134 0.1
100.00 (Default) 0.3 — 38.8 0.3 100.00 45,807 69.0 — 0.6 164 0.3
Sub-total 45.7 28.7 15.4 51.5 1.68 2,786,818 22.9 — 11.7 23 0.5 0.7
Retail AIRB – Total at 30 Jun 2021 439.1 175.2 47.1 518.4 1.31 25,836,952 27.9 — 85.1 16 2.4 2.8
HSBC Holdings plc 2Q21 Pillar 3 34
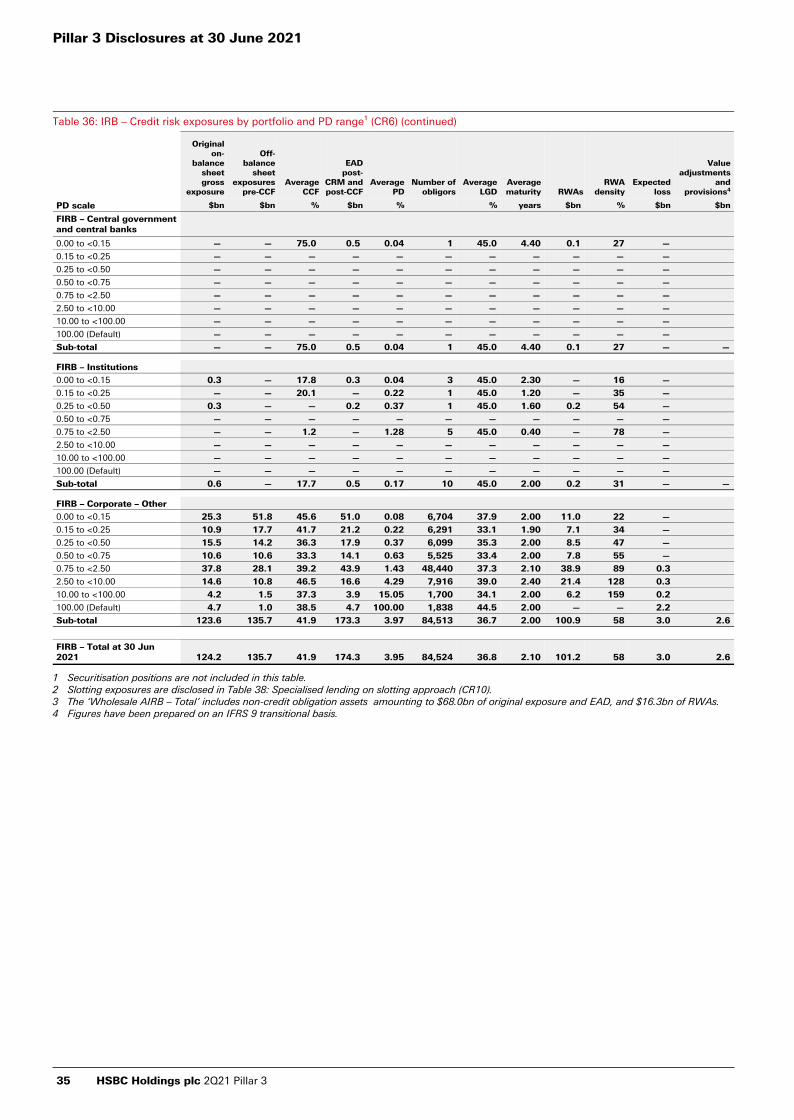
Table 36: IRB – Credit risk exposures by portfolio and PD range¹ (CR6) (continued)
Original on-
balance sheet gross
exposure
Off-balance
sheet exposures
pre-CCFAverage
CCF
EAD post-
CRM and post-CCF
Average PD
Number of obligors
Average LGD
Average maturity RWAs
RWA density
Expected loss
Value adjustments
and provisions4
PD scale $bn $bn % $bn % % years $bn % $bn $bn
FIRB – Central government and central banks
0.00 to <0.15 — — 75.0 0.5 0.04 1 45.0 4.40 0.1 27 —
0.15 to <0.25 — — — — — — — — — — —
0.25 to <0.50 — — — — — — — — — — —
0.50 to <0.75 — — — — — — — — — — —
0.75 to <2.50 — — — — — — — — — — —
2.50 to <10.00 — — — — — — — — — — —
10.00 to <100.00 — — — — — — — — — — —
100.00 (Default) — — — — — — — — — — —
Sub-total — — 75.0 0.5 0.04 1 45.0 4.40 0.1 27 — —
FIRB – Institutions
0.00 to <0.15 0.3 — 17.8 0.3 0.04 3 45.0 2.30 — 16 —
0.15 to <0.25 — — 20.1 — 0.22 1 45.0 1.20 — 35 —
0.25 to <0.50 0.3 — — 0.2 0.37 1 45.0 1.60 0.2 54 —
0.50 to <0.75 — — — — — — — — — — —
0.75 to <2.50 — — 1.2 — 1.28 5 45.0 0.40 — 78 —
2.50 to <10.00 — — — — — — — — — — —
10.00 to <100.00 — — — — — — — — — — —
100.00 (Default) — — — — — — — — — — —
Sub-total 0.6 — 17.7 0.5 0.17 10 45.0 2.00 0.2 31 — —
FIRB – Corporate – Other
0.00 to <0.15 25.3 51.8 45.6 51.0 0.08 6,704 37.9 2.00 11.0 22 —
0.15 to <0.25 10.9 17.7 41.7 21.2 0.22 6,291 33.1 1.90 7.1 34 —
0.25 to <0.50 15.5 14.2 36.3 17.9 0.37 6,099 35.3 2.00 8.5 47 —
0.50 to <0.75 10.6 10.6 33.3 14.1 0.63 5,525 33.4 2.00 7.8 55 —
0.75 to <2.50 37.8 28.1 39.2 43.9 1.43 48,440 37.3 2.10 38.9 89 0.3
2.50 to <10.00 14.6 10.8 46.5 16.6 4.29 7,916 39.0 2.40 21.4 128 0.3
10.00 to <100.00 4.2 1.5 37.3 3.9 15.05 1,700 34.1 2.00 6.2 159 0.2
100.00 (Default) 4.7 1.0 38.5 4.7 100.00 1,838 44.5 2.00 — — 2.2
Sub-total 123.6 135.7 41.9 173.3 3.97 84,513 36.7 2.00 100.9 58 3.0 2.6
FIRB – Total at 30 Jun 2021 124.2 135.7 41.9 174.3 3.95 84,524 36.8 2.10 101.2 58 3.0 2.6
1 Securitisation positions are not included in this table.2 Slotting exposures are disclosed in Table 38: Specialised lending on slotting approach (CR10).3 The ‘Wholesale AIRB – Total’ includes non-credit obligation assets amounting to $68.0bn of original exposure and EAD, and $16.3bn of RWAs.4 Figures have been prepared on an IFRS 9 transitional basis.
Pillar 3 Disclosures at 30 June 2021
35 HSBC Holdings plc 2Q21 Pillar 3
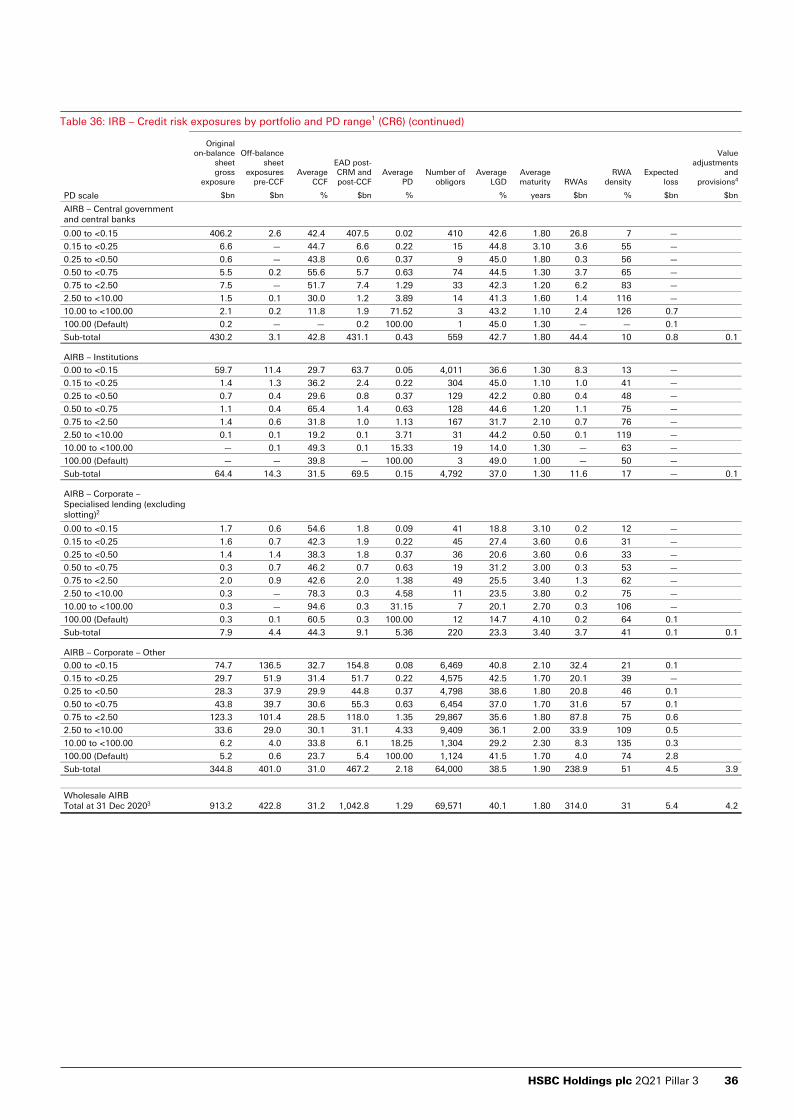
Table 36: IRB – Credit risk exposures by portfolio and PD range¹ (CR6) (continued)
Original on-balance
sheet gross
exposure
Off-balance sheet
exposures pre-CCF
Average CCF
EAD post-CRM and post-CCF
Average PD
Number of obligors
Average LGD
Average maturity RWAs
RWA density
Expected loss
Value adjustments
and provisions4
PD scale $bn $bn % $bn % % years $bn % $bn $bn
AIRB – Central government and central banks
0.00 to <0.15 406.2 2.6 42.4 407.5 0.02 410 42.6 1.80 26.8 7 —
0.15 to <0.25 6.6 — 44.7 6.6 0.22 15 44.8 3.10 3.6 55 —
0.25 to <0.50 0.6 — 43.8 0.6 0.37 9 45.0 1.80 0.3 56 —
0.50 to <0.75 5.5 0.2 55.6 5.7 0.63 74 44.5 1.30 3.7 65 —
0.75 to <2.50 7.5 — 51.7 7.4 1.29 33 42.3 1.20 6.2 83 —
2.50 to <10.00 1.5 0.1 30.0 1.2 3.89 14 41.3 1.60 1.4 116 —
10.00 to <100.00 2.1 0.2 11.8 1.9 71.52 3 43.2 1.10 2.4 126 0.7
100.00 (Default) 0.2 — — 0.2 100.00 1 45.0 1.30 — — 0.1
Sub-total 430.2 3.1 42.8 431.1 0.43 559 42.7 1.80 44.4 10 0.8 0.1
AIRB – Institutions
0.00 to <0.15 59.7 11.4 29.7 63.7 0.05 4,011 36.6 1.30 8.3 13 —
0.15 to <0.25 1.4 1.3 36.2 2.4 0.22 304 45.0 1.10 1.0 41 —
0.25 to <0.50 0.7 0.4 29.6 0.8 0.37 129 42.2 0.80 0.4 48 —
0.50 to <0.75 1.1 0.4 65.4 1.4 0.63 128 44.6 1.20 1.1 75 —
0.75 to <2.50 1.4 0.6 31.8 1.0 1.13 167 31.7 2.10 0.7 76 —
2.50 to <10.00 0.1 0.1 19.2 0.1 3.71 31 44.2 0.50 0.1 119 —
10.00 to <100.00 — 0.1 49.3 0.1 15.33 19 14.0 1.30 — 63 —
100.00 (Default) — — 39.8 — 100.00 3 49.0 1.00 — 50 —
Sub-total 64.4 14.3 31.5 69.5 0.15 4,792 37.0 1.30 11.6 17 — 0.1
AIRB – Corporate – Specialised lending (excluding slotting)2
0.00 to <0.15 1.7 0.6 54.6 1.8 0.09 41 18.8 3.10 0.2 12 —
0.15 to <0.25 1.6 0.7 42.3 1.9 0.22 45 27.4 3.60 0.6 31 —
0.25 to <0.50 1.4 1.4 38.3 1.8 0.37 36 20.6 3.60 0.6 33 —
0.50 to <0.75 0.3 0.7 46.2 0.7 0.63 19 31.2 3.00 0.3 53 —
0.75 to <2.50 2.0 0.9 42.6 2.0 1.38 49 25.5 3.40 1.3 62 —
2.50 to <10.00 0.3 — 78.3 0.3 4.58 11 23.5 3.80 0.2 75 —
10.00 to <100.00 0.3 — 94.6 0.3 31.15 7 20.1 2.70 0.3 106 —
100.00 (Default) 0.3 0.1 60.5 0.3 100.00 12 14.7 4.10 0.2 64 0.1
Sub-total 7.9 4.4 44.3 9.1 5.36 220 23.3 3.40 3.7 41 0.1 0.1
AIRB – Corporate – Other
0.00 to <0.15 74.7 136.5 32.7 154.8 0.08 6,469 40.8 2.10 32.4 21 0.1
0.15 to <0.25 29.7 51.9 31.4 51.7 0.22 4,575 42.5 1.70 20.1 39 —
0.25 to <0.50 28.3 37.9 29.9 44.8 0.37 4,798 38.6 1.80 20.8 46 0.1
0.50 to <0.75 43.8 39.7 30.6 55.3 0.63 6,454 37.0 1.70 31.6 57 0.1
0.75 to <2.50 123.3 101.4 28.5 118.0 1.35 29,867 35.6 1.80 87.8 75 0.6
2.50 to <10.00 33.6 29.0 30.1 31.1 4.33 9,409 36.1 2.00 33.9 109 0.5
10.00 to <100.00 6.2 4.0 33.8 6.1 18.25 1,304 29.2 2.30 8.3 135 0.3
100.00 (Default) 5.2 0.6 23.7 5.4 100.00 1,124 41.5 1.70 4.0 74 2.8
Sub-total 344.8 401.0 31.0 467.2 2.18 64,000 38.5 1.90 238.9 51 4.5 3.9
Wholesale AIRB Total at 31 Dec 20203 913.2 422.8 31.2 1,042.8 1.29 69,571 40.1 1.80 314.0 31 5.4 4.2
HSBC Holdings plc 2Q21 Pillar 3 36
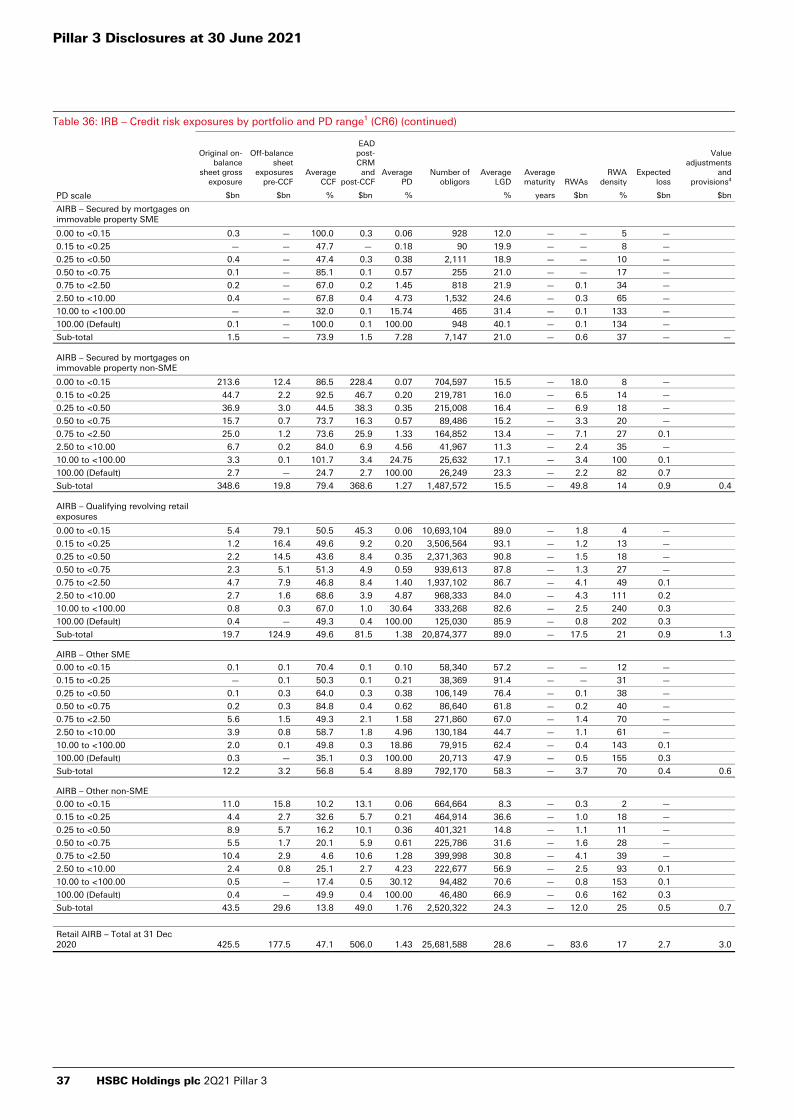
Table 36: IRB – Credit risk exposures by portfolio and PD range¹ (CR6) (continued)
Original on-balance
sheet gross exposure
Off-balance sheet
exposures pre-CCF
Average CCF
EAD post-CRM
and post-CCF
Average PD
Number of obligors
Average LGD
Average maturity RWAs
RWA density
Expected loss
Value adjustments
and provisions4
PD scale $bn $bn % $bn % % years $bn % $bn $bn
AIRB – Secured by mortgages on immovable property SME
0.00 to <0.15 0.3 — 100.0 0.3 0.06 928 12.0 — — 5 —
0.15 to <0.25 — — 47.7 — 0.18 90 19.9 — — 8 —
0.25 to <0.50 0.4 — 47.4 0.3 0.38 2,111 18.9 — — 10 —
0.50 to <0.75 0.1 — 85.1 0.1 0.57 255 21.0 — — 17 —
0.75 to <2.50 0.2 — 67.0 0.2 1.45 818 21.9 — 0.1 34 —
2.50 to <10.00 0.4 — 67.8 0.4 4.73 1,532 24.6 — 0.3 65 —
10.00 to <100.00 — — 32.0 0.1 15.74 465 31.4 — 0.1 133 —
100.00 (Default) 0.1 — 100.0 0.1 100.00 948 40.1 — 0.1 134 —
Sub-total 1.5 — 73.9 1.5 7.28 7,147 21.0 — 0.6 37 — —
AIRB – Secured by mortgages on immovable property non-SME
0.00 to <0.15 213.6 12.4 86.5 228.4 0.07 704,597 15.5 — 18.0 8 —
0.15 to <0.25 44.7 2.2 92.5 46.7 0.20 219,781 16.0 — 6.5 14 —
0.25 to <0.50 36.9 3.0 44.5 38.3 0.35 215,008 16.4 — 6.9 18 —
0.50 to <0.75 15.7 0.7 73.7 16.3 0.57 89,486 15.2 — 3.3 20 —
0.75 to <2.50 25.0 1.2 73.6 25.9 1.33 164,852 13.4 — 7.1 27 0.1
2.50 to <10.00 6.7 0.2 84.0 6.9 4.56 41,967 11.3 — 2.4 35 —
10.00 to <100.00 3.3 0.1 101.7 3.4 24.75 25,632 17.1 — 3.4 100 0.1
100.00 (Default) 2.7 — 24.7 2.7 100.00 26,249 23.3 — 2.2 82 0.7
Sub-total 348.6 19.8 79.4 368.6 1.27 1,487,572 15.5 — 49.8 14 0.9 0.4
AIRB – Qualifying revolving retail exposures
0.00 to <0.15 5.4 79.1 50.5 45.3 0.06 10,693,104 89.0 — 1.8 4 —
0.15 to <0.25 1.2 16.4 49.6 9.2 0.20 3,506,564 93.1 — 1.2 13 —
0.25 to <0.50 2.2 14.5 43.6 8.4 0.35 2,371,363 90.8 — 1.5 18 —
0.50 to <0.75 2.3 5.1 51.3 4.9 0.59 939,613 87.8 — 1.3 27 —
0.75 to <2.50 4.7 7.9 46.8 8.4 1.40 1,937,102 86.7 — 4.1 49 0.1
2.50 to <10.00 2.7 1.6 68.6 3.9 4.87 968,333 84.0 — 4.3 111 0.2
10.00 to <100.00 0.8 0.3 67.0 1.0 30.64 333,268 82.6 — 2.5 240 0.3
100.00 (Default) 0.4 — 49.3 0.4 100.00 125,030 85.9 — 0.8 202 0.3
Sub-total 19.7 124.9 49.6 81.5 1.38 20,874,377 89.0 — 17.5 21 0.9 1.3
AIRB – Other SME
0.00 to <0.15 0.1 0.1 70.4 0.1 0.10 58,340 57.2 — — 12 —
0.15 to <0.25 — 0.1 50.3 0.1 0.21 38,369 91.4 — — 31 —
0.25 to <0.50 0.1 0.3 64.0 0.3 0.38 106,149 76.4 — 0.1 38 —
0.50 to <0.75 0.2 0.3 84.8 0.4 0.62 86,640 61.8 — 0.2 40 —
0.75 to <2.50 5.6 1.5 49.3 2.1 1.58 271,860 67.0 — 1.4 70 —
2.50 to <10.00 3.9 0.8 58.7 1.8 4.96 130,184 44.7 — 1.1 61 —
10.00 to <100.00 2.0 0.1 49.8 0.3 18.86 79,915 62.4 — 0.4 143 0.1
100.00 (Default) 0.3 — 35.1 0.3 100.00 20,713 47.9 — 0.5 155 0.3
Sub-total 12.2 3.2 56.8 5.4 8.89 792,170 58.3 — 3.7 70 0.4 0.6
AIRB – Other non-SME
0.00 to <0.15 11.0 15.8 10.2 13.1 0.06 664,664 8.3 — 0.3 2 —
0.15 to <0.25 4.4 2.7 32.6 5.7 0.21 464,914 36.6 — 1.0 18 —
0.25 to <0.50 8.9 5.7 16.2 10.1 0.36 401,321 14.8 — 1.1 11 —
0.50 to <0.75 5.5 1.7 20.1 5.9 0.61 225,786 31.6 — 1.6 28 —
0.75 to <2.50 10.4 2.9 4.6 10.6 1.28 399,998 30.8 — 4.1 39 —
2.50 to <10.00 2.4 0.8 25.1 2.7 4.23 222,677 56.9 — 2.5 93 0.1
10.00 to <100.00 0.5 — 17.4 0.5 30.12 94,482 70.6 — 0.8 153 0.1
100.00 (Default) 0.4 — 49.9 0.4 100.00 46,480 66.9 — 0.6 162 0.3
Sub-total 43.5 29.6 13.8 49.0 1.76 2,520,322 24.3 — 12.0 25 0.5 0.7
Retail AIRB – Total at 31 Dec 2020 425.5 177.5 47.1 506.0 1.43 25,681,588 28.6 — 83.6 17 2.7 3.0
Pillar 3 Disclosures at 30 June 2021
37 HSBC Holdings plc 2Q21 Pillar 3

Table 36: IRB – Credit risk exposures by portfolio and PD range¹ (CR6) (continued)
Original on-balance
sheet gross exposure
Off-balance sheet
exposures pre-CCF
Average CCF
EAD post-CRM
and post-CCF
Average PD
Number of obligors
Average LGD
Average maturity RWAs
RWA density
Expected loss
Value adjustments
and provisions4
PD scale $bn $bn % $bn % % years $bn % $bn $bn
FIRB – Central government and central banks
0.00 to <0.15 — — 75.0 0.5 0.04 1 45.0 4.60 0.1 29 —
0.15 to <0.25 — — — — — — — — — — —
0.25 to <0.50 — — — — — — — — — — —
0.50 to <0.75 — — — — — — — — — — —
0.75 to <2.50 — — — — — — — — — — —
2.50 to <10.00 — — — — — — — — — — —
10.00 to <100.00 — — — — — — — — — — —
100.00 (Default) — — — — — — — — — — —
Sub-total — — 75.0 0.5 0.04 1 45.0 4.60 0.1 29 — —
FIRB – Institutions
0.00 to <0.15 0.4 — 23.7 0.3 0.03 4 44.9 2.70 0.1 17 —
0.15 to <0.25 0.3 — 29.7 0.3 0.22 1 45.0 2.40 0.1 48 —
0.25 to <0.50 — — 16.8 — 0.37 2 45.0 1.60 — 54 —
0.50 to <0.75 — — — — 0.63 — 45.0 3.60 — 96 —
0.75 to <2.50 — 0.2 — — — 1 — — — — —
2.50 to <10.00 — — — — — — — — — — —
10.00 to <100.00 — — — — — — — — — — —
100.00 (Default) — — — — — — — — — — —
Sub-total 0.7 0.2 25.5 0.6 0.11 8 44.9 2.60 0.2 30 — —
FIRB – Corporate – Other
0.00 to <0.15 24.5 50.6 53.5 52.8 0.09 6,442 39.7 2.10 12.1 23 —
0.15 to <0.25 14.2 19.1 46.0 23.9 0.22 6,367 33.5 2.00 8.2 34 —
0.25 to <0.50 15.7 15.2 42.3 20.4 0.37 6,153 35.5 2.00 9.7 48 —
0.50 to <0.75 12.6 10.3 36.9 16.6 0.63 5,504 30.8 2.00 8.6 52 —
0.75 to <2.50 38.0 33.9 30.8 44.4 1.41 45,024 37.1 2.10 37.9 85 0.3
2.50 to <10.00 15.1 8.5 42.4 16.5 4.48 7,769 39.7 2.30 21.5 130 0.3
10.00 to <100.00 3.4 1.2 28.9 3.4 15.44 1,577 34.7 1.80 5.2 154 0.2
100.00 (Default) 5.0 1.2 42.3 5.2 100.00 1,971 45.0 1.80 — — 2.5
Sub-total 128.5 140.0 43.7 183.2 4.04 80,807 37.1 2.10 103.2 56 3.3 3.2
FIRB – Total at 31 Dec 2020 129.2 140.2 43.7 184.3 4.02 80,816 37.1 2.10 103.5 56 3.3 3.2
1 Securitisation positions are not included in this table.2 Slotting exposures are disclosed in Table 38: Specialised lending on slotting approach (CR10).3 The ‘Wholesale AIRB – Total’ includes non-credit obligation assets amounting to $65.9bn of original exposure and EAD, and $15.4bn of RWAs.4 Figures have been prepared on an IFRS 9 transitional basis.
HSBC Holdings plc 2Q21 Pillar 3 38
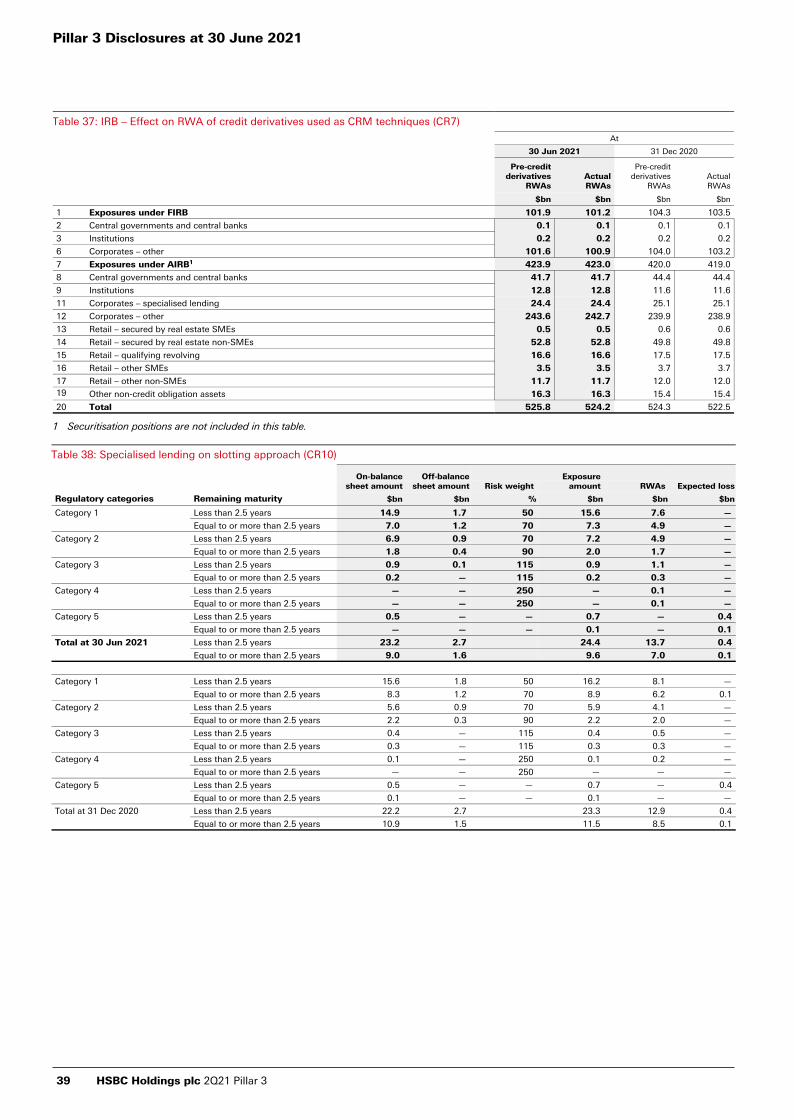
Table 37: IRB – Effect on RWA of credit derivatives used as CRM techniques (CR7)
At
30 Jun 2021 31 Dec 2020
Pre-credit derivatives
RWAsActualRWAs
Pre-credit derivatives
RWAsActualRWAs
$bn $bn $bn $bn
1 Exposures under FIRB 101.9 101.2 104.3 103.5
2 Central governments and central banks 0.1 0.1 0.1 0.1
3 Institutions 0.2 0.2 0.2 0.2
6 Corporates – other 101.6 100.9 104.0 103.2
7 Exposures under AIRB1 423.9 423.0 420.0 419.0
8 Central governments and central banks 41.7 41.7 44.4 44.4
9 Institutions 12.8 12.8 11.6 11.6
11 Corporates – specialised lending 24.4 24.4 25.1 25.1
12 Corporates – other 243.6 242.7 239.9 238.9
13 Retail – secured by real estate SMEs 0.5 0.5 0.6 0.6
14 Retail – secured by real estate non-SMEs 52.8 52.8 49.8 49.8
15 Retail – qualifying revolving 16.6 16.6 17.5 17.5
16 Retail – other SMEs 3.5 3.5 3.7 3.7
17 Retail – other non-SMEs 11.7 11.7 12.0 12.0 19 Other non-credit obligation assets 16.3 16.3 15.4 15.4
20 Total 525.8 524.2 524.3 522.5
1 Securitisation positions are not included in this table.
Table 38: Specialised lending on slotting approach (CR10)
On-balance sheet amount
Off-balance sheet amount Risk weight
Exposure amount RWAs Expected loss
Regulatory categories Remaining maturity $bn $bn % $bn $bn $bn
Category 1 Less than 2.5 years 14.9 1.7 50 15.6 7.6 —
Equal to or more than 2.5 years 7.0 1.2 70 7.3 4.9 —
Category 2 Less than 2.5 years 6.9 0.9 70 7.2 4.9 —
Equal to or more than 2.5 years 1.8 0.4 90 2.0 1.7 —
Category 3 Less than 2.5 years 0.9 0.1 115 0.9 1.1 —
Equal to or more than 2.5 years 0.2 — 115 0.2 0.3 —
Category 4 Less than 2.5 years — — 250 — 0.1 —
Equal to or more than 2.5 years — — 250 — 0.1 —
Category 5 Less than 2.5 years 0.5 — — 0.7 — 0.4
Equal to or more than 2.5 years — — — 0.1 — 0.1
Total at 30 Jun 2021 Less than 2.5 years 23.2 2.7 24.4 13.7 0.4
Equal to or more than 2.5 years 9.0 1.6 9.6 7.0 0.1
Category 1 Less than 2.5 years 15.6 1.8 50 16.2 8.1 —
Equal to or more than 2.5 years 8.3 1.2 70 8.9 6.2 0.1
Category 2 Less than 2.5 years 5.6 0.9 70 5.9 4.1 —
Equal to or more than 2.5 years 2.2 0.3 90 2.2 2.0 —
Category 3 Less than 2.5 years 0.4 — 115 0.4 0.5 —
Equal to or more than 2.5 years 0.3 — 115 0.3 0.3 —
Category 4 Less than 2.5 years 0.1 — 250 0.1 0.2 —
Equal to or more than 2.5 years — — 250 — — —
Category 5 Less than 2.5 years 0.5 — — 0.7 — 0.4
Equal to or more than 2.5 years 0.1 — — 0.1 — —
Total at 31 Dec 2020 Less than 2.5 years 22.2 2.7 23.3 12.9 0.4
Equal to or more than 2.5 years 10.9 1.5 11.5 8.5 0.1
Pillar 3 Disclosures at 30 June 2021
39 HSBC Holdings plc 2Q21 Pillar 3

Counterparty credit riskCounterparty credit risk (‘CCR’) risk arises for derivatives and SFTs. It is calculated in both the trading and non-trading books, and represents the risk that a counterparty may default before settlement of the transaction. CCR is generated primarily in our wholesale global businesses.
Four approaches may be used under CRR II to calculate exposure values for CCR: mark-to-market, original exposure, standardised and IMM. Exposure values calculated under these approaches are used to determine RWAs. Across the Group, we use the mark-to-market and IMM approaches.
For further information, a summary of our current policies and practices for the management of counterparty credit risk is set out in ‘Counterparty credit risk’ on page 55 of the Pillar 3 Disclosures at 31 December 2020.
Table 39: Analysis of counterparty credit risk exposure by approach (excluding centrally cleared exposures)¹ (CCR1)
Replacement cost
Potential future
exposure
Effective expected
positive exposure Multiplier
EADpost-CRM RWAs
$bn $bn $bn $bn $bn $bn
1 Mark-to-market 7.0 21.8 — — 28.8 11.7
4 Internal model method — — 30.6 1.4 42.8 14.2
6 – of which: derivatives and long settlement transactions2 — — 30.6 1.4 42.8 14.2
9 Financial collateral comprehensive method (for SFTs) — — — — 62.9 9.6
11 Total at 30 Jun 2021 7.0 21.8 30.6 1.4 134.5 35.5
1 Mark-to-market 11.5 20.3 — — 31.8 13.0
4 Internal model method — — 35.3 1.4 49.4 17.4
6 – of which: derivatives and long settlement transactions2 — — 35.3 1.4 49.4 17.4
9 Financial collateral comprehensive method (for SFTs) — — — — 52.5 8.3
11 Total at 31 Dec 2020 11.5 20.3 35.3 1.4 133.7 38.7
1 As the Group does not use the original exposure method, notional values are not reported.2 Prior to the implementation of SA-CCR, exposures reported here will be those under the mark-to-market method.
Credit valuation adjustment
Credit valuation adjustments (‘CVA’) represent the risk of loss as a result of adverse changes to the credit quality of counterparties in derivative transactions. Where we have both specific risk VaR approval and IMM approval for a product, the CVA VaR approach has been used to calculate the CVA capital charge.
Where we do not hold both approvals, the standardised approach has been applied. Exposures to certain types of counterparty are exempt from CVA, such as non-financial counterparties and sovereigns.
Table 40: Credit valuation adjustment capital charge (CCR2)
At
30 Jun 2021 31 Dec 2020
EADpost-CRM RWAs
EADpost-CRM RWAs
$bn $bn $bn $bn
1 Total portfolios subject to the advanced CVA capital charge 21.3 2.1 21.3 2.4
2 – VaR component (including the 3 × multiplier) 0.5 0.4
3 – stressed VaR component (including the 3 × multiplier) 1.6 2.0
4 All portfolios subject to the standardised CVA capital charge 12.7 0.6 13.4 0.7
5 Total subject to the CVA capital charge 34.0 2.7 34.7 3.1
The following table presents information on the risk weighting of CCR exposures under the standardised approach by regulatory portfolio.
Table 41: Standardised approach – CCR exposures by regulatory portfolio and risk weights (CCR3)
Risk weight0% 10% 20% 50% 75% 100% 150% Others
Total credit exposure
of which:unrated
$bn $bn $bn $bn $bn $bn $bn $bn $bn $bn
1 Central governments and central banks 4.8 0.2 — — — 5.0 —
2 Regional government or local authorities 2.0 — — 2.0
6 Institutions — 0.1 0.1 0.1
7 Corporates — — 1.3 1.3 1.1
Total at 30 Jun 2021 6.8 0.2 0.1 1.3 8.4 1.2
1 Central governments and central banks 7.9 — 0.1 — — — — — 8.0 —
2 Regional government or local authorities 2.7 — — — — — — — 2.7 —
6 Institutions — — — 0.1 — 0.1 — — 0.2 0.1
7 Corporates — — — — — 1.8 — — 1.8 1.6
Total at 31 Dec 2020 10.6 — 0.1 0.1 — 1.9 — — 12.7 1.7
HSBC Holdings plc 2Q21 Pillar 3 40
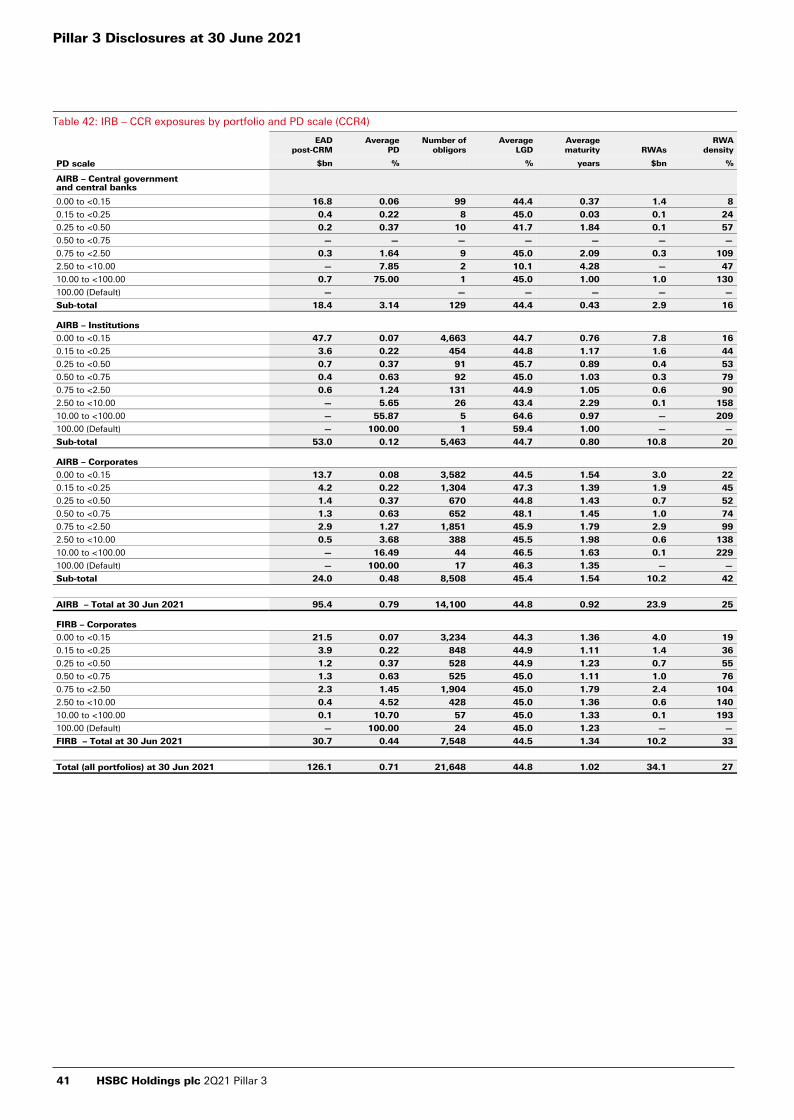
Table 42: IRB – CCR exposures by portfolio and PD scale (CCR4)
EAD post-CRM
AveragePD
Number of obligors
AverageLGD
Average maturity RWAs
RWAdensity
PD scale $bn % % years $bn %
AIRB – Central governmentand central banks
0.00 to <0.15 16.8 0.06 99 44.4 0.37 1.4 8
0.15 to <0.25 0.4 0.22 8 45.0 0.03 0.1 24
0.25 to <0.50 0.2 0.37 10 41.7 1.84 0.1 57
0.50 to <0.75 — — — — — — —
0.75 to <2.50 0.3 1.64 9 45.0 2.09 0.3 109
2.50 to <10.00 — 7.85 2 10.1 4.28 — 47
10.00 to <100.00 0.7 75.00 1 45.0 1.00 1.0 130
100.00 (Default) — — — — — —
Sub-total 18.4 3.14 129 44.4 0.43 2.9 16
AIRB – Institutions
0.00 to <0.15 47.7 0.07 4,663 44.7 0.76 7.8 16
0.15 to <0.25 3.6 0.22 454 44.8 1.17 1.6 44
0.25 to <0.50 0.7 0.37 91 45.7 0.89 0.4 53
0.50 to <0.75 0.4 0.63 92 45.0 1.03 0.3 79
0.75 to <2.50 0.6 1.24 131 44.9 1.05 0.6 90
2.50 to <10.00 — 5.65 26 43.4 2.29 0.1 158
10.00 to <100.00 — 55.87 5 64.6 0.97 — 209
100.00 (Default) — 100.00 1 59.4 1.00 — —
Sub-total 53.0 0.12 5,463 44.7 0.80 10.8 20
AIRB – Corporates
0.00 to <0.15 13.7 0.08 3,582 44.5 1.54 3.0 22
0.15 to <0.25 4.2 0.22 1,304 47.3 1.39 1.9 45
0.25 to <0.50 1.4 0.37 670 44.8 1.43 0.7 52
0.50 to <0.75 1.3 0.63 652 48.1 1.45 1.0 74
0.75 to <2.50 2.9 1.27 1,851 45.9 1.79 2.9 99
2.50 to <10.00 0.5 3.68 388 45.5 1.98 0.6 138
10.00 to <100.00 — 16.49 44 46.5 1.63 0.1 229
100.00 (Default) — 100.00 17 46.3 1.35 — —
Sub-total 24.0 0.48 8,508 45.4 1.54 10.2 42
AIRB – Total at 30 Jun 2021 95.4 0.79 14,100 44.8 0.92 23.9 25
FIRB – Corporates
0.00 to <0.15 21.5 0.07 3,234 44.3 1.36 4.0 19
0.15 to <0.25 3.9 0.22 848 44.9 1.11 1.4 36
0.25 to <0.50 1.2 0.37 528 44.9 1.23 0.7 55
0.50 to <0.75 1.3 0.63 525 45.0 1.11 1.0 76
0.75 to <2.50 2.3 1.45 1,904 45.0 1.79 2.4 104
2.50 to <10.00 0.4 4.52 428 45.0 1.36 0.6 140
10.00 to <100.00 0.1 10.70 57 45.0 1.33 0.1 193
100.00 (Default) — 100.00 24 45.0 1.23 — —
FIRB – Total at 30 Jun 2021 30.7 0.44 7,548 44.5 1.34 10.2 33
Total (all portfolios) at 30 Jun 2021 126.1 0.71 21,648 44.8 1.02 34.1 27
Pillar 3 Disclosures at 30 June 2021
41 HSBC Holdings plc 2Q21 Pillar 3

Table 42: IRB – CCR exposures by portfolio and PD scale (CCR4) (continued)
EADpost-CRM
AveragePD
Number of obligors
AverageLGD
Average maturity RWAs
RWAdensity
PD scale $bn % % years $bn %
AIRB – Central government and central banks
0.00 to <0.15 11.5 0.03 89 44.5 0.57 0.6 5
0.15 to <0.25 0.7 0.22 8 45.0 0.05 0.2 24
0.25 to <0.50 0.2 0.37 11 45.0 1.56 0.1 54
0.50 to <0.75 — 0.63 1 45.0 1.00 — 62
0.75 to <2.50 0.3 1.55 10 45.2 2.07 0.3 107
2.50 to <10.00 — 7.85 1 45.0 1.00 — 168
10.00 to <100.00 0.4 73.52 3 44.2 1.09 0.4 129
100.00 (Default) — —
Sub-total 13.1 2.05 123 44.5 0.60 1.6 12
AIRB – Institutions
0.00 to <0.15 43.8 0.07 4,429 44.8 0.95 8.2 19
0.15 to <0.25 4.0 0.22 425 42.6 1.13 1.6 42
0.25 to <0.50 0.7 0.37 94 45.3 1.46 0.4 63
0.50 to <0.75 0.3 0.63 81 43.7 1.25 0.2 77
0.75 to <2.50 0.5 1.24 152 45.1 1.59 0.5 97
2.50 to <10.00 — 6.99 23 44.5 2.50 0.1 177
10.00 to <100.00 — 13.95 6 45.4 3.46 — 233
100.00 (Default) — 100.00 1 39.5 1.00 — —
Sub-total 49.3 0.11 5,211 44.6 0.98 11.0 22
AIRB – Corporates
0.00 to <0.15 13.9 0.07 3,784 44.0 1.71 3.0 21
0.15 to <0.25 4.8 0.22 1,333 46.0 2.07 2.1 43
0.25 to <0.50 1.6 0.37 649 44.0 1.91 0.9 55
0.50 to <0.75 1.6 0.63 672 46.0 2.67 1.1 76
0.75 to <2.50 3.7 1.30 2,035 45.0 1.69 3.7 99
2.50 to <10.00 0.5 3.87 389 47.0 1.67 0.6 129
10.00 to <100.00 0.1 16.23 57 44.0 1.72 0.2 216
100.00 (Default) — 100.00 17 32.0 4.35 — —
Sub-total 26.2 0.64 8,936 45.0 1.74 11.6 44
AIRB – Total at 31 Dec 2020 88.6 0.56 14,270 45.0 1.15 24.2 27
FIRB – Corporates
0.00 to <0.15 21.1 0.08 3,013 44.3 1.52 4.5 21
0.15 to <0.25 4.2 0.22 780 44.9 1.26 1.4 34
0.25 to <0.50 1.2 0.37 528 45.0 1.39 0.7 55
0.50 to <0.75 1.6 0.63 490 44.9 1.17 1.2 75
0.75 to <2.50 3.5 1.48 1,807 45.0 1.54 3.6 104
2.50 to <10.00 0.7 4.11 456 45.0 1.52 0.9 140
10.00 to <100.00 — 11.60 68 45.0 1.46 0.1 196
100.00 (Default) 0.1 100.00 25 45.0 1.44 — —
FIRB – Total at 31 Dec 2020 32.4 0.64 7,167 44.5 1.47 12.4 38
Total (all portfolios) at 31 Dec 2020 121.0 0.58 21,437 44.6 1.24 36.6 30
HSBC Holdings plc 2Q21 Pillar 3 42
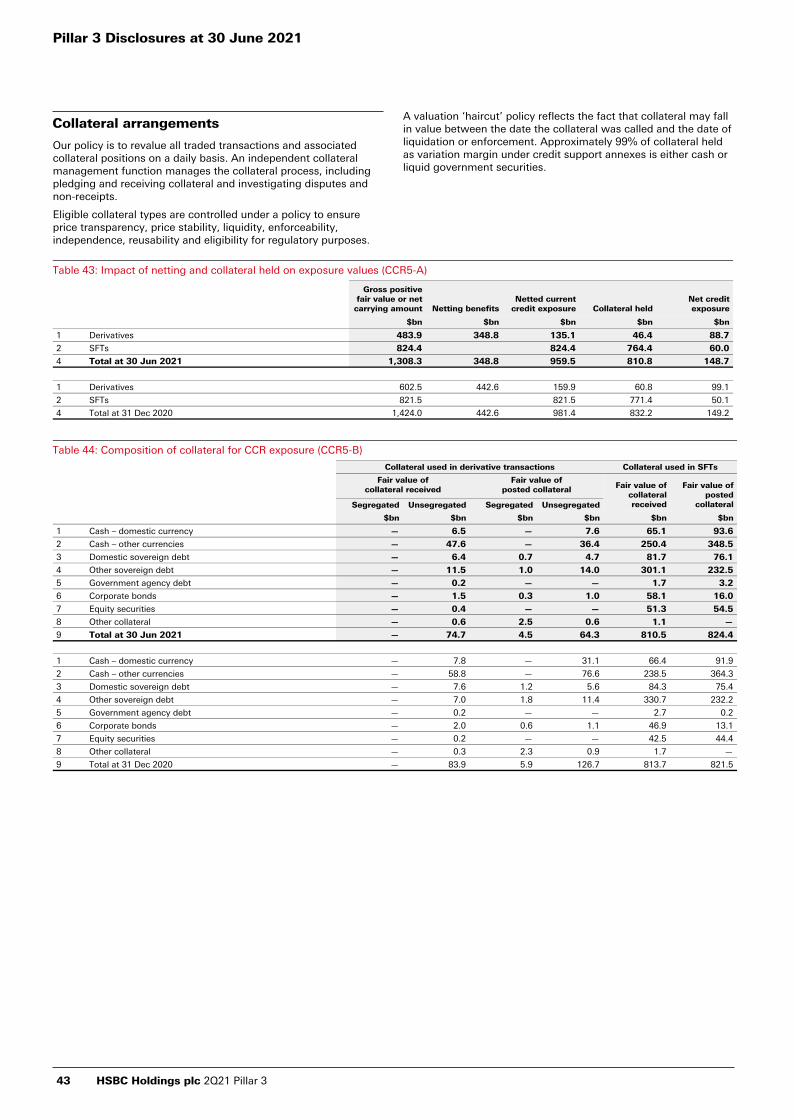
Collateral arrangements
Our policy is to revalue all traded transactions and associated collateral positions on a daily basis. An independent collateral management function manages the collateral process, including pledging and receiving collateral and investigating disputes and non-receipts.
Eligible collateral types are controlled under a policy to ensure price transparency, price stability, liquidity, enforceability, independence, reusability and eligibility for regulatory purposes.
A valuation ‘haircut’ policy reflects the fact that collateral may fall in value between the date the collateral was called and the date of liquidation or enforcement. Approximately 99% of collateral held as variation margin under credit support annexes is either cash or liquid government securities.
Table 43: Impact of netting and collateral held on exposure values (CCR5-A)
Gross positive fair value or net
carrying amount Netting benefitsNetted current
credit exposure Collateral heldNet credit exposure
$bn $bn $bn $bn $bn
1 Derivatives 483.9 348.8 135.1 46.4 88.7
2 SFTs 824.4 824.4 764.4 60.0
4 Total at 30 Jun 2021 1,308.3 348.8 959.5 810.8 148.7
1 Derivatives 602.5 442.6 159.9 60.8 99.1
2 SFTs 821.5 821.5 771.4 50.1
4 Total at 31 Dec 2020 1,424.0 442.6 981.4 832.2 149.2
Table 44: Composition of collateral for CCR exposure (CCR5-B)
Collateral used in derivative transactions Collateral used in SFTs
Fair value ofcollateral received
Fair value ofposted collateral Fair value of
collateral received
Fair value of posted
collateralSegregated Unsegregated Segregated Unsegregated
$bn $bn $bn $bn $bn $bn
1 Cash – domestic currency — 6.5 — 7.6 65.1 93.6
2 Cash – other currencies — 47.6 — 36.4 250.4 348.5
3 Domestic sovereign debt — 6.4 0.7 4.7 81.7 76.1
4 Other sovereign debt — 11.5 1.0 14.0 301.1 232.5
5 Government agency debt — 0.2 — — 1.7 3.2
6 Corporate bonds — 1.5 0.3 1.0 58.1 16.0
7 Equity securities — 0.4 — — 51.3 54.5
8 Other collateral — 0.6 2.5 0.6 1.1 —
9 Total at 30 Jun 2021 — 74.7 4.5 64.3 810.5 824.4
1 Cash – domestic currency — 7.8 — 31.1 66.4 91.9
2 Cash – other currencies — 58.8 — 76.6 238.5 364.3
3 Domestic sovereign debt — 7.6 1.2 5.6 84.3 75.4
4 Other sovereign debt — 7.0 1.8 11.4 330.7 232.2
5 Government agency debt — 0.2 — — 2.7 0.2
6 Corporate bonds — 2.0 0.6 1.1 46.9 13.1
7 Equity securities — 0.2 — — 42.5 44.4
8 Other collateral — 0.3 2.3 0.9 1.7 —
9 Total at 31 Dec 2020 — 83.9 5.9 126.7 813.7 821.5
Pillar 3 Disclosures at 30 June 2021
43 HSBC Holdings plc 2Q21 Pillar 3

Central counterparties
While exchange traded derivatives have been cleared through central counterparties (‘CCPs’) for many years, recent regulatory initiatives designed to reduce systemic risk in the banking system are directing increasing volumes of OTC derivatives to be cleared through CCPs.
To manage the significant concentration of risk in CCPs that results from this, we have developed a risk appetite framework to manage risk accordingly, at the level of individual CCPs and globally. A dedicated CCP risk team has been established to manage the interface with CCPs and undertake in-depth due diligence of the unique risks associated with these organisations.
Table 45: Exposures to central counterparties (CCR8)
At
30 Jun 2021 31 Dec 2020
EAD post-CRM RWAs
EAD post-CRM RWAs
$bn $bn $bn $bn
1 Exposures to qualifying central counterparties (‘QCCPs’) (total) 24.7 1.0 27.2 1.0
2 Exposures for trades at QCCPs (excluding initial margin and default fund contributions) 12.8 0.3 11.2 0.2
3 – OTC derivatives 2.4 0.1 3.4 0.1
4 – exchange-traded derivatives 7.2 0.1 4.4 0.1
5 – securities financing transactions 3.2 0.1 3.4 0.1
7 Segregated initial margin 4.5 5.9
8 Non-segregated initial margin 7.4 0.1 10.1 0.2
9 Pre-funded default fund contributions — 0.6 — 0.6
Table 46: Credit derivatives exposures (CCR6)
At
30 Jun 2021 31 Dec 2020
Protection bought
Protection sold
Protection bought
Protection sold
$bn $bn $bn $bn
Notionals
Credit derivative products used for own credit portfolio
– index credit default swaps 6.9 2.7 6.2 1.8
Total notionals used for own credit portfolio 6.9 2.7 6.2 1.8
Credit derivative products used for intermediation1
– index credit default swaps 103.3 89.5 129.3 111.8
– total return swaps 4.3 11.3 6.1 14.0
Total notionals used for intermediation 107.6 100.8 135.4 125.8
Total credit derivative notionals 114.5 103.5 141.6 127.6
Fair values
– Positive fair value (asset) 0.7 1.6 0.6 2.0
– Negative fair value (liability) (2.1) (1.0) (2.3) (1.4)
1 These are products where we act as an intermediary for our clients, enabling them to take a position in the underlying securities. These do not increase risk for HSBC.
HSBC Holdings plc 2Q21 Pillar 3 44

Securitisation
Securitisation strategy
HSBC acts as originator, sponsor, and investor to securitisation positions. Our strategy is to use securitisation to meet our needs for aggregate funding or capital management, to the extent that market conditions, regulatory treatments and other conditions are suitable, and for customer facilitation.
Securitisations on the banking book follow a detailed due diligence framework in accordance with the new securitisation framework. Wholesale Credit Risk conducts the credit approval process in line with HSBC policies and procedures.
Securitisations on the trading book also follow the due diligence framework, which accords with the requirements of the securitisation regulation. Detailed risk limits and criteria are provided by the Traded Risk function and monitored in line with HSBC policies and procedures.
HSBC does not provide support to its originated or sponsored securitisation transactions as a policy.
Securitisation activity
Our roles in the securitisation process are as follows:
• originator: where we originate the assets being securitised, either directly or indirectly;
• sponsor: where we establish and manage a securitisation programme that purchases exposures from third parties; and
• investor: where we invest in a securitisation transaction directly or provide derivatives or liquidity facilities to a securitisation.
HSBC as originator
We are originator of three securitisation programmes, details of which are given in the table below.
We use special purpose entity (‘SPEs’) to securitise customer loans and advances and other debt that we have originated in order to diversify our sources of funding for asset origination and for capital efficiency purposes. In such cases, we transfer the loans and advances to the SPEs for cash, and the SPEs issue debt securities to investors to fund the cash purchases.
In addition, we use SPEs to mitigate the capital absorbed by some of the customer loans and advances we have originated. Credit derivatives and financial guarantees are used to transfer the credit risk associated with such customer loans and advances, using an approach commonly known as synthetic securitisation.
Entity SPE Underlying assets Start dateMaturity
dateExposure at default ($m)
Capital requirement
before securitisation ($m)
Capital requirement after
securitisation ($m)
HSBC Bank plc Metrix Portfolio Distribution Plc Corporate loans Dec-15 Dec-22 715 38 31
HSBC Bank plc Metrix Portfolio Distribution Plc Corporate loans Dec-19 Dec-26 2,299 112 48
HSBC UK Bank plc Neon Portfolio Distribution DAC Corporate loans Dec-19 Dec-26 3,146 186 76
.
HSBC as sponsor
We are sponsor to two securitisation entities that manage a securitisation programme, which purchases exposures from third parties. Details of these can be found in the table below.
We hold all of the commercial paper issued by Solitaire Funding Limited, which is HSBC’s sponsored securitisation entity. This
is considered a legacy business, and exposure is being repaid as the securities it holds amortise or are sold.
Further details are available in Note 20 of the financial statements in the Annual Report and Accounts 2020.
Securitisation entity Description and nature of exposure
Accounting consolidation
Regulatory consolidation Regulatory treatment
Solitaire Asset-backed commercial paper conduit to which a first-loss letter of credit and transaction-specific liquidity facilities are provided
P P
Consolidated for regulatory capital purposes
Regency Multi-seller conduit to which senior liquidity facilities and programme-wide credit enhancement are provided P O
Exposures (including derivatives and liquidity facilities) are risk weighted as securitisation positions
HSBC as investor
We have exposure to third-party securitisations across a wide range of sectors in the form of investments, liquidity facilities and as a derivative counterparty.
Monitoring of securitisation positions
Securitisation positions are managed by dedicated teams that uses a combination of market standard systems and third-party data providers to monitor performance data and manage market and credit risks.
In the case of legacy re-securitisation positions, similar processes are conducted in respect of the underlying securitisations.
The liquidity risk of securitised assets is consistently managed as part of the Group’s liquidity and funding risk management framework.
Securitisation accounting treatment
For accounting purposes, we consolidate structured entities (including SPEs) when the substance of the relationship indicates that we control them,that is, we are exposed, or have rights, to variable returns from our involvement with the structured entity and have the ability to affect those returns through our power over the entity.
Full details of these assessments and our accounting policy on structured entities may be found in Note 1.2(a) and Note 20 on the financial statements respectively of the Annual Report and Accounts 2020.
We reassess the need to consolidate whenever there is a change in the substance of the relationship between HSBC and a structured entity.
HSBC enters into transactions in the normal course of business by which it transfers financial assets to structured entities. Depending on the circumstances, these transfers may either result in these financial assets being fully or partly derecognised, or continuing to be recognised in their entirety. Full derecognition occurs when we
Pillar 3 Disclosures at 30 June 2021
45 HSBC Holdings plc 2Q21 Pillar 3
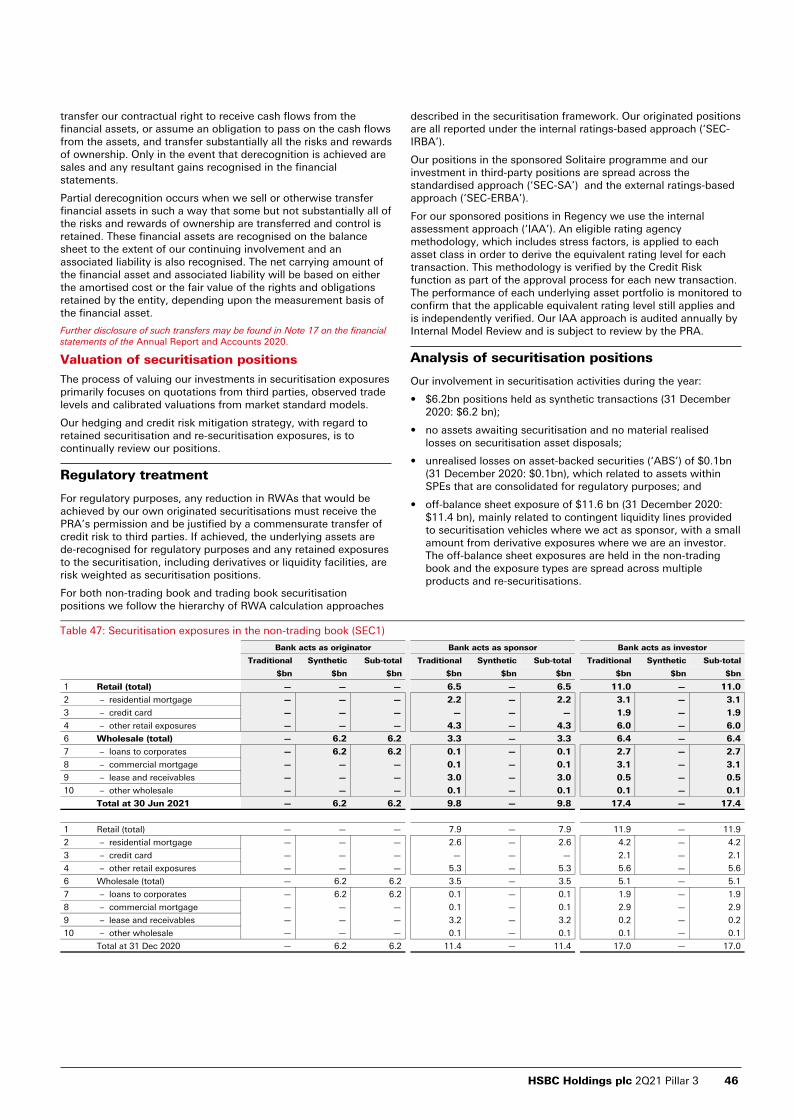
transfer our contractual right to receive cash flows from the financial assets, or assume an obligation to pass on the cash flows from the assets, and transfer substantially all the risks and rewards of ownership. Only in the event that derecognition is achieved are sales and any resultant gains recognised in the financial statements.
Partial derecognition occurs when we sell or otherwise transfer financial assets in such a way that some but not substantially all of the risks and rewards of ownership are transferred and control is retained. These financial assets are recognised on the balance sheet to the extent of our continuing involvement and an associated liability is also recognised. The net carrying amount of the financial asset and associated liability will be based on either the amortised cost or the fair value of the rights and obligations retained by the entity, depending upon the measurement basis of the financial asset.
Further disclosure of such transfers may be found in Note 17 on the financial statements of the Annual Report and Accounts 2020.
Valuation of securitisation positions
The process of valuing our investments in securitisation exposures primarily focuses on quotations from third parties, observed trade levels and calibrated valuations from market standard models.
Our hedging and credit risk mitigation strategy, with regard to retained securitisation and re-securitisation exposures, is to continually review our positions.
Regulatory treatment
For regulatory purposes, any reduction in RWAs that would be achieved by our own originated securitisations must receive the PRA’s permission and be justified by a commensurate transfer of credit risk to third parties. If achieved, the underlying assets are de-recognised for regulatory purposes and any retained exposures to the securitisation, including derivatives or liquidity facilities, are risk weighted as securitisation positions.
For both non-trading book and trading book securitisation positions we follow the hierarchy of RWA calculation approaches
described in the securitisation framework. Our originated positions are all reported under the internal ratings-based approach (‘SEC-IRBA’).
Our positions in the sponsored Solitaire programme and our investment in third-party positions are spread across the standardised approach (‘SEC-SA’) and the external ratings-based approach (‘SEC-ERBA’).
For our sponsored positions in Regency we use the internal assessment approach (‘IAA’). An eligible rating agency methodology, which includes stress factors, is applied to each asset class in order to derive the equivalent rating level for each transaction. This methodology is verified by the Credit Risk function as part of the approval process for each new transaction. The performance of each underlying asset portfolio is monitored to confirm that the applicable equivalent rating level still applies and is independently verified. Our IAA approach is audited annually by Internal Model Review and is subject to review by the PRA.
Analysis of securitisation positions
Our involvement in securitisation activities during the year:
• $6.2bn positions held as synthetic transactions (31 December 2020: $6.2 bn);
• no assets awaiting securitisation and no material realised losses on securitisation asset disposals;
• unrealised losses on asset-backed securities (‘ABS’) of $0.1bn (31 December 2020: $0.1bn), which related to assets within SPEs that are consolidated for regulatory purposes; and
• off-balance sheet exposure of $11.6 bn (31 December 2020: $11.4 bn), mainly related to contingent liquidity lines provided to securitisation vehicles where we act as sponsor, with a small amount from derivative exposures where we are an investor. The off-balance sheet exposures are held in the non-trading book and the exposure types are spread across multiple products and re-securitisations.
Table 47: Securitisation exposures in the non-trading book (SEC1)
Bank acts as originator Bank acts as sponsor Bank acts as investor
Traditional Synthetic Sub-total Traditional Synthetic Sub-total Traditional Synthetic Sub-total
$bn $bn $bn $bn $bn $bn $bn $bn $bn
1 Retail (total) — — — 6.5 — 6.5 11.0 — 11.0
2 – residential mortgage — — — 2.2 — 2.2 3.1 — 3.1
3 – credit card — — — — — — 1.9 — 1.9
4 – other retail exposures — — — 4.3 — 4.3 6.0 — 6.0
6 Wholesale (total) — 6.2 6.2 3.3 — 3.3 6.4 — 6.4
7 – loans to corporates — 6.2 6.2 0.1 — 0.1 2.7 — 2.7
8 – commercial mortgage — — — 0.1 — 0.1 3.1 — 3.1
9 – lease and receivables — — — 3.0 — 3.0 0.5 — 0.5
10 – other wholesale — — — 0.1 — 0.1 0.1 — 0.1
Total at 30 Jun 2021 — 6.2 6.2 9.8 — 9.8 17.4 — 17.4
1 Retail (total) — — — 7.9 — 7.9 11.9 — 11.9
2 – residential mortgage — — — 2.6 — 2.6 4.2 — 4.2
3 – credit card — — — — — — 2.1 — 2.1
4 – other retail exposures — — — 5.3 — 5.3 5.6 — 5.6
6 Wholesale (total) — 6.2 6.2 3.5 — 3.5 5.1 — 5.1
7 – loans to corporates — 6.2 6.2 0.1 — 0.1 1.9 — 1.9
8 – commercial mortgage — — — 0.1 — 0.1 2.9 — 2.9
9 – lease and receivables — — — 3.2 — 3.2 0.2 — 0.2
10 – other wholesale — — — 0.1 — 0.1 0.1 — 0.1
Total at 31 Dec 2020 — 6.2 6.2 11.4 — 11.4 17.0 — 17.0
HSBC Holdings plc 2Q21 Pillar 3 46

Table 48: Securitisation exposures in the trading book (SEC2)
At
30 Jun 2021 31 Dec 2020
Bank acts as investor1 Bank acts as investor1
Traditional Synthetic Sub-total Traditional Synthetic Sub-total
$bn $bn $bn $bn $bn $bn
1 Retail (total) 2.0 — 2.0 2.5 — 2.5
2 – residential mortgage 1.4 — 1.4 1.8 — 1.8
3 – credit card — — — 0.1 — 0.1
4 – other retail exposures 0.6 — 0.6 0.6 — 0.6
6 Wholesale (total) 1.3 — 1.3 1.2 — 1.2
8 – commercial mortgage 0.8 — 0.8 1.1 — 1.1
10 – other wholesale 0.5 — 0.5 0.1 — 0.1
Total (all portfolios) 3.3 — 3.3 3.7 — 3.7
1 HSBC does not act as originator or sponsor for securitisation exposures in the trading book.
Table 49: Securitisation exposures in the non-trading book and associated regulatory capital requirements – bank acting as originator or as sponsor (SEC3)
Exposure values (by risk weight bands) Exposure values (by regulatory approach)
≤20% RW>20% to 50% RW
>50% to 100% RW
>100% to 1,250%
RW1,250%
RW SEC-IRBA SEC-ERBA SEC IAA SEC-SA 1,250%
$bn $bn $bn $bn $bn $bn $bn $bn $bn $bn
2 Traditional securitisation 6.5 2.8 0.4 0.1 — — 1.3 8.2 0.3 —
3 Securitisation 6.5 2.8 0.4 0.1 — — 1.3 8.2 0.3 —
4 – retail underlying 4.0 2.1 0.4 — — — 1.2 5.2 0.1 —
5 – wholesale 2.5 0.7 — 0.1 — — 0.1 3.0 0.2 —
9 Synthetic securitisation 3.0 3.2 — — — 6.2 — — — —
10 Securitisation 3.0 3.2 — — — 6.2 — — — —
12 – wholesale 3.0 3.2 — — — 6.2 — — — —
1 Total at 30 Jun 2021 9.5 6.0 0.4 0.1 — 6.2 1.3 8.2 0.3 —
2 Traditional securitisation 7.3 3.4 0.5 0.2 — — 1.4 9.6 0.4 —
3 Securitisation 7.3 3.4 0.5 0.2 — — 1.4 9.6 0.4 —
4 – retail underlying 4.6 2.7 0.5 0.1 — — 1.3 6.4 0.2 —
5 – wholesale 2.7 0.7 — 0.1 — — 0.1 3.2 0.2 —
9 Synthetic securitisation 3.0 3.2 — — — 6.2 — — — —
10 Securitisation 3.0 3.2 — — — 6.2 — — — —
12 – wholesale 3.0 3.2 — — — 6.2 — — — —
1 Total at 31 Dec 2020 10.3 6.6 0.5 0.2 — 6.2 1.4 9.6 0.4 —
RWAs (by regulatory approach) Capital charge after cap
SEC-IRBA SEC-ERBA SEC IAA SEC-SA 1,250% SEC-IRBA SEC-ERBA SEC IAA SEC-SA 1,250%
$bn $bn $bn $bn $bn $bn $bn $bn $bn $bn
2 Traditional securitisation — 0.8 1.5 0.1 — — 0.1 0.1 — —
3 Securitisation — 0.8 1.5 0.1 — — 0.1 0.1 — —
4 – retail underlying — 0.6 1.0 0.1 — — — 0.1 — —
5 – wholesale — 0.2 0.5 — — — 0.1 — — —
9 Synthetic securitisation 1.6 — — — 0.3 0.2 — — — —
10 Securitisation 1.6 — — — 0.3 0.2 — — — —
12 – wholesale 1.6 — — — 0.3 0.2 — — — —
1 Total at 30 Jun 2021 1.6 0.8 1.5 0.1 0.3 0.2 0.1 0.1 — —
2 Traditional securitisation — 0.8 1.9 0.2 — — 0.1 0.2 — —
3 Securitisation — 0.8 1.9 0.2 — — 0.1 0.2 — —
4 – retail underlying — 0.6 1.3 0.1 — — 0.1 0.2 — —
5 – wholesale — 0.2 0.6 0.1 — — — — — —
9 Synthetic securitisation 1.7 — — — 0.3 0.2 — — — —
10 Securitisation 1.7 — — — 0.3 0.2 — — — —
12 – wholesale 1.7 — — — 0.3 0.2 — — — —
1 Total at 31 Dec 2020 1.7 0.8 1.9 0.2 0.3 0.2 0.1 0.2 — —
Pillar 3 Disclosures at 30 June 2021
47 HSBC Holdings plc 2Q21 Pillar 3

Table 50: Securitisation exposures in the non-trading book and associated capital requirements – bank acting as investor (SEC4)
Exposure values (by risk weight bands) Exposure values (by regulatory approach)
≤20% RW>20% to 50% RW
>50% to 100% RW
>100% to 1,250%
RW1,250%
RW SEC-IRBA SEC-ERBA SEC IAA SEC-SA 1,250%
$bn $bn $bn $bn $bn $bn $bn $bn $bn $bn
2 Traditional securitisation 12.7 1.7 2.7 0.3 — 0.1 2.8 — 14.5 —
3 Securitisation 12.7 1.7 2.7 0.3 — 0.1 2.8 — 14.5 —
4 – retail underlying 9.0 0.9 0.9 0.2 — — 1.0 — 10.0 —
5 – wholesale 3.7 0.8 1.8 0.1 — 0.1 1.8 — 4.5 —
1 Total at 30 Jun 2021 12.7 1.7 2.7 0.3 — 0.1 2.8 — 14.5 —
2 Traditional securitisation 12.8 1.1 2.6 0.5 — 0.1 3.3 — 13.6 —
3 Securitisation 12.8 1.1 2.6 0.5 — 0.1 3.3 — 13.6 —
4 – retail underlying 9.7 0.9 0.9 0.4 — — 1.4 — 10.5 —
5 – wholesale 3.1 0.2 1.7 0.1 — 0.1 1.9 — 3.1 —
1 Total at 31 Dec 2020 12.8 1.1 2.6 0.5 — 0.1 3.3 — 13.6 —
RWAs (by regulatory approach) Capital charge after cap
SEC-IRBA SEC-ERBA SEC IAA SEC-SA 1,250% SEC-IRBA SEC-ERBA SEC IAA SEC-SA 1,250%
$bn $bn $bn $bn $bn $bn $bn $bn $bn $bn
2 Traditional securitisation — 2.3 — 2.7 — — 0.1 0.2 —
3 Securitisation — 2.3 — 2.7 — — 0.1 0.2 —
4 – retail underlying — 0.6 — 2.0 — — — 0.1 —
5 – wholesale — 1.7 — 0.7 — — 0.1 0.1 —
1 Total at 30 Jun 2021 — 2.3 — 2.7 — — 0.1 0.2 —
2 Traditional securitisation — 2.8 — 2.5 — — 0.2 — 0.2 —
3 Securitisation — 2.8 — 2.5 — — 0.2 — 0.2 —
4 – retail underlying — 1.1 — 2.0 — — 0.1 — 0.2 —
5 – wholesale — 1.7 — 0.5 — — 0.1 — — —
1 Total at 31 Dec 2020 — 2.8 — 2.5 — — 0.2 — 0.2 —
HSBC Holdings plc 2Q21 Pillar 3 48
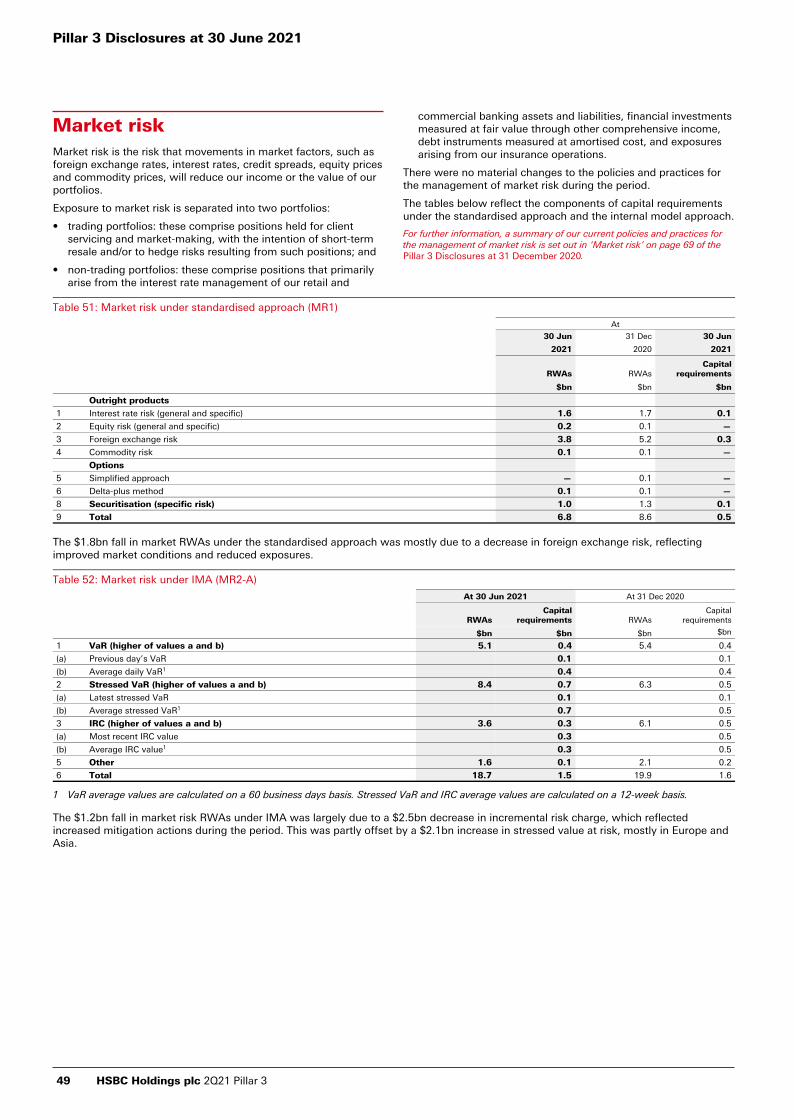
Market riskMarket risk is the risk that movements in market factors, such as foreign exchange rates, interest rates, credit spreads, equity prices and commodity prices, will reduce our income or the value of our portfolios.
Exposure to market risk is separated into two portfolios:
• trading portfolios: these comprise positions held for client servicing and market-making, with the intention of short-term resale and/or to hedge risks resulting from such positions; and
• non-trading portfolios: these comprise positions that primarily arise from the interest rate management of our retail and
commercial banking assets and liabilities, financial investments measured at fair value through other comprehensive income, debt instruments measured at amortised cost, and exposures arising from our insurance operations.
There were no material changes to the policies and practices for the management of market risk during the period.
The tables below reflect the components of capital requirements under the standardised approach and the internal model approach.
For further information, a summary of our current policies and practices for the management of market risk is set out in ‘Market risk’ on page 69 of the Pillar 3 Disclosures at 31 December 2020.
Table 51: Market risk under standardised approach (MR1)
At
30 Jun 31 Dec 30 Jun
2021 2020 2021
RWAs RWAsCapital
requirements
$bn $bn $bn
Outright products
1 Interest rate risk (general and specific) 1.6 1.7 0.1
2 Equity risk (general and specific) 0.2 0.1 —
3 Foreign exchange risk 3.8 5.2 0.3
4 Commodity risk 0.1 0.1 —
Options
5 Simplified approach — 0.1 —
6 Delta-plus method 0.1 0.1 —
8 Securitisation (specific risk) 1.0 1.3 0.1
9 Total 6.8 8.6 0.5
The $1.8bn fall in market RWAs under the standardised approach was mostly due to a decrease in foreign exchange risk, reflecting improved market conditions and reduced exposures.
Table 52: Market risk under IMA (MR2-A)
At 30 Jun 2021 At 31 Dec 2020
RWAsCapital
requirements RWAsCapital
requirements
$bn $bn $bn $bn
1 VaR (higher of values a and b) 5.1 0.4 5.4 0.4
(a) Previous day’s VaR 0.1 0.1
(b) Average daily VaR1 0.4 0.4
2 Stressed VaR (higher of values a and b) 8.4 0.7 6.3 0.5
(a) Latest stressed VaR 0.1 0.1
(b) Average stressed VaR1 0.7 0.5
3 IRC (higher of values a and b) 3.6 0.3 6.1 0.5
(a) Most recent IRC value 0.3 0.5
(b) Average IRC value1 0.3 0.5
5 Other 1.6 0.1 2.1 0.2
6 Total 18.7 1.5 19.9 1.6
1 VaR average values are calculated on a 60 business days basis. Stressed VaR and IRC average values are calculated on a 12-week basis.
The $1.2bn fall in market risk RWAs under IMA was largely due to a $2.5bn decrease in incremental risk charge, which reflected increased mitigation actions during the period. This was partly offset by a $2.1bn increase in stressed value at risk, mostly in Europe and Asia.
Pillar 3 Disclosures at 30 June 2021
49 HSBC Holdings plc 2Q21 Pillar 3
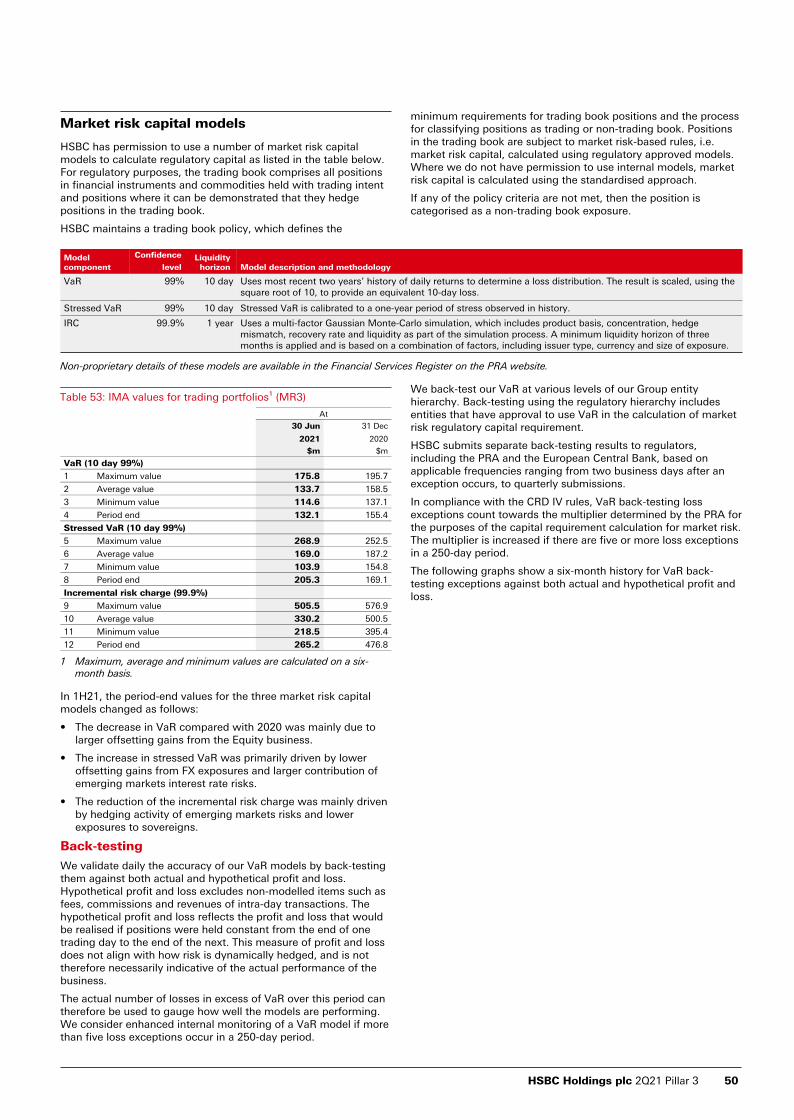
Market risk capital models
HSBC has permission to use a number of market risk capital models to calculate regulatory capital as listed in the table below. For regulatory purposes, the trading book comprises all positions in financial instruments and commodities held with trading intent and positions where it can be demonstrated that they hedge positions in the trading book.
HSBC maintains a trading book policy, which defines the
minimum requirements for trading book positions and the process for classifying positions as trading or non-trading book. Positions in the trading book are subject to market risk-based rules, i.e. market risk capital, calculated using regulatory approved models. Where we do not have permission to use internal models, market risk capital is calculated using the standardised approach.
If any of the policy criteria are not met, then the position is categorised as a non-trading book exposure.
Model component
Confidence
levelLiquidity horizon Model description and methodology
VaR 99 % 10 day Uses most recent two years’ history of daily returns to determine a loss distribution. The result is scaled, using the square root of 10, to provide an equivalent 10-day loss.
Stressed VaR 99 % 10 day Stressed VaR is calibrated to a one-year period of stress observed in history.
IRC 99.9 % 1 year Uses a multi-factor Gaussian Monte-Carlo simulation, which includes product basis, concentration, hedge mismatch, recovery rate and liquidity as part of the simulation process. A minimum liquidity horizon of three months is applied and is based on a combination of factors, including issuer type, currency and size of exposure.
Non-proprietary details of these models are available in the Financial Services Register on the PRA website.
Table 53: IMA values for trading portfolios¹ (MR3)
At
30 Jun 31 Dec
2021 2020
$m $m
VaR (10 day 99%)
1 Maximum value 175.8 195.7
2 Average value 133.7 158.5
3 Minimum value 114.6 137.1
4 Period end 132.1 155.4
Stressed VaR (10 day 99%)
5 Maximum value 268.9 252.5
6 Average value 169.0 187.2
7 Minimum value 103.9 154.8
8 Period end 205.3 169.1
Incremental risk charge (99.9%)
9 Maximum value 505.5 576.9
10 Average value 330.2 500.5
11 Minimum value 218.5 395.4
12 Period end 265.2 476.8
1 Maximum, average and minimum values are calculated on a six-month basis.
In 1H21, the period-end values for the three market risk capital models changed as follows:
• The decrease in VaR compared with 2020 was mainly due to larger offsetting gains from the Equity business.
• The increase in stressed VaR was primarily driven by lower offsetting gains from FX exposures and larger contribution of emerging markets interest rate risks.
• The reduction of the incremental risk charge was mainly driven by hedging activity of emerging markets risks and lower exposures to sovereigns.
Back-testing
We validate daily the accuracy of our VaR models by back-testing them against both actual and hypothetical profit and loss. Hypothetical profit and loss excludes non-modelled items such as fees, commissions and revenues of intra-day transactions. The hypothetical profit and loss reflects the profit and loss that would be realised if positions were held constant from the end of one trading day to the end of the next. This measure of profit and loss does not align with how risk is dynamically hedged, and is not therefore necessarily indicative of the actual performance of the business.
The actual number of losses in excess of VaR over this period can therefore be used to gauge how well the models are performing. We consider enhanced internal monitoring of a VaR model if more than five loss exceptions occur in a 250-day period.
We back-test our VaR at various levels of our Group entity hierarchy. Back-testing using the regulatory hierarchy includes entities that have approval to use VaR in the calculation of market risk regulatory capital requirement.
HSBC submits separate back-testing results to regulators, including the PRA and the European Central Bank, based on applicable frequencies ranging from two business days after an exception occurs, to quarterly submissions.
In compliance with the CRD IV rules, VaR back-testing loss exceptions count towards the multiplier determined by the PRA for the purposes of the capital requirement calculation for market risk. The multiplier is increased if there are five or more loss exceptions in a 250-day period.
The following graphs show a six-month history for VaR back-testing exceptions against both actual and hypothetical profit and loss.
HSBC Holdings plc 2Q21 Pillar 3 50

Table 54: Comparison of VaR estimates with gains/losses (MR4)
VaR back-testing loss exceptions against actual profit and loss ($m)
Jan-21 Feb-21 Mar-21 Apr-21 May-21 Jun-21
-50
0
50
100
Actual profit and loss VaR w Back-testing exception
VaR back-testing loss exceptions against hypothetical profit and loss ($m)
Jan-21 Feb-21 Mar-21 Apr-21 May-21 Jun-21
-50
0
50
100
Hypothetical profit and loss VaR w Back-testing exception
In 1H21, the Group experienced one loss exception against hypothetical profit and loss and no exceptions against actual profit and loss. The loss back-testing exception against hypothetical
profit and loss observed in March was mainly driven by the effect of lower volatility in equity markets and by increases in some emerging markets’ foreign exchange forward rate volatilities.
Pillar 3 Disclosures at 30 June 2021
51 HSBC Holdings plc 2Q21 Pillar 3
Other information
Abbreviations
The following abbreviated terms are used throughout this document.
Currencies$ US dollar
AAIRB Advanced IRB
AT1 capital Additional tier 1 capital
BBCBS/Basel Committee
Basel Committee on Banking Supervision
BoE Bank of England
CCCF1 Credit conversion factor
CCP Central counterparty
CCR1 Counterparty credit risk
CCyB1 Countercyclical capital buffer
CDS1 Credit default swap
CECL Current expected credit loss
CET11 Common equity tier 1
CIU Collective investment undertakings
CMB Commercial Banking, a global business
CRD IV1 Capital Requirements Regulation and Directive
CRM Credit risk mitigation/mitigant
CRR II Revisions to Capital Requirements Regulation, as implemented
CRR III Revisions to EU legislation for Basel III reforms
CVA Credit valuation adjustment
EEAD1 Exposure at default
EBA European Banking Authority
ECL Expected credit loss
EU European Union
FFIRB Foundation IRB
FRTB Fundamental review of the trading book
FSB Financial Stability Board
FSEs Financial sector entities
GGAC Group Audit Committee
GBM Global Banking and Markets, a global business
Group HSBC Holdings together with its subsidiary undertakings
G-SIB1 Global systemically important bank
G-SII Global systemically important institution
HHKMA Hong Kong Monetary Authority
HMT Her Majesty’s Treasury
Hong Kong The Hong Kong Special Administrative Region of the People’s Republic of China
HSBC HSBC Holdings together with its subsidiary undertakings
IIAA1 Internal assessment approach
IFRSs International Financial Reporting Standards
IMA Internal models approach
IMM1 Internal model method
IRB1/RBA Internal ratings-based approach
IRC1 Incremental risk charge
LLCR Liquidity coverage ratio
LGD1 Loss given default
MMENA Middle East and North Africa
MREL Minimum requirement for own funds and eligible liabilities
NNCOA Non-credit obligation asset
OOTC1 Over-the-counter
PPD1 Probability of default
PRA1 Prudential Regulation Authority (UK)
QQCCPs Qualifying central counterparties
RRAS Risk appetite statement
RBM1 Ratings-based method
RMM Risk Management Meeting of the Group Executive Committee
RNIV Risks not in VaR
RW Risk weights
RWA1 Risk-weighted asset
SSA/STD1 Standardised approach
SA-CCR Standardised approach for counterparty credit risk
SFM1 Supervisory formula method
SFT1 Securities financing transactions
SIC Securities Investment Conduit
SME Small and medium-sized enterprise
SPE1 Special purpose entity
SSFA/SFA Simplified supervisory formula approach
SVaR Stressed value at risk
TTLAC1 Total loss absorbing capacity
T1 capital Tier 1 capital
T2 capital Tier 2 capital
UUK United Kingdom
US United States
VVaR1 Value at risk
WWPB Wealth and Personal Banking, a global business
1 Full definition included in the Glossary published on HSBC website www.hsbc.com/investor-relations/group-results-and-reporting.
HSBC Holdings plc 2Q21 Pillar 3 52

Cautionary statement regarding forward-looking statements
These Pillar 3 Disclosures at 30 June 2021 contain certain forward-looking statements with respect to HSBC’s: financial condition; results of operations and business, including the strategic priorities; financial, investment and capital targets; and ESG targets/commitments described herein.
Statements that are not historical facts, including statements about HSBC’s beliefs and expectations, are forward-looking statements. Words such as ‘will’, ‘should’, ‘expects’, ‘targets’, ‘anticipates’, ‘intends’, ‘plans’, ‘believes’, ‘seeks’, ‘estimates’, ‘potential’ and ‘reasonably possible’, variations of these words and similar expressions are intended to identify forward-looking statements. These statements are based on current plans, information, data, estimates and projections, and therefore undue reliance should not be placed on them. Forward-looking statements speak only as of the date they are made. HSBC makes no commitment to revise or update any forward-looking statements to reflect events or circumstances occurring or existing after the date of any forward-looking statements.
Written and/or oral forward-looking statements may also be made in the periodic reports to the US Securities and Exchange Commission, summary financial statements to shareholders, proxy statements, offering circulars and prospectuses, press releases and other written materials, and in oral statements made by HSBC’s Directors, officers or employees to third parties, including financial analysts.
Forward-looking statements involve inherent risks and uncertainties. Readers are cautioned that a number of factors could cause actual results to differ, in some instances materially, from those anticipated or implied in any forward-looking statement. These include, but are not limited to:
• changes in general economic conditions in the markets in which we operate, such as continuing or deepening recessions and fluctuations in employment and creditworthy customers beyond those factored into consensus forecasts (including, without limitation, as a result of the Covid-19 pandemic); the Covid-19 pandemic, which is expected to continue to have adverse impacts on our income due to lower lending and transaction volumes, lower wealth and insurance manufacturing revenue, and lower or negative interest rates in markets where we operate, as well as, more generally, the potential for material adverse impacts on our financial condition, results of operations, prospects, liquidity, capital position and credit ratings; deviations from the market and economic assumptions that form the basis for our ECL measurements (including, without limitation, as a result of the Covid-19 pandemic); potential changes in HSBC’s dividend policy; changes in foreign exchange rates and interest rates, including the accounting impact resulting from financial reporting in respect of hyperinflationary economies; volatility in equity markets; lack of liquidity in wholesale funding or capital markets, which may affect our ability to meet our obligations under financing facilities or to fund new loans, investments and businesses; geopolitical tensions or diplomatic developments producing social instability or legal uncertainty, such as the developments in Hong Kong and the South China Sea, the US’s approach to strategic competition with China, supply chain restrictions, claims of human rights violations, diplomatic tensions between China and the UK, the EU, Australia and India, and other potential areas of tension, which may affect HSBC by creating regulatory, reputational and market risks; the efficacy of government, customer and HSBC’s actions in managing and mitigating climate change and in supporting the global transition to net zero carbon emissions, which may cause both idiosyncratic and systemic risks resulting in potential financial and non-financial impacts; illiquidity and downward price pressure in national real estate markets; adverse changes in central banks’ policies with respect to the provision of liquidity support to financial markets; heightened market concerns over sovereign creditworthiness in over-
indebted countries; adverse changes in the funding status of public or private defined benefit pensions; societal shifts in customer financing and investment needs, including consumer perception as to the continuing availability of credit; exposure to counterparty risk, including third parties using us as a conduit for illegal activities without our knowledge; the expected discontinuation of certain key Ibors and the development of near risk-free benchmark rates, as well as the transition of legacy Ibor contracts to near risk-free benchmark rates, which exposes HSBC to material execution risks, and increases some financial and non-financial risks; and price competition in the market segments we serve;
• changes in government policy and regulation, including the monetary, interest rate and other policies of central banks and other regulatory authorities in the principal markets in which we operate and the consequences thereof (including, without limitation, actions taken as a result of the Covid-19 pandemic); initiatives to change the size, scope of activities and interconnectedness of financial institutions in connection with the implementation of stricter regulation of financial institutions in key markets worldwide; revised capital and liquidity benchmarks, which could serve to deleverage bank balance sheets and lower returns available from the current business model and portfolio mix; changes to tax laws and tax rates applicable to HSBC, including the imposition of levies or taxes designed to change business mix and risk appetite; the practices, pricing or responsibilities of financial institutions serving their consumer markets; expropriation, nationalisation, confiscation of assets and changes in legislation relating to foreign ownership; the future of the UK’s relationship with the EU following the UK’s withdrawal from the EU, which may continue to be characterised by uncertainty despite the signing of the Trade and Cooperation Agreement between the UK and the EU; passage of the Hong Kong national security law and restrictions on telecommunications, as well as the US Hong Kong Autonomy Act, which have caused tensions between China, the US and the UK; general changes in government policy that may significantly influence investor decisions; the costs, effects and outcomes of regulatory reviews, actions or litigation, including any additional compliance requirements; and the effects of competition in the markets where we operate including increased competition from non-bank financial services companies; and
• factors specific to HSBC, including our success in adequately identifying the risks we face, such as the incidence of loan losses or delinquency, and managing those risks (through account management, hedging and other techniques); our ability to achieve our financial, investment, capital and ESG targets/commitments, which may result in our failure to achieve any of the expected benefits of our strategic priorities; model limitations or failure, including, without limitation, the impact that the consequences of the Covid-19 pandemic have had on the performance and usage of financial models, which may require us to hold additional capital, incur losses and/or use compensating controls, such as judgemental post-model adjustments, to address model limitations; changes to the judgements, estimates and assumptions we base our financial statements on; changes in our ability to meet the requirements of regulatory stress tests; a reduction in the credit ratings assigned to us or any of our subsidiaries, which could increase the cost or decrease the availability of our funding and affect our liquidity position and net interest margin; changes to the reliability and security of our data management, data privacy, information and technology infrastructure, including threats from cyber-attacks, which may impact our ability to service clients and may result in financial loss, business disruption and/ or loss of customer services and data; changes in insurance customer behaviour and insurance claim rates; our dependence on loan payments and dividends from subsidiaries to meet our obligations; changes in accounting standards, which may have a material impact on the way we prepare our financial statements; changes in our ability to manage third-party, fraud and reputational risks inherent in our operations; employee misconduct, which may result in regulatory sanctions and/or
Pillar 3 Disclosures at 30 June 2021
53 HSBC Holdings plc 2Q21 Pillar 3

reputational or financial harm; changes in skill requirements, ways of working and talent shortages, which may affect our ability to recruit and retain senior management and diverse and skilled personnel; and changes in our ability to develop sustainable finance products and our capacity to measure the climate impact from our financing activity, which may affect our ability to achieve our climate ambition. Effective risk
management depends on, among other things, our ability through stress testing and other techniques to prepare for events that cannot be captured by the statistical models it uses; our success in addressing operational, legal and regulatory, and litigation challenges; and other risks and uncertainties we identify in ‘Top and emerging risks’ on pages 25 to 26 of the Interim Report 2021.
Contacts
Enquiries relating to HSBC’s strategy or operations may be directed to:
Richard O’ConnorGlobal Head of Investor RelationsHSBC Holdings plc8 Canada SquareLondon E14 5HQ
Mark PhinHead of Investor Relations, Asia-PacificThe Hongkong and Shanghai Banking Corporation Limited1 Queen’s Road CentralHong Kong
Telephone: +44 (0) 20 7991 6590 Telephone: +852 2822 4908Email: [email protected] Email: [email protected]
HSBC Holdings plc 2Q21 Pillar 3 54

HSBC Holdings plc8 Canada SquareLondon E14 5HQUnited KingdomTelephone: 44 020 7991 8888 www.hsbc.comIncorporated in England with limited liability Registered number 617987