HSBC Holdings plc 2008 Annual Report and Accounts
472
Strength, diversity and resilience 2008 HSBC Holdings plc Annual Report and Accounts
Transcript of HSBC Holdings plc 2008 Annual Report and Accounts

Strength, diversity and resilience
2008HSBC Holdings plc Annual Report and Accounts
2.1_Report cover
H S B C H O L D I N G S P L C
Annual Report and Accounts 2008
Headquartered in London, HSBC is one of the largest banking and financial services organisations in the world. Its international network comprises some 10,000 properties in 86 countries and territories in Europe; Hong Kong; Rest of Asia-Pacific, including the Middle East and Africa; North America and Latin America.
With listings on the London, Hong Kong, New York, Paris and Bermuda stock exchanges, shares in HSBC Holdings plc are held by over 210,000 shareholders in 120 countries and territories. The shares are traded on the New York Stock Exchange in the form of American Depositary Shares.
HSBC provides a comprehensive range of financial services to more than 100 million customers through four customer groups and global businesses: Personal Financial Services (including consumer finance); Commercial Banking; Global Banking and Markets; and Private Banking.
Certain defined terms
Unless the context requires otherwise, ‘HSBC Holdings’ means HSBC Holdings plc and ‘HSBC’ or the ‘Group’ means HSBC Holdings together with its subsidiaries. Within this document the Hong Kong Special Administrative Region of the People’s Republic of China is referred to as ‘Hong Kong’. When used in the terms ‘shareholders’ equity’ and ‘total shareholders’ equity’, ‘shareholders’ means holders of HSBC Holdings ordinary shares and those preference shares classified as equity. This document comprises the Annual Report and Accounts 2008 for HSBC Holdings plc and its subsidiaries. It contains the Report of the Directors and Financial Statements, together with the Independent Auditor’s Report thereon, as required by the UK Companies Act 1985. The Annual Review 2008 of HSBC Holdings plc is published as a separate document. The Report of the Directors on pages 12 to 314 and the Directors’ Remuneration Report on pages 315 to 328 have each been drawn up in accordance with the requirements of English law, and liability in respect thereof is also governed by English law. In particular, the liability of the Directors for these reports is solely to HSBC Holdings.

H S B C H O L D I N G S P L C
Contents
1
Financial Highlights ...................................................................................................................................................................... 2
Cautionary Statement Regarding Forward-Looking Statements .................................................................... 6
Group Chairman’s Statement ................................................................................................................................................ 8
Report of the Directors ............................................................................................................................................................... 12
Operating and Financial Review Principal activities ............................................................... 12 Group performance by income and expense item ......... 26Strategic direction ................................................................ 12 Balance sheet ................................................................. 40Challenges and uncertainties ............................................... 12 Critical accounting policies .................................................. 61Key performance indicators ................................................. 17 Customer groups and global businesses1 ............................. 67Reconciliation of reported and underlying profit ................ 21 Geographical regions1 .......................................................... 87Financial summary1 ............................................................. 23 Products and services ........................................................... 138 Income statement ........................................................... 24 Other information ................................................................. 140
Impact of Market Turmoil Background and disclosure policy ...................................... 144 Nature and extent of HSBC’s exposures ............................. 150Overview of exposure .......................................................... 145 Fair values of financial instruments ..................................... 162Business model .................................................................... 149 Special purpose entities ........................................................ 173Risk management ................................................................. 150 Other off-balance sheet arrangements and commitments .... 187Accounting policies ............................................................. 150
Risk1 Regulation and supervision ................................................. 188 Operational risk .................................................................... 252Risk management ................................................................. 191 Pension risk .......................................................................... 253Credit risk ............................................................................ 192 Reputational risk .................................................................. 254Liquidity and funding .......................................................... 235 Sustainability risk.................................................................. 254Market risk ........................................................................... 241 Risk management of insurance operations ........................... 255Residual value risk ............................................................... 252 Capital management and allocation ..................................... 274
Governance1 Corporate governance report ............................................... 281 Employees ............................................................................ 303Directors and senior management ....................................... 281 Corporate sustainability ....................................................... 312Board of Directors ............................................................... 290 Dividends, shareholders and meetings ................................. 313
Directors’ Remuneration Report1 ......................................................................................................................................... 315
Statement of Directors’ Responsibilities .......................................................................................................................... 329
Independent Auditor’s Report ............................................................................................................................................... 330
Financial Statements1 .................................................................................................................................................................. 332
Notes on the Financial Statements .................................................................................................................................... 340
Shareholder Information ........................................................................................................................................................... 448
Enforceability of judgements made in the US ..................... 448 Interim Management Statements and Interim results ........... 452Limitations affecting equity security holders ...................... 448 Actuaries ............................................................................... 452Fourth interim dividend for 2008 ........................................ 448 Shareholder enquiries and communications ........................ 453Interim dividends for 2009 .................................................. 449 Investor relations .................................................................. 454Dividends on ordinary shares of HSBC Holdings .............. 449 Where more information about HSBC is available ............. 454Nature of trading market ...................................................... 449 Taxation of shares and dividends ......................................... 455Shareholder profile .............................................................. 451 History and development of HSBC ..................................... 457Memorandum and Articles of Association .......................... 451 Organisational structure ....................................................... 459Annual General Meeting ..................................................... 452
Glossary of Terms and Index .................................................................................................................................................. 460
1 Detailed contents are provided on the referenced pages.

H S B C H O L D I N G S P L C
Financial Highlights
Highlights / Ratios
2
For the year
• Total operating income up by 1 per cent to US$88,571 million (2007: US$87,601 million).
• Net operating income before loan impairment charges up by 3 per cent to US$81,682 million (2007: US$78,993 million).
• Group pre-tax profit down by 62 per cent to US$9,307 million (2007: US$24,212 million).
• Profit attributable to shareholders of the parent company down by 70 per cent to US$5,728 million (2007: US$19,133 million).
• Return on average shareholders’ equity of 4.7 per cent (2007: 15.9 per cent).
• Earnings per ordinary share down by 72 per cent to US$0.47 (2007: US$1.65).
At the year-end1
• Total equity down by 26 per cent to US$100,229 million (2007: US$135,416 million).
• Customer accounts and deposits by banks up by 1 per cent to US$1,245,411 million (2007: US$1,228,321 million).
• Risk-weighted assets up by 2 per cent to US$1,147,974 million (2007: US$1,123,782 million).
Dividends and capital position1
• Total dividends declared in respect of 2008 of US$0.64 per share, a decrease of 28.9 per cent over dividends for 2007; fourth interim dividend for 2008 of US$0.10 per share, a decrease of 74.4 per cent.
• Tier 1 ratio of 8.3 per cent and total capital ratio of 11.4 per cent.
Dividends per share2 (US dollars)
Return on average invested capital (per cent)
0.63
0.69
0.76
0.87
0.93
2004
2005
2006
2007
2008
15.0
15.9
14.9
15.3
4.0
2004
2005
2006
2007
2008
Earnings per share (US dollars)
Cost efficiency ratio
(per cent)
1.18
1.36
1.40
1.65
0.47
2004
2005
2006
2007
2008
51.6
51.2
51.3
49.4
60.1
2004
2005
2006
2007
2008
For footnotes, see page 5.

3
Capital and performance ratios
2008 2007 % % Capital ratios1 Tier 1 ratio ......................................................................................................................................... 8.3 9.3 Total capital ratio ............................................................................................................................... 11.4 13.6 Performance ratios Return on average invested capital3 ................................................................................................... 4.0 15.3 Return on average total shareholders’ equity4 ................................................................................... 4.7 15.9 Post-tax return on average total assets .............................................................................................. 0.26 0.97 Post-tax return on average risk-weighted assets ............................................................................... 0.55 1.95 Credit coverage ratios Loan impairment charges as a percentage of total operating income ............................................... 27.24 19.61 Loan impairment charges as a percentage of average gross customer advances .............................. 2.46 1.97 Total impairment allowances outstanding as a percentage of impaired loans at the year-end ......... 94.3 98.1 Efficiency and revenue mix ratios Cost efficiency ratio5
– reported ....................................................................................................................................... 60.1 49.4 – excluding goodwill impairment6 ................................................................................................ 47.2 49.4
As a percentage of total operating income: – net interest income ..................................................................................................................... 48.1 43.1 – net fee income ............................................................................................................................ 22.6 25.1 – net trading income ...................................................................................................................... 7.4 11.2
Financial ratios Loans and advances to customers as a percentage of customer accounts ......................................... 83.6 89.5 Average total shareholders’ equity to average total assets ............................................................... 4.87 5.69
Share information at the year-end
2008 2007
US$0.50 ordinary shares in issue (million) ....................................................................................... 12,105 11,829 Market capitalisation (billion) ........................................................................................................... US$114 US$198 Closing market price per ordinary share:
– London ........................................................................................................................................ £6.62 £8.42 – Hong Kong ................................................................................................................................. HK$73.70 HK$131.70
Closing market price per American Depositary Share7 ..................................................................... US$48.67 US$83.71
Over 1 year Over 3 years Over 5 years
HSBC total shareholder return to 31 December 20088 ................................... 84.5 84.5 98.5 Benchmarks:
– FTSE 1009 ................................................................................................ 71.7 88.1 118.3 – MSCI World10 .......................................................................................... 81.8 93.6 123.7 – MSCI Banks11 ........................................................................................... 63.0 60.8 82.7
For footnotes, see page 5.
.

H S B C H O L D I N G S P L C
Financial Highlights (continued)
5-year comparison
4
Five-year comparison
2008 2007 2006 2005 200412
US$m US$m US$m US$m US$m For the year Net interest income ................................... 42,563 37,795 34,486 31,334 31,099 Other operating income ............................ 46,008 49,806 35,584 30,370 24,889 Loan impairment charges and other
credit risk provisions ............................ (24,937) (17,242) (10,573) (7,801) (6,191) Total operating expenses .......................... (49,099) (39,042) (33,553) (29,514) (26,487) Profit before tax ........................................ 9,307 24,212 22,086 20,966 18,943 Profit attributable to shareholders of the
parent company .................................... 5,728 19,133 15,789 15,081 12,918 Dividends2 ................................................. 11,301 10,241 8,769 7,750 6,932 At the year-end Called up share capital .............................. 6,053 5,915 5,786 5,667 5,587 Total shareholders’ equity ........................ 93,591 128,160 108,352 92,432 85,522 Capital resources1,13 .................................. 131,460 152,640 127,074 105,449 90,780 Customer accounts .................................... 1,115,327 1,096,140 896,834 739,419 693,072 Undated subordinated loan capital ........... 2,843 2,922 3,219 3,474 3,686 Preferred securities and dated
subordinated loan capital14 ................... 50,307 49,472 42,642 35,856 32,914 Loans and advances to customers15 .......... 932,868 981,548 868,133 740,002 672,891 Total assets ................................................ 2,527,465 2,354,266 1,860,758 1,501,970 1,279,974 US$ US$ US$ US$ US$ Per ordinary share Basic earnings ........................................... 0.47 1.65 1.40 1.36 1.18 Diluted earnings ........................................ 0.47 1.63 1.39 1.35 1.17 Basic earnings excluding goodwill
impairment6 .......................................... 1.36 1.65 1.40 1.36 1.18 Dividends .................................................. 0.93 0.87 0.76 0.69 0.63 Net asset value at year-end16 .................... 7.44 10.72 9.24 8.03 7.66 Share information US$0.50 ordinary shares in
issue (millions) ...................................... 12,105 11,829 11,572 11,334 11,172 % % % % % Financial ratios Dividend payout ratio17
– reported .................................................. 197.9 52.7 54.3 50.7 53.4 – excluding goodwill impairment6 ........... 68.4 52.7 54.3 50.7 53.4
Post-tax return on average total assets ..... 0.26 0.97 1.00 1.06 1.14 Return on average total shareholders’
equity .................................................... 4.7 15.9 15.7 16.8 16.3 Loans and advances to customers as a
percentage of customer accounts ......... 83.6 89.5 96.8 100.1 97.1 Average total shareholders’ equity to
average total assets ............................... 4.87 5.69 5.97 5.96 6.35 Capital ratios1 Tier 1 ratio ................................................ 8.3 9.3 9.4 9.0 8.9 Total capital ratio ...................................... 11.4 13.6 13.5 12.8 12.0 Foreign exchange translation rates to
US$
Closing – £:US$1 ..................................... 0.686 0.498 0.509 0.581 0.517 – €:US$1 ..................................... 0.717 0.679 0.759 0.847 0.733 Average – £:US$1 ..................................... 0.545 0.500 0.543 0.550 0.546 – €:US$1 ..................................... 0.684 0.731 0.797 0.805 0.805
For footnotes, see page 5.

5
Consolidated Financial Statements
The consolidated financial statements of HSBC and the separate financial statements of HSBC Holdings have been prepared in accordance with International Financial Reporting Standards (‘IFRSs’) as issued by the International Accounting Standards Board (‘IASB’) and as endorsed by the European Union (‘EU’). EU-endorsed IFRSs may differ from IFRSs as issued by the IASB if, at any point in time, new or amended IFRSs have not been endorsed by the EU. At 31 December 2008, there were no unendorsed standards effective for the year ended 31 December 2008 affecting these consolidated and separate financial statements, and there was no difference between IFRSs endorsed by the EU and IFRSs issued by the IASB in terms of their application to HSBC. Accordingly, HSBC’s financial statements for the year ended 31 December 2008 are prepared in accordance with IFRSs as issued by the IASB.
HSBC uses the US dollar as its presentation currency because the US dollar and currencies linked to it form the major currency bloc in which HSBC transacts its business. Unless otherwise stated, the information presented in this document has been prepared in accordance with IFRSs.
When reference to ‘underlying’ or ‘underlying basis’ is made in tables or commentaries, comparative information has been expressed at constant currency (see page 23) and adjusted for the effects of acquisitions and disposals. A reconciliation of reported and underlying profit before tax is presented on page 22.
Footnotes to ‘Financial Highlights’
1 The calculation of capital resources, capital ratios and risk-weighted assets for 31 December 2008 is on a Basel II basis. Comparatives are on a Basel I basis.
2 Dividends recorded in the financial statements are dividends per ordinary share declared in a year and are not dividends in respect of, or for, that year. First, second and third interim dividends for 2008, each of US$0.18 per ordinary share, were paid on 9 July 2008, 8 October 2008 and 14 January 2009, respectively. Note 12 on the Financial Statements provides more information on the dividends declared in 2008. On 2 March 2009 the Directors declared a fourth interim dividend for 2008 of US$0.10 per ordinary share in lieu of a final dividend, which will be payable to ordinary shareholders on 6 May 2009 in cash in US dollars, or in pounds sterling or Hong Kong dollars at exchange rates to be determined on 27 April 2009, with a scrip dividend alternative. The reserves available for distribution at 31 December 2008 were US$18,838 million. Quarterly dividends of US$15.50 per 6.20 per cent non-cumulative Series A US dollar preference share, equivalent to a dividend of US$0.3875 per Series A ADS, each of which represents one-fortieth of a Series A dollar preference share, were paid on 17 March 2008, 16 June 2008, 15 September 2008 and 15 December 2008. Quarterly coupons per 8.125 per cent capital securities of US$0.541 and US$0.508 were paid on 15 July 2008 and 15 October 2008 respectively.
3 The definition of return on average invested capital and a reconciliation to the equivalent GAAP measures are set out on page 19. 4 The return on average total shareholders’ equity is defined as profit attributable to shareholders of the parent company divided by
average total shareholders’ equity. 5 The cost efficiency ratio is defined as total operating expenses divided by net operating income before loan impairment charges and
other credit risk provisions. 6 In 2008 an impairment charge of US$10,564 million, to fully write off goodwill in Personal Financial Services in North America, was
reported in total operating expenses. This amount is excluded from total operating expenses to calculate the ratio. 7 Each American Depositary Share (‘ADS’) represents five ordinary shares. 8 Total shareholder return is defined on page 19. 9 The Financial Times Stock Exchange 100 Index. 10 The Morgan Stanley Capital International World Index. 11 The Morgan Stanley Capital International World Bank Index 12 Data for 2004 exclude the provisions of IAS 32, IAS 39 and IFRS 4, which were adopted with effect from 1 January 2005. 13 Capital resources are total regulatory capital, the calculation of which is set out on page 278. 14 Includes perpetual preferred securities, details of which can found in Note 32 on the Financial Statements. 15 Net of impairment allowances. 16 The definition of net asset value per share is total shareholders’ equity, less non-cumulative preference shares and capital securities,
divided by the number of ordinary shares in issue. 17 Dividends per share expressed as a percentage of earnings per share.

H S B C H O L D I N G S P L C
Cautionary Statement Regarding Forward-Looking Statements
Cautionary statement
6
The Annual Report and Accounts 2008 contains certain forward-looking statements with respect to the financial condition, results of operations and business of HSBC.
Statements that are not historical facts, including statements about HSBC’s beliefs and expectations, are forward-looking statements. Words such as ‘expects’, ‘anticipates’, ‘intends’, ‘plans’, ‘believes’, ‘seeks’, ‘estimates’, ‘potential’ and ‘reasonably possible’, variations of these words and similar expressions are intended to identify forward-looking statements. These statements are based on current plans, estimates and projections, and therefore undue reliance should not be placed on them. Forward-looking statements speak only as of the date they are made, and it should not be assumed that they have been revised or updated in the light of new information or future events.
Written and/or oral forward-looking statements may also be made in the periodic reports to the United States Securities and Exchange Commission, summary financial statements to shareholders, proxy statements, offering circulars and prospectuses, press releases and other written materials, and in oral statements made by HSBC’s Directors, officers or employees to third parties, including financial analysts.
Forward-looking statements involve inherent risks and uncertainties. Readers are cautioned that a number of factors could cause actual results to differ, in some instances materially, from those anticipated or implied in any forward-looking statement. These factors include, among others:
• changes in general economic conditions in the markets in which HSBC operates, such as:
– continuing or deepening recessions and fluctuations in employment;
– changes in foreign exchange rates, in both market exchange rates (for example, between the US dollar and pound sterling) and government-established exchange rates (for example, between the Hong Kong dollar and US dollar);
– volatility in interest rates;
– volatility in equity markets, including in the smaller and less liquid trading markets in Asia and Latin America;
– lack of liquidity in wholesale funding markets;
– illiquidity and downward price pressure in national real estate markets, particularly consumer-owned real estate markets;
– the length and severity of current market turmoil;
– the impact of lower than expected investment returns on the funding of private and public sector defined benefit pensions;
– the effect of unexpected changes in actuarial assumptions on longevity which would influence the funding of private and public sector defined benefit pensions; and
– consumer perception as to the continuing availability of credit, and price competition in the market segments served by HSBC.
• changes in government policy and regulation, including:
– the monetary, interest rate and other policies of central banks and other regulatory authorities, including the UK Financial Services Authority, the Bank of England, the Hong Kong Monetary Authority, the US Federal Reserve, the US Securities and Exchange Commission, the US Office of the Comptroller of the Currency, the European Central Bank, the People’s Bank of China and the central banks of other leading economies and markets where HSBC operates;
– expropriation, nationalisation, confiscation of assets and changes in legislation relating to foreign ownership;
– initiatives by local, state and national regulatory agencies or legislative bodies to revise the practices, pricing or responsibilities of financial institutions serving their consumer markets;
– changes in bankruptcy legislation in the principal markets in which HSBC operates and the consequences thereof;
– general changes in government policy that may significantly influence investor decisions, in particular in markets in which HSBC operates, including financial institutions newly taken into state ownership on a full or partial basis;
– extraordinary governmental actions as a result of current market turmoil;

7
– other unfavourable political or diplomatic developments producing social instability or legal uncertainty which in turn may affect demand for HSBC’s products and services;
– the costs, effects and outcomes of regulatory reviews, actions or litigation, including any additional compliance requirements; and
– the effects of competition in the markets where HSBC operates including increased competition from non-bank financial services companies, including securities firms.
• factors specific to HSBC:
– the success of HSBC in adequately identifying the risks it faces, such as the incidence of loan losses or delinquency, and managing those risks (through account management, hedging and other techniques). Effective risk management depends on, among other things, HSBC’s ability through stress testing and other techniques to prepare for events that cannot be captured by the statistical models it uses.
– the success of HSBC in addressing operational, legal and regulatory and litigation challenges.

H S B C H O L D I N G S P L C
Group Chairman’s Statement Group Chairman’s Statement
8
2008 was the most extraordinary year for the global economy and financial services in well over half a century. It marked the first crisis of the era of globalised securitisation. And it also marked the first crisis of the just-in-time global economy as the impact of the financial crisis fed rapidly straight into the performance of the real economy.
Causes of the crisis
The causes of the crisis are complex and interrelated. But we can clearly see that a number of different factors contributed:
• First, the global financial imbalances that arose from the accelerating global economic shift towards emerging markets. The rapid growth of emerging economies created a macro-economic triangle, made up of: the major consumer markets, in particular the US but also a number of other Western economies; major producer nations – notably a number of fast-growing emerging markets which have been manufacturing a vast range of goods for consumption in the West; and resource providers whose wealth of hydrocarbons and other commodities have helped power the producer economies and have thus commanded such high prices until recently. This macro-economic triangle delivered high rates of growth, but also created major financial imbalances as producer nations and resource providers accumulated massive reserves whilst the US and other consumer markets ran significant and growing deficits.
• Second, cheap credit. A large proportion of the accumulated savings of the producers and resource providers was invested in the world’s reserve currency, the US dollar, keeping rates
low. This cheap money fuelled a consumer boom and rising house prices. It encouraged increased borrowing by banks and by their customers, fuelling asset price bubbles particularly in housing markets. Loose monetary conditions in the US and in much of the emerging world gave added strength to this already potent cocktail.
• Third, securitisation based on overly complex product structures. The complexity and opacity of certain financial instruments reached a point where even senior and experienced bankers and professional investors had trouble understanding them. This meant that people were selling and buying assets whose risks they had not properly assessed.
• And finally, excessive gearing. Many banks became overgeared and too dependent on wholesale funding, which they assumed, incorrectly, would never dry up. Assets were created on the back of ever higher leverage, both direct and indirect. And when the securitisation market began to collapse, banks found themselves with assets that they could neither sell nor fund, so forcing large losses on the asset side and a funding challenge on the liability side for which they were entirely unprepared.
The result has been unprecedented stress in the financial system, and it has led to a major breakdown in trust. In many countries, huge support from taxpayers has been required in order to stabilise the system.
Failings in the banking industry
The industry has done many things wrong. It is important to remember that many ordinary bankers have always sought to provide good service to their customers; but we must also recognise that there have been too many who have profoundly damaged the industry’s reputation.
Inappropriate products were sold inappropriately by many. Compensation practices ran out of control and perverse incentives led to dangerous outcomes. There is genuine and widespread anger that the contributors to the crisis were in some cases amongst the biggest beneficiaries of the system.
Underlying all these events is a question about the culture and ethics of the industry. It is as if, too often, people had given up asking whether something was the right thing to do, and focused only whether it was legal and complied with the rules. The industry needs to recover a sense of what

9
is right and suitable as a key impulse for doing business.
HSBC strategy intact
We at HSBC were not immune from the crisis. But we have built our business on very strong foundations and are able to report results which demonstrate our ability to withstand the storm.
Our strategy has been tested and remains intact. We will continue to build our business by focusing on faster-growing markets around the world and on businesses where international connectivity is important – all from a position of financial strength. If anything, the current crisis validates our renewed focus over the last few years on fast-growing economies, since it will accelerate the shift in the world’s centre of economic gravity from west to east.
Our robust balance sheet and liquidity means that we have continued to lend. In 2008, we grew our lending to commercial customers by 10 per cent on an underlying basis. Lending to personal customers increased in all regions except North America. And our brand strength continues to underpin our performance. It was noticeable that, at times of stress in many markets, HSBC was a beneficiary of funds flowing in. Recently, the HSBC brand was recognised as the number one brand in banking by Brand Finance.
Profitable from a broad-based earnings platform
Excluding the goodwill impairment on our North America Personal Financial Services business, HSBC reported a pre-tax profit for 2008 of US$19.9 billion, a decline of 18 per cent. On a reported basis, pre-tax profit was US$9.3 billion, down 62 per cent. Within this were some strong regional and business line performances. However, there is one area on which I would like to comment.
For North America, we reported a loss of US$15.5 billion including the goodwill impairment charge of US$10.6 billion in Personal Financial Services. The significant deterioration in US employment and economic outlook in the fourth quarter of 2008 were the primary factors in causing us to write off all the remaining goodwill carried on our balance sheet in respect of our Personal Financial Services business in North America.
The management team has worked tirelessly to address this problem acquisition in the US and we have considered all viable options. We saw the disruption in sub-prime lending as early as 2006 and
sharply scaled back in 2007 while others continued to grow. We also devoted considerable resources to helping our customers. Virtually no one then foresaw the subsequent scale of the deterioration in the US economy and financial markets. It is now clear that models of direct personal lending that depend on wholesale markets for funding are no longer viable. In light of this, we have taken the difficult decision that, with the exception of credit cards, we will write no further consumer finance business through the HFC and Beneficial brands in the US and close the majority of the network. Thus, in terms of new business, we are drawing a line and we will run off our existing business, providing all necessary support to HSBC Finance to enable it to do so in a measured way and meet all its commitments.
HSBC has a reputation for telling it as it is. With the benefit of hindsight, this is an acquisition we wish we had not undertaken.
The US remains the world’s largest economy and HSBC remains committed to the US, which we see as a core market for HSBC. HSBC Bank in the US is not affected by the restructure. In the immediate future we will focus on those businesses and customers for whom our global connectivity gives us advantage – primarily in corporate and commercial business, and in Private and Premier banking.
Performance overview and strategic activity
In this difficult environment, we missed our profitability targets. We hit our capital target with our tier 1 ratio at 8.3 per cent. We maintained a very conservative advances-to-deposits ratio at 84 per cent. We grew lending in each region outside North America on an underlying basis. And we constrained costs, with the cost efficiency ratio improving to 47.2 per cent, excluding the goodwill impairment mentioned above. We also continued implementation of OneHSBC, our programme to enhance customer experience and improve cost efficiency through standardising products, processes and technology around the world.
We also acquired businesses in strategic areas – we acquired the assets, liabilities and operations of The Chinese Bank in Taiwan in March; IL&FS Investsmart, a retail brokerage in India in May; and, in October, the acquisition of Bank Ekonomi in Indonesia was announced. The first two are complete and being integrated, the last is expected to be completed in the second quarter. The most notable disposal was the sale of our regional bank network in France for a consideration of US$3.2 billion.

H S B C H O L D I N G S P L C
Group Chairman’s Statement (continued) Group Chairman’s Statement
10
Thank you to our people
This was an extraordinary year and made extraordinary demands on many of our people. I want to express my sincere thanks for all their efforts and achievements. Our industry has rightly been under considerable public scrutiny and banks have been indiscriminately bunched together. It is through our staff that HSBC’s distinctive character stands out for our customers and it is they who ensure that not all banks are the same.
Dividend declaration and progressive dividend policy
The Directors have declared a fourth interim dividend for 2008 of US$0.10 per ordinary share (in lieu of a final dividend) which, together with the first three interim dividends for 2008 of US$0.18 already paid, will make a total distribution in respect of the year of US$0.64 per ordinary share. The payments in total represent a decrease of 29 per cent in US dollar terms compared with 2007 and of 15 per cent in sterling terms. The dividend will be payable on 6 May 2009 to shareholders on the register at the close of business on 20 March 2009.
After 15 years of double-digit dividend growth, we did not make the decision to lower the dividend lightly. Very careful consideration was given to the current operating environment and the increased uncertainty over both the supply of capital required in an increasingly volatile financial world and a pro-cyclical regulatory capital framework.
For 2009, HSBC has rebased the envisaged dividend per share for the first three interim dividends to US$0.08 to reflect the impact of the enlarged ordinary share capital following the Rights Issue we are announcing today, prevailing business conditions and capital requirements. The dividend payments remain substantial and reflect management’s long-term confidence in the business. HSBC will continue to aim to pay progressive dividends in line with the long-term growth of the business.
Maintaining HSBC’s financial strength
The logic of maintaining HSBC’s distinctive financial strength which we have applied to our dividend also applies to our capital position. We have announced today a Rights Issue to strengthen further our capital ratios. We propose to raise, on a fully underwritten basis, approximately US$17.7 billion of equity which will increase our capital ratios by 150 basis points, strengthening the core equity tier 1 ratio to 8.5 per cent and the tier 1 ratio to 9.8 per cent, both on a pro forma basis as at
31 December 2008. I shall be writing to all shareholders with full details.
Over the past 12 months, many of our competitors have received significant government capital injections – something we said we could not envisage – or have raised capital from shareholders and other investors. Higher regulatory capital requirements, in part from the effect of the economic downturn on capital requirements under the Basel II regime, as well as changing market sentiment on appropriate levels of leverage, have also raised expectations regarding capital levels. We are determined that HSBC should maintain its signature financial strength and we are now raising the top of our target range for the tier 1 ratio so that the range will be from 7.5 per cent to 10 per cent.
Planned internal capital generation remains strong and this capital raising will enhance our ability to deal with the impact of an uncertain economic environment and to respond to unforeseen events. Importantly, it will also give us options with respect to opportunities which we believe will present themselves to those with superior financial strength. These may involve organic investment in the continued taking of market share from more capital constrained competitors. There may also be opportunities to grow through targeted acquisitions by taking advantage of attractive valuations where the opportunities in question align with our strategy and the risks are understood.
Culture and compensation
We believe in the profound importance of culture and ethics in business. HSBC’s longstanding traditions of financial strength, long-term customer relationships and conservative management are as important today as ever. They have not always been fashionable and we have not always been perfect. One of the consequences of the crisis – and rightly – is that we are going to see a fundamental re-evaluation of the rules and regulations that govern our business. But we should remember that no amount of rules and regulations will be sufficient if the culture does not encourage people to do the right thing. It is the responsibility of Boards to supervise and management to embed a sustainable culture into the very fibre of the organisation. For HSBC, there is nothing more important.
We also intend to play our part in rebuilding public trust in our industry. This means we must be willing to take part in and shape the debate on how our industry should evolve in the coming years, based on the lessons which must be learnt from this crisis. In particular, we strongly believe that the

11
industry must respond to the requirement for a more sober and reasonable approach to compensation. At HSBC, we are committed to the principle of sensible market-related pay, structured to align executive actions with long-term shareholder interests. A small number of individuals in a market system will inevitably receive compensation that is high in absolute terms, but this must be genuinely linked to long-term shareholder interests. It is clear that the banking industry got it wrong in the go-go years: we will play our part in helping the industry respond appropriately to the new realities.
It is right therefore that in HSBC’s case, I outline our present position. As Chairman I elected in 2007 to no longer receive any cash bonus award; any variable compensation would be delivered through performance share awards – which would only vest if performance hurdles are met. And no performance share awards will be made in the Group in respect of 2008. Mike Geoghegan, Group Chief Executive, and Stuart Gulliver, Chief Executive Global Banking and Markets, and Douglas Flint, Group Finance Director, have asked the Remuneration Committee not to consider them for any bonus award for 2008. No cash bonus award will be made to any Executive Director for 2008. Full details on Directors’ remuneration can be found in the Annual Report.
Learning the lessons
We are living through a genuinely global crisis; it cannot be solved by one nation alone. Governments need to work together with our industry to tackle the root causes of the crisis, while maintaining the open, globalised markets that have helped spread prosperity in the last two decades. Protectionism, both in trade and in capital flows, is a threat and in all its forms must be resisted.
We must also urgently improve governance and regulation to create a more stable financial framework. The globalisation of financial markets contrasts sharply with the domestic agenda of the regulatory regimes that underpin it. We support intergovernmental efforts to enhance the coordination of regulatory oversight, since we believe that this is essential to the stable development of the international capital markets for the benefit of the common good.
Continued economic strain
The coming twelve months will be difficult. We expect parts of Asia, the Middle East and Latin America to continue to outperform Western economies, but to be constrained by the global downturn.
We see unemployment rising through 2009 into 2010 in both the US and the UK, together with continuing declines in housing markets. We should remember that the US is the driver of the global economy and global growth depends on the US recovery.
We remain confident that HSBC is well-placed in today’s environment and that our strength leads to opportunity. Our strategy has served HSBC well and positions it for long-term growth with attractive returns. HSBC continues to combine its position as the world’s leading emerging markets bank with an extensive international network across both developed and faster growing markets. At the same time, as the financial system exhibits stress, our competitive position is improving as the capacity and capabilities of financial institutions are constrained by lack of capital and funding; many of them are also focusing more on their domestic markets.
Further strengthening our capital base will enhance our ability to deal with the impact of an uncertain economic environment and to respond to unforeseen events, as well as giving us options regarding opportunities which will undoubtedly present themselves to those with superior financial strength.
S K Green, Group Chairman 2 March 2009

H S B C H O L D I N G S P L C
Report of the Directors: Operating and Financial Review
Principal activities / Strategic direction / Challenges and uncertainties
12
Principal activities
HSBC is one of the largest banking and financial services organisations in the world, with a market capitalisation of US$114 billion at 31 December 2008.
Through its subsidiaries and associates, HSBC provides a comprehensive range of banking and related financial services. Headquartered in London, HSBC operates through long-established businesses and has an international network of some 10,000 properties in 86 countries and territories in five geographical regions: Europe; Hong Kong; Rest of Asia-Pacific, including the Middle East and Africa; North America and Latin America. Within these regions, a comprehensive range of financial services is offered to personal, commercial, corporate, institutional, investment and private banking clients. Services are delivered primarily by domestic banks, typically with large retail deposit bases, and consumer finance operations. Taken together, the five largest customers of HSBC do not account for more than one per cent of HSBC’s income.
There were no significant acquisitions during the year (for details of acquisitions see page 418). HSBC disposed of its seven French regional banks for US$3.2 billion in July 2008 (see page 418).
Strategic direction
HSBC’s strategic direction reflects its position as ‘The world’s local bank’, combining the largest global emerging markets banking business and a uniquely cosmopolitan customer base with an extensive international network and substantial financial strength.
The Group’s strategy is aligned with key trends which are shaping the global economy. In particular, HSBC recognises that, over the long term, developing markets are growing faster than the mature economies, world trade is expanding at a greater rate than gross domestic product and life expectancy is lengthening virtually everywhere. Against this backdrop, HSBC’s strategy is focused on delivering superior growth and earnings over time by building on the Group’s heritage and skills. Its origins in trade in Asia have had a considerable influence over the development of the Group and, as a consequence, HSBC has an established and longstanding presence in many countries. The combination of local knowledge and international breadth is supported by a substantial financial capability founded on balance sheet strength, largely attributable to the scale of the Group’s retail deposit bases.
HSBC is, therefore, continuing to invest primarily in the faster growing markets and, in the more developed markets, by focusing on businesses which have international connectivity. Central to these reshaping activities is a policy of maintaining HSBC’s capital strength and strong liquidity position.
The Group has identified three main business models for its customer groups and global businesses that embody HSBC’s areas of natural advantage:
• businesses with international customers for whom developing markets connectivity is crucial – Global Banking and Markets, Private Banking, the large business segment of Commercial Banking and the mass affluent segment of Personal Financial Services;
• businesses with local customers where efficiency can be enhanced through global scale – the small business segment of Commercial Banking and the mass market segment of Personal Financial Services; and
• products where global scale is possible through building efficiency, expertise and brand – global product platforms such as global transaction banking.
The means of executing the strategy, and further utilising the linkages within the Group, are clear:
• the HSBC brand and global networks will be leveraged to reach new customers and offer further services to existing clients;
• efficiency will be enhanced by taking full advantage of local, regional and global economies of scale, in particular by adopting a common systems architecture wherever possible; and
• objectives and incentives will be aligned to motivate and reward staff for being fully engaged in delivering the strategy.
Challenges and uncertainties
Current economic and market conditions may adversely affect HSBC’s results
The global economy has entered the most severe downturn for 80 years, with the financial services industry facing extraordinary turbulence. A shortage of liquidity, lack of funding, pressure on capital and extreme price volatility across a wide range of asset classes are putting financial institutions under considerable pressure. This is leading governments and central banks to undertake unprecedented intervention designed to stabilise the global and

13
domestic financial systems, to stimulate new lending and to support systemically important institutions at risk of failing. Many developed economies have entered recession and growth has slowed in many emerging countries, with serious adverse consequences for asset values, employment, consumer confidence and levels of economic activity. Commodity prices have significantly retrenched, in many cases from recent historical highs, interest rate yield curves have flattened, interest rates have fallen in absolute terms and trade flows have contracted. Global equity markets have experienced severe declines and various currencies, including sterling, have depreciated significantly against the US dollar. Emerging markets have suffered as portfolio investments have been repatriated and cross-border inter-bank funding has been withdrawn. Numerous governments and central banks have responded by proposing programmes to make substantial funds and guarantees available to boost liquidity and confidence in their financial systems, as well as cutting taxes and lowering interest rates. It is not known whether these responses will be effective in addressing the severe economic and market conditions or whether recently proposed measures will be implemented as initially proposed.
HSBC’s earnings are affected by global and local economic and market conditions. Dramatic declines in 2007 and 2008 in the housing markets in the US, the UK and elsewhere have combined with increasing unemployment to affect negatively the credit performance of real estate-related exposures, resulting in significant write-downs of asset values by financial institutions, including HSBC. These write-downs, initially of asset-backed securities but spreading to other securities and loans, have caused many financial institutions to seek additional capital, to reduce or eliminate dividends, to merge with larger and stronger competitors or, in some cases, to fail.
A worsening of these conditions may exacerbate the impact of these difficult market conditions on HSBC and other financial institutions and could have an adverse effect on HSBC’s operating results. In particular, the Group may face the following challenges in connection with these events:
• HSBC’s ability to assess the creditworthiness of its customers or to estimate the values of its assets may be impaired if the models and techniques it uses become less accurate in their predictions of future behaviour, valuations or estimates. The process HSBC uses to estimate losses inherent in its credit exposure or assess the value of certain assets requires difficult,
subjective and complex judgements. These include forecasts of economic conditions and how predicted economic scenarios might impair the ability of HSBC’s borrowers to repay their loans or might affect the value of assets. As a consequence, this process may be less capable of making accurate estimates which, in turn, may undermine the reliability of the process.
• The demand for borrowing from creditworthy customers may diminish as economic activity slows.
• Lower interest rates will reduce net interest income earned by HSBC on its excess deposits.
• HSBC’s ability to borrow from other financial institutions or to engage in funding transactions on favourable terms, or at all, could be adversely affected by further disruption in the capital markets or deteriorating investor sentiment.
• Market developments may affect consumer confidence and may cause declines in credit card usage and adverse changes in payment patterns, leading to increases in delinquencies and default rates, write-offs and loan impairment charges beyond HSBC’s expectations.
• Loan impairment allowances and write-offs are likely to rise as a result of a deterioration in payment patterns and increased delinquencies and default rates caused by weakening consumer confidence and increased business failures. A worsening of these economic factors may exacerbate the adverse effects of these difficult market conditions on HSBC and others in the financial services industry.
• HSBC expects to face increased regulation and supervision of the financial services industry, following new or proposed regulatory measures in countries in which it operates.
• Trade and capital flows may further contract as a result of protectionist measures being introduced in certain markets.
• Increased government ownership and control over financial institutions and further consolidation in the financial industry, which could significantly alter the competitive landscape.
As a worldwide financial institution, HSBC is exposed to these developments across all its businesses, both directly and through their impact on its customers and clients. Local variations exist, however, reflecting regional circumstances and

H S B C H O L D I N G S P L C
Report of the Directors: Operating and Financial Review (continued)
Challenges and uncertainties
14
presenting challenges to HSBC which are specific to those areas.
Europe
In the UK, the economy has entered recession and the currency has fallen in value against the US dollar, the yen and the euro. Changes in the marketplace are emerging following the part-nationalisation of some major financial institutions, and political interaction with the regulatory environment is becoming more frequent as the government seeks to stimulate lending to preserve economic activity. A period of low interest rates will reduce deposit spreads and HSBC’s retail business model will be more dependent on transactional fees and lending margin. Pension funding requirements, in particular for UK defined benefit schemes, will place increased financing demands on corporates, which may lead to unfunded commitments being drawn down, adding to pressure on system liquidity. The recent deterioration in credit quality is expected to continue as the economy contracts, with loan impairment charges rising as a result. Market volatility is also expected to continue.
In France, changes in the marketplace are slowly emerging following government measures to stimulate lending and preserve economic activity. A period of low interest rates will not adversely impact spreads in the short-term but will have an adverse effect in later years. HSBC’s retail business model is dependent on banking fees to maintain profitability and a recovery in financial markets is necessary in order to enhance brokerage and management fees and stimulate fund management activities. Deterioration in credit quality is expected to continue as the economy contracts, with commercial loan impairment charges rising as a result. Personal loan impairment charges are expected to remain at around current levels unless there is a very deep recession.
Conditions are likely to remain difficult in a number of markets in which HSBC currently trades and volatility is expected to continue.
Hong Kong and Rest of Asia-Pacific
In Asia-Pacific, a prolonged period of low interest rates is expected which will put pressure on HSBC’s net interest income from its strong deposit base. With capital market and currency volatility endemic, customers are likely to seek capital protection and become increasingly rate and risk sensitive, seeking out products which offer deposit insurance and government guarantees. Regulatory reforms in the areas of wealth management product complexity,
sales requirements and liquidity and reserve ratios are likely, and these will lead to a higher cost of compliance, greater standardisation and slower product approvals. International trade is expected to continue to contract, affecting import and export volumes and reducing HSBC’s earnings from trade financing. The quality of the asset book will deteriorate if economic factors beyond HSBC’s control do not improve, reducing customer credit ratings and, as a consequence, increasing risk- weighted asset allocations and capital requirements. This could be exacerbated if capital continues to be repatriated from emerging markets to more developed economies to take advantage of lower asset prices, adversely affecting emerging markets’ balance of payments and foreign exchange reserves. However, Asia is expected to adapt quickly to secure recovery from the global recession, led by mainland China and India.
The fall in global demand for oil products and related prices, and the contraction in financial surpluses held by key oil-producing countries following the declines in capital markets, will reduce the ability of some countries in the Middle East to maintain spending, borrowing and investment domestically and internationally. This will result in the cancellation or postponement of infrastructure projects which, together with weakening property prices, is expected to reduce both credit cover and revenue streams for financial institutions. The availability of economically priced, long-term funding is likely to contract. Business activity and private investment will also slow as consumer confidence declines. These factors will combine to place pressure on net revenues and on capital requirements.
North America
In the US, the steep decline in the housing market, with falling home prices and increasing foreclosures, and rising unemployment have resulted in significant write-downs of loans and advances and mortgage-backed securities. The effect of these write-downs subsequently spread to other capital market activities, leading many financial institutions to seek additional capital, merge with larger and stronger institutions and, in some cases, fail. Many lenders reduced or stopped providing funding to borrowers, including to other financial institutions. This market turmoil and resultant tightening of credit have led to an increased level of delinquencies, a fall in consumer confidence, increased market volatility and a widespread reduction in business activity in general. To date, various government intervention measures designed to stabilise the markets, including
15
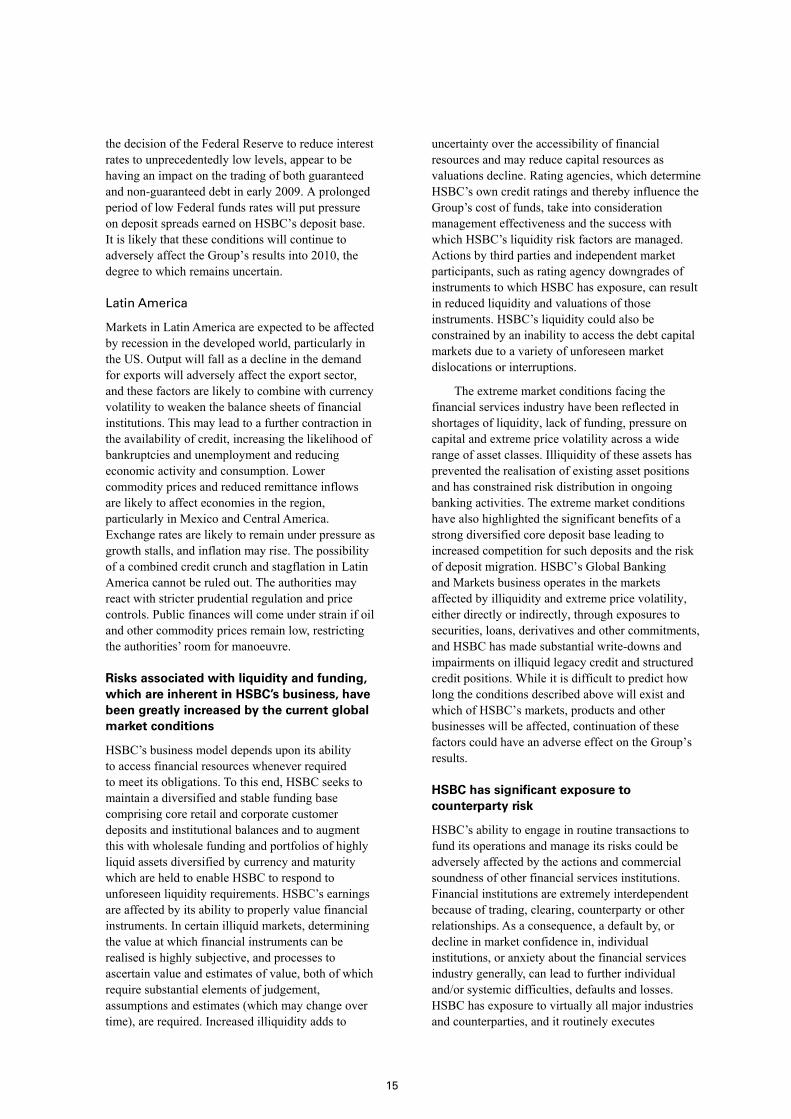
the decision of the Federal Reserve to reduce interest rates to unprecedentedly low levels, appear to be having an impact on the trading of both guaranteed and non-guaranteed debt in early 2009. A prolonged period of low Federal funds rates will put pressure on deposit spreads earned on HSBC’s deposit base. It is likely that these conditions will continue to adversely affect the Group’s results into 2010, the degree to which remains uncertain.
Latin America
Markets in Latin America are expected to be affected by recession in the developed world, particularly in the US. Output will fall as a decline in the demand for exports will adversely affect the export sector, and these factors are likely to combine with currency volatility to weaken the balance sheets of financial institutions. This may lead to a further contraction in the availability of credit, increasing the likelihood of bankruptcies and unemployment and reducing economic activity and consumption. Lower commodity prices and reduced remittance inflows are likely to affect economies in the region, particularly in Mexico and Central America. Exchange rates are likely to remain under pressure as growth stalls, and inflation may rise. The possibility of a combined credit crunch and stagflation in Latin America cannot be ruled out. The authorities may react with stricter prudential regulation and price controls. Public finances will come under strain if oil and other commodity prices remain low, restricting the authorities’ room for manoeuvre.
Risks associated with liquidity and funding, which are inherent in HSBC’s business, have been greatly increased by the current global market conditions
HSBC’s business model depends upon its ability to access financial resources whenever required to meet its obligations. To this end, HSBC seeks to maintain a diversified and stable funding base comprising core retail and corporate customer deposits and institutional balances and to augment this with wholesale funding and portfolios of highly liquid assets diversified by currency and maturity which are held to enable HSBC to respond to unforeseen liquidity requirements. HSBC’s earnings are affected by its ability to properly value financial instruments. In certain illiquid markets, determining the value at which financial instruments can be realised is highly subjective, and processes to ascertain value and estimates of value, both of which require substantial elements of judgement, assumptions and estimates (which may change over time), are required. Increased illiquidity adds to
uncertainty over the accessibility of financial resources and may reduce capital resources as valuations decline. Rating agencies, which determine HSBC’s own credit ratings and thereby influence the Group’s cost of funds, take into consideration management effectiveness and the success with which HSBC’s liquidity risk factors are managed. Actions by third parties and independent market participants, such as rating agency downgrades of instruments to which HSBC has exposure, can result in reduced liquidity and valuations of those instruments. HSBC’s liquidity could also be constrained by an inability to access the debt capital markets due to a variety of unforeseen market dislocations or interruptions.
The extreme market conditions facing the financial services industry have been reflected in shortages of liquidity, lack of funding, pressure on capital and extreme price volatility across a wide range of asset classes. Illiquidity of these assets has prevented the realisation of existing asset positions and has constrained risk distribution in ongoing banking activities. The extreme market conditions have also highlighted the significant benefits of a strong diversified core deposit base leading to increased competition for such deposits and the risk of deposit migration. HSBC’s Global Banking and Markets business operates in the markets affected by illiquidity and extreme price volatility, either directly or indirectly, through exposures to securities, loans, derivatives and other commitments, and HSBC has made substantial write-downs and impairments on illiquid legacy credit and structured credit positions. While it is difficult to predict how long the conditions described above will exist and which of HSBC’s markets, products and other businesses will be affected, continuation of these factors could have an adverse effect on the Group’s results.
HSBC has significant exposure to counterparty risk
HSBC’s ability to engage in routine transactions to fund its operations and manage its risks could be adversely affected by the actions and commercial soundness of other financial services institutions. Financial institutions are extremely interdependent because of trading, clearing, counterparty or other relationships. As a consequence, a default by, or decline in market confidence in, individual institutions, or anxiety about the financial services industry generally, can lead to further individual and/or systemic difficulties, defaults and losses. HSBC has exposure to virtually all major industries and counterparties, and it routinely executes

H S B C H O L D I N G S P L C
Report of the Directors: Operating and Financial Review (continued)
Challenges and uncertainties / KPIs
16
transactions with counterparties in financial services, including brokers and dealers, commercial banks, investment banks, mutual and hedge funds, and other institutional clients. Many of these transactions expose HSBC to credit risk in the event of default by its counterparty or client. Where counterparty risk has been mitigated by taking collateral, HSBC’s credit risk may be exacerbated if the collateral it holds cannot be realised or has to be liquidated at prices which are insufficient to recover the full amount of its loan or derivative exposure. The failure of one of HSBC’s counterparties could have an adverse effect on its results.
HSBC operates in a highly competitive environment, and competition could intensify as a result of current global market conditions
Consolidation in the financial services industry is increasingly concentrating activity in companies that are capable of offering a wide array of financial products at competitive prices, with globalisation exposing HSBC to competition in capital markets and financial services at global and local levels alike. In addition, technological advances, the growth of e-commerce, regulatory developments and public sector participation or guarantees have made it possible for non-depository institutions to offer products and services that traditionally were the preserve of banks. The prominence in recent years of sovereign wealth funds, private equity and hedge funds as alternative sources of funding – which has increased competition for traditional financial institutions – may ease as investors seek safer, more traditional alternatives. Competition may further intensify or the competitive landscape may change as the consolidation of financial services companies continues and others are brought into part or full public ownership in response to the current market conditions. HSBC’s ability to grow its businesses, and therefore its earnings, is affected by these competitive pressures and is dependent on HSBC’s ability to attract and retain talented and dedicated employees.
HSBC is subject to political and economic risks in the countries in which it operates
HSBC operates through an international network of subsidiaries and affiliates in 86 countries and territories around the world. Its results are therefore subject to the risk of loss from unfavourable political developments, currency fluctuations, social instability and change in government policies on such matters as expropriation, authorisations, international ownership, interest-rate caps, limits
on dividend flows and tax in the jurisdictions in which it operates. These factors may also negatively affect revenues from the trading of securities and investment in securities, the effect being accentuated through certain international trading markets, particularly those in emerging market countries, being typically smaller, less liquid and more volatile than developed trading markets. HSBC’s subsidiaries’ and affiliates’ ability to pay dividends could be restricted by changes to official banking measures, exchange controls and other requirements. Because HSBC prepares its accounts in US dollars, while a substantial part of its assets, liabilities, assets under management, revenues and expenses are denominated in other currencies, changes in foreign exchange rates have an effect on its reported income and shareholders’ equity. For a detailed discussion of global and regional factors that impact the results of HSBC’s operations, see page 12.
Operational risks are inherent in HSBC’s business
HSBC is exposed to many types of operational risk, including fraudulent and other criminal activities (both internal and external), breakdowns in processes or procedures and systems failure or non-availability. HSBC is also subject to the risk of disruption of its business arising from events that are wholly or partially beyond its control (for example natural disasters, acts of terrorism, epidemics and transport or utility failures) which may give rise to losses in service to customers and/or economic loss to HSBC. All of these risks are also applicable where HSBC relies on outside suppliers or vendors to provide services to it and its customers.
HSBC is subject to legal risks, which have an adverse effect on the Group’s reputation
The risks to HSBC’s reputation arise from a variety of sources with the potential to cause harm to the Group and its ability to operate. These issues require the Group to deal appropriately with potential conflicts of interest; legal and regulatory requirements; ethical issues; anti-money laundering laws or regulations; privacy laws; information security policies; sales and trading practices; and the conduct of companies with which it is associated. Failure to address these issues appropriately may give rise to additional legal and compliance risk to HSBC, with an increase in the number of litigation claims and the amount of damages asserted against HSBC, or subject HSBC to regulatory enforcement actions, fines or penalties.

17
Increased regulation of the financial services industry could have an adverse effect on HSBC’s operations
HSBC, its subsidiaries and its affiliates are subject to extensive and increasing regulation, accounting standards and interpretations thereof and legislation in the various countries in which the Group operates. From time to time, new laws are introduced, including tax, consumer protection, privacy and other legislation, which affect the operating environment in which the Group operates. As a result of the recent interventions by governments in response to global economic conditions, it is widely expected that there will be a substantial increase in government regulation and supervision of the financial services industry, including the imposition of higher capital requirements and restrictions on certain types of transaction structure. If enacted, such new regulations could require additional capital to be injected into HSBC’s subsidiaries and affiliates, require HSBC to enter into business transactions that are not otherwise part of its current Group strategy, prevent HSBC from continuing current lines of operations, restrict the type or volume of transactions HSBC may enter into, limit HSBC’s subsidiaries’ and affiliates’ ability to declare dividends to HSBC, or set limits on or require the modification of rates or fees that HSBC charges on certain loan or other products. HSBC may also face increased compliance costs and limitations on its ability to pursue business opportunities. Separately, the Basel II Accord’s requirement for financial institutions to increase their capital ratios in response to deteriorating market conditions may have secondary effects on lending, which could exacerbate the current market downturn. These measures, alone or in combination, could have an adverse effect on HSBC’s operations.
In the UK for example, the recent Banking Bill includes a ‘Special Resolutions Regime’ which gives wide powers in respect of UK banks and their parent companies to the UK Treasury, the FSA and the Bank of England in circumstances where any such UK bank has encountered, or is likely to encounter, financial difficulties.
HSBC is subject to tax-related risks in the countries in which it operates, which could have an adverse effect on its operating results
HSBC is subject to the substance and interpretation of tax laws in all countries in which it operates.
A number of double taxation agreements entered into between countries also affect the taxation of the Group. Tax risk is the risk associated with changes in tax law or in the interpretation of tax law. It also includes the risk of changes in tax rates and the risk of consequences arising from failure to comply with procedures required by tax authorities. Failure to manage tax risks could lead to increased tax charges, including financial or operating penalties, for not complying as required with tax laws.
Key performance indicators
The Board of Directors and the Group Management Board monitor HSBC’s progress against its strategic objectives. Progress is assessed by comparison with the Group’s strategy, its operating plan targets and its historical performance using both financial and non-financial measures.
As a prerequisite for the vesting of Performance Shares, the Remuneration Committee must satisfy itself that HSBC Holdings’ financial performance has shown a sustained improvement in the period since the award date. In determining this, the Remuneration Committee will take account of all relevant factors but in particular comparisons against the total shareholder return (‘TSR’) comparator group with regard to the financial key performance indicators (‘KPIs’) described below.
Financial KPIs
To support the Group’s strategy and ensure that HSBC’s performance can be monitored, management utilises a number of financial KPIs. The table below presents these KPIs for the period from 2004 to 2008. At a business level, the KPIs are complemented by a range of benchmarks which are relevant to the planning process and to reviewing business performance.
HSBC has published a number of key targets against which future performance can be measured. Financial targets have been set as follows: the return on average total shareholders’ equity over the medium term has been set at 15-19 per cent; the cost efficiency ratio has been set in the range of 48-52 per cent; and the TSR in the top half of that achieved by peers. The cost efficiency ratio has been set as a range within which the business is expected to remain in order to accommodate the need for continued investment in support of future business growth.

H S B C H O L D I N G S P L C
Report of the Directors: Operating and Financial Review (continued) KPIs
18
Financial KPIs – trend analysis
2008 2007 2006 2005 2004 % % % % %
Revenue growth1 ..................................................................... 3.4 20.8 13.4 12.2 – Revenue mix2
Net interest income ............................................................. 52.1 47.8 52.8 54.4 60.6Net fee income .................................................................... 24.5 27.9 26.3 25.1 25.2Other income3 ..................................................................... 23.4 24.3 20.9 20.5 14.2
Cost efficiency4 – reported ............................................................................ 60.1 49.4 51.3 51.2 51.6 – excluding goodwill impairment ...................................... 47.2 49.4 51.3 51.2 51.6
Credit performance as measured by risk adjusted margin5 .... 4.8 6.0 6.3 6.3 6.8 Return on average invested capital6 ....................................... 4.0 15.3 14.9 15.9 15.0 Dividends per share growth7 ................................................... (28.9) 11.1 11.0 10.6 10.0 Basic earnings per ordinary share8
– reported (US$) ................................................................. 0.47 1.65 1.40 1.36 1.18 – excluding goodwill impairment (US$) ........................... 1.36 1.65 1.40 1.36 1.18
Return on average total shareholders’ equity9 ........................ 4.7 15.9 15.7 16.8 16.3 Over Over Over 1 year 3 years 5 years Total shareholder return HSBC TSR ........................... 84.5 84.5 98.5 Benchmarks:
– FTSE 100 ...................... 71.7 88.1 118.3 – MSCI World ................. 81.8 93.6 123.7 – MSCI Banks ................. 63.0 60.8 82.7
1 The percentage increase in net operating income before loan impairment and other credit risk charges since the previous year. 2 As a percentage of net operating income before loan impairment charges and other credit risk provisions. 3 Other income comprises net operating income before loan impairment charges and other credit risk provisions less net interest income
and net fee income. 4 Total operating expenses divided by net operating income before loan impairment and other credit risk charges. 5 Net operating income divided by average risk-weighted assets. 6 Profit attributable to ordinary shareholders divided by average invested capital. 7 The percentage increase in dividends per share since the previous year, based on the dividends paid in respect of the year to which the
dividend relates. 8 Basic earnings per ordinary share is defined in Note 13 on the Financial Statements. 9 The return on average total shareholders’ equity is defined as profit attributable to shareholders of the parent company divided by the
average total shareholders’ equity.
Revenue growth provides an important guide to the Group’s success in generating business. In 2008, total revenue grew by 3.4 per cent to US$81.7 billion, 2.1 per cent on an underlying basis, reflecting the resilience of HSBC’s income generating capabilities in these exceptionally difficult economic circumstances.
Revenue mix represents the relative distribution of revenue streams between net interest income, net fee income and other revenue. It is used to understand how changing economic factors affect the Group, to highlight dependence on balance sheet utilisation for income generation and to indicate success in cross-selling fee-based services to customers with loan facilities. This understanding assists management in making business investment decisions. Comparison of the revenue mix between 2005 and 2007 shows a trend of net fee income increasing at a faster rate than net interest income. This trend has been reversed in 2008 as net fee income’s contribution fell by 3.4 percentage points
mainly due to lower fees on cards and equity-related products.
Cost efficiency is a relative measure that indicates the consumption of resources in generating revenue. Management uses this to assess the success of technology utilisation and, more generally, the productivity of the Group’s distribution platforms and sales forces. The cost efficiency ratio for 2008 deteriorated by 10.7 percentage points to 60.1 per cent. This included writing off goodwill in the US. Excluding this, the cost efficiency ratio improved by 2.2 percentage points to 47.2 per cent as income grew faster than costs.
Credit performance as measured by risk-adjusted margin is an important gauge for assessing whether credit is correctly priced so that the returns available after recognising impairment charges meet the Group’s required return parameters. The ratio for 2008 was 4.8 per cent, showing a decline of 1.2 percentage points over 2007, as loan impairment

19
charges rose at a faster rate than income on higher average risk-weighted assets.
Return on average invested capital measures the return on the capital investment made in the business, enabling management to benchmark HSBC against competitors. In 2008, the ratio of 4.0 per cent was 11.3 percentage points lower than that reported in 2007. This decrease reflected the decline in profit driven by goodwill impairment, the significant increase in loan impairment charges, write-downs in credit trading, leveraged and acquisition finance, and monoline exposures. The comparative period included dilution gains which were not repeated.
HSBC aims to deliver sustained dividend per share growth for its shareholders. The total dividend for 2008, based on the year to which the dividends relate (rather than when they were paid), amounts to US$0.64, a reduction of 28.9 per cent on 2007, reflecting the decline in profitability, prevailing business conditions and capital requirements. This basis differs from the disclosure in the five-year comparison on page 4.
Basic earnings per share (‘EPS’) is a ratio that shows the level of earnings generated per ordinary share. EPS is one of two KPIs used in rewarding employees and is discussed in more detail in the Director’s Remuneration Report on page 315. EPS for 2008 was US$0.47, a decline of 71.5 per cent on 2007. This, in part, reflected the effect of recognising goodwill impairment in North America as well as the broad based impact of the global economic crisis. Excluding the goodwill impairment, EPS would have been US$1.36, a decline of 17.6 per cent over 2007 and in line with that delivered in 2005 and 2006. In 2007, EPS grew by 17.9 per cent over that reported in 2006.
Return on average total shareholders’ equity measures the return on average shareholders’ investment in the business. This enables management to benchmark Group performance against competitors and its own targets. In 2008, the ratio was 4.7 per cent or 11.2 percentage points lower than in 2007 of which 8.6 percentage points related to the goodwill impairment recognised. This absolute performance is not regarded as satisfactory, being lower than management’s target range of between 15 and 19 per cent.
Total shareholder return (‘TSR’) is used as a method of assessing the overall return to shareholders on their investment in HSBC, and is defined as the growth in share value and declared dividend income during the relevant period. TSR is a key performance measure in rewarding employees. In calculating TSR, dividend income is assumed to
be invested in the underlying shares. The TSR benchmark is an index set at 100 and measured over one, three and five years for the purpose of comparison with the performance of a group of competitor banks which reflect HSBC’s range and breadth of activities. As the comparator group includes companies listed on overseas markets, a common currency is used to ensure that TSR is measured on a consistent basis. The TSR levels at the end of 2008 were 84.5, 84.5, and 98.5 over one, three and five years respectively. HSBC’s TSR over all periods, while disappointing in absolute terms, has significantly outperformed the peer group as the current financial crisis has had a significantly more adverse impact on their performance and rating.
Management believes that financial KPIs must remain relevant to the business so they may be changed over time to reflect changes in the Group’s composition and the strategies employed.
Non-financial KPIs
HSBC has chosen four non-financial KPIs which are important to the future success of the Group in delivering its strategic objectives. These non-financial KPIs are currently reported internally within HSBC on a local basis.
Employee engagement
Employee engagement is a measure of employees’ emotional and rational attachment to HSBC. It is critical to the long-term success of the Group and, as such, an employee engagement target was included in the 2008 objectives for Group Executives (see Directors’ Remuneration Report, page 315).
In 2008, HSBC conducted its second Global People Survey covering HSBC’s permanent workforce worldwide. The 2008 participation rate of 93 per cent improved on the 2007 equivalent of 88 per cent, which was already around the highest in the industry.
The Group’s employee engagement score rose from 60 per cent in 2007 to 67 per cent in 2008. In achieving 67 per cent, HSBC exceeded its target for 2008 of 62 per cent, the external global norm and the sector norm. Its 2009 target is 69 per cent.
The 2008 survey covered 13 dimensions which included assessing for the first time whether action had been perceived to have been taken on the results of the 2007 survey. Employees rated HSBC above the external global norm across all dimensions. HSBC exceeded the external best-in-class norm for Corporate Sustainability, and the dimensions covering Strategy and Vision, Reputation, Direct

H S B C H O L D I N G S P L C
Report of the Directors: Operating and Financial Review (continued) KPIs / Reconciliation of reported and underlying profit before tax
20
Manager and Leadership were close to this norm.
Brand perception
In order to manage the HSBC brand most effectively, the Group tracks brand health amongst Personal Financial Services and Commercial Banking customers in each of HSBC’s major markets. The survey is conducted on a consistent basis by accredited, independent, third-party organisations. A weighted scorecard of brand measures produces an overall score for each market on a 100-point scale, which is then benchmarked against HSBC’s main competitors. The scores from each market are then weighted according to the risk-adjusted revenues in that market to obtain the overall Group score.
In 2008, Personal Financial Services customers judged HSBC’s brand to be 9 points stronger than its competitors (+9), up from 6 points in 2007 and above the 8 point target. Commercial Banking customers judged the brand to be 6 points higher than HSBC’s competitors (+6), the same as in 2007.
For 2009, HSBC will track brand health in more countries. During 2008, competitors were acquired or withdrew from certain markets, so HSBC re-benchmarked its 2008 performance in respect of both brand and customer satisfaction for Personal Financial Services and Commercial Banking. For 2009, the benchmark is +4 with a target of +5 for the former and, for the latter, the equivalent numbers are +6 and +7, respectively.
Customer satisfaction
Customer recommendation is an important driver of business growth for HSBC. HSBC uses a consistent measure of customer recommendation around the world to continue to improve the services provided by the Group to customers of Personal Financial Services and Commercial Banking. This measurement is carried out by accredited, independent, third-party organisations and the resulting recommendation scores are benchmarked against competitors.
The 2008 customer recommendation target for Personal Financial Services increased from +1 to +2, failing to meet the target of +3 by a small margin. Commercial Banking met the target of +7 over competitors, up from +6 in 2007.
In 2009, HSBC has adopted a new benchmark of +1 and a 2009 target of +3 for Personal Financial Services and a benchmark of +4 and a target of +4 for Commercial Banking.
IT performance and systems reliability
HSBC tracks two key measures as indicators of IT performance; namely, the number of customer transactions processed and the reliability and resilience of systems measured in terms of service availability targets.
Number of customer transactions processed
The number of customer transactions processed reflects the dependency on IT in the delivery channels that customers use to interact with HSBC. Monitoring the volumes by channel enables the Group to allocate resources appropriately. Overall, the results show the desired decrease in staff-assisted transactions. Self-service transactions increased as a result of the redesign of the Group’s distribution network and the continuing rollout of One HSBC Technologies, HSBC’s project to standardise its primary systems, products and processes. Internet transactions unexpectedly decreased as a direct result of lower online trading volumes in retail securities in 2008. To improve efficiency HSBC aims to manage the rate of increase in IT transaction processing costs to below the volume increase. The following chart shows the 2005 to 2008 volumes per delivery channel:
Number of customer transactions (millions)
0
500
1,000
1,500
2,000
2,500
Branch/CallCentre-Agent
Creditcard
Internet Self-Service Terminal
Other e-Channels
Others(payment,
clearing, etc)
0
500
1,000
1,500
2,000
2,500
Branch/CallCentre-Agent
Creditcard
Internet Self-Service Terminal
Other e-Channels
Others(payment,
clearing, etc)
2005 2006 2007 2008
Percentage of IT services meeting or exceeding targets
HSBC’s IT function establishes with its end-users service levels for systems performance, such as systems running 99.9 per cent of the time or credit card authorisations within two seconds, and monitors the achievement of each of these commitments. The following chart shows the percentage of IT services meeting or exceeding the agreed service targets by region. Overall, the results show a trend of improving service performance.

21
Percentage of IT services meeting or exceeding targets
90%
91%
92%
93%
94%
95%
96%
97%
98%
99%
100%
Europe HK Rest of Asia-Pacific
NorthAmerica
Latin America
90%
91%
92%
93%
94%
95%
96%
97%
98%
99%
100%
Europe HK Rest of Asia-Pacific
NorthAmerica
Latin America
2006 2007 20082006 2007 2008
Reconciliation of reported and underlying profit before tax
HSBC measures its performance internally on a like-for-like basis by eliminating the effects of foreign currency translation differences, acquisitions, disposals and gains from the dilution of the Group’s interests in associates in 2007, which distort a year-on-year comparison. HSBC refers to this as its underlying performance.
The tables below compare HSBC’s underlying performance in 2008 with 2007, and 2007 with 2006. Equivalent tables are provided for each of HSBC’s customer groups and geographical segments in their respective sections below.
The foreign currency translation differences were mainly due to the strengthening of the US dollar against sterling in the second half of 2008 and its relative weakness against the euro and the Chinese renminbi in 2008 compared with 2007. The Group’s reported profit before tax in 2008 was 62 per cent lower than in 2007, with the effect of the change in foreign currency translation rates making a negligible difference. Comparing 2007 with 2006, the reported profit before tax growth was 10 per
cent, of which 4 per cent was explained by exchange rate movements.
The following acquisitions and disposals, which are listed in chronological order, affected both comparisons:
• the acquisition of HSBC’s partner’s shares in life insurer, Erisa S.A., and property and casualty insurer, Erisa I.A.R.D. (together renamed ‘HSBC Assurances’) in France in March 2007;
• the deemed disposals of the stakes in Ping An Insurance (Group) Company of China, Limited (‘Ping An Insurance’), Bank of Communications Co., Limited (‘Bank of Communications’) and Industrial Bank Co. Limited (‘Industrial Bank’), as a consequence of their share offerings on the domestic ‘A’ share market in mainland China in the first half of 2007, and of the stakes in Financiera Independencia S.A.B. de C.V. (‘Financiera Independencia’) in Mexico and Vietnam Technological and Commercial Joint Stock Bank (‘Techcombank’) following their share issues;
• the disposal of the Hamilton Insurance Company Limited and Hamilton Life Assurance Company Limited in the UK in October 2007;
• the sale of Wealth and Tax Advisory Services to its management in December 2007;
• the acquisition of the assets, liabilities and operations of The Chinese Bank Co., Ltd. (‘The Chinese Bank’) in Taiwan in March 2008;
• the sale of HSBC’s UK merchant acquiring business to a joint venture 49 per cent owned by the Group in June 2008; and
• the disposal of seven French regional banking subsidiaries in July 2008.
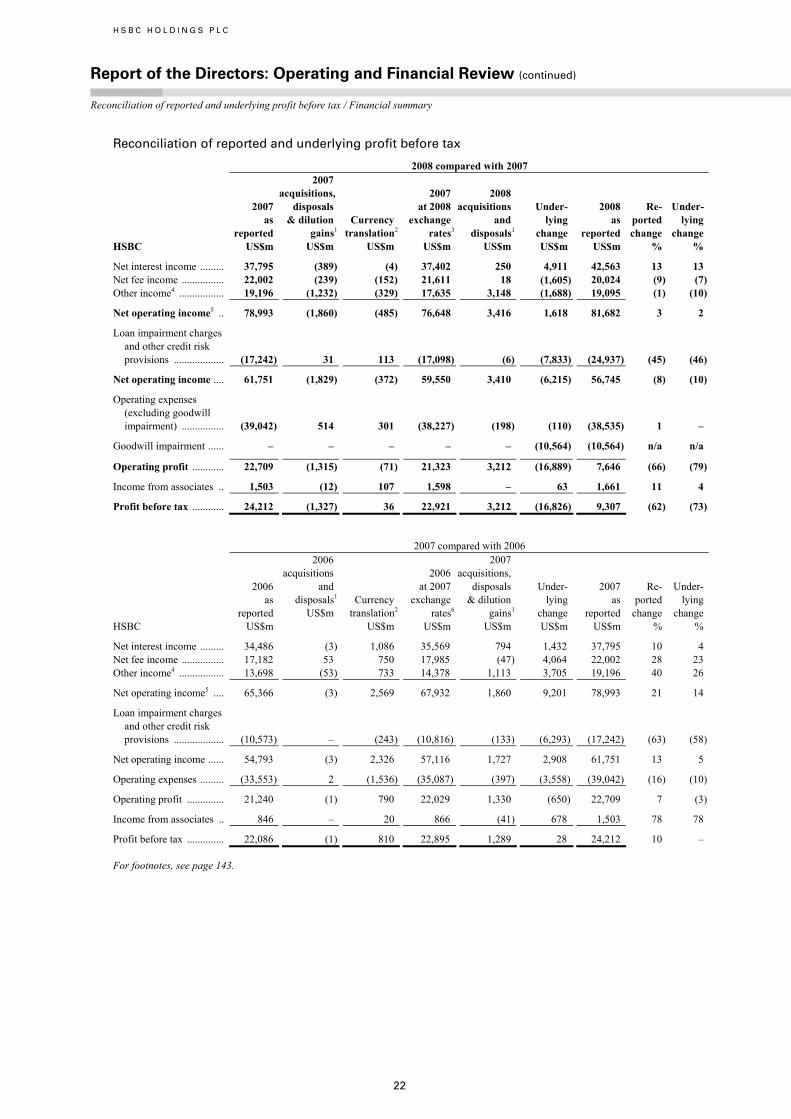
H S B C H O L D I N G S P L C
Report of the Directors: Operating and Financial Review (continued)
Reconciliation of reported and underlying profit before tax / Financial summary
22
Reconciliation of reported and underlying profit before tax
2008 compared with 2007
HSBC
2007 as reported US$m
2007acquisitions, disposals & dilution gains1
US$m
Currency translation2
US$m
2007 at 2008 exchange rates3
US$m
2008 acquisitions and disposals1
US$m
Under- lying change US$m
2008 as reported US$m
Re- ported change %
Under- lying change %
Net interest income ......... 37,795 (389) (4) 37,402 250 4,911 42,563 13 13 Net fee income ................ 22,002 (239) (152) 21,611 18 (1,605) 20,024 (9) (7)Other income4 ................. 19,196 (1,232) (329) 17,635 3,148 (1,688) 19,095 (1) (10)
Net operating income5 .. 78,993 (1,860) (485) 76,648 3,416 1,618 81,682 3 2
Loan impairment charges and other credit risk provisions ................... (17,242) 31 113 (17,098) (6) (7,833) (24,937) (45) (46)
Net operating income .... 61,751 (1,829) (372) 59,550 3,410 (6,215) 56,745 (8) (10)
Operating expenses (excluding goodwill impairment) ................ (39,042) 514 301 (38,227) (198) (110) (38,535) 1 –
Goodwill impairment ...... – – – – – (10,564) (10,564) n/a n/a
Operating profit ............ 22,709 (1,315) (71) 21,323 3,212 (16,889) 7,646 (66) (79)
Income from associates .. 1,503 (12) 107 1,598 – 63 1,661 11 4
Profit before tax ............ 24,212 (1,327) 36 22,921 3,212 (16,826) 9,307 (62) (73)
2007 compared with 2006
HSBC
2006 as reported US$m
2006 acquisitions and disposals1
US$m Currency translation2
US$m
2006 at 2007 exchange rates6
US$m
2007 acquisitions, disposals & dilution gains1
US$m
Under- lying change US$m
2007 as reported US$m
Re- ported change %
Under- lying change %
Net interest income ......... 34,486 (3) 1,086 35,569 794 1,432 37,795 10 4 Net fee income ................ 17,182 53 750 17,985 (47) 4,064 22,002 28 23 Other income4 ................. 13,698 (53) 733 14,378 1,113 3,705 19,196 40 26
Net operating income5 .... 65,366 (3) 2,569 67,932 1,860 9,201 78,993 21 14
Loan impairment charges and other credit risk provisions ................... (10,573) – (243) (10,816) (133) (6,293) (17,242) (63) (58)
Net operating income ...... 54,793 (3) 2,326 57,116 1,727 2,908 61,751 13 5
Operating expenses ......... (33,553) 2 (1,536) (35,087) (397) (3,558) (39,042) (16) (10)
Operating profit .............. 21,240 (1) 790 22,029 1,330 (650) 22,709 7 (3)
Income from associates .. 846 – 20 866 (41) 678 1,503 78 78
Profit before tax .............. 22,086 (1) 810 22,895 1,289 28 24,212 10 –
For footnotes, see page 143.
23
Financial summary
PageIncome statement .......................................... 24Group performance by income and
expense item .............................................. 26
Net interest income .................................... 26Net fee income ........................................... 27Net trading income .................................... 28Net income from financial instruments
designated at fair value .......................... 29Gains less losses from financial
investments ............................................. 30Gains arising from dilution of interests in
associates ............................................... 31Net earned insurance premiums ................ 31Other operating income ............................. 32Net insurance claims incurred and
movement in liabilities to policyholders . 33Loan impairment charges and other
credit risk provisions .............................. 34Operating expenses .................................... 36Share of profit in associates and joint
ventures .................................................. 38Economic profit ......................................... 39
Balance sheet ................................................. 40Movement from 31 December 2007 to
31 December 2008 ................................. 40Average balance sheet and net interest
income .................................................... 42Analysis of changes in net interest
income .................................................... 50Share capital and reserves ......................... 53Short-term borrowings ............................... 56Contractual obligations ............................. 57Ratios of earnings to combined fixed
charges ................................................... 57Loan maturity and interest sensitivity
analysis .................................................. 58Deposits ..................................................... 59Certificates of deposit and other time
deposits .................................................. 61
The consolidated financial statements of HSBC and the separate financial statements of HSBC Holdings have been prepared in accordance with International Financial Reporting Standards (‘IFRSs’) as issued by the International Accounting Standards Board (‘IASB’) and as endorsed by the European Union (‘EU’). EU-endorsed IFRSs may differ from IFRSs as issued by the IASB if, at any point in time, new or amended IFRSs have not been endorsed by the EU. At 31 December 2008, there were no unendorsed standards effective for the year ended 31 December 2008 affecting these consolidated and separate financial statements, and there was no difference between IFRSs endorsed by the EU and IFRSs issued by the IASB in terms of their application to HSBC. Accordingly, HSBC’s financial statements for the year ended 31 December 2008 are prepared in accordance with IFRSs as issued by the IASB.
HSBC uses the US dollar as its presentation currency because the US dollar and currencies linked to it form the major currency bloc in which HSBC transacts its business. Unless otherwise stated, the accounting information presented in this document has been prepared in accordance with IFRSs.
Constant currency
Constant currency comparatives for 2007 and 2006 used in the 2008 and 2007 commentaries, respectively, are computed by retranslating into US dollars, for non-US dollar branches, subsidiaries, joint ventures and associates:
• the income statements for 2007 and 2006 at the average rates of exchange for 2008 and 2007, respectively; and
• the balance sheets at 31 December 2007 and 2006 at the prevailing rates of exchange on 31 December 2008 and 2007, respectively.
No adjustment has been made to the exchange rates used to translate foreign currency denominated assets and liabilities into the functional currencies of any HSBC branches, subsidiaries, joint ventures or associates. When reference is made to ‘constant currency’ in tables or commentaries, comparative data reported in the functional currencies of HSBC’s operations have been translated at the appropriate exchange rates applied in the current period on the basis described above.

H S B C H O L D I N G S P L C
Report of the Directors: Operating and Financial Review (continued)
Financial summary > Income statement
24
Income statement
2008
US$m 2007
US$m 2006
US$m
Interest income ................................................................................................ 91,301 92,359 75,879 Interest expense ............................................................................................... (48,738) (54,564) (41,393)
Net interest income .......................................................................................... 42,563 37,795 34,486
Fee income ....................................................................................................... 24,764 26,337 21,080 Fee expense ...................................................................................................... (4,740) (4,335) (3,898)
Net fee income ................................................................................................. 20,024 22,002 17,182
Trading income excluding net interest income ............................................... 847 4,458 5,619 Net interest income on trading activities ......................................................... 5,713 5,376 2,603
Net trading income .......................................................................................... 6,560 9,834 8,222
Changes in fair value of long-term debt issued and related derivatives ......... 6,679 2,812 (35)Net income/(expense) from other financial instruments designated at
fair value ..................................................................................................... (2,827) 1,271 692
Net income from financial instruments designated at fair value .................... 3,852 4,083 657
Gains less losses from financial investments .................................................. 197 1,956 969 Gains arising from dilution of interests in associates ..................................... – 1,092 – Dividend income .............................................................................................. 272 324 340 Net earned insurance premiums ...................................................................... 10,850 9,076 5,668 Gains on disposal of French regional banks ................................................... 2,445 – – Other operating income ................................................................................... 1,808 1,439 2,546
Total operating income ................................................................................. 88,571 87,601 70,070
Net insurance claims incurred and movement in liabilities to policyholders . (6,889) (8,608) (4,704)
Net operating income before loan impairment charges and other credit risk provisions ................................................................................ 81,682 78,993 65,366
Loan impairment charges and other credit risk provisions ............................. (24,937) (17,242) (10,573)
Net operating income .................................................................................... 56,745 61,751 54,793
Employee compensation and benefits ............................................................. (20,792) (21,334) (18,500)General and administrative expenses .............................................................. (15,260) (15,294) (12,823)Depreciation and impairment of property, plant and equipment .................... (1,750) (1,714) (1,514)Amortisation and impairment of intangible assets .......................................... (733) (700) (716)Goodwill impairment ....................................................................................... (10,564) – –
Total operating expenses ............................................................................... (49,099) (39,042) (33,553)
Operating profit ............................................................................................. 7,646 22,709 21,240
Share of profit in associates and joint ventures ............................................... 1,661 1,503 846
Profit before tax ............................................................................................. 9,307 24,212 22,086
Tax expense ..................................................................................................... (2,809) (3,757) (5,215)
Profit for the year .......................................................................................... 6,498 20,455 16,871
Profit attributable to shareholders of the parent company .............................. 5,728 19,133 15,789 Profit attributable to minority interests ........................................................... 770 1,322 1,082 2008 compared with 2007
Reported pre-tax profits in 2008 fell by 62 per cent to US$9.3 billion and earnings per share declined to US$0.47. In a year characterised by a significant deterioration in the credit markets and by unprecedented illiquidity in most asset classes, return on average total shareholders’ equity fell to 4.7 per cent.
The fall in profit before tax was exacerbated by recognition of a US$10.6 billion impairment
charge which wrote off in full the goodwill carried on the balance sheet in respect of the Group’s investment in its North America Personal Financial Services business. This non-cash charge arose substantially in the second half of 2008 as heightened risk premia in the market increased discount rates and cash flows estimated from ongoing activities fell as the US economy continued to decline and the outlook for the business deteriorated.
Asian performance was strong, generating profit

25
before tax of US$11.9 billion, broadly in line with results excluding the dilution gains which arose in 2007 when HSBC did not participate in share offerings by its mainland Chinese associates. Within Asia, Global Banking and Markets’ results were strongly ahead, driven by foreign exchange, Rates and securities services. Balance Sheet Management revenues rose significantly from positioning ahead of interest rate cuts, and were especially strong in Europe despite losses from the defaults of certain financial sector companies.
With the exception of Personal Financial Services, which incurred significant losses in North America, all customer groups remained profitable. Commercial Banking and Private Banking delivered results broadly in line with 2007, while Global Banking and Markets’ profits declined.
Performance was overshadowed by a US$7.7 billion rise in loan impairment charges and other credit risk provisions, largely from the US consumer finance business, and a further US$5.4 billion in trading write-downs on illiquid legacy positions in credit trading, leveraged and acquisition finance and monoline credit exposure in Global Banking and Markets. Increases in loan impairment charges and other credit risk provisions in Personal Financial Services and Commercial Banking, the latter rising rapidly in the second half of 2008 from a low base, occurred as the global economy slowed. Global Banking and Markets also experienced a rise in loan impairment charges and other credit risk provisions as refinancing options dried up for a number of companies as the market for long-term asset financing became increasingly illiquid. The market turmoil also led to impairments on equity securities in the available-for-sale portfolio.
The following items were significant:
• the non-recurrence of US$1.1 billion of gains which arose in 2007 on the dilution of the Group’s stakes in various associates;
• a US$3.9 billion increase (from US$2.8 billion in 2007 to US$6.7 billion) in fair value gains from wider credit spreads recorded predominantly on HSBC’s own long-term debt designated at fair value. These gains are reported in the ‘Other’ segment, are not allocated to customer groups and are not included within regulatory capital calculations;
• the gain of US$2.4 billion on the sale of the French regional banks; and
• a charge against trading income of US$984 million following the alleged fraud in December 2008 relating to Bernard L Madoff
Investment Securities LLC (‘Madoff Securities’).
On an underlying basis, profit before tax declined by 73 per cent compared with 2007. The difference between the reported and underlying results is explained on page 21. Except where stated otherwise, the commentaries in the Financial Summary are on an underlying basis.
2007 compared with 2006
The strength of HSBC’s geographically diversified business model was demonstrated by profit growth in a year in which financial markets experienced significant dislocation and the credit environment, particularly in the US, deteriorated markedly. Pre-tax profits in 2007 increased by 10 per cent to US$24.2 billion and earnings per share rose by 18 per cent to US$1.65. Despite difficult market conditions, the return on shareholders’ equity exceeded 15 per cent, capital ratios remained strong, revenue growth was in double digits and the cost efficiency ratio improved. For the first time in recent years, pre-tax profits from the Group’s emerging markets operations exceeded 60 per cent of total profits.
On an underlying basis, profit before tax was broadly in line with 2006.
The Group had a notably strong year in most emerging markets. Vigorous economic activity, strong trade flows and buoyant equity markets helped drive broadly based profit growth, with profits in all customer groups ahead of 2006. A strong performance in Asia in all customer groups compensated for the effect of deteriorating conditions in the US and slower growth in other mature markets. Commercial Banking and Private Banking again delivered record results, as did many of the businesses within Global Banking and Markets, including foreign exchange, payments and cash management, equities, HSBC Global Asset Management and securities services.
The deterioration in credit quality which began in 2006 in a particular portfolio of purchased mortgages in the US consumer finance business widened in the second half of 2007, leading to significantly increased loan impairment charges in the US as economic conditions deteriorated and global market liquidity for asset-backed securities dried up. This lack of liquidity adversely affected credit trading and asset-backed securities businesses within Global Banking and Markets, where de-leveraging of traded markets contributed to volatility and lower valuations. The effect of these factors was partially offset by a gain on HSBC’s own debt designated at fair value.

H S B C H O L D I N G S P L C
Report of the Directors: Operating and Financial Review (continued)
Financial summary / Group performance > Net interest income / net fee income
26
Group performance by income and expense item
Net interest income
2008 2007 2006
Net interest income1 (US$m) ........................................................................... 42,563 37,795 34,486 Average interest-earning assets (US$m) ......................................................... 1,466,622 1,296,701 1,113,404 Gross interest yield (per cent)2 ......................................................................... 6.23 7.12 6.82Net interest spread (per cent)3 .......................................................................... 2.87 2.86 2.94Net interest margin (per cent)4 ......................................................................... 2.90 2.91 3.10
1 Net interest income includes the cost of funding trading assets, while the related external revenues are reported in trading income. In HSBC’s customer group results, the cost of funding trading assets is included with Global Banking and Markets’ net trading income as an interest expense.
2 Gross interest yield is the average annualised interest rate earned on average interest-earning assets (‘AIEA’). 3 Net interest spread is the difference between the average annualised interest rate earned on AIEA, net of amortised premiums and loan
fees, and the average annualised interest rate paid on average interest-bearing funds. 4 Net interest margin is net interest income expressed as an annualised percentage of AIEA.
2008 compared with 2007
Reported net interest income of US$42.6 billion rose by 13 per cent compared with 2007, 13 per cent on an underlying basis.
Growth in net interest income was driven by significantly higher revenues in Balance Sheet Management, in part reflecting favourable positioning to take advantage of falling interest rates. Lending and deposit balances also grew strongly, while progressive reductions in central bank reference rates led to a decline in both asset yields and the cost of funds. Overall, spreads narrowed on an underlying basis.
Average interest-earning assets increased to US$1,467 billion, led by growth in average loans and advances to customers. This was mainly due to an increase in average term lending balances in Europe and Asia.
An increase in average interest-bearing liabilities was driven by growth in average customer accounts, notably in Europe. HSBC attracted substantial deposits from customers who valued HSBC’s perceived strength at a time of global financial market turmoil and customers also expressed a preference for security and liquidity following declines in equity markets.
Interest rates were cut aggressively in many countries during 2008, as central banks reduced their reference rates as part of stimulus programmes introduced in response to deteriorating economic conditions. This contributed to a decline in asset yields. The cost of funds also fell, but this was less significant than the decline in yields as spreads narrowed overall on an underlying basis.
In North America, net interest income was also adversely affected by rises in loan modifications designed to reduce the payment burden on the Group’s customers, and impaired loans.
2007 compared with 2006
Reported net interest income increased by 10 per cent to US$37.8 billion, 4 per cent on an underlying basis. The increase was driven by an underlying 10 per cent rise in average interest earning assets to US$1,297 billion, partly offset by a decline in spreads as funding costs rose more than yields.
The growth in average interest earning assets was due to a 6 per cent rise in average loans and advances to customers. HSBC continued to focus on competitive liability products, with average deposits and current account balances rising by 16 per cent, driven by customer acquisition in Rest of Asia-Pacific and deposit balance growth in North America, Europe and Hong Kong.
Balance Sheet Management revenues increased compared with 2006, particularly in Hong Kong and Rest of Asia-Pacific as deposits grew strongly.
Lending spreads in 2007 reflected the continued benign corporate and commercial credit conditions that have existed in the last three or four years. However, some upward re-pricing occurred in personal lending as a result of growing delinquency and restricted credit appetite and, as market liquidity diminished in the last four months of 2007, the value and cost of funds, including the cost of funding HSBC’s trading activities, rose markedly.

27
Net fee income
2008US$m
2007 US$m
2006US$m
Cards ................................................................................................................ 5,844 6,496 5,367 Account services .............................................................................................. 4,353 4,359 3,633 Funds under management ................................................................................ 2,757 2,975 2,718 Insurance .......................................................................................................... 1,771 1,836 1,358 Broking income ............................................................................................... 1,738 2,012 1,354 Credit facilities ................................................................................................ 1,313 1,138 922 Global custody ................................................................................................. 1,311 1,404 797 Imports/exports ................................................................................................ 1,014 866 780 Remittances ..................................................................................................... 610 556 472 Unit trusts ........................................................................................................ 502 875 520 Corporate finance ............................................................................................ 381 409 255 Underwriting .................................................................................................... 325 367 286 Trust income .................................................................................................... 325 299 248 Taxpayer financial services ............................................................................. 168 252 263 Maintenance income on operating leases ........................................................ 130 139 122 Mortgage servicing .......................................................................................... 120 109 97 Other ................................................................................................................ 2,102 2,245 1,888
Total fee income .............................................................................................. 24,764 26,337 21,080
Less: fee expense ............................................................................................. (4,740) (4,335) (3,898)
Net fee income ................................................................................................. 20,024 22,002 17,182
2008 compared with 2007
Reported net fee income declined by 9 per cent to US$20 billion, 7 per cent lower on an underlying basis.
Lower equity market-related revenues, notably in Hong Kong, were driven by weakened investor sentiment, and reflected in the fall of 17 per cent in the aggregate of broking income, global custody and unit trust income. Similarly, fund management fees declined as equity markets retreated and lower performance fees were earned.
HSBC announced revisions to its credit card fee charging policies in the US in 2007, and this fed through as expected in the form of a substantial decline in overlimit fees, further compounded by lower cash advance and interchange fee income as a result of reduced volumes. In the UK, the divestment in 2008 of the card acquiring business resulted in reduced card acquiring fees. Offsetting these factors were rises in card fees in Hong Kong, the Middle East, India and Turkey.
Fee income from credit facilities rose, notably in the Middle East, in line with customer volumes. Growth in fee income from trade and supply chain products reflected higher volumes and customer acquisition in India and, to a greater extent in the Middle East, increased activity driven by commodity price inflation.
2007 compared with 2006
Reported net fee income increased by 28 per cent to US$22 billion, 23 per cent on an underlying basis.
The rise in card fee income was mainly in the US and Mexico. Income growth in the US was driven by higher late and over-limit fees in addition to higher balances. Revenue from enhancement services on cards also increased. In Mexico, the credit card business continued to grow, both in balances and in transaction volumes.
Higher income from funds under management products, broking services, unit trusts and global custody was driven by buoyant stock markets in Hong Kong and throughout the Rest of Asia-Pacific region, enhanced by the launch of new investment schemes.
Increased account services income was due to higher levels of customer activity in Europe, North America and Latin America. In the US, growth in credit card balances triggered an increased use of the Intellicheck service. In the UK, growth in the sale of fee-based packaged accounts contributed to a rise in account services fees.
An increase in insurance fees was driven by higher life insurance commission income, boosted by new product offerings in Hong Kong.

H S B C H O L D I N G S P L C
Report of the Directors: Operating and Financial Review (continued)
Financial summary / Group performance > Net trading income / Net income from financial instruments at FV
28
Net trading income
2008US$m
2007 US$m
2006US$m
Trading activities ............................................................................................. 2,988 4,521 5,465 Net interest income on trading activities ......................................................... 5,713 5,376 2,603 Other trading income – hedge ineffectiveness:
– on cash flow hedges ................................................................................. (40) (77) (122)– on fair value hedges ................................................................................. 5 19 16
Non-qualifying hedges .................................................................................... (1,122) (5) 260 Losses on collapse of Madoff Securities.......................................................... (984) – –
Net trading income1,2 ....................................................................................... 6,560 9,834 8,222
1 The cost of internal funding of trading assets was US$5,547 million (2007: US$5,433 million) (2006: US$2,658 million) and is excluded from the reported ‘Net trading income’ line and included in ‘Net interest income’. However, this cost is reinstated in ‘Net trading income’ in HSBC’s customer group and global business reporting.
2 Net trading income includes US$529 million (2007: US$34 million), associated with changes in the fair value of issued structured notes and other hybrid instrument liabilities derived from movements in HSBC issuance spreads.
2008 compared with 2007
Reported net trading income fell by 33 per cent to US$6.6 billion, 32 per cent lower on an underlying basis.
Net income from trading activities declined by 81 per cent, driven by the continuing effect of the market turmoil which led to US$5.4 billion of write-downs on legacy monoline credit exposures, credit trading and leveraged and acquisition finance loans. More information about the losses, the associated assets and residual exposure is provided in ‘Impact of Market Turmoil’ on pages 144 to 162.
Record foreign exchange trading income was due to increased customer volumes and market volatility across all regions, as investors sought to reduce risk in the second half of 2008, driving growth in global foreign exchange trading as demand for assets denominated in US dollars and Japanese Yen increased.
Rates trading income rose substantially, with record revenues in the first half of 2008 due to favourable positioning against movements in interest rate yield curves as central banks responded to the market turmoil by lowering short-term interest rates. Revenues were also boosted by an increased number of deals, widening spreads and increased customer demand for trading and hedging products.
The decline in equities trading income reflected weaker equity markets, particularly in Hong Kong, where demand for structured equity products fell. In addition, following the alleged fraud at Madoff Securities, HSBC wrote off the value of units it held in funds that had invested with the company and took a US$984 million charge. The units had been acquired in connection with various financing transactions HSBC had entered into with institutional clients.
The decline in non-qualifying hedges related to mark-to-market losses on cross-currency swaps as the US dollar appreciated and on interest rate swaps as interest rates fell in late 2008.
Widening credit spreads led to further gains on credit default swap transactions in parts of the Global Banking portfolio.
2007 compared with 2006 Reported net trading income increased by 20 per cent to US$9.8 billion, 13 per cent on an underlying basis.
Net interest income on trading activities more than doubled, mainly due to increased holdings of shorter maturity assets in the UK.
Net trading income was significantly affected by a total of US$2.1 billion of write-downs on credit trading, leveraged and acquisition financing positions, and monoline credit exposures, resulting from deterioration in the credit market in the second half of 2007. The write-downs arose mainly in the US and, to a lesser extent, the UK.
Income from foreign exchange trading increased by 40 per cent to a record result. Revenues were driven by higher customer volumes, against the backdrop of a weakening US dollar and greater market volatility.
Trading income from structured derivatives fell by 26 per cent. The structured credit business incurred losses in the second half of the year in the difficult trading conditions. This was partly offset by higher trading income from other structured derivative products, following investment made in technical expertise and systems in previous years.
Record results were achieved in the equities business, reflecting strong growth across all regions, particularly Europe.

29
Net income from financial instruments designated at fair value
2008US$m
2007 US$m
2006US$m
Net income arising from: – financial assets held to meet liabilities under insurance and
investment contracts ................................................................................ (5,064) 2,056 1,552 – liabilities to customers under investment contracts ................................ 1,751 (940) (1,008)– HSBC’s long-term debt issued and related derivatives .......................... 6,679 2,812 (35)
– change in own credit spread on long-term debt ................................... 6,570 3,055 (388)– other changes in fair value1 .................................................................. 109 (243) 353
– other instruments designated at fair value and related derivatives ......... 486 155 148
Net income from financial instruments designated at fair value .................... 3,852 4,083 657
Financial assets designated at fair value at 31 December ............................... 28,533 41,564 20,573 Financial liabilities designated at fair value at 31 December ......................... 74,587 89,939 70,211
1 Includes gains and losses arising from changes in the fair value of derivatives that are managed in conjunction with HSBC’s long-term debt issued.
HSBC designates certain financial instruments at fair value to remove or reduce accounting mismatches in measurement or recognition, or where financial instruments are managed and their performance is evaluated together on a fair value basis. All income and expense from financial instruments designated at fair value are included in this line except for interest arising from HSBC’s issued debt securities and related derivatives managed in conjunction with those debt securities, which is recognised in ‘Interest expense’.
HSBC principally uses the fair value designation in the following instances:
• for certain fixed-rate long-term debt issues whose rate profile has been changed to floating through interest rate swaps as part of a documented interest rate management strategy. Approximately US$59 billion (2007: US$66 billion) of the Group’s debt issues have been accounted for using the fair value option.
The movement in fair value of these debt issues includes the effect of own credit spread changes and any ineffectiveness in the economic relationship between the related swaps and own debt. As credit spreads widen or narrow, accounting profits or losses are booked, respectively. The size and direction of the accounting consequences of changes in own credit spread and ineffectiveness can be volatile from year to year, but do not alter the cash flows envisaged as part of the documented interest rate management strategy; as a consequence of this, gains and losses arising from changes in own credit spread on long-term debt are not regarded internally as part of managerial performance. Similarly, such gains and losses are ignored in the calculation of regulatory capital.
• for approximately US$11 billion (2007: US$17 billion) of financial assets held to meet liabilities under insurance contracts, and certain liabilities under investment contracts with discretionary participation features; and
• for approximately US$7 billion (2007: US$14 billion) of financial assets held to meet liabilities under unit-linked and other investment contracts.
2008 compared with 2007
Reported net income from financial instruments designated at fair value decreased by US$231 million to US$3.9 billion in 2008.
Credit spreads widened significantly during the year, leading to US$6.6 billion of positive fair value movements on certain long-term debt issued by the Group, compared with US$3.1 billion in 2007. These fair value movements will fully reverse over the life of the debt. The cumulative fair value adjustment at 31 December 2008 amounted to US$8.0 billion.
A negative movement of US$5.1 billion was recorded in the fair value of assets held to back insurance and investment contracts, compared with a positive movement of US$2.1 billion in 2007. This reflected investment losses driven by falling equity and bond markets, predominantly affecting the value of assets held in unit-linked and participating funds in Hong Kong, France and the UK. The negative movement in fair value is partially offset by a corresponding reduction in ‘Net insurance claims and movement in liabilities to policyholders’, where unit-linked policyholders in particular participate in the investment performance experienced on the investment portfolios held to support the liabilities.

H S B C H O L D I N G S P L C
Report of the Directors: Operating and Financial Review (continued)
Financial summary / Group performance > Gains less losses from financial investments / Net earned insurance premiums
30
For assets held to meet liabilities under investment contracts the corresponding reduction in the liability to customers is also reported within net income from financial instruments designated at fair value. A reduction of US$1.8 billion in the movement in fair value of liabilities held under investment contracts compared with an increase in the fair value of liabilities of US$940 million in 2007.
2007 compared with 2006
Credit spreads widened significantly in the second half of 2007, leading to a substantial increase in net income from financial instruments designated at fair value compared with 2006. This was primarily driven by a widening in credit spreads on certain fixed-rate long-term debt issued by HSBC Holdings
and its subsidiaries. These cumulative gains will fully reverse over the life of the debt. The cumulative adjustments to reserves (when the policy is applied for the first time) and the income statement (subsequent applications of the policy), reflecting the change in own credit spread since the fair value option was available, was US$1.6 billion after taking into account the US$3.1 billion credit in 2007.
Income from assets held to meet liabilities under insurance and investment contracts also rose, by 32 per cent, reflecting primarily premium growth and higher investment returns on the portfolios held by the insurance businesses in the UK and Hong Kong. The change in fair value of liabilities under investment contracts declined by 7 per cent.
Gains less losses from financial investments 2008
US$m 2007
US$m 2006
US$m Net gain from disposal of:
– debt securities ........................................................................................... 19 120 252 – equity securities ........................................................................................ 1,216 1,864 702 – other financial investments ...................................................................... 4 14 15
1,239 1,998 969 Impairment of available-for-sale equity securities .......................................... (1,042) (42) –
Gains less losses from financial investments .................................................. 197 1,956 969
2008 compared 2007
Reported gains less losses of US$197 million from financial investments during 2008 were 90 per cent lower than in 2007, 93 per cent lower on an underlying basis. A reduction in net gains from disposals was compounded by significant impairments recognised on equity securities held in the available-for-sale portfolio as certain investments were marked down to reflect the prevailing market conditions.
The redemption of Visa Inc. (‘Visa’) shares following its IPO resulted in significant gains, and there were further gains from the sale of MasterCard Inc. (‘MasterCard’) shares. These were more than offset by losses in Principal Investments and the non-recurrence of various significant gains in 2007, mostly in respect of Euronext, the European stock exchange, and a credit bureau in Brazil.
Declining equity markets caused impairments to be recognised against a number of strategic investments in Asia, held in the available-for-sale portfolio and on private equity investments, mainly in Europe. The market turmoil in the US also led to impairments against investments in various US financial institutions.
2007 compared with 2006
Net gains of US$2.0 billion were reported by HSBC as a result of the disposal of financial investments during 2007, a two-fold increase over 2006 and 93 per cent higher on an underlying basis.
The increase was driven by the sale of shares and various equity investments in all regions, including holdings in Euronext (the European stock exchange), MasterCard in North America and a credit bureau in Brazil. In Private Banking, a gain of US$91 million arose from the sale of a further holding in the Hermitage Fund, compared with US$117 million in 2006. The gains in 2007 were marginally offset by the non-recurrence of a US$101 million gain on the sale of part of HSBC’s stake in UTI Bank Limited in 2006.

31
Gains arising from dilution of interests in associates
In 2007, HSBC’s associates, Industrial Bank, Ping An Insurance and Bank of Communications in mainland China, Financiera Independencia in Mexico and Techcombank in Vietnam issued new shares for which HSBC did not subscribe. As a
consequence of the new monies raised by the associates, HSBC’s share of their underlying assets increased by US$1.1 billion, notwithstanding the reduction in the Group’s interests. These gains were presented in the income statement as ‘Gains arising from dilution of interests in associates’, and should be regarded as exceptional.
Net earned insurance premiums
2008US$m
2007 US$m
2006US$m
Gross insurance premium income ................................................................... 12,547 11,001 6,455 Reinsurance premiums .................................................................................... (1,697) (1,925) (787)
Net earned insurance premiums ...................................................................... 10,850 9,076 5,668 2008 compared with 2007
Reported net earned insurance premiums amounted to US$10.9 billion, 20 per cent higher than in 2007. HSBC acquired the remaining interest in HSBC Assurances in France in March 2007 and, in October 2007, sold the Hamilton Insurance Company Limited and Hamilton Life Assurance Company Limited in the UK. On an underlying basis, net earned insurance premiums increased by 14 per cent.
Growth in net earned insurance premiums was driven by a continued strong performance from the UK life assurance business, mainly as a result of higher sales of the Guaranteed Income Bond, a non-linked product that was launched in June 2007. The introduction of enhanced life assurance benefits to certain pension products, which led to these products being reclassified as insurance contracts, also resulted in higher premiums.
The Hong Kong insurance business also performed well with respect to premium growth, due to stronger sales of products with discretionary participation features (‘DPF’) and an increase in regular premiums partly offset by a reduction in unit-linked premiums.
In France, HSBC Assurances performed well in a declining market, as three promotional campaigns during the year contributed to growth in sales of policies with DPF. However, a significant one-off reinsurance transaction undertaken during 2008 caused net earned insurance premiums to decrease compared with 2007.
2007 compared with 2006
Reported net earned insurance premiums of US$9.1 billion were 60 per cent higher than in 2006, boosted by HSBC’s acquisition in the first half of 2007 of the remaining shares in HSBC Assurances in France and the purchase of HSBC Bank Panama in Central America in late 2006. Underlying net insurance premiums grew by 21 per cent.
Growth in net earned insurance premiums was achieved in all regions except North America, primarily from new business growth in the life insurance business in Europe, Hong Kong and Latin America. An increase in net earned premiums was recorded in the UK due to higher sales of Guaranteed Income Bonds and the introduction of enhanced death benefits to pension contracts. New product launches also aided growth in Hong Kong. In Latin America, higher premiums in Brazil were driven by increased sales of pension products with linked-life policies.
In non-life insurance, the UK benefited from a decision to reduce the proportion of risk and corresponding premiums ceded to reinsurers compared with 2006. The Latin American business also performed well, led by growth in motor premiums in Argentina. However, results in North America declined, as a reduction in loan volumes led to a fall in credit insurance sales and HSBC stopped reinsuring credit insurance for other lenders.

H S B C H O L D I N G S P L C
Report of the Directors: Operating and Financial Review (continued)
Financial summary / Group performance > Other operating income / Net insurance claims incurred
32
Other operating income
2008US$m
2007 US$m
2006US$m
Rent received ................................................................................................... 606 630 687 Gains/(losses) recognised on assets held for sale ............................................ (130) 5 28 Valuation gains/(losses) on investment properties .......................................... (92) 152 164 Gain on disposal of property, plant and equipment, intangible assets and
non-financial investments ........................................................................... 465 213 781 Change in present value of in-force long-term insurance business ................ 286 (145) 40 Gain on repurchase of 8 Canada Square ......................................................... 416 – – Other ................................................................................................................ 257 584 846
Other operating income ................................................................................... 1,808 1,439 2,546
2008 compared with 2007
Reported other operating income of US$1.8 billion was 26 per cent higher than in 2007. This included gains of US$425 million on the sale of the card merchant acquiring business in the UK and US$71 million on the sale of HSBC’s entire stake in Financiera Independencia, a Mexican consumer lending company. On an underlying basis, other operating income fell by 23 per cent.
The difficult property market conditions in the UK led to a loss in value of a property fund, lower income from the sale of property fund assets and a reduction in Group real estate disposals in 2008. Similarly, in Hong Kong revaluation gains on investment properties did not recur.
Life assurance enhancements to pension products resulted in increased present value of in-force long-term insurance (‘PVIF’) business, which also benefited from the non-recurrence of regulatory changes in 2007 in the UK.
During 2008, HSBC recognised a gain of US$416 million in respect of the purchase of the subsidiary of Metrovacesa which owned the property and long leasehold comprising 8 Canada Square, London. See Note 23 on the Financial Statements.
Other operating income declined, driven by losses on sale of the Canadian vehicle finance business and other loan portfolios in 2008, in addition to the non-recurrence of gains on disposal of fixed assets and private equity investments in 2007.
2007 compared with 2006
Reported other operating income of US$1.4 billion was 43 per cent lower than in 2006, 51 per cent lower on an underlying basis.
Significant decreases in gain on disposal of property and other income were driven by lower proceeds from the sale of real estate in the declining US property market. This was compounded by the non-recurrence of income earned on asset disposals in 2006, including the sale of the former head office building of Hang Seng Bank in Hong Kong and properties in Japan and India, and the transfer of the credit card acquiring business into a joint venture with Global Payments Inc. A gain on the sale and leaseback of a London building in 2007 and the non-recurrence of a loss on sale on asset disposals in 2006 partially offset these factors.
Although HSBC sold its Canary Wharf headquarters building at 8 Canada Square in 2007, the gain remained unrecognised as the Group continued to provide bridge finance for the debt portion of the transaction.
PVIF business declined, primarily due to a change in the calculation methodology employed in the UK as HSBC implemented regulatory changes to the rules governing the calculation of insurance liabilities. This had a marginally positive effect on profit as there was a corresponding reduction in policyholder liabilities. Income rose in Mexico due to a refinement of the income recognition methodology in respect of long-term insurance contracts.
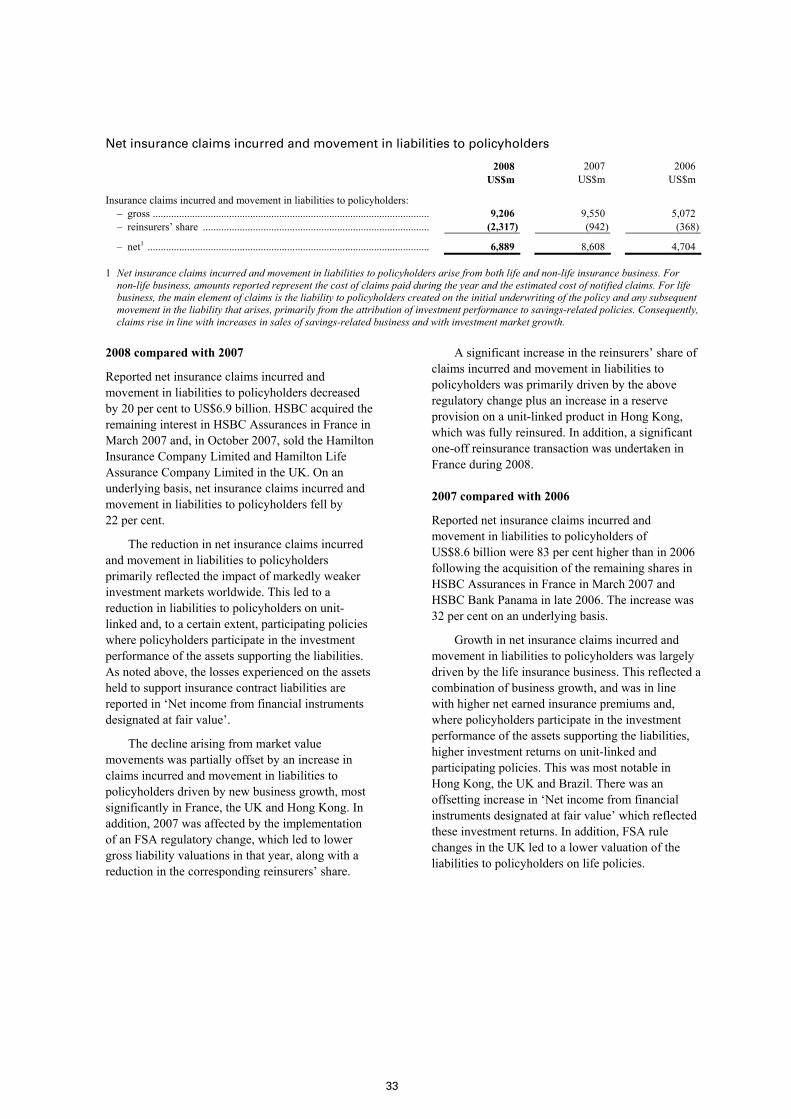
33
Net insurance claims incurred and movement in liabilities to policyholders
2008US$m
2007 US$m
2006US$m
Insurance claims incurred and movement in liabilities to policyholders: – gross ......................................................................................................... 9,206 9,550 5,072 – reinsurers’ share ...................................................................................... (2,317) (942) (368)
– net1 ........................................................................................................... 6,889 8,608 4,704
1 Net insurance claims incurred and movement in liabilities to policyholders arise from both life and non-life insurance business. For non-life business, amounts reported represent the cost of claims paid during the year and the estimated cost of notified claims. For life business, the main element of claims is the liability to policyholders created on the initial underwriting of the policy and any subsequent movement in the liability that arises, primarily from the attribution of investment performance to savings-related policies. Consequently, claims rise in line with increases in sales of savings-related business and with investment market growth.
2008 compared with 2007
Reported net insurance claims incurred and movement in liabilities to policyholders decreased by 20 per cent to US$6.9 billion. HSBC acquired the remaining interest in HSBC Assurances in France in March 2007 and, in October 2007, sold the Hamilton Insurance Company Limited and Hamilton Life Assurance Company Limited in the UK. On an underlying basis, net insurance claims incurred and movement in liabilities to policyholders fell by 22 per cent.
The reduction in net insurance claims incurred and movement in liabilities to policyholders primarily reflected the impact of markedly weaker investment markets worldwide. This led to a reduction in liabilities to policyholders on unit-linked and, to a certain extent, participating policies where policyholders participate in the investment performance of the assets supporting the liabilities. As noted above, the losses experienced on the assets held to support insurance contract liabilities are reported in ‘Net income from financial instruments designated at fair value’.
The decline arising from market value movements was partially offset by an increase in claims incurred and movement in liabilities to policyholders driven by new business growth, most significantly in France, the UK and Hong Kong. In addition, 2007 was affected by the implementation of an FSA regulatory change, which led to lower gross liability valuations in that year, along with a reduction in the corresponding reinsurers’ share.
A significant increase in the reinsurers’ share of claims incurred and movement in liabilities to policyholders was primarily driven by the above regulatory change plus an increase in a reserve provision on a unit-linked product in Hong Kong, which was fully reinsured. In addition, a significant one-off reinsurance transaction was undertaken in France during 2008.
2007 compared with 2006
Reported net insurance claims incurred and movement in liabilities to policyholders of US$8.6 billion were 83 per cent higher than in 2006 following the acquisition of the remaining shares in HSBC Assurances in France in March 2007 and HSBC Bank Panama in late 2006. The increase was 32 per cent on an underlying basis.
Growth in net insurance claims incurred and movement in liabilities to policyholders was largely driven by the life insurance business. This reflected a combination of business growth, and was in line with higher net earned insurance premiums and, where policyholders participate in the investment performance of the assets supporting the liabilities, higher investment returns on unit-linked and participating policies. This was most notable in Hong Kong, the UK and Brazil. There was an offsetting increase in ‘Net income from financial instruments designated at fair value’ which reflected these investment returns. In addition, FSA rule changes in the UK led to a lower valuation of the liabilities to policyholders on life policies.
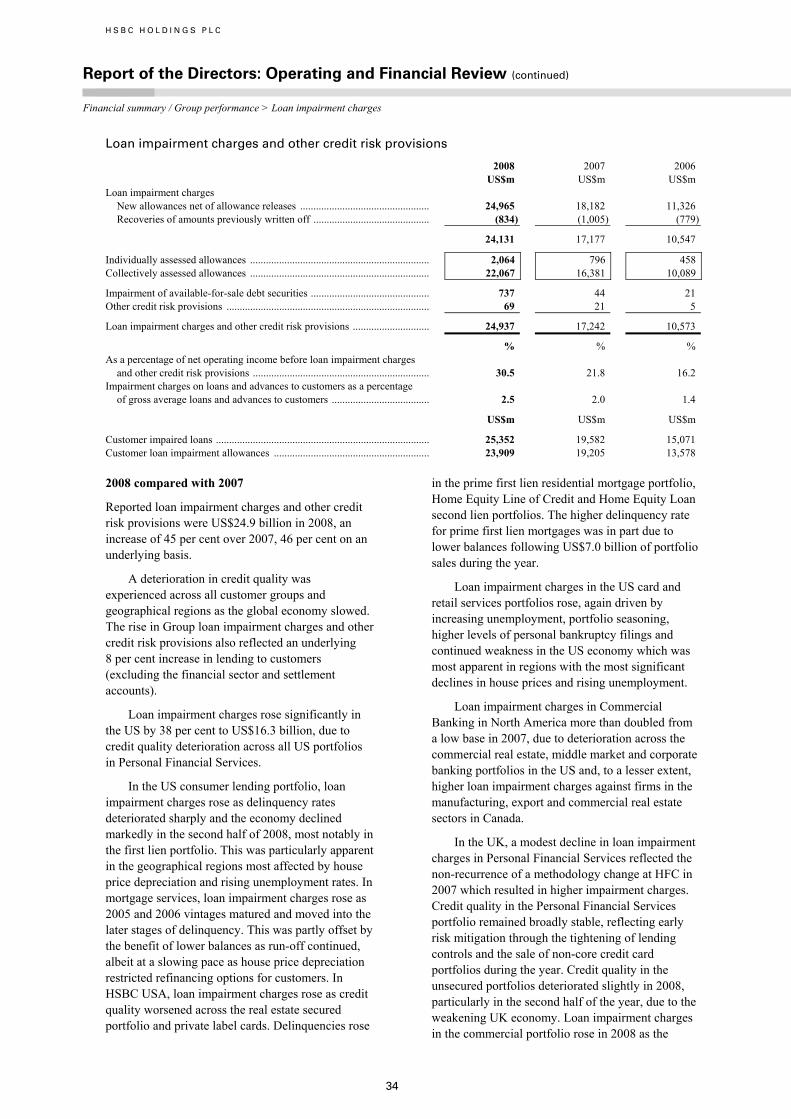
H S B C H O L D I N G S P L C
Report of the Directors: Operating and Financial Review (continued)
Financial summary / Group performance > Loan impairment charges
34
Loan impairment charges and other credit risk provisions
2008US$m
2007 US$m
2006US$m
Loan impairment charges New allowances net of allowance releases ................................................. 24,965 18,182 11,326 Recoveries of amounts previously written off ............................................ (834) (1,005) (779)
24,131 17,177 10,547
Individually assessed allowances .................................................................... 2,064 796 458Collectively assessed allowances .................................................................... 22,067 16,381 10,089
Impairment of available-for-sale debt securities ............................................. 737 44 21 Other credit risk provisions ............................................................................. 69 21 5
Loan impairment charges and other credit risk provisions ............................. 24,937 17,242 10,573
% % % As a percentage of net operating income before loan impairment charges
and other credit risk provisions ................................................................... 30.5 21.8 16.2 Impairment charges on loans and advances to customers as a percentage
of gross average loans and advances to customers ..................................... 2.5 2.0 1.4
US$m US$m US$m
Customer impaired loans ................................................................................. 25,352 19,582 15,071 Customer loan impairment allowances ........................................................... 23,909 19,205 13,578 2008 compared with 2007
Reported loan impairment charges and other credit risk provisions were US$24.9 billion in 2008, an increase of 45 per cent over 2007, 46 per cent on an underlying basis.
A deterioration in credit quality was experienced across all customer groups and geographical regions as the global economy slowed. The rise in Group loan impairment charges and other credit risk provisions also reflected an underlying 8 per cent increase in lending to customers (excluding the financial sector and settlement accounts).
Loan impairment charges rose significantly in the US by 38 per cent to US$16.3 billion, due to credit quality deterioration across all US portfolios in Personal Financial Services.
In the US consumer lending portfolio, loan impairment charges rose as delinquency rates deteriorated sharply and the economy declined markedly in the second half of 2008, most notably in the first lien portfolio. This was particularly apparent in the geographical regions most affected by house price depreciation and rising unemployment rates. In mortgage services, loan impairment charges rose as 2005 and 2006 vintages matured and moved into the later stages of delinquency. This was partly offset by the benefit of lower balances as run-off continued, albeit at a slowing pace as house price depreciation restricted refinancing options for customers. In HSBC USA, loan impairment charges rose as credit quality worsened across the real estate secured portfolio and private label cards. Delinquencies rose
in the prime first lien residential mortgage portfolio, Home Equity Line of Credit and Home Equity Loan second lien portfolios. The higher delinquency rate for prime first lien mortgages was in part due to lower balances following US$7.0 billion of portfolio sales during the year.
Loan impairment charges in the US card and retail services portfolios rose, again driven by increasing unemployment, portfolio seasoning, higher levels of personal bankruptcy filings and continued weakness in the US economy which was most apparent in regions with the most significant declines in house prices and rising unemployment.
Loan impairment charges in Commercial Banking in North America more than doubled from a low base in 2007, due to deterioration across the commercial real estate, middle market and corporate banking portfolios in the US and, to a lesser extent, higher loan impairment charges against firms in the manufacturing, export and commercial real estate sectors in Canada.
In the UK, a modest decline in loan impairment charges in Personal Financial Services reflected the non-recurrence of a methodology change at HFC in 2007 which resulted in higher impairment charges. Credit quality in the Personal Financial Services portfolio remained broadly stable, reflecting early risk mitigation through the tightening of lending controls and the sale of non-core credit card portfolios during the year. Credit quality in the unsecured portfolios deteriorated slightly in 2008, particularly in the second half of the year, due to the weakening UK economy. Loan impairment charges in the commercial portfolio rose in 2008 as the

35
weakening property market led to higher impairment charges against construction companies and businesses dependent upon the real estate sector, particularly in the final quarter of the year. Impairment charges against banks rose due to some exposure to the Icelandic banks in 2008. In addition, rising levels of personal indebtedness resulted in lower releases and recoveries of charges than in 2007.
Higher loan impairment and other credit risk provisions within Global Banking and Markets in Europe reflected increased charges against certain corporate accounts and impairment recorded on available-for-sale debt securities.
In Mexico, loan impairment charges rose by US$513 million or 69 per cent, primarily in the credit card portfolio. This was due to a combination of higher lending volumes from organic expansion and higher delinquency rates which were driven by a deterioration in credit quality as the portfolio continued to season and move into the later stages of delinquency. Management took action to enhance collection activity and improve the quality of new business. Impairment charges in the commercial portfolio also rose due to credit quality deterioration among small and medium-sized enterprises as the economy weakened.
In Hong Kong, the rise in loan impairment charges was driven by weakness in parts of the export sector within the commercial portfolio in the second half of 2008. In Global Banking and Markets, credit impairment charges within Balance Sheet Management principally reflected losses on debt securities and paper issued by financial institutions previously rated at investment grade which failed in the year.
In Rest of Asia-Pacific, the growth in loan impairment charges reflected a combination of the expansion of consumer lending and credit quality deterioration in India and the Middle East. In addition, higher impairment charges in Commercial Banking were driven by a deterioration in credit quality in the second half of the year.
For the Group as a whole, the aggregate outstanding customer loan impairment allowances at 31 December 2008 of US$23.9 billion represented 2.6 per cent of gross customer advances (net of reverse repos and settlement accounts), compared with 2.0 per cent at the end of 2007.
2007 compared with 2006
Reported loan impairment charges and other credit risk provisions were US$17.2 billion, a 63 per cent increase over 2006.
Loan impairment charges increased by 58 per cent, reflecting substantially higher losses in the US consumer finance loan book, primarily in mortgage lending, but also in the credit cards portfolio in the final part of the year. US delinquency rates increased during 2007 as falling house prices constrained customers’ ability to refinance their loans.
The rise in Group charges also reflected an underlying 7 per cent increase in lending to customers (excluding lending to the financial sector and settlement accounts).
In North America, loan impairment charges increased by 79 per cent to US$12.2 billion. The main factor driving this deterioration was the impact of the weaker housing market on both economic activity and the ability of borrowers to extend or refinance debt. In addition, seasoning and mix change within the credit cards portfolio, and increases in bankruptcy filings after the exceptionally low levels seen in 2006 following changes in legislation, added to loan impairment charges.
The real estate secured portfolios experienced continuing deterioration in credit quality as a lack of demand for securitised sub-prime mortgages and falls in house prices severely restricted refinancing options for many customers. Loan impairment charges rose by 41 per cent to US$3.1 billion and by 139 per cent to US$4.1 billion in the mortgage services business and in consumer lending, respectively. Delinquency rates exceeded recent historical trends, particularly for those loans originated in 2005 and 2006. Performance was weakest in housing markets which had previously experienced the steepest home price appreciation, as well as in second lien products and stated income products.
US card services experienced an increase in loan impairment charges from a combination of growth in balances, higher losses in the final part of the year as the economy slowed, a rise in bankruptcy rates to near historical levels, and a shift in portfolio mix to higher levels of non-prime loans.
In the UK, loan impairment charges rose, primarily in the consumer finance business. Delinquency rates on mortgages in the UK offered through HSBC Finance remained stable throughout 2007, with delinquency rates for loans offered in 2006 and 2007 lower than in the preceding two

H S B C H O L D I N G S P L C
Report of the Directors: Operating and Financial Review (continued)
Financial summary / Group performance > Operating expenses
36
years. In the rest of the UK business, loan impairment charges in the second half of 2007 were lower than in the first half of the year, as overall credit quality improved following measures taken to tighten underwriting standards and improve the credit quality of new business. Although losses from mortgage lending remained low, maximum loan to value ratios were reduced during the year to mitigate the effects of a possible housing market downturn.
In Mexico, higher loan impairment charges were driven by strong growth in loan balances, a deterioration in credit quality and portfolio seasoning.
For the Group as a whole, the aggregate outstanding customer loan impairment allowances at 31 December 2007 of US$19.2 billion represented 2.0 per cent of gross customer advances (net of reverse repos and settlement accounts), compared with 1.6 per cent at the end of 2006.
Impaired loans to customers were US$18.3 billion at 31 December 2007 compared with US$13.8 billion at 31 December 2006. On a constant currency basis, impaired loans to customers were 28 per cent higher than in 2006 compared with customer lending growth (excluding loans to the financial sector and settlement accounts) of 7 per cent.
Operating expenses
2008 2007 2006 US$m US$m US$m
By expense category Employee compensation and benefits1 ............................................................ 20,792 21,334 18,500 Premises and equipment (excluding depreciation and impairment) ............... 4,305 3,966 3,389 General and administrative expenses .............................................................. 10,955 11,328 9,434
Administrative expenses .................................................................................. 36,052 36,628 31,323 Depreciation and impairment of property, plant and equipment .................... 1,750 1,714 1,514 Amortisation and impairment of intangible assets .......................................... 733 700 716 Goodwill impairment ....................................................................................... 10,564 – –
Total operating expenses ................................................................................. 49,099 39,042 33,553
At 31 December 2008 2007 2006 Staff numbers (full-time equivalent) Europe .............................................................................................................. 82,093 82,166 78,311 Hong Kong ...................................................................................................... 29,330 27,655 27,586 Rest of Asia-Pacific ......................................................................................... 98,159 88,573 72,265 North America ................................................................................................. 44,725 52,722 55,642 Latin America .................................................................................................. 58,559 64,404 64,900
Total staff numbers .......................................................................................... 312,866 315,520 298,704
1 A charge of US$135 million was realised in 2006 arising from the waiver of the TSR-related performance condition in respect of the 2003 awards under the HSBC Holdings Group Share Option Plan.
2008 compared with 2007
Reported operating expenses increased by US$10.1 billion to US$49.1 billion, due to an impairment charge of US$10.6 billion to fully write off goodwill in Personal Financial Services in North America. Excluding this, operating expenses remained broadly in line on both reported and underlying bases.
Employee compensation and benefits fell marginally. Lower discretionary bonuses reflected weaker performance in the current economic conditions. A review of actuarial assumptions on employees’ defined benefit pensions resulted in lower service costs in the UK. The restructuring of the consumer finance business in North America led to reduced headcount and lower costs. This was partially offset by higher salaries and increased
headcount to support business expansion, mainly in Asia. Restructuring costs were incurred primarily in Latin America and Europe.
Premises and equipment costs increased primarily in the UK and the Rest of Asia-Pacific region, driven by investment in technology and extensions and improvements to the branch and ATM networks. As a consequence, repairs and maintenance costs rose. Commercial property rental costs also increased as a result of higher prices, new rentals and sale and leaseback deals.
General and administrative expenses decreased, primarily due to a one-off recovery of US$110 million of previous years’ transactional taxes in Brazil and the non-recurrence of a number of one-off items in 2007, most notably (i) ex-gratia payments made in the UK in respect of overdraft

37
fees, (ii) the provision for reimbursement of certain charges on historic will trusts and other related services in the UK, (iii) the indemnification agreement with Visa ahead of Visa’s IPO, and (iv) restructuring charges in the US consumer finance business incurred in 2007. These were partly offset by an increase in the Financial Services compensation scheme levy in the UK and an increase in a litigation provision in Asia.
Goodwill impairment amounting to US$10.6 billion was booked following the continued deterioration in economic and credit conditions in North America. For further information see Note 22 on the Financial Statements.
2007 compared with 2006
Reported operating expenses increased by US$5.5 billion to US$39.0 billion. On an underlying basis, cost growth was 10 per cent.
Employee compensation and benefits rose due to increased headcount employed to support business expansion in Rest of Asia-Pacific and Europe and higher salaries and bonuses. Salary increases reflected inflationary pressures and performance as bonuses rose in response to revenue growth. A change in actuarial assumptions regarding the staff defined benefit pension scheme in the UK led to increased costs. Staff numbers in North America fell as the consumer finance business was restructured, resulting in the discontinuation of certain business channels in mortgage services and the closing of branch offices in consumer lending.
Premises and equipment costs increased on investments in technology, straight-through
processing and extending and improving the branch and ATM networks. In particular, there was investment in the distribution platform in Latin America, Middle East, India and mainland China. The retail bank branch network in North America was extended both within and beyond the Group’s traditional spheres of operation to support the expansion of retail and Commercial Banking businesses, increasing premises and equipment costs as a consequence. Commercial property rental costs rose in Hong Kong’s dynamic economy, the effect magnified by a sale and leaseback agreement on a headquarters building in 2006. In France, the IT systems inherited with the acquisition of HSBC France were replaced with HSBC’s universal banking platform.
General and administrative expenses rose in support of the business expansion and a number of one-off costs. Higher transaction volumes drove processing costs and transactional taxes while business expansion was supported by marketing expenditure. In the UK, ex-gratia payments of US$227 million were expensed in respect of overdraft fees applied in previous years and a provision of US$169 million was raised for reimbursement of certain charges on historic will trusts and other related services. In the US, the business incurred US$70 million of one-off costs arising from the indemnification agreement with Visa ahead of its planned IPO. The US consumer finance business incurred restructuring charges of US$103 million resulting from the discontinuation of the wholesale and correspondent channels in mortgage services and the closing of branch offices in consumer lending.
Cost efficiency ratios
2008%
2007 %
2006%
HSBC .............................................................................................................. 60.1 49.4 51.3 Personal Financial Services .......................................................................... 76.4 50.3 49.7 Europe ............................................................................................................. 62.7 64.8 59.2 Hong Kong ...................................................................................................... 32.2 27.2 32.2 Rest of Asia-Pacific ......................................................................................... 73.5 73.9 71.1 North America ................................................................................................. 106.8 42.3 42.3 Latin America .................................................................................................. 59.7 61.3 65.6 Commercial Banking .................................................................................... 43.0 44.8 43.7 Europe ............................................................................................................. 44.2 49.3 46.7 Hong Kong ...................................................................................................... 26.2 24.9 26.1 Rest of Asia-Pacific ......................................................................................... 41.0 42.9 42.5 North America ................................................................................................. 46.1 45.1 44.9 Latin America .................................................................................................. 55.0 54.3 55.9

H S B C H O L D I N G S P L C
Report of the Directors: Operating and Financial Review (continued)
Financial summary / Group performance > Share of profit in associates and joint ventures / Economic profit
38
Share of profit in associates and joint ventures
2008US$m
2007 US$m
2006US$m
Bank of Communications ................................................................................ 741 445 259 Ping An Insurance ........................................................................................... 324 518 245 Industrial Bank ................................................................................................ 221 128 71 The Saudi British Bank ................................................................................... 251 216 258 Other ................................................................................................................ 63 159 (10)Share of profit in:
– associates .................................................................................................. 1,600 1,466 823 – joint ventures ............................................................................................ 61 37 23
Share of profit in associates and joint ventures ............................................... 1,661 1,503 846
2008 compared with 2007
Share of profit in associates and joint ventures was US$1.7 billion, an increase of 11 per cent compared with 2007, and 4 per cent on an underlying basis.
This increase was driven by higher contributions from Bank of Communications, Industrial Bank, and The Saudi British Bank, partly offset by lower profits from Ping An Insurance.
HSBC’s share of profits from the Bank of Communications rose by 52 per cent to US$741 million, primarily driven by increased margins, as yields rose following higher base rates in mainland China through most of 2008, and balance sheet growth. Growth in revenues from the asset custody business, financial advisory services and bank card transactions also drove higher profits.
HSBC’s share of profits from Ping An Insurance decreased by 43 per cent, primarily due to the impairment of Ping An Insurance’s investment in Fortis SA/NV and Fortis N.V. (‘Fortis Investments’), following significant declines in its market value.
Profits from the Saudi British Bank were higher by 16 per cent due to strong balance sheet growth, particularly in the lending portfolio, augmented by higher fees from cards, account services and trade.
Profits from Industrial Bank grew by 72 per cent, driven by increased investment income and balance sheet growth.
The share of profits from joint ventures rose due to growth in HSBC Saudi Arabia Ltd and the recognition of profits in HSBC Merchant Services UK Ltd, the new merchant acquiring venture with Global Payments Inc.
An adjustment to the embedded value of HSBC Assurances in 2007 did not recur.
2007 compared with 2006
Share of profit in associates and joint ventures of US$1.5 billion was 78 per cent higher than in 2006, on both reported and underlying bases.
Profit from associates and joint ventures rose due to increased contributions from HSBC’s strategic investments in mainland China. Profit from Bank of Communications, Ping An Insurance and Industrial Bank improved significantly, driven largely by the thriving local economy.
HSBC’s share of profit from Ping An Insurance rose by 101 per cent to US$518 million as a result of robust growth, notably from life insurance products, and the realisation of synergistic gains across Ping An Insurance’s other business offerings.
Profit from the Bank of Communications rose by 64 per cent to US$445 million as a result of improved performance across the associate’s various product offerings. Increased income from credit and treasury products and significant growth in fee income contributed to the increase in profits.
HSBC’s share of profits from the Saudi British Bank decreased by 22 per cent to US$216 million, driven by the effects of a significant correction to the local stock market in the second half of 2006.
A US$73 million adjustment to the embedded value of HSBC Assurances, an associate in France, resulted in an increase in profits from associates.

39
Economic profit
HSBC’s internal performance measures include economic profit, a calculation which compares the return on financial capital invested in HSBC by its shareholders with the cost of that capital. HSBC prices its cost of capital internally and the difference between that cost and the post-tax profit attributable to ordinary shareholders (less goodwill previously amortised in respect of the French regional banks sold in 2008) represents the amount of economic profit generated. Economic profit generated is used by management as a means of deciding where to allocate resources so that they will be most productive.
In order to concentrate on external factors rather than measurement bases, HSBC emphasises the trend in economic profit ahead of absolute amounts within business units. In order to ensure consistency and comparability with the five-year strategic plan completed in 2008, the cost of capital on a consolidated basis remains at 10 per cent.
Economic profit decreased by US$14.8 billion to a loss of US$8.2 billion. Profit attributable fell, while average shareholders’ equity increased marginally. The decline in profit was predominately driven by the US$10.6 billion goodwill impairment charge relating to the North American Personal Financial Services business, alongside a significant increase in loan impairment charges and write-downs in credit trading, leveraged and acquisition finance, and monoline exposures. The comparative period included dilution gains of US$1.0 billion (excluding minority interests) which were not repeated. These effects were partially offset by fair value gains on own debt, driven by a widening of credit spreads, of US$6.6 billion compared with US$3.1 billion in 2007. The lower return on average invested capital led to a decrease in economic profit and an erosion in economic spread, which fell by 11.3 percentage points compared with 2007. Excluding the goodwill impairment charge, the economic profit spread decreased by 3.6 percentage points compared with 2007.
2008 2007 US$m %1 US$m %1
Average total shareholders’ equity ......................................................... 122,292 120,346 Adjusted by:
Goodwill previously amortised or written off ................................... 8,152 8,172 Property revaluation reserves ............................................................. (828) (898) Reserves representing unrealised losses on effective
cash flow hedges ............................................................................ 997 425 Reserves representing unrealised (gains)/losses on
available-for-sale securities ........................................................... 9,163 (1,918) Preference shares and other equity instruments ................................. (2,685) (1,405)
Average invested capital2 ........................................................................ 137,091 124,722
Return on invested capital3 ..................................................................... 5,497 4.0 19,043 15.3
Benchmark cost of capital ...................................................................... (13,709) (10.0) (12,472) (10.0)
Economic profit/(loss) and spread .......................................................... (8,212) (6.0) 6,571 5.3
1 Expressed as a percentage of average invested capital. 2 Average invested capital is measured as average total shareholders’ equity after:
– adding back the average balance of goodwill amortised pre-transition to IFRSs or subsequently written-off, directly to reserves (less goodwill previously amortised in respect of the French regional banks sold in 2008);
– deducting the average balance of HSBC’s revaluation surplus relating to property held for own use. This reserve was generated when determining the deemed carrying cost of such properties on transition to IFRSs and will run down over time as the properties are sold;
– deducting average preference shares and other equity instruments issued by HSBC Holdings, and; – deducting average reserves for unrealised gains/(losses) on effective cash flow hedges and available-for-sale securities.
3 Return on invested capital is based on the profit attributable to ordinary shareholders of the parent company less goodwill previously amortised in respect of the French regional banks sold in 2008.

H S B C H O L D I N G S P L C
Report of the Directors: Operating and Financial Review (continued)
Financial summary > Balance sheet > Movement in 2008
40
Balance sheet
At 31 December 2008
US$m 2007
US$m 2006
US$m
ASSETS Cash and balances at central banks ................................................................. 52,396 21,765 12,732 Trading assets .................................................................................................. 427,329 445,968 328,147 Financial assets designated at fair value ......................................................... 28,533 41,564 20,573 Derivatives ....................................................................................................... 494,876 187,854 103,702 Loans and advances to banks .......................................................................... 153,766 237,366 185,205 Loans and advances to customers ................................................................... 932,868 981,548 868,133 Financial investments ...................................................................................... 300,235 283,000 204,806 Other assets ...................................................................................................... 137,462 155,201 137,460
Total assets ..................................................................................................... 2,527,465 2,354,266 1,860,758 LIABILITIES AND EQUITY Liabilities Deposits by banks ............................................................................................ 130,084 132,181 99,694 Customer accounts ........................................................................................... 1,115,327 1,096,140 896,834 Trading liabilities ............................................................................................. 247,652 314,580 226,608 Financial liabilities designated at fair value .................................................... 74,587 89,939 70,211 Derivatives ....................................................................................................... 487,060 183,393 101,478 Debt securities in issue .................................................................................... 179,693 246,579 230,325 Liabilities under insurance contracts ............................................................... 43,683 42,606 17,670 Other liabilities ................................................................................................ 149,150 113,432 103,010
Total liabilities ................................................................................................ 2,427,236 2,218,850 1,745,830 Equity Total shareholders’ equity ............................................................................... 93,591 128,160 108,352 Minority interests ............................................................................................. 6,638 7,256 6,576
Total equity .................................................................................................... 100,229 135,416 114,928
Total equity and liabilities ............................................................................ 2,527,465 2,354,266 1,860,758
A more detailed consolidated balance sheet is contained in the Financial Statements on page 334.
Movement from 31 December 2007 to 31 December 2008
Total assets amounted to US$2.5 trillion, 7 per cent higher than at 31 December 2007. After excluding currency movements, the disposal of HSBC’s French regional subsidiaries and the acquisition of the assets, liabilities and operations of The Chinese Bank in 2008, underlying assets rose by 22 per cent, driven by growth in derivative assets.
The expansion in the Group’s balance sheet was largely attributable to increases in derivative assets and liabilities, and was due to growth in the fair value of these positions rather than a rise in their notional contract amounts. Excluding the growth in derivative liabilities, customer accounts formed an increasing share of the Group’s liabilities as depositors and savers responded to HSBC’s reputation for strength and security. As a result, a proportion of the Group’s funding repayable on demand or within one year rose. For information on the Group’s management of liquidity, see pages 235 to 240.
The Group’s tier 1 capital ratio declined from 9.3 per cent to 8.3 per cent. For detail on regulatory capital and risk weighted assets, see pages 274 to 280.
The following commentary is on an underlying basis.
Assets
The Group’s cash and balances at central banks rose substantially, particularly in Hong Kong as additional liquidity was injected into the banking system, and in the US where excess liquidity was required in the short-term as part of a planned transfer of assets between the Group’s subsidiaries.
Trading assets increased by 11 per cent. The majority of the rise occurred on 30 September 2008, following the Group’s consolidation of five Constant Net Asset Value (‘CNAV’) funds with assets of around US$40 billion. The decision to consolidate these funds was based on actions taken to support them. For further details of these actions, see page 180. The rise was partly offset by the reclassification of US$18 billion of trading assets

41
partly to ‘Loans and Advances’ and partly to ‘Financial investments’ following the changes to International Accounting Standard 39 – ‘Financial Instruments – Recognition and Measurement’ (‘IAS39’) issued in October 2008 by the IASB.
Excluding these effects, trading assets remained broadly unchanged as rises in Europe and Asia, where the Group increased its holdings of government bonds, were offset by the run-off of the mortgage-backed securities portfolio in the US and a reduction in debt securities held for balance sheet management purposes due to changes in liquidity and risk preference.
An 18 per cent decline in financial assets designated at fair value was driven by falling equity markets, which reduced the value of assets held to meet life insurance liabilities, particularly in Hong Kong and France. To the extent that these liabilities related to unit-linked and participating insurance contracts, there was a corresponding decline in liabilities under insurance contracts. The underperformance of certain investment products also led clients to withdraw funds.
Derivative assets rose significantly, led by an increase in interest rate derivatives with further growth in credit and foreign exchange derivatives. The global falls in interest rates resulted in significant gaps between the fixed and floating legs of interest rate swaps, leading to substantial mark-to-market increases in the value of interest rate swap positions. Widening credit spreads and increasing market volatility caused mark-to-market increases in the value of credit derivatives held in the UK and the US. Foreign exchange derivative asset growth was driven by a combination of increased volumes and mark-to-market rises in existing positions in the UK. Under IFRS, only limited netting is allowed between derivative assets and liabilities with the same counterparty, and the balance sheet value is therefore significantly higher than the credit exposure. For information on maximum exposure to credit risk, see pages 197 to 200.
A 29 per cent decline in loans and advances to banks occurred mainly in Hong Kong and the UK where Balance Sheet Management invested a greater proportion of its assets in government and government-guaranteed debt.
HSBC also reduced counterparty credit risk in the UK by channelling an increasing proportion of lending to banks through the London Clearing House in the form of reverse repos. This is recorded within customer loans even when the end counterparty is a bank, which means the fall in loans and advances to banks and the rise in loans and advances to
customers are magnified. The rise in loans and advances to customers was also inflated by the reclassification of US$15 billion of assets following changes to IAS39 isused in October 2008.
Further increases in loans and advances to customers were due to growth in mortgage lending in Europe and Asia, as well as to a rise in overdraft balances to customers whose exposures are managed net but reported gross under IFRS. These rises were offset by a reduction in customer lending in the US due to the run-off of the mortgage services portfolio, the sale of certain loan portfolios at HSBC USA, tighter underwriting criteria which restricted originations in the consumer lending and credit card portfolios, and the cessation of most new originations in the US vehicle finance portfolio.
Financial investments grew by 15 per cent as Balance Sheet Management assets were increasingly classified as available-for-sale financial investments rather than trading assets. As noted above, there was also a rise in financial investments in the UK as the Group placed a greater proportion of surplus funds in government issued or guaranteed debt. The growth in the Group’s financial investments was partly offset by a reduction in holdings of asset-backed securities, including those held through special purpose entities, which decreased due to a combination of asset sales, amortisation and write-downs. For details of the Group’s asset-backed securities portfolios, see pages 145 to 158.
Liabilities
Deposits by banks rose by 14 per cent, driven, in particular, by increases in France, due to a rise in repo activity to finance increased trading activity, and in Hong Kong, where banks responded to HSBC’s reputation for strength and security and deposited their surplus liquidity with the Group.
Customer account balances grew by 16 per cent, driven by strong inflows from customers attracted by HSBC’s relative financial strength as they withdrew funds from more volatile investments.
Trading liabilities declined 9 per cent as a fall in third-party funding requirements allowed a reduction in liabilities in Hong Kong, and repo transactions were reduced in Europe to manage liquidity and counterparty credit risk.
A significant widening of credit spreads led to further falls in the fair value of the Group’s own debt which reduced financial liabilities designated at fair value. This was compounded by a decline in liabilities in the UK due to the underperformance of certain investment products.

H S B C H O L D I N G S P L C
Report of the Directors: Operating and Financial Review (continued)
Financial summary > Balance sheet > Movement in 2008 / Average balance sheet and NII
42
Derivative businesses are managed within market risk limits, and as a consequence the value of derivative liabilities broadly matched the value of derivative assets.
A decline of 22 per cent in debt securities in issue was driven by the US as maturing debt securities did not need replacing as the funding requirements of the consumer finance business declined as its balance sheet contracted. There was also a reduction in debt securities in issue in line with the decrease in holdings of asset-backed securities.
Liabilities under insurance contracts increased by 10 per cent, largely due to new business sales in Hong Kong, France and the UK, partly offset by reduced liabilities on unit-linked policies.
Other liabilities rose by 50 per cent due to the consolidation of the CNAV funds described above.
Equity
Total shareholders’ equity declined by 19 per cent, which mainly arose from a decline in the available-for-sale reserve. The continuing market turmoil led to falls in the market values of assets held in HSBC’s available-for-sale portfolio. These declines mainly represented market illiquidity rather than impairment of the assets concerned, but they nonetheless reduced the value of the available-for-sale reserve from a positive reserve of US$0.9 billion to a negative reserve of US$20.6 billion.
Average balance sheet and net interest income
Average balances and related interest are shown for the domestic operations of HSBC’s principal commercial banks by geographic region. ‘Other operations’ comprise the operations of the principal Commercial Banking and consumer finance entities outside their domestic markets and all other banking operations, including investment banking balances and transactions.
Average balances are based on daily averages for the principal areas of HSBC’s banking activities with monthly or less frequent averages used elsewhere.
Balances and transactions with fellow subsidiaries are reported gross in the principal Commercial Banking and consumer finance entities within ‘Other interest-earning assets’ and ‘Other interest-bearing liabilities’ as appropriate and the elimination entries are included within ‘Other operations’ in those two categories.
Net interest margin numbers are calculated by dividing net interest income as reported in the income statement by the average interest-earning assets from which interest income is reported within the ‘Net interest income’ line of the income statement. Interest income and interest expense arising from trading assets and liabilities and the funding thereof is included within ‘Net trading income’ in the income statement.

43
Assets
2008 2007 2006
Averagebalance
Interestincome Yield
Average balance
Interestincome Yield
Average balance
Interestincome Yield
US$m US$m % US$m US$m % US$m US$m %
Summary
Total interest-earning assets (itemised below) ...................................................... 1,466,622 91,301 6.23 1,296,701 92,359 7.12
1,113,404 75,879 6.82
Trading assets7 ............................................. 428,539 16,742 3.91 374,973 17,562 4.68 288,605 12,445 4.31Financial assets designated at fair value8 .... 37,303 1,108 2.97 14,899 813 5.46 7,681 290 3.78Impairment provisions ................................. (20,360) (15,309) (11,864) Non-interest-earning assets ......................... 596,885 440,686 291,741
Total assets and interest income .................. 2,508,989 109,151 4.35 2,111,950 110,734 5.24 1,689,567 88,614 5.24 Short-term funds and loans and advances
to banks
Europe HSBC Bank ..................... 46,703 2,187 4.68 49,910 2,592 5.19 33,856 1,536 4.54
HSBC Private Banking
Holdings (Suisse) ........ 8,040 333 4.14 5,295 229 4.32
4,956 190 3.83 HSBC France .................. 35,801 1,495 4.18 31,591 1,294 4.10 20,197 690 3.42
Hong Kong Hang Seng Bank ............. 17,402 587 3.37 13,054 609 4.67 10,360 483 4.66
The Hongkong and Shanghai Banking Corporation ................. 47,244 1,344 2.84 50,210 2,352 4.68
38,802 1,645 4.24
Rest of Asia-Pacific
The Hongkong and Shanghai Banking Corporation ................. 27,907 881 3.16 19,286 810 4.20
13,388 520 3.88 HSBC Bank Malaysia ..... 4,659 165 3.54 2,861 103 3.60 2,492 87 3.49 HSBC Bank Middle East . 6,028 188 3.12 6,328 324 5.12 4,279 208 4.86
North America HSBC Bank USA ............ 9,595 328 3.42 9,393 477 5.08 8,422 465 5.52 HSBC Bank Canada ........ 3,354 107 3.19 3,810 174 4.57 3,167 138 4.36
Latin America HSBC Mexico ................. 3,682 247 6.71 3,555 239 6.72 3,395 227 6.69 Brazilian operations9 ....... 7,959 951 11.95 5,790 645 11.14 4,129 572 13.85 HSBC Bank Panama ....... 1,133 30 2.65 897 33 3.68 130 9 6.92 HSBC Bank Argentina .... 612 43 7.03 304 16 5.26 196 8 4.08
Other operations .......................................... 19,992 760 3.80 19,087 898 4.70 16,686 618 3.70
240,111 9,646 4.02 221,371 10,795 4.88 164,455 7,396 4.50
For footnotes, see page 143.

H S B C H O L D I N G S P L C
Report of the Directors: Operating and Financial Review (continued)
Financial summary > Balance sheet > Average balance sheet and NII
44
Assets (continued) 2008 2007
2006
Averagebalance
Interestincome Yield
Average balance
Interestincome Yield
Average balance
Interestincome Yield
US$m US$m % US$m US$m % US$m US$m %
Loans and advances to customers
Europe HSBC Bank ..................... 288,214 18,587 6.45 237,231 18,078 7.62 226,528 14,166 6.25
HSBC Private Banking
Holdings (Suisse) ........ 12,355 494 4.00 9,805 507 5.17
7,134 338 4.74 HSBC France .................. 73,455 3,604 4.91 68,027 3,219 4.73 52,990 2,463 4.65 HSBC Finance ................. 4,808 505 10.50 5,492 611 11.13 5,932 671 11.31
Hong Kong Hang Seng Bank .............. 42,304 1,589 3.76 37,827 2,120 5.60 34,416 1,952 5.67
The Hongkong and Shanghai Banking Corporation ................. 54,628 2,291 4.19 48,134 2,901 6.03
47,292 2,843 6.01
Rest of Asia-Pacific
The Hongkong and Shanghai Banking Corporation ................. 77,741 5,163 6.64 59,286 4,321 7.29
52,159 3,449 6.61 HSBC Bank Malaysia ..... 8,407 553 6.58 7,467 507 6.79 6,292 430 6.83 HSBC Bank Middle East 23,697 1,549 6.54 15,125 1,200 7.93 12,757 957 7.50
North America HSBC Bank USA ............ 93,088 5,758 6.19 90,091 6,585 7.31 88,563 6,141 6.93 HSBC Finance ................. 140,957 15,835 11.23 153,658 18,086 11.77 147,336 17,061 11.58 HSBC Bank Canada ........ 48,331 2,455 5.08 43,570 2,598 5.96 35,055 2,037 5.81
Latin America HSBC Mexico ................. 17,252 2,565 14.87 16,469 2,187 13.28 13,193 1,532 11.61 Brazilian operations9 ....... 19,642 4,879 24.84 13,569 3,895 28.71 9,461 3,244 34.29 HSBC Bank Panama ....... 8,620 810 9.40 8,113 778 9.59 1,189 92 7.74 HSBC Bank Argentina .... 2,136 378 17.70 1,667 241 14.46 838 107 12.77
Other operations .......................................... 28,027 1,707 6.09 21,318 1,790 8.40 19,795 1,528 7.72
943,662 68,722 7.28 836,849 69,624 8.32 760,930 59,011 7.76 Financial investments
Europe HSBC Bank ..................... 83,725 3,840 4.59 45,885 2,431 5.30 42,726 1,977 4.63
HSBC Private Banking
Holdings (Suisse) ........ 12,018 553 4.60 10,372 511 4.93
8,729 391 4.48 HSBC France .................. 14,862 795 5.35 10,357 511 4.93 2,545 95 3.73
Hong Kong Hang Seng Bank .............. 24,031 1,063 4.42 30,791 1,550 5.03 27,288 1,224 4.49
The Hongkong and Shanghai Banking Corporation ................. 15,361 563 3.67 20,717 1,017 4.91
20,362 911 4.47
Rest of Asia-Pacific
The Hongkong and Shanghai Banking Corporation ................. 31,992 1,507 4.71 23,739 1,065 4.49
17,179 737 4.29 HSBC Bank Malaysia ..... 937 36 3.84 1,515 56 3.70 954 36 3.77 HSBC Bank Middle East 5,671 144 2.54 3,654 174 4.76 1,387 72 5.19
North America HSBC Bank USA ............ 25,089 1,232 4.91 23,373 1,189 5.09 22,214 1,109 4.99 HSBC Finance ................. 2,908 143 4.92 4,072 229 5.62 3,724 200 5.37 HSBC Bank Canada ........ 7,037 197 2.80 6,068 258 4.25 4,351 174 4.00
Latin America HSBC Mexico ................. 3,470 244 7.03 3,327 319 9.59 4,049 427 10.55 Brazilian operations9 ....... 6,758 853 12.62 5,596 672 12.01 3,862 501 12.97 HSBC Bank Panama ....... 618 47 7.61 709 58 8.18 429 21 4.90 HSBC Bank Argentina .... 287 47 16.38 563 68 12.08 311 38 12.22
Other operations .......................................... 29,632 1,354 4.57 27,252 1,407 5.16 24,742 1,191 4.81
264,396 12,618 4.77 217,990 11,515 5.28 184,852 9,104 4.93
For footnotes, see page 143.

45
Assets (continued)
2008 2007 2006
Averagebalance
Interestincome Yield
Average balance
Interestincome Yield
Average balance
Interestincome Yield
US$m US$m % US$m US$m % US$m US$m %
Other interest-earning assets
Europe HSBC Bank ..................... 25,885 630 2.43 11,170 652 5.84 9,938 652 6.56
HSBC Private Banking
Holdings (Suisse) ........ 21,189 875 4.13 16,360 882 5.39
14,558 732 5.03 HSBC France .................. 23,414 630 2.69 12,158 419 3.45 6,434 173 2.69
Hong Kong Hang Seng Bank ............. 1,629 48 2.95 832 42 5.05 538 28 5.20
The Hongkong and Shanghai Banking Corporation ................. 33,571 949 2.83 27,057 1,237 4.57
19,246 909 4.72
Rest of Asia-Pacific
The Hongkong and Shanghai Banking Corporation ................. 24,492 352 1.44 11,137 588 5.28
6,938 449 6.47 HSBC Bank Malaysia ..... 212 7 3.30 231 12 5.19 178 10 5.62 HSBC Bank Middle East . 843 63 7.47 758 52 6.86 380 32 8.42
North America HSBC Bank USA ............ 3,091 188 6.08 3,731 231 6.19 1,867 82 4.39 HSBC Finance ................ 2,638 63 2.39 1,724 89 5.16 767 43 5.61 HSBC Bank Canada ........ 1,025 25 2.44 960 31 3.23 1,006 32 3.18
Latin America HSBC Mexico ................. 193 2 1.04 – – – – – – Brazilian operations9 ....... 1,438 147 10.22 840 75 8.93 1,004 190 18.92 HSBC Bank Panama ....... 1,807 23 1.27 1,351 40 2.96 – – – HSBC Bank Argentina .... 58 1 1.72 39 1 2.56 23 3 13.04
Other operations .......................................... (123,032) (3,688) (67,857) (3,926) (59,710) (2,967)
18,453 315 1.71 20,491 425 2.07 3,167 368 11.62 Total interest-earning assets
Europe HSBC Bank ..................... 444,527 25,244 5.68 344,196 23,753 6.90 313,048 18,331 5.86
HSBC Private Banking
Holdings (Suisse) ........ 53,602 2,255 4.21 41,832 2,129 5.09
35,377 1,651 4.67 HSBC France .................. 147,532 6,524 4.42 122,133 5,443 4.46 82,166 3,421 4.16 HSBC Finance ................ 4,808 505 10.50 5,492 611 11.13 5,932 671 11.31
Hong Kong Hang Seng Bank ............. 85,366 3,287 3.85 82,504 4,321 5.24 72,602 3,687 5.08
The Hongkong and Shanghai Banking Corporation ................. 150,804 5,147 3.41 146,118 7,507 5.14
125,702 6,308 5.02
Rest of Asia-Pacific
The Hongkong and Shanghai Banking Corporation ................. 162,132 7,903 4.87 113,448 6,784 5.98
89,664 5,155 5.75 HSBC Bank Malaysia ..... 14,215 761 5.35 12,074 678 5.62 9,916 563 5.68 HSBC Bank Middle East . 36,239 1,944 5.36 25,865 1,750 6.77 18,803 1,269 6.75
North America HSBC Bank USA ............ 130,863 7,506 5.74 126,588 8,482 6.70 121,066 7,797 6.44 HSBC Finance ................ 146,503 16,041 10.95 159,454 18,404 11.54 151,827 17,304 11.40 HSBC Bank Canada ........ 59,747 2,784 4.66 54,408 3,061 5.63 43,579 2,381 5.46
Latin America HSBC Mexico ................. 24,597 3,058 12.43 23,351 2,745 11.76 20,637 2,186 10.59 Brazilian operations9 ....... 35,797 6,830 19.08 25,795 5,287 20.50 18,456 4,507 24.42 HSBC Bank Panama ....... 12,178 910 7.47 11,070 909 8.21 1,748 122 6.98 HSBC Bank Argentina .... 3,093 469 15.16 2,573 326 12.67 1,368 156 11.40
Other operations .......................................... (45,381) 133 (200) 169 1,513 370
1,466,622 91,301 6.23 1,296,701 92,359 7.12 1,113,404 75,879 6.82
For footnotes, see page 143.

H S B C H O L D I N G S P L C
Report of the Directors: Operating and Financial Review (continued)
Financial summary > Balance sheet > Average balance sheet and NII
46
Total equity and liabilities
2008 2007 2006
Averagebalance
Interestexpense Cost
Average balance
Interestexpense Cost
Average balance
Interestexpense Cost
US$m US$m % US$m US$m % US$m US$m %Summary
Total interest-bearing liabilities (itemised below) ..................................................... 1,451,842 48,738 3.36 1,279,460 54,564 4.26
1,067,646 41,393 3.88
Trading liabilities ........................................ 277,940 11,029 3.97 250,572 12,186 4.86 224,050 9,842 4.39Financial liabilities designated at fair value
(excluding own debt issued) .................. 21,266 345 1.62 20,827 224 1.07
12,537 13 0.10Non-interest-bearing current accounts ....... 98,193 83,958 71,744 Total equity and other non-interest-bearing
liabilities ................................................. 659,747 477,133 313,590
Total equity and liabilities .......................... 2,508,988 60,112 2.40 2,111,950 66,974 3.17 1,689,567 51,248 3.03
Deposits by banks10
Europe HSBC Bank ..................... 48,167 1,875 3.89 44,787 2,148 4.80 32,825 1,311 3.99
HSBC Private Banking
Holdings (Suisse) ........ 4,493 105 2.34 690 22 3.19
1,030 33 3.20 HSBC France .................. 37,851 1,672 4.42 30,816 1,358 4.41 23,171 886 3.82
Hong Kong Hang Seng Bank .............. 1,696 55 3.24 2,993 123 4.11 2,031 84 4.14
The Hongkong and Shanghai Banking Corporation ................. 3,665 70 1.91 3,634 150 4.13
2,745 125 4.55
Rest of Asia-Pacific
The Hongkong and Shanghai Banking Corporation ................. 16,232 450 2.77 10,247 445 4.34
6,276 246 3.92 HSBC Bank Malaysia ..... 338 10 2.96 375 12 3.20 280 9 3.21 HSBC Bank Middle East 1,680 29 1.73 672 32 4.76 453 23 5.08
North America HSBC Bank USA ............ 11,015 220 2.00 6,933 414 5.97 3,695 208 5.63 HSBC Bank Canada ........ 1,391 41 2.95 1,681 93 5.53 1,520 68 4.47
Latin America HSBC Mexico ................. 822 32 3.89 983 63 6.41 781 50 6.40 Brazilian operations9 ....... 2,790 190 6.81 1,549 106 6.84 1,033 101 9.78 HSBC Bank Panama ....... 1,016 43 4.23 1,137 66 5.80 349 17 4.87 HSBC Bank Argentina .... 27 1 3.70 117 9 7.69 72 5 6.94
Other operations .......................................... 4,564 166 3.64 4,495 291 6.47 5,304 334 6.30
135,747 4,959 3.65 111,109 5,332 4.80 81,565 3,500 4.29 Financial liabilities designated at fair
value – own debt issued11
Europe HSBC Holdings ............... 18,675 721 3.86 15,142 822 5.43 15,132 745 4.92 HSBC Bank ..................... 8,805 529 6.01 9,907 525 5.30 7,888 373 4.73 HSBC France .................. 1,515 79 5.21 143 11 7.69
Hong Kong Hang Seng Bank .............. 127 6 4.72 126 6 4.76
North America HSBC Bank USA ............ 1,504 67 4.45 1,620 125 7.72 1,892 116 6.13 HSBC Finance ................. 32,126 1,563 4.87 31,889 2,079 6.52 29,917 1,877 6.27
Other operations .......................................... 1,083 168 15.51 – – – 461 49 10.63
63,835 3,133 4.91 58,827 3,568 6.07 55,290 3,160 5.72
For footnotes, see page 143.

47
Total equity and liabilities (continued)
2008 2007 2006
Averagebalance
Interestexpense Cost
Average balance
Interestexpense Cost
Average balance
Interestexpense Cost
US$m US$m % US$m US$m % US$m US$m %Customer accounts12 Europe HSBC Bank ..................... 305,702 10,092 3.30 270,965 10,576 3.90 221,369 7,031 3.18
HSBC Private Banking
Holdings (Suisse) ........ 37,778 1,349 3.57 30,955 1,485 4.80
25,346 1,069 4.22 HSBC France .................. 39,428 1,583 4.01 31,845 1,226 3.85 23,579 752 3.19
Hong Kong Hang Seng Bank .............. 66,142 914 1.38 61,227 1,900 3.10 54,267 1,712 3.15
The Hongkong and Shanghai Banking Corporation ................. 139,169 1,365 0.98 125,478 3,499 2.79
104,441 2,934 2.81
Rest of Asia-Pacific
The Hongkong and Shanghai Banking Corporation ................. 96,476 2,869 2.97 76,052 2,645 3.48
56,760 1,903 3.35 HSBC Bank Malaysia ..... 10,266 295 2.87 8,823 260 2.95 7,260 212 2.92 HSBC Bank Middle East 19,922 422 2.12 15,685 578 3.69 11,713 411 3.51
North America HSBC Bank USA ............ 86,701 2,069 2.39 78,138 3,051 3.90 71,031 2,490 3.51 HSBC Bank Canada ........ 34,090 967 2.84 30,060 1,090 3.63 25,277 804 3.18
Latin America HSBC Mexico ................. 14,612 561 3.84 14,230 548 3.85 13,625 471 3.46 Brazilian operations9 ....... 26,288 3,110 11.83 19,581 2,163 11.05 14,887 2,056 13.81 HSBC Bank Panama ....... 7,761 296 3.81 7,604 314 4.13 998 34 3.41 HSBC Bank Argentina .... 2,266 145 6.40 1,892 85 4.49 983 41 4.17
Other operations .......................................... 64,253 1,952 3.04 55,351 2,297 4.15 49,846 1,811 3.63
950,854 27,989 2.94 827,886 31,717 3.83 681,382 23,731 3.48
Debt securities in issue
Europe HSBC Bank ..................... 86,216 4,001 4.64 64,168 3,753 5.85 45,870 2,047 4.46 HSBC France .................. 30,815 1,447 4.70 28,757 1,207 4.20 19,818 633 3.19 HSBC Finance ................. 215 8 3.72 240 18 7.50 548 32 5.84
Hong Kong Hang Seng Bank .............. 1,685 57 3.38 1,734 80 4.61 1,622 64 3.95
Rest of Asia-Pacific
The Hongkong and Shanghai Banking Corporation ................. 8,995 640 7.12 8,979 559 6.23 7,990 438 5.48
HSBC Bank Malaysia ..... 475 20 4.21 318 13 4.09 371 13 3.50 HSBC Bank Middle East 2,650 90 3.40 2,086 119 5.70 – – –
North America HSBC Bank USA ............ 21,922 852 3.89 25,724 1,232 4.79 28,832 1,407 4.88 HSBC Finance ................. 98,096 3,765 3.84 115,520 5,311 4.60 112,353 5,047 4.49 HSBC Bank Canada ........ 16,957 604 3.56 14,771 640 4.33 10,616 460 4.33
Latin America HSBC Mexico ................. 2,693 243 9.02 1,147 110 9.59 249 23 9.24 Brazilian operations9 ....... 1,859 156 8.39 1,417 115 8.12 700 70 10.00 HSBC Bank Panama ....... 556 33 5.94 607 45 7.41 35 2 5.71 HSBC Bank Argentina .... 2 – – 12 – – – – –
Other operations .......................................... 13,691 66 0.48 6,446 (13) (0.20) 3,070 108 3.52
286,827 11,982 4.18 271,926 13,189 4.85 232,074 10,344 4.46
For footnotes, see page 143.

H S B C H O L D I N G S P L C
Report of the Directors: Operating and Financial Review (continued)
Financial summary > Balance sheet > Movement in 2008 / Average balance sheet and NII
48
Total equity and liabilities (continued)
2008 2007 2006
Averagebalance
Interestexpense Cost
Average balance
Interestexpense Cost
Average balance
Interestexpense Cost
US$m US$m % US$m US$m % US$m US$m %Other interest-bearing liabilities
Europe HSBC Bank ..................... 38,906 1,134 2.91 22,035 1,302 5.91 23,196 1,026 4.42
HSBC Private Banking
Holdings (Suisse) ........ 4,203 135 3.21 3,427 163 4.76
3,545 155 4.37 HSBC France .................. 33,920 1,361 4.01 27,830 979 3.52 13,476 488 3.62 HSBC Finance ................. 3,712 191 5.15 4,557 227 4.98 4,211 219 5.20
Hong Kong Hang Seng Bank .............. 1,258 41 3.26 2,278 114 5.00 1,378 64 4.64
The Hongkong and Shanghai Banking Corporation ................. 10,557 288 2.73 9,866 535 5.42
8,140 365 4.48
Rest of Asia-Pacific
The Hongkong and Shanghai Banking Corporation ................. 23,685 466 1.97 12,631 580 4.59
13,425 629 4.69 HSBC Bank Malaysia ..... 338 7 2.07 232 6 2.59 235 9 3.83 HSBC Bank Middle East 1,918 89 4.64 1,168 81 6.93 1,046 63 6.02
North America HSBC Bank USA ............ 10,490 468 4.46 13,602 587 4.32 11,966 1,211 10.12 HSBC Finance ................. 4,670 141 3.02 1,941 113 5.82 542 18 3.32 HSBC Bank Canada ........ 1,306 19 1.45 1,151 27 2.35 1,134 22 1.94 HSBC Markets Inc .......... 10,349 78 0.75 8,889 255 2.87 2,883 88 3.05
Latin America HSBC Mexico ................. 187 20 10.70 207 16 7.73 135 8 5.93 Brazilian operations9 ....... 2,340 207 8.85 1,103 182 16.50 817 105 12.85 HSBC Bank Panama ....... 917 3 0.33 574 9 1.57 – – – HSBC Bank Argentina .... 92 6 6.52 95 4 4.21 79 10 12.66
Other operations .......................................... (134,269) (3,979) (101,874) (4,422) (68,873) (3,822)
14,579 675 4.63 9,712 758 7.80 17,335 658 3.80 Total interest-bearing liabilities
Europe HSBC Bank ..................... 487,796 17,631 3.61 411,862 18,304 4.44 331,148 11,788 3.56
HSBC Private Banking
Holdings (Suisse) ........ 46,474 1,589 3.42 35,072 1,670 4.76
29,921 1,257 4.20 HSBC France .................. 143,529 6,142 4.28 119,391 4,781 4.00 80,044 2,759 3.45 HSBC Finance ................. 3,927 199 5.07 4,797 245 5.11 4,759 251 5.27
Hong Kong Hang Seng Bank .............. 70,908 1,073 1.51 68,358 2,223 3.25 59,298 1,924 3.24
The Hongkong and Shanghai Banking Corporation ................. 153,391 1,723 1.12 138,978 4,184 3.01 115,326 3,424 2.97
Rest of Asia-Pacific
The Hongkong and Shanghai Banking Corporation ................. 145,388 4,425 3.04 107,909 4,229 3.92 84,451 3,216 3.81
HSBC Bank Malaysia ..... 11,417 332 2.91 9,748 291 2.99 8,146 243 2.98 HSBC Bank Middle East 26,170 630 2.41 19,611 810 4.13 13,212 497 3.76
North America HSBC Bank USA ............ 131,632 3,676 2.79 126,017 5,409 4.29 117,416 5,432 4.63 HSBC Finance ................. 134,892 5,469 4.05 149,350 7,503 5.02 142,812 6,942 4.86 HSBC Bank Canada ........ 53,744 1,631 3.03 47,663 1,850 3.88 38,547 1,354 3.51 HSBC Markets Inc .......... 10,349 78 0.75 8,889 255 2.87 2,883 88 3.05
Latin America HSBC Mexico ................. 18,314 856 4.67 16,567 737 4.45 14,790 552 3.73 Brazilian operations9 ....... 33,277 3,663 11.01 23,650 2,566 10.85 17,437 2,332 13.37 HSBC Bank Panama ....... 10,250 375 3.66 9,922 434 4.37 1,383 53 3.83 HSBC Bank Argentina .... 2,387 152 6.37 2,116 98 4.63 1,134 56 4.94
Other operations .......................................... (32,003) (906) (20,440) (1,025) 4,939 (775)
1,451,842 48,738 3.36 1,279,460 54,564 4.26 1,067,646 41,393 3.88
For footnotes, see page 143.

49
Net interest margin13
2008 2007 2006 % % %
Europe HSBC Bank ................................................................... 1.71 1.58 2.09 HSBC Private Banking Holdings (Suisse) .................... 1.24 1.10 1.11 HSBC France ................................................................. 0.26 0.54 0.81 HSBC Finance ............................................................... 6.36 6.66 7.08
Hong Kong Hang Seng Bank ............................................................ 2.59 2.54 2.43 The Hongkong and Shanghai Banking Corporation ..... 2.27 2.27 2.29
Rest of Asia-Pacific The Hongkong and Shanghai Banking Corporation ..... 2.15 2.25 2.16 HSBC Bank Malaysia ................................................... 3.02 3.21 3.23 HSBC Bank Middle East .............................................. 3.63 3.63 4.11
North America HSBC Bank USA .......................................................... 2.93 2.43 1.95 HSBC Finance ............................................................... 7.22 6.84 6.83 HSBC Bank Canada ...................................................... 1.93 2.23 2.36
Latin America HSBC Mexico ............................................................... 8.95 8.60 7.92 Brazilian operations9 ..................................................... 8.85 10.55 11.78 HSBC Bank Panama ..................................................... 4.39 4.29 3.94
HSBC Bank Argentina .................................................. 10.25 8.86 7.31
2.90 2.91 3.10 Distribution of average total assets
2008 2007 2006 % % %
Europe HSBC Bank ................................................................... 36.7 34.6 30.6 HSBC Private Banking Holdings (Suisse) .................... 2.3 2.2 2.3 HSBC France ................................................................. 13.8 12.0 10.0 HSBC Finance ............................................................... 0.2 0.3 0.5
Hong Kong Hang Seng Bank ............................................................ 3.9 4.4 4.3 The Hongkong and Shanghai Banking Corporation ..... 9.5 10.1 10.7
Rest of Asia-Pacific The Hongkong and Shanghai Banking Corporation ..... 8.8 6.9 6.0 HSBC Bank Malaysia ................................................... 0.6 0.7 0.6 HSBC Bank Middle East .............................................. 1.8 1.4 1.3
North America HSBC Bank USA .......................................................... 11.2 10.1 11.3 HSBC Finance ............................................................... 6.2 8.3 10.0 HSBC Bank Canada ...................................................... 2.9 3.3 2.4
Latin America HSBC Mexico ............................................................... 1.5 2.5 1.7 Brazilian operations9 ..................................................... 2.1 1.6 1.5 HSBC Bank Panama ..................................................... 0.6 0.7 0.2
HSBC Bank Argentina .................................................. 0.2 0.2 0.1
Other operations (including consolidation adjustments) ................................... (2.3) 0.7 6.5
100.0 100.0 100.0
For footnotes, see page 143.

H S B C H O L D I N G S P L C
Report of the Directors: Operating and Financial Review (continued)
Financial summary > Balance sheet > Changes in net interest income
50
Analysis of changes in net interest income
The following table allocates changes in net interest income between volume and rate for 2008 compared with 2007, and for 2007 compared with 2006.
Interest income
Increase/(decrease) in 2008 compared
with 2007
Increase/(decrease) in 2007 compared
with 2006 2008 Volume Rate 2007 Volume Rate 2006 US$m US$m US$m US$m US$m US$m US$m Short-term funds and loans and advances to banks
Europe HSBC Bank ................................. 2,187 (166) (239) 2,592 729 327 1,536
HSBC Private Banking
Holdings (Suisse) .................... 333 119 (15) 229 13 26 190 HSBC France .............................. 1,495 173 28 1,294 390 214 690
Hong Kong Hang Seng Bank .......................... 587 203 (225) 609 126 – 483
The Hongkong and Shanghai
Banking Corporation .............. 1,344 (139) (869) 2,352 484 223 1,645
Rest of Asia-Pacific
The Hongkong and Shanghai Banking Corporation .............. 881 362 (291) 810 229 61 520
HSBC Bank Malaysia ................. 165 65 (3) 103 13 3 87 HSBC Bank Middle East ............ 188 (15) (121) 324 100 16 208
North America HSBC Bank USA ........................ 328 10 (159) 477 54 (42) 465 HSBC Bank Canada .................... 107 (21) (46) 174 28 8 138
Latin America HSBC Mexico ............................. 247 9 (1) 239 11 1 227 Brazilian operations9 ................... 951 242 64 645 230 (157) 572 HSBC Bank Panama ................... 30 9 (12) 33 24 – 9 HSBC Bank Argentina ................ 43 16 11 16 4 4 8
Other operations ......................................................... 760 43 (181) 898 89 191 618
9,646 915 (2,064) 10,795 2,561 838 7,396 Loans and advances to customers
Europe HSBC Bank ................................. 18,587 3,885 (3,376) 18,078 669 3,243 14,166
HSBC Private Banking
Holdings (Suisse) .................... 494 132 (145) 507 127 42 338 HSBC France .............................. 3,604 257 128 3,219 699 57 2,463 HSBC Finance ............................. 505 (76) (30) 611 (50) (10) 671
Hong Kong Hang Seng Bank .......................... 1,589 251 (782) 2,120 193 (25) 1,952
The Hongkong and Shanghai
Banking Corporation .............. 2,291 392 (1,002) 2,901 51 7 2,843
Rest of Asia-Pacific
The Hongkong and Shanghai Banking Corporation .............. 5,163 1,345 (503) 4,321 471 401 3,449
HSBC Bank Malaysia ................. 553 64 (18) 507 80 (3) 430 HSBC Bank Middle East ............ 1,549 680 (331) 1,200 178 65 957
North America HSBC Bank USA ........................ 5,758 219 (1,046) 6,585 106 338 6,141 HSBC Finance ............................. 15,835 (1,495) (756) 18,086 732 293 17,061 HSBC Bank Canada .................... 2,455 284 (427) 2,598 495 66 2,037
Latin America HSBC Mexico ............................. 2,565 104 274 2,187 380 275 1,532 Brazilian operations9 ................... 4,879 1,744 (760) 3,895 1,409 (758) 3,244 HSBC Bank Panama ................... 810 49 (17) 778 686 – 92 HSBC Bank Argentina ................ 378 68 69 241 106 28 107
Other operations ......................................................... 1,707 564 (647) 1,790 118 144 1,528
68,722 8,887 (9,789) 69,624 5,891 4,722 59,011
For footnotes, see page 143.

51
Interest income (continued)
Increase/(decrease) in 2008 compared with
2007
Increase/(decrease) in 2007 compared with
2006 2008 Volume Rate 2007 Volume Rate 2006 US$m US$m US$m US$m US$m US$m US$mFinancial investments
Europe HSBC Bank ........................... 3,840 2,006 (597) 2,431 146 308 1,977
HSBC Private Banking
Holdings (Suisse) .............. 553 81 (39) 511 74 46 391 HSBC France ........................ 795 222 62 511 291 125 95
Hong Kong Hang Seng Bank .................... 1,063 (340) (147) 1,550 157 169 1,224
The Hongkong and Shanghai
Banking Corporation ........ 563 (263) (191) 1,017 16 90 911
Rest of Asia-Pacific
The Hongkong and Shanghai Banking Corporation ........ 1,507 371 71
1,065
281
47 737
HSBC Bank Malaysia ........... 36 (21) 1 56 21 (1) 36 HSBC Bank Middle East ...... 144 96 (126) 174 118 (16) 72
North America HSBC Bank USA .................. 1,232 87 (44) 1,189 58 22 1,109 HSBC Finance ....................... 143 (65) (21) 229 19 10 200 HSBC Bank Canada .............. 197 41 (102) 258 69 15 174
Latin America HSBC Mexico ....................... 244 14 (89) 319 (76) (32) 427 Brazilian operations9 ............. 853 140 41 672 225 (54) 501 HSBC Bank Panama ............. 47 (7) (4) 58 37 – 21 HSBC Bank Argentina .......... 47 (33) 12 68 31 (1) 38
Other operations ................................................ 1,354 123 (176) 1,407 121 95 1,191
12,618 2,450 (1,347) 11,515 1,634 777 9,104 Interest expense
Deposits by banks
Europe HSBC Bank ........................... 1,875 162 (435) 2,148 477 360 1,311
HSBC Private Banking
Holdings (Suisse) .............. 105 121 (38) 22 (11) – 33 HSBC France ........................ 1,672 310 4 1,358 292 180 886
Hong Kong Hang Seng Bank .................... 55 (53) (15) 123 40 (1) 84
The Hongkong and Shanghai
Banking Corporation ........ 70 1 (81) 150 40 (15) 125
Rest of Asia-Pacific
The Hongkong and Shanghai Banking Corporation ........ 450 260 (255) 445 156 43 246
HSBC Bank Malaysia ............ 10 (1) (1) 12 3 – 9 HSBC Bank Middle East ...... 29 48 (51) 32 11 (2) 23
North America HSBC Bank USA .................. 220 244 (438) 414 182 24 208 HSBC Bank Canada .............. 41 (16) (36) 93 7 18 68
Latin America HSBC Mexico ....................... 32 (10) (21) 63 13 – 50 Brazilian operations9 ............. 190 85 (1) 106 50 (45) 101 HSBC Bank Panama ............. 43 (7) (16) 66 49 – 17 HSBC Bank Argentina .......... 1 (7) (1) 9 3 1 5
Other operations ................................................ 166 4 (129) 291 (51) 8 334
4,959 1,183 (1,556) 5,332 1,267 565 3,500
For footnotes, see page 143.

H S B C H O L D I N G S P L C
Report of the Directors: Operating and Financial Review (continued)
Financial summary > Balance sheet > Changes in net interest income / Share capital and reserves
52
Interest expense (continued)
Increase/(decrease) in 2008 compared
with 2007
Increase/(decrease) in 2007 compared
with 2006 2008 Volume Rate 2007 Volume Rate 2006 US$m US$m US$m US$m US$m US$m US$m Customer accounts
Europe HSBC Bank ............................... 10,092 1,355 (1,839) 10,576 1,577 1,968 7,031
HSBC Private Banking
Holdings (Suisse) .................. 1,349 328 (464) 1,485 237 179 1,069 HSBC France ............................. 1,583 292 65 1,226 264 210 752
Hong Kong Hang Seng Bank ........................ 914 152 (1,138) 1,900 219 (31) 1,712
The Hongkong and Shanghai
Banking Corporation ............. 1,365 382 (2,516) 3,499 591 (26) 2,934
Rest of Asia-Pacific
The Hongkong and Shanghai Banking Corporation ............. 2,869 711 (487) 2,645 646 96 1,903
HSBC Bank Malaysia ............... 295 43 (8) 260 46 2 212 HSBC Bank Middle East .......... 422 156 (312) 578 139 28 411
North America HSBC Bank USA ...................... 2,069 334 (1,316) 3,051 249 312 2,490 HSBC Bank Canada .................. 967 146 (269) 1,090 152 134 804
Latin America HSBC Mexico ........................... 561 15 (2) 548 21 56 471 Brazilian operations9 ................. 3,110 741 206 2,163 648 (541) 2,056 HSBC Bank Panama ................. 296 6 (24) 314 280 – 34 HSBC Bank Argentina .............. 145 17 43 85 38 6 41
Other operations ...................................................... 1,952 369 (714) 2,297 200 286 1,811
27,989 4,710 (8,438) 31,717 5,098 2,888 23,731
Financial liabilities designated at fair value – own debt issued 3,133 304 (739) 3,568 196 212 3,160
Debt securities in issue
Europe HSBC Bank ............................... 4,001 1,290 (1,042) 3,753 816 890 2,047 HSBC France ............................. 1,447 86 154 1,207 285 289 633 HSBC Finance ........................... 8 (2) (8) 18 (18) 4 32
Hong Kong Hang Seng Bank ........................ 57 (2) (21) 80 4 12 64
Rest of Asia-Pacific
The Hongkong and Shanghai Banking Corporation ............. 640 1 80 559 54 67 438
HSBC Bank Malaysia ................ 20 6 1 13 (2) 2 13 HSBC Bank Middle East .......... 90 32 (61) 119 119 – –
North America HSBC Bank USA ...................... 852 (182) (198) 1,232 (152) (23) 1,407 HSBC Finance ........................... 3,765 (802) (744) 5,311 142 122 5,047 HSBC Bank Canada .................. 604 95 (131) 640 180 – 460
Latin America HSBC Mexico ........................... 243 148 (15) 110 83 4 23 Brazilian operations9 ................. 156 36 5 115 72 (27) 70 HSBC Bank Panama ................. 33 (4) (8) 45 43 – 2 HSBC Bank Argentina .............. – – – – – – –
Other operations ...................................................... 66 (14) 93 (13) 119 (240) 108
11,982 (723) (1,930) 13,189 1,777 1,068 10,344

53
Share capital and reserves
Authorised share capital
The authorised share capital of HSBC Holdings at 31 December 2008 was US$7,500,100,000 divided into 15,000 million ordinary shares of US$0.50 each and 10 million non-cumulative preference shares of US$0.01 each; £401,500 divided into 10 million non-cumulative preference shares of £0.01 each and 301,500 non-voting deferred shares of £1 each; and €100,000 divided into 10 million non-cumulative preference shares of €0.01 each.
The percentage of the total authorised share capital of HSBC Holdings at 31 December 2008 represented by the numbers of ordinary shares of US$0.50 each, non-cumulative preference shares of £0.01 each, non-cumulative preference shares of US$0.01 each, non-cumulative preference shares of €0.01 each and non-voting deferred shares of £1 each was approximately 99.9890, 0.0019, 0.0013, 0.0019 and 0.0059 per cent respectively.
Issued share capital
The issued share capital of HSBC Holdings at 31 December 2008 was US$6,052,647,041 million divided into 12,105,265,082 ordinary shares of US$0.50 each and 1,450,000 non-cumulative preference shares of US$0.01 each; and £301,500 comprising 301,500 non-voting deferred shares of £1 each.
The percentage of the total issued share capital of HSBC Holdings at 31 December 2008 represented by the ordinary shares of US$0.50 each, non-cumulative preference shares of US$0.01 each and non-voting deferred shares of £1 each was approximately 99.9925, 0.0002, and 0.0073 per cent respectively.
Rights and obligations attaching to shares
The rights and obligations attaching to each class of share in the authorised share capital of HSBC Holdings are set out in the Articles of Association of HSBC Holdings. Set out below is a summary of the rights and obligations attaching to each class of shares with respect to voting, dividends, capital and, in the case of the preference shares, redemption.
To be registered, a transfer of shares must be in relation to a share which is fully paid up and on which the Company has no lien and to one class of shares denominated in the same currency. The transfer must be in favour of a single transferee or no more than four joint transferees and it must be duly stamped (if required). The transfer must be delivered to the registered office of the Company or to its
Registrars accompanied by the certificate to which it relates or such other evidence that proves the title of the transferor.
If a shareholder or any person appearing to be interested in the Company’s shares has been sent a notice under section 793 of the Companies Act 2006 (which confers upon public companies the power to require information from any person whom the Company knows or has reasonable cause to believe to be interested in the shares) and has failed in relation to any shares (the ‘default shares’) to supply the information requested within the period set out in the notice, then the member is not entitled to be present at or to vote the default shares at any general meeting or to exercise any other right conferred by being a shareholder. If the default shares represent at least 0.25 per cent in nominal value of the issued shares of that class any dividend shall be withheld by the Company, without interest and no election for the scrip dividend alternative may be made. No transfer of any shares held by the member will be registered, except in limited circumstances.
Ordinary shares
Subject to the Companies Act 2006 and the Articles of Association of HSBC Holdings, in a general meeting of HSBC Holdings, every holder of ordinary shares who is present in person or by proxy shall on a show of hands have one vote and every holder of ordinary shares present in person or by proxy shall on a poll have one vote for every share he or she holds. Where any shareholder is, under the rules governing the listing of securities on any stock exchange on which all or any shares of HSBC Holdings are for the time being listed or traded, required to abstain from voting on any particular resolution or restricted to voting only for or only against any particular resolution, any votes cast by or on behalf of such holder in contravention of such requirement or restriction will not be counted.
Subject to the Companies Act 2006 and the Articles of Association of HSBC Holdings, HSBC Holdings may, by ordinary resolution, declare dividends to be paid to the holders of ordinary shares, however, no dividend shall exceed the amount recommended by the Board. The Board may pay interim dividends as appears to the Board to be justified by the profits of HSBC Holdings available for distribution. All dividends shall be apportioned and paid proportionately to the percentage of the nominal amount paid up on the shares during any portion or portions of the period in respect of which the dividend is paid, but if any share is issued on terms providing that it shall rank for dividend as from a particular date, it shall rank for dividend

H S B C H O L D I N G S P L C
Report of the Directors: Operating and Financial Review (continued)
Financial summary > Balance sheet > Share capital and reserves
54
accordingly. Subject to the Articles of Association of HSBC Holdings, the Board may, with the prior authority of an ordinary resolution of HSBC Holdings and subject to such terms and conditions as the Board may determine, offer to any holders of ordinary shares the right to elect to receive ordinary shares of the same or a different currency, credited as fully paid, instead of cash in any currency in respect of the whole (or some part, to be determined by the Board) of any dividend specified by the ordinary resolution. At the 2007 Annual General Meeting shareholders gave authority to the Directors to offer a scrip dividend alternative until the conclusion of the Annual General Meeting in 2012.
Subject to the relevant insolvency laws and the Articles of Association of HSBC Holdings, if HSBC Holdings is wound up, the assets available for distribution among the holders of ordinary shares will be distributed among such holders in proportion to the number of ordinary shares held by them respectively, such distribution to be adjusted to take account of any amount remaining unpaid on a holder’s share. On a winding up, the liquidator may, with the sanction of a special resolution of HSBC Holdings and any other sanction required by law, divide among the shareholders in specie the whole or any part of the assets of HSBC Holdings and may, for that purpose, value any assets and determine how the division shall be carried out as between the shareholders or different classes of shareholders.
Preference shares
The non-cumulative preference shares of £0.01 each, the non-cumulative preference shares of US$0.01 each (the ‘Dollar Preference Shares’) and the non-cumulative preference shares of €0.01 each carry the same rights and obligations under the Articles of Association save in respect of the timing of and payment of proceeds from the redemption of each class of share, to the extent issued, and certain rights and obligations that attach to each class of preference share as determined by the Board prior to allotment of the relevant preference shares. The Dollar Preference Shares are the only class of the preference shares which have been issued and allotted to date.
Holders of the preference shares will only be entitled to attend and vote at general meetings of HSBC Holdings if any dividend payable on the relevant preference shares in respect of such period as the Board shall determine prior to allotment thereof (which, in the case of the Dollar Preference Shares in issue at 2 March 2009, is four consecutive dividend payment dates) is not paid in full or in such other circumstances, and upon and subject to such
terms, as the Board may determine prior to allotment of the relevant preference shares. Whenever holders of the relevant preference shares are entitled to vote on a resolution at a general meeting, on a show of hands every such holder who is present in person or by proxy shall have one vote and on a poll every such holder who is present in person or by proxy shall have one vote per preference share held by him or her or such number of votes per share as the Board shall determine prior to allotment of such share.
Subject to the Articles of Association, holders of the relevant preference shares shall have the right to a non-cumulative preferential dividend at such rate, on such dates and on such other terms and conditions as may be determined by the Board prior to allotment thereof in priority to the payment of any dividend to the holders of ordinary shares and any other class of shares of HSBC Holdings in issue (other than (i) the other preference shares in issue and any other shares expressed to rank pari passu therewith as regards income; and (ii) any shares which by their terms rank in priority to the relevant preference shares as regards income). Dividends on the Dollar Preference Shares in issue at 2 March 2009 are paid quarterly at the sole and absolute discretion of the Board of Directors. The Board of Directors will not declare a dividend on the Dollar Preference Shares if payment of the dividend would cause HSBC Holdings not to meet the applicable capital adequacy requirements of the FSA or the profit of HSBC Holdings available for distribution as dividends is not sufficient to enable HSBC Holdings to pay in full both dividends on the relevant preference shares and dividends on any other shares that are scheduled to be paid on the same date and that have an equal right to dividends. HSBC Holdings may not declare or pay dividends on any class of its shares ranking lower in the right to dividends than the preference shares nor redeem nor purchase in any manner any of its other shares ranking equal with or lower than the preference shares unless it has paid in full, or set aside an amount to provide for payment in full, the dividends on the preference shares for the then-current dividend period.
The preference shares carry no rights to participate in the profits or assets of HSBC Holdings other than as set out in the Articles of Association and subject to the Companies Act 1985, do not confer any right to participate in any offer or invitation by way of rights or otherwise to subscribe for additional shares in HSBC Holdings, do no not confer any right of conversion and do not confer any right to participate in any issue or bonus shares or

55
shares issued by way of capitalisation of reserves.
Subject to the relevant insolvency laws and the Articles of Association of HSBC Holdings, holders of the relevant preference shares have the right in a winding up of HSBC Holdings to receive out of the assets of HSBC Holdings available for distribution to its shareholders, in priority to any payment to the holders of the ordinary shares and any other class of shares of HSBC Holdings in issue (other than (i) the other relevant preference shares and any other shares expressed to rank pari passu therewith as regards repayment of capital; and (ii) any shares which by their terms rank in priority to the relevant preference shares as regards repayment of capital), a sum equal to any unpaid dividend on the relevant preference shares which is payable as a dividend in accordance with or pursuant to the Articles of Association and the amount paid up or credited as paid up on the relevant preference shares together with such premium (if any) as may be determined by the Board prior to allotment thereof.
HSBC Holdings may redeem the relevant preference shares in accordance with the Articles of Association and the terms on which the relevant preference shares were issued and allotted. In the case of the Dollar Preference Shares in issue at 2 March 2009, HSBC Holdings may redeem such shares in whole at any time on or after 16 December 2010, subject to prior notification to the FSA.
Non-voting deferred shares
The non-voting deferred shares are held by a subsidiary undertaking of HSBC Holdings. Holders of the non-voting deferred shares are not entitled to receive dividends on these shares. In addition, on winding up or other return of capital, holders are entitled to receive the amount paid up on their shares after distribution to ordinary shareholders of £10 million in respect of each ordinary share held by them. The holders of the non-voting deferred shares are not entitled to receive notice of or to attend (either personally or by proxy) any general meeting of HSBC Holdings or to vote (either personally or by proxy) on any resolution to be proposed thereat.
The following events occurred during the year in relation to the share capital of HSBC Holdings:
Scrip dividends
1. 36,524,050 ordinary shares were issued at par in January 2008 to shareholders who elected to receive new shares in lieu of the third interim dividend for 2007. The market value per share used to calculate shareholders’ entitlements to
new shares was US$16.821, being the US dollar equivalent of £8.132.
2. 136,165,605 ordinary shares were issued at par in May 2008 to shareholders who elected to receive new shares in lieu of the fourth interim dividend for 2007. The market value per share used to calculate shareholders’ entitlements to new shares was US$16.4022, being the US dollar equivalent of £8.132.
3. 15,191,514 ordinary shares were issued at par in July 2008 to shareholders who elected to receive new shares in lieu of the first interim dividend for 2008. The market value per share used to calculate shareholders’ entitlements to new shares was US$16.8421, being the US dollar equivalent of £8.519.
4. 47,687,930 ordinary shares were issued at par in October 2008 to shareholders who elected to receive new shares in lieu of the second interim dividend for 2008. The market value per share used to calculate shareholders’ entitlements to new shares was US$15.2466, being the US dollar equivalent of £8.266.
All-Employee share plans
5. In connection with the exercise of options under the HSBC Holdings savings-related share option plans: 27,491,176 ordinary shares were issued at prices ranging from £5.3496 to £7.6736 per share; 1,782,367 ordinary shares were issued at prices ranging from HK$103.4401 to HK$108.4483 per share; 805,885 ordinary shares were issued at prices ranging from US$13.3290 to US$14.7478 per share; and 46,698 ordinary shares were issued at €10.4217 per share. Options over 18,163,336 ordinary shares lapsed.
6. 2,667,632 ordinary shares were issued at €8.3124 per share in connection with a Plan d’Epargne Entreprise for the benefit of non-UK resident employees of HSBC France and its subsidiaries.
7. Options over 32,951,305 ordinary shares were granted at nil consideration on 30 April 2008 to nearly 70,000 HSBC employees resident in nearly 70 countries and territories under the HSBC Holdings savings-related share option plans.
Discretionary share incentive plans
8. 4,050,585 ordinary shares were issued at prices ranging from £6.2767 to £7.460 per share in connection with the exercise of options under

H S B C H O L D I N G S P L C
Report of the Directors: Operating and Financial Review (continued)
Financial summary > Balance sheet > Share capital and reserves / Contractual obligations / Ratios
56
the HSBC Holdings Executive Share Option Scheme. Options over 223,951 ordinary shares lapsed.
9. 3,734,125 ordinary shares were issued at prices ranging from £6.9100 to £8.7120 per share in connection with the exercise of options under the HSBC Holdings Group Share Option Plan. Options over 5,889,067 ordinary shares lapsed.
10. No options were exercised under and no ordinary shares were issued in connection with the HSBC Share Plan. Options over 224,728 ordinary shares lapsed.
HSBC Finance
11. 65,198 ordinary shares were issued at prices ranging from US$14.59 to US$16.71 per share in connection with the vesting of Restricted Stock Rights under HSBC Finance share plans that have been converted into rights over HSBC Holdings ordinary shares.
Authority to purchase ordinary shares
12. At the Annual General Meeting in 2008, shareholders renewed the authority for the Company to make market purchases of ordinary shares. The authority is to make market purchases of up to 1,186,700,000 ordinary shares. The Directors have not exercised this authority. In accordance with the terms of a waiver granted by the Hong Kong Stock Exchange on 19 December 2005, HSBC Holdings will comply with the applicable law and regulation in the UK in relation to the holding of any shares in treasury and with the
conditions of the waiver, in connection with any shares it may hold in treasury.
Authority to allot shares
13. At the Annual General Meeting in 2008 shareholders renewed the general authority for the Directors to allot new shares. The general authority is to allot up to 2,373,400,000 ordinary shares, 10,000,000 non-cumulative preference shares of £0.01 each, 8,550,000 non-cumulative preference shares of US$0.01 each and 10,000,000 non-cumulative preference shares of €0.01 each. Within this, the Directors have authority to allot up to a maximum of 593,350,000 ordinary shares wholly for cash to persons other than existing shareholders.
Other than as described in paragraphs 1 to 6 and 8 to 10 above, the Directors did not allot any shares during 2008.
Short-term borrowings
HSBC includes short-term borrowings within customer accounts, deposits by banks and debt securities in issue and does not show short-term borrowings separately on the balance sheet. Short-term borrowings are defined by the US Securities and Exchange Commission (‘SEC’) as Federal funds purchased and securities sold under agreements to repurchase, commercial paper and other short-term borrowings. HSBC’s only significant short-term borrowings are securities sold under agreements to repurchase and certain debt securities in issue. Additional information on these is provided in the tables below.
2008 2007 2006 US$m US$m US$m Securities sold under agreements to repurchase Outstanding at 31 December ........................................................................... 145,180 140,001 97,139 Average amount outstanding during the year ................................................. 177,256 129,779 102,715 Maximum quarter-end balance outstanding during the year .......................... 190,651 148,601 109,689
Weighted average interest rate during the year ............................................... 3.8% 5.4% 4.3% Weighted average interest rate at the year-end ............................................... 2.9% 4.8% 4.6% Short-term bonds Outstanding at 31 December ........................................................................... 40,279 51,792 37,906 Average amount outstanding during the year ................................................. 45,330 39,153 37,729 Maximum quarter-end balance outstanding during the year .......................... 55,842 51,792 38,907
Weighted average interest rate during the year ............................................... 5.0% 7.0% 5.1% Weighted average interest rate at the year-end ............................................... 3.1% 6.5% 4.8%

57
Contractual obligations
The table below provides details of HSBC’s material contractual obligations as at 31 December 2008.
Payments due by period
Total Less than 1 year
1–5 years
More than 5 years
US$m US$m US$m US$m
Long-term debt obligations .......................................... 254,946 92,191 99,353 63,402 Term deposits and certificates of deposit ..................... 256,661 245,672 10,989 – Capital (finance) lease obligations ............................... 979 55 188 736 Operating lease obligations .......................................... 4,139 766 1,800 1,573 Purchase obligations ..................................................... 1,541 948 593 – Short positions in debt securities and equity shares ..... 66,774 52,679 4,477 9,618 Current tax liability ....................................................... 1,822 1,822 – – Pension obligations ....................................................... 15,137 1,208 5,393 8,536
601,999 395,341 122,793 83,865
Ratios of earnings to combined fixed charges (and preference share dividends)
2008 2007 2006 2005 2004 % % % % % Ratios of earnings to combined fixed charges and preference
share dividends
Ratios in accordance with IFRSs – excluding interest on deposits ............................................... 2.97 6.96 7.22 9.16 8.64 – including interest on deposits ................................................ 1.13 1.34 1.40 1.59 1.86
Ratios in accordance with UK GAAP – excluding interest on deposits ............................................... – – – – 8.07 – including interest on deposits ................................................ – – – – 1.81
Ratios of earnings to combined fixed charges Ratios in accordance with IFRSs
– excluding interest on deposits ............................................... 3.17 7.52 7.93 9.60 8.64 – including interest on deposits ................................................ 1.14 1.34 1.41 1.59 1.86
Ratios in accordance with UK GAAP – excluding interest on deposits ............................................... – – – – 8.07 – including interest on deposits ................................................ – – – – 1.81
For the purpose of calculating the ratios, earnings consist of income from continuing operations before taxation and minority interests, plus fixed charges, and after deduction of the unremitted pre-tax income of associated undertakings. Fixed charges consist of total interest expense, including or excluding interest on deposits, as appropriate, dividends on preference shares and other equity instruments, as applicable, and the proportion of rental expense deemed representative of the interest factor.

H S B C H O L D I N G S P L C
Report of the Directors: Operating and Financial Review (continued)
Financial summary > Balance sheet > Loan maturities / Deposits
58
Loan maturity and interest sensitivity analysis
At 31 December 2008, the geographical analysis of loan maturity and interest sensitivity by loan type on a contractual repayment basis was as follows:
Europe Hong Kong
Rest of Asia- Pacific
North America
Latin America Total
US$m US$m US$m US$m US$m US$m Maturity of 1 year or less Loans and advances to banks ............................. 58,520 29,258 35,668 10,966 11,919 146,331 Commercial loans to customers
Commercial, industrial and international trade............................................................. 83,772 14,666 31,433 5,611 8,827 144,309
Real estate and other property related ............ 18,430 6,253 6,071 9,527 1,497 41,778 Non-bank financial institutions ...................... 57,853 1,070 4,188 21,490 1,116 85,717 Governments .................................................. 1,121 117 1,260 243 309 3,050 Other commercial ........................................... 35,652 1,919 5,648 8,737 1,955 53,911
196,828 24,025 48,600 45,608 13,704 328,765 Hong Kong Government Home Ownership
Scheme ........................................................... – 442 – – – 442 Residential mortgages and other personal loans . 30,336 13,476 13,972 36,119 8,382 102,285 Loans and advances to customers ...................... 227,164 37,943 62,572 81,727 22,086 431,492 285,684 67,201 98,240 92,693 34,005 577,823
Maturity after 1 year but within 5 years Loans and advances to banks ............................. 3,152 388 398 442 190 4,570 Commercial loans to customers
Commercial, industrial and international trade............................................................. 23,889 4,943 7,360 8,087 3,640 47,919
Real estate and other property related ............ 13,760 13,716 6,182 8,002 790 42,450 Non-bank financial institutions ...................... 3,419 594 1,111 3,112 1,185 9,421 Governments .................................................. 323 784 355 78 769 2,309 Other commercial ........................................... 11,839 3,365 4,130 3,214 2,072 24,620
53,230 23,402 19,138 22,493 8,456 126,719 Hong Kong Government Home Ownership
Scheme ........................................................... – 1,404 – – – 1,404 Residential mortgages and other personal loans ... 31,595 8,991 9,948 52,234 5,755 108,523 Loans and advances to customers ...................... 84,825 33,797 29,086 74,727 14,211 236,646 87,977 34,185 29,484 75,169 14,401 241,216 Interest rate sensitivity of loans and advances
to banks and commercial loans to customers Fixed interest rate ........................................... 11,333 185 2,734 5,066 2,460 21,778 Variable interest rate ...................................... 45,049 23,605 16,802 17,869 6,186 109,511
56,382 23,790 19,536 22,935 8,646 131,289 Maturity after 5 years Loans and advances to banks .............................. 340 – 75 50 2,463 2,928 Commercial loans to customers
Commercial, industrial and international trade ............................................................ 13,386 577 1,354 1,480 815 17,612
Real estate and other property related ............ 8,180 4,560 1,019 3,209 512 17,480 Non-bank financial institutions ...................... 551 738 88 2,958 63 4,398 Governments .................................................. 420 50 145 31 539 1,185 Other commercial ........................................... 15,923 1,514 1,428 991 535 20,391
38,460 7,439 4,034 8,669 2,464 61,066 Hong Kong Government Home Ownership
Scheme ........................................................... – 2,036 – – – 2,036 Residential mortgages and other personal loans . 79,601 19,738 13,491 107,181 5,526 225,537 Loans and advances to customers ...................... 118,061 29,213 17,525 115,850 7,990 288,639 118,401 29,213 17,600 115,900 10,453 291,567 Interest rate sensitivity of loans and advances
to banks and commercial loans to customers Fixed interest rate ........................................... 7,607 – 942 1,128 619 10,296 Variable interest rate ...................................... 31,193 7,439 3,167 7,591 4,308 53,698
38,800 7,439 4,109 8,719 4,927 63,994

59
Deposits
The following tables summarise the average amount of bank deposits, customer deposits and certificates of deposit (‘CDs’) and other money market instruments (which are included within ‘Debt securities in issue’ in the balance sheet), together
with the average interest rates paid thereon for each of the past three years. The geographical analysis of average deposits is based on the location of the office in which the deposits are recorded and excludes balances with HSBC companies. The ‘Other’ category includes securities sold under agreements to repurchase.
2008 2007 2006
Average balance
Average rate
Average balance
Average rate
Average balance
Average rate
US$m % US$m % US$m % Deposits by banks
Europe Demand and other – non-interest
bearing ................................................ 5,231 – 6,359 –
9,814 –Demand – interest bearing ..................... 19,204 3.2 11,036 3.8 8,368 3.7 Time ........................................................ 43,695 3.9 38,470 4.7 27,447 4.0 Other ....................................................... 31,098 4.4 28,770 4.8 23,396 3.5
99,228 84,635 69,025 Hong Kong
Demand and other – non-interest bearing ................................................ 1,375 – 1,331 –
1,031 –
Demand – interest bearing ..................... 2,780 2.0 2,420 4.3 2,428 4.6 Time ........................................................ 1,583 2.7 3,267 4.5 2,016 4.3 Other ....................................................... 178 3.4 251 0.4 362 3.3
5,916 7,269 5,837 Rest of Asia-Pacific
Demand and other – non-interest bearing ................................................ 1,911 – 1,897 –
1,618 –
Demand – interest bearing ..................... 4,332 2.3 3,167 2.4 1,960 2.4 Time ........................................................ 10,342 3.5 6,433 5.1 3,645 4.8 Other ....................................................... 3,769 3.3 2,768 4.8 2,157 4.5
20,354 14,265 9,380 North America
Demand and other – non-interest bearing ................................................ 761 – 827 –
767 –
Demand – interest bearing ..................... 5,684 1.7 3,759 4.8 3,033 5.3 Time ........................................................ 7,941 2.3 6,746 6.0 3,543 5.4 Other ....................................................... 449 1.6 169 7.1 699 5.6
14,835 11,501 8,042 Latin America
Demand and other – non-interest bearing ................................................ 366 – 808 –
702 –
Demand – interest bearing ..................... 81 2.5 153 5.9 96 6.3 Time ........................................................ 3,357 5.6 2,690 6.5 1,732 5.5 Other ....................................................... 1,254 7.8 1,010 8.0 683 9.4
5,058 4,661 3,213 Total
Demand and other – non-interest bearing ................................................ 9,644 – 11,222 –
13,932 –
Demand – interest bearing ..................... 32,081 2.7 20,535 3.8 15,885 4.5 Time ........................................................ 66,918 3.7 57,606 4.9 38,383 4.5 Other ....................................................... 36,748 4.5 32,968 5.0 27,297 3.9
145,391 122,331 95,497

H S B C H O L D I N G S P L C
Report of the Directors: Operating and Financial Review (continued)
Financial summary > Balance sheet > Deposits / CDs // Critical accounting policies
60
2008 2007 2006 Average
balance Average rate
Average balance
Average rate
Average balance
Average rate
US$m % US$m % US$m % Customer accounts
Europe Demand and other – non-interest
bearing ................................................ 39,610 – 34,585 –
33,000 – Demand – interest bearing ..................... 225,034 2.9 210,692 3.5 173,150 2.7 Savings ................................................... 73,479 4.3 62,002 4.6 50,525 3.9 Time ........................................................ 83,208 3.8 69,476 4.9 59,374 4.2 Other ....................................................... 26,651 3.9 14,741 4.5 9,249 4.1
447,982 391,496 325,298 Hong Kong
Demand and other – non-interest bearing ................................................ 15,620 – 14,214 –
13,011 –
Demand – interest bearing ..................... 126,199 0.4 107,053 2.2 88,754 2.4 Savings ................................................... 65,068 2.4 63,649 3.9 58,883 3.8 Time ........................................................ 27,659 2.3 26,712 3.9 20,454 3.6 Other ....................................................... 1,563 1.2 1,164 4.3 51 3.9
236,109 212,792 181,153 Rest of Asia-Pacific
Demand and other – non-interest bearing ................................................ 22,721 – 16,438 –
13,107 –
Demand – interest bearing ..................... 55,653 1.9 41,089 2.4 29,816 2.1 Savings ................................................... 68,968 3.6 57,950 4.2 42,153 4.3 Time ........................................................ 15,226 3.3 11,538 4.6 10,246 4.5 Other ....................................................... 1,359 2.8 1,835 4.5 2,233 3.5
163,927 128,850 97,555 North America
Demand and other – non-interest bearing ................................................ 16,759 – 15,175 –
13,662 –
Demand – interest bearing ..................... 18,261 1.6 15,389 3.3 14,406 2.9 Savings ................................................... 87,001 2.5 79,529 3.3 65,216 2.8 Time ........................................................ 17,838 3.2 17,655 5.9 21,124 5.4 Other ....................................................... 5,123 2.4 3,234 3.7 3,339 2.0
144,982 130,982 117,747 Latin America
Demand and other – non-interest bearing ................................................ 12,507 – 10,530 –
7,995 –
Demand – interest bearing ..................... 4,994 1.9 5,662 2.1 5,438 1.6 Savings ................................................... 31,442 10.3 24,861 8.8 16,512 11.3 Time ........................................................ 15,179 5.2 12,443 5.9 7,665 5.9 Other ....................................................... 949 8.2 1,212 9.5 2,145 13.4
65,071 54,708 39,755 Total
Demand and other – non-interest bearing ................................................ 107,217 – 90,942 –
80,775 –
Demand – interest bearing ..................... 430,141 1.9 379,885 3.0 311,564 2.6 Savings ................................................... 325,958 3.9 287,991 4.4 233,289 4.1 Time ........................................................ 159,110 3.6 137,824 4.9 118,863 4.5 Other ....................................................... 35,645 3.6 22,186 4.7 17,017 4.8
1,058,071 918,828 761,508 CDs and other money market instruments
Europe ......................................................... 74,007 4.5 66,164 5.0 48,238 4.2 Hong Kong ................................................. 745 3.0 941 3.9 1,191 3.5 Rest of Asia-Pacific .................................... 7,614 6.4 7,230 6.0 6,621 5.6 North America ............................................ 22,278 3.3 23,735 5.4 23,472 4.6 Latin America ............................................. 3,036 7.8 1,526 6.8 318 10.7
107,680 4.5 99,596 5.2 79,840 4.5

61
Certificates of deposit and other time deposits
At 31 December 2008, the maturity analysis of CDs and other wholesale time deposits, by remaining maturity, was as follows:
3 months or less
After 3 months but within 6 months
After 6 months but within 12 months
After 12 months Total
US$m US$m US$m US$m US$m Europe
Certificates of deposit .......................... 23,911 483 192 – 24,586 Time deposits: – banks .................................................. 34,951 1,943 2,418 4,649 43,961 – customers ........................................... 78,562 5,140 4,135 1,598 89,435
137,424 7,566 6,745 6,247 157,982
Hong Kong Certificates of deposit .......................... 145 137 280 904 1,466 Time deposits: – banks .................................................. 1,031 5 – 67 1,103 – customers ........................................... 21,898 1,057 274 419 23,648
23,074 1,199 554 1,390 26,217
Rest of Asia-Pacific Certificates of deposit .......................... 2,324 1,383 928 248 4,883 Time deposits: – banks .................................................. 3,912 887 310 164 5,273 – customers ........................................... 13,106 1,651 670 1,490 16,917
19,342 3,921 1,908 1,902 27,073
North America Time deposits: – banks .................................................. 10,209 2 5 201 10,417 – customers ........................................... 13,882 720 248 310 15,160
24,091 722 253 511 25,577
Latin America Certificates of deposit .......................... 1,161 640 60 316 2,177 Time deposits: – banks .................................................. 2,360 1,446 389 264 4,459 – customers ........................................... 10,357 1,389 1,071 359 13,176
13,878 3,475 1,520 939 19,812
Total Certificates of deposit .......................... 27,541 2,643 1,460 1,468 33,112 Time deposits: – banks .................................................. 52,463 4,283 3,122 5,345 65,213 – customers ........................................... 137,805 9,957 6,398 4,176 158,336
217,809 16,883 10,980 10,989 256,661
The geographical analysis of deposits is based on the location of the office in which the deposits are recorded and excludes balances with HSBC companies. The majority of certificates of deposit and time deposits are in amounts of US$100,000 and over or the equivalent in other currencies.
Critical accounting policies (Audited)
Introduction
The results of HSBC are sensitive to the accounting policies, assumptions and estimates that underlie the preparation of its consolidated financial statements. The significant accounting policies used in the preparation of the consolidated financial statements are described in Note 2 on the Financial Statements.
When preparing the financial statements, it is the Directors’ responsibility under UK company law to select suitable accounting policies and to make judgements and estimates that are reasonable and prudent.
The accounting policies that are deemed critical to HSBC’s results and financial position, in terms of the materiality of the items to which the policy is applied, and which involve a high degree of judgement including the use of assumptions and estimation, are discussed below.

H S B C H O L D I N G S P L C
Report of the Directors: Operating and Financial Review (continued) Critical accounting policies
62
Impairment of loans and advances
HSBC’s accounting policy for losses arising from the impairment of customer loans and advances is described in Note 2g on the Financial Statements. Loan impairment allowances represent management’s best estimate of losses incurred in the loan portfolios at the balance sheet date.
Management is required to exercise judgement in making assumptions and estimations when calculating loan impairment allowances on both individually and collectively assessed loans and advances. Of the Group’s total loans and advances to customers before impairment allowances of US$957 billion (2007: US$1,001 billion), US$6.9 billion or 1 per cent (2007: US$6.5 billion; 1 per cent) were individually assessed for impairment, and US$950 billion or 99 per cent (2007: US$994 billion; 99 per cent) were collectively assessed for impairment.
The most significant judgemental area is the calculation of collective impairment allowances. HSBC’s most significant geographical area of exposure to collectively assessed loans and advances is North America, which comprised US$271 billion or 29 per cent (2007: US$301 billion; 30 per cent) of HSBC’s total collectively assessed loans and advances. Collective impairment allowances in North America were US$15.9 billion, representing 77 per cent (2007: US$11.9 billion; 72 per cent) of the total collectively assessed loan impairment allowance.
HSBC uses two alternative methods to calculate collective impairment allowances on homogeneous groups of loans that are not considered individually significant:
• when appropriate empirical information is available, HSBC utilises roll-rate methodology. This methodology employs statistical analysis of historical data and experience of delinquency and default to estimate the likelihood that loans will progress through the various stages of delinquency and ultimately prove irrecoverable. The estimated loss is the difference between the present value of expected future cash flows, discounted at the original effective interest rate of the portfolio, and the carrying amount of the portfolio; and
• in other cases, when the portfolio size is small or when information is insufficient or not reliable enough to adopt a roll-rate methodology, HSBC adopts a formulaic approach which allocates progressively higher percentage loss rates the longer a customer’s
loan is overdue. Loss rates are based on historical experience.
Both methodologies are subject to estimation uncertainty, in part because it is not practicable to identify losses on an individual loan basis because of the large number of individually insignificant loans in the portfolio.
In addition, the use of statistically assessed historical information is supplemented with significant management judgement to assess whether current economic and credit conditions are such that the actual level of inherent losses is likely to be greater or less than that suggested by historical experience. In normal circumstances, historical experience provides the most objective and relevant information from which to assess inherent loss within each portfolio. In certain circumstances, historical loss experience provides less relevant information about the inherent loss in a given portfolio at the balance sheet date, for example, where there have been changes in economic, regulatory or behavioural conditions such that the most recent trends in the portfolio risk factors are not fully reflected in the statistical models. In these circumstances, such risk factors are taken into account when calculating the appropriate levels of impairment allowances, by adjusting the impairment allowances derived solely from historical loss experience.
This key area of judgement is subject to uncertainty and is highly sensitive to factors such as loan portfolio growth, product mix, unemployment rates, bankruptcy trends, geographic concentrations, loan product features, economic conditions such as national and local trends in housing markets, the level of interest rates, portfolio seasoning, account management policies and practices, changes in laws and regulations, and other factors that can affect customer payment patterns. Different factors are applied in different regions and countries to reflect different economic conditions and laws and regulations. The assumptions underlying this judgement are highly subjective. The methodology and the assumptions used in calculating impairment losses are reviewed regularly in the light of differences between loss estimates and actual loss experience. For example, roll rates, loss rates and the expected timing of future recoveries are regularly benchmarked against actual outcomes to ensure they remain appropriate.
The total amount of the Group’s impairment allowances on homogeneous groups of loans is inherently uncertain because it is highly sensitive to changes in economic and credit conditions across a

63
large number of geographical areas. Economic and credit conditions within geographical areas are influenced by many factors with a high degree of interdependency so that there is no single factor to which the Group’s loan impairment allowances as a whole are sensitive. However, HSBC’s loan impairment allowances are particularly sensitive to general economic and credit conditions in North America. For example, a 10 per cent increase in impairment allowances on collectively assessed loans and advances in North America would increase loan impairment allowances by US$1.6 billion at 31 December 2008 (2007: US$1.2 billion). It is possible that the outcomes within the next financial year could be different from the assumptions built into the models, resulting in a material adjustment to the carrying amount of loans and advances.
Goodwill impairment
HSBC’s accounting policy for goodwill is described in Note 2(p) on the Financial Statements. Note 22 on the Financial Statements lists the Group’s cash generating units (‘CGUs’) by geographical region and global business. Total goodwill for the Group amounted to US$22 billion as at 31 December 2008 (2007: US$34 billion).
The process of identifying and evaluating goodwill impairment is inherently uncertain because it requires significant management judgement in making a series of estimations, the results of which are highly sensitive to the assumptions used. The review of goodwill impairment represents management’s best estimate of the factors below:
• the future cash flows of the CGUs are sensitive to the cash flows projected for the periods for which detailed forecasts are available, and to assumptions regarding the long-term pattern of sustainable cash flows thereafter. Forecasts are compared with actual performance and verifiable economic data in future years; however, the cash flow forecasts necessarily and appropriately reflect management’s view of future business prospects at the time of the assessment; and
• the discount rate used to discount the future expected cash flows is based on the cost of capital assigned to an individual CGU, and can have a significant effect on the CGU’s valuation. The cost of capital percentage is generally derived from a Capital Asset Pricing Model, which incorporates inputs reflecting a number of financial and economic variables, including the risk-free interest rate in the country concerned and a premium to reflect the
inherent risk of the business being evaluated. These variables are subject to fluctuations in external market rates and economic conditions outside of management’s control and are therefore established on the basis of significant management judgement and are subject to uncertainty.
When this exercise demonstrates that the expected cash flows of a CGU have declined and/or that its cost of capital has increased, the effect is to reduce the CGU’s estimated recoverable amount. If this results in an estimated recoverable amount that is lower than the carrying value of the CGU, a charge for impairment of goodwill will be recognised in HSBC’s income statement for the year.
The accuracy of forecast cash flows is subject to a high degree of uncertainty in volatile market conditions. In such market conditions, management retests goodwill for impairment more frequently than annually to ensure that the assumptions on which the cash flow forecasts are based continue to reflect current market conditions and management’s best estimate of future business prospects.
Given the extraordinary market events experienced globally during the second half of 2008, HSBC performed an additional impairment test on all the CGUs within the Group as at 31 December 2008. As a result, HSBC recognised an impairment charge of US$10.6 billion on Personal Financial Services – North America as at 31 December 2008 (2007: nil). Management concluded that the recoverable amount of the other CGUs to which goodwill has been allocated exceeded their carrying value. However, in the event of further significant deterioration in the economic and credit conditions beyond the levels already reflected by management in the cash flow forecasts for the CGUs, a material adjustment to a CGU’s recoverable amount may occur which may result in the recognition of an impairment charge in the income statement.
Note 22 on the Financial Statements includes details of the CGUs with significant balances of goodwill, states the key assumptions used to assess the goodwill in each of those CGUs for impairment, and provides a discussion of the sensitivity of the carrying value of goodwill to changes in key assumptions.
Valuation of financial instruments
HSBC’s accounting policy for determining the fair value of financial instruments is described in Note 2d on the Financial Statements.

H S B C H O L D I N G S P L C
Report of the Directors: Operating and Financial Review (continued) Critical accounting policies / Customer groups > Summary
64
The best evidence of fair value is a quoted price in an actively traded market. In the event that the market for a financial instrument is not active, a valuation technique is used. The majority of valuation techniques employ only observable market data, and so the reliability of the fair value measurement is high. However, certain financial instruments are valued on the basis of valuation techniques that feature one or more significant market inputs that are unobservable. Valuation techniques that rely to a greater extent on unobservable inputs require a higher level of management judgement to calculate a fair value than those based wholly on observable inputs.
Valuation techniques used to calculate fair values include comparisons with similar financial instruments for which market observable prices exist, discounted cash flow analysis, option pricing models and other valuation techniques commonly used by market participants. Valuation techniques incorporate assumptions that other market participants would use in their valuations, including assumptions about interest rate yield curves, exchange rates, volatilities, and prepayment and default rates. When valuing instruments by reference to comparable instruments, management takes into account the maturity, structure and rating of the instrument with which the position held is being compared.
The main assumptions and estimates which management considers when applying a model with valuation techniques are:
• the likelihood and expected timing of future cash flows on the instrument. These cash flows are usually governed by the terms of the instrument, although management judgement may be required when the ability of the counterparty to service the instrument in accordance with the contractual terms is in doubt. Future cash flows may be sensitive to changes in market rates;
• selecting an appropriate discount rate for the instrument. Management bases the determination of this rate on its assessment of what a market participant would regard as the appropriate spread of the rate for the instrument over the appropriate risk-free rate; and
• judgement to determine what model to use to calculate fair value in areas where the choice of valuation model is particularly subjective, for example, when valuing complex derivative products.
When applying a model with unobservable inputs, estimates are made to reflect uncertainties in fair values resulting from a lack of market data inputs, for example, as a result of illiquidity in the market. For these instruments, the fair value measurement is less reliable. Inputs into valuations based on unobservable data are inherently uncertain because there are little or no current market data available from which to determine the level at which an arm’s length transaction would occur under normal business conditions. However, in most cases there are some market data available on which to base a determination of fair value, for example historical data, and the fair values of most financial instruments will be based on some market observable inputs even where the unobservable inputs are significant.
An analysis of the basis for valuation of financial instruments measured at fair value in the financial statements is provided on page 162. The value of financial assets and liabilities that use a valuation technique are US$876 billion (2007: US$626 billion) and US$671 billion (2007: US$401 billion) or 71 per cent (2007: 66 per cent) and 83 per cent (2007: 68 per cent) of total assets and total liabilities measured at fair value, respectively. A sensitivity analysis of fair values for financial instruments with significant unobservable inputs to reasonably possible alternative assumptions and a range of assumptions and inputs used in valuation models in respect of instruments of particular interest in the current market turmoil can be found on page 164. Given the uncertainty and subjective nature of valuing financial instruments at fair value, it is possible that the outcomes in the next financial year could differ from the assumptions used, and this could result in a material adjustment to the carrying amount of financial instruments measured at fair value.
Impairment of available-for-sale financial assets
HSBC’s accounting policy for impairment of available-for-sale financial assets is described in Note 2(j) on the Financial Statements.
Available-for-sale financial assets are measured at fair value, and changes in fair value are recognised in equity in the available-for-sale fair value reserve until the financial assets are either sold or become impaired. An impairment loss is recognised if there is objective evidence of impairment as a result of loss events which have an impact on the estimated future cash flows of the financial asset that can be reliably estimated. If an available-for-sale financial asset becomes impaired, the entire balance in equity

65
relating to that asset is removed from equity and recognised in the income statement as an impairment loss. A further decline in the fair value of an available-for-sale debt security subsequent to the initial impairment is recognised in the income statement when there is further objective evidence of impairment.
At 31 December 2008 the Group’s total available-for-sale financial assets amounted to US$286 billion (2007: US$273 billion), of which US$279 billion or 98 per cent (2007: US$261 billion; 95 per cent) were debt securities. At 31 December 2008, the available-for-sale fair value reserve relating to debt securities amounted to a deficit of US$21.4 billion (2007: deficit of US$2.4 billion). A deficit in the available-for-sale fair value reserve occurs on an available-for-sale debt security when the fair value of the security is less than the security’s acquisition cost (net of any principal repayments and amortisation) less any previous impairment loss recognised in the income statement, but there is no evidence of any impairment or, if an impairment was previously recognised, any subsequent impairment.
Management is required to exercise judgement in determining whether there is objective evidence that an impairment loss has occurred. Once an impairment has been identified, the amount of impairment loss is measured in relation to the fair value of the asset. More information on assumptions and estimates requiring management judgement relating to the determination of fair values of financial instruments is provided above in ‘Valuation of financial instruments’.
The objective evidence required to determine whether an available-for-sale debt security is impaired comprises evidence of the occurrence of a loss event and evidence that the loss event results in a decrease in estimated future cash flows. Where cash flows are readily determinable, a low level of judgement may be involved. Where determination of estimated future cash flows requires consideration of a number of variables, some of which may be unobservable in current market conditions, more significant judgement is required.
The most significant judgements concern more complex instruments, such as asset-backed securities (‘ABS’s), where it is necessary to consider factors such as the estimated future cash flows on underlying pools of collateral, the extent and depth of market price declines and changes in credit ratings. The review of estimated future cash flows on underlying collateral is subject to estimation uncertainties where the assessment is based on
historical information on pools of assets, and judgement is required to determine whether historical performance is likely to be representative of current economic and credit conditions. A description of these securities is included in the ‘Impact of market turmoil’ section under ‘Nature and extent of HSBC’s exposures’ on page 150 and a more detailed description of the assumptions and estimates used in assessing these securities for impairment is disclosed in the section ‘Assessing available-for-sale assets for impairment’ on page 170.
There is no single factor to which the Group’s charge for impairment of available-for-sale debt securities is particularly sensitive, because of the range of different types of securities held, the range of geographical areas in which those securities are held, and the wide range of factors which can affect the occurrence of loss events and the cash flows of securities, including different types of collateral.
Management’s current assessment of the holdings of available-for-sale ABSs with the most sensitivity to possible future impairment is focused on sub-prime and Alt-A residential mortgage-backed securities (‘MBSs’). The Group’s principal exposure to these securities is in the Global Banking and Markets’ business. Excluding holdings in certain special purpose entities where significant first loss risks are borne by external investors, the available-for-sale holdings in these categories within Global Banking and Markets amounted to US$5.2 billion at 31 December 2008 (2007: US$11.8 billion). The deficit in the available-for-sale fair value reserve as at 31 December 2008 in relation to these securities was US$5.9 billion (2007: US$1.1 billion).
The main factors in the reduction in fair value of these securities over the period were the effects of reduced market liquidity and negative market sentiment. The level of actual credit losses experienced was low in 2008, notwithstanding the deterioration in the performance of the underlying mortgages in the period as US house prices fell and defaults increased. The absence of material credit losses is judged to be attributable to the seniority of the tranches held by HSBC as well as the priority for cash flow held by these tranches.
Further details of the nature and extent of HSBC’s exposures to asset backed securities classified as available-for-sale are provided in ‘Impact of market turmoil–nature and extent of HSBC’s exposures’ on page 150.
It is reasonably possible that outcomes in the next financial year could be different from the assumptions and estimates used in identifying
H S B C H O L D I N G S P L C
Report of the Directors: Operating and Financial Review (continued) Critical accounting policies / Customer groups > Summary
66
impairment on available-for-sale debt securities, as a result of which, evidence of impairment may be identified in available-for-sale debt securities which had previously been determined not to be impaired. It is possible that this could result in the recognition of material impairment losses in the next financial year.
Deferred tax assets
HSBC’s accounting policy for the recognition of deferred tax assets is described in Note 2s on the Financial Statements. A deferred tax asset is recognised to the extent that it is probable that future taxable profits will be available against which deductible temporary differences can be utilised. The recognition of a deferred tax asset relies on management’s judgements surrounding the probability and sufficiency of future taxable profits, future reversals of existing taxable temporary differences and ongoing tax planning strategies.
HSBC’s most significant judgements are around the US deferred tax assets, where there has been a recent history of losses in HSBC’s US operations. Net US deferred tax assets amounted to US$5.0 billion or 71 per cent (2007: US$3.7 billion; 70 per cent) of total net deferred tax assets recognised on the Group’s balance sheet.
The amount of US deferred tax assets recognised is based on the evidence available about conditions at the balance sheet date, and requires significant judgements to be made by management, especially those based on management’s projections of credit losses and the timing of recovery in the US economy. Management’s judgement takes into consideration the impact of both positive and negative evidence, including historical financial performance, projections of future taxable income, future reversals of existing taxable temporary differences, and the availability of loss carrybacks. The recognition of the deferred tax asset is mainly dependent upon the projection of future taxable profits, future reversals of existing taxable temporary differences and the capacity to carry back net operating losses arising in 2009.
Tax losses were incurred in HSBC’s US operations in 2008. Management has evaluated the factors contributing to the losses to determine whether the factors leading to the losses are temporary or indicative of a permanent decline in earnings. Based on its analysis, management has
determined that the losses were primarily caused by increases in credit losses in the US due to the current housing and credit market conditions, as well as continued weakening in the general economy, which has led to higher unemployment levels and, consequently, higher credit losses.
In the US, management’s projections of future taxable income are based on business plans, future capital requirements and ongoing tax planning strategies. These projections include assumptions about the depth and severity of further house price depreciation, assumptions about the US recession, including unemployment levels and their related impact on credit losses, and assumptions about ongoing capital support from HSBC.
The assumptions surrounding future expected credit losses in the US represent the most subjective areas of judgement in management’s projections of future taxable income.
Management’s forecasts support the assumption that it is probable that the results of future operations will generate sufficient taxable income to utilise the deferred tax assets. In management’s judgement, the recent market conditions, which have resulted in losses being incurred in the US over the last two years, will create significant downward pressure and volatility on the profit or loss before tax in the next few years. To reflect this, the assessment of recoverability of the deferred tax asset in the US significantly discounts any future expected taxable income and relies to a greater extent on continued capital support to the US operations from HSBC, including tax planning strategies implemented in relation to such support. The most significant tax planning strategy is HSBC’s investment of capital into its US operations to ensure the utilisation of the net operating loss carry forwards. This strategy provides substantial support for the recoverability of the deferred tax assets. HSBC expects that its US operations will continue to be dependent upon its capital support, and will continue to execute their business strategies and plans until they return to profitability. Based on management’s forecasts, HSBC expects to provide capital support to its US operations in each of the next three years. If HSBC were to decide, however, not to provide this ongoing support, the full recovery of the deferred tax asset may no longer be probable and could result in a material adjustment to the deferred tax asset which would be recognised in the income statement.
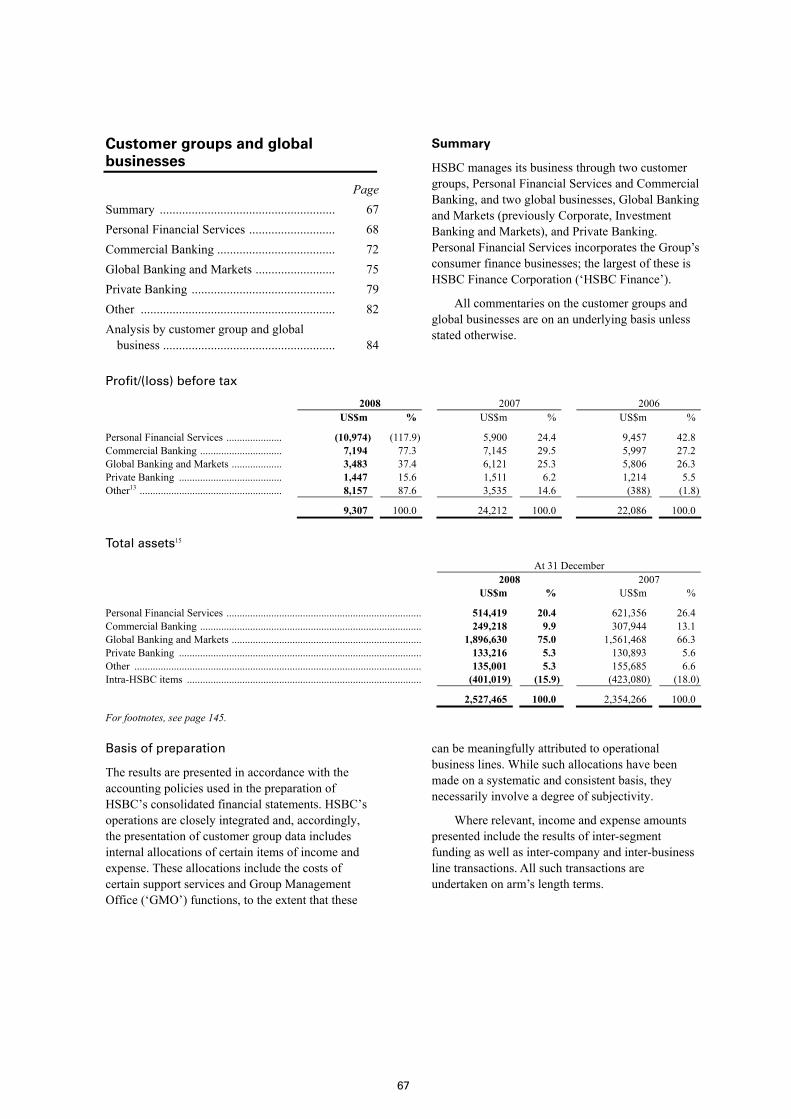
67
Customer groups and global businesses
PageSummary ....................................................... 67Personal Financial Services ........................... 68Commercial Banking ..................................... 72Global Banking and Markets ......................... 75Private Banking ............................................. 79Other ............................................................. 82Analysis by customer group and global
business ...................................................... 84
Summary
HSBC manages its business through two customer groups, Personal Financial Services and Commercial Banking, and two global businesses, Global Banking and Markets (previously Corporate, Investment Banking and Markets), and Private Banking. Personal Financial Services incorporates the Group’s consumer finance businesses; the largest of these is HSBC Finance Corporation (‘HSBC Finance’).
All commentaries on the customer groups and global businesses are on an underlying basis unless stated otherwise.
Profit/(loss) before tax
2008 2007 2006 US$m % US$m % US$m %
Personal Financial Services ..................... (10,974) (117.9) 5,900 24.4 9,457 42.8 Commercial Banking ............................... 7,194 77.3 7,145 29.5 5,997 27.2 Global Banking and Markets ................... 3,483 37.4 6,121 25.3 5,806 26.3 Private Banking ....................................... 1,447 15.6 1,511 6.2 1,214 5.5 Other13 ...................................................... 8,157 87.6 3,535 14.6 (388) (1.8)
9,307 100.0 24,212 100.0 22,086 100.0
Total assets15
At 31 December 2008 2007 US$m % US$m %
Personal Financial Services .......................................................................... 514,419 20.4 621,356 26.4 Commercial Banking .................................................................................... 249,218 9.9 307,944 13.1 Global Banking and Markets ........................................................................ 1,896,630 75.0 1,561,468 66.3 Private Banking ............................................................................................ 133,216 5.3 130,893 5.6 Other ............................................................................................................. 135,001 5.3 155,685 6.6 Intra-HSBC items ......................................................................................... (401,019) (15.9) (423,080) (18.0)
2,527,465 100.0 2,354,266 100.0
For footnotes, see page 145.
Basis of preparation
The results are presented in accordance with the accounting policies used in the preparation of HSBC’s consolidated financial statements. HSBC’s operations are closely integrated and, accordingly, the presentation of customer group data includes internal allocations of certain items of income and expense. These allocations include the costs of certain support services and Group Management Office (‘GMO’) functions, to the extent that these
can be meaningfully attributed to operational business lines. While such allocations have been made on a systematic and consistent basis, they necessarily involve a degree of subjectivity.
Where relevant, income and expense amounts presented include the results of inter-segment funding as well as inter-company and inter-business line transactions. All such transactions are undertaken on arm’s length terms.
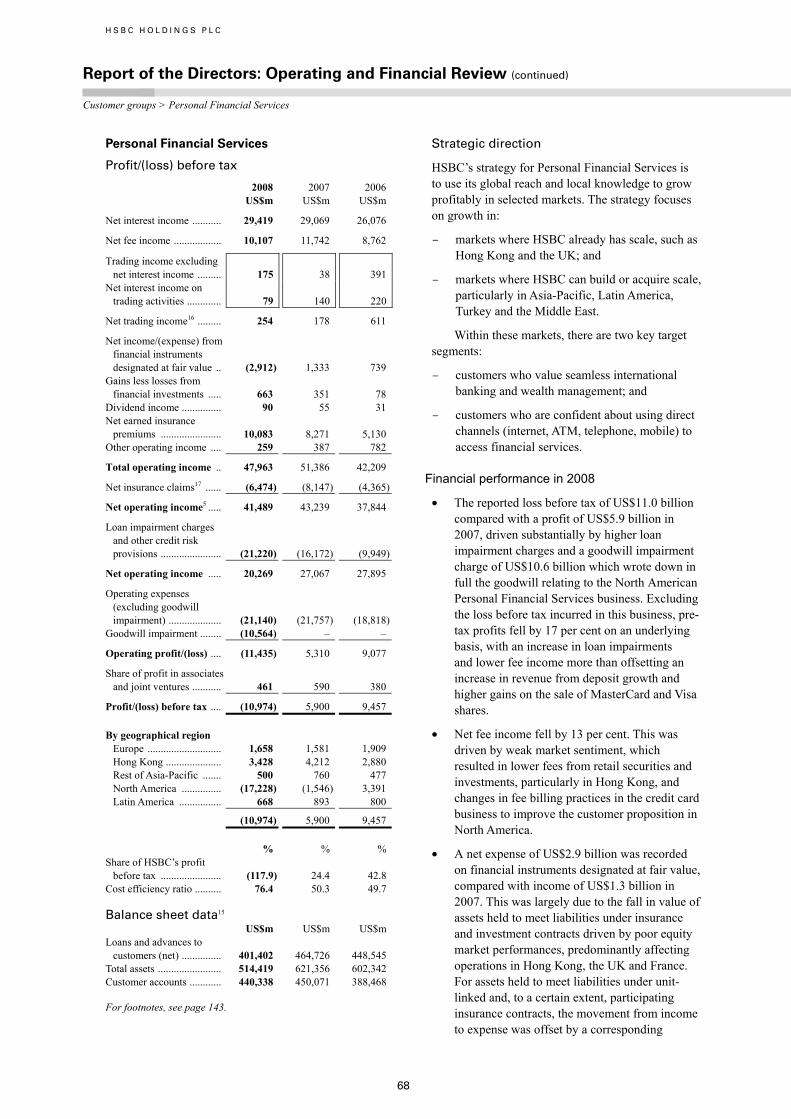
H S B C H O L D I N G S P L C
Report of the Directors: Operating and Financial Review (continued)
Customer groups > Personal Financial Services
68
Personal Financial Services
Profit/(loss) before tax
2008 2007 2006 US$m US$m US$m
Net interest income ........... 29,419 29,069 26,076
Net fee income .................. 10,107 11,742 8,762
Trading income excluding net interest income ......... 175 38 391
Net interest income on trading activities ............. 79 140 220
Net trading income16 ......... 254 178 611
Net income/(expense) from financial instruments designated at fair value .. (2,912) 1,333 739
Gains less losses from financial investments ..... 663 351 78
Dividend income ............... 90 55 31 Net earned insurance
premiums ....................... 10,083 8,271 5,130 Other operating income .... 259 387 782
Total operating income .. 47,963 51,386 42,209
Net insurance claims17 ...... (6,474) (8,147) (4,365)
Net operating income5 ..... 41,489 43,239 37,844
Loan impairment charges and other credit risk provisions ....................... (21,220) (16,172) (9,949)
Net operating income ..... 20,269 27,067 27,895
Operating expenses (excluding goodwill impairment) .................... (21,140) (21,757) (18,818)
Goodwill impairment ........ (10,564) – –
Operating profit/(loss) .... (11,435) 5,310 9,077
Share of profit in associates and joint ventures ........... 461 590 380
Profit/(loss) before tax .... (10,974) 5,900 9,457 By geographical region
Europe ............................ 1,658 1,581 1,909 Hong Kong ..................... 3,428 4,212 2,880 Rest of Asia-Pacific ....... 500 760 477 North America ............... (17,228) (1,546) 3,391 Latin America ................ 668 893 800
(10,974) 5,900 9,457 % % % Share of HSBC’s profit
before tax ....................... (117.9) 24.4 42.8
Cost efficiency ratio .......... 76.4 50.3 49.7 Balance sheet data15 US$m US$m US$m Loans and advances to
customers (net) ............... 401,402 464,726 448,545 Total assets ........................ 514,419 621,356 602,342 Customer accounts ............ 440,338 450,071 388,468
For footnotes, see page 143.
Strategic direction
HSBC’s strategy for Personal Financial Services is to use its global reach and local knowledge to grow profitably in selected markets. The strategy focuses on growth in:
– markets where HSBC already has scale, such as Hong Kong and the UK; and
– markets where HSBC can build or acquire scale, particularly in Asia-Pacific, Latin America, Turkey and the Middle East.
Within these markets, there are two key target segments:
– customers who value seamless international banking and wealth management; and
– customers who are confident about using direct channels (internet, ATM, telephone, mobile) to access financial services.
Financial performance in 2008
• The reported loss before tax of US$11.0 billion compared with a profit of US$5.9 billion in 2007, driven substantially by higher loan impairment charges and a goodwill impairment charge of US$10.6 billion which wrote down in full the goodwill relating to the North American Personal Financial Services business. Excluding the loss before tax incurred in this business, pre-tax profits fell by 17 per cent on an underlying basis, with an increase in loan impairments and lower fee income more than offsetting an increase in revenue from deposit growth and higher gains on the sale of MasterCard and Visa shares.
• Net fee income fell by 13 per cent. This was driven by weak market sentiment, which resulted in lower fees from retail securities and investments, particularly in Hong Kong, and changes in fee billing practices in the credit card business to improve the customer proposition in North America.
• A net expense of US$2.9 billion was recorded on financial instruments designated at fair value, compared with income of US$1.3 billion in 2007. This was largely due to the fall in value of assets held to meet liabilities under insurance and investment contracts driven by poor equity market performances, predominantly affecting operations in Hong Kong, the UK and France. For assets held to meet liabilities under unit-linked and, to a certain extent, participating insurance contracts, the movement from income to expense was offset by a corresponding

69
reduction in policyholder liabilities where investment losses can be passed to policyholders.
• Loan impairment charges rose by 32 per cent, primarily due to further deterioration in credit quality in the North American Personal Financial Services business. Delinquency rates increased across all portfolios in HSBC Finance, particularly consumer lending, and in the real estate secured portfolios in HSBC USA, following the sustained downturn in the housing market and the onset of economic recession.
• A rise in loan impairments in Mexico, Turkey and India was attributable to higher delinquencies following growth of the credit card and personal loan portfolios. Actions taken to curtail asset growth in these markets focused on tightening lending criteria and deploying advanced credit analytics.
• Operating expenses were 48 per cent higher, largely due to the goodwill impairment charge. Excluding this, operational costs were slightly lower, driven by a 12 per cent reduction in North America following initiatives taken since 2007 to cease originations in mortgage services, limit new originations in consumer lending and reduce marketing spend in cards. This benefit was partially offset by investment in business expansion in mainland China and Japan and an increase in restructuring costs and union-agreed salaries in Latin America.
• Profit before tax increased in Europe, with a solid performance in the UK partially offset by a fall in Turkey as an investment in 98 additional branches was made in order to attain nationwide coverage. Profits were lower in France.
• In the Middle East, profit rose by 17 per cent on 2007, with strong growth in revenue from cards.
Business highlights in 2008
• HSBC Premier (‘Premier’), which offers mass affluent customers a seamless international banking and wealth management service, grew to 2.6 million customers in 2008. During the year, the service was extended to a further six countries, taking the total to 41. 472,000 net new customers joined Premier, of whom 80 per cent were new to the Group.
• The strength of the HSBC brand helped attract an increase in customer accounts of US$50 billion, or 13 per cent, to US$440 billion, despite the low interest rate environment. In North America, net loans and advances to customers fell by 16 per cent as HSBC reduced its balance sheet and lowered its risk profile in the US. Excluding North America, lending increased by 10 per cent, demonstrating HSBC’s commitment to supporting its core customer base. At 31 December 2008, the advances-to-deposits ratio was 91 per cent, compared with 106 per cent at the end of December 2007.
• The HSBC Direct online savings offering in the US performed well in difficult market conditions. Average balances increased by US$2.0 billion to US$13.2 billion, reducing the overall funding costs of the US Personal Financial Services business.
• In the UK, HSBC launched a RateMatcher mortgage promotion to attract quality customers facing an interest rate reset in the near term. HSBC attracted a strong flow of new business totalling US$9.9 billion during the campaign. In December 2008, HSBC announced that the bank will make available up to £15 billion of UK residential mortgages in 2009.
• Consistent with HSBC’s strategy to increase the sale of insurance products to existing customers, the major life businesses in Europe and Asia grew and underlying net premium income rose by 15 per cent. However, declining worldwide equity markets led to a reduction in insurance profits compared with 2007.
• In the US, declining house prices, rising unemployment and increasing bankruptcies fuelled growing customer delinquencies. HSBC continued to take measures to help customers manage their mortgage repayments and avoid foreclosure. During 2008, HSBC Finance expanded its mortgage loan modification programme which included longer-term modifications. The loan obligations of over 92,000 customers with aggregate mortgages of US$13.5 billion were modified during 2008, helping to maximise cash flow for HSBC and preserve home ownership for customers.

H S B C H O L D I N G S P L C
Report of the Directors: Operating and Financial Review (continued)
Customer groups > Personal Financial Services
70
Subsequent developments
The branch-based US consumer lending business of HSBC Finance has historically focused on sub-prime customers who rely on drawing cash against the equity in their homes to help meet their cash needs. Unsecured consumer lines of credit have served as a means of generating new customer accounts, with the potential to subsequently provide the customer with a mortgage product, typically a secured debt consolidation loan. As a result, the bulk of the mortgage lending products sold in the US consumer lending branch network have been for refinancing and debt consolidation rather than for house purchase.
The unprecedented deterioration in the US housing market over the last two years, including declining property values and lower secondary market demand for sub-prime mortgages, has undermined the ability of many real estate loan customers to make payments or refinance their loans. In many cases, there is no equity in their homes or, if there is, few institutions are willing to finance its withdrawal. As a result, loan originations in this business have fallen dramatically for both HSBC Finance and the industry as a whole. Management believes it will take years before property values return to the levels seen prior to the decline and, as such, has concluded that recovery in the sub-prime mortgage lending business is uncertain and the industry is unlikely to stabilise for a number of years. Management also expects that changes in regulation and practice will make it problematic to plan and execute a sub-prime lending business strategy with a reasonable degree of confidence.
Given the above, in 2008 HSBC began to reposition its US consumer lending business to reduce risk by tightening lending criteria and expanding its lending to include government sponsored entity and conforming loan products. As part of this repositioning, HSBC intended to place greater emphasis on unsecured loan products while decreasing secured loan production. To date, the results of this repositioning effort have not met expectations, in part due to the continued deterioration in the economy, leading management to re-evaluate whether, given the Group’s risk appetite, the initiative can produce the volume necessary to ensure that the consumer lending business will return to profitability in the foreseeable future.
As a consequence, at the end of February 2009, the Board of HSBC endorsed management’s recommendation to discontinue as soon as practicable originations of all products by the branch-based US consumer lending business of HSBC Finance. At 31 December 2008 this business had outstanding balances of US$62 billion comprising US$46 billion in real estate secured and US$16 billion in unsecured loan balances. HSBC will continue to service and collect the existing loan portfolio as it runs off, and will continue the Group’s efforts to help customers in need of loan modification and other account management programmes to maximise collection and preserve, as far as possible, home ownership. In the US, substantially all consumer lending branches branded HFC and Beneficial will cease taking loan applications and will be closed. HSBC Finance will also continue to run-off the loan portfolios of its mortgage services business and its vehicle finance business. HSBC will provide all necessary support to HSBC Finance to enable it to run off these businesses in a measured way and to meet all its commitments.
The operations of HSBC’s other US Personal Financial Services businesses, including its card business, and the retail bank branch business of HSBC USA are unaffected by this decision. HSBC USA will continue to service its customers with real estate secured and unsecured products.
HSBC expects as a result of this decision affecting the US consumer lending business of HSBC Finance that total revenue will fall by approximately US$50 million in 2009 and operating expenses by approximately US$700 million on an annualised basis. Closure costs of up to US$195 million will be incurred, predominantly related to one-off termination and other employee benefit costs, a substantial portion of which will be recorded in the first half of 2009.
In addition, a non-cash charge of approximately US$70 million is expected to be incurred in relation to the impairment of fixed assets associated with the consumer lending branch network, also to be recognised in the first half of 2009.
Employees supporting originations operations will be evaluated for service elsewhere in HSBC’s operations, but it is currently expected that approximately 6,100 employees will be displaced.

71
Reconciliation of reported and underlying profit/(loss) before tax
2008 compared with 2007
Personal Financial Services
2007 as reported US$m
2007 acquisitions, disposals & dilution gains1
US$m
Currency translation2
US$m
2007 at 2008 exchange rates3
US$m
2008 acquisitions and disposals1
US$m
Under- lying change US$m
2008 as reported US$m
Re- ported change %
Under- lying change %
Net interest income .......... 29,069 (224) (126) 28,719 215 485 29,419 1 2 Net fee income ................. 11,742 (21) (105) 11,616 (9) (1,500) 10,107 (14) (13)Other income4 .................. 2,428 (91) (10) 2,327 83 (447) 1,963 (19) (19)
Net operating income5 ... 43,239 (336) (241) 42,662 289 (1,462) 41,489 (4) (3)
Loan impairment charges and other credit risk provisions .................... (16,172) 4 75 (16,093) (3) (5,124) (21,220) (31) (32)
Net operating income .... 27,067 (332) (166) 26,569 286 (6,586) 20,269 (25) (25)
Operating expenses (excluding goodwill impairment) ................. (21,757) 236 117 (21,404) (98) 362 (21,140) 3 2
Goodwill impairment ....... – – – – – (10,564) (10,564) n/a n/a
Operating profit/(loss) ... 5,310 (96) (49) 5,165 188 (16,788) (11,435) (315) (325)
Income from associates ... 590 – 52 642 – (181) 461 (22) (28)
Profit/(loss) before tax ... 5,900 (96) 3 5,807 188 (16,969) (10,974) (286) (292) 2007 compared with 2006
Personal Financial Services
2006 as reported US$m
2006 acquisitions and disposals1
US$m
Currency translation2
US$m
2006 at 2007 exchange rates6
US$m
2007 acquisitions, disposals & dilution gains1
US$m
Under- lying change US$m
2007 as reported US$m
Re- ported change %
Under- lying change %
Net interest income .......... 26,076 (3) 746 26,819 653 1,597 29,069 11 6 Net fee income ................. 8,762 53 322 9,137 (77) 2,682 11,742 34 30 Other income4 .................. 3,006 (53) 87 3,040 (38) (574) 2,428 (19) (19)
Net operating income5 ..... 37,844 (3) 1,155 38,996 538 3,705 43,239 14 10
Loan impairment charges and other credit risk provisions .................... (9,949) – (205) (10,154) (72) (5,946) (16,172) (63) (59)
Net operating income ...... 27,895 (3) 950 28,842 466 (2,241) 27,067 (3) (8)
Operating expenses .......... (18,818) 2 (753) (19,569) (285) (1,903) (21,757) (16) (10)
Operating profit ............... 9,077 (1) 197 9,273 181 (4,144) 5,310 (42) (45)
Income from associates ... 380 – 13 393 6 191 590 55 49
Profit before tax ............... 9,457 (1) 210 9,666 187 (3,953) 5,900 (38) (41)
For footnotes, see page 143.

H S B C H O L D I N G S P L C
Report of the Directors: Operating and Financial Review (continued)
Customer groups > Commercial Banking
72
Commercial Banking
Profit before tax
2008 2007 2006 US$m US$m US$m
Net interest income ........... 9,494 9,055 7,514
Net fee income .................. 4,097 3,972 3,207
Trading income excluding net interest income ......... 369 265 204
Net interest income on trading activities ............. 17 31 20
Net trading income16 ......... 386 296 224
Net income/(expense) from financial instruments designated at fair value .. (224) 22 (22)
Gains less losses from financial investments ..... 193 90 44
Dividend income ............... 88 8 6 Net earned insurance
premiums ....................... 679 733 258 Other operating income .... 939 165 250
Total operating income .. 15,652 14,341 11,481
Net insurance claims17 ...... (335) (391) (96)
Net operating income5 ..... 15,317 13,950 11,385
Loan impairment charges and other credit risk provisions ....................... (2,173) (1,007) (697)
Net operating income ..... 13,144 12,943 10,688
Total operating expenses .. (6,581) (6,252) (4,979)
Operating profit .............. 6,563 6,691 5,709
Share of profit in associates and joint ventures ........... 631 454 288
Profit before tax .............. 7,194 7,145 5,997 By geographical region
Europe ............................ 2,722 2,516 2,234 Hong Kong ..................... 1,315 1,619 1,321 Rest of Asia-Pacific ....... 1,793 1,350 1,034 North America ............... 658 920 957 Latin America ................ 706 740 451
7,194 7,145 5,997 % % % Share of HSBC’s profit
before tax ....................... 77.3 29.5 27.2
Cost efficiency ratio .......... 43.0 44.8 43.7 Balance sheet data15 US$m US$m US$m Loans and advances to
customers (net) ............... 203,949 220,068 172,976 Total assets ........................ 249,218 307,944 228,668 Customer accounts ............ 235,879 237,987 190,853
For footnotes, see page 143.
Strategic direction
HSBC’s Commercial Banking strategy is focused on two key initiatives:
− to be the leading international business bank, using HSBC’s extensive geographical network together with product expertise in payments, trade, receivables finance and foreign exchange to actively support customers trading and investing across borders; and
− to be the best bank for small businesses in target markets, building global scale and creating efficiencies by sharing best practice, including customer experience and credit scoring, and selectively rolling out the direct banking model.
Financial performance in 2008
• Reported pre-tax profit was broadly in line with 2007 at US$7.2 billion as revenue growth was offset by the rise in loan impairment charges and operating costs. Pre-tax profit growth was evident in emerging markets, with their contribution increasing to 56 per cent excluding a gain of US$425 million on the disposal of the UK merchant acquiring division, recorded in ‘Other operating income’. Profit growth was most significant in Australia, India, mainland China, United Arab Emirates (‘UAE’), Turkey, Brazil and Argentina.
• HSBC remained committed to new lending, increasing lending balances by 10 per cent. Deposit growth of 15 per cent was driven by brand strength, particularly in the UK, the US and Hong Kong.
• Balance sheet growth drove a 7 per cent rise in net interest income, notwithstanding the adverse affect of widespread reductions in interest rates on liability spreads. This was partly offset by higher lending spreads from improved pricing.
• Net fee income rose by 8 per cent with income from trade services and foreign exchange growing particularly strongly.
• Other income was boosted by a number of significant gains, notably from the sale of shares in MasterCard and Visa.
• Loan impairment charges increased from US$1.0 billion in 2007 to US$2.2 billion, as the previously benign credit environment was replaced by economic slowdown in most countries. Loan impairment charges increased by 44 basis points to 1 per cent of average reported assets, with most of the increase coming in the second half of 2008.

73
• The cost efficiency ratio improved to 44.2 per cent excluding the US$425 million gains noted above. Costs were tightly controlled in Europe and North America, but grew elsewhere as the Group continued to expand operations in emerging markets, particularly in Asia.
• Customer numbers grew to 2.9 million, with continuing recruitment of new customers through existing operations and gains from the acquisition of the assets, liabilities and operations of The Chinese Bank in Taiwan, despite a reduction from the sale of the French regional banks.
Business highlights in 2008
Commercial Banking achieved key objectives toward its international business strategy in 2008 as the proportion of its total revenues derived from international customers and products increased.
• Revenue from foreign exchange and trade and supply chain products grew strongly, with increases of 66 per cent and 27 per cent, respectively. This was driven by improved cross-selling of products, particularly in foreign exchange, as customers sought protection from volatile currency movements. A number of initiatives were launched to extend foreign exchange services, which included enhancing relationship management in the US and UAE, and introducing dedicated sales desks in India.
• The volume of international trade finance increased significantly and revenue grew commensurately as HSBC benefited from higher commodity prices, the reintermediation of traditional trade instruments in respect of which the Group demonstrated continued capacity to lend, and improved pricing reflecting market trends. HSBC’s growth outpaced market growth in a number of key countries, particularly in Asia and the Middle East.
• Successful Global Links referrals nearly doubled to 5,600, with the aggregate transaction value exceeding US$11 billion, an increase of 96 per cent. The use of electronic account opening ‘SmartForms’ improved customer experience.
In support of its strategy to be the best bank for small businesses, HSBC focused on deposit gathering and transaction banking, and was particularly successful in attracting customer deposits.
• With over US$100 billion in customer deposits, HSBC’s small and micro segments are a
significant source of funding for Commercial Banking, generating over twice as much in liabilities as loans and advances to customers. Customer numbers in the small and micro segments rose by 7 per cent to 2.6 million. In Taiwan, the acquisition of the assets, liabilities and operations of The Chinese Bank expanded the branch network to 33 and added over 15,000 small business customers.
• Customer loyalty was evidenced by an increase in the use of internet banking, with the number of active users of Business Internet Banking growing by 16 per cent and the number of transactions by 18 per cent.
• New small business offerings continued to be initiated. BusinessDirect was extended to seven countries and total customer numbers exceeded 180,000. BusinessVantage was launched in Indonesia while, in the US, the autumn marketing campaign led to over 9,000 new accounts. New business card products were rolled out in a further six countries.
• The announcement of HSBC’s US$5 billion International SME Fund in December under-scored the Group’s commitment to lending to small and medium-sized enterprises, and led to significant interest from existing and prospective customers. Specific initiatives were launched in the UK, Hong Kong, France and Malta.
Commercial Banking increased its intra-Group referrals, in part by extending the Global Links platform to facilitate cross-customer group referrals.
• In Hong Kong and India, an initiative to increase referrals across customer groups resulted in a two-fold rise in the number of Premier account referrals, and significant growth in referrals from Personal Financial Services to Commercial Banking. Similar programmes in the UK contributed to sales of Premier accounts and mortgage products, and plans are underway to extend these programmes to other regions in 2009.
• Referrals to Private Banking grew by 30 per cent, and led to US$2.7 billion in new assets under management, while referrals from Private Banking led to a three-fold increase in new relationships.
• Sales of Global Markets products were particularly strong in foreign exchange under Commercial Banking’s strategy to be the leading bank for international business.

H S B C H O L D I N G S P L C
Report of the Directors: Operating and Financial Review (continued)
Customer groups > Commercial Banking / Global Banking and Markets
74
Reconciliation of reported and underlying profit before tax
2008 compared with 2007
Commercial Banking
2007 as reported US$m
2007 acquisitions, disposals & dilution gains1
US$m
Currency translation2
US$m
2007 at 2008 exchange rates3
US$m
2008 acquisitions and disposals1
US$m
Under- lying change US$m
2008 as reported US$m
Re- ported change %
Under- lying change %
Net interest income .......... 9,055 (166) (77) 8,812 41 641 9,494 5 7 Net fee income ................. 3,972 (113) (76) 3,783 27 287 4,097 3 8 Other income4 .................. 923 (7) (28) 888 525 313 1,726 87 35
Net operating income5 ... 13,950 (286) (181) 13,483 593 1,241 15,317 10 9
Loan impairment charges and other credit risk provisions .................... (1,007) 3 36 (968) (3) (1,202) (2,173) (116) (124)
Net operating income .... 12,943 (283) (145) 12,515 590 39 13,144 2 –
Operating expenses .......... (6,252) 180 47 (6,025) (106) (450) (6,581) (5) (7)
Operating profit ............. 6,691 (103) (98) 6,490 484 (411) 6,563 (2) (6)
Income from associates ... 454 – 26 480 – 151 631 39 31
Profit before tax ............. 7,145 (103) (72) 6,970 484 (260) 7,194 1 (4) 2007 compared with 2006
Commercial Banking
2006 as reported US$m
2006 acquisitions and disposals1
US$m
Currency translation2
US$m
2006 at 2007 exchange rates6
US$m
2007 acquisitions, disposals & dilution gains1
US$m
Under- lying change US$m
2007 as reported US$m
Re- ported change %
Under- lying change %
Net interest income .......... 7,514 – 382 7,896 114 1,045 9,055 21 13 Net fee income ................. 3,207 – 189 3,396 17 559 3,972 24 16 Other income4 .................. 664 – 27 691 48 184 923 39 27
Net operating income5 ..... 11,385 – 598 11,983 179 1,788 13,950 23 15
Loan impairment charges and other credit risk provisions .................... (697) – (47) (744) (61) (202) (1,007) (44) (27)
Net operating income ...... 10,688 – 551 11,239 118 1,586 12,943 21 14
Operating expenses .......... (4,979) – (291) (5,270) (73) (909) (6,252) (26) (17)
Operating profit ............... 5,709 – 260 5,969 45 677 6,691 17 11
Income from associates ... 288 – 9 297 1 156 454 58 53
Profit before tax ............... 5,997 – 269 6,266 46 833 7,145 19 13
For footnotes, see page 143.

75
Global Banking and Markets
Profit before tax
2008 2007 2006 US$m US$m US$m
Net interest income ........... 8,541 4,430 3,168
Net fee income .................. 4,291 4,901 3,718
Trading income excluding net interest income ......... 157 3,503 4,890
Net interest income/ (expense) on trading activities ......................... 324 (236) (379)
Net trading income16 ......... 481 3,267 4,511
Net income/(expense) from financial instruments designated at fair value ................... (438) (164) 20
Gains less losses from financial investments ..... (327) 1,313 534
Dividend income ............... 76 222 235 Net earned insurance
premiums ....................... 105 93 73 Other operating income .... 868 1,218 1,378
Total operating income .. 13,597 15,280 13,637
Net insurance claims17 ...... (79) (70) (62)
Net operating income5 ..... 13,518 15,210 13,575
Loan impairment (charges)/ recoveries and other credit risk provisions .... (1,471) (38) 119
Net operating income ..... 12,047 15,172 13,694
Total operating expenses .. (9,092) (9,358) (7,991)
Operating profit .............. 2,955 5,814 5,703
Share of profit in associates and joint ventures ........... 528 307 103
Profit before tax .............. 3,483 6,121 5,806 By geographical region
Europe ............................ 195 2,527 2,304 Hong Kong ..................... 1,436 1,578 955 Rest of Asia-Pacific ....... 3,786 2,464 1,649 North America ............... (2,575) (965) 423 Latin America ................ 641 517 475
3,483 6,121 5,806 % % % Share of HSBC’s profit
before tax ....................... 37.4 25.3 26.3
Cost efficiency ratio .......... 67.3 61.5 58.9
For footnotes, see page 143.
Strategic direction
In 2008, Global Banking and Markets continued to pursue its ‘emerging markets-led and financing-focused’ strategy, which was introduced in 2006 and fully implemented in 2007. HSBC’s strategy is to be a leading wholesale bank by:
– utilising HSBC’s extensive distribution network;
– developing Global Banking and Markets’ hub-and-spoke business model; and
– continuing to build capabilities in major hubs to support the delivery of an advanced suite of services to corporate, institutional and government clients across the HSBC network.
Ensuring that this combination of product depth and distribution strength meets the needs of existing and new clients will allow Global Banking and Markets to achieve its strategic goals.
Financial performance in 2008
• Global Banking and Markets delivered a pre-tax profit of US$3.5 billion, a decline of US$2.6 billion or 43 per cent compared with 2007. Although credit trading was significantly impacted by the adverse market conditions, revenues in other core businesses grew strongly in both developed and emerging markets. At constant exchange rates, total operating expenses were slightly below 2007 with a progressive decline over the last four half-years.
• Core businesses such as foreign exchange, Rates, Balance Sheet Management and financing and equity capital markets posted record revenues.
• In 2008, some US$5.4 billion of write-downs were absorbed on legacy positions in credit trading, leveraged and acquisition financing and monoline credit exposures. This compared with US$2.1 billion of write-downs recorded in 2007. Results for 2008 included a US$529 million fair value gain on the widening of credit spreads on structured liabilities.
• In addition, because of an alleged fraud, HSBC wrote off the value of units in funds which had invested with Madoff Securities, and took a charge against trading income of US$984 million in the equities business in December 2008. The units had been acquired in connection with various financing transactions entered into with institutional clients.

H S B C H O L D I N G S P L C
Report of the Directors: Operating and Financial Review (continued)
Customer groups > Global Banking and Markets
76
Management view of total operating income
2008
US$m 2007
US$m 2006
US$m
Global Markets18 ............... 2,676 5,720 6,059 Credit ............................ (5,502) (1,319) 931Rates ............................. 2,033 1,291 1,207Foreign exchange ......... 3,842 2,178 1,552Equities ......................... (64) 1,177 721Securities services ........ 2,116 1,926 1,378Asset and structured
finance ....................... 251 467 270
Global Banking ................. 5,718 4,190 3,388 Financing and equity
capital markets ........... 3,572 2,186 1,730Payments and cash
management ............... 1,665 1,632 1,257Other transaction
services ....................... 481 372 401
Balance Sheet Management ................. 3,618 1,226 713
Global Asset Management ................. 934 1,336 1,061
Principal Investments ....... (415) 1,253 686 Other19 ............................... 1,066 1,555 1,730
Total operating income ..... 13,597 15,280 13,637
Comparative information has been adjusted to reflect the current management view.
For footnotes, see page 143.
• Loan impairment charges and other credit risk provisions of US$1.5 billion were higher than in 2007, reflecting loan impairment charges resulting from the deteriorating credit environment, coupled with a relatively modest impairment charge within the available-for-sale portfolio, taken through the income statement and detailed below.
• Within the Group’s available-for-sale portfolio, continuing illiquidity in asset-backed securities markets led to further write-downs. However, due to the underlying credit quality and seniority of the tranches held by HSBC, only a relatively modest impairment charge of US$279 million was identified on securities with a nominal value of US$570 million and was taken to the income statement. The expected cash flow impairment on these securities was US$86 million. A further US$293 million impairment was absorbed by income note holders who take the first loss on positions within the securities investment conduits (‘SIC’s) now consolidated in HSBC’s accounts. Further details on the SICs are provided on pages 174 to 179.
Business highlights in 2008
• The success of Global Banking and Markets’ two-year-old ‘emerging markets-led and financing-focused’ strategy was recognised by a number of key industry awards, including ‘Sterling Bond House’, ‘Islamic Bond House’, ‘Middle East Loan House’ and ‘Latin America Bond House’ in International Financing Review; ‘Best Emerging Markets Bank’, ‘Best Investment Bank in the Middle East’ and ‘Best Debt House in Europe’ in Euromoney; ‘Best Bond House’ in Asia in FinanceAsia, Asiamoney and The Asset; ‘Bond House of the Year’ in Latin Finance; and ‘Emerging Markets Manager of the Year’ in European Pensions.
• In Global Markets, foreign exchange revenues rose by 76 per cent to a record US$3.8 billion due to increased market volatility and higher levels of customer activity. While foreign exchange revenues rose in all regions, performance was notably strong in Europe, where revenues rose by 75 per cent to US$1.4 billion, in the Rest of Asia-Pacific region, and in North America, where revenues more than doubled.
• The Rates business also reported record revenues, reflecting increased customer activity against a backdrop of greater market volatility.
• Securities services revenues grew despite the lower interest rate environment, benefiting from new customer flows and additional business from existing customers. Assets under custody decreased by 34 per cent to US$3.6 trillion, driven by the downturn in the equity markets and the net redemptions experienced across the industry in the final quarter.
• Growth in Global Banking was driven by improved margins in the credit and lending business and substantial gains on credit default swap transactions in certain portfolios. Payments and cash management continued to deliver revenue growth, primarily due to strong growth in liability balances, although margins narrowed in the latter part of the year.
• Balance Sheet Management income rose in Europe, Asia and North America, reflecting positioning ahead of rate reductions by a number of central banks.
• In Principal Investments, markets remained closed for realisations and certain private equity holdings were marked down to reflect market conditions.

77
• In Global Asset Management, although underlying management fees remained strong, overall revenues fell, primarily due to the costs associated with the provision of support to certain money market funds. A fall in
performance fees reflected a 20 per cent decrease in funds under management following recent equity market declines. Nevertheless, HSBC remained one of the leading emerging markets asset managers.
Reconciliation of reported and underlying profit before tax
2008 compared with 2007
Global Banking and Markets
2007 as reported US$m
2007 acquisitions, disposals & dilution gains1
US$m
Currency translation2
US$m
2007 at 2008 exchange rates3
US$m
2008 acquisitions and disposals1
US$m
Under- lying change US$m
2008 as reported US$m
Re- ported change %
Under- lying change %
Net interest income .......... 4,430 – (32) 4,398 – 4,143 8,541 93 94 Net fee income ................. 4,901 – (46) 4,855 – (564) 4,291 (12) (12)Other income4 .................. 5,879 – (57) 5,822 – (5,136) 686 (88) (88)
Net operating income5 ... 15,210 – (135) 15,075 – (1,557) 13,518 (11) (10)
Loan impairment charges and other credit risk provisions .................... (38) – 1 (37) – (1,434) (1,471) (3,771) (3,876)
Net operating income .... 15,172 – (134) 15,038 – (2,991) 12,047 (21) (20)
Operating expenses .......... (9,358) – 175 (9,183) – 91 (9,092) 3 1
Operating profit ............. 5,814 – 41 5,855 – (2,900) 2,955 (49) (50)
Income from associates ... 307 – 18 325 – 203 528 72 62
Profit before tax ............. 6,121 – 59 6,180 – (2,697) 3,483 (43) (44) 2007 compared with 2006
Global Banking and Markets
2006 as reported US$m
2006 acquisitions and disposals1
US$m
Currency translation2
US$m
2006 at 2007 exchange rates6
US$m
2007 acquisitions, disposals & dilution gains1
US$m
Under- lying change US$m
2007 as reported US$m
Re- ported change %
Under- lying change %
Net interest income .......... 3,168 – 175 3,343 25 1,062 4,430 40 32 Net fee income ................. 3,718 – 182 3,900 9 992 4,901 32 25 Other income4 .................. 6,689 – 360 7,049 10 (1,180) 5,879 (12) (17)
Net operating income5 ..... 13,575 – 717 14,292 44 874 15,210 12 6
Loan impairment charges and other credit risk provisions .................... 119 – 6 125 – (163) (38) (132) (130)
Net operating income ...... 13,694 – 723 14,417 44 711 15,172 11 5
Operating expenses .......... (7,991) – (406) (8,397) (35) (926) (9,358) (17) (11)
Operating profit ............... 5,703 – 317 6,020 9 (215) 5,814 2 (4)
Income from associates ... 103 – (4) 99 2 206 307 198 208
Profit before tax ............... 5,806 – 313 6,119 11 (9) 6,121 5 –
For footnotes, see page 143.

H S B C H O L D I N G S P L C
Report of the Directors: Operating and Financial Review (continued)
Customer groups > Global Banking and Markets / Private Banking
78
Balance sheet data significant to Global Banking and Markets
Year ended 31 December 2008
Europe Hong Kong
Rest of Asia- Pacific
North America
Latin America Total
US$m US$m US$m US$m US$m US$m
Trading assets20 ................................................... 281,089 45,398 19,606 74,498 5,004 425,595 Derivative assets ................................................. 303,265 26,989 26,506 125,848 5,145 487,753 Loans and advances to:
– customers (net) ............................................ 185,818 23,042 34,590 35,583 8,273 287,306 – banks (net) ................................................... 49,508 20,970 26,710 9,238 12,574 119,000
Financial investments20 ....................................... 105,546 46,964 37,346 39,841 8,179 237,876 Total assets ......................................................... 1,131,721 225,853 172,049 318,139 48,868 1,896,630
Deposits by banks ............................................... 79,509 11,509 13,205 16,244 3,871 124,338 Customer accounts .............................................. 199,687 30,866 50,605 23,844 15,384 320,386 Trading liabilities ................................................ 144,759 13,056 3,687 72,325 2,546 236,373 Derivative liabilities ........................................... 300,200 28,536 26,481 122,699 4,615 482,531 Year ended 31 December 2007
Europe Hong Kong
Rest of Asia- Pacific
North America
Latin America Total
Trading assets20 ................................................... 294,078 26,877 19,732 93,395 8,570 442,652 Derivative assets ................................................. 102,409 11,492 10,234 56,531 1,814 182,480 Loans and advances to:
– customers (net) ............................................ 163,066 19,171 32,106 26,186 9,935 250,464 – banks (net) ................................................... 89,651 53,725 30,853 14,938 10,339 199,506
Financial investments20 ....................................... 94,416 46,765 39,448 33,273 10,155 224,057 Total assets ......................................................... 892,712 215,801 155,106 252,804 45,045 1,561,468
Deposits by banks ............................................... 85,315 6,251 17,174 14,825 2,830 126,395 Customer accounts .............................................. 163,713 37,364 54,120 30,732 13,950 299,879 Trading liabilities ................................................ 201,010 15,939 8,601 73,081 4,998 303,629 Derivative liabilities ........................................... 104,687 10,865 9,656 53,058 1,986 180,252 Year ended 31 December 2006
Europe Hong Kong
Rest of Asia- Pacific
North America
Latin America Total
Trading assets20 ................................................... 165,116 30,895 14,726 105,645 7,575 323,957 Derivative assets ................................................. 53,223 6,259 6,575 32,357 1,230 99,644 Loans and advances to:
– customers (net) ............................................ 140,277 20,270 24,311 17,215 8,147 210,220 – banks (net) ................................................... 63,788 45,023 22,171 15,862 9,704 156,548
Financial investments20 ....................................... 54,009 48,407 20,890 30,496 8,169 161,971 Total assets ......................................................... 526,468 182,540 109,535 203,639 37,564 1,059,746
Deposits by banks ............................................... 65,963 4,363 9,849 9,664 3,115 92,954 Customer accounts .............................................. 139,416 24,530 36,623 23,711 11,685 235,965 Trading liabilities ................................................ 97,015 17,292 6,243 88,275 4,898 213,723 Derivative liabilities ........................................... 55,581 6,376 6,149 32,148 1,266 101,520
For footnotes, see page 143.

79
Private Banking
Profit before tax
2008 2007 2006 US$m US$m US$m
Net interest income ........... 1,612 1,216 1,011
Net fee income .................. 1,476 1,615 1,323
Trading income excluding net interest income ......... 408 525 362
Net interest income on trading activities ........ 14 9 2
Net trading income15 ......... 422 534 364
Net income/(expense) from financial instruments designated at fair value .. – (1) 1
Gains less losses from financial investments ..... 64 119 166
Dividend income ............... 8 7 5 Other operating income .... 49 58 61
Total operating income .. 3,631 3,548 2,931
Net insurance claims16 ...... – – –
Net operating income5 ..... 3,631 3,548 2,931
Loan impairment charges and other credit risk provisions ....................... (68) (14) (33)
Net operating income ..... 3,563 3,534 2,898
Total operating expenses .. (2,116) (2,025) (1,685)
Operating profit .............. 1,447 1,509 1,213
Share of profit in associates and joint ventures ........... – 2 1
Profit before tax .............. 1,447 1,511 1,214 By geographical region
Europe ............................ 998 915 805 Hong Kong ..................... 237 305 201 Rest of Asia-Pacific ....... 113 92 80 North America ............... 83 174 114 Latin America ................ 16 25 14
1,447 1,511 1,214 % % % Share of HSBC’s profit
before tax ....................... 15.6 6.2 5.5
Cost efficiency ratio .......... 58.3 57.1 57.5 Balance sheet data14 US$m US$m US$m Loans and advances to
customers (net) ............... 37,590 43,612 34,297 Total assets ........................ 133,216 130,893 106,178 Customer accounts ............ 116,683 106,197 80,303
For footnotes, see page 143.
Strategic direction
The strategy for Private Banking is to be the world’s leading international private bank, known for excellent client experience and global connections.
– HSBC’s global network, strong capital position and recognised brand provide a base from which Private Banking attracts and retains clients and serves their complex international needs. It uses both traditional and innovative ways of managing and preserving the wealth of high net worth individuals while optimising returns.
– Private Banking has built a network of domestic and international operations that provide diversified revenue streams, helped by product leadership in areas such as credit, hedge funds, emerging markets, investment advice and estate planning. This is achieved by attracting, retaining and motivating talented individuals, by providing close communication between clients and staff, and by making targeted investments in IT, marketing and branding initiatives.
Financial performance in 2008
• Reported pre-tax profit fell by 4 per cent as clients moved progressively to a more conservative investment stance in the turbulent markets. This trend was reflected in reduced trading income in Asia, lower fee income in Europe and higher loan impairment charges and other credit risk provisions. By contrast, net interest income grew strongly in Europe. On an underlying basis, pre-tax profit decreased by 3 per cent.
• Net interest income rose by 34 per cent to US$1.6 billion as a result of an increase in customer deposit balances in Switzerland, the UK and Hong Kong as customers reduced risk in response to market turbulence, choosing HSBC for its strength and switching from investment securities to cash deposits. Spreads improved as interest rates declined sharply.
• Net fee income decreased by 4 per cent to US$1.5 billion, driven by a fall in funds under management in all regions as a result of equity market declines and clients switching from securities into cash deposits. Transaction volumes also fell, particularly in the fourth quarter.

H S B C H O L D I N G S P L C
Report of the Directors: Operating and Financial Review (continued)
Customer groups > Private Banking
80
• Trading income fell by 21 per cent to US$422 million, driven by lower demand for structured products in Asia following the decline in the Hong Kong stock market which led to clients preferring more stable cash deposits. Partly offsetting this was an increase in foreign exchange trading revenue in the volatile currency markets.
• Gains less losses from financial investments decreased by 47 per cent to US$64 million due to lower gains from the disposal of HSBC’s residual holding in the Hermitage Fund in 2008, compared with 2007.
• Loan impairment charges and other credit risk provisions increased by US$54 million to US$68 million, primarily due to a loss on a bond position in a failed US bank and higher provisions on real estate-related products.
• Operating expenses grew by 9 per cent to US$2.1 billion, mainly due to the non-recurrence of a one-off pension-related credit recognised in 2007. Staff numbers increased in Asia and Europe in late 2007 and the first half of 2008, leading to higher costs, although these reduced in the second half of the year. As a result, the cost efficiency ratio worsened by 1.9 percentage points to 58.3 per cent.
Client assets 2008 2007 US$bn US$bn
At 1 January ....................................... 421 333 Net new money .................................. 24 36 Value change ...................................... (71) 19 Exchange and other ........................... (22) 33
At 31 December ................................. 352 421 Client assets by investment class 2008 2007 US$bn US$bn
Equities .............................................. 53 81 Bonds ................................................. 57 64 Structured products ............................ 7 12 Funds .................................................. 87 123 Cash, fiduciary deposits and other .... 148 141
352 421 • Reported client assets decreased by 16 per cent
to US$352 billion in 2008, due to the decline in equity market values in all regions. Net new money flows continued to be strong, particularly in Europe, as clients were attracted by HSBC’s strong capital base during the market turbulence. However, reduced leverage had a US$5.9 billion
effect on net new money flows compared with 2007 and some outflows of client deposits were experienced in the fourth quarter following the introduction of government guarantees to certain competitor banks.
• Total client assets declined by 12 per cent on a reported basis to US$433 billion, with net new money of US$30 billion. ‘Total client assets’ is a measure equivalent to many industry definitions of assets under management which include some non-financial assets held in client trusts.
Business highlights in 2008
• Inward referrals from other customer groups in HSBC resulted in US$6.8 billion of net new money compared with US$5.7 billion in 2007.
• The proportion of trading volumes that were transacted with Global Banking and Markets increased as more systems and processes were connected.
• Investments in emerging markets continued as Private Banking clients invested over US$1 billion in various HSBC Private Equity and fund offerings.
• The Euromoney 2009 Private Banking Survey placed HSBC Private Bank second overall in the Global Private Bank category, up from third in 2008. HSBC Private Bank was also awarded ‘Best Private Bank in Asia’ and ‘Best Private Bank in the Middle East’. At the International Wealth Management Summit, HSBC won ‘Outstanding Global Private Banker’ awarded to the Global CEO of HSBC Private Bank, and ‘Outstanding Private Bank’ in the Middle East.
• In 2008, HSBC announced that it would merge its two Swiss private banks under the HSBC Private Bank brand. The merger is expected to result in future strategic and cost benefits.
• Following a comprehensive review in 2008, HSBC Private Bank launched a fresh image campaign in 2009, including the aim to be ‘The world’s private bank’ in alignment with the Group’s recognised global brand strategy. The launch was combined with a targeted advertising and marketing campaign.
• Offices in Guangzhou, Shanghai and Beijing were formally opened as part of the launch of Private Banking operations in mainland China. Preparations were also made for a launch of domestic operations in Russia in 2009.

81
Reconciliation of reported and underlying profit before tax
2008 compared with 2007
Private Banking
2007 as reported US$m
2007 acquisitions, disposals & dilution gains1
US$m
Currency translation2
US$m
2007 at 2008 exchange rates3
US$m
2008 acquisitions and disposals1
US$m
Under- lying change US$m
2008 as reported US$m
Re- ported change %
Under- lying change %
Net interest income .......... 1,216 1 (12) 1,205 – 407 1,612 33 34 Net fee income ................. 1,615 (105) 26 1,536 – (60) 1,476 (9) (4)Other income4 ................... 717 (18) 5 704 – (161) 543 (24) (23)
Net operating income5 .... 3,548 (122) 19 3,445 – 186 3,631 2 5
Loan impairment charges and other credit risk provisions .................... (14) – – (14) – (54) (68) (386) (386)
Net operating income .... 3,534 (122) 19 3,431 – 132 3,563 1 4
Operating expenses .......... (2,025) 98 (17) (1,944) – (172) (2,116) (4) (9)
Operating profit ............. 1,509 (24) 2 1,487 – (40) 1,447 (4) (3)
Income from associates ... 2 – – 2 – (2) – (100) (100)
Profit before tax ............. 1,511 (24) 2 1,489 – (42) 1,447 (4) (3) 2007 compared with 2006
Private Banking
2006 as reported US$m
2006 acquisitions and disposals1
US$m
Currency translation2
US$m
2006 at 2007 exchange rates6
US$m
2007 acquisitions, disposals & dilution gains1
US$m
Under- lying change US$m
2007 as reported US$m
Re- ported change %
Under- lying change %
Net interest income .......... 1,011 – 24 1,035 2 179 1,216 20 17 Net fee income ................. 1,323 – 32 1,355 4 256 1,615 22 19 Other income4 .................. 597 – 7 604 1 112 717 20 19
Net operating income5 ...... 2,931 – 63 2,994 7 547 3,548 21 18
Loan impairment charges and other credit risk provisions .................... (33) – – (33) – 19 (14) 58 58
Net operating income ...... 2,898 – 63 2,961 7 566 3,534 22 19
Operating expenses .......... (1,685) – (40) (1,725) (4) (296) (2,025) (20) (17)
Operating profit ............... 1,213 – 23 1,236 3 270 1,509 24 22
Income from associates ... 1 – – 1 – 1 2 100 100
Profit before tax ............... 1,214 – 23 1,237 3 271 1,511 24 22
For footnotes, see page 143.

H S B C H O L D I N G S P L C
Report of the Directors: Operating and Financial Review (continued)
Customer groups > Other
82
Other
Profit/(loss) before tax
2008 2007 2006 US$m US$m US$m
Net interest expense .......... (956) (542) (625)
Net fee income/(expense) .. 53 (228) 172
Trading income/(expense) excluding net interest income ............................ (262) 127 (228)
Net interest income/ (expense) on trading activities ......................... (268) (1) 82
Net trading income/ (expense)16 .................... (530) 126 (146)
Changes in fair value of long-term debt issued and related derivatives .. 6,679 2,812 (35)
Net income/(expense) from other financial instruments designated at fair value ................... 747 81 (46)
Net income/(expense) from financial instruments designated at fair value .. 7,426 2,893 (81)
Gains less losses from financial investments ..... (396) 83 147
Gains arising from dilution of interests in associates ....................... – 1,092 –
Dividend income ............... 10 32 63 Net earned insurance
premiums ....................... (17) (21) 207 Gains on disposal of
French regional banks .... 2,445 – – Other operating income .... 4,261 3,523 3,254
Total operating income .. 12,296 6,958 2,991
Net insurance claims17 ....... (1) – (181)
Net operating income5 ..... 12,295 6,958 2,810
Loan impairment charges and other credit risk provisions ....................... (5) (11) (13)
Net operating income ..... 12,290 6,947 2,797
Total operating expenses .. (4,174) (3,562) (3,259)
Operating profit/(loss) .... 8,116 3,385 (462)
Share of profit in joint ventures and associates .. 41 150 74
Profit/(loss) before tax .... 8,157 3,535 (388)
By geographical region Europe ............................ 5,296 1,056 (278)Hong Kong ..................... (955) (375) (175)Rest of Asia-Pacific ....... 276 1,343 287 North America ............... 3,534 1,508 (217)Latin America ................ 6 3 (5)
8,157 3,535 (388)
% % % Share of HSBC’s profit
before tax ....................... 87.6 14.6 (1.8)
Cost efficiency ratio .......... 33.9 51.2 116.0 For footnotes, see page 143.
Notes
• Reported profit before tax in Other was US$8.2 billion, compared with US$3.5 billion in 2007. For a description of the main items reported under ‘Other’, see footnote 14 on page 143.
• Net income from financial instruments designated at fair value amounted to US$7.4 billion in 2008, compared with US$2.9 billion in 2007. This largely related to fair value gains on own debt issued by HSBC Holdings and its North American and European subsidiaries and resulted primarily from the widening of credit spreads. These gains will reverse over the life of the debt.
• A loss of US$396 million reported in ‘Gains less losses from financial investments’ included impairments related to non-trading strategic equity investments, classified as available for sale, following significant declines in equity market prices. These investments were primarily in Asian financial services companies which are held for the long term.
• In 2007, the results included dilution gains of US$1.1 billion following share offerings made by HSBC’s associates, Ping An Insurance, Bank of Communications and Industrial Bank in mainland China, Financiera Independencia in Mexico and Techcombank in Vietnam.
• Other gains included a US$2.4 billion pre-tax profit from the sale of seven regional banks in France.
• HSBC recognised a gain of US$416 million in respect of the purchase of the subsidiary of Metrovacesa which owned the property and long leasehold land comprising 8 Canada Square, London. See Note 23 on the Financial Statements for further details.
• HSBC continued to increase the scope of activities undertaken at its Group Service Centres (‘GSCs’) which are accounted for within Other. Employee numbers increased accordingly and an additional GSC was opened which, together, contributed to a rise in operating expenses. In North America, costs at the IT Service Centres declined in line with reduced operations in the region. Substantially all service centre costs are recharged to HSBC’s customer groups and reported under ‘Other operating income’.

83
Balance sheet data15 2008 2007 2006 US$m US$m US$m Loans and advances to
customers (net) ............... 2,621 2,678 2,095 Total assets ........................ 135,001 155,685 137,291 Customer accounts ............ 2,041 2,006 1,245
Reconciliation of reported and underlying profit/(loss) before tax
2008 compared with 2007
Other
2007 as reported US$m
2007 acquisitions, disposals & dilution gains1
US$m
Currency translation2
US$m
2007 at 2008 exchange rates3
US$m
2008 acquisitions and disposals1
US$m
Under- lying change US$m
2008 as reported US$m
Re- ported change %
Under- lying change %
Net interest expense ......... (542) – (38) (580) (6) (370) (956) (76) (64)Net fee income/
(expense) ..................... (228) – 49 (179) – 232 53 123 130 Other income4 ................... 7,728 (1,116) 36 6,648 2,540 4,010 13,198 71 60
Net operating income5 .... 6,958 (1,116) 47 5,889 2,534 3,872 12,295 77 66
Loan impairment charges and other credit risk provisions .................... (11) 24 1 14 – (19) (5) 55 (136)
Net operating income .... 6,947 (1,092) 48 5,903 2,534 3,853 12,290 77 65
Operating expenses .......... (3,562) – (15) (3,577) 6 (603) (4,174) (17) (17)
Operating profit ............. 3,385 (1,092) 33 2,326 2,540 3,250 8,116 140 140
Income from associates ... 150 (12) 11 149 – (108) 41 (73) (72)
Profit before tax ............. 3,535 (1,104) 44 2,475 2,540 3,142 8,157 131 127 2007 compared with 2006
Other
2006 as reported US$m
2006 acquisitions and disposals1
US$m
Currency translation2
US$m
2006 at 2007 exchange rates6
US$m
2007 acquisitions, disposals & dilution gains1
US$m
Under- lying change US$m
2007 as reported US$m
Re- ported change %
Under- lying change %
Net interest income .......... (625) – (22) (647) – 105 (542) 13 16 Net fee income ................. 172 – 25 197 – (425) (228) (233) (216)Other income4 ................... 3,263 – 77 3,340 1,092 3,296 7,728 137 99
Net operating income5 ...... 2,810 – 80 2,890 1,092 2,976 6,958 148 103
Loan impairment charges and other credit risk provisions .................... (13) – 3 (10) – (1) (11) 15 (10)
Net operating income ...... 2,797 – 83 2,880 1,092 2,975 6,947 148 103
Operating expenses .......... (3,259) – (90) (3,349) – (213) (3,562) (9) (6)
Operating profit/(loss) ..... (462) – (7) (469) 1,092 2,762 3,385 833 589
Income from associates ... 74 – 2 76 (50) 124 150 103 163
Profit/(loss) before tax ..... (388) – (5) (393) 1,042 2,886 3,535 1,011 734
For footnotes, see page 143.

H S B C H O L D I N G S P L C
Report of the Directors: Operating and Financial Review (continued)
Customer groups > Profit/(loss) before tax
84
Analysis by customer group and global business
Profit/(loss) before tax
2008
Total
Personal Financial Services US$m
Commercial Banking US$m
Global Banking & Markets US$m
Private Banking US$m
Other14
US$m
Inter- segment elimination21
US$m Total US$m
Net interest income/(expense) .... 29,419 9,494 8,541 1,612 (956) (5,547) 42,563 Net fee income ............................ 10,107 4,097 4,291 1,476 53 – 20,024
Trading income/(expense) excluding net interest income 175 369 157 408 (262) – 847
Net interest income/(expense) on trading activities ................ 79 17 324 14 (268) 5,547 5,713
Net trading income/(expense)16 .. 254 386 481 422 (530) 5,547 6,560
Changes in fair value of long- term debt issued and related derivatives .............................. – – – – 6,679 – 6,679
Net income/(expense) from other financial instruments designated at fair value ........... (2,912) (224) (438) – 747 – (2,827)
Net income/(expense) from financial instruments designated at fair value ........... (2,912) (224) (438) – 7,426 – 3,852
Gains less losses from financial investments .............. 663 193 (327) 64 (396) – 197
Dividend income ......................... 90 88 76 8 10 – 272 Net earned insurance premiums . 10,083 679 105 – (17) – 10,850 Gains on disposal of French
regional banks ........................ – – – – 2,445 – 2,445 Other operating income .............. 259 939 868 49 4,261 (4,568) 1,808 Total operating income ............ 47,963 15,652 13,597 3,631 12,296 (4,568) 88,571
Net insurance claims17 ................ (6,474) (335) (79) – (1) – (6,889)Net operating income5 .............. 41,489 15,317 13,518 3,631 12,295 (4,568) 81,682
Loan impairment charges and other credit risk provisions ..... (21,220) (2,173) (1,471) (68) (5) – (24,937)
Net operating income ............... 20,269 13,144 12,047 3,563 12,290 (4,568) 56,745
Operating expenses (excluding goodwill impairment) ............. (21,140) (6,581) (9,092) (2,116) (4,174) 4,568 (38,535)
Goodwill impairment .................. (10,564) – – – – – (10,564)Operating profit/(loss) .............. (11,435) 6,563 2,955 1,447 8,116 – 7,646
Share of profit in associates and joint ventures ................... 461 631 528 – 41 – 1,661
Profit/(loss) before tax .............. (10,974) 7,194 3,483 1,447 8,157 – 9,307
% % % % % % Share of HSBC’s profit
before tax ................................ (117.9) 77.3 37.4 15.6 87.6 100.0 Cost efficiency ratio ................... 76.4 43.0 67.3 58.3 33.9 60.1 Balance sheet data15 US$m US$m US$m US$m US$m US$m Loans and advances to
customers (net) ....................... 401,402 203,949 287,306 37,590 2,621 932,868 Total assets ................................. 514,419 249,218 1,896,630 133,216 135,001 (401,019) 2,527,465 Customer accounts ...................... 440,338 235,879 320,386 116,683 2,041 1,115,327
For footnotes, see page 143.

85
Analysis by customer group and global business (continued)
Profit/(loss) before tax
2007
Total
Personal Financial Services US$m
Commercial Banking US$m
Global Banking & Markets US$m
Private Banking US$m
Other14
US$m
Inter- segment elimination21
US$m Total US$m
Net interest income/(expense) .... 29,069 9,055 4,430 1,216 (542) (5,433) 37,795
Net fee income/(expense) ........... 11,742 3,972 4,901 1,615 (228) – 22,002
Trading income excluding net interest income ....................... 38 265 3,503 525 127 – 4,458
Net interest income/(expense) on trading activities ................ 140 31 (236) 9 (1) 5,433 5,376
Net trading income16 ................... 178 296 3,267 534 126 5,433 9,834
Changes in fair value of long- term debt issued and related derivatives .............................. – – – – 2,812 – 2,812
Net income/(expense) from other financial instruments designated at fair value ........... 1,333 22 (164) (1) 81 – 1,271
Net income/(expense) from financial instruments designated at fair value ........... 1,333 22 (164) (1) 2,893 – 4,083
Gains less losses from financial investments .............. 351 90 1,313 119 83 – 1,956
Gains arising from dilution of interests in associates ............. – – – – 1,092 – 1,092
Dividend income ......................... 55 8 222 7 32 – 324 Net earned insurance premiums . 8,271 733 93 – (21) – 9,076 Other operating income .............. 387 165 1,218 58 3,523 (3,912) 1,439
Total operating income ............ 51,386 14,341 15,280 3,548 6,958 (3,912) 87,601
Net insurance claims17 ................ (8,147) (391) (70) – – – (8,608)
Net operating income5 .............. 43,239 13,950 15,210 3,548 6,958 (3,912) 78,993
Loan impairment charges and other credit risk provisions ..... (16,172) (1,007) (38) (14) (11) – (17,242)
Net operating income ............... 27,067 12,943 15,172 3,534 6,947 (3,912) 61,751
Total operating expenses ............ (21,757) (6,252) (9,358) (2,025) (3,562) 3,912 (39,042)
Operating profit ........................ 5,310 6,691 5,814 1,509 3,385 – 22,709
Share of profit in associates and joint ventures ................... 590 454 307 2 150 – 1,503
Profit before tax ........................ 5,900 7,145 6,121 1,511 3,535 – 24,212
% % % % % % Share of HSBC’s profit
before tax................................. 24.4 29.5 25.3 6.2 14.6 100.0 Cost efficiency ratio ................... 50.3 44.8 61.5 57.1 51.2 49.4 Balance sheet data15 US$m US$m US$m US$m US$m US$m Loans and advances to
customers (net) ....................... 464,726 220,068 250,464 43,612 2,678 981,548 Total assets ................................. 621,356 307,944 1,561,468 130,893 155,685 (423,080) 2,354,266 Customer accounts ...................... 450,071 237,987 299,879 106,197 2,006 1,096,140
For footnotes, see page 143.

H S B C H O L D I N G S P L C
Report of the Directors: Operating and Financial Review (continued)
Customer groups > Profit/(loss) before tax // Geographical regions > Summary
86
Profit/(loss) before tax
2006
Total
Personal Financial Services US$m
Commercial Banking US$m
Global Banking & Markets US$m
Private Banking US$m
Other14
US$m
Inter- segment elimination21
US$m Total US$m
Net interest income/(expense) .... 26,076 7,514 3,168 1,011 (625) (2,658) 34,486
Net fee income ............................ 8,762 3,207 3,718 1,323 172 – 17,182
Trading income/(expense) excluding net interest income 391 204 4,890 362 (228) – 5,619
Net interest income/ (expense) on trading activities ................ 220 20 (379) 2 82 2,658 2,603
Net trading income/(expense)16 .. 611 224 4,511 364 (146) 2,658 8,222
Changes in fair value of long- term debt issued and related derivatives .............................. – – – – (35) – (35)
Net income/(expense) from other financial instruments designated at fair value ........... 739 (22) 20 1 (46) – 692
Net income/(expense) from financial instruments designated at fair value ........... 739 (22) 20 1 (81) – 657
Gains less losses from financial investments .............. 78 44 534 166 147 – 969
Dividend income ......................... 31 6 235 5 63 – 340 Net earned insurance premiums . 5,130 258 73 – 207 – 5,668 Other operating income .............. 782 250 1,378 61 3,254 (3,179) 2,546
Total operating income ............... 42,209 11,481 13,637 2,931 2,991 (3,179) 70,070
Net insurance claims17 ................ (4,365) (96) (62) – (181) – (4,704)
Net operating income5 ................ 37,844 11,385 13,575 2,931 2,810 (3,179) 65,366
Loan impairment (charges)/ recoveries and other credit risk provisions ........................ (9,949) (697) 119 (33) (13) – (10,573)
Net operating income ................. 27,895 10,688 13,694 2,898 2,797 (3,179) 54,793
Total operating expenses ............ (18,818) (4,979) (7,991) (1,685) (3,259) 3,179 (33,553)
Operating profit/(loss) ................ 9,077 5,709 5,703 1,213 (462) – 21,240
Share of profit in associates and joint ventures ................... 380 288 103 1 74 – 846
Profit/(loss) before tax ................ 9,457 5,997 5,806 1,214 (388) – 22,086
% % % % % % Share of HSBC’s profit
before tax ................................ 42.8 27.2 26.3 5.5 (1.8) 100.0 Cost efficiency ratio ................... 49.7 43.7 58.9 57.5 116.0 51.3 Balance sheet data15 US$m US$m US$m US$m US$m US$m Loans and advances to
customers (net) ....................... 448,545 172,976 210,220 34,297 2,095 868,133 Total assets ................................. 602,342 228,668 1,059,746 106,178 137,291 (273,467) 1,860,758 Customer accounts ...................... 388,468 190,853 235,965 80,303 1,245 896,834
For footnotes, see page 143.

87
Geographical regions
PageSummary ....................................................... 87Europe ........................................................... 89Hong Kong .................................................... 99Rest of Asia-Pacific ....................................... 107North America ............................................... 119Latin America ................................................ 129
Additional information on results in 2008 may be found in the ‘Financial Summary’ on pages 23 to 38.
Summary
Europe
HSBC’s principal banking operations in Europe are HSBC Bank plc (‘HSBC Bank’) in the UK, HSBC France, HSBC Bank A.S. in Turkey, HSBC Bank Malta p.l.c., HSBC Private Bank (Suisse) S.A., HSBC Trinkaus & Burkhardt AG and HSBC Guyerzeller Bank AG. Through these operations HSBC provides a wide range of banking, treasury and financial services to personal, commercial and corporate customers across Europe.
Hong Kong
HSBC’s principal banking subsidiaries in Hong Kong are The Hongkong and Shanghai Banking Corporation Limited (‘The Hongkong and Shanghai Banking Corporation’) and Hang Seng Bank Limited (‘Hang Seng Bank’). The former is the largest bank incorporated in Hong Kong and is HSBC’s flagship bank in the Asia-Pacific region. It is one of Hong Kong’s three note-issuing banks, accounting for more than 65 per cent by value of banknotes in circulation in 2007.
Rest of Asia-Pacific (including the Middle East)
HSBC offers personal, commercial, global banking and markets services in mainland China, mainly through its local subsidiary, HSBC Bank (China) Company Limited (‘HSBC Bank China’). HSBC also participates indirectly in mainland China through its three associates, Bank of Communications (19.01 per cent owned), Ping An Insurance (16.78 per cent) and Industrial Bank (12.78 per cent), and has a further interest of 8 per cent in Bank of Shanghai.
Outside Hong Kong and mainland China, HSBC conducts business in 20 countries in the Asia-Pacific region, primarily through branches and subsidiaries of The Hongkong and Shanghai Banking Corporation, with particularly strong coverage in India, Indonesia, South Korea, Singapore and Taiwan. HSBC’s presence in the Middle East is led by HSBC Bank Middle East Limited (‘HSBC Bank Middle East’), whose network of branches, together with HSBC’s subsidiaries and associates, gives it the widest coverage in the region; in Australia by HSBC Bank Australia Limited; and in Malaysia by HSBC Bank Malaysia Berhad (‘HSBC Bank Malaysia’), which is the largest foreign-owned bank in the country by operating income and pre-tax profits. HSBC’s associate in Saudi Arabia, The Saudi British Bank (40 per cent owned), is the Kingdom’s fifth largest bank by total assets.
North America
HSBC’s North American businesses are located in the US, Canada and Bermuda. Operations in the US are primarily conducted through HSBC Bank USA, N.A. (‘HSBC Bank USA’) which is concentrated in New York State, and HSBC Finance, a national consumer finance company based in the Chicago metropolitan area. HSBC Markets (USA) Inc. is the intermediate holding company of, inter alia, HSBC Securities (USA) Inc., a registered broker and dealer of securities and a registered futures commission merchant. HSBC Bank Canada and The Bank of Bermuda Limited (‘Bank of Bermuda’) operate in their respective countries.
Latin America
HSBC’s operations in Latin America principally comprise HSBC México, S.A. (‘HSBC Mexico’), HSBC Bank Brasil S.A.-Banco Múltiplo (‘HSBC Bank Brazil’), HSBC Bank Argentina S.A. (‘HSBC Bank Argentina’) and HSBC Bank (Panama) S.A. (‘HSBC Bank Panama’), which owns subsidiaries in Costa Rica, Honduras, Colombia, Nicaragua and El Salvador. HSBC is also represented by subsidiaries in Chile, the Bahamas, Peru, Paraguay and Uruguay and by a representative office in Venezuela. In addition to banking services, HSBC operates insurance businesses in Mexico, Argentina, Brazil, Panama, Honduras and El Salvador. In Brazil, HSBC offers consumer finance products through its subsidiary, Losango.

H S B C H O L D I N G S P L C
Report of the Directors: Operating and Financial Review (continued)
Geographical regions > Summary / Europe
88
In the analysis of profit by geographical regions that follows, operating income and operating expenses
include intra-HSBC items of US$2,492 million (2007: US$1,985 million; 2006: US$1,494 million).
Profit/(loss) before tax
2008 2007 2006 US$m % US$m % US$m %
Europe ...................................................... 10,869 116.7 8,595 35.5 6,974 31.5 Hong Kong .............................................. 5,461 58.7 7,339 30.3 5,182 23.5 Rest of Asia-Pacific ................................. 6,468 69.5 6,009 24.8 3,527 16.0 North America ......................................... (15,528) (166.8) 91 0.4 4,668 21.1 Latin America .......................................... 2,037 21.9 2,178 9.0 1,735 7.9
9,307 100.0 24,212 100.0 22,086 100.0
Total assets15
At 31 December 2008 2007 US$m % US$m %
Europe ........................................................................................................... 1,343,011 53.1 1,236,633 52.5 Hong Kong ................................................................................................... 407,151 16.1 356,894 15.2 Rest of Asia-Pacific ...................................................................................... 262,305 10.4 243,205 10.3 North America .............................................................................................. 552,612 21.9 549,285 23.3 Latin America ............................................................................................... 97,944 3.9 101,088 4.3 Intra-HSBC items ......................................................................................... (135,558) (5.4) (132,839) (5.6)
2,527,465 100.0 2,354,266 100.0
For footnote, see page 143.

89
Europe
Profit/(loss) before tax by country within customer groups and global businesses
Personal Financial Services US$m
Commercial Banking US$m
Global Banking & Markets21
US$m
Private Banking US$m
Other US$m
Total US$m
2008 United Kingdom ............................................... 1,546 2,361 (469) 250 2,997 6,685 France22 ............................................................. 139 176 273 10 2,242 2,840 Germany ........................................................... – 31 184 32 (22) 225 Malta ................................................................. 59 67 16 – – 142 Switzerland ....................................................... – – – 553 – 553 Turkey ............................................................... 3 91 130 – – 224 Other ................................................................. (89) (4) 61 153 79 200
1,658 2,722 195 998 5,296 10,869
2007 United Kingdom ............................................... 1,221 2,064 1,214 317 976 5,792 France22 ............................................................. 173 192 692 25 (49) 1,033 Germany ........................................................... – 36 195 45 19 295 Malta ................................................................. 45 67 45 – – 157 Switzerland ....................................................... – – – 475 – 475 Turkey ............................................................... 144 75 118 (1) – 336 Other ................................................................. (2) 82 263 54 110 507
1,581 2,516 2,527 915 1,056 8,595
2006 United Kingdom ............................................... 1,496 1,801 1,299 380 (185) 4,791 France22 ............................................................. 174 236 545 22 (107) 870 Germany ........................................................... – 29 114 41 16 200 Malta ................................................................. 42 50 29 – – 121 Switzerland ....................................................... – – – 305 – 305 Turkey ............................................................... 121 50 64 – (18) 217 Other ................................................................. 76 68 253 57 16 470
1,909 2,234 2,304 805 (278) 6,974
Loans and advances to customers (net) by country At 31 December 2008
US$m 2007
US$m 2006
US$m
United Kingdom .............................................................................................. 313,065 326,927 305,758 France22 ............................................................................................................ 70,896 81,473 55,491 Germany .......................................................................................................... 5,756 6,411 4,439 Malta ................................................................................................................ 4,343 4,157 3,456 Switzerland ...................................................................................................... 12,708 13,789 9,151 Turkey .............................................................................................................. 6,125 7,974 5,233 Other ................................................................................................................ 13,298 11,544 8,971
426,191 452,275 392,499
Customer accounts by country At 31 December 2008
US$m 2007
US$m 2006
US$m
United Kingdom .............................................................................................. 351,253 367,363 318,614 France22 ............................................................................................................ 74,826 64,905 43,372 Germany .......................................................................................................... 11,611 10,282 11,607 Malta ................................................................................................................ 5,604 5,947 4,529 Switzerland ...................................................................................................... 44,643 41,015 30,062 Turkey .............................................................................................................. 5,845 6,473 4,140 Other ................................................................................................................ 8,694 8,969 7,041
502,476 504,954 419,365
For footnotes, see page 143.

H S B C H O L D I N G S P L C
Report of the Directors: Operating and Financial Review (continued)
Geographical regions > Europe > 2008
90
Profit before tax
2008 2007 2006 Europe US$m US$m US$m
Net interest income .......................................................................................... 9,696 7,746 8,289
Net fee income ................................................................................................. 7,492 8,431 7,108
Net trading income .......................................................................................... 5,357 6,943 4,529
Changes in fair value of long-term debt issued and related derivatives ......... 2,939 1,059 28Net income/(expense) from other financial instruments designated
at fair value ................................................................................................. (1,826) 167 116Net income from financial instruments designated at fair value .................... 1,113 1,226 144
Gains less losses from financial investments .................................................. 418 1,326 624 Dividend income .............................................................................................. 130 171 183 Net earned insurance premiums ...................................................................... 5,299 4,010 1,298 Gains on disposal of French regional banks ................................................... 2,445 – – Other operating income ................................................................................... 2,096 1,193 1,428
Total operating income ................................................................................. 34,046 31,046 23,603
Net insurance claims incurred and movement in liabilities to policyholders .......................................................................................... (3,367) (3,479) (531)
Net operating income before loan impairment charges and other credit risk provisions ................................................................................ 30,679 27,567 23,072
Loan impairment charges and other credit risk provisions ............................. (3,754) (2,542) (2,155)
Net operating income .................................................................................... 26,925 25,025 20,917
Total operating expenses ................................................................................. (16,072) (16,525) (13,871)
Operating profit ............................................................................................. 10,853 8,500 7,046
Share of profit/(loss) in associates and joint ventures .................................... 16 95 (72)
Profit before tax ............................................................................................. 10,869 8,595 6,974 % % %
Share of HSBC’s profit before tax .................................................................. 116.7 35.5 31.5 Cost efficiency ratio ........................................................................................ 52.4 59.9 60.1 Year-end staff numbers (full-time equivalent) ................................................ 82,093 82,166 78,311 Balance sheet data15 At 31 December 2008 2007 2006 US$m US$m US$m
Loans and advances to customers (net) ........................................................... 426,191 452,275 392,499 Loans and advances to banks (net) .................................................................. 61,949 104,527 76,830 Trading assets, financial assets designated at fair value and
financial investments20 ............................................................................... 433,885
445,258 242,010 Total assets ...................................................................................................... 1,343,011 1,236,633 867,032 Deposits by banks ............................................................................................ 80,847 87,491 67,821 Customer accounts ........................................................................................... 502,476 504,954 419,365
For footnotes, see page 143. All commentaries on Europe are on an underlying basis unless stated otherwise.
2008 compared with 2007
Economic briefing
In the UK, growth in gross domestic product (‘GDP’) decelerated markedly in 2008 to 0.7 per cent from 3.0 per cent in 2007, with a technical recession of two successive quarterly contractions in GDP confirmed during the second half of the year. Weakness proved widespread across most of the
economy, prompting a sharp deterioration in labour market conditions as unemployment hit a 9-year high of 6.1 per cent in November 2008. Consumer Price Index (‘CPI’) inflation reached a decade-long high of 5.2 per cent in September 2008 before falling back to 3.1 per cent by the year-end, still some way above the Bank of England’s 2 per cent target. House prices continued to fall throughout the year and housing activity decreased sharply. The Bank of

91
England reduced interest rates by 350 basis points during 2008, to finish the year at 2 per cent, as policymakers sought to mitigate the worst effects of the economic slowdown.
The expansion of the eurozone economy slowed sharply in 2008, with GDP growth of 0.7 per cent following a 2.6 per cent expansion in 2007. As in the UK, conditions deteriorated markedly as the year progressed and three successive quarterly declines in GDP were recorded during 2008, confirming that the economy had entered a period
of recession. Consumer spending growth proved subdued following the sharp rise in oil prices during the first of half of 2008 and a progressive increase in the unemployment rate towards the year-end. Inflation remained a concern for much of 2008, hitting a peak of 4.0 per cent in July before falling rapidly to 1.6 per cent in December. The European Central Bank, having initially raised interest rates by 25 basis points in July, cut them by 175 basis points to finish the year at 2.5 per cent.
Reconciliation of reported and underlying profit before tax
2008 compared with 2007
Europe
2007 as reported US$m
2007 acquisitions, disposals & dilution gains1
US$m
Currency translation2
US$m
2007 at 2008 exchange rates3
US$m
2008 acquisitions and disposals1
US$m
Under- lying change US$m
2008 as reported US$m
Re- ported change %
Under- lying change %
Net interest income .......... 7,746 (390) (224) 7,132 219 2,345 9,696 25 33 Net fee income ................. 8,431 (134) (244) 8,053 15 (576) 7,492 (11) (7)Other income4 .................. 11,390 (121) (380) 10,889 3,007 (405) 13,491 18 (4)
Net operating income5 ... 27,567 (645) (848) 26,074 3,241 1,364 30,679 11 5
Loan impairment charges and other credit risk provisions .................... (2,542) 30 152 (2,360) (6) (1,388) (3,754) (48) (59)
Net operating income .... 25,025 (615) (696) 23,714 3,235 (24) 26,925 8 –
Operating expenses .......... (16,525) 416 531 (15,578) (88) (406) (16,072) 3 (3)
Operating profit ............. 8,500 (199) (165) 8,136 3,147 (430) 10,853 28 (5)
Income from associates ... 95 (12) 14 97 – (81) 16 (83) (84)
Profit before tax ............. 8,595 (211) (151) 8,233 3,147 (511) 10,869 26 (6)
For footnotes, see page 143.
Review of business performance
HSBC’s European operations reported a pre-tax profit of US$10.9 billion, compared with US$8.6 billion in 2007, an increase of 26 per cent.
These results included gains of US$2.4 billion on the disposal of seven regional banks in France in July 2008, and of US$425 million on the sale of the card acquiring business in the UK to a joint venture with Global Payments, Inc. in June 2008. Excluding these disposals and, in 2007, the acquisition of HSBC Assurances and the disposal of Hamilton Insurance Company Limited and Hamilton Life Assurance Company Limited and substantial fair value gains on own debt, underlying pre-tax profits fell by 33 per cent. This primarily reflected a sharp decline in Global Banking and Markets’ revenues, which was mainly attributable to the deterioration in credit markets, the continuing illiquidity in asset-backed securities markets which led to further
write-downs, and a US$854 million charge within the equities business following the alleged fraud at Madoff Securities. Personal Financial Services and Private Banking delivered underlying growth.
Net interest income increased by 33 per cent. There was significant growth in Balance Sheet Management revenues, which reflected favourable interest rate risk positioning in expectation of interest rate cuts by central banks. Net interest income also benefited from necessarily selective incremental lending as credit availability generally contracted. In Global Banking, net interest income was boosted by improved spreads.
Falling confidence in the UK banking sector necessitated government intervention in a number of competitor banks. HSBC experienced a strong increase in customer numbers, with corresponding growth in liability balances as the market turmoil intensified. The volume benefit was partially offset
H S B C H O L D I N G S P L C
Report of the Directors: Operating and Financial Review (continued)
Geographical regions > Europe > 2008 / 2007
92
by narrowing deposit spreads, as base rates were cut in the UK, and increased funding costs, principally for trading activities, in France. Higher net interest income from the expansion of credit card lending and commercial loan portfolio growth in the small and mid-market customer segments in Turkey was partially offset by narrower spreads following credit card interest rate cap reductions by the central bank.
Net fee income fell by 7 per cent, with lower fees from mergers and acquisitions and equity capital markets due to origination and execution difficulties, coupled with a rise in brokerage expenses in line with increased trading activity in France. Lower performance and management fees in the UK and France as the value of funds under management reduced, reflected the decline in global equity markets. Increased customer acquisition partly offset this, with higher fees derived from growth in packaged accounts and transaction volumes in France and credit card fees in Turkey.
Trading income was 20 per cent lower than in 2007, falling significantly in Global Banking and Markets due to further write-downs on legacy exposures in credit, structured credit derivatives and leveraged and acquisition finance caused by the ongoing turmoil in the credit markets. In addition, a US$854 million charge was taken in equities in respect of the alleged fraud at Madoff Securities. US$11.4 billion and US$2.4 billion of held-for-trading financial assets were reclassified under revised IFRS rules as loans and receivables and available for sale, respectively, preventing any further mark-to-market trading losses on these assets. If these reclassifications had not been made, the profit before tax would have been US$2.6 billion lower.
Excluding the write-downs on legacy exposures and the charge relating to Madoff Securities, trading income grew by 11 per cent, driven by a significant increase in foreign exchange revenues against the backdrop of greater market volatility, and robust revenues in the Rates business, which was positioned to take advantage of falling interest rates. The widening of credit spreads, particularly in the second half of 2008, contributed to fair value gains on structured liabilities and on credit protection bought in the form of credit default swaps.
Net income from financial instruments designated at fair value increased by 36 per cent, primarily due to fair value gains from the effect of widening credit spreads on certain fixed-rate long-term debt issued by HSBC Holdings. This movement was partly offset by a reduction in the value of assets held to meet liabilities under insurance and
investment contracts. The reduction in fair value of assets held to meet liabilities under unit-linked insurance contracts is offset by a corresponding reduction in ‘Net insurance claims and liabilities to policyholders’. The fair value gains on HSBC’s own debt will fully reverse over the life of the debt.
Gains less losses from financial investments of US$418 million were US$915 million lower than in 2007 as there were fewer disposal opportunities in 2008 and the significant realisations from equity investments in the UK and France in 2007 did not recur. Gains largely reflected the sale of MasterCard shares in 2008.
Net earned insurance premiums increased by 22 per cent, largely due to growth in the Guaranteed Income Bond launched in June 2007 and the introduction of enhanced death benefits to certain pension products in the UK. In France, HSBC Assurances performed well in a declining market, as the launch of new guaranteed rate products contributed to 3 per cent growth in gross earned premiums. However, net earned insurance premiums fell following a significant re-insurance transaction undertaken in the first half of 2008.
Other operating income increased by 33 per cent. This was primarily due to recognition of the gain in respect of the purchase of the subsidiary of Metrovacesa which owned the property and long leasehold land comprising 8 Canada Square, London. See Note 23 on the Financial Statements for further details. The growth in revenue also reflected the non-recurrence of a decrease in the value of PVIF business in 2007 following regulatory changes to the rules governing the calculation of insurance liabilities. In addition, there was a favourable embedded value adjustment following HSBC’s introduction of enhanced benefits to existing commercial pension products in the first half of 2008. These benefits were partially offset by costs associated with the support of money market funds in the global asset management business.
Net insurance claims incurred and movement in liabilities to policyholders decreased by 5 per cent as a reduction in insurance liabilities reflected the fall in value of market-linked funds. This was partially offset by an increase in liabilities following increased sales of the Guaranteed Income Bond and the implementation of FSA rule changes in 2007 which lowered the liability valuation on life policies.
Loan impairment charges and credit risk provisions rose by 59 per cent to US$3.8 billion; in the UK, primarily in Global Banking and Markets. The deteriorating credit environment resulted in a rise in loan impairment charges, largely reflecting an

93
exposure to a single European property company, and additional credit risk provisions on debt securities held within the Group’s available-for-sale portfolio, mainly in Solitaire Funding Limited (‘Solitaire’), a special purpose entity managed by HSBC. A modest improvement in the UK personal finance sector reflected the non-recurrence of a change in the methodology in the consumer finance business which resulted in a higher charge in 2007. Excluding this factor, delinquency rates in cards were marginally higher and there was a rise in impairments in the consumer finance business driven by worsening economic conditions and credit quality deterioration, partly offset by action taken to mitigate risk through the continued application of strict lending criteria and the sale of non-core credit card portfolios.
Credit conditions weakened in the commercial business and specific loan impairment charges increased in the UK and France due to the deteriorating credit environment in the second half of 2008. In Turkey, credit card and personal loan delinquency rates were significantly higher, resulting in the implementation of tighter underwriting criteria, reduced credit limits and revised account management policies throughout 2008.
Operating costs increased by 3 per cent to US$16.1 billion. Costs in the UK were in line with 2007, which included ex-gratia payments expensed in respect of overdraft fees applied in previous years and a provision for reimbursement of certain charges on historic will trusts and other related services. Excluding these items, costs rose as a result of an increase in the Financial Services Compensation Scheme levy, restructuring costs and increased rental charges following the sale and leaseback of branch properties, partially offset by lower performance-related pay and a reduction in defined benefit pension scheme costs due to a change in actuarial assumptions.
Operating costs in France decreased slightly with lower performance-related pay and a reduction in pension and retirement healthcare costs following the transfer of certain obligations to a third-party offsetting the higher costs of a voluntary retirement programme.
There was investment in premises and new staff to support business expansion in Turkey, Russia and central and eastern Europe. In 2008, 112 new branches opened and staff numbers increased by 30 per cent in these markets.
Share of profit in associates and joint ventures declined by 84 per cent to US$16 million with 2007
benefiting from an adjustment to the embedded value of HSBC Assurances. The absence of this gain was partially offset by increased joint venture profits following the sale of the card acquiring business in the UK.
2007 compared with 2006
Economic briefing
In the UK, GDP growth accelerated in 2007 to 3.1 per cent from 2.9 per cent in 2006, mainly as a result of buoyant consumer and investment spending. Net trade depressed GDP growth through 2007, and the current account deficit reached a record 5.7 per cent of GDP in the third quarter of the year. Employment growth was fairly subdued, rising by approximately 0.7 per cent during the year. CPI inflation reached a decade-long high of 3.1 per cent in March but subsequently fell back to 2.1 per cent by the year-end, close to the Bank of England’s 2 per cent target. After a strong start to the year, nominal house prices declined and housing activity diminished in the final months of 2007. The Bank of England raised interest rates by 75 basis points during 2007 to a peak of 5.75 per cent, but subsequently reduced them to 5.5 per cent at the end of 2007.
The expansion of the eurozone economy continued steadily in 2007, with GDP growth of 2.7 per cent. As in the UK, much of the momentum came from strength in business investment and exports as global demand remained strong, particularly from emerging markets. Consumption was relatively subdued, despite declining unemployment, although fiscal reforms (particularly in Germany) are believed to have depressed household expenditure. Eurozone inflation increased steadily during the second half of the year to an annual rate of 3.1 per cent in December, driven largely by rises in food and energy prices. The European Central Bank (‘ECB’) raised interest rates by 50 basis points during 2007, to finish the year at 4 per cent.
Review of business performance
European operations reported a pre-tax profit of US$8.6 billion, compared with US$7.0 billion in 2006, an increase of 23 per cent. On an underlying basis, pre-tax profits improved by 13 per cent.
In March 2007, HSBC acquired its partner’s shares in life, property and casualty insurer, HSBC Assurances. The results of HSBC Assurances are excluded from the commentary below, which is on an underlying basis.

H S B C H O L D I N G S P L C
Report of the Directors: Operating and Financial Review (continued)
Geographical regions > Europe > 2007
94
Reconciliation of reported and underlying profit before tax
2007 compared with 2006
Europe
2006 as reported US$m
2006 acquisitions and disposals1
US$m
Currency translation2
US$m
2006 at 2007 exchange rates6
US$m
2007 acquisitions, disposals & dilution gains1
US$m
Under- lying change US$m
2007 as reported US$m
Re- ported change %
Under- lying change %
Net interest income .......... 8,289 (3) 635 8,921 419 (1,594) 7,746 (7) (18)Net fee income ................. 7,108 53 586 7,747 (133) 817 8,431 19 11 Other income4 .................. 7,675 (53) 576 8,198 (90) 3,282 11,390 48 40
Net operating income5 ..... 23,072 (3) 1,797 24,866 196 2,505 27,567 19 10
Loan impairment charges and other credit risk provisions .................... (2,155) – (147) (2,302) – (240) (2,542) (18) (10)
Net operating income ...... 20,917 (3) 1,650 22,564 196 2,265 25,025 20 10
Operating expenses .......... (13,871) 2 (1,076) (14,945) (51) (1,529) (16,525) (19) (10)
Operating profit ............... 7,046 (1) 574 7,619 145 736 8,500 21 10
Income/(expense) from associates ......................... (72) – (6) (78) (50) 223 95 232 286
Profit before tax ............... 6,974 (1) 568 7,541 95 959 8,595 23 13
For footnotes, see page 143.
In Commercial Banking, growth in deposit and lending balances in the UK and ongoing business expansion in Turkey and Malta led to steady growth in revenues. This was partly offset by increased loan impairment charges and higher costs associated with business expansion. In Global Banking and Markets, higher income from most businesses was offset by trading losses in Credit and Rates and increased costs. Strong profit growth in Private Banking was driven by an increased client appetite for discretionary portfolios, a rise in lending volumes and further improvements in cross-referrals. In Personal Financial Services, a fall in pre-tax profits reflected ex gratia payments expensed in respect of overdraft fees applied in previous years and a provision for reimbursement of certain charges on historic will trusts and other related services. The ‘Other’ segment benefited from a US$1.3 billion fair value gain in HSBC’s own debt.
Net interest income declined by 18 per cent, mainly because the expansion of trading activities in both the UK and France resulted in higher funding costs, with the related revenues reported in the trading income line. This was partly offset by higher net interest income in the personal and commercial businesses.
In the UK, Personal Financial Services’ spreads widened in a rising interest rate environment and competitive pricing attracted higher balances. This was mitigated by lower spreads on mortgages as customers switched to fixed rate products. In
Commercial Banking, higher net interest income was largely driven by growth in the UK, Turkey, Germany and Malta. In the UK, a negotiated rate deposit product launched in previous years continued to be instrumental in driving higher deposit balances. Strong growth in corporate and structured banking for micro customers, together with expansion in lending to small and mid-market customers, contributed to higher lending balances although this benefit was partially constrained by spread compression in the competitive market.
Revenues from transactional balances held within the payments and cash management business increased by 13 per cent, as credit market dislocation in the second half of the year caused customers to hold higher cash balances. After several years of decline, balance sheet management revenues in Europe increased.
In Turkey, higher net interest income was driven by new customer acquisition. In Switzerland, the Private Banking business earned higher net interest income from lending to existing clients as they further leveraged their portfolios.
Net fee income rose by 11 per cent. Account services increased on higher customer balances and volumes of transactions in the UK and France, supported by sales of fee-earning packaged accounts. Card fees increased in the UK, mainly on interchange and acquiring fees, and in Turkey, on interchange and cash advance fees. This was partly offset by a reduction in credit card default fees in the

95
UK following regulatory intervention by the OFT in 2006. Broking income increased in the UK, Germany and Switzerland, mainly driven by growth in client assets and transaction volumes. Funds under management fell on lower income from the Hermitage Fund following the part sale of HSBC’s investment in it.
Trading income rose by 41 per cent, driven by the equities business and foreign exchange trading, where income increased strongly, with volume and profitability reflecting market volatility. The increase was partly offset by write-downs in credit, structured derivatives and leveraged and acquisition finance. Net trading income increased following the strategic decision to expand the collateralised lending and structured derivatives businesses, the funding costs of which are reported in net interest income.
Credit spreads, primarily on certain fixed-rate long-term debt issued by HSBC Holdings and its subsidiaries, widened significantly in the second half of 2007, leading to a sevenfold increase in net income from financial instruments designated at fair value compared with 2006. These cumulative gains will fully reverse over the life of the debt.
The sale of shareholdings and various equity investments in the UK and France, including Euronext (the European stock exchange), contributed to gains from financial investments of US$1.3 billion, an increase of 101 per cent on 2006.
Net earned insurance premiums increased by 50 per cent to US$4.0 billion, including growth of the Guaranteed Income Bond and motor insurance, and the introduction of enhanced death benefits to pension contracts in the UK. Premiums also grew in the UK because of a higher retention of risk in the non-life business compared with 2006, when a greater proportion of risk and corresponding premiums were ceded to reinsurers. There were also significant contributions from the reinsurance business in Ireland and the life assurance business in Malta.
Other operating income declined by 25 per cent. This largely resulted from a fall in the value of in-force business in UK insurance, driven by a change in the calculation methodology of the PVIF business in the first half of 2007 when HSBC implemented regulatory changes to the rules governing the
calculation of insurance liabilities. This had a marginally positive effect on profit as there was a corresponding reduction in policyholder liabilities.
Net insurance claims incurred and movement in liabilities to policyholders grew by 121 per cent to US$3.5 billion. This growth, which paralleled the growth in net earned insurance premiums, included the effect of higher risk retention in the non-life business, although it was offset by FSA rule changes which led to lower claims valuations on life policies. There was also a rise in flood-related claims in the UK after record rainfalls during the summer.
Loan impairment charges rose by 10 per cent to US$2.5 billion. Overall credit quality remained broadly stable. In the UK, loan impairment charges rose, primarily in consumer finance lending outside HSBC Bank; within HSBC Bank, steps taken in 2006 to tighten underwriting standards led to an improvement in loan impairment trends. Corporate loan impairment charges remained low in absolute terms, although they were 23 per cent higher than in 2006, principally reflecting the effect of Individual Voluntary Arrangements on micro businesses and impairments on two large corporate accounts in the UK.
Operating costs increased by 10 per cent to US$16.5 billion, in line with the growth in net operating income before loan impairment charges. In the UK, a change in actuarial assumptions regarding the principal staff defined benefit pension scheme led to increased costs. Ex-gratia payments were expensed in respect of overdraft fees applied in previous years and a provision for reimbursement of certain charges on historic will trusts and other related services was raised which totalled US$396 million. Cost increases also reflected investments in technology, higher payments and cash management transaction volumes, investments in the French structured derivatives business to support revenue growth and, in Turkey, technical infrastructure and additional headcount in support of business expansion.
Share of profit in associates and joint ventures rose by US$167 million, largely as a result of a US$73 million adjustment to the embedded value of HSBC Assurances in France prior to the acquisition of its remaining share capital, following which it was accounted for as a subsidiary.
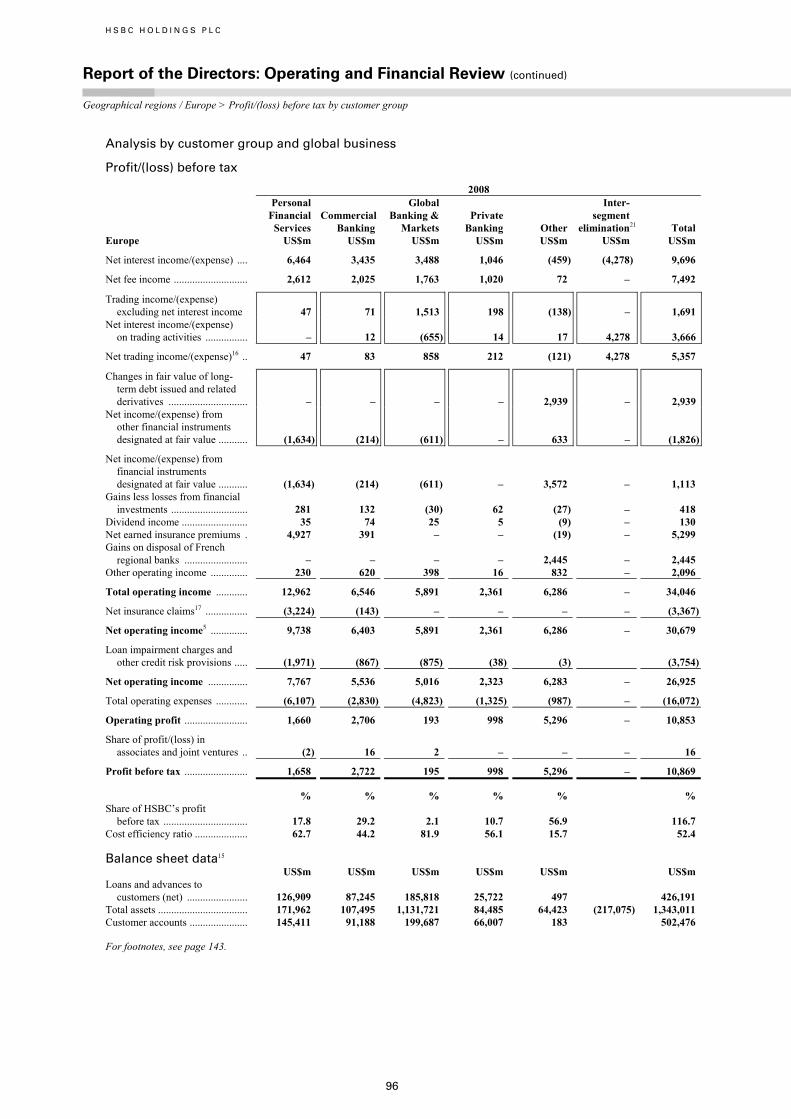
H S B C H O L D I N G S P L C
Report of the Directors: Operating and Financial Review (continued)
Geographical regions / Europe > Profit/(loss) before tax by customer group
96
Analysis by customer group and global business
Profit/(loss) before tax
2008
Europe
Personal Financial Services US$m
Commercial Banking US$m
Global Banking & Markets US$m
Private Banking US$m
Other
US$m
Inter- segment elimination21
US$m Total US$m
Net interest income/(expense) .... 6,464 3,435 3,488 1,046 (459) (4,278) 9,696
Net fee income ............................ 2,612 2,025 1,763 1,020 72 – 7,492
Trading income/(expense) excluding net interest income 47 71 1,513 198 (138) – 1,691
Net interest income/(expense) on trading activities ................ – 12 (655) 14 17 4,278 3,666
Net trading income/(expense)16 .. 47 83 858 212 (121) 4,278 5,357
Changes in fair value of long- term debt issued and related derivatives .............................. – – – – 2,939 – 2,939
Net income/(expense) from other financial instruments designated at fair value ........... (1,634) (214) (611) – 633 – (1,826)
Net income/(expense) from financial instruments designated at fair value ........... (1,634) (214) (611) – 3,572 – 1,113
Gains less losses from financial investments ............................. 281 132 (30) 62 (27) – 418
Dividend income ......................... 35 74 25 5 (9) – 130 Net earned insurance premiums . 4,927 391 – – (19) – 5,299 Gains on disposal of French
regional banks ........................ – – – – 2,445 – 2,445 Other operating income .............. 230 620 398 16 832 – 2,096
Total operating income ............ 12,962 6,546 5,891 2,361 6,286 – 34,046
Net insurance claims17 ................ (3,224) (143) – – – – (3,367)
Net operating income5 .............. 9,738 6,403 5,891 2,361 6,286 – 30,679
Loan impairment charges and other credit risk provisions ..... (1,971) (867) (875) (38) (3) (3,754)
Net operating income ............... 7,767 5,536 5,016 2,323 6,283 – 26,925
Total operating expenses ............ (6,107) (2,830) (4,823) (1,325) (987) – (16,072)
Operating profit ........................ 1,660 2,706 193 998 5,296 – 10,853
Share of profit/(loss) in associates and joint ventures .. (2) 16 2 – – – 16
Profit before tax ........................ 1,658 2,722 195 998 5,296 – 10,869
% % % % % % Share of HSBC’s profit
before tax ................................ 17.8 29.2 2.1 10.7 56.9 116.7 Cost efficiency ratio .................... 62.7 44.2 81.9 56.1 15.7 52.4 Balance sheet data15 US$m US$m US$m US$m US$m US$m Loans and advances to
customers (net) ....................... 126,909 87,245 185,818 25,722 497 426,191 Total assets .................................. 171,962 107,495 1,131,721 84,485 64,423 (217,075) 1,343,011 Customer accounts ...................... 145,411 91,188 199,687 66,007 183 502,476
For footnotes, see page 143.

97
Profit/(loss) before tax
2007
Europe
Personal Financial Services US$m
Commercial Banking US$m
Global Banking & Markets US$m
Private Banking US$m
Other
US$m
Inter- segment elimination21
US$m Total US$m
Net interest income ..................... 6,604 3,419 1,361 793 86 (4,517) 7,746
Net fee income/(expense) ........... 3,060 2,194 2,316 1,032 (171) – 8,431
Trading income excluding net interest income ....................... 60 36 2,657 161 89 – 3,003
Net interest income/(expense) on trading activities ................ (7) 30 (610) 9 1 4,517 3,940
Net trading income16 ................... 53 66 2,047 170 90 4,517 6,943
Changes in fair value of long- term debt issued and related derivatives .................. – – – – 1,059 – 1,059
Net income/(expense) from other financial instruments designated at fair value ........... 126 31 (185) – 195 – 167
Net income/(expense) from financial instruments designated at fair value ........... 126 31 (185) – 1,254 – 1,226
Gains less losses from financial investments ............................. 50 36 1,100 115 25 – 1,326
Dividend income ......................... 1 4 155 7 4 – 171 Net earned insurance premiums . 3,511 521 – – (22) – 4,010 Other operating income/
(expense) ................................ 54 (35) 853 8 301 12 1,193
Total operating income ............... 13,459 6,236 7,647 2,125 1,567 12 31,046
Net insurance claims17 ................ (3,214) (265) – – – – (3,479)
Net operating income5 ................ 10,245 5,971 7,647 2,125 1,567 12 27,567
Loan impairment (charges)/ recoveries and other credit risk provisions ........................ (2,044) (515) 26 (4) (5) – (2,542)
Net operating income ................. 8,201 5,456 7,673 2,121 1,562 12 25,025
Total operating expenses ............ (6,635) (2,941) (5,150) (1,208) (579) (12) (16,525)
Operating profit .......................... 1,566 2,515 2,523 913 983 – 8,500
Share of profit in associates and joint ventures ................... 15 1 4 2 73 – 95
Profit before tax .......................... 1,581 2,516 2,527 915 1,056 – 8,595
% % % % % % Share of HSBC’s profit
before tax ................................ 6.5 10.4 10.4 3.8 4.4 35.5 Cost efficiency ratio .................... 64.8 49.3 67.3 56.8 36.9 59.9 Balance sheet data15 US$m US$m US$m US$m US$m US$m Loans and advances to
customers (net) ....................... 151,687 106,846 163,066 30,195 481 452,275 Total assets .................................. 240,361 168,846 892,712 83,740 96,346 (245,372) 1,236,633 Customer accounts ...................... 178,757 99,704 163,713 62,055 725 504,954
For footnotes, see page 143.

H S B C H O L D I N G S P L C
Report of the Directors: Operating and Financial Review (continued)
Geographical regions / Europe > Profit/(loss) before tax by customer group // Hong Kong
98
Analysis by customer group and global business (continued)
Profit/(loss) before tax
2006
Europe
Personal Financial Services US$m
Commercial Banking US$m
Global Banking & Markets US$m
Private Banking US$m
Other
US$m
Inter- segment elimination21
US$m Total US$m
Net interest income ..................... 5,653 2,923 1,222 675 14 (2,198) 8,289
Net fee income ............................ 2,533 1,707 1,673 869 326 – 7,108
Trading income/(expense) excluding net interest income 119 27 2,636 99 (39) – 2,842
Net interest income/(expense) on trading activities ................ (6) 15 (523) 2 1 2,198 1,687
Net trading income/(expense)16 .. 113 42 2,113 101 (38) 2,198 4,529
Changes in fair value of long- term debt issued and related derivatives .................. – – – – 28 – 28
Net income/(expense) from other financial instruments designated at fair value ........... 80 27 11 – (2) – 116
Net income/(expense) from financial instruments designated at fair value ........... 80 27 11 – 26 – 144
Gains less losses from financial investments ............................. 37 22 413 149 3 – 624
Dividend income ......................... 2 3 171 5 2 – 183 Net earned insurance premiums . 979 110 – – 209 – 1,298 Other operating income .............. 128 103 957 13 256 (29) 1,428
Total operating income ............... 9,525 4,937 6,560 1,812 798 (29) 23,603
Net insurance claims17 ................ (331) (19) – – (181) – (531)
Net operating income5 ................ 9,194 4,918 6,560 1,812 617 (29) 23,072
Loan impairment (charges)/ recoveries and other credit risk provisions ........................ (1,838) (386) 64 2 3 – (2,155)
Net operating income ................. 7,356 4,532 6,624 1,814 620 (29) 20,917
Total operating expenses ............ (5,447) (2,298) (4,224) (1,010) (921) 29 (13,871)
Operating profit/(loss) ................ 1,909 2,234 2,400 804 (301) – 7,046
Share of profit/(loss) in associates and joint ventures .. – – (96) 1 23 – (72)
Profit/(loss) before tax ................ 1,909 2,234 2,304 805 (278) – 6,974
% % % % % % Share of HSBC’s profit
before tax ................................ 8.6 10.1 10.4 3.6 (1.2) 31.5 Cost efficiency ratio .................... 59.2 46.7 64.4 55.7 149.3 60.1 Balance sheet data15 US$m US$m US$m US$m US$m US$m Loans and advances to
customers (net) ....................... 147,507 81,430 140,277 23,283 2 392,499 Total assets .................................. 227,609 111,510 526,468 68,380 85,183 (152,118) 867,032 Customer accounts ...................... 152,411 80,312 139,416 47,223 3 419,365
For footnotes, see page 143.

99
Hong Kong
Profit/(loss) before tax by customer group and global business
2008 US$m
2007 US$m
2006US$m
Personal Financial Services ............................................................................. 3,428 4,212 2,880 Commercial Banking ....................................................................................... 1,315 1,619 1,321 Global Banking and Markets ........................................................................... 1,436 1,578 955 Private Banking ............................................................................................... 237 305 201 Other ................................................................................................................ (955) (375) (175)
5,461 7,339 5,182
Profit before tax
2008US$m
2007 US$m
2006US$m
Net interest income .......................................................................................... 5,698 5,483 4,685
Net fee income ................................................................................................. 2,580 3,362 2,056
Net trading income .......................................................................................... 1,193 1,242 617
Changes in fair value of long-term debt issued and related derivatives ......... 3 2 –Net income/(expense) from other financial instruments designated at fair
value ............................................................................................................ (1,194) 674 260
Net income/(expense) from financial instruments designated at fair value ... (1,191) 676 260 Gains less losses from financial investments .................................................. (309) 94 162 Dividend income .............................................................................................. 41 31 61 Net earned insurance premiums ...................................................................... 3,247 2,797 2,628 Other operating income ................................................................................... 817 845 834
Total operating income ................................................................................. 12,076 14,530 11,303
Net insurance claims incurred and movement in liabilities to policyholders ........................................................................................... (1,922) (3,208) (2,699)
Net operating income before loan impairment charges and other credit risk provisions ................................................................................. 10,154 11,322 8,604
Loan impairment charges and other credit risk provisions ............................. (765) (231) (172)
Net operating income .................................................................................... 9,389 11,091 8,432
Total operating expenses ................................................................................. (3,943) (3,780) (3,269)
Operating profit ............................................................................................. 5,446 7,311 5,163
Share of profit in associates and joint ventures ............................................... 15 28 19
Profit before tax ............................................................................................. 5,461 7,339 5,182 % % %
Share of HSBC’s profit before tax .................................................................. 58.7 30.3 23.5 Cost efficiency ratio ........................................................................................ 38.8 33.4 38.0 Year-end staff numbers (full-time equivalent) ................................................ 29,330 27,655 27,586 Balance sheet data15 At 31 December 2008 2007 2006 US$m US$m US$m
Loans and advances to customers (net) ........................................................... 100,220 89,638 84,282 Loans and advances to banks (net) .................................................................. 29,646 63,737 50,359 Trading assets, financial assets designated at fair value, and
financial investments ................................................................................... 122,602 102,180 103,734 Total assets ...................................................................................................... 407,151 356,894 318,857 Deposits by banks ............................................................................................ 11,769 6,420 4,799 Customer accounts ........................................................................................... 250,517 234,488 196,691
For footnote, see page 143. All commentaries on Hong Kong are on an underlying basis unless stated otherwise.

H S B C H O L D I N G S P L C
Report of the Directors: Operating and Financial Review (continued)
Geographical regions / Hong Kong > 2008 / 2007
100
2008 compared with 2007
Economic briefing
Hong Kong’s GDP growth slowed to 2.5 per cent in 2008 from 6.4 per cent in 2007. After performing strongly during the early months of the year, the economy slowed sharply and a technical recession was confirmed with the release of the third quarter GDP statistics. External demand proved especially weak during the second half of 2008 and the growth in private consumption also slowed sharply. The unemployment rate rose from a ten-year low of
3.2 per cent in August 2008 to 4.1 per cent by the year-end. Consumer price inflation proved volatile during the year, rising to a ten-year high of 6.3 per cent in July before slowing to 2.1 per cent by December 2008, although this movement largely reflected the trends in food and energy prices. In response to interest rate cuts in the US, Hong Kong cut its base interest rate on seven occasions during 2008, finishing the year at 0.5 per cent compared with 5.75 per cent at the end of 2007. The Hang Seng Index fell by 48 per cent during 2008.
Reconciliation of reported and underlying profit before tax
2008 compared with 2007
Hong Kong
2007 as reported US$m
2007 acquisitions, disposals & dilution gains1
US$m
Currency translation2
US$m
2007 at 2008 exchange rates3
US$m
2008 acquisitions and disposals1
US$m
Under- lying change US$m
2008 as reported US$m
Re- ported change %
Under- lying change %
Net interest income .......... 5,483 – 15 5,498 – 200 5,698 4 4 Net fee income ................. 3,362 – 9 3,371 – (791) 2,580 (23) (23)Other income4 ................... 2,477 (1) 3 2,479 – (603) 1,876 (24) (24)
Net operating income5 .... 11,322 (1) 27 11,348 – (1,194) 10,154 (10) (11)
Loan impairment charges and other credit risk provisions .................... (231) 1 (1) (231) – (534) (765) (231) (231)
Net operating income .... 11,091 – 26 11,117 – (1,728) 9,389 (15) (16)
Operating expenses .......... (3,780) – (9) (3,789) – (154) (3,943) (4) (4)
Operating profit ............. 7,311 – 17 7,328 – (1,882) 5,446 (26) (26)
Income from associates ... 28 – – 28 – (13) 15 (46) (46)
Profit before tax ............. 7,339 – 17 7,356 – (1,895) 5,461 (26) (26)
For footnotes, see page 143.
Review of business performance
Hong Kong reported pre-tax profits of US$5.5 billion, a 26 per cent decline compared with record profits of US$7.3 billion in 2007. Lower revenues largely reflected a decline in wealth management and insurance income as economic conditions deteriorated. Revenue decline was compounded by impairment charges recognised on certain investments, which arose as a consequence of significant falls in equity market prices. Offsetting this, in part, was considerably stronger balance sheet management income from treasury positions which correctly anticipated the decline in interest rates.
Net interest income rose by 4 per cent, driven by the strong Balance Sheet Management performance in Global Banking and Markets mainly driven by liquidity generated by retail banking in the environment of falling short-term interest rates.
Savings and deposit balances grew strongly, particularly in Personal Financial Services, as customers revealed a preference for security and liquidity following declines in equity markets. Deposit growth was augmented by the launch of campaigns offering both preferential time deposit rates and an enhanced HSBC online platform. The significant decline in interest rates during 2008 led to a narrowing of deposit spreads.
Customer lending volumes were 11 per cent higher, due in part to an 11 per cent rise in mortgage balances. Lending margins narrowed, however, due to interest rate cuts, particularly affecting mortgage lending and other loans linked to HIBOR. Balances outstanding on credit cards rose, driven by increased cardholder spending, and spreads on this business increased due to lower funding costs. Nearly one million new cards were issued in the year, bringing the total cards in circulation to 5.3 million. Volumes

101
of trade finance grew strongly, driven by demand from corporates with international trade requirements, and commercial lending balances rose, particularly during the first half of the year.
Fee income declined by 23 per cent, driven by lower equity market-related revenues. Weak market sentiment led to lower volumes of retail brokerage and a decrease in income from wealth management activity. This was partly offset by a rise in fees from cards following increases in both cards in circulation and cardholder spending. Fees from account services rose due to greater customer activity and there were higher fees generated from bundled products.
Trading income was 4 per cent lower, driven by further write-downs of US$0.2 billion in Global Banking and Markets on a legacy monoline exposure. Excluding these write-downs, trading income grew due to a rise in foreign exchange and rates income as continuing market volatility generated increased trading opportunities and demand for active hedging products.
The net loss of US$1.2 billion on financial instruments designated at fair value compared with income of US$676 million in 2007. The loss reflected a decline in the value of assets linked to the insurance business. To a large extent, these losses are attributable to policyholders, with an equivalent reduction in net insurance claims and movement in liabilities to policyholders. While the decline in the value of assets which relate to unit-linked products is allocated to policyholders in full, the portion of decline in the value passed on to clients who have products with discretionary participation features and guarantees may be restricted.
Losses from financial investments of US$309 million reflected impairments required on investments which have experienced significant falls in equity market prices. These equity investments are classified as available for sale, are not held for trading, and remain part of the strategic positioning of HSBC’s businesses in Asia. These losses were partly offset by an aggregate gain of US$203 million from the redemption of shares in the Visa initial public offering (‘IPO’) and the disposal of MasterCard shares.
Net earned insurance premiums increased by 16 per cent to US$3.2 billion, largely due to growth in the life insurance business, in particular for policies with discretionary participation features.
Net insurance claims and movement in liabilities to policyholders fell by 40 per cent, reflecting the decline in asset values noted above
partly offset by increases due to growth in premiums.
Loan impairment charges and other credit risk provisions rose markedly from the previously low level to US$765 million as economic conditions deteriorated. Within these charges were exposures to financial institutions held within Global Banking and Markets, which resulted in other credit risk provisions. In Commercial Banking, the combination of an absence of significant recoveries recorded in 2007 and weakness among certain exporters in Hong Kong, who were affected by reduced demand from the US and other developed countries, raised loan impairment charges. As local businesses responded to the economic environment, unemployment rose in the second half of 2008. Credit policies were consequently adjusted across certain products as delinquency and bankruptcy increased in Hong Kong. Although property market declines reduced equity levels for residential mortgage customers, the impact on loan impairment charges was limited as this lending was well-secured and regulatory restrictions constrained origination loan-to-value ratios to below 70 per cent.
Operating expenses rose by 4 per cent. Staff costs declined by 3 per cent despite wage increases and a rise in the number of customer-facing staff, largely due to lower performance-related costs in Global Banking and Markets. Staff numbers were higher than in 2007 notwithstanding reductions within the branch network for lower business volumes in the latter part of 2008. IT costs rose as investment in systems continued. Marketing costs were lower following active management of costs while property rental costs increased due to higher market rental rates. Overall, cost growth was curtailed in response to the more difficult economic climate.
2007 compared with 2006
Economic briefing
Hong Kong’s economy remained robust during 2007, with the annual rate of growth of 6.3 per cent. Domestic consumption was the major contributor to economic expansion, supported by the strong labour market. The unemployment rate fell to 3.4 per cent, a nine year low, as the supply of labour remained very tight. Global increases in food and oil prices affected Hong Kong, but the territory also experienced wage inflation, rising import prices and growth in property rental costs. Inflation increased as a result, exceeding 3 per cent in the final quarter of the year.
In response to interest rate cuts in the US and capital inflows into the local market, Hong Kong’s

H S B C H O L D I N G S P L C
Report of the Directors: Operating and Financial Review (continued)
Geographical regions / Hong Kong > 2007
102
main interest rate was cut on three separate occasions during the final months of 2007, with the prime rate ending the year at 6.75 per cent, down by one per cent from its high for the year. Local asset markets benefited accordingly. The previously very strong levels of export growth slowed in the second half of 2007, as demand from the US moderated and
the reduction in mainland China’s export tax rebate in July temporarily affected Hong Kong’s re-exports. Despite relatively modest trade growth, external demand for Hong Kong’s services remained strong due to the buoyant tourism sector and increasing cross-border business activities, especially within the financial sector.
Reconciliation of reported and underlying profit before tax
2007 compared with 2006
Hong Kong
2006 as reported US$m
2006 acquisitions and disposals1
US$m
Currency translation2
US$m
2006 at 2007 exchange rates6
US$m
2007 acquisitions, disposals & dilution gains1
US$m
Under- lying change US$m
2007 as reported US$m
Re- ported change %
Under- lying change %
Net interest income .......... 4,685 – (15) 4,670 – 813 5,483 17 17 Net fee income ................. 2,056 – (6) 2,050 – 1,312 3,362 64 64 Other income4 .................. 1,863 – (6) 1,857 – 620 2,477 33 33
Net operating income5 ..... 8,604 – (27) 8,577 – 2,745 11,322 32 32
Loan impairment charges and other credit risk provisions .................... (172) – 1 (171) – (60) (231) (34) (35)
Net operating income ...... 8,432 – (26) 8,406 – 2,685 11,091 32 32
Operating expenses .......... (3,269) – 9 (3,260) – (520) (3,780) (16) (16)
Operating profit ............... 5,163 – (17) 5,146 – 2,165 7,311 42 42
Income from associates ... 19 – – 19 – 9 28 47 47
Profit before tax ............... 5,182 – (17) 5,165 – 2,174 7,339 42 42
For footnotes, see page 143.
Review of business performance
HSBC’s operations in Hong Kong reported a record pre-tax profit of US$7.3 billion, an increase of 42 per cent compared with US$5.2 billion in 2006. The underlying change was in line with the reported change. Net operating income increased by 32 per cent, double the rate of growth in operating expenses.
In Personal Financial Services, record results reflected increased fee income, particularly from retail brokerage and investment products, as well as growth in net interest income from higher deposit balances and lending. In Commercial Banking, results were driven by balance sheet growth from customer acquisition, increased trade flows and the expansion of supporting businesses into mainland China. In Global Banking and Markets, income growth reflected improved performance in balance sheet management and strong results from the trading businesses and securities services in the buoyant economic environment. Higher demand for structured products and mutual funds drove the increase in Private Banking profits. Cost efficiency ratios improved in all customer groups.
Net interest income rose by 17 per cent, driven by growth in asset and liability products in the personal, commercial and corporate businesses. Net interest income from Global Banking and Markets increased by 79 per cent as balance sheet management revenues recovered and deposits grew strongly with higher spreads. A rise in liabilities to fund trading activities reduced net interest income, with a corresponding rise in trading income. Personal Financial Services’ net interest income grew by 16 per cent as wider spreads were recorded on higher deposit balances, with the relaunch of HSBC Premier contributing to the growth in deposit balances. Card balances were also higher following a number of promotional programmes during the year. In Commercial Banking, strong economic growth helped generate demand for savings products and this, combined with strong customer acquisition, resulted in higher net interest from the investment of deposits.
Buoyant stock market activity drove an increase in fee income. Broking and global custody income rose as larger trading volumes were registered on higher stock exchange daily turnover. This was

103
enhanced by the launch of new investment schemes, awareness campaigns and the adoption of a new portfolio wealth management sales tool in the branch network. An increase in IPO activity in Hong Kong, mainly derived from mainland China, had a positive effect on underwriting fees. Life insurance commission income increased, boosted by new product offerings. Credit card fee income also rose, driven by increased cards in circulation and a rise in cardholder balances.
Trading income growth was achieved throughout the Global Markets business and particularly in foreign exchange, assisted by investments made in recent years to extend the product range and customer base. Structured equity growth continued, driven by the bank’s product offering linked to the Hong Kong Stock Exchange, which rose significantly. HSBC had only very limited exposure to asset-based securities and structured credit products in Hong Kong.
Net earned insurance premiums increased by 7 per cent to US$2.8 billion, as the life assurance business expanded with the launch of new products.
Other operating income was largely in line with 2006, notwithstanding the non-recurrence of income on the sale of the former head office building of Hang Seng Bank and the transfer of the credit card
acquiring business into a joint venture with Global Payments Inc.
Net insurance claims incurred and movement in liabilities to policyholders increased by 19 per cent to US$3.2 billion. The increase was more significant than premium growth because many of the liabilities were related to life policies. Policyholders participate in the investment performance of assets supporting these liabilities and the investment return on these assets is shown in ‘Net income from financial instruments designated at fair value’.
Loan impairment charges continued at a low level and in line with 2006 at US$231 million, despite strong balance sheet growth. This reflected good credit quality and robust economic conditions.
Operating expenses increased by 16 per cent. Staff costs rose by 23 per cent on wage inflation and the recruitment of additional staff, mainly in Commercial Banking and Global Banking and Markets. Performance-related bonuses grew in response to revenue growth. Higher marketing and IT costs reflected business growth and the launch of new initiatives. As commercial rents rose in Hong Kong’s dynamic economy, property rental costs increased, the effect magnified by the sale and leaseback agreement on Hang Seng Bank’s head office in 2006.

H S B C H O L D I N G S P L C
Report of the Directors: Operating and Financial Review (continued)
Geographical regions / Hong Kong > Profit/(loss) before tax by customer group
104
Analysis by customer group and global business
Profit/(loss) before tax
2008
Hong Kong
Personal Financial Services US$m
Commercial Banking US$m
Global Banking & Markets US$m
Private Banking US$m
Other US$m
Inter- segment elimination21
US$m Total US$m
Net interest income/(expense) ..... 3,381 1,498 1,524 214 (669) (250) 5,698
Net fee income ............................ 1,441 548 414 163 14 – 2,580
Trading income excluding net interest income ....................... 143 79 483 120 30 – 855
Net interest/(expense) income on trading activities ................ 11 1 244 – (168) 250 338
Net trading income/(expense)16 ... 154 80 727 120 (138) 250 1,193
Changes in fair value of long- term debt issued and related derivatives .............................. – – – – 3 – 3
Net income/(expense) from other financial instruments designated at fair value ........... (1,291) (10) 39 – 68 – (1,194)
Net income/(expense) from financial instruments designated at fair value ........... (1,291) (10) 39 – 71 – (1,191)
Gains less losses from financial investments .............. 156 32 (109) – (388) – (309)
Dividend income ......................... 3 2 17 – 19 – 41 Net earned insurance
premiums ................................ 3,047 181 17 – 2 – 3,247 Other operating income .............. 132 38 101 8 906 (368) 817
Total operating income ............ 7,023 2,369 2,730 505 (183) (368) 12,076
Net insurance claims17 ................ (1,773) (136) (11) – (2) – (1,922)
Net operating income5 .............. 5,250 2,233 2,719 505 (185) (368) 10,154
Loan impairment (charges)/ recoveries and other credit risk provisions ........................ (134) (335) (284) (13) 1 – (765)
Net operating income/(expense) 5,116 1,898 2,435 492 (184) (368) 9,389
Total operating expenses ............ (1,691) (584) (1,000) (255) (781) 368 (3,943)
Operating profit/(loss) .............. 3,425 1,314 1,435 237 (965) – 5,446
Share of profit in associates and joint ventures ................... 3 1 1 – 10 – 15
Profit/(loss) before tax .............. 3,428 1,315 1,436 237 (955) – 5,461 % % % % % % Share of HSBC’s profit
before tax ................................ 36.9 14.1 15.4 2.6 (10.3) 58.7 Cost efficiency ratio ................... 32.2 26.2 36.8 50.5 (422.2) 38.8 Balance sheet data15 US$m US$m US$m US$m US$m US$m Loans and advances to
customers (net) ....................... 41,447 30,331 23,042 3,605 1,795 100,220 Total assets ................................. 75,419 36,428 225,853 28,800 66,192 (25,541) 407,151 Customer accounts ...................... 145,002 54,869 30,866 19,416 364 250,517
For footnotes, see page 143.

105
Analysis by customer group and global business (continued)
Profit/(loss) before tax
2007
Hong Kong
Personal Financial Services US$m
Commercial Banking US$m
Global Banking & Markets US$m
Private Banking US$m
Other US$m
Inter- segment elimination21
US$m Total US$m
Net interest income/(expense) ..... 3,342 1,540 986 70 (767) 312 5,483
Net fee income ............................ 1,973 526 682 179 2 – 3,362
Trading income excluding net interest income ....................... 188 63 553 280 186 – 1,270
Net interest income on trading activities .................................. 5 – 241 – 38 (312) (28)
Net trading income16.................... 193 63 794 280 224 (312) 1,242
Changes in fair value of long- term debt issued and related derivatives .............................. – – – – 2 – 2
Net income/(expense) from other financial instruments designated at fair value ........... 820 (13) 7 – (140) – 674
Net income/(expense) from financial instruments designated at fair value ........... 820 (13) 7 – (138) – 676
Gains less losses from financial investments .............. – – 38 1 55 – 94
Dividend income ......................... 2 1 6 – 22 – 31 Net earned insurance
premiums ................................ 2,654 130 13 – – – 2,797 Other operating income .............. 153 28 114 6 881 (337) 845
Total operating income ............... 9,137 2,275 2,640 536 279 (337) 14,530
Net insurance claims17 ................ (3,116) (82) (10) – – – (3,208)
Net operating income5 ................ 6,021 2,193 2,630 536 279 (337) 11,322
Loan impairment charges and other credit risk provisions ..... (175) (28) (28) – – – (231)
Net operating income ................. 5,846 2,165 2,602 536 279 (337) 11,091
Total operating expenses ............ (1,639) (547) (1,025) (231) (675) 337 (3,780)
Operating profit/(loss) ................ 4,207 1,618 1,577 305 (396) – 7,311
Share of profit in associates and joint ventures ................... 5 1 1 – 21 – 28
Profit/(loss) before tax ................ 4,212 1,619 1,578 305 (375) – 7,339 % % % % % % Share of HSBC’s profit
before tax ................................ 17.4 6.7 6.5 1.3 (1.6) 30.3 Cost efficiency ratio ................... 27.2 24.9 39.0 43.1 241.9 33.4 Balance sheet data15 US$m US$m US$m US$m US$m US$m Loans and advances to
customers (net) ....................... 38,197 25,890 19,171 4,329 2,051 89,638 Total assets ................................. 66,002 32,059 215,801 17,484 53,227 (27,679) 356,894 Customer accounts ...................... 129,159 51,562 37,364 15,649 754 234,488
For footnotes, see page 143.

H S B C H O L D I N G S P L C
Report of the Directors: Operating and Financial Review (continued)
Geographical regions / Hong Kong > Profit/(loss) before tax by customer group // Rest of Asia-Pacific
106
Profit/(loss) before tax
2006
Hong Kong
Personal Financial Services US$m
Commercial Banking US$m
Global Banking & Markets US$m
Private Banking US$m
Other US$m
Inter- segment elimination21 US$m
Total US$m
Net interest income/(expense) .... 2,882 1,344 553 76 (646) 476 4,685
Net fee income/(expense) ........... 977 454 534 123 (32) – 2,056
Trading income excluding net interest income ....................... 84 57 573 176 34 – 924
Net interest income on trading activities .................................. 4 – 88 – 77 (476) (307)
Net trading income16.................... 88 57 661 176 111 (476) 617
Changes in fair value of long- term debt issued and related derivatives .............................. – – – – – – –
Net income/(expense) from other financial instruments designated at fair value ........... 373 (53) 5 1 (66) – 260
Net income/(expense) from financial instruments designated at fair value ........... 373 (53) 5 1 (66) – 260
Gains less losses from financial investments .............. 14 – (1) 9 140 – 162
Dividend income ......................... 1 1 2 – 57 – 61 Net earned insurance
premiums ................................ 2,519 95 14 – – – 2,628 Other operating income .............. 202 33 81 13 781 (276) 834
Total operating income ............... 7,056 1,931 1,849 398 345 (276) 11,303
Net insurance claims17 ................ (2,638) (50) (11) – – – (2,699)
Net operating income5 ................ 4,418 1,881 1,838 398 345 (276) 8,604
Loan impairment (charges)/ recoveries and other credit risk provisions ........................ (119) (69) 27 – (11) – (172)
Net operating income ................. 4,299 1,812 1,865 398 334 (276) 8,432
Total operating expenses ............ (1,422) (491) (911) (197) (524) 276 (3,269)
Operating profit/(loss) ................ 2,877 1,321 954 201 (190) – 5,163
Share of profit in associates and joint ventures ................... 3 – 1 – 15 – 19
Profit/(loss) before tax ................ 2,880 1,321 955 201 (175) – 5,182 % % % % % % Share of HSBC’s profit
before tax ................................ 13.0 6.0 4.3 0.9 (0.7) 23.5 Cost efficiency ratio ................... 32.2 26.1 49.6 49.5 151.9 38.0 Balance sheet data15 US$m US$m US$m US$m US$m US$m Loans and advances to
customers (net) ....................... 35,445 23,520 20,270 3,081 1,966 84,282 Total assets ................................. 57,977 30,137 182,540 22,492 49,866 (24,155) 318,857 Customer accounts ...................... 118,201 41,493 24,530 11,991 476 196,691
For footnotes, see page 143.

107
Rest of Asia-Pacific (including the Middle East)
Profit/(loss) before tax by country within customer groups and global businesses
Personal Financial Services US$m
Commercial Banking US$m
Global Banking & Markets US$m
Private Banking US$m
Other US$m
Total US$m
2008 Australia ............................................................ 19 68 102 – (13) 176 India .................................................................. (155) 118 578 2 123 666 Indonesia ........................................................... (22) 17 126 – – 121 Japan ................................................................. (88) (1) 88 1 4 4 Mainland China ................................................ 284 622 688 (5) 16 1,605
Associates ..................................................... 393 558 335 – – 1,286 Other mainland China .................................. (109) 64 353 (5) 16 319
Malaysia ............................................................ 94 96 171 – 8 369 Middle East ....................................................... 289 558 816 4 79 1,746
Egypt ............................................................ 16 68 90 – 49 223 United Arab Emirates ................................... 133 330 388 4 6 861 Other Middle East ........................................ 80 125 161 – 1 367 Middle East (excluding Saudi Arabia) ......... 229 523 639 4 56 1,451 Saudi Arabia ................................................. 60 35 177 – 23 295
Singapore .......................................................... 104 83 337 110 (37) 597 South Korea ...................................................... (16) (13) 304 – 38 313 Taiwan .............................................................. (41) 45 179 – (8) 175 Other ................................................................. 32 200 397 1 66 696
500 1,793 3,786 113 276 6,468 2007 Australia ............................................................ 41 37 42 – 4 124 India .................................................................. (70) 88 429 (1) 83 529 Indonesia ........................................................... (7) 29 86 – (4) 104 Japan ................................................................. (34) (3) 75 – 5 43 Mainland China ................................................ 494 397 369 – 1,101 2,361
Associates ..................................................... 516 351 220 – 1,093 2,180 Other mainland China .................................. (22) 46 149 – 8 181
Malaysia ............................................................ 81 90 146 – 13 330 Middle East ....................................................... 245 482 495 3 82 1,307
Egypt ............................................................ 10 46 65 – 32 153 United Arab Emirates ................................... 108 262 242 3 2 617 Other Middle East ........................................ 83 101 116 – – 300 Middle East (excluding Saudi Arabia) ......... 201 409 423 3 34 1,070 Saudi Arabia ................................................. 44 73 72 – 48 237
Singapore .......................................................... 101 112 240 90 7 550 South Korea ...................................................... (44) (20) 159 – 28 123 Taiwan .............................................................. (52) 27 144 – 4 123 Other ................................................................. 5 111 279 – 20 415
760 1,350 2,464 92 1,343 6,009

H S B C H O L D I N G S P L C
Report of the Directors: Operating and Financial Review (continued)
Geographical regions > Rest of Asia-Pacific > 2008
108
Personal Financial Services US$m
Commercial Banking US$m
Global Banking & Markets US$m
Private Banking US$m
Other US$m
Total US$m
2006 Australia ............................................................ 76 32 46 – – 154 India .................................................................. (24) 46 277 2 92 393 Indonesia ........................................................... (22) 46 69 – (22) 71 Japan ................................................................. (3) (2) 49 (1) 80 123 Mainland China ................................................ 276 241 167 – 24 708
Associates ..................................................... 274 210 86 – 5 575Other mainland China .................................. 2 31 81 – 19 133
Malaysia ............................................................ 77 87 99 (1) 12 274 Middle East ....................................................... 235 356 396 2 46 1,035
Egypt ............................................................ 9 41 41 – 20 111United Arab Emirates ................................... 70 209 145 3 (2) 425Other Middle East ........................................ 59 67 70 (1) (1) 194Middle East (excluding Saudi Arabia) ......... 138 317 256 2 17 730Saudi Arabia ................................................. 97 39 140 – 29 305
Singapore .......................................................... 73 90 145 68 (11) 365 South Korea ...................................................... (55) (20) 115 – 19 59 Taiwan .............................................................. (179) 37 118 – 1 (23)Other ................................................................. 23 121 168 10 46 368
477 1,034 1,649 80 287 3,527
Loans and advances to customers (net) by country
At 31 December 2008
US$m 2007
US$m 2006
US$m
Australia ........................................................................................................... 9,321 11,339 8,775 India ................................................................................................................. 6,244 7,220 4,915 Indonesia .......................................................................................................... 1,904 1,642 1,337 Japan ................................................................................................................ 5,839 4,258 3,391 Mainland China ............................................................................................... 11,440 11,647 6,065 Malaysia ........................................................................................................... 9,404 8,856 7,747 Middle East (excluding Saudi Arabia) ............................................................ 27,295 21,607 15,622
Egypt ........................................................................................................... 2,473 1,853 965United Arab Emirates .................................................................................. 17,537 14,103 10,148Other Middle East ....................................................................................... 7,285 5,651 4,509
Singapore ......................................................................................................... 13,441 11,505 9,610 South Korea ..................................................................................................... 5,336 7,124 6,260 Taiwan ............................................................................................................. 4,329 3,658 3,974 Other ................................................................................................................ 13,403 12,996 9,878
107,956 101,852 77,574

109
Customer accounts by country
At 31 December 2008
US$m 2007
US$m 2006
US$m
Australia ........................................................................................................... 9,201 11,418 8,491 India ................................................................................................................. 9,767 12,021 7,936 Indonesia .......................................................................................................... 2,896 2,574 2,082 Japan ................................................................................................................ 6,204 4,657 4,186 Mainland China ............................................................................................... 19,171 14,537 6,941 Malaysia ........................................................................................................... 11,963 11,701 9,640 Middle East (excluding Saudi Arabia) ............................................................ 35,166 30,937 21,196
Egypt ........................................................................................................... 5,363 4,056 2,703United Arab Emirates .................................................................................. 19,808 18,455 11,166Other Middle East ....................................................................................... 9,995 8,426 7,327
Singapore ......................................................................................................... 32,748 28,962 23,517 South Korea ..................................................................................................... 4,383 5,760 3,890 Taiwan ............................................................................................................. 9,689 9,426 7,675 Other ................................................................................................................ 18,171 18,240 13,441
159,359 150,233 108,995
2008 compared with 2007
Economic briefing
Growth in mainland China was steady during 2008, although lower than in previous years. Overall GDP growth totalled 9 per cent in 2008, down from 13 per cent in 2007, as weakness in key export markets led to a slowdown in industrial activity during the final months of the year. The tightening of monetary conditions in 2007 and early 2008 also contributed to the slowdown, although interest rates and reserve requirements were both reduced significantly during the final months of the year and a significant fiscal stimulus package was also announced. Consumer spending continued to advance at a strong pace with retail spending increasing by 21.6 per cent over the course of 2008. After accelerating to an eleven year high of 8.7 per cent in February 2008, consumer price inflation slowed to 1.2 per cent by the year-end, largely reflecting the movements in food and energy prices. The renminbi appreciated by more than 6 per cent against the US dollar during 2008, although the exchange rate was little changed during the second half of the year.
Japan’s economy slowed sharply during the course of 2008, with industrial activity declining rapidly during the final quarter of the year in response to much weaker external demand. Contractions were registered in both second and third quarter GDP data, confirming a technical recession, while the unemployment rate rose from 3.8 per cent in January 2008 to 4.4 per cent by the year-end. Inflationary pressures increased during the first half before subsiding during the final months of 2008, while measures of business confidence also fell sharply.
The economies of the Middle East performed strongly for much of 2008, although inflationary concerns were a feature for much of the year, driven by the surge in oil prices to record levels and private and public investment expenditure. High oil revenues continued to boost fiscal and current account surpluses throughout the region during 2008, although the impact of the decline in oil prices during the final months of the year, together with the OPEC-mandated production cuts, are expected to lead to slower growth in 2009.
Elsewhere in Asia, most economies followed an uneven pattern of growth during 2008. Policymakers focused on the rise in inflation during the first half of the year, but the sharp slowdown in growth during the final months of 2008 came to dominate, with a series of monetary and fiscal policy measures being introduced across the region to stimulate activity. The sustained rise in inflation prompted the Reserve Bank of India to tighten policy by raising both interest rates and reserve requirements during the first half of 2008, before then cutting the cash reserve ratio by 350 basis points and the repo rate by 250 basis points during the final quarter of the year. A recession was confirmed in Singapore after GDP contracted for three consecutive quarters in 2008, as an economic slowdown initially focused on specific industries turned more pervasive. After rising to a 26-year high of 7.5 per cent in June 2008, the annual rate of inflation slowed to 4.3 per cent by the year-end.
Inflation also proved the predominant concern in Vietnam during the first half of 2008 as the annual rate of consumer price inflation more than doubled to 28.3 per cent, prompting the State Bank of Vietnam to sanction substantial interest rate

H S B C H O L D I N G S P L C
Report of the Directors: Operating and Financial Review (continued)
Geographical regions > Rest of Asia-Pacific > 2008
110
Profit before tax
2008 2007 2006 Rest of Asia-Pacific (including the Middle East) US$m US$m US$m
Net interest income .......................................................................................... 5,493 4,143 3,047
Net fee income ................................................................................................. 2,558 2,246 1,622
Net trading income .......................................................................................... 2,444 1,643 1,181
Changes in fair value of long-term debt issued and related derivatives ......... 1 1 –Net income/(expense) from other financial instruments designated at
fair value ..................................................................................................... (172) 110 79
Net income/(expense) from financial instruments designated at fair value ..................................................................................................... (171) 111 79
Gains less losses from financial investments .................................................. 32 38 41 Gains arising from dilution of interests in associates ..................................... 1,081 – Dividend income .............................................................................................. 4 8 5 Net earned insurance premiums ...................................................................... 197 226 174 Other operating income ................................................................................... 1,064 798 765
Total operating income ................................................................................. 11,621 10,294 6,914
Net insurance claims incurred and movement in liabilities to policyholders .......................................................................................... 28 (253) (192)
Net operating income before loan impairment charges and other credit risk provisions ................................................................................ 11,649 10,041 6,722
Loan impairment charges and other credit risk provisions ............................. (1,131) (616) (512)
Net operating income .................................................................................... 10,518 9,425 6,210
Total operating expenses ................................................................................. (5,663) (4,764) (3,548)
Operating profit ............................................................................................. 4,855 4,661 2,662
Share of profit in associates and joint ventures ............................................... 1,613 1,348 865
Profit before tax ............................................................................................. 6,468 6,009 3,527 % % %
Share of HSBC’s profit before tax .................................................................. 69.5 24.8 16.0 Cost efficiency ratio ........................................................................................ 48.6 47.4 52.8 Year-end staff numbers (full-time equivalent) ................................................ 98,159 88,573 72,265 Balance sheet data15 At 31 December
2008
US$m 2007
US$m 2006
US$m
Loans and advances to customers (net) ........................................................... 107,956 101,852 77,574 Loans and advances to banks (net) .................................................................. 36,141 39,861 27,517 Trading assets, financial assets designated at fair value, and
financial investments ................................................................................... 61,223
64,381 41,585 Total assets ...................................................................................................... 262,305 243,205 175,010 Deposits by banks ............................................................................................ 13,689 17,560 10,323 Customer accounts ........................................................................................... 159,359 150,233 108,995
For footnote, see page 143. All commentaries on Rest of Asia-Pacific are on an underlying basis unless stated otherwise.
increases, before these measures were rapidly reversed during the final months of the year. Interest rate increases were also forthcoming in Indonesia between May and October 2008, although with growth levels maintaining a relatively robust level during much of the year, a tentative easing cycle was only initiated during the final weeks of 2008. Bank Negara Malaysia proved the exception by refraining
from interest rate increases during the year, even as consumer price inflation accelerated to 8.5 per cent in July 2008, before cutting the policy rate to 3.25 per cent in November. The outlook for the South Korean economy was affected by the open nature of the economy and the relatively high levels of household and corporate sector indebtedness. Full year GDP rose by 2.5 per cent in 2008, down from

111
5.0 per cent in 2007 and the weakest performance for ten years, while fourth quarter GDP fell by 3.4 per cent on a year-on-year basis. Rising food prices proved particularly problematic for the Philippines during the first half of the year as inflation moved
well above the central bank’s targeted range, although the earlier tightening of monetary policy was partially reversed at the end of 2008. Growth slowed sharply in Taiwan during the course of the year, driven by deteriorating conditions overseas.
Reconciliation of reported and underlying profit before tax
2008 compared with 2007
Rest of Asia-Pacific (including the Middle East)
2007 as reported US$m
2007 acquisitions, disposals & dilution gains1
US$m
Currency translation2
US$m
2007 at 2008 exchange rates3
US$m
2008 acquisitions and disposals1
US$m
Under- lying change US$m
2008 as reported US$m
Re- ported change %
Under- lying change %
Net interest income .......... 4,143 – 43 4,186 31 1,276 5,493 33 30 Net fee income ................. 2,246 – 24 2,270 3 285 2,558 14 13 Other income4 ................... 3,652 (1,081) 18 2,589 70 939 3,598 (1) 36
Net operating income5 .... 10,041 (1,081) 85 9,045 104 2,500 11,649 16 28
Loan impairment charges and other credit risk provisions .................... (616) – 14 (602) – (529) (1,131) (84) (88)
Net operating income .... 9,425 (1,081) 99 8,443 104 1,971 10,518 12 23
Operating expenses .......... (4,764) – (17) (4,781) (110) (772) (5,663) (19) (16)
Operating profit ............. 4,661 (1,081) 82 3,662 (6) 1,199 4,855 4 33
Income from associates ... 1,348 – 93 1,441 – 172 1,613 20 12
Profit before tax ............. 6,009 (1,081) 175 5,103 (6) 1,371 6,468 8 27
For footnotes, see page 143.
Review of business performance
HSBC’s operations in Rest of Asia-Pacific performed strongly, reporting a pre-tax profit of US$6.5 billion compared with US$6.0 billion in 2007, an increase of 8 per cent. HSBC continued to increase its presence in key markets, augmenting organic growth with the integration of the operations of The Chinese Bank in Taiwan and the purchase of IL&FS Investsmart Ltd in India, which was completed in September. On an underlying basis, excluding the dilution gains on Chinese associates of US$1.1 billion recorded in 2007 and the acquisitions noted above, profit before tax increased by 27 per cent, with notable growth in the Middle East, South Korea, mainland China, India, and an increased contribution from associates in the region. Branches were added in mainland China, Indonesia, Japan, Malaysia and Bangladesh.
Net interest income increased by 30 per cent, with growth across most major countries and all customer groups. Deposit acquisition and related asset deployment across the region drove net interest income, though this volume growth was partly offset by deposit spread compression in the second half of
the year due to declining interest rates, compounded by strong competition to acquire deposits.
In the Middle East, net interest income increased by 42 per cent, with deposit growth, notably in Personal Financial Services. This supported a strong rise in corporate lending balances aligned to trade and infrastructure investments, as well as increased personal lending, in particular credit cards. Asset spreads benefited from declines in local base rates following US dollar interest rate cuts, which resulted in a lower cost of funds.
In India, net interest income increased by 44 per cent as deposit balances in Personal Financial Services and Commercial Banking rose due to customer acquisition, notably among small businesses following the launch of the HSBC Direct for Business product. These deposits were deployed in increasing lending, where spreads improved on the corporate lending and credit card portfolios and mortgage spreads widened following a re-pricing in the second half of the year.
In mainland China, net interest income also rose due to deposit growth, as investors increasingly preferred deposits over market-led investments as

H S B C H O L D I N G S P L C
Report of the Directors: Operating and Financial Review (continued)
Geographical regions > Rest of Asia-Pacific > 2008 / 2007
112
market sentiment deteriorated. This facilitated an increase in personal lending balances following branch network expansion and successful re-pricing initiatives on corporate and commercial loans.
There was strong growth in net interest income from Balance Sheet Management within Global Banking and Markets, due to lower funding costs and steeper yield curves, notably in Singapore, mainland China, India, Japan and the Middle East.
Net fee income rose by 13 per cent, driven by a growth in fees from personal credit cards and trade and supply chain services. Credit card fees rose, particularly in the Middle East and India, driven by increases in interchange fees from higher cardholder spending and late payment and over-limit fees from higher delinquencies (see below). Trade and supply chain services contributed strongly to fee income growth with an increase of 34 per cent in the Middle East, in part reflecting the significant rise in commodity prices in the first half of the year, demonstrably in the construction and infrastructure industries in the UAE. There were lower fees from investment products and broking across the region, driven by a decline in equity markets and weakened investor sentiment.
Fee income from credit facilities rose, notably in the Middle East, India, Australia and Singapore, reflecting increases in the number of customers.
Net trading income rose by 51 per cent, predominantly due to strong Rates and foreign exchange trading across the region as volatile market conditions continued, encouraging increased corporate hedging activity.
Growth was particularly strong in South Korea, mainland China and Australia due to strategic positioning of HSBC’s balance sheet to benefit from the interest rate cuts and foreign exchange volatility in 2008, and increased activity in these local markets. In the Middle East, market uncertainty regarding possible currency revaluations drove volatility and, together with robust client demand, led to growth in foreign exchange income. In India, foreign exchange and, to a lesser extent, Rates revenues rose, driven mainly by increased customer activity and high levels of market volatility.
A net loss from financial instruments designated at fair value of US$171 million was recorded compared with income of US$111 million in 2007. Declines in equity markets affected unit-linked insurance products, particularly in Singapore. This was largely offset by a corresponding decrease in
liabilities to policyholders reflected in net insurance claims incurred and movement in liabilities to policyholders.
Net earned insurance premiums decreased by 17 per cent to US$197 million, mainly in Singapore and Malaysia due to lower sales of single premium unit-linked products. This was partly offset by an increase in the sale of general insurance products.
Loan impairment charges rose sharply, increasing by 88 per cent to US$1.1 billion, following a marked deterioration in credit quality across the region in the final quarter of the year. These charges rose most significantly in India, the Middle East and, to a lesser extent, in Australia.
In India, the rise was attributable to increased delinquency across personal lending portfolios, in response to which HSBC took action to restrict mortgage and personal lending. However, HSBC continued to extend credit to selected cards customers, which resulted in volume growth and also contributed to higher loan impairment charges.
In the Middle East, higher loan impairment charges were the result of volume growth and increased delinquency rates on personal lending. In Australia, higher delinquencies arose from the maturing of the cards portfolio and, to a lesser extent, volume growth, in addition to a credit risk provision related to an exposure to an Icelandic Bank. Partly offsetting this, loan impairment charges declined by 41 per cent in Taiwan due to an improvement in asset quality. Similarly, in Thailand, loan impairment charges were 69 per cent lower due to the non-recurrence of charges attributable to the down-grading of certain corporate customers.
Operating expenses increased by 16 per cent to US$5.7 billion. Significant investment in the region continued, notably in mainland China where 29 new outlets were opened and staff numbers increased. Related premises and equipment costs rose accordingly. Expansion was also pursued in Indonesia with the addition of new branches, and in Japan with the rollout of seven HSBC Premier centres. In the Middle East, operating expenses were 22 per cent higher in line with substantially increased levels of operating volumes and related headcount growth. In India, the rise in operating expenses was driven mainly by investment in IT, premises costs and an increase in collection activities as default rates rose. Business growth contributed to higher operating expenses in Australia. Litigation costs in the region rose.

113
Growth in operating expenses at the Group Service and Software Development Centres was driven by increased volumes of activity as HSBC continued to implement a global resourcing strategy to minimise costs throughout the Group. All related costs are recharged to other Group entities and the income is reported within Other operating income.
Profit from associates and joint ventures in the region increased by 12 per cent, notwithstanding a significant impairment recorded in Ping An Insurance in respect of its stake in Fortis Bank. Growth was strong across HSBC’s other principal associates, the Bank of Communications, Industrial Bank, and the Saudi British Bank.
2007 compared with 2006
Economic briefing
Mainland China’s economy continued to grow strongly, with GDP rising by 11.4 per cent in 2007, the fifth consecutive year of double-digit growth; this was despite a combination of measures aimed at curbing investment, such as increases in interest rates and reserve ratios required for banks. Economic performance remained primarily dependent on investment and exports. Bank loan growth also remained very strong. Export growth slowed from very high levels as the year progressed, reflecting the mild downturn in global trade. Consumer spending grew steadily in 2007, with retail sales rising by about 16 per cent. Inflationary pressures increased, with consumer price inflation exceeding 6 per cent towards the end of the year, mainly due to higher food prices. Mainland China’s foreign exchange reserves rose further, to more than US$1.5 trillion, while the renminbi appreciated by over 5 per cent against the US dollar in 2007.
Japan’s economy, the largest in the region, expanded modestly in 2007. Private capital investment decelerated after five years of firm growth but a rise in exports, especially to Asia, drove overall growth. Private consumption also made a positive contribution, helped by a gradual increase in employees’ income. Core consumer price inflation remained around zero throughout the course of the year.
In the Middle East, economies continued to grow, although growth rates slowed slightly on those recorded in 2006, largely as a result of OPEC-mandated cuts in oil production. Underlying
economic performance was robust, however, led by continued non-oil sector growth. The catalyst for expansion was a fifth consecutive year of rising oil prices, which facilitated continued growth in public and private investment. Consumption rose as employment levels increased and low interest rates supported an ongoing expansion in credit. Strong population growth, accelerated in parts of the region by high levels of immigration, also boosted demand for credit. High oil revenues resulted in a further year of fiscal and current account surpluses throughout the Middle East, boosting reserves and holdings of overseas assets. Rapid economic growth, low interest rates and currency weakness increased inflation, however, fuelling demands in some quarters for adjustments to the long-standing dollar pegs. Regional equity markets recovered from their 2005-06 downturns to perform strongly in 2007.
Elsewhere in the region, the Indian economy expanded by 8.7 per cent in 2007, although there was evidence that recent interest rate rises and the strength of the rupee were slowing some areas of the economy, and inflationary pressures eased in 2007. The economies of Vietnam and Singapore recorded strong performances too, expanding by 8.5 per cent and 7.7 per cent, respectively in 2007. Growth was approximately 6 per cent in Indonesia and Malaysia. Domestic demand in all these countries has become an increasingly important source of GDP growth with investment, particularly in the construction sector, expanding rapidly. Inflationary pressures intensified in 2007, largely as a result of higher oil and food prices, but remained under control. The South Korean economy accelerated in 2007 as exports continued to flourish and household spending recovered from levels recorded in 2006. Concerns over liquidity growth prompted the central bank to increase interest rates by 50 basis points to 5 per cent during the year. A gradual cooling of demand and concerns over rapid exchange rate appreciation are expected to limit the scope for further interest rate rises in 2008. Buoyant exports supported economic growth in Taiwan, while domestic demand remained lacklustre due to a lack of government initiatives which is expected to continue beyond the presidential and parliamentary elections scheduled for 2008. Generally robust economic performances in the Philippines, Thailand, and Pakistan in 2007 were overshadowed to varying degrees by political risks.

H S B C H O L D I N G S P L C
Report of the Directors: Operating and Financial Review (continued)
Geographical regions > Rest of Asia-Pacific > 2007
114
Reconciliation of reported and underlying profit before tax
2007 compared with 2006
Rest of Asia-Pacific (including the Middle East)
2006 as reported US$m
2006 acquisitions and disposals1
US$m
Currency translation2
US$m
2006 at 2007 exchange rates6
US$m
2007 acquisitions, disposals & dilution gains1
US$m
Under- lying change US$m
2007 as reported US$m
Re- ported change %
Under- lying change %
Net interest income .......... 3,047 – 140 3,187 – 956 4,143 36 30 Net fee income ................. 1,622 – 58 1,680 – 566 2,246 38 34 Other income4 ................... 2,053 – 108 2,161 1,081 410 3,652 78 19
Net operating income5 ...... 6,722 – 306 7,028 1,081 1,932 10,041 49 27
Loan impairment charges and other credit risk provisions .................... (512) – (13) (525) – (91) (616) (20) (17)
Net operating income ...... 6,210 – 293 6,503 1,081 1,841 9,425 52 28
Operating expenses .......... (3,548) – (179) (3,727) – (1,037) (4,764) (34) (28)
Operating profit ............... 2,662 – 114 2,776 1,081 804 4,661 75 29
Income from associates ... 865 – 25 890 – 458 1,348 56 51
Profit before tax ............... 3,527 – 139 3,666 1,081 1,262 6,009 70 34
For footnotes, see page 143.
Review of business performance
HSBC’s operations in Rest of Asia-Pacific reported a pre-tax profit of US$6.0 billion compared with US$3.5 billion in 2006, an increase of 70 per cent. On an underlying basis, excluding dilution gains of US$1.1 billion, profit before tax increased by 34 per cent, bolstered by sustained growth and business expansion across the region.
In Global Banking and Markets, profit before tax increased significantly, driven by an enhanced product offering combined with buoyant local markets. Commercial Banking revenue benefited from increased customer volumes as a result of new and enhanced banking services. In Personal Financial Services, profit before tax rose as a result of strong balance sheet growth and increased contributions from associates. Private Banking delivered a solid performance, underpinned by robust stock markets and increasing wealth in the region.
HSBC’s three associates in mainland China, Ping An Insurance, Bank of Communications and Industrial Bank, all raised new capital in 2007 in the ‘A’ share market in Shanghai in which HSBC, as a foreign investor, was unable to participate. The dilution of the Group’s interests was considerably less than its share of the new monies, resulting in gains of US$1.1 billion which should be regarded as exceptional.
Net interest income rose by 30 per cent. Continued expansion of the branch network, particularly in the populous markets of mainland
China, Indonesia and India, together with increased marketing expenditure and greater brand awareness, accelerated customer acquisition and growth in loans and deposits.
In the Middle East, the significant increase in net interest income was driven by balance sheet growth across all customer groups and augmented by improved spreads. The growth was underpinned by strong local economies, higher oil prices and demand for credit for infrastructure investment and trade.
In Global Banking and Markets, the rise in net interest income was driven by the recovery in Balance Sheet Management revenues and, as trade and investment flows increased, by higher transactional balances in the payments and cash management businesses.
In Personal Financial Services, net interest income rose by 23 per cent, driven by higher personal lending, credit cards and deposit balances. Growth was broad-based across the region. Commercial Banking net interest income grew by 29 per cent due to volume growth in both loans and deposits following an increase in customer numbers.
Fee income increased by 34 per cent. Buoyant stock markets stimulated customer appetite for unit trusts and other investment products. Strong investment sales were recorded in India, Philippines, South Korea, Singapore and mainland China. Security services increased, driven by a sustained level of transaction volumes and investment flows. In the Middle East, increases were registered in cards,

115
global custody, credit facilities and insurance. Increased trade services income in the region reflected higher intra-regional trade flows, which were driven by the favourable economic conditions.
Strong trading income growth was delivered, led by foreign exchange trading, where higher volumes were driven by increased volatility which, in turn, increased customer demand for risk management products.
Net earned insurance premiums rose by 24 per cent to US$226 million. This growth was mainly generated in Malaysia by the HSBC Amanah Takaful business which was launched in late 2006, offering shariah-compliant insurance products.
Other operating income decreased by 2 per cent, partly because gains on disposals of certain businesses in Australia were recorded in 2006. Similarly, profits from the disposal of assets held for sale decreased due to the non-recurrence of profits on sale of properties in Japan and India.
Net insurance claims incurred and movement in liabilities to policyholders rose by 25 per cent to US$253 million, in line with the increase in premiums, mainly in Malaysia.
Loan impairment charges rose by 17 per cent to US$616 million as corporate loan impairment charges increased in several countries. In addition, loan impairment charges in India rose due to balance sheet growth and higher loss rates on credit cards. Partly offsetting these factors, loan impairment charges were significantly lower in Taiwan due to the non-recurrence of impairment charges in 2006 which resulted from regulatory intervention in the card market and the imposition of a government debt negotiation scheme. In Indonesia, performance improved on 2006 when loan impairment charges
were affected by the introduction of minimum repayment terms.
Operating expenses increased by 28 per cent in line with the rise in net operating income before loan impairment charges. Business expansion continued throughout the region. Staff costs in India, mainland China and the Middle East rose on increases in volume-driven headcount and performance-related bonuses, the latter due to higher revenue generation. Business expansion initiatives were taken in mainland China, where an additional 27 new branches or sub-branches were opened. In India, the branch network and the consumer finance and credit card businesses were all expanded. Marketing, technology and infrastructure costs were incurred in support of business expansion.
Share of profit in associates and joint ventures in the region rose by 51 per cent, mainly due to increased contributions from HSBC’s strategic investments in mainland China, Bank of Communications, Ping An Insurance and Industrial Bank. HSBC’s share of profit from Ping An Insurance rose by 101 per cent to US$518 million as a result of robust growth, notably from life insurance products, and the realisation of synergistic gains across Ping An Insurance’s other business offerings. Profit from the Bank of Communications rose by 64 per cent to US$445 million as a result of improved performance across the associate’s various product offerings. Increased income from credit and treasury products and significant growth in fee income contributed to the rise in profits. HSBC’s share of profits from the Saudi British Bank decreased by 22 per cent to US$216 million. This was largely due to the effects of a significant correction to the local stock market in the second half of 2006.

H S B C H O L D I N G S P L C
Report of the Directors: Operating and Financial Review (continued)
Geographical regions > Rest of Asia-Pacific > Profit before tax by customer group
116
Analysis by customer group and global business
Profit before tax
2008
Rest of Asia-Pacific (including the Middle East)
Personal Financial Services US$m
Commercial Banking US$m
Global Banking & Markets US$m
Private Banking US$m
Other US$m
Inter- segment elimination21 US$m
Total US$m
Net interest income ..................... 2,360 1,444 1,886 106 185 (488) 5,493
Net fee income ............................ 819 597 1,048 77 17 – 2,558
Trading income/(expense) excluding net interest income 112 187 1,477 77 (30) – 1,823
Net interest income/(expense) on trading activities ................ (5) – 143 – (5) 488 621
Net trading income/(expense)16 ... 107 187 1,620 77 (35) 488 2,444
Changes in fair value of long- term debt issued and related derivatives .............................. – – – – 1 – 1
Net income/(expense) from other financial instruments designated at fair value ........... (172) – (4) – 4 – (172)
Net income/(expense) from financial instruments designated at fair value ........... (172) – (4) – 5 – (171)
Gains less losses from financial investments .............. 29 3 – – – – 32
Dividend income ......................... – – 4 – – – 4 Net earned insurance premiums . 172 25 – – – – 197 Other operating income ............... 79 84 90 2 1,096 (287) 1,064
Total operating income ............ 3,394 2,340 4,644 262 1,268 (287) 11,621
Net insurance claims17 ................ 42 (14) – – – – 28
Net operating income5 .............. 3,436 2,326 4,644 262 1,268 (287) 11,649
Loan impairment charges and other credit risk provisions ..... (863) (182) (85) (1) – – (1,131)
Net operating income ............... 2,573 2,144 4,559 261 1,268 (287) 10,518
Total operating expenses ............ (2,527) (953) (1,298) (148) (1,024) 287 (5,663)
Operating profit ........................ 46 1,191 3,261 113 244 – 4,855
Share of profit in associates and joint ventures ................... 454 602 525 – 32 – 1,613
Profit before tax ........................ 500 1,793 3,786 113 276 – 6,468 % % % % % % Share of HSBC’s profit
before tax ................................ 5.4 19.3 40.7 1.2 2.9 69.5 Cost efficiency ratio ................... 73.5 41.0 28.0 56.5 80.8 48.6 Balance sheet data15 US$m US$m US$m US$m US$m US$m Loans and advances to
customers (net) ....................... 34,860 35,188 34,590 2,989 329 107,956 Total assets ................................. 44,478 43,702 172,049 12,486 702 (11,112) 262,305 Customer accounts ...................... 56,531 36,350 50,605 14,475 1,398 159,359
For footnotes, see page 143.

117
Profit before tax
2007
Rest of Asia-Pacific (including the Middle East)
Personal Financial Services US$m
Commercial Banking US$m
Global Banking & Markets US$m
Private Banking US$m
Other US$m
Inter- segment elimination21 US$m
Total US$m
Net interest income ..................... 1,965 1,131 1,295 60 153 (461) 4,143
Net fee income ............................ 766 429 952 85 14 – 2,246
Trading income/(expense) excluding net interest income 72 129 1,000 71 (70) – 1,202
Net interest income/(expense) on trading activities ................ (2) – (22) – 4 461 441
Net trading income/(expense)16 ... 70 129 978 71 (66) 461 1,643
Changes in fair value of long- term debt issued and related derivatives .............................. – – – – 1 – 1
Net income/(expense) from other financial instruments designated at fair value ........... 73 4 (3) (1) 37 – 110
Net income/(expense) from financial instruments designated at fair value ........... 73 4 (3) (1) 38 – 111
Gains less losses from financial investments .............. 5 4 28 – 1 – 38
Gains arising from dilution of interests in associates ............. – – – – 1,081 – 1,081
Dividend income ......................... – – 2 – 6 – 8 Net earned insurance premiums . 209 16 – – 1 – 226 Other operating income .............. 40 15 53 2 849 (161) 798
Total operating income ............... 3,128 1,728 3,305 217 2,077 (161) 10,294
Net insurance claims17 ................ (246) (7) – – – – (253)
Net operating income5 ................ 2,882 1,721 3,305 217 2,077 (161) 10,041
Loan impairment charges and other credit risk provisions ..... (552) (61) (3) – – – (616)
Net operating income ................. 2,330 1,660 3,302 217 2,077 (161) 9,425
Total operating expenses ............ (2,131) (739) (1,140) (125) (790) 161 (4,764)
Operating profit .......................... 199 921 2,162 92 1,287 – 4,661
Share of profit in associates and joint ventures ................... 561 429 302 – 56 – 1,348
Profit before tax .......................... 760 1,350 2,464 92 1,343 – 6,009 % % % % % % Share of HSBC’s profit
before tax ................................ 3.1 5.6 10.2 0.4 5.5 24.8 Cost efficiency ratio ................... 73.9 42.9 34.5 57.6 38.0 47.4 Balance sheet data15 US$m US$m US$m US$m US$m US$m Loans and advances to
customers (net) ....................... 34,486 32,159 32,106 2,955 146 101,852 Total assets ................................. 42,337 39,743 155,106 9,294 4,756 (8,031) 243,205 Customer accounts ...................... 49,703 34,891 54,120 11,116 403 150,233
For footnotes, see page 143.

H S B C H O L D I N G S P L C
Report of the Directors: Operating and Financial Review (continued)
Geographical regions > Rest of Asia-Pacific > Profit before tax by customer group // North America > 2008
118
Analysis by customer group and global business (continued)
Profit before tax
2006
Rest of Asia-Pacific (including the Middle East)
Personal Financial Services US$m
Commercial Banking US$m
Global Banking & Markets US$m
Private Banking US$m
Other US$m
Inter- segment elimination21 US$m
Total US$m
Net interest income ..................... 1,520 848 802 35 61 (219) 3,047
Net fee income ............................ 524 330 688 68 12 – 1,622
Trading income/(expense) excluding net interest income 61 86 717 74 (3) – 935
Net interest income on trading activities .................................. – – – – 27 219 246
Net trading income16 ................... 61 86 717 74 24 219 1,181
Changes in fair value of long- term debt issued and related derivatives .............................. – – – – – – –
Net income from other financial instruments designated at fair value ....................................... 59 4 4 – 12 – 79
Net income from financial instruments designated at fair value ................................. 59 4 4 – 12 – 79
Gains less losses from financial investments .............. 2 2 38 (1) – – 41
Dividend income ......................... – – 1 – 4 – 5 Net earned insurance premiums . 148 26 – – – – 174 Other operating income .............. 108 20 61 – 667 (91) 765
Total operating income ............... 2,422 1,316 2,311 176 780 (91) 6,914
Net insurance claims17 ................ (180) (11) – – (1) – (192)
Net operating income5 ................ 2,242 1,305 2,311 176 779 (91) 6,722
Loan impairment (charges)/ recoveries and other credit risk provisions .............. (545) 29 5 – (1) – (512)
Net operating income ................. 1,697 1,334 2,316 176 778 (91) 6,210
Total operating expenses ............ (1,593) (554) (869) (96) (527) 91 (3,548)
Operating profit .......................... 104 780 1,447 80 251 – 2,662
Share of profit in associates and joint ventures ................... 373 254 202 – 36 – 865
Profit before tax .......................... 477 1,034 1,649 80 287 – 3,527 % % % % % % Share of HSBC’s profit
before tax ................................ 2.2 4.7 7.5 0.4 1.2 16.0 Cost efficiency ratio ................... 71.1 42.5 37.6 54.5 67.7 52.8 Balance sheet data15 US$m US$m US$m US$m US$m US$m Loans and advances to
customers (net) ....................... 28,911 21,912 24,311 2,313 127 77,574 Total assets ................................. 35,794 26,757 109,535 7,882 – (4,958) 175,010 Customer accounts ...................... 38,557 24,228 36,623 8,929 658 108,995
For footnotes, see page 143.

119
North America
Profit/(loss) before tax by country within customer groups and global businesses
Personal Financial Services US$m
Commercial Banking US$m
Global Banking & Markets US$m
Private Banking US$m
Other US$m
Total US$m
2008 United States23 .................................................. (17,364) 226 (2,899) 67 3,427 (16,543)Canada .............................................................. 106 380 252 5 96 839 Bermuda ............................................................ 31 51 72 11 9 174 Other ................................................................. (1) 1 – – 2 2
(17,228) 658 (2,575) 83 3,534 (15,528) 2007 United States ..................................................... (1,824) 377 (1,243) 156 1,468 (1,066)Canada .............................................................. 265 466 239 8 5 983 Bermuda ............................................................ 13 77 39 10 34 173 Other ................................................................. – – – – 1 1
(1,546) 920 (965) 174 1,508 91 2006 United States ..................................................... 3,128 442 199 107 (264) 3,612 Canada .............................................................. 253 437 189 – 17 896 Bermuda ............................................................ 10 78 31 7 29 155 Other ................................................................. – – 4 – 1 5
3,391 957 423 114 (217) 4,668
For footnote, see page 143.
Loans and advances to customers (net) by country
At 31 December 2008
US$m 2007
US$m 2006
US$m
United States .................................................................................................... 208,834 233,706 236,188 Canada ............................................................................................................. 44,866 53,891 39,584 Bermuda ........................................................................................................... 2,514 2,263 2,215
256,214 289,860 277,987
Customer accounts by country
At 31 December 2008
US$m 2007
US$m 2006
US$m
United States .................................................................................................... 101,963 100,034 84,560 Canada ............................................................................................................. 33,905 37,061 28,668 Bermuda ........................................................................................................... 7,664 8,078 7,694
143,532 145,173 120,922
2008 compared with 2007
Economic briefing
Economic conditions proved very difficult in the US during 2008 as the economy entered a period of recession. Overall GDP growth slowed to just 1.1 per cent for the year, down from 2 per cent in 2007. In common with many other economies, much of this weakness was concentrated in the final months of 2008 as fourth quarter GDP registered the largest quarterly decline for 26 years. Economic
weakness proved broad-based across most areas of the economy, with the notable exception of net exports. Housing sales and residential construction activity both declined from already depressed levels, with house prices continuing to fall in most regions and mortgage delinquencies continuing to rise. Labour market conditions weakened throughout the course of the year as the unemployment rate rose from 4.9 per cent in January to a 15-year high of 7.2 per cent in December 2008. The annual rate of

H S B C H O L D I N G S P L C
Report of the Directors: Operating and Financial Review (continued)
Geographical regions > North America > 2008
120
Profit/(loss) before tax
2008 2007 2006 North America US$m US$m US$m
Net interest income .......................................................................................... 15,218 14,847 14,268
Net fee income ................................................................................................. 5,227 5,810 4,766
Net trading income/(expense) ......................................................................... (3,135) (542) 1,358
Changes in fair value of long-term debt issued and related derivatives ......... 3,736 1,750 (63)Net income from other financial instruments designated at fair value ........... 1 – –
Net income/(expense) from financial instruments designated at fair value ... 3,737 1,750 (63)Gains less losses from financial investments .................................................. (120) 245 58 Dividend income .............................................................................................. 77 105 85 Net earned insurance premiums ...................................................................... 390 449 492 Other operating income ................................................................................... 23 360 922
Total operating income ................................................................................. 21,417 23,024 21,886
Net insurance claims incurred and movement in liabilities to policyholders ............................................................................................ (238) (241) (259)
Net operating income before loan impairment charges and other credit risk provisions ................................................................................. 21,179 22,783 21,627
Loan impairment charges and other credit risk provisions ............................. (16,795) (12,156) (6,796)
Net operating income .................................................................................... 4,384 10,627 14,831
Operating expenses (excluding goodwill impairment) ................................... (9,359) (10,556) (10,193)Goodwill impairment ....................................................................................... (10,564) – –
Operating profit/(loss).................................................................................... (15,539) 71 4,638
Share of profit in associates and joint ventures ............................................... 11 20 30
Profit/(loss) before tax ................................................................................... (15,528) 91 4,668 % % %
Share of HSBC’s profit before tax .................................................................. (166.8) 0.4 21.1 Cost efficiency ratio ........................................................................................ 94.1 46.3 47.1
Year-end staff numbers (full-time equivalent) ................................................ 44,725 52,722 55,642 Balance sheet data15 At 31 December 2008 2007 2006 US$m US$m US$m
Loans and advances to customers (net) ........................................................... 256,214 289,860 277,987 Loans and advances to banks (net) .................................................................. 11,458 16,566 17,865 Trading assets, financial assets designated at fair value, and
financial investments20 ................................................................................ 119,634 133,998 145,700 Total assets ...................................................................................................... 552,612 549,285 505,638 Deposits by banks ............................................................................................ 18,181 16,618 11,484 Customer accounts ........................................................................................... 143,532 145,173 120,922
For footnotes, see page 143. All commentaries on North America are on an underlying basis unless stated otherwise.
consumer price inflation reached a 17-year high of 5.6 per cent in July 2008 before moderating sharply to stand at just 0.1 per cent by the year-end. A combination of falling asset values and weak employment conditions undermined consumer confidence and household spending growth turned negative during the second half of 2008. The Standard & Poor’s S&P 500 stock market index fell by 38 per cent during the year. Faced with this deterioration in economic activity and financial
conditions, the Federal Reserve lowered short-term interest rates by 425 basis points during the course of 2008, leaving the Funds’ target rate within a narrow range of between zero and 25 basis points, while a number of liquidity initiatives were also introduced.
Canadian GDP increased by 0.4 per cent during the first eleven months of 2008 compared with the equivalent period of 2007, with growth slowing markedly during the second half of the year, due predominantly to weaker external demand. Labour

121
market conditions deteriorated as the unemployment rate rose from a historical low of 5.8 per cent in January 2008 to finish the year at 6.6 per cent. After rising to a level of 3.5 per cent in August 2008, the headline rate of consumer price inflation slowed to 1.2 per cent by the year-end. The core rate of
inflation remained below 2.0 per cent throughout the year. Responding to the deteriorating economic outlook, the Bank of Canada cut its overnight interest rate from 4.25 per cent at the end of 2007 to 1.5 per cent in December 2008.
Reconciliation of reported and underlying profit/(loss) before tax
2008 compared with 2007
North America
2007 as reported US$m
2007 acquisitions, disposals & dilution gains1
US$m
Currency translation2
US$m
2007 at 2008 exchange rates3
US$m
2008 acquisitions and disposals1
US$m
Under- lying change US$m
2008 as reported US$m
Re- ported change %
Under- lying change %
Net interest income .......... 14,847 1 7 14,855 – 363 15,218 2 2 Net fee income ................. 5,810 (105) 1 5,706 – (479) 5,227 (10) (8)Other income4 ................... 2,126 (18) (1) 2,107 – (1,373) 734 (65) (65)
Net operating income5 .... 22,783 (122) 7 22,668 – (1,489) 21,179 (7) (7)
Loan impairment charges and other credit risk provisions .................... (12,156) – 12 (12,144) – (4,651) (16,795) (38) (38)
Net operating income .... 10,627 (122) 19 10,524 – (6,140) 4,384 (59) (58)
Operating expenses (excluding goodwill impairment) ................. (10,556) 98 (6) (10,464) – 1,105 (9,359) 11 11
Goodwill impairment ....... – – – – – (10,564) (10,564) n/a n/a
Operating profit/(loss).... 71 (24) 13 60 – (15,599) (15,539) (21,986) (25,998)
Income from associates ... 20 – – 20 – (9) 11 (45) (45)
Profit/(loss) before tax ... 91 (24) 13 80 – (15,608) (15,528) (17,164) (19,510)
For footnotes, see page 143.
Review of business performance
HSBC’s operations in North America reported a pre-tax loss of US$15.5 billion in 2008, compared with a pre-tax profit of US$91 million in 2007.
Net interest income in North America increased by 2 per cent to US$15.2 billion, driven by Balance Sheet Management activities in Global Banking and Markets which more than offset the decline in Personal Financial Services as lending reduced.
The significant increase in net interest income in the Balance Sheet Management business resulted from correct positioning in anticipation of lower interest rates. Net interest income was also boosted by higher balances within certain loan portfolios in Global Banking and Markets.
Net interest income fell in Personal Financial Services as asset balances declined and deposit spreads narrowed. Deposit spread compression was driven by the competitive environment for retail deposits in which HSBC refrained from passing on the full effects of interest rate cuts to customers.
Asset spreads widened, particularly in vehicle finance and credit cards and, to a lesser extent, the real estate secured portfolios as yields declined by less than funding costs in the lower interest rate environment, and the credit card portfolio benefited from APR floors. This was partly offset by a rise in non-performing loans, lower loan prepayments, increased volumes of loan modifications, and lower fees from reduced loan origination volumes. Funding costs declined as a result of lower base rates during the year.
Lending balances declined as the mortgage services portfolio continued to run-off, originations ceased during the year within the dealer and direct-to-consumer channels in vehicle finance, and tighter underwriting criteria in consumer lending constrained customer eligibility for finance. In addition, US$8.2 billion of mortgages were sold from the US real estate secured portfolios during the year. These factors were partly offset by a change in mix towards higher-yielding credit card loans and reduced levels of prepayments that resulted in loans remaining on the balance sheet longer. At the end of

H S B C H O L D I N G S P L C
Report of the Directors: Operating and Financial Review (continued)
Geographical regions > North America > 2008 / 2007
122
February 2009, HSBC authorised the discontinuation as soon as practicable of all new receivable originations of all products by the branch-based consumer lending business of HSBC Finance in North America (see page 70).
Net fee income declined by 8 per cent, driven by reductions in US credit card fees following changes in fee practices implemented since the fourth quarter of 2007 and lower cash advance and interchange fees as a result of reduced volumes. Partly offsetting the decline were increased income from enhancement services due to higher customer acceptance rates of Account Secure Plus and Identity Protection Plan, a rise in syndication, credit and service fees in Commercial Banking and increased fees from asset management.
Trading losses were dominated by write-downs in Global Banking and Markets on legacy exposures as continuing turmoil in credit markets adversely affected valuations of credit and structured credit trading positions, monoline exposures and leveraged and acquisition finance loans. Continued deterioration in the fair value of the run-off portfolio of sub-prime residential mortgage loans held for sale also contributed to the loss. US$3.6 billion in leveraged loans, high yield notes and securities held for balance sheet management were reclassified in 2008 under revised IFRS rules from trading assets to loans and receivables and available for sale, preventing any further mark-to-market trading losses on these assets. If these reclassifications had not been made, the loss before tax would have been US$0.9 billion higher.
The losses on legacy assets were partly offset by strong performances in other trading areas as foreign exchange trading benefited from pronounced market volatility, Rates trading correctly anticipated central bank rate cuts and gains were generated on credit default swaps in Global Banking. Revenues from emerging markets trading and precious metals trading also rose as a result of ongoing market volatility and increased transaction volumes as prices of gold and platinum rose during 2008. Losses on non-qualifying hedge positions in interest rate swaps generated further trading losses. In 2007, the Decision One business, which was closed that year, recorded trading losses of US$263 million.
Net income from financial instruments designated at fair value rose by US$2.0 billion to US$3.7 billion, primarily on HSBC’s fixed-rate long-term debt as credit spreads widened significantly in the second half of 2008 in the ongoing market turmoil. These gains, together with
those booked in previous years, will fully reverse over the life of the debt.
Gains less losses from financial investments declined, mainly due to losses on US government agency securities in 2008 and the non-recurrence of the sale of MasterCard shares, partly offset by gains from the Visa IPO in 2008.
Net earned insurance premiums decreased by 13 per cent to US$390 million, driven by lower credit related premiums in HSBC Finance due to declining loan volumes.
Other operating income declined due to losses on sale of the Canadian vehicle finance businesses and other loan portfolios in 2008, in addition to the non-recurrence of gains on disposal of fixed assets and a small portfolio of private equity investments in 2007.
Net insurance claims incurred and movement in liabilities to policyholders were broadly in line with 2007 at US$238 million.
Loan impairment charges and other credit risk provisions rose sharply, by 38 per cent to US$16.8 billion, reflecting substantially higher impairment charges in HSBC Finance across all portfolios and, in HSBC USA, the deterioration of credit quality in prime residential mortgages, second lien portfolios and private label cards. The main factors driving this deterioration were the continued weakening of the US economy, which led to rising levels of unemployment and personal bankruptcy filings: higher early-stage delinquency and increased roll rates in consumer lending: the ageing of portfolios: and further declines in house prices which increased loss severity and reduced customers’ ability to refinance and access equity in their homes. Partly offsetting these factors was a reduction in overall lending as HSBC continued to actively reduce its balance sheet and lower its risk profile in the US.
In the Mortgage Services business, loan impairment charges rose by 14 per cent to US$3.5 billion as the 2005 and 2006 vintages continued to season and experience rising delinquency. Run-off of the portfolio slowed in light of continued house price depreciation which, along with the constrained credit environment, restricted refinancing options for personal customers. In consumer lending, loan impairment charges rose by 39 per cent to US$5.7 billion. In the second half of 2008, delinquency rates began to accelerate particularly in the first lien portfolios in the parts of the country most affected by house price depreciation and rising unemployment rates. In

123
HSBC USA, loan impairment charges rose by 76 per cent to US$2.6 billion driven by credit quality deterioration across the Home Equity line of credit, Home Equity loan, prime first lien residential mortgage and private label card portfolios.
Loan impairment charges in US card and retail services rose, driven by portfolio seasoning and rising unemployment, particularly in the second half of 2008, higher levels of personal bankruptcy filings and lower recovery rates. As with mortgages, this was most notable in parts of the country most affected by house price falls and unemployment. Vehicle finance loan impairment charges rose as delinquencies rose and lower prices resulted in lower recoveries when repossessed vehicles were sold at auction.
Loan impairment charges in Commercial Banking grew to US$449 million from a low base, primarily driven by higher impairment losses due to deterioration across the middle market, commercial real estate and corporate banking portfolios in the US and among firms in the manufacturing, export and commercial real estate sectors in Canada. Higher loan impairment charges and other credit risk provisions in Global Banking and Markets reflected weaker credit fundamentals in the US in 2008.
Operating expenses increased by 90 per cent, driven by US$10.6 billion of impairment charge recognised in respect of North America Personal Financial Services in 2008 to fully write off goodwill. Excluding the goodwill impairment charge, expenses were US$1.1 billion or 11 per cent lower. Staff costs declined, primarily in HSBC Finance, following decisions taken in 2007 to close the acquisition channels for new business in Mortgage Services and a number of consumer lending branches, and integrate the operations of the card businesses. HSBC USA made the decision to close its wholesale and third-party correspondent mortgage business in November 2008, while HSBC Finance took the decision to cease originations in the dealer and direct-to-consumer channels in the vehicle finance business in July 2008. Staff costs in Global Banking and Markets also fell as performance-related compensation and staff numbers both declined.
Other administrative costs decreased as origination activity declined, marketing costs in card and retail services reduced and branch costs in consumer lending fell as tightened underwriting criteria curtailed business and led to branch closures. This was partly offset by higher marketing and occupancy costs in the retail bank reflecting a continued expansion of the branch network,
increased community investment activities and higher deposit insurance, collection, payments and cash management and asset management costs in support of business growth.
2007 compared with 2006
Economic briefing
In the US, GDP growth in 2007 was 2.2 per cent, 0.7 percentage points less than that recorded in 2006 as the housing-led downturn gathered pace. Consumer spending in 2007 grew by 2.9 per cent, the weakest annual expansion since 2003. Housing activity continued to weaken in 2007, with residential investment falling by 17 per cent during the year. Both new and existing home sales also declined to new lows in 2007. The unemployment rate averaged 4.6 per cent in 2007, with the average in the second half of the year slightly higher at 4.8 per cent. The trade deficit narrowed in 2007 as export growth strengthened. Consumer price inflation averaged around 4 per cent in the final quarter of 2007. This was largely due to higher energy prices; excluding food and energy, consumer price inflation averaged 2.3 per cent in the fourth quarter. The Federal Reserve lowered short-term interest rates by 100 basis points in the second half of 2007, from 5.25 per cent to 4.25 per cent, as policymakers attempted to mitigate the worst effects of the sub-prime related credit squeeze upon economic activity. 10-year note yields reached a high of 5.3 per cent in June 2007, before falling to 4 per cent by the year-end. Declines in the final months of 2007 left the S&P 500 stock market index practically unchanged compared with the end of 2006.
Canadian GDP increased by 2.4 per cent during the first eleven months of 2007 compared with the equivalent period of 2006. Domestic demand remained strong despite tighter credit conditions in the latter part of the year, supported by the robust labour market. The unemployment rate averaged 6 per cent for the year, reaching a historical low of 5.8 per cent in October. After hitting a high of 2.5 per cent in April, core consumer price inflation slowed to 1.5 per cent by the end of 2007. The Canadian dollar appreciated during the year, particularly in the second half. In July, the Bank of Canada raised its overnight interest rate from 4.25 per cent to 4.5 per cent before reversing this move in the final weeks of 2007.
Review of business performance
HSBC’s operations in North America experienced a significant fall in pre-tax profits of 98 per cent in 2007, on both reported and underlying bases.

H S B C H O L D I N G S P L C
Report of the Directors: Operating and Financial Review (continued)
Geographical regions > North America > 2007
124
Reconciliation of reported and underlying profit before tax
2007 compared with 2006
North America
2006 as reported US$m
2006 acquisitions and disposals1
US$m
Currency translation2
US$m
2006 at 2007 exchange rates6
US$m
2007 acquisitions, disposals & dilution gains1
US$m
Under- lying change US$m
2007 as reported US$m
Re- ported change %
Under- lying change %
Net interest income .......... 14,268 – 65 14,333 – 514 14,847 4 4 Net fee income ................. 4,766 – 26 4,792 – 1,018 5,810 22 21 Other income4 ................... 2,593 – 10 2,603 20 (497) 2,126 (18) (19)
Net operating income5 ...... 21,627 – 101 21,728 20 1,035 22,783 5 5
Loan impairment charges and other credit risk provisions .................... (6,796) – (3) (6,799) – (5,357) (12,156) (79) (79)
Net operating income ...... 14,831 – 98 14,929 20 (4,322) 10,627 (28) (29)
Operating expenses .......... (10,193) – (47) (10,240) (26) (290) (10,556) (4) (3)
Operating profit ............... 4,638 – 51 4,689 (6) (4,612) 71 (98) (98)
Income from associates ... 30 – 1 31 – (11) 20 (33) (35)
Profit before tax ............... 4,668 – 52 4,720 (6) (4,623) 91 (98) (98)
For footnotes, see page 143.
The US economy began to slow in the fourth quarter of 2007 and, increasingly, evidence suggested that some parts of the country were already in recession. As the housing market slump affected the real economy, the deterioration in credit quality that began in the mortgage services business extended to include other consumer finance businesses in the US. In HSBC, this was reflected in a 79 per cent rise in loan impairment charges and a loss before tax of US$1.5 billion in Personal Financial Services. In response to this, management took actions to manage exposure and realign the business, including stopping new mortgage purchases in mortgage services, tightening underwriting criteria, restricting the product range in consumer lending, decreasing credit lines and reducing the volume of balance transfers in credit cards, and restructuring the consumer lending branch network by closing some 400 branches of HSBC Finance to reflect expected lower demand. A loss of US$965 million in Global Banking and Markets arose from credit-related and liquidity event write-downs as asset-backed securities markets became illiquid and credit spreads widened markedly.
Net interest income rose by 4 per cent, as higher revenues from payments and cash management, commercial lending and cards were offset by lower mortgage balances, spread compression and higher non-performing balances.
Overall, average lending balances were 5 per cent higher, as growth in credit and private label cards and vehicle finance offset lower mortgage
balances. The benefits of higher volumes were largely offset as asset spreads narrowed due to higher funding costs. Also, although deposit balances rose, spreads reduced as the product mix shifted to higher yielding products. Business expansion and higher customer volumes drove growth in loans and deposits in Commercial Banking. A 43 per cent increase in revenue from payments and cash management was due to higher customer balances.
Net fee income rose as a result of higher personal card balances attracting late and over-limit fees. Fees from card services also rose, due to enhancement services on cards such as debt protection and identity protection. The Intellicheck service, which allows customers to pay their credit card balances over the telephone for a fee, proved popular with customers. Payments and cash management fees also increased on higher volumes generated. In the fourth quarter of 2007, HSBC changed fee practices on credit cards to ensure they fully reflected HSBC’s brand principles. This reduced income by US$55 million in 2007.
HSBC incurred a trading loss following write-downs in credit and structured derivatives, including US$282 million relating to monoline exposures, and in leveraged and acquisition finance, driven by deterioration in the credit market in the second half of the year. The write-downs were compounded by trading losses on purchased loans in the mortgage services’ wholesale business, in response to which HSBC closed the Decision One business. By

125
contrast, foreign exchange trading performance was strong, supported by activity generated by a weakening dollar and volatile markets.
Net income from financial instruments designated at fair value rose to US$1.8 billion, driven by significant fair value movements on HSBC’s own debt as a result of the widening of credit spreads and related derivatives in the second half of the year.
Gains less losses from financial investments of US$245 million were primarily attributable to the sale of shares in MasterCard.
Net earned insurance premiums decreased by 9 per cent to US$449 million, as the decline in loan volumes led to a fall in credit insurance sales and HSBC stopped reinsuring credit insurance for other lenders.
Other operating income decreased significantly, as higher losses were recorded on foreclosed properties due to the combined effect of an increase in the stock of such properties and a reduction in their value due to falling prices. In addition, there were lower gains on the sale of investments, mainly due to a significant one-off gain in the latter part of 2006.
Net insurance claims incurred and movement in liabilities to policyholders decreased by 7 per cent to US$241 million, in line with the change in net earned insurance premiums.
Loan impairment charges posted a steep rise, increasing by 79 per cent to US$12.2 billion, reflecting substantially higher charges in the US consumer finance loan book, primarily in mortgage lending but also in the credit cards portfolio in the final part of the year. The main factor driving this deterioration was the effect of the weaker housing market on both economic activity and the ability of borrowers to extend or refinance debt. In addition, seasoning and mix change within the credit cards portfolio and increases in bankruptcy filings after the exceptionally low levels seen in 2006, following changes in legislation, added to loan impairment charges.
The real estate secured portfolios experienced continuing deterioration in credit quality as a lack of demand for securitised sub-prime mortgages and falls in house prices severely restricted refinancing options for many customers. Loan impairment charges rose by 41 per cent to US$3.1 billion and by 139 per cent to US$4.1 billion in the mortgage services business and consumer lending,
respectively. Delinquency rates exceeded recent historical trends, particularly for those loans originated in 2005 and 2006. Performance was weakest in housing markets which had previously experienced the steepest home price appreciation, second lien products and stated income products.
US card services experienced a rise in loan impairment charges from a combination of factors, primarily a growth in balances, higher losses in the final part of the year as the economy slowed, a rise in bankruptcy rates to levels approaching those seen historically, and a shift in portfolio mix towards non-prime loans.
Loan impairment charges in Commercial Banking rose by 151 per cent to US$191 million, reflecting growth in the loan book, the increasing probability of default among commercial real estate loans in the US and a change in methodology for determining loan impairment allowances on a portfolio of revolving loans to small businesses. In addition, in Canada, loan impairment charges increased due to exposure to certain sectors affected by the strength of the Canadian dollar and an impairment charge for non-bank asset-backed commercial paper was also taken.
Operating expenses increased by 3 per cent, compared with growth in net operating income before loan impairment charges of 5 per cent. The retail bank branch network was extended both within and beyond the Group’s traditional spheres of operation to support the expansion of the Personal Financial Services and Commercial Banking businesses in the US and Canada. Premises and equipment expenses rose as a consequence. The consumer finance business incurred restructuring charges from the discontinuation of the wholesale and correspondent channels in mortgage services and the closing of branch offices in consumer lending. There were corresponding benefits in origination costs. The Canadian consumer finance business was also restructured in a similar fashion to the US. The business incurred US$70 million of one-off costs arising from the indemnification agreement with Visa ahead of Visa’s planned IPO. In the cards and consumer lending businesses, communication expenses increased due to higher mailing volumes on cards and consumer lending as credit collection policies were tightened. In the third quarter, however, expenditure on card marketing declined in line with a decision to slow lending growth.
Share of profit in associates and joint ventures declined to US$20 million.

H S B C H O L D I N G S P L C
Report of the Directors: Business Review (continued)
Geographical regions > North America > Profit/loss before tax by customer group
126
Analysis by customer group and global business
Profit/(loss) before tax
2008
North America
Personal Financial Services US$m
Commercial Banking US$m
Global Banking & Markets US$m
Private Banking US$m
Other
US$m
Inter- segment elimination21
US$m Total US$m
Net interest income ..................... 12,632 1,480 1,064 224 22 (204) 15,218
Net fee income/(expense) ........... 3,896 391 818 181 (59) – 5,227
Trading income/(expense) excluding net interest income (250) 5 (3,516) 10 (128) – (3,879)
Net interest income/(expense) on trading activities ................ 66 – 584 – (110) 204 744
Net trading income/(expense)16 .. (184) 5 (2,932) 10 (238) 204 (3,135)
Changes in fair value of long- term debt issued and related derivatives .............................. – – – – 3,736 – 3,736
Net income/(expense) from other financial instruments designated at fair value ........... (2) – (1) – 4 – 1
Net income/(expense) from financial instruments designated at fair value ........... (2) – (1) – 3,740 – 3,737
Gains less losses from financial investments ............................. 65 5 (209) – 19 – (120)
Dividend income ......................... 36 11 27 3 – – 77 Net earned insurance premiums . 390 – – – – – 390 Other operating income/
(expense) ................................ (426) 140 240 20 1,419 (1,370) 23
Total operating income/(expense) ................... 16,407 2,032 (993) 438 4,903 (1,370) 21,417
Net insurance claims17 ................ (238) – – – – – (238)
Net operating income/ (expense)5 ............................... 16,169 2,032 (993) 438 4,903 (1,370) 21,179
Loan impairment charges and other credit risk provisions ..... (16,132) (449) (198) (16) – – (16,795)
Net operating income/ (expense) ................................ 37 1,583 (1,191) 422 4,903 (1,370) 4,384
Operating expenses (excluding goodwill impairment) ............. (6,701) (937) (1,384) (339) (1,368) 1,370 (9,359)
Goodwill impairment .................. (10,564) – – – – – (10,564)
Operating profit/(loss) .............. (17,228) 646 (2,575) 83 3,535 – (15,539)
Share of profit/(loss) in associates and joint ventures .. – 12 – – (1) – 11
Profit/(loss) before tax .............. (17,228) 658 (2,575) 83 3,534 – (15,528) % % % % % % Share of HSBC’s profit
before tax ................................ (185.1) 7.1 (27.7) 0.9 38.0 (166.8)Cost efficiency ratio ................... 106.8 46.1 (139.4) 77.4 27.9 94.1 Balance sheet data15 US$m US$m US$m US$m US$m US$m Loans and advances to
customers (net) ....................... 179,663 35,725 35,583 5,243 – 256,214 Total assets ................................. 192,240 42,211 318,139 7,054 3,323 (10,355) 552,612 Customer accounts ...................... 65,830 39,105 23,844 14,657 96 143,532
For footnotes, see page 143.
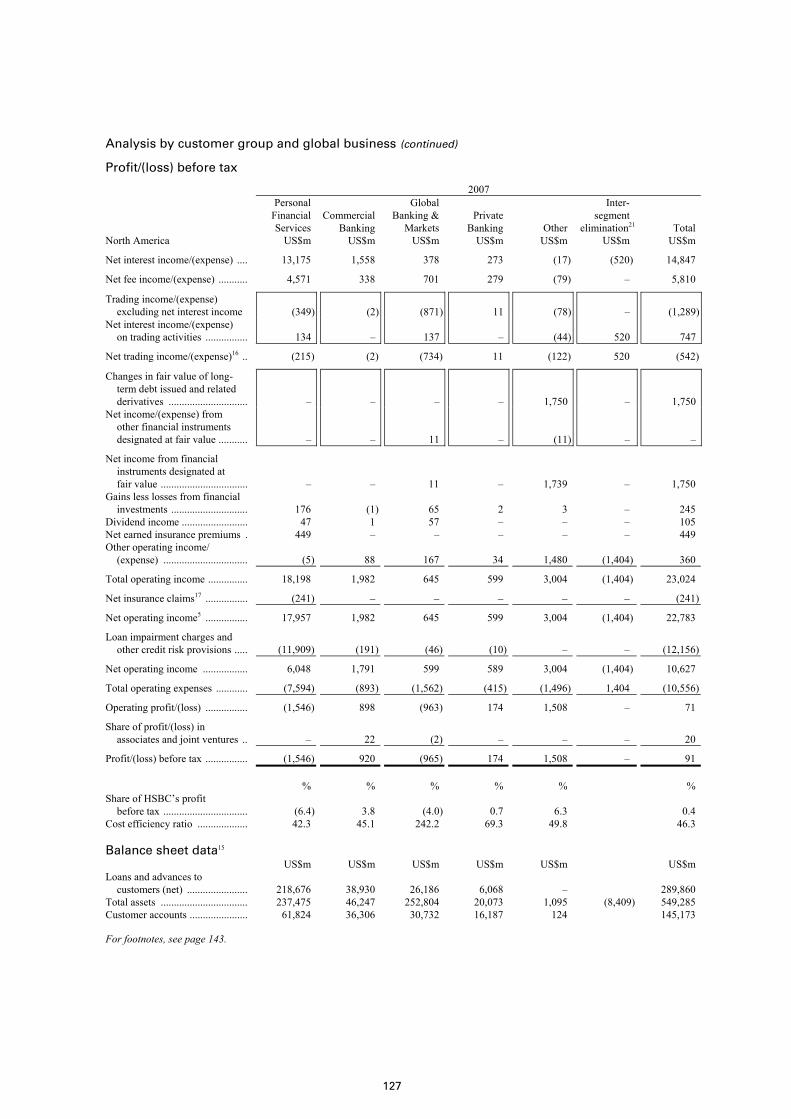
127
Analysis by customer group and global business (continued) Profit/(loss) before tax
2007
North America
Personal Financial Services US$m
Commercial Banking US$m
Global Banking & Markets US$m
Private Banking US$m
Other
US$m
Inter- segment elimination21
US$m Total US$m
Net interest income/(expense) .... 13,175 1,558 378 273 (17) (520) 14,847
Net fee income/(expense) ........... 4,571 338 701 279 (79) – 5,810
Trading income/(expense) excluding net interest income (349) (2) (871) 11 (78) – (1,289)
Net interest income/(expense) on trading activities ................ 134 – 137 – (44) 520 747
Net trading income/(expense)16 .. (215) (2) (734) 11 (122) 520 (542)
Changes in fair value of long- term debt issued and related derivatives .............................. – – – – 1,750 – 1,750
Net income/(expense) from other financial instruments designated at fair value ........... – – 11 – (11) – –
Net income from financial instruments designated at fair value ................................. – – 11 – 1,739 – 1,750
Gains less losses from financial investments ............................. 176 (1) 65 2 3 – 245
Dividend income ......................... 47 1 57 – – – 105 Net earned insurance premiums . 449 – – – – – 449 Other operating income/
(expense) ................................ (5) 88 167 34 1,480 (1,404) 360
Total operating income ............... 18,198 1,982 645 599 3,004 (1,404) 23,024
Net insurance claims17 ................ (241) – – – – – (241)
Net operating income5 ................ 17,957 1,982 645 599 3,004 (1,404) 22,783
Loan impairment charges and other credit risk provisions ..... (11,909) (191) (46) (10) – – (12,156)
Net operating income ................. 6,048 1,791 599 589 3,004 (1,404) 10,627
Total operating expenses ............ (7,594) (893) (1,562) (415) (1,496) 1,404 (10,556)
Operating profit/(loss) ................ (1,546) 898 (963) 174 1,508 – 71
Share of profit/(loss) in associates and joint ventures .. – 22 (2) – – – 20
Profit/(loss) before tax ................ (1,546) 920 (965) 174 1,508 – 91 % % % % % % Share of HSBC’s profit
before tax ................................ (6.4) 3.8 (4.0) 0.7 6.3 0.4 Cost efficiency ratio ................... 42.3 45.1 242.2 69.3 49.8 46.3 Balance sheet data15 US$m US$m US$m US$m US$m US$m Loans and advances to
customers (net) ....................... 218,676 38,930 26,186 6,068 – 289,860 Total assets ................................. 237,475 46,247 252,804 20,073 1,095 (8,409) 549,285 Customer accounts ...................... 61,824 36,306 30,732 16,187 124 145,173
For footnotes, see page 143.

H S B C H O L D I N G S P L C
Report of the Directors: Operating and Financial Review (continued)
Geographical regions > North America > Profit/loss before tax by customer group // Latin America
128
Profit/(loss) before tax
2006
North America
Personal Financial Services US$m
Commercial Banking US$m
Global Banking & Markets US$m
Private Banking US$m
Other
US$m
Inter- segment elimination21 US$m
Total US$m
Net interest income/(expense) .... 12,964 1,362 266 212 (52) (484) 14,268
Net fee income/(expense) ........... 3,675 329 656 240 (134) – 4,766
Trading income/(expense) excluding net interest income 66 13 746 12 (220) – 617
Net interest income/(expense) on trading activities ................ 208 – 72 – (23) 484 741
Net trading income/(expense)16 .. 274 13 818 12 (243) 484 1,358
Changes in fair value of long- term debt issued and related derivatives .............................. – – – – (63) – (63)
Net income/(expense) from other financial instruments designated at fair value ........... – – (11) – 11 – –
Net expense from financial instruments designated at fair value ................................. – – (11) – (52) – (63)
Gains less losses from financial investments ............................. 14 19 12 9 4 – 58
Dividend income ......................... 23 1 61 – – – 85 Net earned insurance premiums . 492 – – – – – 492 Other operating income .............. 270 87 269 31 1,536 (1,271) 922
Total operating income ............... 17,712 1,811 2,071 504 1,059 (1,271) 21,886
Net insurance claims17 ................ (259) – – – – – (259)
Net operating income5 ................ 17,453 1,811 2,071 504 1,059 (1,271) 21,627
Loan impairment charges and other credit risk provisions ..... (6,683) (74) (3) (35) (1) – (6,796)
Net operating income ................. 10,770 1,737 2,068 469 1,058 (1,271) 14,831
Total operating expenses ............ (7,379) (814) (1,641) (355) (1,275) 1,271 (10,193)
Operating profit/(loss) ................ 3,391 923 427 114 (217) – 4,638
Share of profit/(loss) in associates and joint ventures .. – 34 (4) – – – 30
Profit/(loss) before tax ................ 3,391 957 423 114 (217) – 4,668 % % % % % % Share of HSBC’s profit
before tax ................................ 15.4 4.3 1.9 0.5 (1.0) 21.1 Cost efficiency ratio ................... 42.3 44.9 79.2 70.4 120.4 47.1 Balance sheet data15 US$m US$m US$m US$m US$m US$m Loans and advances to
customers (net) ....................... 220,517 34,651 17,215 5,604 – 277,987 Total assets ................................. 252,725 43,665 203,639 7,334 1,898 (3,623) 505,638 Customer accounts ...................... 54,099 31,066 23,711 11,938 108 120,922
For footnotes, see page 143.

129
Latin America
Profit/(loss) before tax by country within customer groups and global businesses
Personal Financial Services US$m
Commercial Banking US$m
Global Banking & Markets US$m
Private Banking US$m
Other US$m
Total US$m
2008 Argentina .......................................................... – 111 113 – – 224 Brazil ................................................................. 250 348 298 8 6 910 Mexico .............................................................. 360 157 190 7 – 714 Panama .............................................................. 51 37 33 – – 121 Other ................................................................. 7 53 7 1 – 68
668 706 641 16 6 2,037 2007 Argentina .......................................................... 36 75 90 – – 201 Brazil ................................................................. 293 286 297 9 (6) 879 Mexico .............................................................. 514 333 113 11 9 980 Panama .............................................................. 45 18 16 7 – 86 Other ................................................................. 5 28 1 (2) – 32
893 740 517 25 3 2,178 2006 Argentina .......................................................... 35 51 68 – 3 157 Brazil ................................................................. 121 185 218 6 (4) 526 Mexico .............................................................. 628 197 177 7 – 1,009 Panama .............................................................. 16 13 10 – – 39 Other ................................................................. – 5 2 1 (4) 4
800 451 475 14 (5) 1,735
Loans and advances to customers (net) by country
At 31 December 2008
US$m 2007
US$m 2006
US$m
Argentina ......................................................................................................... 2,356 2,485 1,912 Brazil ................................................................................................................ 18,255 18,491 11,469 Mexico ............................................................................................................. 12,211 18,059 14,294 Panama ............................................................................................................. 4,538 4,158 4,178 Other ................................................................................................................ 4,927 4,730 3,938
42,287 47,923 35,791
Customer accounts by country
At 31 December 2008
US$m 2007
US$m 2006
US$m
Argentina ......................................................................................................... 2,988 2,779 2,470 Brazil ................................................................................................................ 27,857 26,231 19,946 Mexico ............................................................................................................. 17,652 22,307 19,775 Panama ............................................................................................................. 5,185 5,062 5,031 Other ................................................................................................................ 5,761 4,913 3,639
59,443 61,292 50,861

H S B C H O L D I N G S P L C
Report of the Directors: Operating and Financial Review (continued)
Geographical regions > Latin America > 2008
130
Profit before tax
2008 2007 2006 Latin America US$m US$m US$m
Net interest income .......................................................................................... 6,458 5,576 4,197
Net fee income ................................................................................................. 2,167 2,153 1,630
Net trading income .......................................................................................... 701 548 537
Changes in fair value of long-term debt issued and related derivatives ......... – – –Net income from other financial instruments designated at fair value ........... 364 320 237
Net income from financial instruments designated at fair value .................... 364 320 237 Gains less losses from financial investments .................................................. 176 253 84 Gains arising from dilution of interests in associates ...................................... – 11 – Dividend income .............................................................................................. 20 9 6 Net earned insurance premiums ...................................................................... 1,717 1,594 1,076 Other operating income ................................................................................... 300 228 91
Total operating income ................................................................................. 11,903 10,692 7,858
Net insurance claims incurred and movement in liabilities to policyholders .......................................................................................... (1,390) (1,427) (1,023)
Net operating income before loan impairment charges and other credit risk provisions ................................................................................ 10,513 9,265 6,835
Loan impairment charges and other credit risk provisions ............................. (2,492) (1,697) (938)
Net operating income .................................................................................... 8,021 7,568 5,897
Total operating expenses ................................................................................. (5,990) (5,402) (4,166)
Operating profit ............................................................................................. 2,031 2,166 1,731
Share of profit in associates and joint ventures ............................................... 6 12 4
Profit before tax ............................................................................................. 2,037 2,178 1,735 % % %
Share of HSBC’s profit before tax .................................................................. 21.9 9.0 7.9 Cost efficiency ratio ........................................................................................ 57.0 58.3 61.0
Year-end staff numbers (full-time equivalent) ................................................ 58,559 64,404 64,900 Balance sheet data15 At 31 December 2008 2007 2006 US$m US$m US$m
Loans and advances to customers (net) ........................................................... 42,287 47,923 35,791 Loans and advances to banks (net) .................................................................. 14,572 12,675 12,634 Trading assets, financial assets designated at fair value, and
financial investments ................................................................................... 18,753 24,715 20,497 Total assets ...................................................................................................... 97,944 101,088 82,169 Deposits by banks ............................................................................................ 5,598 4,092 5,267 Customer accounts ........................................................................................... 59,443 61,292 50,861
For footnote, see page 143. All commentaries on Latin America are on an underlying basis unless stated otherwise.
2008 compared with 2007
Economic briefing
Inflationary pressures developed in Mexico during the course of 2008, mostly due to rising commodity prices, as consumer price inflation accelerated from 3.7 per cent in January to 6.5 per cent by the year-end. In response, the Bank of Mexico raised its overnight interest rate by 75 basis points to 8.25 per cent by the end of the year, although a variety of
economic indicators pointed to a sharp loss of momentum during the final quarter as global growth slowed.
The Brazilian economy performed strongly during the first half of 2008, driven by domestic demand, with the annual rate of consumer price inflation rising from 4.6 per cent in January to 6.4 per cent in July, towards the upper limit of the central banks’ tolerance range. Conditions within the labour market improved, with the rate of

131
unemployment well below levels observed a year earlier. In line with many other economies within the region, however, conditions weakened markedly towards the end of 2008, with industrial production falling by close to 20 per cent during the fourth quarter.
In Argentina, economic activity held at a reasonably robust level for much of the year, although measures of industrial production growth slowed noticeably during the final months of 2008.
Declines in commodity prices during the second half of 2008 and the reduced value of exports raised concerns over the level of capital outflow from the country, while domestic currency interest rates increased sharply. The official headline rate of consumer price inflation rose during the first half of 2008, reaching 9.3 per cent in June 2008 before slowing to 7.2 per cent in December, although methodological changes make comparisons over year difficult.
Reconciliation of reported and underlying profit before tax
2008 compared with 2007
Latin America
2007 as reported US$m
2007 acquisitions, disposals & dilution gains1
US$m
Currency translation2
US$m
2007 at 2008 exchange rates3
US$m
2008 acquisitions and disposals1
US$m
Under- lying change US$m
2008 as reported US$m
Re- ported change %
Under- lying change %
Net interest income .......... 5,576 – 155 5,731 – 727 6,458 16 13 Net fee income ................. 2,153 – 58 2,211 – (44) 2,167 1 (2)Other income4 ................... 1,536 (11) 23 1,548 71 269 1,888 23 17
Net operating income5 .... 9,265 (11) 236 9,490 71 952 10,513 13 10
Loan impairment charges and other credit risk provisions .................... (1,697) – (64) (1,761) – (731) (2,492) (47) (42)
Net operating income .... 7,568 (11) 172 7,729 71 221 8,021 6 3
Operating expenses .......... (5,402) – (190) (5,592) – (398) (5,990) (11) (7)
Operating profit ............. 2,166 (11) (18) 2,137 71 (177) 2,031 (6) (8)
Income from associates ... 12 – – 12 – (6) 6 (50) (50)
Profit before tax ............. 2,178 (11) (18) 2,149 71 (183) 2,037 (6) (9)
For footnotes, see page 143.
Review of business performance
In Latin America, HSBC reported a pre-tax profit of US$2.0 billion compared with US$2.2 billion in 2007, a decrease of 6 per cent. On an underlying basis, pre-tax profits decreased by 9 per cent as increased revenues were offset by higher loan impairment charges, largely in Mexico and Brazil, and increased operating costs across the region.
Net interest income increased by 13 per cent. Growth in average personal lending volumes was mainly driven by vehicle finance and payroll loans in Brazil, and credit cards and personal loans in Mexico. Average credit card balances increased as a result of significant organic growth in 2007 which was not repeated in 2008. Commercial loan volume growth was driven by increased lending for working capital and trade finance loans in Brazil, and medium-sized businesses and the real estate sector in Mexico. Increased income on customer liabilities, which was driven by volume growth, particularly in
time deposits, was largely offset by a contraction in deposit spreads, primarily on US dollar denominated accounts. Active repricing strategies were deployed to mitigate spread compression in the region and to better reflect the credit risk on the loan portfolio. Lower overall spreads on lending products were partly offset by increases in cards in the region, small business loans in Mexico and overdrafts in Brazil. In Argentina, spreads on most products widened.
Net fee income decreased by 2 per cent following a ruling by the Brazilian Central Bank reducing or eliminating certain fees such as charges on early loan repayments and returned cheques. Lower transaction volumes in Personal Financial Services in Brazil also reduced fee income. These were partly offset by product repricing, the introduction of new fees and volume growth, particularly in cards, personal loans, packaged deposit products and payments and cash management.

H S B C H O L D I N G S P L C
Report of the Directors: Operating and Financial Review (continued)
Geographical regions > Latin America > 2008 / 2007
132
Trading income rose by 22 per cent largely reflecting favourable positioning against foreign exchange movements and increased foreign exchange sales volumes. Trading losses were registered on certain transactions where an offsetting benefit is reported in net income from financial instruments designated at fair value. Losses from defaults on derivative contracts were registered, primarily in Mexico.
Gains less losses from financial investments declined by 24 per cent as gains on the redemption of VISA shares, following its global IPO, and the sale of shares in both Brazil and Mexico were lower than the gains achieved on the sale of shares in a number of companies in Brazil in 2007.
Net earned insurance premiums rose, driven by higher prices and increased sales in the general insurance business, primarily in Argentina. Sales of life assurance products remained strong.
Increased net insurance claims incurred and movements in liabilities to policyholders in Argentina were more than offset by a decrease in liabilities to policyholders in Brazil following a decline in the equity market where the investment losses were passed on to unit-linked policyholders. This was compensated for by a similar decrease in net income from financial instruments designated at fair value.
Other operating income was broadly in line with 2007. A refinement of the income recognition methodology used in respect of long-term insurance contracts in Brazil in 2008 was offset by a similar adjustment in Mexico in 2007.
Loan impairment charges and other credit risk provisions rose by 42 per cent, mainly relating to credit cards, as organically grown portfolios in Mexico seasoned following market share growth and credit quality deteriorated in Mexico and Brazil. The personal unsecured, vehicle finance and small and medium-sized commercial loan portfolios in Brazil also experienced increased levels of loan impairment. Specific focus was placed on improving the quality of new business, based on underwriting experience and relationship management, and steps were taken to improve collection strategies.
Operating expenses increased by 7 per cent. An increase in staff costs was primarily driven by higher salaries following union-agreed pay rises and redundancy payments following reductions in staff numbers, partly offset by cost savings from the reduced headcount. Administrative expenses rose following an increase in the use of a credit card cashback promotional facility in Mexico which was
terminated at the end of 2008. Costs also grew in support of improved operational processes in the region. HSBC benefited in 2008 from the recognition of a tax credit following a court ruling in Brazil granting the right to recover excess taxes paid on insurance transactions and changes in transactional tax legislation. As economic conditions weakened towards the second half of 2008, strategic cost saving measures were implemented throughout the region.
2007 compared with 2006
Economic briefing
In response to fluctuations in export demand from the US, economic growth in Mexico moderated during the course of 2007, with GDP rising an estimated 3.1 per cent during the year, compared with 4.8 per cent in 2006. Inflationary pressures remained significant throughout 2007, with consumer price inflation averaging 4 per cent, driven by increases in international prices of commodities, which affected domestic food prices in the core index. As a result, the Bank of Mexico raised its overnight interest rate by a total of 50 basis points, and has maintained its restrictive monetary policy despite reductions in interest rates by the US Federal Reserve.
The Brazilian economy expanded strongly in 2007, with GDP expected to have grown by 5.4 per cent compared with 3.7 per cent in 2006. As in 2006, growth was driven by domestic demand, with private consumption rising considerably. As a consequence, the average unemployment rate fell to 9.3 per cent in 2007 from 10 per cent in 2006. After declining to 3.1 per cent at the end of 2006, the annual rate of consumer price inflation climbed to 4.5 per cent by December 2007, mainly from higher food prices. The cycle of monetary easing which began in the third quarter of 2005 paused in October 2007 with the overnight rate at 11.25 per cent, the lowest level in several decades. After nine years of steady expansion, the trade balance surplus fell slightly in 2007, and is expected to decrease further in 2008. Balance of payments fundamentals, however, remained robust and, as a result, the Brazilian economy seemed less vulnerable to external shocks than in previous years.
The Argentine economy also performed strongly in 2007, with GDP expected to have risen by 8.7 per cent. This strength was a consequence of several factors such as a competitive exchange rate, spare capacity in the economy and a generally favourable external environment, which helped Argentina extend its fiscal and external surpluses

133
into a fourth successive year. Less encouraging was the fact that inflation accelerated to about 13 per cent, up from 10 per cent in 2006. Although food inflation was part of the explanation, rapid demand growth was also a factor. 2007 was an election year, and as a result the rate of growth of fiscal spending doubled to 45 per cent on an annual basis. As a consequence, the primary surplus fell by around 1.2 per cent of GDP.
Throughout the region as a whole, GDP growth roughly matched that of 2006. The slowdown in Mexico provided a contrast to better performances elsewhere in Central and Southern America. Central America grew by an estimated 6.3 per cent, up from 5.9 per cent in 2006 while, in South America, growth
was an estimated 5.8 per cent, up from 5.3 per cent in 2006. The most dynamic economies in Central America were Panama (10.0 per cent growth in GDP) and the Dominican Republic (8.0 per cent), followed by Costa Rica (6.2 per cent) and Honduras (6.2 per cent). In South America, the fastest growing countries after Argentina were Peru (7.2 per cent growth in GDP), Venezuela (7.0 per cent) and Colombia (6.5 per cent). In general, inflation appears to be under control in Latin America, averaging around 5 per cent over the past three years. Only Venezuela and Argentina have experienced double-digit inflation, while the US dollar-based economies of Panama, Ecuador and El Salvador have better inflationary records.
Reconciliation of reported and underlying profit before tax
2007 compared with 2006
Latin America
2006 as reported US$m
2006 acquisitions and disposals1
US$m Currency translation2
US$m
2006 at 2007 exchange rates6
US$m
2007 acquisitions, disposals & dilution gains1
US$m
Under- lying change US$m
2007 as reported US$m
Re- ported change %
Under- lying change %
Net interest income .......... 4,197 – 261 4,458 375 743 5,576 33 17 Net fee income ................. 1,630 – 86 1,716 86 351 2,153 32 20 Other income4 ................... 1,008 – 60 1,068 102 366 1,536 52 34
Net operating income5 ...... 6,835 – 407 7,242 563 1,460 9,265 36 20
Loan impairment charges and other credit risk provisions .................... (938) – (81) (1,019) (133) (545) (1,697) (81) (53)
Net operating income ...... 5,897 – 326 6,223 430 915 7,568 28 15
Operating expenses .......... (4,166) – (258) (4,424) (320) (658) (5,402) (30) (15)
Operating profit ............... 1,731 – 68 1,799 110 257 2,166 25 14
Income from associates ... 4 – – 4 9 (1) 12 200 (25)
Profit before tax ............... 1,735 – 68 1,803 119 256 2,178 26 14
For footnotes, see page 143.
Review of business performance
HSBC’s operations in Latin America reported a pre-tax profit of US$2.2 billion compared with US$1.7 billion in 2006, representing an increase of 26 per cent. The Group’s acquisitions of HSBC Bank Panama and Banca Nazionale in 2006 strengthened the existing business platform and geographical representation. On an underlying basis, pre-tax profits rose by 14 per cent as increased revenues were partly offset by higher loan impairment charges, largely from Mexico, and a rise in operating costs.
Notable contributions to Commercial Banking’s pre-tax profits, which were 64 per cent higher than in 2006, arose in Brazil from small and mid-market enterprises and in Mexico from larger corporates.
In Personal Financial Services, profit before tax increased by 12 per cent as strong growth in revenues was partly offset by increased loan impairment charges in Mexico. Profit before tax in Global Banking and Markets increased as strong growth in net fee and net interest income was partly offset by a decrease in trading income and higher costs related to business expansion.
Notwithstanding continuing investment and integration costs throughout the region, the cost efficiency ratio improved by 2.7 percentage points to 58.3 per cent.
Net interest income increased by 17 per cent. Growth was strong across the region, with net interest

H S B C H O L D I N G S P L C
Report of the Directors: Operating and Financial Review (continued)
Geographical regions > Latin America > Profit/(loss) before tax by customer group
134
income rising by 22 per cent and 11 per cent in Mexico and Brazil, respectively.
In Mexico, net interest income rose despite a fall in balance sheet management revenues due to growth in both assets and liabilities. In particular, credit card balances increased, driven by marketing and portfolio management initiatives designed to improve customer retention and card usage. Volume growth was achieved in mortgages, commercial real estate lending, trade and factoring. Customer relationship management campaigns resulted in new customer acquisitions and increased cross-selling. Net interest income in Brazil increased as the sound economic outlook and falling interest rates resulted in strong demand for credit.
Fee income rose by 20 per cent, primarily driven by robust business growth across the region. In Mexico, the use of debit and credit cards grew, in part because of the growing ATM network and the number of cards in force, which drove commissions from ATM cash withdrawals and point of sale billing. Stricter guidelines on the imposition of late payment fees also led to higher income.
A strategy to migrate more transactions to internet-based services resulted in higher payment and cash management transactions as the number of active customers rose.
Current account income increased as a result of a re-pricing exercise and a rise in volumes. Fees from loans and funds under management also grew on higher volumes. Strong growth in customer accounts delivered higher transactional fees and the continuing success of the Tu Cuenta product in Mexico led to increased take-up with higher product fees charged to customers.
Net income from trading activities decreased by 4 per cent, mainly due to reduced trading opportunities in Credit and Rates. This was partly offset by income growth from foreign exchange trading, driven by continuing market volatility.
Net gains from financial investments rose significantly following a gain on sale of shares held in a credit bureau, a stock exchange and a derivatives exchange in Brazil.
The continued growth of insurance operations in the region, achieved by increasing HSBC’s product offerings and expanding its distribution channels, along with targeted sales initiatives, led to higher net insurance claims incurred and movements in liabilities to policyholders.
A 97 per cent increase in other operating income reflected the recognition of the embedded value calculation on the PVIF life assurance business in Mexico. The improvement on 2006 was also aided by the non-recurrence of a loss on sale of a portfolio of assets during that year and sundry gains on foreclosed assets in 2007.
Loan impairment charges rose sharply, by 53 per cent to US$1.7 billion, mainly driven by portfolio growth, normal seasoning and higher delinquency rates on credit cards in Mexico, following a targeted expansion in market share. Loan impairment charges for small and medium-sized businesses lending and delinquencies on loans to the self-employed also increased in Mexico. Partly offsetting these developments was an improvement in personal and commercial delinquency rates in Brazil.
Continuing investment and business expansion resulted in an increase in operating expenses of 15 per cent. This compared favourably with growth in net operating income before loan impairment charges of 20 per cent. Staff costs rose, primarily on higher salaries and bonuses in the region, driven by the need to support business growth, union-agreed pay rises and one-off costs incurred in Brazil to improve operational efficiencies. These were partially offset by a curtailment and settlement gain in Mexico from staff transferring from the Group’s defined benefit healthcare scheme to a new defined contribution scheme.
Increases in non-staff costs included higher marketing expenditure in support of growth in credit card operations, continued investment in infrastructure to support business growth and a rise in telecommunication costs and transactional taxes. Four additional months of Banca Nazionale expenses also increased costs.

135
Analysis by customer group and global business
Profit/(loss) before tax
2008
Latin America
Personal Financial Services US$m
Commercial Banking US$m
Global Banking & Markets US$m
Private Banking US$m
Other
US$m
Inter- segment elimination21 US$m
Total US$m
Net interest income ..................... 4,582 1,637 579 22 (35) (327) 6,458
Net fee income ............................ 1,339 536 248 35 9 – 2,167
Trading income excluding net interest income ....................... 123 27 200 3 4 – 356
Net interest income/(expense) on trading activities ................ 7 4 8 – (2) 327 345
Net trading income16 ................... 130 31 208 3 2 327 701
Changes in fair value of long- term debt issued and related derivatives .................. – – – – – – –
Net income from other financial instruments designated at fair value ....................................... 187 – 139 – 38 – 364
Net income from financial instruments designated at fair value ................................. 187 – 139 – 38 – 364
Gains less losses from financial investments ............................. 132 21 21 2 – – 176
Dividend income ......................... 16 1 3 – – – 20 Net earned insurance premiums . 1,547 82 88 – – – 1,717 Other operating income .............. 244 57 39 3 8 (51) 300
Total operating income ............ 8,177 2,365 1,325 65 22 (51) 11,903
Net insurance claims17 ................ (1,281) (42) (68) – 1 – (1,390)
Net operating income5 .............. 6,896 2,323 1,257 65 23 (51) 10,513
Loan impairment charges and other credit risk provisions ..... (2,120) (340) (29) – (3) – (2,492)
Net operating income ............... 4,776 1,983 1,228 65 20 (51) 8,021
Total operating expenses ............ (4,114) (1,277) (587) (49) (14) 51 (5,990)
Operating profit ........................ 662 706 641 16 6 – 2,031
Share of profit in associates and joint ventures ................... 6 – – – – – 6
Profit before tax ........................ 668 706 641 16 6 – 2,037 % % % % % % Share of HSBC’s profit
before tax ................................ 7.2 7.6 6.9 0.2 – 21.9 Cost efficiency ratio ................... 59.7 55.0 46.7 75.4 60.9 57.0 Balance sheet data15 US$m US$m US$m US$m US$m US$m Loans and advances to
customers (net) ....................... 18,523 15,460 8,273 31 – 42,287 Total assets ................................. 30,320 19,382 48,868 391 361 (1,378) 97,944 Customer accounts ...................... 27,564 14,367 15,384 2,128 – 59,443
For footnotes, see page 143.

H S B C H O L D I N G S P L C
Report of the Directors: Operating and Financial Review (continued)
Geographical regions > Latin America > Profit/(loss) before tax by customer group
136
Analysis by customer group and global business (continued)
Profit/(loss) before tax
2007
Latin America
Personal Financial Services US$m
Commercial Banking US$m
Global Banking & Markets US$m
Private Banking US$m
Other
US$m
Inter- segment elimination21 US$m
Total US$m
Net interest income ..................... 3,983 1,407 410 20 3 (247) 5,576
Net fee income ............................ 1,372 485 250 40 6 – 2,153
Trading income excluding net interest income ....................... 67 39 164 2 – – 272
Net interest income on trading activities ..................... 10 1 18 – – 247 276
Net trading income16 ................... 77 40 182 2 – 247 548
Changes in fair value of long- term debt issued and related derivatives .................. – – – – – – –
Net income from other financial instruments designated at fair value ....................................... 314 – 6 – – – 320
Net income from financial instruments designated at fair value ................................. 314 – 6 – – – 320
Gains less losses from financial investments ............................. 120 51 82 1 (1) – 253
Gains arising from dilution of interests in associates ............. – – – – 11 – 11
Dividend income ......................... 5 2 2 – – – 9 Net earned insurance premiums . 1,448 66 80 – – – 1,594 Other operating income .............. 145 69 31 8 12 (37) 228
Total operating income ............... 7,464 2,120 1,043 71 31 (37) 10,692
Net insurance claims17 ................ (1,330) (37) (60) – – – (1,427)
Net operating income5 ................ 6,134 2,083 983 71 31 (37) 9,265
Loan impairment (charges)/ recoveries and other credit risk provisions ........................ (1,492) (212) 13 – (6) – (1,697)
Net operating income ................. 4,642 1,871 996 71 25 (37) 7,568
Total operating expenses ............ (3,758) (1,132) (481) (46) (22) 37 (5,402)
Operating profit .......................... 884 739 515 25 3 – 2,166
Share of profit in associates and joint ventures ................... 9 1 2 – – – 12
Profit before tax .......................... 893 740 517 25 3 – 2,178 % % % % % % Share of HSBC’s profit
before tax ................................ 3.7 3.1 2.1 0.1 – 9.0 Cost efficiency ratio ................... 61.3 54.3 48.9 64.8 71.0 58.3 Balance sheet data15 US$m US$m US$m US$m US$m US$m Loans and advances to
customers (net) ....................... 21,680 16,243 9,935 65 – 47,923 Total assets ................................. 35,181 21,049 45,045 302 261 (750) 101,088 Customer accounts ...................... 30,628 15,524 13,950 1,190 – 61,292
For footnotes, see page 143.

137
Profit/(loss) before tax
2006
Latin America
Personal Financial Services US$m
Commercial Banking US$m
Global Banking & Markets US$m
Private Banking US$m
Other
US$m
Inter- segment elimination21 US$m
Total US$m
Net interest income/(expense) .... 3,057 1,037 325 13 (2) (233) 4,197
Net fee income ............................ 1,053 387 167 23 – – 1,630
Trading income excluding net interest income ....................... 61 21 218 1 – – 301
Net interest income/(expense) on trading activities ................ 14 5 (16) – – 233 236
Net trading income16 ................... 75 26 202 1 – 233 537
Changes in fair value of long-term debt issued and related derivatives .............................. – – – – – – –
Net income from other financial instruments designated at fair value ....................................... 227 – 11 – (1) – 237
Net income/(expense) from financial instruments designated at fair value ........... 227 – 11 – (1) – 237
Gains less losses from financial investments ............................. 11 1 72 – – – 84
Dividend income ......................... 5 1 – – – – 6 Net earned insurance premiums . 992 27 59 – (2) – 1,076 Other operating income .............. 74 7 10 4 14 (18) 91
Total operating income ............... 5,494 1,486 846 41 9 (18) 7,858
Net insurance claims17 ................ (957) (16) (51) – 1 – (1,023)
Net operating income5 ................ 4,537 1,470 795 41 10 (18) 6,835
Loan impairment (charges)/ recoveries and other credit risk provisions ........................ (764) (197) 26 – (3) – (938)
Net operating income ................. 3,773 1,273 821 41 7 (18) 5,897
Total operating expenses ............ (2,977) (822) (346) (27) (12) 18 (4,166)
Operating profit/(loss) ................ 796 451 475 14 (5) – 1,731
Share of profit in associates and joint ventures ................... 4 – – – – – 4
Profit/(loss) before tax ................ 800 451 475 14 (5) – 1,735 % % % % % % Share of HSBC’s profit
before tax ................................ 3.6 2.0 2.2 0.1 – 7.9 Cost efficiency ratio ................... 65.6 55.9 43.5 65.9 120.0 61.0 Balance sheet data15 US$m US$m US$m US$m US$m US$m Loans and advances to
customers (net) ....................... 16,165 11,463 8,147 16 – 35,791 Total assets ................................. 28,237 16,599 37,564 90 344 (665) 82,169 Customer accounts ...................... 25,200 13,754 11,685 222 – 50,861
For footnotes, see page 143.

H S B C H O L D I N G S P L C
Report of the Directors: Operating and Financial Review (continued)
Products and services
138
Products and services
Personal Financial Services
Personal Financial Services provides over 105 million individual and self-employed customers with financial services in 62 countries. The selection of products and services offered in each case is determined by HSBC’s participation strategy in the respective markets.
In markets where HSBC already has scale or, in emerging markets where scale can be built over time, HSBC offers a full range of personal financial products and services. Typically, products provided include personal banking products (current and savings accounts, mortgages and personal loans, credit cards, and local and international payment services), together with consumer finance and wealth management services.
In other markets, HSBC participates more selectively, targeting only those customer segments which have strong international connectivity or where HSBC’s global scale is crucial.
HSBC Premier, the Group’s premium banking service, provides personalised relationship management, a single online view of all international accounts, free international funds transfer between HSBC accounts, 24-hour priority telephone access, global travel assistance and wealth management services. There are now over 2.6 million HSBC Premier customers, who can use more than 300 specially designated Premier branches and centres in 41 countries and territories.
Wealth management (insurance and investment products and financial planning services) plays an important part in meeting the needs of customers. Insurance products distributed by HSBC through its direct channels and branch networks include loan protection, life, property and health insurance and pensions. HSBC also makes available a wide range of investment products. A choice of third-party and proprietary funds offer customers the ability to diversify their investments across a range of best-in-class fund managers chosen after a rigorous and objective selection process. Comprehensive financial planning services covering customers’ investment, retirement, personal and asset protection needs are offered through qualified financial planning managers.
Personal customers prefer to conduct their financial business at times convenient to them, using the sales and service channels of their choice. This demand for flexibility is met through the increased provision of direct channels such as the internet and self-service terminals, in addition to traditional and
automated branches and service centres accessed by telephone.
HSBC is a major global credit card issuer with over 100 million credit cards in force in 49 countries. In addition to HSBC branded cards, HSBC Finance in the US offers Household Bank and Orchard Bank branded cards and affiliation programmes such as the GM card and the AFL-CIO Union Plus card. HSBC is also a provider of third-party private label credit cards (or store cards) through merchant relationships.
HSBC Finance’s operations in the US, the UK and Canada also make credit available to customers not well catered for by traditional banking operations and facilitate point-of-sale credit in support of retail purchases. At the end of February 2009, HSBC authorised the discontinuation as soon as practicable of all new receivable originations of all products by the branch-based consumer lending business of HSBC Finance in North America (see page 70).
High net worth individuals and their families who choose the differentiated services offered within Private Banking are not included in this customer group.
Commercial Banking
HSBC is one of the world’s leading and most international banks, with over 2.9 million Commercial Banking customers in 63 countries, including sole proprietors, partnerships, clubs and associations, incorporated businesses and publicly quoted companies. At 31 December 2008, HSBC had total commercial customer account balances of US$236 billion and total commercial customer loans and advances, net of loan impairment allowances, of US$204 billion.
HSBC segments its Commercial Banking business into corporate, mid-market, small and micro businesses, allowing the development of tailored customer propositions while adopting a broader view of the entire Commercial Banking sector, from sole traders to top-end mid-market corporations. This allows HSBC to provide continuous support to companies as they grow in size both domestically and internationally, and ensures a clear focus on the small and micro business sectors, which are typically the key to innovation and growth in market economies.
HSBC places particular emphasis on geographical collaboration to meet its business customers’ needs and aims to be recognised as the leading international business bank and the best bank

139
for small business in target markets. The range of products and services includes:
Financing: HSBC provides a range of short and longer-term financing options for Commercial Banking customers, both domestically and cross-border, including overdrafts, receivables finance, term loans and property finance. The Group offers forms of asset finance in selected sites and has established specialised divisions providing leasing and instalment finance for vehicles, plant and equipment.
Payments and cash management: HSBC is a leading provider of domestic and cross-border payments, collections, liquidity management and account services worldwide. The Group’s extensive network of offices and direct access to numerous local clearing systems enhances its customers’ ability to manage their cash efficiently on a global basis. Deposits are attracted through both current accounts and savings products, in local and foreign currencies.
International trade: HSBC finances and facilitates significant volumes of international trade, under both open account terms and traditional trade finance instruments. HSBC also provides international factoring, commodity and insured export finance, and forfaiting services. The Group utilises its extensive international network to build customer relationships at both ends of trade flows, and maximises efficiency through expertise in documentary checking and processing, and highly automated systems.
Treasury and capital markets: Commercial Banking customers are volume users of the Group’s foreign exchange capabilities, including sophisticated currency and interest rate options.
Commercial cards: HSBC offers commercial card services covering both issuing and acquiring. Commercial card issuing provides its customers with services which enhance cash management, improve cost control and streamline purchasing processes. HSBC offers card acquiring services, either directly or as part of a joint venture, enabling merchants to accept credit and debit card payments either in person/on the premises or when the cardholder is not present (eg over the internet or on the telephone).
Insurance: HSBC offers insurance services covering a full range of commercial insurance products designed to meet the needs of businesses and their employees, including employee benefit, pension and healthcare programmes, and a variety of commercial risks such as buildings, marine, cargo, keyman and credit protection. These products are provided by HSBC either as an intermediary (broker,
agent or consultant) or as a supplier of in-house or third-party offerings. HSBC also provides insurance due diligence reviews, and actuarial and employee benefit consultancy services.
Wealth management services: These include advice and products related to savings and investments provided to Commercial Banking customers and their employees through HSBC’s worldwide network, with clients being referred to Private Banking where appropriate.
Investment banking: A small number of Commercial Banking customers need corporate finance and advisory support. These requirements are serviced by the Group on a client-specific basis.
Delivery channels: HSBC deploys a full range of delivery channels, including specific online and direct banking offerings such as HSBCnet and Business Internet Banking.
Global Banking and Markets
Global Banking and Markets provides tailored financial solutions to major government, corporate and institutional clients worldwide. Managed as a global business, Global Banking and Markets operates a long-term relationship management approach to build a full understanding of clients’ financial requirements. Sectoral client service teams comprising relationship managers and product specialists develop financial solutions to meet individual client needs. With dedicated offices in over 66 countries and access to HSBC’s worldwide presence and capabilities, this business serves subsidiaries and offices of its clients on a global basis.
Global Banking and Markets is managed as four principal business lines: Global Markets, Global Banking, Principal Investments and Global Asset Management. This structure allows HSBC to focus on relationships and sectors that best fit the Group’s footprint and facilitates seamless delivery of HSBC’s products and services to clients.
Global Markets
HSBC’s operations in Global Markets consist of treasury and capital markets services for supranationals, central banks, corporations, institutional and private investors, financial institutions and other market participants. Products include:
• foreign exchange;
• currency, interest rate, bond, credit, equity and other derivatives;

H S B C H O L D I N G S P L C
Report of the Directors: Operating and Financial Review (continued)
Products and services / Other information > FUM / Assets in custody
140
• government and non-government fixed income and money market instruments;
• precious metals and exchange traded futures;
• equity services, including research, sales and trading for institutional, corporate and private clients and asset management services;
• distribution of capital markets instruments, including debt, equity and structured products, utilising HSBC’s global network; and
• securities services, where HSBC is one of the world’s leading custodians providing custody and clearing services and funds administration to both domestic and cross-border investors.
Global Banking
HSBC’s operations in Global Banking consist of financing, advisory and transaction services for corporations, institutional and private investors, financial institutions, and governments and their agencies. Products include:
• financing and capital markets, which comprises capital raising, including debt and equity capital, corporate finance and advisory services, bilateral and syndicated lending, leveraged and acquisition finance, structured and project finance, lease finance, and non-retail deposit-taking;
• international, regional and domestic payments and cash management services; and
• other transaction services, including trade services, factoring and banknotes.
Global Asset Management
HSBC’s operations in asset management consist of products and services for institutional investors, intermediaries and individual investors and their advisers.
Principal Investments
This includes private equity, which comprises HSBC’s captive private equity funds, strategic relationships with third-party private equity managers and other investments.
Private Banking
HSBC’s presence in all the major wealth-creating regions has enabled it to build one of the world’s leading private banking groups, providing private banking and trustee services to high net worth individuals and their families from over 90 locations
in 43 countries and territories, with client assets of US$352 billion at 31 December 2008.
HSBC Private Bank is the principal marketing name of the HSBC Group’s international private banking business and utilising the most suitable products from the marketplace, HSBC Private Bank works with its clients to offer both traditional and innovative ways to manage and preserve wealth while optimising returns. Products and services offered include:
Private Banking Services: These comprise multi-currency deposit accounts and fiduciary deposits, credit and specialist lending, treasury trading services, cash management, securities custody and clearing. In addition, HSBC Private Bank works to ensure its clients have full access to other products and services available throughout HSBC, such as credit cards, internet banking, corporate banking, and investment banking.
Private Wealth Management: These comprise both advisory and discretionary investment services. A wide range of investment vehicles is covered, including bonds, equities, derivatives, options, futures, structured products, mutual funds and alternatives (hedge funds, private equity and real estate). By accessing regional expertise located within six major advisory centres in Hong Kong, Singapore, Geneva, New York, Paris and London, Private Banking seeks to find the most suitable investments for clients’ needs and investment strategies. Corporate Finance Solutions helps provide clients with cross-border solutions for their companies working with Global Banking & Markets.
Private Wealth Solutions: These comprise inheritance planning, trustee and other fiduciary services designed to protect existing wealth and create tailored structures to preserve wealth for future generations. Areas of expertise include trusts, foundation and company administration, charitable trusts and foundations, insurance, family office advisory and philanthropy. These are tailored to meet the individual needs of each family.
Other information
Funds under management
2008 2007 US$bn US$bn Funds under management At 1 January ............................... 844 695 Net new money .......................... (1) 36 Value change .............................. (159) 53 Exchange and other .................... 51 60
At 31 December ......................... 735 844

141
At 31 December 2008 2007 US$bn US$bn Funds under management by
business
Global Asset Management ........ 370 380 Private Banking ......................... 219 275 Affiliates .................................... 2 3 Other .......................................... 144 186
735 844
Funds under management at 31 December 2008 were US$735 billion, a decrease of 13 per cent compared with 31 December 2007. Both Global Asset Management and Private Banking funds decreased due to the fall in equity markets.
Global Asset Management funds under management amounted to US$370 billion, a decrease of 3 per cent compared with 31 December 2007. Excluding an internal transfer of US$67 billion, Global Asset Management funds decreased by 20 per cent to US$303 billion.
Net outflows were predominantly driven by clients redeeming long-term funds as a consequence of the downturn in the global economic environment, although this was reduced by net new money into money market funds as clients sought to reduce risk. Additionally, the total value of funds under management was affected by a weaker investment performance resulting from turbulent markets and by foreign exchange movements.
Notwithstanding a decrease in emerging markets funds during the year, Global Asset Management remained one of the world’s largest emerging market asset managers, with US$52 billion of funds under management.
Private Banking’s funds under management decreased by 20 per cent to US$219 billion, driven by equity market performance. Net new money, while positive, amounted to only US$2 billion as positive flows in Europe, were offset by outflows of funds in other regions as clients reduced risk by transferring funds to cash deposits, many with HSBC in response to its perceived strength.
Other funds under management, of which the main element is a corporate trust business in Asia, decreased to US$144 billion.
Assets held in custody and under administration
Custody is the safekeeping and servicing of securities and other financial assets on behalf of clients. At 31 December 2008, assets held by HSBC as custodian amounted to US$3.6 trillion, 33 per cent lower than the US$5.4 trillion held at
31 December 2007. This was mainly driven by adverse market movements affecting the value of assets held.
HSBC’s assets under administration business, which includes the provision of various support function activities including the valuation of portfolios of securities and other financial assets on behalf of clients, complements the custody business. At 31 December 2008, the value of assets held under administration by the Group amounted to US$3.3 trillion, in line with 31 December 2007.
Property
During 2008, HSBC recognised a gain of US$416 million in other operating income in respect of the purchase of the subsidiary of Metrovacesa which owned the property and long leasehold land comprising 8 Canada Square, London. See Note 23 on the Financial Statements for further details.
At 31 December 2008, HSBC operated from some 9,870 operational properties worldwide, of which approximately 2,770 were located in Europe, 1,090 in Hong Kong and Rest of Asia-Pacific, 1,640 in North America, 4,200 in Latin America and 170 in Middle East. These properties had an area of approximately 73.6 million square feet (2007: 69.8 million square feet).
Freehold, long leasehold and short leasehold land and buildings carried on the balance sheet represented 35 per cent of HSBC’s operational space. Of the total net book value of HSBC properties, more than 72 per cent was for owned properties or properties under long-term leases. In addition, properties with a net book value of US$971 million were held for investment purposes.
HSBC’s operational properties are stated at cost, being historical cost or fair value at the date of transition to IFRSs (their deemed cost) less any impairment losses, and are depreciated on a basis calculated to write off the assets over their estimated useful lives. Properties owned as a consequence of an acquisition are recognised initially at fair value.
Valuation of freehold and leasehold land and buildings
HSBC’s freehold and long leasehold properties, together with all leasehold properties in Hong Kong, were valued in 2008. The value of these properties was US$3.3 billion (2007: US$2.2 billion) in excess of their carrying amount in the consolidated balance sheet.
Further details are included in Note 23 on the Financial Statements.

H S B C H O L D I N G S P L C
Report of the Directors: Operating and Financial Review (continued)
Other information / Legal proceedings / Footnotes
142
Legal proceedings
On 27 July 2007, the UK Office of Fair Trading (‘OFT’) issued High Court legal proceedings against a number of UK financial institutions, including HSBC Bank, to determine the legal status and enforceability of certain of the charges applied to their personal customers in relation to unauthorised overdrafts (the ‘charges’). Pending the resolution of the proceedings, the Financial Services Authority (‘FSA’) has granted firms (including HSBC Bank) a waiver enabling them to place relevant complaints about the charges on hold and the County Courts have stayed all individual customer claims.
Certain preliminary issues in these proceedings have been heard in the Commercial Division of the High Court. This has confirmed that HSBC Bank’s current and historic charges are capable of being tested for fairness but are not capable of being penalties. HSBC Bank (and all the other financial institutions involved in the legal proceedings) appealed the finding that the current charges are capable of being tested for fairness. The Court of Appeal delivered its judgement on 26 February 2009, confirming the decision of the High Court that the charges of HSBC Bank (and all of the other financial institutions involved in the legal proceedings) are capable of being tested for fairness. HSBC Bank is considering applying for leave to appeal to the House of Lords.
The proceedings remain at an early stage and may, allowing for appeals on the issues, take some time to conclude. A wide range of outcomes is possible, depending upon the outcome of any appeal to the House of Lords and, to the extent applicable, upon the Court’s assessment of the fairness of each charge across the period under review. Since July 2001, there have been a variety of charges applied by HSBC Bank across different charging periods under the then existing contractual arrangements. HSBC Bank considers the charges to be and to have been valid and enforceable, and intends strongly to defend its position.
If, contrary to HSBC Bank’s current assessment, the Court should ultimately (after appeals) reach an adverse decision that results in a liability, a large number of different outcomes is possible, each of which would have a different financial impact. Given that there is limited authority on how an assessment of fairness should be conducted, HSBC Bank’s estimate of the potential financial impact is that it could be in the order of approximately £350 million (US$510 million), as published in the Interim Report 2008. To make an estimate of the potential financial impact at this stage with any
precision is extremely difficult, owing to (among other things) the complexity of the issues, the number of permutations of possible outcomes, and the early stage of the proceedings. In addition, the assumptions made by HSBC Bank may prove to be incorrect.
On 11 December 2008 Bernard L Madoff (‘Madoff’) was arrested and charged in the United States District Court for the Southern District of New York with one count of securities fraud. That same day, the US Securities and Exchange Commission (‘SEC’) filed securities fraud charges against Madoff and his firm Bernard L Madoff Investment Securities LLC (‘Madoff Securities’), a broker dealer and investment advisor registered with the SEC. The criminal complaint and SEC complaint each alleged that Madoff had informed senior Madoff Securities employees, in substance, that his investment advisory business was a fraud. On 15 December 2008, on the application of the Securities Investor Protection Corporation, the United States District Court for the Southern District of New York appointed a trustee for the liquidation of the business of Madoff Securities, and removed the liquidation proceeding to the United States Bankruptcy Court for the Southern District of New York. On 9 February 2009, on Madoff’s consent, the United States District Court for the Southern District of New York entered a partial judgement in the SEC action, permanently enjoining Madoff from violating certain antifraud provisions of the US securities laws, ordering Madoff to pay disgorgement, prejudgement interest and a civil penalty in amounts to be determined at a later time, and continuing certain other relief previously imposed, including a freeze on Madoff’s assets. The relevant US authorities are continuing their investigations into the alleged fraud. There remains significant uncertainty as to the facts of the alleged fraud and the extent of any assets of, and remaining within, Madoff Securities.
Various non-US HSBC group companies provide custodial, administration and similar services to a number of funds incorporated outside the United States of America whose assets were invested with Madoff Securities. Based on information provided by Madoff Securities, as at 30 November 2008, the aggregate net asset value of these funds (which would include principal amounts invested and unrealised gains) was US$8.4 billion.
Proceedings concerning Madoff and Madoff Securities have already been issued in various jurisdictions against numerous defendants and HSBC expects further proceedings to be brought, including by the Madoff Securities trustee. Various

143
HSBC group companies have been named as defendants in suits in the United States anticipated to seek class action status and cases in the Commercial List of the Irish courts. All of the cases where HSBC group companies are named as a defendant are at a very early stage. HSBC considers that it has good defences to these claims and will continue to defend them vigorously. HSBC is unable reliably to estimate the liability, if any, that might arise as a result of such claims.
Various HSBC group companies have also received requests for information from various regulatory authorities in connection with the alleged fraud by Madoff. HSBC group companies are co-
operating with these requests for information.
These actions apart HSBC is party to legal actions in a number of jurisdictions including the UK, Hong Kong and the US arising out of its normal business operation. HSBC considers that none of the actions is material, and none is expected to result in a significant adverse effect on the financial position of HSBC, either individually or in the aggregate. Management believes that adequate provisions have been made in respect of the litigation arising out of its normal business operations. HSBC has not disclosed any contingent liability associated with these legal actions because it is not practical to do so.
Operating and Financial Review footnotes (see pages 12 to 143)
1 Columns headed ‘Acquisitions, disposals and dilution gains’ and ‘Acquisitions and disposals’ comprise the net increments or decrements in profits in the current year (compared with the previous year) which are attributable to acquisitions or disposals of subsidiaries made, or dilution gains, in the relevant years. Acquisitions and disposals are determined on the basis of the review and analysis of events in each year.
2 ‘Currency translation’ is the effect of translating the results of subsidiaries and associates for the previous year at the average rates of exchange applicable in the current year.
3 Excluding 2007 acquisitions, disposals and dilution gains. 4 ‘Other income’ in this context comprises net trading income (see 15 below), net income from financial instruments designated at fair
value, gains less losses from financial investments, gains arising from dilution of interests in associates, dividend income, net earned insurance premiums and other operating income less net insurance claims incurred and movement in liabilities to policyholders.
5 Net operating income before loan impairment charges and other credit risk provisions. 6 Excluding 2006 acquisitions, disposals and dilution gains. 7 Interest income on trading assets is reported as ‘Net trading income’ in the consolidated income statement. 8 Interest income on financial assets designated at fair value is reported as ‘Net income from financial instruments designated at fair
value’ in the consolidated income statement. 9 Brazilian operations comprise HSBC Bank Brasil S.A.-Banco Múltiplo and subsidiaries, plus HSBC Serviços e Participações Limitada.
10 This table analyses interest-bearing bank deposits only. See page 15 for an analysis of all bank deposits. 11 Interest expense on financial liabilities designated at fair value is reported as ‘Net income on financial instruments designated at fair
value’ in the consolidated income statement other than interest on own debt. 12 This table analyses interest-bearing customer accounts only. See page 60 for an analysis of all customer accounts. 13 Net interest margin is calculated as net interest income divided by average interest earning assets. 14 The main items reported under ‘Other’ are certain property activities, unallocated investment activities, centrally held investment
companies, gains arising from the dilution of interests in associates, movements in the fair value of own debt designated at fair value (the remainder of the Group’s gain on own debt is included in Global Banking and Markets), and HSBC’s holding company and financing operations. The results also include net interest earned on free capital held centrally, operating costs incurred by the head office operations in providing stewardship and central management services to HSBC, and costs incurred by the Group Service Centres and Shared Service Organisations and associated recoveries. At 31 December 2008, gains arising from the dilution of interests in associates were nil (2007: US$1.1 billion and 2006: nil) and fair value gains on HSBC’s own debt designated at fair value were US$6.7 billion (2007: US$2.8 billion income; 2006: US$35 million expense).
15 Assets by geographical region and customer group include intra-HSBC items. These items are eliminated, where appropriate, under the heading ‘Intra-HHSBC items’.
16 In the analyses of customer groups and global businesses, net trading income comprises all gains and losses from changes in the fair value of financial assets and financial liabilities classified as held for trading, together with related external and internal interest income and interest expense, and dividends received; in the statutory presentation internal interest income and expense are eliminated.
17 Net insurance claims incurred and movement in liabilities to policyholders. 18 In 2008, Global Markets included a US$529 million gain on the widening of credit spreads on structured liabilities (2007:
US$34 million; 2006: nil). 19 ‘Other’ in Global Banking and Markets includes net interest earned on free capital held in the global business not assigned to products. 20 Trading assets and financial investments held in Europe, and by Global Banking and Markets in North America, include financial assets
which may be repledged or resold by counterparties. 21 Inter-segment elimination comprises (i) the costs of shared services and Group Service Centres included within ‘Other’ which are
recovered from customer groups, and (ii) the intra-segment funding costs of trading activities undertaken within Global Banking and Markets. HSBC’s balance sheet management business, reported within Global Banking and Markets, provides funding to the trading businesses. To report Global Banking and Markets’ ‘Net trading income’ on a fully funded basis, ‘Net interest income’ and ‘Net interest income/(expense) on trading activities’ are grossed up to reflect internal funding transactions prior to their elimination in the inter-segment column.
22 France primarily comprises the domestic operations of HSBC France, HSBC Assurances and the Paris branch of HSBC Bank. 23 United States includes the impairment of goodwill in respect of Personal Financial Services - North America as described in Note 22 on
the Financial Statements.

H S B C H O L D I N G S P L C
Report of the Directors: Impact of Market Turmoil Background / Overview
144
Background and disclosure policy (Audited)
As a result of the widespread deterioration in the markets for securitised and structured financial assets, and consequent disruption to the global financial system since mid-2007, it has become increasingly difficult to observe prices for structured credit risk, including prime tranches of such risk as the markets for these assets became illiquid. The resulting constraint on the ability of financial institutions to access wholesale markets to fund such assets added additional downward pressure on all asset prices. As a consequence, many financial institutions have recorded considerable reductions in the fair values of their asset-backed securities (‘ABS’s) and leveraged structured transactions, most significantly in sub-prime mortgages but in other asset classes too.
In light of increasing illiquidity and the risk to capital from further write-downs, many financial institutions took steps during 2008 to reduce leveraged exposures, build liquidity and raise additional capital. However, credit conditions suffered additional deterioration in the second half of the year, as the economic outlook worsened and unemployment rose, intensifying the pressure on the global financial system. Volatility in money markets also increased during the second half of 2008, resulting in wider interest spreads, and markets for securitised and structured financial assets continued to be thoroughly constrained. This instability triggered a series of significant events including the default of a number of major financial institutions, and the taking into public ownership of banks in a number of countries.
Deterioration in the measured fair value of assets supported by sub-prime mortgages continued in 2008 with the primary market for all but US government-sponsored issues remaining weak. Spreads widened due to credit and liquidity concerns as delinquencies on the underlying mortgages continued to increase beyond the levels priced into securitisations issued in recent years. The impact widened beyond sub-prime related assets, with the measured fair value of securities backed by Alt-A collateral, in particular, suffering significant deterioration.
During 2008, governments and central banks worldwide took unprecedented measures designed to stabilise and increase confidence in financial markets. These measures included providing vast amounts of liquidity via emergency funding, extending guarantees of financial assets, and launching various forms of rescue plans.
This section contains disclosures about the effect of the recent market turmoil on HSBC’s securitisation activities and other structured products. HSBC’s principal exposures to the US and the UK mortgage markets primarily take the form of credit risk from direct loans and advances to customers which were originated to be held to maturity or refinancing, details of which are provided on page 208.
Financial instruments which were most affected by the market turmoil include exposures to direct lending held at fair value through profit or loss and ABSs, including mortgage-backed securities (‘MBS’s) and collateralised debt obligations (‘CDO’s), and exposures to and contingent claims on monoline insurers in respect of structured credit activities and leveraged finance transactions which were originated to be distributed.
In accordance with HSBC’s policy to provide meaningful disclosures that help investors and other stakeholders understand the financial position, performance and changes in the financial position of the Group, the information provided in this section goes beyond the minimum levels required by accounting standards, statutory and regulatory requirements and listing rules. In the specific context of facilitating an understanding of the recent market turmoil in markets for securitised and structured assets, HSBC has considered the recommendations relating to disclosure contained within the reports issued by the Financial Stability Forum on ‘Enhancing Market and Institutional Resilience’ (April and October 2008), the Committee of European Banking Supervisors on ‘Banks’ Transparency on Activities and Products Affected by the Recent Market Turmoil’ (June and October 2008) and the International Accounting Standards Board Expert Advisory Panel on ‘Measuring and disclosing the fair value of financial instruments in markets that are no longer active’ (October 2008). In addition, HSBC has considered feedback from investors, regulators and other stakeholders on the disclosures that investors would find most useful.
The specific topics covered in respect of HSBC’s securitisation activities and exposure to structured products are as follows:
• overview of exposure; • business model; • risk management; • accounting policies; • nature and extent of HSBC’s exposures; • fair values of financial instruments; and • special purpose entities.

145
Overview of exposure (Audited)
At 31 December 2008, the aggregate carrying amount of HSBC’s exposure to ABSs, trading loans
held for securitisation and exposure to leveraged finance transactions was US$91 billion (2007: US$131 billion), summarised as follows:
At 31 December 2008 At 31 December 2007
Carrying amount
Including sub-prime and Alt-A
Carrying amount
Including sub-prime and Alt-A
US$bn US$bn US$bn US$bn
ABSs .................................................................................................... 81 12 116 31 – fair value through profit or loss ................................................... 14 1 33 7– available for sale1 ......................................................................... 56 9 80 24– held to maturity1 ........................................................................... 3 – 3 –– loans and receivables .................................................................... 8 2 – –
Loans at fair value through profit or loss ............................................ 4 3 6 6
Leveraged finance loans ...................................................................... 6 – 9 – – fair value through profit or loss2 .................................................. – – 8 –– loans and receivables .................................................................... 6 – 1 –
91 15 131 37
1 Total includes holdings of ABSs issued by Freddie Mac and Fannie Mae. 2 Includes the carrying amount of funded loans plus the net exposure to unfunded leveraged finance commitments.
The majority of these exposures arise in the Global Banking and Markets business segment.
Within the total carrying amount of ABSs on the balance sheet, ABS holdings of US$14.6 billion (2007: US$32.1 billion) are held through vehicles discussed on page 148, where significant first loss protection is provided by external investors on a fully collateralised basis.
A reconciliation of the movement in the carrying amount of ABSs on the balance sheet of US$34.5 billion is set out below:
• the write-downs of ABSs taken to the income statement – US$3.4 billion;
• the movement in fair values on available-for-sale ABSs taken to equity – US$16.5 billion;
• principal amortisation – US$11.4 billion; and,
• exchange differences and other movements – US$3.2 billion.
Due to the market dislocation in respect of these securities, the impact of purchases and sales on the total carrying amount of ABSs was not significant in 2008.
At 31 December 2008, of the total carrying amount of ABSs and trading loans held for securitisation in respect of sub-prime and Alt-A residential mortgage exposure, US$3.5 billion (2007: US$11.7 billion) was held through special purpose entities (‘SPE’s).
Reclassification of financial assets
In October 2008, the IASB issued amendments to IAS 39 ‘Financial Instruments: Recognition and Measurement’ and IFRS 7 ‘Financial Instruments: Disclosures’ which permitted an entity to reclassify non-derivative financial assets out of the held-for-trading category as described in the accounting policies on Note 2 (e) on the Financial Statements. This was done to better align IFRSs with US GAAP and was restricted to situations where the transferring entity had the intention and ability to hold the transferred position for the foreseeable future or until maturity.
During the second half of 2008, HSBC reclassified financial assets from the held-for-trading category as tabulated below. The amount reclassified was the fair value of the financial assets at the date of reclassification, subject to the transition rules noted below. In October 2008, HSBC reclassified US$12.5 billion and US$0.4 billion of held-for-trading financial assets as loans and receivables and available for sale, respectively. During November and December 2008, HSBC reclassified a further US$2.8 billion and US$2.2 billion of held-for-trading financial assets as loans and receivables and available for sale, respectively. The financial consequence of the reclassification is that the reclassified assets are no longer marked-to-market through the income statement. Amounts reclassified as loans and receivables are accounted as such from the date of reclassification and tested thereafter for

H S B C H O L D I N G S P L C
Report of the Directors: Impact of Market Turmoil (continued)
Overview > Global Banking and Markets ABSs
146
On reclassification At 31 December 2008
Amount reclassified1
Estimate of future cash flows2
Effective interest rate
Carrying amount Fair value
US$m US$m % US$m US$m Reclassification to loans and receivables ABSs ..................................................................................... 8,194 11,642 8 7,991 6,139 Trading loans – commercial mortgage loans ....................... 650 741 5 587 557 Leveraged finance loans ....................................................... 6,458 8,481 7 5,670 4,239
15,302 20,864 14,248 10,935 Reclassification to available-for-sale Corporate debt and other securities ...................................... 2,549 3,626 5 2,401 2,401
17,851 24,490 16,649 13,336
1 Amounts reclassified that are denominated in foreign currencies have been translated using the rate of exchange at the date of reclassification; all other amounts denominated in foreign currencies have been translated into the functional currency at the rate of exchange ruling at the balance sheet date.
2 The estimate of future cash flows represents the cash flows expected to be recovered at the date of reclassification.
impairment. Amounts reclassified as available for sale are held at fair value with changes in the fair value recognised in equity, and tested for impairment. In line with the transition rules, for reclassifications made during October 2008, the reclassified financial assets were treated as having been so reclassified as at 1 July 2008. The impact of back-dating these retrospective reclassifications was that fair value movements between 1 July 2008 and October 2008 of US$835 million were not recorded in the income statement.
The reclassifications resulted from significant reductions in market liquidity for these assets and a change in HSBC’s intention to hold them for the foreseeable future or to maturity. These circumstances arose in the wider context of market turmoil. As a result, the Group decided to reclassify financial assets that would have met the definition of loans and receivables at initial recognition, as permitted by the IAS 39 amendments. In addition, as permitted by the IAS 39 amendments in rare
circumstances, the Group reclassified securities, that did not meet the definition of loans and receivables on initial recognition, as the conditions of market turmoil prevailing in the second half of 2008 were considered rare.
If these reclassifications had not been made, the Group’s pre-tax profit would have been reduced by US$3.5 billion from US$9.3 billion to US$5.8 billion. The reduction would have been US$0.9 billion in the North America and US$2.6 billion in the Europe segments. There was no significant impairment identified on the loans transferred even though the fair value continued to fall as a consequence of illiquidity and market sentiment.
The following table shows the fair value gains and losses, income and expense recognised in the income statement both before and after the date of reclassification:
Effect on income statement
Prior to reclassification After reclassification1
Assuming no reclassification2
Net effect of reclassification
2008 2007 2008 2008 2008 US$m US$m US$m US$m US$m
Reclassifications to loans and receivables ABSs ............................................................... (1,020) (357) 303 (1,549) 1,852 Trading loans – commercial mortgage loans . (16) – 17 (13) 30 Leveraged finance loans ................................. (253) (158) 192 (1,239) 1,431
(1,289) (515) 512 (2,801) 3,313 Reclassifications to available-for-sale Corporate debt and other securities ................ (82) (2) 22 (202) 224
(1,371) (517) 534 (3,003) 3,537
1 Income and expense recorded in the income statement after reclassification represents the accrual of the effective interest rate and also includes US$26 million in respect of impairment of leveraged finance loans. The group recorded no impairment charges on other financial assets reclassified during the second half of 2008.
2 Effect on the income statement which would have arisen from the date of reclassification, had the reclassification not occurred.

147
Financial effect of market turmoil
As described in the background to market turmoil on page 144, the dislocation of financial markets which developed in the second half of 2007 continued throughout 2008. For the three half-year periods
affected to date, the write-downs incurred by the Group on ABSs, trading loans held for securitisation, leveraged finance transactions, and the movement in fair values on available-for-sale ABSs taken to equity, plus impairment losses on specific exposures to banks, are summarised in the following table:
Half-year to 31 December
2008 30 June
2008 31 December
2007 US$bn US$bn US$bn
Write-downs taken to income statement ......................................................... (2.3) (4.0) (2.3)Fair value movement taken to available-for-sale reserve on ABSs in the
period ........................................................................................................... (10.4) (6.1) (2.2)Closing balance of available-for-sale reserve relating to ABSs ..................... (18.7) (8.3) (2.2)
Virtually all of these effects were recorded in Global Banking and Markets. Included in write-downs taken to the income statement is US$209 million in respect of impairment losses on the collapse of financial institutions, of which US$126 million was incurred on the collapse of Icelandic banks. The group took no material write-
downs to the income statement in respect of exposures to Lehman Brothers.
Further analysis of the write-downs taken to the income statement by Global Banking and Markets, and the net carrying amounts of the positions that have generated these write-downs, are shown in the following table:
Global Banking and Markets write-downs taken to the income statement and carrying amounts
Write-downs during half-year to Carrying amount at
31 December 2008
30 June 2008
31 December 2007
31 December 2008
30 June 2008
31 December 2007
US$m US$m US$m US$m US$m US$m Sub-prime mortgage-related assets
– loan securitisation ................................ 292 301 529 1,213 1,565 1,965 – credit trading ....................................... 150 665 463 428 1,377 1,700
Other ABSs ................................................. 486 1,327 459 2,201 8,923 9,830
Derivative transactions with monolines – investment grade counterparts ............ 130 598 133 2,089 1,206 1,209 – non-investment grade counterparts ..... 370 608 214 352 78 –
Leveraged finance loans1 ............................ 26 278 195 271 7,375 7,772
Other credit related items ........................... 95 99 142 186 321 446
Available-for-sale impairments and other non-trading related items .............. 655 55 –
2,204 3,931 2,135
1 The carrying amount includes funded loans plus the net exposure to unfunded leveraged finance commitments, held within fair value through the profit or loss.
Global Banking and Markets asset-backed securities classified as available for sale
HSBC’s principal holdings of ABSs are in the Global Banking and Markets’ business through special purpose entities (‘SPE’s) which have the benefit of external investor first loss protection
support, positions held directly and by Solitaire Funding Limited (‘Solitaire’) where HSBC has first loss risk.
The table below summarises these Global Banking and Markets’ exposures to ABSs which are held on an available-for-sale basis.

H S B C H O L D I N G S P L C
Report of the Directors: Impact of Market Turmoil (continued)
Overview > Global Banking and Markets ABSs // Business model
148
Global Banking and Markets available-for-sale ABSs exposure
At 31 December 2008 At 31 December 2007
Directly held1 SPEs Total
Directly held1 SPEs Total
US$m US$m US$m US$m US$m US$m
Total carrying amount of net principal exposure ............................................................ 35,736 14,610 50,346 43,826 32,105 75,931– which includes sub-prime/Alt-A exposure .. 5,155 3,516 8,671 11,801 11,664 23,465
Available-for-sale reserves relating to sub-prime/Alt-A exposure ....................................... (5,920) (3,573) (9,493) (1,122) – (1,122)
Half year to Half year to Half year to 31 December 2008 30 June 2008 31 December 2007
Directly held1
US$m SPEs
US$m Total
US$m
Directlyheld1
US$m SPEs
US$m Total
US$m
Directly held1
US$m SPEs
US$m Total
US$m Impairment charge:
– borne by HSBC ...................... 224 – 224 55 – 55 – – – – allocated to capital note
holders .................................... – 159 159 – 134 134 – – –
Total impairment charge ................. 224 159 383 55 134 189 – – –
1 ‘Directly held’ includes both assets held by Solitaire where HSBC provides first loss protection and those assets held directly by the Group.
Structured investment vehicles and securities investment conduits (special purpose entities)
In the table above, the total carrying amount of ABSs on the balance sheet in respect of SPEs represent holdings in which significant first loss protection is provided through the capital notes issued by the structured investment conduits (‘SIC’s), excluding Solitaire. The economic first loss protection remaining at 31 December 2008 amounted to US$2.2 billion (2007: US$2.3 billion). As set out on page 174, on an IFRS accounting basis the impairment charge of US$293 million was allocated to the capital note holders at 31 December 2008 (2007: n/a).
At each balance sheet date, an assessment is made as to whether there is any objective evidence of impairment in the value of available-for-sale ABSs. Impairment charges incurred on assets held by these SPEs are offset by a credit to the impairment line for the amount of the loss allocated to capital note holders.
Impairments recognised at 31 December 2008 from assets held directly or within Solitaire in recognition of the first loss protection of US$1.2 billion provided by HSBC through credit enhancement were US$279 million (2007: nil), based on a notional principal value of securities which were impaired of US$570 million (2007: nil). The low level of impairment recognised in comparison with the deficit in the available-for-sale
reserve is a reflection of the credit quality and seniority of the assets held.
Sub-prime and Alt-A residential mortgage-backed securities
Management’s current assessment of the holdings of available-for-sale ABSs with the most sensitivity to possible future impairment is focused on sub-prime and Alt-A residential mortgage-backed securities (‘MBS’s).
Excluding holdings in the SPEs discussed above, available-for-sale holdings in these categories within Global Banking and Markets amounted to US$5.2 billion at 31 December 2008 (2007: US$11.8 billion). During the year ended 31 December 2008, the movement in fair values of these securities taken to equity was a reduction of US$4.8 billion. The deficit in the available-for-sale fair value reserve as at 31 December 2008 in relation to these securities was US$5.9 billion (2007: US$1.1 billion).
The main factors in the reduction in fair value of these securities over the period were the effects of reduced market liquidity and negative market sentiment. The level of actual credit losses experienced was low in 2008, notwithstanding the deterioration in the performance of the underlying mortgages in the period as US house prices fell and defaults increased. The absence of material credit losses is judged to be attributable to the seniority of the tranches held by HSBC as well as the priority for cash flow held by these tranches.

149
During February 2009, the credit ratings on a proportion of ABSs held directly by HSBC, Solitaire and the SICs were downgraded. In particular, Moody’s Investor Services downgraded the ratings on substantially all the Group’s holdings of US Alt-A residential MBSs issued during 2006 and 2007.
As discussed on page 170, when assessing available-for-sale ABSs for objective evidence of impairment at the balance sheet date HSBC considers all available evidence including the performance of the underlying collateral. A downgrade of a security’s credit rating is not, of itself, evidence of impairment. Consequently, Moody’s action has no direct impact on the measurement of impairment losses. The impairment losses recognised on these securities at 31 December 2008 is set out on page 148.
Stress analysis (Unaudited)
HSBC’s regular impairment assessment uses an industry standard model with inputs which are corroborated using observable market data where available. At 31 December 2008, management performed a stress test on the available-for-sale ABS positions, based on the fair value of the positions at that date. The outcome of the stress test was particularly sensitive to expected loss and prepayment rates for Alt-A securities and the loss of credit protection from certain monoline insurers on US Home Equity Lines of Credit (‘HELoC’s). The results of the stress test showed that, by applying different inputs to those currently observed, a further potential impairment charge to the income statement of some US$2 billion to US$2.5 billion could arise over the next three years. These different inputs were calculated by increasing the net impact of expected loss and prepayment rates for Alt-A securities by between a third and a half depending on loan vintage and by removing all credit protection from monoline insurers rated below AAA by S&P on the HELoC positions. However, management believes that the loss which would be realised in cash terms would be considerably lower than the impairment charge above and potentially cost some US$0.6 billion to US$0.8 billion over the next four years.
Business model (Audited)
Asset-backed securities and leveraged finance
HSBC is or has been involved in the following activities in these areas:
• the purchase of US mortgage loans with the intention of structuring and placing securitisations into the market;
• trading in ABSs, including MBSs, in secondary markets;
• the holding of MBSs and other ABSs in balance sheet management activities, with the intention of earning net interest income over the life of the securities;
• the holding of MBSs and other ABSs as part of investment portfolios, including the SIVs, SICs and money market funds described under ‘Special purpose entities’ below, with the intention of earning net interest income and management fees;
• MBSs or other ABSs held in the trading portfolio hedged through credit derivative protection, typically purchased from monoline insurers, with the intention of earning the spread differential over the life of the instruments; and
• leveraged finance: originating loans for the purposes of syndicating or selling them down in order to generate a trading profit and holding them in order to earn interest margin over their lives.
Historically, these activities have not been a significant part of Global Banking and Markets’ business, and Global Banking and Markets is not reliant on them for any material aspect of its business operations or profitability.
The purchase and securitisation of US mortgage loans and the secondary trading of US MBSs was conducted in HSBC’s US MBSs business. This business was discontinued in 2007.
Special purpose entities
HSBC enters into certain transactions with customers in the ordinary course of business which involve the establishment of SPEs to facilitate customer transactions. SPEs are used in HSBC’s business in order to provide structured investment opportunities for customers, facilitate the raising of funding for customers’ business activities, or diversify HSBC’s sources of funding and/or improve capital efficiency.
The use of SPEs is not a significant part of HSBC’s activities and HSBC is not reliant on the use of SPEs for any material part of its business operations or profitability. Detailed disclosures of HSBC’s sponsored SPEs are provided on page 173.
H S B C H O L D I N G S P L C
Report of the Directors: Impact of Market Turmoil (continued)
Risk management / Accounting policies / Nature and extent of exposures
150
Risk management (Audited)
The effect of the recent market turmoil on HSBC’s risk exposures, the way in which HSBC has managed risk exposures in this context, and any changes made in HSBC’s risk management polices and procedures in response to the market conditions are set out in the following sections:
• Liquidity risk – ‘The impact of market turmoil on the Group’s liquidity risk position’ (see page 239).
• Market risk – ‘The impact of market turmoil on market risk’ (see page 242).
• Credit Risk – ‘Credit exposure’ (see page 197).
Accounting policies (Audited)
HSBC’s accounting policies regarding the classification and valuation of financial instruments are in accordance with the requirements of IAS 32 ‘Financial Instruments: Presentation’ and IAS 39 ‘Financial Instruments: Recognition and Measurement’, as described in Note 2 on the Financial Statements, and the use of assumptions and estimation in respect of valuation of financial instruments as described on page 63.
Nature and extent of HSBC’s exposures (Audited)
This section contains information on HSBC’s exposures to the following:
• direct lending held at fair value through profit or loss;
• ABSs including MBSs and CDOs;
• monoline insurers;
• credit derivative product companies (‘CDPC’s); and
• leveraged finance transactions.
MBSs are securities that represent interests in a group of mortgages. Investors in these securities have the right to cash received from future mortgage payments (interest and/or principal). Where an MBS references mortgages with different risk profiles, the MBS is classified according to the highest risk class. Consequently, an MBS with both sub-prime and Alt-A exposures is classified as sub-prime.
CDOs are securities in which ABSs and/or certain other related assets have been purchased and securitised by a third-party, or securities which pay a
return which is referenced to those assets. CDOs may feature exposure to sub-prime mortgage assets through the underlying assets. As there is often uncertainty surrounding the nature of the underlying collateral supporting CDOs, all CDOs supported by residential mortgage-related assets, irrespective of the level of sub-prime assets, are classified as sub-prime.
HSBC’s holdings of ABSs and CDOs, and its direct lending positions, include the following categories of collateral and lending activity:
• sub-prime: loans to customers who have limited credit histories, modest incomes, high debt-to-income ratios or have experienced credit problems caused by occasional delinquencies, prior charge-offs, bankruptcy or other credit-related actions. For US mortgages, US credit scores are primarily used to determine whether a loan is sub-prime. US home equity lines of credit are classified as sub-prime. For non-US mortgages, management judgement is used to identify loans of similar risk characteristics to sub-prime, for example, UK non-conforming mortgages (see below);
• US home equity lines of credit (‘HELoC’s): a form of revolving credit facility provided to customers, which is supported by a first or second lien charge over residential property. Global Banking and Markets’ holdings of HELoCs are classified as US sub-prime residential mortgage assets;
• US Alt-A: loans classified as Alt-A are regarded as lower risk than sub-prime, but they share higher risk characteristics than lending under normal criteria. US credit scores, as well as the level of mortgage documentation held (such as proof of income), are considered when determining whether an Alt-A classification is appropriate. Non-agency mortgages in the US are classified as Alt-A if they do not meet the criteria for classification as sub-prime. These are mortgages not eligible to be sold to the major US Government agency, Ginnie Mae (Government National Mortgage Association), and government sponsored enterprises in the mortgage market, Fannie Mae (the Federal National Mortgage Association) and Freddie Mac (the Federal Home Loan Mortgage Corporation);
• US government agency mortgage-related assets: securities that are guaranteed by US Government agencies, such as Ginnie Mae;
• US Government sponsored enterprises

151
mortgage-related assets: securities that are guaranteed by US Government sponsored entities, including Fannie Mae and Freddie Mac;
• UK non-conforming mortgage-related assets: UK mortgages that do not meet normal lending criteria. This includes instances where the normal level of documentation has not been provided (for example, in the case of self-certification of income), or where increased risk factors, such as poor credit history, result in lending at a rate that is higher than the normal lending rate. UK non-conforming mortgages are treated as sub-prime exposures; and
• other mortgage-related assets: residential mortgage-related assets that do not meet any of the classifications described above. Prime
residential mortgage-related assets are included in this category.
HSBC’s exposure to non-residential mortgage-related ABSs and direct lending includes:
• commercial property mortgage-related assets: MBSs with collateral other than residential mortgage-related assets;
• leveraged finance-related assets: securities with collateral relating to leveraged finance loans;
• student loan-related assets: securities with collateral relating to student loans; and
• other assets: securities with other receivable-related collateral.
Carrying amount of HSBC’s consolidated holdings of ABSs, and direct lending held at fair value through profit or loss
At 31 December 2008
Trading Available for sale
Held to maturity
Designated at fair value through profit or loss
Loans and receivables Total
Of whichheld through consolidated SPEs
US$m US$m US$m US$m US$m US$m US$m
Sub-prime residential mortgage-related assets .......... 3,372 3,741 – 1 453 7,567 4,230 Direct lending ......................... 2,789 – – – – 2,789 1,300MBSs and MBS CDOs1 ......... 583 3,741 – 1 453 4,778 2,930
US Alt-A residential mortgage-related assets .......... 618 5,829 185 – 1,056 7,688 3,831 Direct lending ......................... 246 – – – - 246 –MBSs1 ..................................... 372 5,829 185 – 1,056 7,442 3,831
US government agency mortgage-related assets MBSs1 ..................................... 640 7,418 494 – – 8,552 441
US government-sponsored enterprises mortgage-related assets MBSs1 ..................................... 487 12,894 1,918 51 – 15,350 –
Other residential mortgage- related assets ........................... 1,633 4,272 – 31 2,135 8,071 2,822 Direct lending ......................... 677 – – – – 677 –MBSs1 ..................................... 956 4,272 – 31 2,135 7,394 2,822
Commercial property mortgage-related assets MBSs and MBS CDOs1 ......... 589 6,802 – 86 1,402 8,879 4,985
Leveraged finance-related assets ABSs and ABS CDOs1 ........... 784 4,489 – – 204 5,477 3,667
Student loan-related assets ABSs and ABS CDOs1 ........... 214 4,809 – 3 81 5,107 4,028
Other assets ABSs and ABS CDOs1 ........... 3,068 5,957 – 6,371 2,660 18,056 3,941
11,405 56,211 2,597 6,543 7,991 84,747 27,945
For footnotes, see page 162. The above table excludes leveraged finance transactions, which are shown separately on page 160.

H S B C H O L D I N G S P L C
Report of the Directors: Impact of Market Turmoil (continued)
Nature and extent of exposures
152
At 31 December 2007
Trading Available for sale
Held to maturity
Designated at fair value through profit or loss Total
Of which held through consolidated SPEs
US$m US$m US$m US$m US$m US$m
Sub-prime residential mortgage-related assets ..... 9,431 9,311 – 2 18,744 11,504 Direct lending ................................................... 5,825 – – – 5,825 3,596MBSs and MBS CDOs1 ................................... 3,606 9,311 – 2 12,919 7,908
US Alt-A residential mortgage-related assets ...... 3,288 14,760 173 – 18,221 11,193 Direct lending ................................................... 342 – – – 342 –MBSs1 ............................................................... 2,946 14,760 173 – 17,879 11,193
US government agency mortgage-related assets MBSs1 ............................................................... 204 5,239 552 – 5,995 –
US government-sponsored enterprises mortgage-related assets
MBSs1 ............................................................... 2,583 11,414 1,881 26 15,904 –
Other residential mortgage-related assets ............ 5,243 5,701 – 289 11,233 4,441 Direct lending ................................................... 416 – – – 416 –MBSs1 ............................................................... 4,827 5,701 – 289 10,817 4,441
Commercial property mortgage-related assets MBSs and MBS CDO1 ..................................... 3,467 10,505 – 105 14,077 8,600
Leveraged finance-related assets ABSs and ABS CDOs1 ..................................... 263 5,820 – – 6,083 5,126
Student loan-related assets ABSs and ABS CDOs1 ..................................... 144 7,052 – – 7,196 6,308
Other assets ........................................................... 6,252 10,683 – 7,736 24,671 9,495 Direct lending ................................................... 3 – – – 3 –ABSs and ABS CDOs1 ..................................... 6,249 10,683 – 7,736 24,668 9,495
30,875 80,485 2,606 8,158 122,124 56,667
For footnotes, see page 162. The above table excludes leveraged finance transactions, which are shown separately on page 160.
Included in the above table are ABSs which are held through SPEs that are consolidated by HSBC. Although HSBC includes these assets in full on its balance sheet, the risks arising from the assets are mitigated to the extent of third-party investment in notes issued by those SPEs. For a description of HSBC’s holdings of and arrangements with SPEs, see page 173.
The exposure detailed above includes long positions where risk is mitigated by specific credit derivatives with monoline insurers (‘monolines’) and other financial institutions. These positions comprise:
• residential MBSs with a carrying amount of US$0.9 billion (2007: US$2.1 billion);
• residential MBS CDOs with a carrying amount of US$39 million (2007: US$349 million); and
• ABSs other than residential MBSs and MBS CDOs with a carrying amount of US$9.8 billion (2007: US$10.8 billion).
In the tables which follow, carrying amounts and gains and losses are given for securities except those where risk is mitigated through specific credit derivatives with monolines. The counterparty credit risk arising from the derivative transactions undertaken with monolines is covered in the monoline exposure analysis on page 159.
US government-sponsored enterprises mortgage-related assets shown in the table above include holdings of securities issued by Freddie Mac of US$8.0 billion (2007: US$6.8 billion) and by Fannie Mae of US$6.6 billion (2007: US$8.5 billion).

153
HSBC’s consolidated holdings of US ABSs, and direct lending held at fair value through profit or loss
2008 At 31 December 2008
Unrealised gains and (losses)3
Realised gains and (losses)4
Fair valuemovements through equity5
Impair- ment6
Gross principal7
CDS gross protection8
Net principal exposure9
Carrying amount10
US$m US$m US$m US$m US$m US$m US$m US$m US sub-prime residential
mortgage-related assets
Direct lending ........................ (494) 7 – – 3,653 – 3,653 2,789 MBSs1 .................................... (784) 1 (1,578) – 6,845 794 6,051 3,044 – high grade2 .......................... (243) 6 (290) – 2,903 507 2,396 1,634– rated C to A ........................ (444) (4) (1,288) – 3,913 287 3,626 1,399– not publicly rated ................ (97) (1) – – 29 – 29 11
MBS CDOs1 .......................... (110) – (55) (50) 1,042 234 808 61 – high grade2 .......................... – – (78) – 172 27 145 45– rated C to A ........................ (110) – 23 (50) 870 207 663 16
(1,388) 8 (1,633) (50) 11,540 1,028 10,512 5,894
US Alt-A residential mortgage-related assets Direct lending ........................ (11) – – – 264 – 264 246 MBSs1 .................................... (737) 9 (6,416) (510) 16,860 436 16,424 7,174 – high grade2 .......................... (446) 17 (3,012) (82) 9,804 317 9,487 4,869– rated C to A ........................ (292) (7) (3,404) (428) 7,041 119 6,922 2,293– not publicly rated ................ 1 (1) – – 15 – 15 12
(748) 9 (6,416) (510) 17,124 436 16,688 7,420
US government agency mortgage-related assets MBSs1 – high grade2 .......................... 3 9 122 – 8,448 – 8,448 8,551
US government-sponsored enterprises mortgage-related assets MBSs1 – high grade2 .......................... (54) 31 270 – 15,022 – 15,022 15,349
Other US residential mortgage-related assets
Direct lending ............................ 23 (9) – – 691 – 691 677 MBSs1 .................................... (65) (37) 33 – 1,039 284 755 614 – high grade2 .......................... (63) (37) 33 – 959 262 697 574– rated C to A ........................ (2) – – – 80 22 58 40
(42) (46) 33 – 1,730 284 1,446 1,291
Commercial property mortgage-related assets
MBS and MBS CDOs1 .......... (57) (19) (1,709) – 5,797 553 5,244 3,182 – high grade2 .......................... (57) (18) (1,696) – 5,658 553 5,105 3,059– rated C to A ........................ – (1) (13) – 108 – 108 94– not publicly rated ................ – – – – 31 – 31 29
Balance carried forward ............ (2,286) (8) (9,333) (560) 59,661 2,301 57,360 41,687

H S B C H O L D I N G S P L C
Report of the Directors: Impact of Market Turmoil (continued)
Nature and extent of exposures
154
2008 At 31 December 2008
Unrealised gains and (losses)3
Realised gains and (losses)4
Fair valuemovements through equity5
Impair- ment6
Gross principal7
CDS gross protection8
Net principal exposure9
Carrying amount10
US$m US$m US$m US$m US$m US$m US$m US$m
Balance brought forward ........... (2,286) (8) (9,333) (560) 59,661 2,301 57,360 41,687
Leveraged finance-related assets ABSs and ABS CDOs1 .......... (15) – (1,000) – 5,212 551 4,661 3,390 – high grade2 ........................ (15) – (996) – 5,193 551 4,642 3,375– rated C to A ....................... – – (4) – 19 – 19 15
Student loan-related assets ABSs and ABS CDOs1 .......... (63) (4) (1,959) – 7,610 279 7,331 4,908 – high grade2 ........................ (47) (4) (1,649) – 6,888 279 6,609 4,523– rated C to A ....................... (16) – (310) – 722 – 722 385
Other assets ABS and ABS CDOs1 ........... (247) (90) (807) (33) 7,885 1,539 6,346 4,277 – high grade2 ........................ (153) (71) (589) – 5,216 1,370 3,846 2,725– rated C to A ....................... (94) (19) (218) (13) 1,916 169 1,747 805– not publicly rated .............. – – – (20) 753 – 753 747
Total ........................................... (2,611) (102) (13,099) (593) 80,368 4,670 75,698 54,262
2007 At 31 December 2007
Unrealised gains and (losses)3
Realised gains and (losses)4
Fair value movements through equity5
Impair- ment6
Gross principal7
CDS gross protection8
Net principal exposure9
Carrying amount10
US$m US$m US$m US$m US$m US$m US$m US$m US sub-prime residential
mortgage-related assets11
Direct lending ......................... (385) (251) – – 6,288 – 6,288 5,825 MBSs1 ..................................... (564) (69) (290) – 9,576 657 8,919 7,981
– high grade2 ........................ (121) (10) (289) – 9,079 647 8,432 7,807– rated C to A ....................... (275) (36) (1) – 462 10 452 153– not publicly rated .............. (168) (23) – – 35 – 35 21
MBS CDOs1 ............................ (21) – (45) – 1,157 652 505 440 – high grade2 ........................ (19) – (40) – 923 454 469 411– rated C to A ....................... (2) – (5) – 234 198 36 29
(970) (320) (335) – 17,021 1,309 15,712 14,246
US Alt-A residential mortgage-related assets Direct lending ......................... – – – – 341 – 341 342 MBSs1 ..................................... (128) (36) (802) – 19,175 205 18,970 17,708
– high grade2 ........................ (122) (6) (802) – 19,099 205 18,894 17,640– rated C to A ....................... (6) (30) – – 64 – 64 56– not publicly rated .............. – – – – 12 – 12 12
(128) (36) (802) – 19,516 205 19,311 18,050
US government agency mortgage-related assets
MBSs1 – high grade2 ........................ 2 3 49 – 5,996 – 5,996 5,995
Balance carried forward ............ (1,096) (353) (1,088) – 42,533 1,514 41,019 38,291

155
2007 At 31 December 2007
Unrealised gains and (losses)3
Realised gains and (losses)4
Fair value movements through equity5
Impair- ment6
Gross principal7
CDS gross protection8
Net principal exposure9
Carrying amount10
US$m US$m US$m US$m US$m US$m US$m US$m
Balance brought forward ........... (1,096) (353) (1,088) – 42,533 1,514 41,019 38,291
US government-sponsored enterprises mortgage-related assets MBSs1 – high grade2 .......................... 12 (39) 3 – 16,125 – 16,125 15,904
Other US residential mortgage-related assets
Direct lending ........................ (10) (29) – – 424 – 424 416 MBSs1 .................................... (34) – (1) – 1,587 821 766 756 – high grade2 .......................... (30) – (1) – 1,565 799 766 756– rated C to A ........................ (4) – – – 22 22 – –
(44) (29) (1) – 2,011 821 1,190 1,172
Commercial property mortgage-related assets
MBS and MBS CDOs1 .......... (30) – (141) – 5,981 685 5,296 5,196 – high grade2 .......................... (30) – (141) – 5,760 685 5,075 4,983– not publicly rated ................ – – – – 221 – 221 213
Leveraged finance-related assets ABSs and ABS CDOs1 – high grade2 .......................... (6) – (89) – 4,930 322 4,608 4,432
Student loan-related assets ABSs and ABS CDOs1 .......... 5 – (338) – 7,352 – 7,352 7,196 – high grade2 .......................... 7 – (338) – 7,312 – 7,312 7,159– rated C to A ........................ (2) – – – 40 – 40 37
Other assets ABS and ABS CDOs1 ........... (100) (3) (134) – 8,943 2,735 6,208 6,204 – high grade2 .......................... (99) (3) (134) – 8,233 2,707 5,526 5,557– rated C to A ........................ (1) – – – 595 28 567 550– not publicly rated ................ – – – – 115 – 115 97
Total ........................................... (1,259) (424) (1,788) – 87,875 6,077 81,798 78,395
For footnotes, see page 162.
HSBC’s consolidated holdings of UK ABSs, and direct lending held at fair value through profit or loss
2008 At 31 December 2008
Unrealised gains and (losses)3
Realised gains and (losses)4
Fair valuemovements through equity5
Impair- ment6
Gross principal7
CDS gross protection8
Net principal exposure9
Carrying amount10
US$m US$m US$m US$m US$m US$m US$m US$m UK non-conforming residential
mortgage-related assets
MBSs1 ..................................... (3) – (294) – 1,425 – 1,425 1,100 – high grade2 ........................ (1) – (268) – 1,349 – 1,349 1,051 – rated C to A ....................... (2) – (26) – 76 – 76 49
Other UK residential mortgage-related assets MBSs1 ..................................... (47) (8) (709) – 5,781 – 5,781 4,568
– high grade2 ........................ (27) (10) (694) – 5,289 – 5,289 4,185 – rated C to A ....................... (20) 2 (15) – 488 – 488 382 – not publicly rated .............. – – – – 4 – 4 1
Balance carried forward ............ (50) (8) (1,003) – 7,206 – 7,206 5,668

H S B C H O L D I N G S P L C
Report of the Directors: Impact of Market Turmoil (continued)
Nature and extent of exposures
156
2008 At 31 December 2008
Unrealised gains and (losses)3
Realised gains and (losses)4
Fair valuemovements through equity5
Impair- ment6
Gross principal7
CDS gross protection8
Net principal exposure9
Carrying amount10
US$m US$m US$m US$m US$m US$m US$m US$m
Balance brought forward ........... (50) (8) (1,003) – 7,206 – 7,206 5,668
Commercial property mortgage-related assets
MBS and MBS CDOs1 ........... (112) (6) (571) – 3,836 – 3,836 3,017 – high grade2 ........................ (83) (6) (560) – 3,665 – 3,665 2,910 – rated C to A ....................... (29) – (11) – 156 – 156 101 – not publicly rated .............. – – – – 15 – 15 6
Leveraged finance-related assets ABSs and ABS CDOs1
– high grade2 ........................ – – (77) – 761 384 377 293
Student loan-related assets ABSs and ABS CDOs1
– high grade2 ........................ – – – – 98 – 98 55
Other assets ABS and ABS CDOs1.............. (10) (4) (413) – 7,623 5,102 2,521 1,997
– high grade2 ........................ (8) (4) (52) – 1,751 – 1,751 1,607 – rated C to A ....................... (2) – (361) – 770 – 770 390 – not publicly rated .............. – – – – 5,102 5,102 – –
Total ........................................... (172) (18) (2,064) – 19,524 5,486 14,038 11,030
2007 At 31 December 2007
Unrealised gains and (losses)3
Realised gains and (losses)4
Fair value movements through equity5
Impair- ment6
Gross principal7
CDS gross protection8
Net principal exposure9
Carrying amount10
US$m US$m US$m US$m US$m US$m US$m US$m UK non-conforming residential
mortgage-related assets
MBSs1 ..................................... (5) – (15) – 3,355 – 3,355 3,211 – high grade2 ........................ (3) – (15) – 3,321 – 3,321 3,183 – rated C to A ....................... (2) – – – 28 – 28 24 – not publicly rated .............. – – – – 6 – 6 4
Other UK residential mortgage-related assets MBSs1 ..................................... (53) (14) (121) – 5,943 – 5,943 5,640
– high grade2 ........................ (22) (14) (118) – 5,411 – 5,411 5,156 – rated C to A ....................... (31) – (3) – 520 – 520 472 – not publicly rated .............. – – – – 12 – 12 12
Commercial property mortgage-related assets
MBS and MBS CDOs1 ........... (64) (2) (40) – 5,330 – 5,330 4,902 – high grade2 ........................ (54) (2) (39) – 4,437 – 4,437 4,095 – rated C to A ....................... (10) – (1) – 173 – 173 113 – not publicly rated .............. – – – – 720 – 720 694
Leveraged finance-related assets ABSs and ABS CDOs1 ........... – – (8) – 675 330 345 336
– high grade2 ........................ – – (8) – 366 21 345 336 – not publicly rated .............. – – – – 309 309 – –
Other assets ABS and ABS CDOs1 ............. (13) – (38) – 9,385 6,802 2,583 2,511
– high grade2 ........................ (8) – (38) – 2,225 – 2,225 2,170 – rated C to A ....................... (5) – – – 26 – 26 29 – not publicly rated .............. – – – – 7,134 6,802 332 312
Total ........................................... (135) (16) (222) – 24,688 7,132 17,556 16,600
For footnotes, see page 162.

157
HSBC’s consolidated holdings of ABSs, and direct lending held at fair value through profit or loss, other than those supported by US and UK-originated assets
2008 At 31 December 2008
Unrealised gains and (losses)3
Realised gains and (losses)4
Fair valuemovements through equity5
Impair- ment6
Gross principal7
CDS gross protection8
Net principal exposure9
Carrying amount10
US$m US$m US$m US$m US$m US$m US$m US$m Non-US and non-UK non-
sub-prime residential mortgage-related assets
MBSs1 ..................................... – – – (8) 47 – 47 39
– high grade2 ........................ – – – (8) 46 – 46 38 – rated C to A ....................... – – – – 1 – 1 1
MBS CDOs1 ............................ (15) – (3) – 53 – 53 26 – high grade2 ........................ (14) – (3) – 40 – 40 23 – rated C to A ....................... (1) – – – 11 – 11 1 – not publicly rated .............. – – – – 2 – 2 2
Other non-US and non-UK residential mortgage-related assets MBSs1 ..................................... (66) (27) (62) – 2,411 – 2,411 2,051
– high grade2 ........................ (59) (28) (62) – 2,184 – 2,184 1,878 – rated C to A ....................... (6) – – – 149 – 149 127 – not publicly rated .............. (1) 1 – – 78 – 78 46
Commercial property mortgage-related assets
MBS and MBS CDOs1 ........... (123) (2) (463) – 3,051 – 3,051 2,311 – high grade2 ........................ (91) (14) (453) – 2,928 – 2,928 2,234 – rated C to A ....................... (32) 12 (7) – 112 – 112 69 – not publicly rated .............. – – (3) – 11 – 11 8
Leveraged finance-related assets ABSs and ABS CDOs1
– high grade2 ........................ (4) 1 (229) – 1,419 1 1,418 1,098
Other assets ABS and ABS CDOs1 ............. (209) (13) (241) (51) 5,604 1,853 3,751 3,188
– high grade2 ........................ (168) (6) (92) – 4,379 1,679 2,700 2,199 – rated C to A ....................... (41) (7) (149) – 906 174 732 707 – not publicly rated .............. – – – (51) 319 – 319 282
Total ........................................... (417) (41) (998) (59) 12,585 1,854 10,731 8,713
2007 At 31 December 2007
Unrealised gains and (losses)3
Realised gains and (losses)4
Fair value movements through equity5
Impair- ment6
Gross principal7
CDS gross protection8
Net principal exposure9
Carrying amount10
US$m US$m US$m US$m US$m US$m US$m US$m Non-US and non-UK non-
sub-prime residential mortgage-related assets
MBSs1 .................................... – – – – 624 – 624 385 – high grade2 ........................ – – – – 447 – 447 279 – rated C to A ....................... – – – – 104 – 104 38 – not publicly rated .............. – – – – 73 – 73 68
Other non-US and non-UK residential mortgage-related assets MBSs1 .................................... (20) (10) (6) – 4,001 814 3,187 3,055 – high grade2 .......................... (16) (8) (6) – 3,703 710 2,993 2,869 – rated C to A ........................ (6) – – – 130 90 40 36 – not publicly rated ................ 2 (2) – – 168 14 154 150
Balance carried forward ............ (20) (10) (6) – 4,625 814 3,811 3,440

H S B C H O L D I N G S P L C
Report of the Directors: Impact of Market Turmoil (continued)
Nature and extent of exposures > Monolines
158
2007 At 31 December 2007
Unrealised gains and (losses)3
Realised gains and (losses)4
Fair value movements through equity5
Impair- ment6
Gross principal7
CDS gross protection8
Net principal exposure9
Carrying amount10
US$m US$m US$m US$m US$m US$m US$m US$m
Balance brought forward ........... (20) (10) (6) – 4,625 814 3,811 3,440
Commercial property mortgage-related assets
MBS and MBS CDOs1 .......... (9) – (20) – 3,576 238 3,338 3,051 – high grade2 .......................... (6) – (20) – 3,212 102 3,110 2,827 – rated C to A ........................ (3) – – – 185 136 49 49 – not publicly rated ................ – – – – 179 – 179 175
Leveraged finance-related assets ABSs and ABS CDOs1 .......... (3) – (20) – 1,356 3 1,353 1,315 – high grade2 .......................... (3) – (20) – 1,281 2 1,279 1,244 – not publicly rated ................ – – – – 75 1 74 71
Other assets Direct lending ........................ – – – – 3 – 3 3 ABS and ABS CDOs1 ........... (2) 6 (18) (36) 7,929 1,702 6,227 6,113 – high grade2 .......................... (5) (2) (18) (36) 7,310 1,443 5,867 5,550 – rated C to A ........................ – 5 – – 547 259 288 522 – not publicly rated ................ 3 3 – – 72 – 72 41
(2) 6 (18) (36) 7,932 1,702 6,230 6,116
Total ........................................... (34) (4) (64) (36) 17,489 2,757 14,732 13,922
For footnotes, see page 162.
The following table shows the vintages of the collateral assets supporting HSBC’s holdings of US sub-prime and Alt-A MBSs. Market prices for these instruments generally incorporate higher discounts
for later vintages. The majority of HSBC’s holdings of US sub-prime MBSs are originated pre-2007; holdings of US Alt-A MBSs are more evenly distributed between pre- and post-2007 vintages.
Vintages of US sub-prime and Alt-A mortgage-backed securities
Gross principal7 of US sub-prime mortgage-backed securities
at 31 December
Gross principal7 of US Alt-A mortgage-backed securities
at 31 December 2008 2007 2008 2007 US$m US$m US$m US$m Mortgage vintage Pre-2006 ........................................................................ 2,012 3,170 2,695 2,870 2006 .............................................................................. 4,287 5,186 7,712 7,777 2007 .............................................................................. 1,588 2,377 6,453 8,528
7,887 10,733 16,860 19,175
For footnotes, see page 162.
Transactions with monoline insurers
HSBC’s exposure to derivative transactions entered into directly with monoline insurers
HSBC’s principal exposure to monolines is through a number of over-the-counter (‘OTC’) derivative transactions, mainly credit default swaps (‘CDS’s). HSBC entered into these CDSs primarily to purchase credit protection against securities held within the trading portfolio.
During 2008, the notional value of contracts with monolines decreased as certain transactions
were commuted and others matured. Nevertheless, HSBC’s overall credit exposure to monolines increased as the fair value of the underlying securities declined, causing the value of the CDS protection purchased to increase. The table below sets out the fair value, essentially the replacement cost, of the derivative transactions at 31 December 2008, and hence the amount at risk if the CDS protection purchased were to be wholly ineffective because, for example, the monoline insurer was unable to meet its obligations. In order to illustrate that risk, the value of protection purchased is shown

159
subdivided between those monolines that were rated by S&P at ‘BBB or above’ at 31 December 2008, and those that were ‘below BBB’ (‘BBB’ is the S&P cut-off for an investment grade classification). As certain monolines were downgraded during 2008, exposure to monolines rated ‘below BBB’ at 31 December 2008 increased from the position as at 31 December 2007. The ‘Credit risk adjustment’
column indicates the valuation adjustment (the provision) taken against the net exposures, and reflects the assessed loss of value on purchased protection arising from the deterioration in creditworthiness of the monolines. These valuation adjustments, which reflect a measure of the irrecoverability of the protection purchased, have been charged to the income statement.
HSBC’s exposure to derivative transactions entered into directly with monoline insurers
Notional amount
Net exposure before credit risk adjustment12
Credit risk adjustment13
Net exposure after credit risk adjustment
US$m US$m US$m US$m At 31 December 2008 Derivative transactions with monoline counterparties
Monoline – BBB or above ....................................... 9,627 2,829 (740) 2,089 Monoline – below BBB ........................................... 2,731 1,104 (752) 352
12,358 3,933 (1,492) 2,441
At 31 December 2007 Derivative transactions with monoline counterparties
Monoline – BBB or above ....................................... 14,314 1,342 (133) 1,209 Monoline – below BBB ........................................... 1,120 214 (214) –
15,434 1,556 (347) 1,209
For footnotes, see page 162.
The above table can be analysed as follows. HSBC has derivative transactions referenced to underlying securities with a nominal value of US$12.4 billion, whose value at 31 December 2008 indicated a potential claim against the protection purchased from the monolines of some US$3.9 billion. On the basis of a credit assessment of the standing of the monolines, a provision of US$1.5 billion has been taken, leaving US$2.4 billion exposed, of which US$2.1 billion is recoverable from monolines rated investment grade at 31 December 2008. The provisions taken imply in aggregate that 74 cents in the dollar will be recoverable from investment grade monolines and 32 cents in the dollar from non-investment grade monolines.
HSBC’s exposure to direct lending and irrevocable commitments to lend to monoline insurers
HSBC has outstanding liquidity facilities totalling US$47 million to monoline insurers, of which US$2 million was drawn at 31 December 2008 (2007: US$158 million, none drawn).
HSBC’s exposure to debt securities which benefit from guarantees provided by monoline insurers
Within both the trading and available-for-sale portfolios, HSBC holds bonds that are ‘wrapped’ with a credit enhancement from a monoline insurer. As the bonds are traded explicitly with the benefit of this enhancement, any deterioration in the credit profile of the monoline insurer is reflected in market prices and, therefore, in the carrying amount of these securities on HSBC’s balance sheet at 31 December 2008. For wrapped bonds held in the trading portfolio, the mark-to-market movement has been reflected through the income statement. For wrapped bonds held in the available-for-sale portfolio, the mark-to-market movement is reflected in equity unless there is objective evidence of impairment, in which case the impairment loss is reflected in the income statement. No wrapped bonds were included in the reclassification of financial assets described on page 145.

H S B C H O L D I N G S P L C
Report of the Directors: Impact of Market Turmoil (continued)
Nature and extent of exposures > Monolines / Leveraged finance
160
HSBC’s exposure to Credit Derivative Product Companies
CDPCs are independent companies that specialise in selling credit default protection on corporate exposures. As corporate credit spreads widened during the second half of 2008, increasing the potential value of claims against the CDPCs, the creditworthiness of CDPCs became a focus. At 31 December 2008, HSBC had purchased credit protection from CDPCs with a notional value of US$6.4 billion (2007: US$5.7 billion) which had a fair value (essentially, replacement cost) of US$1.2 billion (2007: US$218 million), against which a credit risk adjustment (a provision) of US$228 million (2007: nil) was held. All of the fair value exposures at 31 December 2008 and 2007 represented exposure to CDPCs with investment grade ratings.
Leveraged finance transactions
Leveraged finance transactions include sub-investment grade acquisition or event-driven financing. During the second half of 2008, HSBC reclassified US$6.5 billion of leveraged finance loans from the held-for-trading category to loans and receivables as detailed on page 146 as its intention now is to hold these assets for the foreseeable future or until maturity. Impairment on these reclassified assets is now recognised on an incurred loss basis. The following tables show HSBC’s gross commitments and exposure to leveraged finance transactions arising from primary transactions and the movement in that leveraged finance exposure in the year. HSBC’s additional exposure to leveraged finance loans through holdings of ABSs from its trading and investment activities is shown in the tables on pages 151 and 152.
HSBC’s gross commitments to leveraged finance transactions by geographical segment
Funded commitments
Unfunded commitments
Total commitments
US$m US$m US$m At 31 December 2008 Europe .............................................................................................................. 3,818 543 4,361 Rest of Asia-Pacific ......................................................................................... 25 12 37 North America ................................................................................................. 1,987 268 2,255
5,830 823 6,653
Funded commitments
Unfunded commitments
Total commitments
US$m US$m US$m At 31 December 2007 Europe .................................................................................................................. 4,004 1,822 5,826 Hong Kong .......................................................................................................... – 160 160 Rest of Asia-Pacific ............................................................................................. 45 182 227 North America ..................................................................................................... 1,991 733 2,724
6,040 2,897 8,937
HSBC’s exposure to leveraged finance transactions
At 31 December
Funded exposures14
Unfunded exposures15
Total exposures
US$m US$m US$m
2008 Europe .................................................................................................................. 3,554 480 4,034 Rest of Asia-Pacific ............................................................................................. 25 12 37 North America ..................................................................................................... 1,825 258 2,083
5,404 750 6,154
Held within: – loans and receivables .................................................................................... 5,401 482 5,883 – fair value through the profit or loss .............................................................. 3 268 271

161
At 31 December
Funded exposures14
Unfunded exposures15
Total exposures
US$m US$m US$m
2007 Europe .................................................................................................................. 3,903 1,813 5,716 Hong Kong .......................................................................................................... – 160 160 Rest of Asia-Pacific ............................................................................................. 45 182 227 North America ..................................................................................................... 1,917 722 2,639
5,865 2,877 8,742
Held within: – loans and receivables .................................................................................... 424 546 970 – fair value through the profit or loss .............................................................. 5,441 2,331 7,772
For footnotes, see page 162.
Movement in leveraged finance exposures
Funded exposures14
Unfunded exposures15
Total exposures
US$m US$m US$m
At 31 December 2007 .......................................................................................... 5,865 2,877 8,742 Additions .............................................................................................................. 128 647 775 Fundings .............................................................................................................. 834 (834) – Sales, repayments and other movements ............................................................ (1,184) (1,875) (3,059)Write-downs ........................................................................................................ (239) (65) (304)
At 31 December 2008 .......................................................................................... 5,404 750 6,154
For footnotes, see page 162.
The fall in unfunded exposures during 2008 primarily relates to the depreciation in sterling against the US dollar.
As described in the background to market turmoil on page 144, the dislocation of financial
markets developed in the second half of 2007 and continued throughout 2008. Consequently, income statement write-downs on leveraged finance transactions are presented for the three half-year periods affected to date.
Half-year to
31 December 2008
30 June 2008
31 December 2007
US$m US$m US$m
Write-downs taken to income statement ......................................................... – 278 195 Impairment of leveraged finance loans taken to the income statement .......... 26 – –
For footnotes, see page 162.
As a result of the reclassification of certain leveraged finance loans from held-for-trading to loans and receivables, write-downs of US$1.2 billion were not taken to the income statement for the half year to 31 December 2008.
At 31 December 2008, HSBC’s principal exposures were to companies in two sectors:
US$3.6 billion to data processing (2007: US$3.8 billion) and US$1.7 billion to communications and infrastructure (2007: US$2.7 billion). During the year, 99 per cent of the total write-downs were against exposures in these two sectors.

H S B C H O L D I N G S P L C
Interim Management Report: Impact of Market Turmoil (continued)
Footnotes / Fair values of financial instruments / FV
162
Footnotes to ‘Nature and extent of HSBC’s exposures’ 1 Mortgage-backed securities (‘MBSs’), asset-backed securities (‘ABSs’) and collateralised debt obligations (‘CDOs’). 2 High grade assets rated AA or AAA. 3 Unrealised gains and losses on the net principal exposure (see footnote 9) recognised in the income statement as a result of changes in
the fair value of the asset, adjusted for the cumulative amount of transfers to realised gains and losses as a result of the disposal of assets.
4 Realised gains and losses on the net principal exposure (see footnote 9) recognised in the income statement as a result of the disposal of assets.
5 Fair value gains and losses on the net principal exposure (see footnote 9) recognised in equity as a result of the changes in the fair value of available-for-sale assets, adjusted for transfers from the available-for-sale reserve to the income statement as a result of impairment, and adjusted for transfers to realised gains and losses following the disposal of assets.
6 Impairment losses recognised in the income statement in respect of the net principal exposure (see footnote 9) of available-for-sale and held-to-maturity assets.
7 The gross principal is the redemption amount on maturity or, in the case of an amortising instrument, the sum of the future redemption amounts through the residual life of the security.
8 A CDS is a credit default swap. CDS gross protection is the gross principal of the underlying instrument that is protected by CDSs. 9 Net principal exposure is the gross principal amount of assets that are not protected by CDSs. It includes assets that benefit from
monoline protection, except where this protection is purchased with a CDS. 10 Carrying amount of the net principal exposure. 11 During 2008, the Group reclassified holdings of HELoCs to US sub-prime residential mortgage-related assets from Other US
residential mortgage-related assets, and restated the amounts of certain direct lending exposures presented in the ABS tables to show the gross carrying amount of assets on the consolidated balance sheet rather than the net exposure, consistent with other direct lending exposures. 2007 amounts have been restated accordingly, resulting in an increase of US$6.3 billion in the reported balance of US sub-prime mortgage-related assets as at 31 December 2007.
12 Net exposure after legal netting and any other relevant credit mitigation prior to deduction of the credit risk adjustment. 13 Cumulative fair value adjustment recorded against OTC derivative counterparty exposures to reflect the creditworthiness of the
counterparty. 14 Funded exposure represents the loan amount advanced to the customer, less any fair value write-downs, net of fees held on deposit. 15 Unfunded exposures represent the contractually committed loan facility amount not yet drawn down by the customer, less any fair value
write-downs, net of fees held on deposit.
Fair values of financial instruments (Audited)
The classification of financial instruments is determined in accordance with the accounting policies set out in Note 2 on the Financial Statements, and the use of assumptions and estimation in respect of valuation of financial instruments as described on page 63. The following is a description of HSBC’s methods of determining fair value and its related control framework, and a quantification of its exposure to financial instruments measured at fair value.
Fair value is the amount for which an asset could be exchanged, or a liability settled, between knowledgeable, willing parties in an arm’s length transaction.
Financial instruments measured at fair value on an ongoing basis include trading assets and liabilities, instruments designated at fair value, derivatives and financial investments classified as available for sale (including treasury and other eligible bills, debt securities, and equity securities).
Fair values of financial instruments carried at fair value
Control framework
Fair values are subject to a control framework designed to ensure that they are either determined or validated by a function independent of the risk-taker.
To this end, ultimate responsibility for the determination of fair values lies with Finance, which reports functionally to the Group Finance Director. Finance establishes the accounting policies and procedures governing valuation, and is responsible for ensuring that they comply with all relevant accounting standards.
For all financial instruments where fair values are determined by reference to externally quoted prices or observable pricing inputs to models, independent price determination or validation is utilised. In inactive markets, direct observation of a traded price may not be possible. In these circumstances, HSBC will source alternative market information to validate the financial instrument’s fair value, with greater weight given to information that is considered to be more relevant and reliable. The factors that are considered in this regard are, inter alia:
• the extent to which prices may be expected to represent genuine traded or tradeable prices;
• the degree of similarity between financial instruments;
• the degree of consistency between different sources;
• the process followed by the pricing provider to derive the data;

163
• the elapsed time between the date to which the market data relates and the balance sheet date; and
• the manner in which the data was sourced.
Models provide a logical framework for the capture and processing of necessary valuation inputs. For fair values determined using a valuation model, the control framework may include, as applicable, independent development or validation of (i) the logic within valuation models; (ii) the inputs to those models; (iii) any adjustments required outside the valuation models; and, (iv) where possible, model outputs. Valuation models are subject to a process of due diligence and calibration before becoming operational and are calibrated against external market data on an ongoing basis.
The results of the independent validation process are reported to, and considered by, Valuation Committees. Valuation Committees are composed of valuation experts from several independent support functions (Product Control, Market Risk Management, Derivative Model Review Group and Finance) in addition to senior management. The members of each Valuation Committee consider the appropriateness and adequacy of the fair value adjustments and the effectiveness of valuation models. If necessary, they may require changes to model calibration or calibration procedures. The Valuation Committees are overseen by the Valuation Committee Review Group, which consists of Heads of Global Banking and Markets’ Finance and Risk Functions. All subjective valuation items with a potential impact in excess of US$5 million are reported to the Valuation Committee Review Group.
Determination of fair value
Fair values are determined according to the following hierarchy:
• Quoted market price: financial instruments with quoted prices for identical instruments in active markets.
• Valuation technique using observable inputs: financial instruments with quoted prices for similar instruments in active markets or quoted prices for identical or similar instruments in inactive markets and financial instruments valued using models where all significant inputs are observable.
• Valuation technique with significant unobservable inputs: financial instruments valued using valuation techniques where one or more significant inputs are unobservable.
The best evidence of fair value is a quoted price in an actively traded market. In the event that the market for a financial instrument is not active, a valuation technique is used.
The judgement as to whether a market is active may include, but is not restricted to, the consideration of factors such as the magnitude and frequency of trading activity, the availability of prices and the size of bid/offer spreads. In inactive markets, obtaining assurance that the transaction price provides evidence of fair value or determining the adjustments to transaction prices that are necessary to measure the fair value of the instrument requires additional work during the valuation process.
The majority of valuation techniques employ only observable market data, and so the reliability of the fair value measurement is high. However, certain financial instruments are valued on the basis of valuation techniques that feature one or more significant market inputs that are unobservable, and for them, the derivation of fair value is more judgemental. An instrument in its entirety is classified as valued using significant unobservable inputs if, in the opinion of management, a significant proportion of the instrument’s balance sheet value and/or inception profit (‘day 1 gain or loss’) is driven by unobservable inputs. ‘Unobservable’ in this context means that there is little or no current market data available from which to determine the price at which an arm’s length transaction would be likely to occur. It generally does not mean that there is no market data available at all upon which to base a determination of fair value (consensus pricing data may, for example, be used). Furthermore, in some cases the majority of the fair value derived from a valuation technique with significant unobservable inputs may be attributable to observable inputs. Consequently, the effect of uncertainty in determining unobservable inputs will generally be restricted to uncertainty about the overall fair value of the financial instrument being measured. To help in understanding the extent and the range of this uncertainty, additional information is provided in the section headed ‘Effect of changes in significant unobservable assumptions to reasonably possible alternatives’ below.
In certain circumstances, primarily where debt is hedged with interest rate derivatives or structured notes issued, HSBC records its own debt in issue at fair value, based on quoted prices in an active market for the specific instrument concerned, if available. When quoted market prices are unavailable, the own debt in issue is valued using valuation techniques, the inputs for which are either based upon quoted

H S B C H O L D I N G S P L C
Report of the Directors: Impact of Market Turmoil (continued)
Fair values of financial instruments > at fair value
164
prices in an inactive market for the instrument, or are estimated by comparison with quoted prices in an active market for similar instruments. In both cases, the fair value includes the effect of applying the credit spread which is appropriate to HSBC’s liabilities. For all issued debt securities, discounted cash flow modelling is used to separate the change in fair value that may be attributed to HSBC’s credit spread movements from movements in other market factors such as benchmark interest rates or foreign exchange rates. Specifically, the change in fair value of issued debt securities attributable to the Group’s own credit spread is computed as follows: for each security at each reporting date, an externally verifiable price is obtained or a price is derived using credit spreads for similar securities for the same issuer. Then, using discounted cash flow, each security is valued using a risk-free discount curve. The difference in the valuations is attributable to the Group’s own credit spread. This methodology is applied consistently across all securities.
Structured notes issued and certain other hybrid instrument liabilities are included within trading liabilities and are measured at fair value. The credit spread applied to these instruments is derived from the spreads at which HSBC issues structured notes. These market spreads are significantly smaller than credit spreads observed for plain vanilla debt or in the credit default swap markets.
Gains and losses arising from changes in the credit spread of liabilities issued by HSBC reverse over the contractual life of the debt, provided that the debt is not repaid early.
All net positions in non-derivative financial instruments, and all derivative portfolios, are valued at bid or offer prices as appropriate. Long positions are marked at bid prices; short positions are marked at offer prices.
The fair value of a portfolio of financial instruments quoted in an active market is calculated as the product of the number of units and its quoted price and no block discounts are made.
The valuation techniques used when quoted market prices are not available incorporate certain assumptions that HSBC believes would be made by a market participant to establish fair value. When HSBC considers that there are additional considerations not included within the valuation model, appropriate adjustments may be made. Examples of such adjustments are:
• Credit risk adjustment: an adjustment to reflect the creditworthiness of OTC derivative counterparties.
• Market data/model uncertainty: an adjustment to reflect uncertainties in fair values based on unobservable market data inputs (for example, as a result of illiquidity), or in areas where the choice of valuation model is particularly subjective.
• Inception profit (‘day 1 gain or loss’): for financial instruments valued at inception on the basis of one or more significant unobservable inputs, the difference between transaction price and model value, as adjusted, at inception (the day 1 gain or loss) is not recognised in the consolidated income statement, but is deferred. An analysis of the movement in the deferred day 1 gain or loss is provided on page 400.
Transaction costs are not included in the fair value calculation, nor are the future costs of administering the OTC derivative portfolio. These, along with trade origination costs such as brokerage fees and post-trade costs, are included either in fee expense or in operating expenses.
A detailed description of the valuation techniques applied to instruments of particular interest follows:
• Private equity
HSBC’s private equity positions are generally classified as available for sale and are not traded in active markets. In the absence of an active market, an investment’s fair value is estimated on the basis of an analysis of the investee’s financial position and results, risk profile, prospects and other factors, as well as by reference to market valuations for similar entities quoted in an active market, or the price at which similar companies have changed ownership. The exercise of judgement is required because of uncertainties inherent in estimating fair value for private equity investments.
• Debt securities, treasury and other eligible bills, and equities
The fair value of these instruments is based on quoted market prices from an exchange, dealer, broker, industry group or pricing service, when available. When they are unavailable, the fair value is determined by reference to quoted market prices for similar instruments, adjusted as appropriate for the specific circumstances of the instruments.
Illiquidity and a lack of transparency in the market for debt securities backed by US sub-prime mortgages has resulted in less observable

165
data being available. While quoted market prices are generally used to determine the fair value of these securities, valuation models are used to substantiate the reliability of the limited market data available and to identify whether any adjustments to quoted market prices are required.
In the absence of quoted market prices, fair value is determined using valuation techniques based on the calculation of the present value of expected future cash flows of the assets. The inputs to these valuation techniques are derived from observable market data and, where relevant, assumptions in respect of unobservable inputs. In respect of ABSs and mortgages, the assumptions may include prepayment speeds, default rates and loss severity based on collateral type, and performance as appropriate. The output from the valuation techniques is benchmarked for consistency against observable data.
• Derivatives
OTC (i.e. non-exchange traded) derivatives are valued using valuation models. Valuation models calculate the present value of expected future cash flows, based upon ‘no-arbitrage’ principles. For many vanilla derivative products, such as interest rate swaps and European options, the modelling approaches used are standard across the industry. For more complex derivative products, there may be some differences in market practice. Inputs to valuation models are determined from observable market data wherever possible, including prices available from exchanges, dealers, brokers or providers of consensus pricing. Certain inputs may not be observable in the market directly, but can be determined from observable prices via model calibration
procedures. Finally, some inputs are not observable, but can generally be estimated from historical data or other sources. Examples of inputs that are generally observable include foreign exchange spot and forward rates, benchmark interest rate curves and volatility surfaces for commonly traded option products. Examples of inputs that may be unobservable include volatility surfaces, in whole or in part, for less commonly traded option products, and correlations between market factors.
• Loans including leveraged loans and loans held for securitisation
Loans held at fair value are valued from broker quotes and/or market data consensus providers when available. In the absence of an observable market, the fair value is determined using valuation techniques including discounted cash flow models, which incorporate assumptions regarding an appropriate credit spread for the loan derived from other market instruments issued by the same or comparable entities.
• Structured notes
The fair value of structured notes valued using a valuation technique is derived from the fair value of the underlying debt security as described above, and the fair value of the embedded derivative is determined as described in the paragraph above on derivatives.
Fair value valuation bases
The following table provides an analysis of the various bases described above which have been deployed for valuing financial assets and financial liabilities measured at fair value in the consolidated financial statements:
Bases of valuing financial assets and liabilities measured at fair value
Valuation techniques
Quoted market price
Using observable inputs
With significant unobservable inputs Total
US$m US$m US$m US$m At 31 December 2008 Assets Trading assets .................................................................. 234,399 185,369 7,561 427,329 Financial assets designated at fair value ......................... 14,590 13,483 460 28,533 Derivatives ....................................................................... 8,495 476,498 9,883 494,876 Financial investments: available for sale ........................ 103,949 173,157 9,116 286,222
Liabilities Trading liabilities ............................................................. 105,584 135,559 6,509 247,652 Financial liabilities designated at fair value .................... 23,311 51,276 – 74,587 Derivatives ....................................................................... 9,896 473,359 3,805 487,060

H S B C H O L D I N G S P L C
Report of the Directors: Impact of Market Turmoil (continued)
Fair values of financial instruments > at fair value
166
Valuation techniques
Quoted market price
Using observable inputs
With significant unobservable inputs Total
US$m US$m US$m US$m At 31 December 2007 Assets Trading assets .................................................................. 209,339 222,678 13,951 445,968 Financial assets designated at fair value ......................... 28,565 12,694 305 41,564 Derivatives ....................................................................... 8,132 175,493 4,229 187,854 Financial investments: available for sale ........................ 77,045 187,677 8,510 273,232
Liabilities Trading liabilities ............................................................. 140,629 167,967 5,984 314,580 Financial liabilities designated at fair value .................... 37,709 52,230 – 89,939 Derivatives ....................................................................... 8,879 171,444 3,070 183,393
The main drivers of the movement in the balances of assets and liabilities measured at fair value with significant unobservable inputs were an increase in the fair value of derivative assets and liabilities due to market conditions, and a reduction in the level of ABSs and loans held at fair value due
either to disposal, repayment or reclassification. At 31 December 2008, financial instruments measured at fair value using a valuation technique with significant unobservable inputs represented 2 per cent of total assets and liabilities measured at fair value (31 December 2007: 2 per cent).
Financial instruments measured at fair value using a valuation technique with significant unobservable inputs
Assets Liabilities
Available for sale
Held for trading
Designated at fair value through profit or loss Derivatives
Held for trading
Designated at fair value through profit or loss
Derivatives US$m US$m US$m US$m US$m US$m US$m At 31 December 2008 Private equity investments ........... 2,689 54 225 – – – – Asset-backed securities ............... 4,264 882 – 95 – – 565 Leveraged finance ....................... – 266 – – – – 33 Loans held for securitisation ....... – 2,133 – – – – – Structured notes ........................... – 87 – – 5,294 – – Derivatives with monolines ......... – – – 2,441 – – – Other derivatives .......................... – – – 7,347 – – 3,207 Other portfolios ............................ 2,163 4,139 235 – 1,215 – –
9,116 7,561 460 9,883 6,509 – 3,805
At 31 December 2007 Private equity investments ........... 3,037 – – – – – – Asset-backed securities ............... 4,223 2,073 – – – – – Leveraged finance ....................... – 3,349 – – – – – Loans held for securitisation ........ – 5,100 – – – – – Structured notes ........................... – – – – 5,396 – – Derivatives with monolines ......... – – – 1,010 – – – Other derivatives .......................... – – – 3,219 – – 3,070 Other portfolios ............................ 1,250 3,429 305 – 588 – –
8,510 13,951 305 4,229 5,984 – 3,070
At 31 December 2008, available-for-sale assets valued using a valuation technique with significant unobservable inputs principally comprised various ABSs, private equity investments and other portfolios, similar to the position at 31 December 2007.
Trading assets valued using a valuation technique with significant unobservable inputs principally comprised loans held for securitisation
and other portfolios. Other portfolios included holdings in various bonds, preference shares and corporate and mortgage loans. The decrease during the year largely reflected leveraged finance and ABS positions no longer held on a fair value basis following their reclassification to loans and receivables as a result of the amendment to IAS 39 and a reduction in the level of loans held for securitisation.

167
Derivative products valued using valuation techniques with significant unobservable inputs included certain types of correlation products, such as foreign exchange basket options, foreign exchange-interest rate hybrid transactions and long-dated option transactions. Examples of the latter are equity options, interest rate and foreign exchange options and certain credit derivatives. Credit derivatives included tranched CDS transactions. The increase in derivative assets during the year was mainly due to (i) the transfer of certain leveraged credit derivative transactions into this category because widening credit spreads increased the significance of unobservable credit spread volatilities, and (ii) a general increase in the fair value of derivative assets during 2008.
Trading liabilities valued using a valuation technique with significant unobservable inputs principally comprised equity-linked structured note transactions. These notes, which HSBC issues to
investors, provide the counterparty with a return that is linked to the performance of certain equity securities.
The increase in derivative liabilities valued using a valuation technique with significant unobservable inputs was due to the general increase in the fair value of derivative liabilities during 2008.
Effect of changes in significant unobservable assumptions to reasonably possible alternatives
As discussed above, the fair value of financial instruments are, in certain circumstances, measured using valuation techniques that incorporate assumptions that are not evidenced by prices from observable current market transactions in the same instrument and are not based on observable market data. The following table shows the sensitivity of these fair values to reasonably possible alternative assumptions:
Reflected in profit or loss Reflected in equity
Favourable changes
Unfavourable changes
Favourable changes
Unfavourable changes
US$m US$m US$m US$m At 31 December 2008 Derivatives, trading assets and trading liabilities1 ........ 1,266 (703) – – Financial assets and liabilities designated at fair value 30 (30) – – Financial investments: available for sale ..................... – – 984 (1,005) At 31 December 2007 Derivatives, trading assets and trading liabilities1 ........ 602 (415) – – Financial assets and liabilities designated at fair value 30 (30) – – Financial investments: available for sale ..................... – – 529 (591)
1 Derivatives, trading assets and trading liabilities are presented as one category to reflect the manner in which these financial instruments are risk-managed.
The increase in the effect of changes in significant unobservable inputs in relation to derivatives, trading assets and trading liabilities
during the year primarily reflected increased sensitivity of instruments to unobservable parameters across asset and liability classes.
Principal assumptions used in the valuation of financial instruments with significant unobservable inputs
Reflected in profit or loss Reflected in equity
Favourable changes
Unfavourable changes
Favourable changes
Unfavourable changes
US$m US$m US$m US$m At 31 December 2008 Private equity investments ............................................ 28 (28) 234 (261)Asset-backed securities ................................................ 90 (91) 667 (660)Leveraged finance ........................................................ 2 (2) – – Loans held for securitisation ........................................ 41 (41) – – Structured notes ............................................................ 8 (8) – – Derivatives with monolines .......................................... 341 (250) – – Other derivatives ........................................................... 652 (224) – – Other portfolios ............................................................. 134 (89) 83 (84)

H S B C H O L D I N G S P L C
Report of the Directors: Impact of Market Turmoil (continued)
Fair values of financial instruments > at fair value
168
Reflected in profit or loss Reflected in equity
Favourable changes
Unfavourable changes
Favourable changes
Unfavourable changes
US$m US$m US$m US$m At 31 December 2007 ................................................... Private equity investments ............................................ – – 228 (228)Asset-backed securities ................................................ 226 (178) 101 (163)Leveraged finance ........................................................ 49 (49) – – Loans held for securitisation ........................................ 40 (40) – – Structured notes ............................................................ 17 (17) – – Derivatives with monolines .......................................... 88 (109) – – Other derivatives ........................................................... 132 (6) – – Other portfolios ............................................................. 80 (46) 200 (200)
Favourable and unfavourable changes are determined on the basis of changes in the value of the instrument as a result of varying the levels of the unobservable parameter using statistical techniques. When parameters are not amenable to statistical analysis, quantification of uncertainty is judgemental.
When the fair value of a financial instrument is affected by more than one unobservable assumption, the above table reflects the most favourable or most unfavourable change from varying the assumptions individually.
In respect of private equity investments, the valuations are assessed on an asset by asset basis using a valuation methodology appropriate to the specific investment, in line with industry guidelines. In many of the methodologies, the principal assumption is the valuation multiple to be applied to the main financial indicators including, for example, multiples for comparable listed companies and discounts for marketability.
For ABSs whose prices are unobservable, models are used to generate the expected value of the asset, incorporating benchmark information on factors such as prepayment speeds, default rates, loss severities and the historical performance of the underlying assets. The models used are calibrated by using securities for which external market information is available.
For leveraged finance, loans held for securitisation and derivatives with monolines the principal assumption concerns the appropriate value to be attributed to the counterparty credit risk. This requires exposure at default, probability of default and recovery in the event of default to be estimated. For loan transactions, assessment of exposure at default is straight-forward. For derivative transactions, a future exposure profile is generated based on current market data. Probabilities of default and recovery levels are estimated using market evidence, which may include financial information,
historical experience, CDS spreads and consensus recovery levels.
In the absence of such evidence, management’s best estimate is used.
For structured notes and other derivatives, principal assumptions concern the future volatility of asset values and the future correlation between asset values. For such unobservable assumptions, estimates are based on available market data, which may include the use of a proxy method to derive a volatility or a correlation from comparable assets for which market data is more readily available, and/or an examination of historical levels.
Changes in fair value recorded in the income statement
The following table quantifies the changes in fair values recognised in profit or loss during the year in respect of exposures whose fair values are estimated using valuation techniques that incorporate significant assumptions that are not evidenced by prices from observable current market transactions in the same instrument, and are not based on observable market data:
• the table details the total change in fair value of these instruments; it does not isolate the component of the change that is attributable to the unobservable component;
• instruments valued with significant unobservable inputs are frequently dynamically managed with instruments valued using observable inputs; the table does not include any changes in fair value of these latter instruments; and
• the table reflects the full change in fair value during 2008 of assets and liabilities valued using significant unobservable inputs at 31 December 2008 which were observable at 31 December 2007.

169
2008 2007 US$m US$mRecorded profit/(loss) on: Derivatives, trading assets
and trading liabilities ......... 779 491Financial assets and liabilities
designated at fair value ...... 109 9
The profit during the year primarily reflects changes in the fair value of credit derivatives which were transferred from using a valuation technique with significant observable inputs to a valuation technique with significant unobservable inputs. The change in valuation technique was due to widening credit spreads which have increased the significance
of unobservable credit spread volatilities. These movements are offset by reductions occurring due to write-downs of MBSs, mortgage loans acquired for the purpose of securitisation and credit derivative transactions executed against monoline insurers.
HSBC Holdings
The following table provides an analysis of the basis for valuing financial assets and financial liabilities measured at fair value in the financial statements:
Bases of valuing HSBC Holdings’ financial assets and liabilities measured at fair value
Valuation techniques
Quoted market price
Using observable inputs
With significant unobservable inputs Total
US$m US$m US$m US$m At 31 December 2008 Assets
Derivatives ................................................................ – 3,682 – 3,682 Financial investments: available for sale ................. – – 2,629 2,629
Liabilities Financial liabilities designated at fair value ............ 16,389 – – 16,389 Derivatives ................................................................ – 1,324 – 1,324
At 31 December 2007 Assets
Derivatives ................................................................ – 2,660 – 2,660 Financial investments: available for sale ................. 346 – 2,676 3,022
Liabilities Financial liabilities designated at fair value ............ 18,683 – – 18,683 Derivatives ................................................................ – 44 – 44
Financial investments measured using a valuation technique with significant unobservable inputs comprise fixed-rate trust-preferred securities and senior notes purchased from HSBC undertakings. The unobservable elements of the valuation technique include the use of implied credit spreads and simplified bond pricing assumptions.
Effect of changes in significant unobservable assumptions to reasonably possible alternatives
As discussed above, the fair value of financial instruments are in certain circumstances measured using valuation models that incorporate assumptions that are not supported by prices from observable current market transactions in the same instrument and are not based on observable market data. The following table shows the sensitivity of non-derivative financial instruments to reasonably possible alternative assumptions.
Reflected in equity
Favourable changes
Unfavourable changes
US$m US$m Financial investments
available for sale
At 31 December 2008 .... 113 (97)At 31 December 2007 ..... 53 (52)
Assessing available-for-sale assets for impairment
HSBC’s policy on impairment of available-for-sale assets is described on page 350. The following is a description of HSBC’s application of that policy.
A systematic impairment review is carried out periodically of all available-for-sale assets, and all available indicators are considered to determine whether there is any objective evidence that an impairment may have occurred, whether as the result of a single loss event or as the combined effect of several events.
H S B C H O L D I N G S P L C
Report of the Directors: Impact of Market Turmoil (continued)
Fair values of financial instruments > at fair value / not at fair value
170
Debt securities
When assessing available-for-sale debt securities for objective evidence of impairment at the balance sheet date, HSBC considers all available evidence, including observable data or information about events specifically relating to the securities which may result in a shortfall in recovery of future cash flows. These events may include a significant financial difficulty of the issuer, a breach of contract such as a default, bankruptcy or other financial reorganisation, or the disappearance of an active market for the debt security because of financial difficulties relating to the issuer.
These types of specific event and other factors such as information about the issuers’ liquidity, business and financial risk exposures, levels of and trends in default for similar financial assets, national and local economic trends and conditions, and the fair value of collateral and guarantees may be considered individually, or in combination, to determine if there is objective evidence of impairment of a debt security.
In addition, when assessing available-for-sale ABSs for objective evidence of impairment, HSBC considers the performance of underlying collateral, the extent and depth of market price declines and changes in credit ratings. The primary indicators of potential impairment are considered to be adverse fair value movements, and the disappearance of an active market for the securities.
At 31 December 2008, the population of available-for-sale ABSs identified as being most at risk of impairment included residential MBSs backed by sub-prime and Alt-A mortgages originated in the US, and CDOs with significant exposure to this sector. The estimated future cash flows of these securities are assessed to determine whether any of their cash flows are unlikely to be recovered as a result of events occurring on or before the balance sheet date.
In particular, for residential MBSs the estimated future cash flows are assessed by determining the future projected cash flows arising on the underlying collateral taking into consideration the delinquency status of underlying loans, the probability of delinquent loans progressing to default and the proportion of the advances subsequently recoverable. HSBC uses a modelling approach which incorporates historically observed progression rates to default, to determine if the decline in aggregate projected cash flows from the underlying collateral will lead to a shortfall in contractual cash flows. In such cases the security is considered to be impaired.
In respect of CDOs, in order to determine whether impairment has occurred, the expected future cash flows of the CDOs are compared with the total of the underlying collateral on the non-defaulted assets and the recovery value of the defaulted assets. In the event of a shortfall, the CDO is considered to be impaired.
When a security benefits from a contract provided by a monoline insurer that insures payments of principal and interest, the expected recovery on the contract is assessed in determining the total expected credit support available to the ABS.
Equity securities
Objective evidence of impairment for available-for-sale equity securities may include specific information about the issuer as detailed above, but may also include information about significant changes in technology, markets, economics or the law that provides evidence that the cost of the equity securities may not be recovered.
A significant or prolonged decline in the fair value of the asset below its cost is also objective evidence of impairment. In assessing whether it is significant, the decline in fair value is evaluated against the original cost of the asset at initial recognition. In assessing whether it is prolonged, the decline is evaluated against the period in which the fair value of the asset has been below its original cost at initial recognition.
For impairment losses on available-for-sale debt and equity securities, see pages 34 and 30, respectively. Any impairment losses recognised in the income statement relating to ABSs are recorded in the ‘Loan impairment charges and other credit risk provisions’ line. Impairment losses incurred on assets held by consolidated securities investment conduits (excluding Solitaire) are offset by a credit to the impairment line for the amount of the loss borne by capital note holders.
Fair values of financial instruments not carried at fair value
Financial instruments that are not measured at fair value on the balance sheet include loans and advances to banks and customers, deposits by banks, customer accounts, debt securities in issue and subordinated liabilities. Their fair values are, however, provided for information by way of note disclosure and are calculated as described below.
The calculation of fair value incorporates HSBC’s estimate of the amount at which financial

171
assets could be exchanged, or financial liabilities settled, between knowledgeable, willing parties in an arm’s length transaction. It does not reflect the economic benefits and costs that HSBC expects to flow from the instruments’ cash flows over their expected future lives. Other reporting entities may use different valuation methodologies and assumptions in determining fair values for which no observable market prices are available, so comparisons of fair values between entities may not be meaningful and users are advised to exercise caution when using this data.
Since August 2007, the unstable market conditions in the US mortgage lending industry have resulted in a significant reduction in the secondary market demand for US consumer lending assets. Uncertainty over the extent and timing of future credit losses, together with an absence of liquidity for non-prime ABSs, continued to be reflected in a lack of bid prices at 31 December 2008. It is not possible to distinguish from the indicative market prices that are available, between the relative discount to nominal value within the fair value measurement that reflects cash flow impairment due to expected losses to maturity, and the discount that the market is demanding for holding an illiquid and out of favour asset. Under impairment accounting for loans and advances, there is no need nor requirement to adjust carrying amounts to reflect illiquidity as HSBC’s intention is to fund assets until the earlier of prepayment, charge-off or repayment on maturity. Market fair values, on the other hand, reflect both incurred loss and loss expected through the life of the asset, a discount for illiquidity and a credit spread which reflects the market’s current risk preferences. This usually differs from the credit spread applicable in the market at the time the loan was underwritten and funded.
The estimated fair values at 31 December 2008 and 31 December 2007 of loans and advances to customers in North America reflect the combined effect of these conditions. As a result, the fair values are substantially lower than the carrying amount of customer loans held on-balance sheet and lower than would otherwise be reported under more normal market conditions. Accordingly, the fair values reported do not reflect HSBC’s estimate of the underlying long-term value of the assets.
Fair values at the balance sheet date of the assets and liabilities set out below are estimated for the purpose of disclosure as follows:
• Loans and advances to banks and customers
The fair value of loans and advances is based on observable market transactions, where available. In the absence of observable market transactions, fair value is estimated using discounted cash flow models. Performing loans are grouped, as far as possible, into homogeneous pools segregated by maturity and coupon rates. In general, contractual cash flows are discounted using HSBC’s estimate of the discount rate that a market participant would use in valuing instruments with similar maturity, repricing and credit risk characteristics.
The fair value of a loan portfolio reflects both loan impairments at the balance sheet date and estimates of market participants’ expectations of credit losses over the life of the loans.
For impaired loans, fair value is estimated by discounting the future cash flows over the time period they are expected to be recovered.
• Financial investments
The fair values of listed financial investments are determined using bid market prices. The fair values of unlisted financial investments are determined using valuation techniques that take into consideration the prices and future earnings streams of equivalent quoted securities.
• Deposits by banks and customer accounts
For the purposes of estimating fair value, deposits by banks and customer accounts are grouped by residual maturity. Fair values are estimated using discounted cash flows, applying current rates offered for deposits of similar remaining maturities. The fair value of a deposit repayable on demand is assumed to be the amount payable on demand at the balance sheet date.
• Debt securities in issue and subordinated liabilities
Fair values are determined using quoted market prices at the balance sheet date where available, or by reference to quoted market prices for similar instruments.
The fair values in this note are stated at a specific date and may be significantly different from the amounts which will actually be paid on the maturity or settlement dates of the instruments. In many cases, it would not be possible to realise immediately the estimated fair values given the size

H S B C H O L D I N G S P L C
Report of the Directors: Impact of Market Turmoil (continued)
Fair values of financial instruments > HSBC Holdings / SPEs
172
of the portfolios measured. Accordingly, these fair values do not represent the value of these financial instruments to HSBC as a going concern.
For all classes of financial instruments, fair value represents the product of the value of a single instrument, multiplied by the number of instruments held. No block discount or premium adjustments are made. The fair values of intangible assets related to the businesses which originate and hold the financial instruments subject to fair value measurement, such as values placed on portfolios of core deposits, credit card and customer relationships, are not included above because they are not classified as financial instruments. Accordingly, an aggregation of fair value measurements does not approximate to the value of the organisation as a going concern.
The following table lists financial instruments whose carrying amount is a reasonable approximation of fair value because, for example, they are short-term in nature or reprice to current market rates frequently:
Assets Cash and balances at central banks Items in the course of collection from other banks Hong Kong Government certificates of indebtedness Endorsements and acceptances Short-term receivables within ‘Other assets’ Accrued income
Liabilities Hong Kong currency notes in circulation Items in the course of transmission to other banks Investment contracts with discretionary participation features within ‘Liabilities under insurance contracts’ Endorsements and acceptances Short-term payables within ‘Other liabilities’ Accruals
Fair values of financial instruments which are not carried at fair value on the balance sheet
At 31 December 2008 At 31 December 2007
Carrying amount
Fair value
Carrying amount
Fair value
US$m US$m US$m US$m Assets Loans and advances to banks ....................................................................... 153,766 153,363 237,366 237,374 Loans and advances to customers ................................................................ 932,868 876,239 981,548 951,850 Financial investments: debt securities .......................................................... 14,013 15,057 9,768 10,154
Liabilities Deposits by banks ......................................................................................... 130,084 130,129 132,181 132,165 Customer accounts ........................................................................................ 1,115,327 1,115,291 1,096,140 1,095,727 Debt securities in issue ................................................................................. 179,693 170,599 246,579 243,802 Subordinated liabilities ................................................................................. 29,433 28,381 24,819 23,853
Fair values of financial investments classified as held for sale which are not carried at fair value on the balance sheet
At 31 December 2008 At 31 December 2007
Carrying amount
Fair value
Carrying amount
Fair value
US$m US$m US$m US$m Assets classified as held for sale Loans and advances to banks and customers ............................................... 11 11 14 14 Financial investments: debt securities .......................................................... 37 37 27 27
Analysis of loans and advances to customers by geographical segment At 31 December 2008 At 31 December 2007
Carrying amount
Fair Value
Carrying amount
Fair value
US$m US$m US$m US$m Loans and advances to customers Europe ........................................................................................................... 426,191 417,256 452,275 450,010 Hong Kong ................................................................................................... 100,220 100,490 89,638 89,908 Rest of Asia-Pacific ...................................................................................... 107,956 104,687 101,852 101,860 North America1 ............................................................................................. 256,214 211,346 289,860 262,123 Latin America ............................................................................................... 42,287 42,460 47,923 47,949
932,868 876,239 981,548 951,850
1 The reasons for the significant difference between carrying amount and fair value of loans and advances to customers in North America are discussed on page 170.

173
HSBC Holdings
The methods used by HSBC Holdings to determine fair values of financial instruments for the purpose of measurement and disclosure are described above.
The following table provides an analysis of the fair value of financial instruments not carried at fair value on the balance sheet:
Fair values of HSBC Holdings’ financial instruments not carried at fair value on the balance sheet
2008 2007
Carrying amount
Fair value
Carrying amount
Fair value
US$m US$m US$m US$m
Assets Loans and advances to HSBC undertakings ................ 11,804 12,670 17,242 17,356 Liabilities Amounts owed to HSBC undertakings ........................ 4,042 4,218 2,969 2,992 Subordinated liabilities ................................................. 14,017 13,940 8,544 8,609
Special purpose entities (Audited)
This section contains disclosures about HSBC-sponsored SPEs that are included in HSBC’s consolidated balance sheet, with a particular focus on SPEs containing exposures affected by recent turmoil in credit markets, and those that are not consolidated by HSBC under IFRSs. In addition to the disclosures about SPEs, information on other off-balance sheet arrangements has been included in this section.
HSBC enters into certain transactions with customers in the ordinary course of business which involve the establishment of SPEs to facilitate or secure customer transactions.
HSBC structures that utilise SPEs are authorised centrally when they are established to ensure appropriate purpose and governance. The activities of SPEs administered by HSBC are closely monitored by senior management. HSBC’s involvement with SPE transactions is described below.
HSBC-sponsored SPEs
HSBC sponsors the formation of entities which are designed to accomplish certain narrow and well-defined objectives, such as securitising financial assets or affecting a lease, and this requires a form of legal structure that restricts the assets and liabilities within the structure to the single purpose for which it was established. HSBC consolidates these SPEs when the substance of the relationship indicates that HSBC controls them. In assessing control, all relevant factors are considered, including qualitative and quantitative aspects. For example:
Qualitative factors – in substance:
• the activities of the SPE are being conducted on behalf of HSBC according to HSBC’s specific business needs so that it obtains benefit from the SPE’s operation. This might be evidenced, for example, by HSBC providing a significant level of support to the SPE; and
• HSBC has the decision-making powers to obtain the majority of the benefits of the activities of the SPE.
Quantitative factors – hereinafter referred to as ‘the majority of risks and rewards of ownership’. In substance:
• HSBC has rights to obtain the majority of the benefits of the SPE and therefore may be exposed to risks incidental to the activities of the SPE; and
• HSBC retains the majority of the residual or ownership risks related to the SPE or its assets in order to obtain benefits from its activities.
In a number of cases, these SPEs are accounted for off-balance sheet under IFRSs where HSBC does not have the majority of the risks and rewards of ownership of the SPE. However in certain circumstances, after careful consideration of the facts, HSBC consolidates an SPE when, although it does not obtain the majority of risks and rewards of ownership, the qualitative features of HSBC’s involvement indicate that, in substance, the activities of the SPE are being conducted on behalf of HSBC.
HSBC reassesses the required consolidation accounting tests whenever there is a change in the substance of the relationship between HSBC and an SPE, for example, when the nature of HSBC’s involvement or the governing rules, contractual

H S B C H O L D I N G S P L C
Report of the Directors: Impact of Market Turmoil (continued)
SPEs > SIVs and conduits
174
arrangements or capital structure of the SPE change. The most significant categories of SPEs are discussed in more detail below.
Structured investment vehicles and conduits
Structured investment vehicles
Structured investment vehicles (‘SIV’s) are SPEs which invest in diversified portfolios of interest-earning assets, generally funded through issues of commercial paper (‘CP’), medium-term notes (‘MTN’s) and other senior debt to take advantage of the spread differentials between the assets in the SIV and the funding cost. Prior to the implementation of Basel II, it was capital efficient to many bank investors to invest in highly-rated investment securities in this way. HSBC sponsored the establishment of two SIVs, Cullinan Finance Limited (‘Cullinan’) and Asscher Finance Limited (‘Asscher’) in 2005 and 2007, respectively, and in November 2007 HSBC consolidated Cullinan and Asscher.
As market illiquidity intensified, there were two main challenges for the SIV sector which could force asset sales: an inability to fund in the CP markets and the sensitivity of the continuing operation of SIVs to changes in the market value of their underlying assets.
In order to remove the risk of having to make forced asset sales, HSBC established three new securities investment conduits (defined below) to take on the assets held in Cullinan and Asscher. Mazarin Funding Limited (‘Mazarin’), an asset backed CP conduit, and Barion Funding Limited (‘Barion’), a term-funding vehicle, were set up in respect of Cullinan; and Malachite Funding Limited (‘Malachite’), a term-funding vehicle, was set up in respect of Asscher. During 2008, the investors in the capital notes issued by Cullinan and Asscher had the option of exchanging their existing capital notes for the capital notes of the respective new conduits. In addition, the new conduits agreed to purchase the assets in Cullinan and Asscher. As a result of this agreement the legal title of all Cullinan and Asscher’s assets were transferred to the new conduits. By 31 December 2008, all the original assets in Cullinan and Asscher were transferred to the new conduits.
During 2008, 91.3 per cent of the remaining capital note holders in Asscher and all of the capital note holders in Cullinan elected to exchange their existing holdings for capital notes in the new conduits. In January 2009, the remaining 8.7 per cent of Asscher’s capital notes were redeemed. At 31 December 2007, the holders of the capital notes
bore the risk of any actual losses arising in the new conduits up to US$2.3 billion, being the par value of their respective holdings. Prior to the exchanges of assets against capital note extinguishments, the par value of the capital notes was US$2.6 billion. At 31 December 2008, the economic first loss protection from capital note holders amounted to US$2.2 billion (2007: US$2.3 billion). The reduction in economic first loss protection is attributable to the recognition of a US$92 million realised loss at 31 December 2008 (2007: n/a). On an IFRS accounting basis, the capital notes were initially recognised at fair value on consolidation, which amounted to US$1.3 billion at 31 December 2007. At 31 December 2008, on an IFRS accounting basis, an impairment charge of US$293 million (2007: n/a) was recognised in addition to the realised loss of US$92 million, therefore reducing the carrying amount of these capital notes to US$0.9 billion.
Conduits
HSBC sponsors and manages two types of conduits which issue CP; multi-seller securities and securities investment conduits (‘SIC’s). HSBC has consolidated these conduits from inception because it is exposed to the majority of risks and rewards of ownership.
Securities investment conduits
Solitaire, HSBC’s principal securities investment conduit, purchases highly rated ABSs to facilitate tailored investment opportunities. HSBC’s other SICs, Mazarin, Barion and Malachite, evolved from the restructuring of HSBC’s sponsored SIVs as discussed above.
Multi-seller conduits
These vehicles were established for the purpose of providing access to flexible market-based sources of finance for HSBC’s clients, for example, to finance discrete pools of third-party originated trade and vehicle finance loan receivables. HSBC’s principal multi-seller conduits are Regency Assets Limited (‘Regency’), Bryant Park Funding Limited LLC (‘Bryant Park’), Abington Square Funding LLC (‘Abington Square’) and Performance Trust.
The multi-seller conduits purchase or fund interests in diversified pools of third-party assets financed by issuing CP or drawing advances from HSBC. The cash flows received by the conduits from the third-party assets are used to service the funding and provide a commercial rate of return for HSBC for structuring, for various other

175
administrative services, and for the liquidity and credit support it gives to the conduits. The asset pools acquired by the conduits are structured so that the credit enhancement the conduits receive, which equates to senior investment grade ratings, and the benefit of liquidity facilities typically provided by HSBC mean that the CP issued by the multi-seller conduits is itself highly rated.
During 2008, the finance provided by HSBC to Abington Square Funding LLC at the end of 2007 was repaid using the proceeds received from refinancing the assets within the conduit. The conduit did not enter into any new securitisation transactions during the period.
An analysis of the assets held by HSBC’s SIVs and conduits is set out below:
Ratings analysis of assets
Solitaire Other SICs
Total SICs
Total multi-seller conduits
Total SIVs
US$bn US$bn US$bn US$bn US$bn S&P ratings at 31 December 2008
AAA ....................................................... 8.1 12.0 20.1 6.1 0.3 AA .......................................................... 0.7 1.4 2.1 1.8 – A ............................................................. 1.0 4.7 5.7 1.6 – BBB ........................................................ 0.8 1.0 1.8 1.2 – BB .......................................................... 0.3 0.4 0.7 0.2 – B ............................................................. 0.1 0.2 0.3 0.5 – CCC ........................................................ 0.2 0.2 0.4 1.8 – D ............................................................. – – – 0.3 –
Total investments ...................................... 11.2 19.9 31.1 13.5 0.3 Cash and other investments ...................... 0.9 0.3 1.2 0.4 0.1
12.1 20.2 32.3 13.9 0.4 S&P ratings at 31 December 2007
AAA ....................................................... 20.8 – 20.8 9.7 28.3 AA .......................................................... – – – 1.6 3.3 A ............................................................. – – – 3.9 3.4 BBB ........................................................ – – – 0.1 0.1
Total investments ...................................... 20.8 – 20.8 15.3 35.1 Cash and other investments ...................... 0.8 – 0.8 0.5 5.6
21.6 – 21.6 15.8 40.7
Composition of asset portfolio
Solitaire Other SICs
Total SICs
Total multi-seller conduits1
Total SIVs
US$bn US$bn US$bn US$bn US$bn Asset class at 31 December 2008 Structured finance
Vehicle loans and equipment leases ...... – – – 3.9 – Consumer receivables ............................ – – – 0.7 – Credit card receivables .......................... 0.2 – 0.2 1.4 – Residential MBSs .................................. 4.4 5.7 10.1 0.6 – Commercial MBSs ................................. 2.1 3.1 5.2 0.2 – Auto floor plan ....................................... – – – 2.2 – Trade receivables ................................... – – – 2.7 – Student loan securities ........................... 2.2 2.0 4.2 – – Vehicle finance loan securities .............. – 0.3 0.3 – – Leverage loan securities ........................ 1.5 2.2 3.7 – – Other ABSs ............................................ 0.8 1.3 2.1 1.7 –
11.2 14.6 25.8 13.4 –

H S B C H O L D I N G S P L C
Report of the Directors: Impact of Market Turmoil (continued)
SPEs > SIVs and conduits
176
Solitaire Other SICs
Total SICs
Total multi-seller conduits1
Total SIVs
US$bn US$bn US$bn US$bn US$bn Finance
Commercial bank securities and deposits ......................................... – 4.4 4.4 0.4 –
Investment bank debt securities ............. – 0.5 0.5 – – Investment bank securities ..................... – – – – – Finance company debt securities ........... – 0.4 0.4 – 0.3 Other assets ............................................ 0.9 0.3 1.2 0.1 0.1
0.9 5.6 6.5 0.5 0.4
12.1 20.2 32.3 13.9 0.4 US sub-prime mortgages .......................... 0.6 0.7 1.3 – – US Alt-A.................................................... 2.3 2.2 4.5 – –
2.9 2.9 5.8 – –
Asset class at 31 December 2007 Structured finance
Vehicle loans and equipment leases ...... – – – 3.6 – Consumer receivables ............................ – – – 0.8 – Credit card receivables .......................... – – – 1.5 – Residential MBSs .................................. 9.3 – 9.3 2.0 14.5 Commercial MBSs ................................. 3.7 – 3.7 0.1 5.0 Auto floor plan ....................................... – – – 2.0 – Trade receivables ................................... – – – 3.1 – Student loan securities ........................... 3.5 – 3.5 – 2.6 Vehicle finance loan securities .............. 0.1 – 0.1 – 0.3 Leverage loan securities ........................ 2.2 – 2.2 – 2.8 Other ABSs ............................................ 2.2 – 2.2 2.3 6.9
21.0 – 21.0 15.4 32.1 Finance
Commercial bank securities and deposits ................................................ 0.6 – 0.6 – 7.3
Investment bank debt securities ............. – – – – 0.8 Investment bank securities ..................... – – – 0.4 – Finance company debt securities ........... – – – – 0.5
0.6 – 0.6 0.4 8.6
21.6 – 21.6 15.8 40.7 US sub-prime mortgages .......................... 1.9 – 1.9 0.1 3.5 US Alt-A.................................................... 5.3 – 5.3 – 5.9
7.2 – 7.2 0.1 9.4
1 Assets within multi-seller conduits are classified as collateralised loans. Under IFRSs, the conduits cannot recognise the underlying assets.
During 2008, the credit ratings of various securities held by the SICs, many with exposures to US sub-prime and Alt-A mortgages, were downgraded by rating agencies. At 31 December 2008, 44.7 per cent of the SICs’ exposures to US sub-prime and Alt-A mortgages remained AAA rated (2007: 100 per cent), while 81.4 per cent remained investment grade.
It should be noted that securities purchased by SICs typically benefit from substantial transaction-specific credit enhancements such as subordinated tranches and/or excess spread, which absorb any
credit losses before they would fall on the tranche held by the SPE.
As noted above, by 31 December 2008, all the original assets held by the SIVs were transferred to the new SICs. However, during the second half of 2008, the SIVs purchased CP issued by certain SICs set up by HSBC and, at 31 December 2008, the SIVs’ holdings amounted to US$0.3 billion. The cash flows of the CP issued by the new SICs are referenced to bonds which include those backed by US sub-prime and US Alt-A MBSs. In early 2009, the CP matured, and the cash received by the SIVs has been transferred to the respective SICs.

177
Asset analysis by geographical origination for multi-seller conduits1
At 31 December 2008 2007 US$bn US$bn
Europe ...................................................................................................................................................... 7.5 7.4 Rest of Asia-Pacific ................................................................................................................................. 0.9 1.0 North America ......................................................................................................................................... 5.5 6.3 Latin America .......................................................................................................................................... – 1.1
13.9 15.8
1 For details on the geographical origin of the mortgage loans held at fair value and ABSs, including those represented by MBSs and CDOs held in consolidated SIVs and securities investment conduits, see ‘Nature and extent of HSBC’s exposures’ on page 150.
Total assets by balance sheet classification
Solitaire Other SICs
Total SICs
Total multi-seller conduits
Total SIVs
US$bn US$bn US$bn US$bn US$bn At 31 December 2008 Financial instruments designated at
fair value ................................................ 0.1 – 0.1 – – Derivative assets ....................................... – 0.2 0.2 0.1 – Loans and advances to banks ................... – 0.1 0.1 – 0.1 Loans and advances to customers ............ – – – 13.4 – Financial investments ............................... 11.1 19.9 31.0 – 0.3 Other assets ............................................... 0.9 – 0.9 0.4 –
12.1 20.2 32.3 13.9 0.4
At 31 December 2007 Financial instruments designated at
fair value ................................................ 0.1 – 0.1 – – Derivative assets ....................................... 0.1 – 0.1 – 0.3 Loans and advances to banks ................... 0.2 – 0.2 – 3.1 Loans and advances to customers ............ – – – 14.9 – Financial investments ............................... 20.6 – 20.6 0.5 37.1 Other assets ............................................... 0.6 – 0.6 0.4 0.2
21.6 – 21.6 15.8 40.7
Weighted average maturity of assets and life of portfolios
Solitaire Other SICs
Total SICs
Total multi-seller conduits
Total SIVs
US$bn US$bn US$bn US$bn US$bn At 31 December 2008 0-6 months ................................................ 1.0 1.3 2.3 5.7 0.4 6-12 months .............................................. 0.2 1.4 1.6 0.5 – Over 12 months ........................................ 10.9 17.5 28.4 7.7 –
1-3 years ................................................. 1.8 5.6 7.4 6.2 –3-5 years ................................................. 3.6 6.6 10.2 1.5 –5+ years .................................................. 5.5 5.3 10.8 – –
12.1 20.2 32.3 13.9 0.4
Weighted average life (years) ................... 5.8 3.9 4.6 1.6 –
At 31 December 2007 0-6 months ................................................ 0.3 – 0.3 5.6 6.9 6-12 months .............................................. 0.3 – 0.3 2.5 2.2 Over 12 months ........................................ 21.0 – 21.0 7.7 31.6
1-3 years ................................................. 2.5 – 2.5 4.8 7.63-5 years ................................................. 8.3 – 8.3 2.2 13.45+ years .................................................. 10.2 – 10.2 0.7 10.6
21.6 – 21.6 15.8 40.7
Weighted average life (years) ................... 5.3 – 5.3 1.6 4.0

H S B C H O L D I N G S P L C
Report of the Directors: Impact of Market Turmoil (continued)
SPEs > SIVs and conduits
178
The revolving credit facilities of multi-seller conduits will predominantly have expected average
lives with maturities of less than 12 months, but typically have a range of 1 to 60 months.
Funding structure
Solitaire Other SICs Total SICs Total multi-seller
conduits Total SIVs
Total Provided by HSBC Total
Provided by HSBC Total
Provided by HSBC Total
Provided by HSBC Total
Provided by HSBC
US$bn US$bn US$bn US$bn US$bn US$bn US$bn US$bn US$bn US$bn At 31 December 2008 Capital notes .................... – – 0.9 – 0.9 – – – – – Drawn liquidity
facility ........................... 2.4 2.4 – – 2.4 2.4 – – – – Commercial paper ........... 17.2 8.3 10.5 10.4 27.7 18.7 12.9 2.1 – – Medium-term notes ......... – – 3.4 3.4 3.4 3.4 – – 0.1 – Term repos executed ........ 0.8 0.8 13.3 13.3 14.1 14.1 – – – –
20.4 11.5 28.1 27.1 48.5 38.6 12.9 2.1 0.1 –
At 31 December 2007 Capital notes .................... – – – – – – – – 1.3 – Commercial paper ........... 23.0 7.8 – – 23.0 7.8 14.8 8.6 7.3 2.4 Medium-term notes ......... – – – – – – – – 23.2 5.3 Term repos executed ........ – – – – – – – – 8.7 8.2
23.0 7.8 – – 23.0 7.8 14.8 8.6 40.5 15.9
Weighted average life of the funding liabilities
Solitaire Other SICs
Total SICs
Total multi-seller conduits
Total SIVs
Years Years Years Years Years At 31 December 2008 CP funding ................................................ 0.1 0.2 0.1 0.1 n/a MTN funding ............................................ n/a 7.3 7.3 n/a 0.1 At 31 December 2007 CP funding ................................................ 0.4 – – 0.1 0.5 MTN funding ............................................ – – – – 1.1
The majority CP and MTN funding issued by the SIVs was repaid in full during 2008 using the proceeds from the asset sales to the new SICs. The MTNs matured in early 2009.
HSBC’s maximum exposure
Conduits
Mazarin
• HSBC is exposed to the par value of Mazarin’s assets through the provision of a liquidity facility equal to the lesser of the amortised cost of issued senior debt and the amortised cost of non-defaulted assets. At 31 December 2008, HSBC's exposure amounted to US$15.5 billion (2007: n/a). First loss protection is provided through the capital notes issued by Mazarin, which are substantially all held by third parties.
• In addition, at 31 December 2008, HSBC held 1.3 per cent of Mazarin’s capital notes, which
have a par value of US$17million (2007: n/a), and a carrying amount of US$0.6 million (2007: n/a).
Barion and Malachite
• These SICs are term funded by HSBC, consequently HSBC’s primary exposure to them is represented by the amortised cost of the debt required to support the non-cash assets of the vehicles. At 31 December 2008 this amounted to US$11.7 billion (2007: n/a).
• First loss protection is provided through the capital notes issued by these vehicles, which are substantially all held by third parties.
• In addition, at 31 December 2008, HSBC held 3.53 per cent (2007: n/a) of the capital notes issued by these vehicles which have a par value of US$35 million (2007: n/a), and a carrying amount of US$1.3 million (2007: n/a).

179
Solitaire
• CP issued by Solitaire benefits from a 100 per cent liquidity facility provided by HSBC. First loss credit protection, after any transaction-specific credit enhancement (as described on page 148) and retained reserves, is provided by HSBC in the form of letters of credit with a combined notional value of US$1.2 billion at 31 December 2008 (2007: US$1.2 billion).
• HSBC’s maximum exposure to Solitaire is limited to the amortised cost of non-cash equivalent assets, which represents the risk that HSBC may be required to fund the vehicle in the event the debt is redeemed without reinvestment from third parties.
• HSBC’s maximum exposure at 31 December 2008 amounted to US$20.4 billion (2007: US$25.7 billion).
Multi-seller conduits
• HSBC provides transaction-specific liquidity facilities to each of its multi-seller conduits, designed to be drawn in order to ensure the repayment of the CP issued. At 31 December 2008, the committed liquidity facilities amounted to US$17.1 billion (2007: US$21.2 billion).
• First loss protection is provided through transaction-specific credit enhancements, for example, over-collateralisation and excess spread. These credit enhancements are provided by the originator of the assets and not by HSBC. In addition, a layer of secondary loss protection is provided by HSBC in the form of programme-wide enhancement facilities, and at 31 December 2008 this amounted to US$0.6 billion (2007: US$0.7 billion). HSBC’s maximum exposure is equal to the transaction-specific liquidity facilities offered to the multi-seller conduits, as described above.
• The liquidity facilities are set to support total commitments and therefore exceed the funded assets as at 31 December 2008.
• In consideration of the significant first loss protection afforded by the structure, the credit enhancements and a range of indemnities provided by the various obligors, HSBC carries only a minimal risk of loss from the programme.
Structured investment vehicles
• At 31 December 2008, Cullinan held Mazarin CP amounting to US$0.3 billion. HSBC retains
no marginal exposure through Cullinan to Mazarin’s activities over the maximum exposure value stated for Mazarin.
• Asscher retains only cash and equivalent assets held within the HSBC Group. Consequently, HSBC retains no exposure to the vehicle.
Money market funds
HSBC has established and manages a number of money market funds which provide customers with tailored investment opportunities with a set of narrow and well-defined objectives. In most cases, they are not consolidated in HSBC because the Group’s holdings in them are not of sufficient size to represent the majority of the risks and rewards of ownership.
Investors in money market funds generally have no recourse other than to the assets in the funds, so asset holdings are designed to meet expected fund liabilities. Usually, money market funds are constrained in their operations should the value of their assets and their ratings fall below predetermined thresholds. The risks to HSBC are, therefore, contingent, arising from the reputational damage which could occur if an HSBC-sponsored money market fund was thought to be unable to meet withdrawal requests on a timely basis or in full.
In aggregate, HSBC has established money market funds with total assets of US$102.7 billion at 31 December 2008 (2007: US$91.3 billion).
The main sub-categories of money market funds are:
• US$72.0 billion (2007: US$56.8 billion) in Constant Net Asset Value (‘CNAV’) funds, which invest in shorter-dated and highly-rated money market securities with the objective of providing investors with a highly liquid and secure investment;
• US$2.7 billion (2007: US$11.9 billion) in French domiciled dynamique (‘dynamic’) funds and Irish ‘enhanced’ funds, together Enhanced Variable Net Asset Value (‘Enhanced VNAV’) funds, which invest in longer-dated money market securities to provide investors with a higher return than traditional money market funds; and
• US$28.0 billion (2007: US$22.6 billion) in various other money market Variable Net Asset Value (‘VNAV’) funds, including funds domiciled in Brazil, France, India, Mexico and other countries.

H S B C H O L D I N G S P L C
Report of the Directors: Impact of Market Turmoil (continued)
SPEs > SIVs and conduits
180
These money market funds invest in diverse portfolios of highly-rated debt instruments, including limited holdings in instruments issued by SIVs. At 31 December 2008, the exposure of these funds to SIVs was US$0.5 billion (2007: US$3.9 billion).
Constant Net Asset Value funds
CNAV funds price their assets on an amortised cost basis, subject to the amortised book value of the portfolio remaining within 50 basis points of its market value. This feature enables CNAV funds to create and liquidate shares in the funds at a constant price. If the amortised value of an asset portfolio were to vary by more than 50 basis points from its market value, the CNAV fund would be required to price its assets at market value, and consequently would no longer be able to create or liquidate shares at a constant price. This is commonly known as ‘breaking the buck’.
Investments made by the CNAV funds in senior notes issued by SIVs continued to deteriorate in valuation terms during 2008. The market values of the underlying assets of those SIVs were affected by market nervousness over possible default levels, exacerbated by severe illiquidity. This reduced the ability of SIVs to sell assets in order to fund maturing liabilities, or issue new senior notes in order to raise cash. As a consequence, the CNAV funds recorded unrealised losses on their SIV holdings.
During 2008, the following actions were taken by HSBC in respect of the CNAV funds to maintain their AAA rating and mitigate any forced sale of liquid assets to meet potential redemptions:
• the provision of additional letters of limited indemnity (‘LOI’) to the directors of the CNAV funds that held investments in SIVs, as well as amendments to existing letters of limited indemnity. The total assets under management (‘AUM’) of the funds in respect of which indemnities were provided amounted to US$43.8 billion at 31 December 2008 (2007: US$27.1 billion); and
• in early October 2008, HSBC:
(i) purchased all the SIV assets that were in enforcement from the CNAV funds, which amounted to US$687 million. Enforcement is the process by which winding down of independent SIVs and repaying secured creditors begins. The purchased SIV assets are included within HSBC’s consolidated holdings of ABSs on page 151;
(ii) made a payment of US$43 million under the letters of limited indemnity as a consequence of HSBC purchasing all the SIV assets that were in enforcement from the CNAV funds; and
(iii) made capital contributions amounting to US$53 million.
The following table provides a breakdown of the losses incurred and capital contributions made as a result of the actions taken by HSBC. 2008 US$m
Payment under LOI ..................................... 43 Capital contribution ..................................... 53 Fair value write down1 ................................. 18
Total ............................................................. 114
1 When HSBC purchased the enforced SIV assets from a fund at their amortised cost, an immediate loss was recognised by HSBC on initial recognition.
As stated on page 173, a reassessment of the required consolidation accounting tests is performed whenever there is a change in the substance of the relationship between HSBC and an SPE. As a result of the events described above, a reassessment of the consolidation tests was, therefore, performed.
When considered together, the actions taken by HSBC demonstrated the Group’s support, within limited parameters, of the CNAV funds in the prevailing market conditions. This support was based on a commercial decision to support the funds at that time, but did not constitute any commitment to undertake further action and the future operations of the funds in question continue to be governed by their respective prospectuses. HSBC concluded that this substantively changed the relationship HSBC had with these CNAV funds, and therefore HSBC consolidated them from 30 September 2008. Although the actions taken by HSBC described above occurred in early October 2008, management’s intention had been agreed prior to this date.
The effect of consolidating the CNAV funds on HSBC’s balance sheet was to include US$43.8 billion of assets and US$43.1 billion of liabilities. HSBC’s exposure to the funds is described below.

181
Composition of CNAV asset portfolio
2008 US$bn
ABSs ............................................................ 0.8Certificates of deposit .................................. 13.0CP ................................................................. 18.1Floating rate notes ....................................... 5.2Government agency bonds .......................... 1.9Other assets .................................................. 4.8
Total ............................................................. 43.8
HSBC’s maximum exposure
HSBC’s maximum exposure to consolidated and unconsolidated CNAV funds is represented by HSBC’s investment in the units of each CNAV fund, and by the maximum limit of the letters of limited indemnity provided to the CNAV funds. HSBC’s exposure at 31 December 2008 amounted to US$0.7 billion (2007: US$1.3 billion) and US$58 million (2007: US$41 million) for investment in units within the CNAV funds and letters of limited indemnity, respectively.
Enhanced Variable Net Asset Value funds
Enhanced VNAV funds price their assets on a fair value basis and, consequently, prices may change from one day to the next. These funds pursue an ‘enhanced’ investment strategy, as part of which investors accept greater credit and duration risk in the expectation of higher returns.
As part of action taken in respect of these funds in the second half of 2007, HSBC acquired some of the underlying assets and shares in two of its French dynamic money market funds. HSBC’s aggregate holding in these funds at 31 December 2008 amounted to €0.5 billion (US$0.6 billion) (2007: €0.9 billion; US$1.4 billion). As a result of continued redemptions by unitholders during 2008, HSBC’s holding in the two funds increased to a level at which it obtained the majority of the risks and rewards of ownership, and it therefore consolidated these funds.
HSBC’s maximum exposure
HSBC’s maximum exposure to consolidated and unconsolidated Enhanced VNAV and consolidated and unconsolidated VNAV funds is represented by HSBC’s investment in the units of each fund. HSBC’s maximum exposure at 31 December 2008 amounted to US$0.6 billion (2007:
US$5.9 billion) and US$1.6 billion (2007: US$0.3 billion), for Enhanced VNAV and VNAV funds, respectively.
Total assets of HSBC’s money market funds which are on-balance sheet by balance sheet classification
At 31 December 2008 2007 US$bn US$bn
Cash ...................................... 0.3 – Trading assets ...................... 43.3 0.7 Financial instruments
designated at fair value .... – 5.0 Other assets .......................... 2.3 –
45.9 5.7
Non-money market investment funds
HSBC, through its fund management business, has established a large number of non-money market funds to enable customers to invest in a range of assets, typically equities and debt securities. At the launch of a fund HSBC, as fund manager, usually provides a limited amount of initial capital known as ‘seed capital’ to enable the fund to start purchasing assets. These holdings are normally redeemed over time. The majority of these funds are off-balance sheet for HSBC because the Group’s limited economic interest means it does not have the majority of the risks and rewards of ownership. As the non-money market funds explicitly provide investors with tailored risk, the risk to HSBC is restricted to HSBC’s own investments in the funds.
In aggregate, HSBC has established non-money market funds with total assets of US$200.3 billion at 31 December 2008 (2007: US$288.8 billion).
The main sub-categories of non-money market funds are:
• US$83.1 billion (2007: US$132.0 billion) in specialist funds, which comprise fundamental active specialists and active quantitative specialists;
• US$96.2 billion (2007: US$126.4 billion) in local investment management funds, which invest in domestic products, primarily for retail and private clients; and
• US$21.0 billion (2007: US$30.4 billion) in multi-manager funds, which offer fund of funds and manager of manager products across a diversified portfolio of assets.

H S B C H O L D I N G S P L C
Report of the Directors: Impact of Market Turmoil (continued)
SPEs > SIVs and conduits > maximum exposures
182
Total assets of HSBC’s non-money market funds which are on-balance sheet by balance sheet classification
At 31 December 2008 2007 US$bn US$bn
Cash ........................................... 0.4 0.4 Trading assets ............................ 0.2 0.5 Financial instruments
designated at fair value .......... 2.3 3.0 Financial investments ................ 0.8 0.2
3.7 4.1
HSBC’s maximum exposure
HSBC’s maximum exposure to consolidated and unconsolidated non-money market funds is represented by HSBC’s investment in the units of each respective fund. HSBC’s exposure at 31 December 2008 amounted to US$4.4 billion (2007: US$6.0 billion).
Securitisations
HSBC uses SPEs to securitise customer loans and advances that it has originated, mainly in order to diversify its sources of funding for asset origination and for capital efficiency purposes. In such cases, the loans and advances are transferred by HSBC to the SPEs for cash, and the SPEs issue debt securities to investors to fund the cash purchases. Credit enhancements to the underlying assets may be used to obtain investment grade ratings on the senior debt issued by the SPEs. Except in one instance, these securitisations are all consolidated by HSBC. HSBC has also established securitisation programmes in the US and Germany where loans originated by third parties are securitised. Most of these vehicles are not consolidated by HSBC as it is not exposed to the majority of risks and rewards of ownership in the SPEs. In 2008, demand for the securitised products remained low.
In addition, HSBC uses SPEs to mitigate the capital absorbed by some of the customer loans and advances it has originated. Credit derivatives are used to transfer the credit risk associated with such customer loans and advances to an SPE, using securitisations commonly known as synthetic securitisations. These SPEs are consolidated when HSBC is exposed to the majority of risks and rewards of ownership.
Total assets of HSBC’s securitisations which are on-balance sheet, by balance sheet classification
At 31 December 2008 2007 US$bn US$bn
Trading assets ........................... 1.3 3.6 Loans and advances to customers 50.8 69.6 Financial investments ............... – 0.1 Other assets ............................... 1.1 1.3 Derivatives ................................ 1.4 0.1
54.6 74.7
These assets include US$1.3 billion (2007: US$3.6 billion) of exposure to US sub-prime mortgages.
Total assets of HSBC’s securitisations which are off-balance sheet
2008 2007 US$bn US$bn
HSBC originated assets ............. 0.6 0.9 Non-HSBC originated assets –
term securitisation programmes ............................ 13.5 16.0
14.1 16.9
HSBC’s financial investments in off-balance sheet securitisations at 31 December 2008 amounted to US$0.2 billion (2007: US$0.4 billion). These assets include assets which are classified as available-for-sale securities and measured at fair value, and have been securitised by HSBC under arrangements by which HSBC retains a continuing involvement in them. Further details are provided in Note 20 on the Financial Statements.
HSBC’s maximum exposure
The maximum exposure is the aggregate of any holdings of notes issued by these vehicles and the reserve account positions intended to provide credit support under certain pre-defined circumstances to senior note holders. HSBC is not obligated to provide further funding. At 31 December 2008, HSBC’s maximum exposure to consolidated and unconsolidated securitisations amounted to US$27.2 billion (2007: US$31 billion).
Other
HSBC also establishes SPEs in the normal course of business for a number of purposes, for example, structured credit transactions for customers to provide finance to public and private sector infrastructure projects, and for asset and structured finance (‘ASF’) transactions.

183
Structured credit transactions
HSBC provides structured credit transactions to third-party professional and institutional investors who wish to obtain exposure, sometimes on a leveraged basis, to a reference portfolio of debt instruments. In such structures, the investor receives returns referenced to the underlying portfolio by purchasing notes issued by the SPEs. HSBC enters into contracts with the SPEs, generally in the form of derivatives, in order to pass the required risks and rewards of the reference portfolios to the SPEs. HSBC’s risk in relation to the derivative contracts with the SPEs is managed within HSBC’s trading market risk framework (see Market Risk on page 241). In certain transactions HSBC is exposed to risk often referred to as gap risk. Gap risk typically arises in transactions where the aggregate potential claims against the SPE by HSBC pursuant to one or more derivatives could be greater than the value of the collateral held by the SPE and securing such derivatives. HSBC often mitigates such gap risk by incorporating in the SPE transaction features which allow for deleveraging, a managed liquidation of the portfolio, or other mechanisms. Following the inclusion of such risk reduction mechanisms, HSBC has, in certain circumstances, retained all or a portion of the underlying exposure in the transaction. When this retained exposure represents ABSs, it has been included in ‘Nature and extent of HSBC’s exposures’ on page 150.
Often, transactions are facilitated through SPEs to enable the notes issued to the investors to be rated. The SPEs are not consolidated by HSBC because the investors bear substantially all the risks and rewards of ownership through the notes.
The total fair value of liabilities (notes issued and derivatives) in structured credit transaction SPEs was US$21.2 billion at 31 December 2008 (2007: US$23.6 billion). These amounts included US$0.3 billion (2007: US$0.1 billion) in SPEs that were consolidated by HSBC.
Other uses of SPEs
HSBC participates in Public-Private Partnerships to provide financial support for infrastructure projects initiated by government authorities. The funding structure is commonly achieved through the use of SPEs. HSBC consolidates these SPEs when it is exposed to the majority of risks and rewards of the vehicles.
HSBC’s ASF business specialises in leasing and arranging finance for aircraft and other physical assets, which it is customary to ring-fence through the use of SPEs, and in structured loans and deposits, where SPEs introduce cost efficiencies. HSBC consolidates these SPEs when the substance of the relationship indicates that HSBC controls the SPE.
HSBC’s risks and rewards of ownership in these SPEs are in respect of its on-balance sheet assets and liabilities.
HSBC’s maximum exposures to SPEs
The following tables show the total assets of the various types of SPEs, and the amount and types of funding provided by HSBC to these SPEs. The tables also show HSBC’s maximum exposure to the SPEs and, within that exposure, the types of liquidity and credit enhancements provided by HSBC. The maximum exposures to SPEs represent HSBC’s maximum possible risk exposure that could occur as a result of the Group’s arrangements and commitments to SPEs. The maximum amounts are contingent in nature, and may arise as a result of drawdowns under liquidity facilities, where these have been provided, and any other funding commitments, or as a result of any loss protection provided by HSBC to the SPEs. The conditions under which such exposure might arise differ depending on the nature of each SPE and HSBC’s involvement with it. The aggregation of such maximum exposures across the different forms of SPEs results in a theoretical total maximum exposure number. The elements of the maximum exposure to an SPE are not necessarily additive and a detailed explanation of how maximum exposures are determined is provided under each category of SPE.

H S B C H O L D I N G S P L C
Report of the Directors: Impact of Market Turmoil (continued)
SPEs > SIVs and conduits > Maximum exposures
184
HSB
C’s
max
imum
exp
osur
e to
con
solid
ated
SPE
s affe
cted
by
the
rece
nt m
arke
t tur
moi
l
Se
curi
ties
E
nhan
ced
N
on-m
oney
mar
ket f
unds
SIV
s i
nves
tmen
t
cond
uits
1 M
ulti-
selle
r
cond
uits
CN
AV
fund
s
VN
AV
fund
s
VN
AV
fund
s
Spec
ialis
t
fund
s
Loc
al
fu
nds2
Se
curi
t-
isat
ions
3
Oth
er
T
otal
U
S$bn
US$
bn
U
S$bn
US$
bn
U
S$bn
US$
bn
U
S$bn
US$
bn
U
S$bn
US$
bn
U
S$bn
A
t 31
Dec
embe
r 20
08
To
tal a
sset
s ...
......
......
......
......
......
......
......
0.4
32
.3
13
.9
43.8
0.
7
1.4
0.
6
3.1
54
.6
0.
3
151.
1 D
irect
lend
ing4 ..
......
......
......
......
......
....
–
–
–
–
–
–
–
–
1.
3
–
1.3
AB
Ss4 .
......
......
......
......
......
......
......
......
–
25.8
–
0.8
–
–
–
–
–
–
26
.6O
ther
.....
......
......
......
......
......
......
......
....
0.
4
6.5
13
.943
.00.
7
1.4
0.
6
3.1
53
.3
0.3
12
3.2
Fund
ing
prov
ided
by
HSB
C ..
......
......
.....
–
38
.6
2.
1 0.
7 0.
6
1.3
0.
2
3.2
0.
7
0.2
47
.6
CP
......
......
......
......
......
......
......
......
......
.
–
18.7
2.
1
–
–
–
–
–
–
–
20.8
MTN
s ....
......
......
......
......
......
......
......
....
–
3.
4
–
–
–
–
–
–
0.4
0.
2
4.0
Juni
or n
otes
....
......
......
......
......
......
......
–
–
–
–
–
–
–
–
0.3
–
0.
3Te
rm re
pos e
xecu
ted
......
......
......
......
..
–
14.1
–
–
–
–
–
–
–
–
14
.1In
vest
men
ts in
fund
s ...
......
......
......
.....
–
–
–
0.7
0.6
1.
3
0.2
3.
2
–
–
6.0
Dra
wn
liqui
dity
faci
lity.
......
......
......
....
–
2.
4
–
–
–
–
–
–
–
–
2.4
Cap
ital n
otes
5 .....
......
......
......
......
......
...
–
–
–
–
–
–
–
–
–
–
–
Tota
l max
imum
exp
osur
e to
co
nsol
idat
ed S
PEs .
......
......
......
......
......
.
–
47.6
17.1
0.8
0.6
1.
3
0.2
3.
2
27.0
0.2
98
.0
Liqu
idity
and
cre
dit e
nhan
cem
ents
Dea
l-spe
cific
liqu
idity
faci
litie
s ...
......
–
–
17.1
–
–
–
–
–
–
–
17
.1
Inde
mni
ties
......
......
......
......
......
......
.....
–
–
–
0.1
–
–
–
–
–
–
0.
1 Pr
ogra
mm
e-w
ide
liqui
dity
faci
litie
s ..
–
34
.8
–
–
–
–
–
–
–
–
34.8
Pr
ogra
mm
e-w
ide
limite
d cr
edit
enha
ncem
ents
....
......
......
......
......
......
–
1.2
0.
6
–
–
–
–
–
–
–
1.8
Oth
er li
quid
ity a
nd c
redi
t en
hanc
emen
ts .
......
......
......
......
......
...
–
–
–
–
–
–
–
–
0.1
–
0.
1

185
Se
curit
ies
Non
-mon
ey m
arke
t fun
ds
SIV
s
inve
stm
ent
co
ndui
ts1
Mul
ti-se
ller
co
ndui
ts
En
hanc
ed
VN
AV
fund
s
Spec
ialis
t
fund
s
Loca
l
fund
s2,6
Se
curit
-
isat
ions
3
Oth
er
To
tal
US$
bn
U
S$bn
US$
bn
U
S$bn
US$
bn
U
S$bn
US$
bn
U
S$bn
US$
bn
At 3
1 D
ecem
ber 2
007
To
tal a
sset
s ...
......
......
......
......
......
......
......
......
......
......
......
......
......
......
......
40.7
21.6
15.8
5.7
1.
0
3.1
74
.7
0.
1
162.
7 D
irect
lend
ing4 ..
......
......
......
......
......
......
......
......
......
......
......
......
......
....
–
–
–
–
–
–
3.
6
–
3.6
AB
Ss4 .
......
......
......
......
......
......
......
......
......
......
......
......
......
......
......
......
32.1
21
.0
–
–
–
–
–
–
53.1
Oth
er ..
......
......
......
......
......
......
......
......
......
......
......
......
......
......
......
......
.
8.6
0.
6
15.8
5.
7
1.0
3.
1
71.1
0.
1
106.
0
Fund
ing
prov
ided
by
HSB
C ..
......
......
......
......
......
......
......
......
......
......
.....
15.9
7.8
8.
6
4.6
0.
4
2.8
1.
0
–
41.1
C
P ...
......
......
......
......
......
......
......
......
......
......
......
......
......
......
......
......
....
2.
4
7.8
8.
6
–
–
–
–
–
18.8
MTN
s ....
......
......
......
......
......
......
......
......
......
......
......
......
......
......
......
....
5.
3
–
–
–
–
–
0.3
–
5.
6Ju
nior
not
es .
......
......
......
......
......
......
......
......
......
......
......
......
......
......
...
–
–
–
–
–
–
0.
7
–
0.7
Term
repo
s exe
cute
d ...
......
......
......
......
......
......
......
......
......
......
......
.....
8.2
–
–
–
–
–
–
–
8.
2In
vest
men
ts in
fund
s ...
......
......
......
......
......
......
......
......
......
......
......
.....
–
–
–
4.6
0.
4
2.8
–
–
7.
8
Tota
l max
imum
exp
osur
e to
con
solid
ated
SPE
s ...
......
......
......
......
......
...
40
.0
25
.7
21
.2
4.
6
0.4
2.
8
30.6
0.1
12
5.4
Liqu
idity
and
cre
dit e
nhan
cem
ents
Dea
l-spe
cific
liqu
idity
faci
litie
s ...
......
......
......
......
......
......
......
......
......
–
–
21.2
–
–
–
–
–
21.2
Pr
ogra
mm
e-w
ide
liqui
dity
faci
litie
s ...
......
......
......
......
......
......
......
.....
0.8
25
.7
–
–
–
–
–
–
26
.5
Prog
ram
me-
wid
e lim
ited
cred
it en
hanc
emen
ts .
......
......
......
......
......
..
–
0.
2
0.7
–
–
–
–
–
0.
9 O
ther
liqu
idity
and
cre
dit e
nhan
cem
ents
....
......
......
......
......
......
......
...
–
–
–
–
–
–
0.
2
–
0.2
1 Th
e se
curi
ties i
nves
tmen
t con
duits
incl
ude
Maz
arin
, Bar
ion,
Mal
achi
te a
nd S
olita
ire.
2
Loca
l inv
estm
ent m
anag
emen
t fun
ds.
3 Al
so in
clud
es c
onso
lidat
ed S
PEs t
hat h
old
mor
tgag
e lo
ans h
eld
at fa
ir v
alue
. 4
Thes
e as
sets
onl
y in
clud
e th
ose
mea
sure
d at
fair
val
ue. F
or d
etai
ls o
n th
e ge
ogra
phic
al o
rigi
n of
the
mor
tgag
e lo
ans h
eld
at fa
ir v
alue
and
ABS
s, in
clud
ing
thos
e re
pres
ente
d by
MBS
s and
CD
Os h
eld
in
cons
olid
ated
SIV
s and
secu
ritie
s inv
estm
ent c
ondu
its, s
ee ‘N
atur
e an
d ex
tent
of H
SBC
’s e
xpos
ures
’ on
pag
e 15
0. T
he g
eogr
aphi
cal o
rigi
n of
the
loan
s and
rece
ivab
les h
eld
by th
e m
ulti-
selle
r con
duits
is
disc
lose
d on
pag
e 17
7.
5 Th
e ca
rryi
ng a
mou
nt o
f HSB
C’s
hol
ding
of c
apita
l not
es in
the
secu
ritie
s inv
estm
ent c
ondu
its a
mou
nted
to U
S$1.
9 m
illio
n (2
007:
n/a
) with
a p
ar v
alue
of U
S$52
mill
ion
(200
7: n
/a).
6
Tota
l ass
ets f
or 2
007
have
bee
n re
stat
ed a
s a re
sult
of re
clas
sify
ing
asse
ts a
mou
ntin
g to
US$
17 b
illio
n fr
om V
NAV
to lo
cal f
unds
.

H S B C H O L D I N G S P L C
Report of the Directors: Impact of Market Turmoil (continued) SPEs > SIVs and conduits > Maximum exposures / 3rd party SPEs // Off-balance sheet
186
HSB
C’s
max
imum
exp
osur
e to
unc
onso
lidat
ed S
PEs
Se
curi
tisat
ions
1 M
oney
mar
ket f
unds
1 N
on-m
oney
mar
ket f
unds
1
H
SBC
or
igin
ated
asse
ts
Non
-HSB
C
orig
inat
ed
as
sets
2
CN
AV
fu
nds
E
nhan
ced
V
NA
V
fund
s
VN
AV
4
fu
nds
Sp
ecia
list
fu
nds
L
ocal
fund
s3,4
M
ulti-
m
anag
er
fu
nds
O
ther
Tot
al
US$
bn
U
S$bn
US$
bn
U
S$bn
US$
bn
U
S$bn
US$
bn
U
S$bn
US$
bn
U
S$bn
A
t 31
Dec
embe
r 20
08
Tota
l ass
ets
......
......
......
......
......
......
......
......
......
......
......
...
0.
6
13.5
28.2
2.0
26
.6
82
.5
93
.1
21
.0
20
.9
28
8.4
Fund
ing
prov
ided
by
HSB
C ..
......
......
......
......
......
......
.....
–
0.
2
–
–
0.3
–
1.
0
–
8.3
9.
8 M
TNs .
......
......
......
......
......
......
......
......
......
......
......
......
.
–
0.2
–
–
–
–
–
–
8.
3
8.5
Inve
stm
ents
in fu
nds
......
......
......
......
......
......
......
......
..
–
–
–
–
0.3
–
1.
0
–
–
1.3
Tota
l max
imum
exp
osur
e to
unc
onso
lidat
ed S
PEs
......
..
–
0.2
–
–
0.
3
–
1.0
–
4.
1
5.6
A
t 31
Dec
embe
r 200
7
To
tal a
sset
s ...
......
......
......
......
......
......
......
......
......
......
......
0.9
16
.0
56
.8
6.
2
22.6
131.
0
123.
3
30.4
23.5
410.
7
Fund
ing
prov
ided
by
HSB
C ..
......
......
......
......
......
......
.....
–
0.
4
1.3
1.
3
0.3
0.
1
2.6
0.
1
7.2
13
.3
MTN
s ....
......
......
......
......
......
......
......
......
......
......
......
....
–
0.
3
–
–
–
–
–
–
7.2
7.
5M
ezza
nine
not
es ..
......
......
......
......
......
......
......
......
......
.
–
0.1
–
–
–
–
–
–
–
0.
1In
vest
men
ts in
fund
s ...
......
......
......
......
......
......
......
.....
–
–
1.
3
1.3
0.
3
0.1
2.
6
0.1
–
5.
7
Tota
l max
imum
exp
osur
e to
unc
onso
lidat
ed S
PEs
......
..
–
0.4
1.
3
1.3
0.
3
0.1
2.
6
0.1
4.
5
10.6
1 H
SBC
’s fi
nanc
ial i
nves
tmen
ts in
off-
bala
nce
shee
t mon
ey m
arke
t fun
ds a
nd n
on-m
oney
mar
ket f
unds
hav
e be
en c
lass
ified
as a
vaila
ble-
for-
sale
secu
ritie
s, an
d m
easu
red
at fa
ir v
alue
. HSB
C’s
fina
ncia
l in
vest
men
ts in
off-
bala
nce
shee
t sec
uriti
satio
ns h
ave
been
cla
ssifi
ed a
s tra
ding
ass
ets a
nd a
vaila
ble-
for-
sale
secu
ritie
s, an
d m
easu
red
at fa
ir v
alue
. 2
In th
e U
S, H
SBC
has
est
ablis
hed
secu
ritis
atio
n pr
ogra
mm
es w
here
term
-fund
ed S
PEs a
re u
sed
to se
curi
tise
thir
d-pa
rty
orig
inat
ed m
ortg
ages
, mai
nly
sub-
prim
e an
d Al
t-A re
side
ntia
l mor
tgag
es. T
he
maj
ority
of t
hese
SPE
s are
not
con
solid
ated
by
HSB
C a
s it i
s not
exp
osed
to th
e m
ajor
ity o
f the
risk
and
rew
ards
of o
wne
rshi
p in
the
SPEs
. No
liqui
dity
faci
lity
has b
een
prov
ided
by
HSB
C.
3 Lo
cal i
nves
tmen
t man
agem
ent f
unds
. 4
Tota
l ass
ets f
or 2
007
have
bee
n re
stat
ed a
s a re
sult
of re
clas
sify
ing
asse
ts a
mou
ntin
g to
US$
17 b
illio
n fr
om V
NAV
fund
s to
loca
l fun
ds.

187
Third-party sponsored SPEs
Through standby liquidity facility commitments, HSBC has exposure to third-party sponsored SIVs, conduits and securitisations under normal banking arrangements on standard market terms. These exposures are quantified below.
HSBC’s commitments under liquidity facilities to third-party SIVs, conduits and securitisations
Commit- ments Drawn
US$bn US$bn At 31 December 2008 Third-party SIVs .................. – – Third-party conduits ............ 1.1 0.1 Third-party securitisations ... 0.6 0.1
1.7 0.2 At 31 December 2007 Third-party SIVs .................. 0.3 – Third-party conduits ............ 4.4 0.4 Third-party securitisations ... 0.5 –
5.2 0.4
Other exposures to third-party SIVs, conduits and securitisations where a liquidity facility has been provided
At 31 December 2008 2007 US$bn US$bn
Derivative assets .................. – 0.2
Other off-balance sheet arrangements and commitments
Financial guarantees, letters of credit and similar undertakings
Note 40 on the Financial Statements describes various types of guarantees and discloses the maximum potential future payments under such arrangements. Credit risk associated with all forms of guarantees is assessed in the same manner as for on-balance sheet credit advances and, where necessary, provisions for assessed impairment are included in ‘Other provisions’.
Commitments to lend
Undrawn credit lines are disclosed in Note 40 on the Financial Statements. The majority by value of undrawn credit lines arise from ‘open to buy’ lines on personal credit cards, advised overdraft limits and other pre-approved loan products, and mortgage offers awaiting customer acceptance. HSBC generally has the right to change or terminate any conditions of a personal customer’s overdraft, credit card or other credit line upon notification to the customer. In respect of corporate commitments to lend, in most cases HSBC’s position will be protected through restrictions on access to funding in the event of material adverse change.
Leveraged finance transactions
Loan commitments in respect of leveraged finance transactions are accounted for as derivatives where it is HSBC’s intention to sell the loan after origination. Further information is provided on page 160.

H S B C H O L D I N G S P L C
Report of the Directors: Risk Regulation and supervision
188
PageRegulation and supervision1 ....................... 188Risk management1 ...................................... 191Credit risk ................................................... 192
Credit risk management2 ........................ 192Credit exposure3 ..................................... 197Areas of special interest1 ......................... 208Renegotiated loans2 .................................. 216Credit quality of financial instruments3 .. 217Impaired loans and advances3 ................. 220Impairment allowances and charges3 ...... 223HSBC Holdings2 ..................................... 232Risk elements in the loan portfolio1 ........ 233
Liquidity and funding ................................. 235Policies and procedures2 ......................... 235Primary sources of funding2 ................... 235HSBC Holdings2 ..................................... 240
Market risk ................................................. 241Value at risk3 .......................................... 241Impact of market turmoil3 ........................ 242Trading portfolios2 .................................. 244Non-trading portfolios2 ........................... 245Defined benefit pension schemes2 ............. 246Sensitivity of net interest income1 ........... 246Structural foreign exchange exposures1 .... 248HSBC Holdings3 ..................................... 249
Residual value risk1 .................................... 252Operational risk1 ......................................... 252
Legal risk1 ............................................... 252Global security and fraud1 ....................... 253
Pension risk1 ............................................... 253Reputational risk1 ....................................... 254Sustainability risk1 ...................................... 254Risk management of insurance
operations2 .............................................. 255Life insurance business2 ........................... 255Non-life insurance business2 .................... 256Insurance risk2 ........................................ 256Financial risks2 ....................................... 262Present value of in-force long-term
insurance business2 ............................. 272Capital management and allocation ............ 274
Capital management2 .............................. 274Capital measurement and allocation3 ..... 275Risk-weighted assets by principal
subsidiary1 ............................................ 280
1 Unaudited. 2 Audited. 3Audited where indicated.
Regulation and supervision (Unaudited)
With listings of its ordinary shares in London, Hong Kong, New York, Paris and Bermuda, HSBC Holdings complies with the relevant requirements for listing and trading on each of these exchanges. In the UK, these are the Listing Rules of the Financial Services Authority (‘FSA’); in Hong Kong, The Rules Governing the Listing of Securities on The Stock Exchange of Hong Kong Limited (‘HKSE’); in the US, where the shares are traded in the form of ADSs, HSBC Holdings’ shares are registered with the US Securities and Exchange Commission (‘SEC’). As a consequence of its US listing, HSBC Holdings is also subject to the reporting and other requirements of the US Securities Act of 1933, as amended, the Securities Exchange Act of 1934, as amended, and the New York Stock Exchange’s (‘NYSE’) Listed Company Manual, in each case as applied to foreign private issuers. In France and Bermuda, HSBC Holdings is subject to the listing rules of Euronext, Paris and the Bermuda Stock Exchange respectively, applicable to companies with secondary listings.
A statement of HSBC’s compliance with the code provisions of the Combined Code on Corporate Governance issued by the Financial Reporting Council and with the Code on Corporate Governance Practices in Appendix 14 to the Rules Governing the Listing of Securities on The Stock Exchange of Hong Kong Limited is set out in the ‘Report of the Directors: Governance’ on page 281.
HSBC’s operations throughout the world are regulated and supervised by approximately 540 different central banks and regulatory authorities in those jurisdictions in which HSBC has offices, branches or subsidiaries. These authorities impose a variety of requirements and controls designed to improve financial stability and the transparency of financial markets and their contribution to economic growth. These regulations and controls cover, inter alia, capital adequacy, depositor protection, market liquidity, governance standards, customer protection (for example, fair lending practices, product design, and marketing and documentation standards), and social responsibility obligations (for example, anti-money laundering and anti-terrorist financing measures). In addition, a number of countries in which HSBC operates impose rules that affect, or place limitations on, foreign or foreign-owned or controlled banks and financial institutions. The rules include restrictions on the opening of local offices, branches or subsidiaries and the types of banking and non-banking activities that may be conducted by those local offices, branches or subsidiaries;

189
restrictions on the acquisition of local banks or regulations requiring a specified percentage of local ownership; and restrictions on investment and other financial flows entering or leaving the country. The supervisory and regulatory regimes of the countries where HSBC operates will determine to some degree HSBC’s ability to expand into new markets, the services and products that HSBC will be able to offer in those markets and how HSBC structures specific operations. As a result of the recent government interventions in response to recent global economic conditions – it is widely anticipated that there will be a substantial increase in government regulation and supervision of the financial services industry, including the imposition of higher capital requirements, heightened disclosure standards and restrictions on certain types of transaction structures.
In June 2006, the Basel Committee on Banking Supervision introduced a new capital adequacy framework to replace the 1988 Basel Capital Accord in the form of a new Accord (commonly known as ‘Basel II’). Details of the way in which Basel II has been implemented by the FSA, the timing of the change and the impact on HSBC are set out on page 275.
The FSA supervises HSBC on a consolidated basis. In addition, each operating bank, finance company or insurance operation within HSBC is regulated by local supervisors. The primary regulatory authorities are those in the UK, Hong Kong and the US, the Group’s principal areas of operation.
UK regulation and supervision
UK banking and financial services institutions are subject to multiple regulations. The primary UK statute is the Financial Services and Markets Act 2000 (‘FSMA’). Additionally, data privacy is regulated by the Data Protection Act 1998. Other UK financial services legislation is derived from EU directives relating to banking, securities, insurance, investments and sales of personal financial services.
In addition to its role as HSBC’s lead regulator, the FSA is responsible for authorising and supervising all HSBC’s businesses in the UK which require authorisation under FSMA. These include deposit-taking, retail banking, life and general insurance, pensions, investments, mortgages, custody and share dealing businesses, and treasury and capital markets activity. HSBC Bank plc is HSBC’s principal authorised institution in the UK.
FSA rules establish the minimum criteria for authorisation for banks and financial services
businesses in the UK. They also set out reporting (and, as applicable, consent) requirements with regard to large individual exposures and large exposures to related borrowers. In its capacity as supervisor of HSBC on a consolidated basis, the FSA receives information on the capital adequacy of, and sets requirements for, HSBC as a whole. Further details on capital measurement are included in ‘Capital management and allocation’ on pages 274 to 280. The FSA’s approach to capital requirements for UK insurers is to require minimum capital to be calculated on two bases. First, firms must calculate their liabilities on a prudent basis and add a statutory solvency margin (‘pillar 1’). Secondly, firms must calculate their liabilities on a realistic basis then add to this their own calculation of risk-based capital. The sum of realistic reserves and risk-based capital (‘pillar 2’) is agreed with the FSA. Insurers are required to maintain capital equal to the higher of pillars 1 and 2. The FSA has the right to object, on prudential grounds, to persons who hold, or intend to hold, 10 per cent or more of the voting power of a financial institution.
The regulatory framework of the UK financial services system has traditionally been based on co-operation between the FSA and authorised institutions. The FSA monitors authorised institutions through ongoing supervision and the review of routine and ad hoc reports relating to financial and prudential matters. The FSA may periodically obtain independent reports, usually from the auditors of the authorised institution, as to the adequacy of internal control procedures and systems as well as procedures and systems governing records and accounting. The FSA meets regularly with HSBC’s senior executives to discuss HSBC’s adherence to the FSA’s prudential guidelines. They also regularly discuss fundamental matters relating to HSBC’s business in the UK and internationally, including areas such as strategic and operating plans, risk control, loan portfolio composition and organisational changes, including succession planning. In light of current conditions, HSBC has experienced an increased level of ongoing interaction with the FSA.
Hong Kong regulation and supervision
Banking in Hong Kong is subject to the provisions of the Banking Ordinance and to the powers, functions and duties ascribed by the Banking Ordinance to the Hong Kong Monetary Authority (the ‘HKMA’). The principal function of the HKMA is to promote the general stability and effective working of the banking system in Hong Kong. The HKMA is responsible for supervising compliance
H S B C H O L D I N G S P L C
Report of the Directors: Risk (continued) Regulation and supervision / Risk management
190
with the provisions of the Banking Ordinance. The Banking Ordinance gives power to the Chief Executive of Hong Kong to give directions to the HKMA and the Financial Secretary with respect to the exercise of their respective functions under the Banking Ordinance.
The HKMA has responsibility for authorising banks, and has discretion to attach conditions to its authorisation. The HKMA requires that banks or their holding companies file regular prudential returns, and holds regular discussions with the management of the banks to review their operations. The HKMA may also conduct ‘on-site’ examinations of banks and, in the case of banks incorporated in Hong Kong, of any local and overseas branches and subsidiaries. The HKMA requires all authorised institutions to have adequate systems of internal control and requires the institutions’ external auditors, upon request, to report on those systems and other matters such as the accuracy of information provided to the HKMA. In addition, the HKMA may from time to time conduct tripartite discussions with banks and their external auditors.
The HKMA has the power to divest controlling interests in a bank from persons if they are no longer deemed to be fit and proper, if they may otherwise threaten the interests of depositors or potential depositors, or if they have contravened any conditions specified by the HKMA. The HKMA may revoke authorisation in the event of an institution’s non-compliance with the provisions of the Banking Ordinance. These provisions require, among other things, the furnishing of accurate reports.
The HKMA implemented Basel II with effect from 1 January 2007 for all Authorised Institutions incorporated in Hong Kong.
The marketing of, dealing in and provision of advice and asset management services in relation to securities in Hong Kong are subject to the provisions of the Securities and Futures Ordinance of Hong Kong (‘Securities and Futures Ordinance’). Entities engaging in activities regulated by the Securities and Futures Ordinance are required to be licensed. The HKMA is the primary regulator for banks involved in the securities business, while the Securities and Futures Commission is the regulator for non-banking entities.
US regulation and supervision
HSBC is subject to extensive federal and state supervision and regulation in the US. Banking laws and regulations of the Board of Governors of the Federal Reserve System (the ‘Federal Reserve Board’), the Office of the Comptroller of the
Currency (the ‘OCC’) and the Federal Deposit Insurance Corporation (the ‘FDIC’) govern many aspects of HSBC’s US business.
HSBC and its US operations are subject to supervision, regulation and examination by the Federal Reserve Board because HSBC is a ‘bank holding company’ under the US Bank Holding Company Act of 1956 (‘BHCA’), as a result of its control of HSBC Bank USA, N.A., Mclean, Virginia (‘HBUS’); HSBC Trust Company (Delaware), N.A., Wilmington, Delaware (‘HTCD’); and Wells Fargo Trade Bank, N.A., San Francisco, California (‘WFTB’). HSBC North America Holdings Inc. (‘HNAH’), formed to hold HSBC’s US and Canadian operations is also a ‘bank holding company’. Both HSBC and HNAH are registered as financial holding companies (‘FHC’s) under the BHCA, and, accordingly, may affiliate with securities firms and insurance companies and engage in other activities that are financial in nature or incidental or complementary to activities that are financial in nature. The ability of HSBC and HNAH to engage in expanded financial activities as FHCs depends upon HSBC and HNAH continuing to meet certain criteria set forth in the BHCA, including requirements that their US depository institution subsidiaries be ‘well capitalised’ and ‘well managed’, and that such institutions have achieved at least a satisfactory record in meeting community credit needs during their most recent examinations pursuant to the Community Reinvestment Act.
In general, under the BHCA, an FHC would be required, upon notice by the Federal Reserve Board, to enter into an agreement with the Federal Reserve Board to correct any failure to comply with the requirements to maintain FHC status. Until such deficiencies are corrected, the Federal Reserve Board may impose limitations on the US activities of an FHC and depository institutions under its control. If such deficiencies are not corrected, the Federal Reserve Board may require an FHC to divest its control of any subsidiary depository institution or to desist from certain financial activities in the US.
The three US banks, HBUS, HTCD, and WFTB are subject to regulation and examination primarily by the OCC, secondarily by the FDIC, and by the Federal Reserve Board. Banking laws and regulations restrict many aspects of their operations and administration, including the establishment and maintenance of branch offices, capital and reserve requirements, deposits and borrowings, investment and lending activities, payment of dividends and numerous other matters.
In December 2007, US regulators published a final

191
rule regarding Risk-Based Capital Standards: Advanced Capital Adequacy Framework – Basel II. This final rule represents the US adoption of the Basel II International Capital Accord (‘Basel II’). The final rule became effective on 1 April 2008, and requires large bank holding companies, including HNAH, to adopt its provisions no later than 1 April 2011. HNAH has established comprehensive Basel II implementation project teams comprised of risk management specialists representing all risk disciplines. In addition, US banking authorities have adopted ‘leverage’ capital requirements that generally require US banks and bank holding companies to maintain a minimum amount of capital in relation to their balance sheet assets (measured on a non-risk-weighted basis).
HBUS and HTCD are subject to risk-based assessments from the FDIC, which insures deposits generally to a maximum of US$100,000 per domestic depositor. In October 2008, the FDIC raised the maximum amount of insured deposits to US$250,000 per domestic depositor until 31 December 2009, after which the limit will return to US$100,000. The FDIC bases assessments on supervisory ratings, financial ratios and long-term debt issuer ratings, with those banks in the highest rated categories paying lower assessments.
In October 2008, the FDIC announced its Temporary Liquidity Guarantee Programme (‘TLGP’), under which the FDIC will guarantee (i) newly-issued senior unsecured debt issued by eligible, participating institutions, and (ii) certain non-interest bearing transaction accounts. HNAH and its subsidiary banks and bank holding companies elected to participate in both components of the TLGP, as applicable.
HSBC’s US consumer finance operations are subject to extensive state-by-state regulation in the US, and to laws relating to consumer protection (both in general, and in respect of sub-prime lending operations, which have been subject to enhanced regulatory scrutiny); discrimination in extending credit; use of credit reports; privacy matters; disclosure of credit terms; and correction of billing errors. They also are subject to regulations and legislation that limit operations in certain jurisdictions.
Risk management (Unaudited)
Introduction
All HSBC’s activities involve, to varying degrees, the analysis, evaluation, acceptance and management of risks or combinations of risks. The most important
categories of risk that the Group is exposed to are credit risk (including cross-border country risk), market risk, operational risks in various forms, liquidity risk, insurance risk, pension risk, residual value risk, reputational risk and sustainability (environmental and social) risks. Market risk includes foreign exchange, interest rate and equity price risks.
The management of these various risk categories is discussed below. Insurance risk is managed by the Group’s insurance businesses together with their own credit, liquidity and market risk functions, distinct from those covering the rest of HSBC due to the different nature of their activities. They remain under risk oversight at Group level.
The risk profiles of HSBC Group and of individual operating entities change constantly under the influence of a wide range of factors. The risk management framework established by the Group fosters the continuous monitoring of the risk environment and an integrated evaluation of risks and their interdependencies.
Risk governance and ownership
A well-established risk governance and ownership structure ensures oversight of, and accountability for, the effective management of risk at Group, regional, customer group and operating entity levels.
The Board approves the Group’s risk appetite framework, plans and performance targets for the Group and its principal operating subsidiaries, the appointment of senior officers, the delegation of authorities for credit and other risks and the establishment of effective control procedures. Under authority delegated by the Board, the Group Management Board (‘GMB’) through its separately convened Risk Management Meeting (‘RMM’) formulates high-level Group risk management policy, exercises delegated risk authorities and oversees the implementation of risk appetite and controls. It monitors all categories of risk, receives reports on actual performance and emerging issues, determines action to be taken and reviews the efficacy of HSBC’s risk management framework.
Primary responsibility for managing risk at operating entity level lies with the respective boards and Chief Executive Officers, as custodians of their balance sheets. In their oversight and stewardship of risk management at Group level, GMB and RMM are supported by a dedicated Global Risk function headed by the Group Chief Risk Officer (‘GCRO’), who is a member of both bodies and reports to the Group Finance Director within the integrated Finance and

H S B C H O L D I N G S P L C
Report of the Directors: Risk (continued) Credit risk > Management
192
Risk function, which the Group Finance Director represents on the Board.
Global Risk has functional responsibility for the principal financial risk types, namely retail and wholesale credit, market, operational, security and fraud risks. For these it establishes Group policy, exercises Group-wide oversight and provides reporting and analysis of portfolio composition on a global and a regional basis to senior management. Accountability and consistent control across the Global Risk function is provided through the Global Risk Management Board, chaired by the GCRO, the membership of which includes the Chief Risk Officers of HSBC’s regions and the heads of risk disciplines within GMO. Global Risk also co-ordinates the continued development of the Group’s risk appetite, economic capital and stress testing frameworks. In addition, the GCRO is a member of the Group Portfolio Oversight Committee, chaired by the Group Treasurer, which governs the Group’s portfolio management activities for the wholesale business sector.
Risk appetite
HSBC’s risk appetite framework describes the quantum and types of risk that HSBC is prepared to take in executing its strategy. It is central to an integrated approach to risk, capital and business management and supports the Group in achieving its return on equity objectives, as well as being a key element in meeting the Group’s obligations under pillar 2 of Basel II.
The formulation of risk appetite considers HSBC’s risk capacity, its financial position, the strength of its core earnings and the resilience of its reputation and brand. It is expressed both qualitatively, describing which risks are taken and why, and quantitatively. HSBC senior management attaches quantitative metrics to individual risk types to ensure that:
• underlying business activity may be guided and controlled, so that it continues to be aligned to the risk appetite framework;
• key assumptions underpinning risk appetite can be monitored and, as necessary, adjusted through subsequent business planning cycles; and
• business decisions anticipated to be necessary to mitigate risk are flagged and acted upon promptly.
The risk appetite framework, governed by the Board and overseen in its implementation on an ongoing basis by GMB and RMM, is also
maintained at regional and customer group levels. It operates through two key mechanisms:
• the framework itself defines the governance bodies, processes, metrics and other features of how HSBC addresses risk appetite as part of its ongoing business;
• periodic risk appetite statements define, at various levels in the business, the desired level of risk commensurate with return and growth targets and in line with the corporate strategy and stakeholder objectives.
The risk appetite framework covers both the beneficial and adverse aspects of risk. Within it, economic capital is the common currency through which risk is measured and used as the basis for risk evaluation, capital allocation and performance measurement across regions and customer groups. Risk appetite is executed through the operational limits that control the levels of risk run by the Group, regions and customer groups and is measured using risk-adjusted performance metrics.
Risk control culture
HSBC’s risk management policies are encapsulated in the Group Standards Manual and cascaded in a hierarchy of policy manuals throughout the Group and communicate standards, instructions and guidance to employees. They support the formulation of risk appetite and establish procedures for monitoring and controlling risks, with timely and reliable reporting to management. HSBC regularly reviews and updates its risk management policies, systems and methodologies to reflect changes in law, regulation, markets, products and emerging best practice.
It is the responsibility of all Group officers to identify, assess and manage risk within the scope of their assigned responsibilities. Personal accountability, reinforced by the Group’s governance structure and instilled by training and experience, helps to foster throughout the Group a disciplined and constructive culture of risk management and control.
Credit risk
Credit risk management (Audited)
Credit risk is the risk of financial loss if a customer or counterparty fails to meet an obligation under a contract. It arises principally from direct lending, trade finance and leasing business, but also from certain off-balance sheet products such as guarantees and credit derivatives, and from the Group’s holdings of assets in the form of debt securities. HSBC has standards, policies and procedures

193
dedicated to monitoring and managing risk from such activities.
The credit risk governance structures and control frameworks implemented by the Group are designed for all stages of economic and financial cycles, including the current economic environment. No material changes were initiated to HSBC’s risk management objectives, policies or procedures as a direct result of market turmoil. Certain measures already undertaken, however, are helping the Group to manage the effects of that turmoil. Such measures, for example the reinforcement of central credit risk oversight and independent review activities, continue to be implemented within a common operating model for the responsibilities and interaction of GMO Risk, regionally integrated risk functions and country-based management. In addition, certain operational processes have been invoked and applied in order to manage risks more intensively.
Credit Risk is part of the Global Risk function, and the heads of its Retail and Wholesale risk disciplines within GMO, as well as regional Chief Risk Officers, certain country Chief Credit Officers and the Head of Risk Strategy, report to the GCRO. The regional governance bodies for key risk matters reflect those in place at the centre. Functional units at the entity and regional levels report to GMO Risk. GMO helps build the Group’s credit risk management capacity through staff selection, training, development, performance assessment and remuneration – the GCRO is jointly responsible with business heads for setting the performance goals of senior Global Risk officers.
Across the Group, Credit Risk fulfils the role of an independent credit control unit, while engaging in dialogue with business teams to set priorities, refine risk appetite, and monitor and report higher-risk exposures. Credit risk and risk capital management policies and methodologies, including analytical model development/review and management information, are enhanced in the light of experience gained, for instance through the roll-out of the Group’s advanced internal ratings-based (‘IRB’) approach to Basel II. See also ‘Capital Management’ on page 274.
The Credit Risk function within GMO provides high-level oversight and management of credit risk for HSBC worldwide. Its responsibilities include:
• Formulating Group credit policy. Compliance, subject to approved dispensations, is mandatory for all HSBC’s operating companies, which must develop and record in local instruction manuals their detailed credit policies and procedures, consistent with Group policy.
• Guiding HSBC’s operating companies on the Group’s appetite for credit risk exposure to specified market sectors, activities and banking products. GMO Risk controls exposures to certain higher-risk sectors and closely monitors exposure to others, including real estate, the automotive sector, certain non-bank financial institutions, structured products and leveraged finance transactions. When necessary, restrictions are imposed on new business or exposures, which may be capped at Group and/or entity level.
• Undertaking independent review and objective assessment of risk. GMO Risk assesses all commercial non-bank credit facilities and exposures – including those embedded in derivatives – that are originated or renewed by HSBC’s operating companies over designated limits, prior to the facilities being committed to customers or transactions being undertaken. Operating companies may not confirm credit approval without this concurrence.
• Monitoring the performance and management of retail portfolios across the Group. GMO Risk tracks emerging trends and conducts in-depth portfolio reviews, overseeing the effective management of any adverse characteristics.
• Controlling centrally exposures to sovereign entities, banks and other financial institutions. HSBC’s credit and settlement risk limits to counterparties in these sectors are approved and managed by GMO Risk to optimise the use of credit availability and avoid excessive risk concentration.
• Controlling exposure for all debt securities held; where a security is not held solely for the purpose of trading, a formal issuer risk limit is established.
• Establishing and maintaining HSBC’s policy on large credit exposures, ensuring that concentrations of exposure by counterparty, sector or geography do not become excessive in relation to the Group’s capital base and remain within internal and regulatory limits. The approach is designed to be more conservative than internationally accepted regulatory standards. GMO Risk also monitors HSBC’s intra-Group exposures to ensure they are maintained within regulatory limits. Plans are being developed to adopt the FSA’s new ‘Integrated Groups’ regime in accordance with the published transition timetable.

H S B C H O L D I N G S P L C
Report of the Directors: Risk (continued) Credit risk > Management
194
• Controlling cross-border exposures, through the imposition of country limits with sub-limits by maturity and type of business. Country limits are determined by taking into account economic and political factors, and applying local business knowledge. Transactions with countries deemed to be higher risk are considered on a case by case basis.
• Maintaining and developing HSBC’s risk rating framework and systems, to classify exposures meaningfully and enable focused management of the risks involved. The GCRO chairs the Credit Risk Analytics Oversight Committee, which reports to the RMM and oversees risk rating model governance for both wholesale and retail business. Rating methodologies, based upon a wide range of analytics and market data-based tools, are core inputs to the assessment of customer risk. For larger facilities, while full use is made of automated risk-rating processes, the ultimate responsibility for setting risk ratings rests with the final approving executive.
• Assisting the Risk Strategy unit in the development of stress-testing scenarios, economic capital measurement and the refinement of key risk indicators and their reporting, the tools for this being increasingly embedded within the Group’s business planning processes.
• Reporting on aspects of the HSBC credit risk portfolio to the RMM, the Group Audit Committee and the Board of Directors of HSBC Holdings by way of a variety of regular and ad hoc reports covering:
– risk concentrations;
– retail portfolio performance at Group entity, regional and overall Group levels;
– specific higher-risk portfolio segments;
– a Risk Map of the status of key risk topics, with associated preventive and mitigating actions;
– individual large impaired accounts, and impairment allowances/charges for all customer segments;
– country limits, cross-border exposures and related impairment allowances;
– portfolio and analytical model performance data; and
– stress-testing results and recommendations.
• Managing and directing credit risk management systems initiatives. HSBC has constructed a centralised database covering substantially all the Group’s direct lending exposures, to deliver an increasingly granular level of management reporting. A uniform credit application process for banks is operational throughout the Group and a similar corporate credit application system covers almost all Group corporate business by value.
• Providing advice and guidance to HSBC’s operating companies, to promote best practice throughout the Group on credit-related matters such as sustainability risk, new products and training.
• Acting on behalf of HSBC Holdings as the primary interface, for credit-related issues, with external parties including the Bank of England, the FSA, rating agencies, corporate analysts, trade associations and counterparts in the world’s major banks and non-bank financial institutions.
Each HSBC operating company is required to implement credit policies, procedures and lending guidelines that meet local requirements while conforming to Group standards. Credit approval authorities are delegated by the Board of Directors of HSBC Holdings to the most senior Chief Executive Officers, who receive commensurate delegations from their own boards. In each major subsidiary, a Chief Risk Officer or Chief Credit Officer reports to the local Chief Executive Officer or Chief Operating Officer on credit-related issues, while maintaining a direct functional reporting line to the GCRO.
Each operating company is responsible for the quality and performance of its credit portfolios and for monitoring and controlling all credit risks in them, including those subject to central approval by Group Risk. This includes managing its own risk concentrations by market sector, geography and product. Local systems are in place throughout the Group to enable operating companies to control and monitor exposures by customer and retail product segments.
Special attention is paid to problem exposures, which are subject to more frequent and intensive review and reporting, in order to accelerate remedial action. Where appropriate, HSBC’s local operating companies maintain or establish specialist units to provide customers with support in order to help them avoid default wherever possible.
Periodic risk-based audits of operating companies’ credit processes and portfolios are
195
undertaken by HSBC’s Internal Audit function. Audits include consideration of the adequacy and clarity of credit policy/procedure manuals; an in-depth analysis of a representative sample of accounts; an overview of homogeneous portfolios of similar assets to assess the quality of the loan book and other exposures; consideration of any oversight or review work performed by credit risk management functions and the adequacy of impairment calculations; a review of analytical model governance and implementation; a review of management objectives and a check that Group and local standards and policies are adhered to in the approval and management of credit facilities.
Individually significant accounts are reviewed on a sample basis to ensure that risk ratings are appropriate, that credit and collection procedures have been properly followed and that, when an account or portfolio evidences deterioration, impairment allowances are raised in accordance with the Group’s established procedures. Internal Audit discusses with management any risk ratings it considers to be inappropriate; after discussion, its final recommendations for revised ratings must then be adopted.
Credit quality (Audited)
HSBC’s credit risk rating systems and processes differentiate exposures in order to highlight those with greater risk factors and higher potential severity of loss. In the case of individually significant accounts, risk ratings are reviewed regularly and any amendments are implemented promptly. Within the Group’s retail businesses, risk is assessed and managed using a wide range of risk and pricing models to generate portfolio data.
HSBC’s historical, seven-grade risk rating system based on a judgemental assessment of the likelihood and impact of delinquency was superseded in 2008 for financial reporting purposes, as for those of all significant risk management decisions employing credit risk ratings, by a more risk-sensitive and granular methodology. This facilitates the IRB approach under Basel II adopted by the Group to support calculation of its minimum credit regulatory capital requirement.
The integration of this methodology into HSBC’s risk processes and structures is well advanced and supports reporting on the new basis to senior management in line with the Group’s IRB obligations. For further details, please see ‘Credit quality of financial instruments’ on page 217.
Impairment assessment (Audited)
When impairment losses occur, HSBC reduces the carrying amount of loans and advances through the use of an allowance account. When impairment of available-for-sale financial assets and held-to-maturity financial investments occurs, the carrying amount of the asset is reduced directly. For further details on the accounting policy for impairment of available-for-sale debt and equity securities, see ‘Accounting policies’ on page 350.
Impairment allowances may be assessed and created either for individually significant accounts or, on a collective basis, for groups of individually significant accounts for which no evidence of impairment has been individually identified or for high-volume groups of homogeneous loans that are not considered individually significant.
It is HSBC’s policy that each operating company creates allowances for impaired loans promptly and consistently.
Management regularly evaluates the adequacy of the established allowances for impaired loans by conducting a detailed review of the loan portfolio, comparing performance and delinquency statistics with historical trends and assessing the impact of current economic conditions.
Individually assessed impairment allowances
These are determined by evaluating exposure to loss, case by case, on all individually significant accounts and all other accounts that do not qualify for the collective assessment approach outlined below. Loans are treated as impaired as soon as there is objective evidence that an impairment loss has been incurred. The criteria used by HSBC to determine that there is such objective evidence include:
• known cash flow difficulties experienced by the borrower;
• past due contractual payments of either principal or interest;
• breach of loan covenants or conditions;
• the probability that the borrower will enter bankruptcy or other financial realisation; and
• a significant downgrading in credit rating by an external credit rating agency.
In determining the level of allowances on such accounts, the following factors are typically considered:
• HSBC’s aggregate exposure to the customer;

H S B C H O L D I N G S P L C
Report of the Directors: Risk (continued) Credit risk > Management / Credit exposure
196
• the viability of the customer’s business model and their capacity to trade successfully out of financial difficulties, generating sufficient cash flow to service debt obligations;
• the ability of the borrower to obtain, and make payments in, the currency of the loan if not denominated in local currency;
• the amount and timing of expected receipts and recoveries;
• the extent of other creditors’ commitments ranking ahead of, or pari passu with, HSBC and the likelihood of other creditors continuing to support the company;
• the complexity of determining the aggregate amount and ranking of all creditor claims and the extent to which legal and insurance uncertainties are evident;
• the value of security and likelihood of successfully realising it;
• the existence of other credit mitigants and the ability of the providers of such credit mitigants to deliver as contractually committed; and
• when available, the secondary market price of the debt.
The level of impairment allowances on individually significant accounts that are above defined materiality thresholds is reviewed at least semi-annually, and more regularly when circumstances require. This normally encompasses re-assessment of the enforceability of any collateral held and of actual and anticipated receipts. For significant commercial and corporate debts, specialised loan ‘work-out’ teams with experience in insolvency and specific market sectors are used to manage the lending and assess likely losses.
Individually assessed impairment allowances are only released when there is reasonable and objective evidence of a reduction in the established loss estimate.
Collectively assessed impairment allowances
Impairment is assessed on a collective basis in two circumstances:
• to cover losses that have been incurred but have not yet been identified on loans subject to individual assessment; and
• for homogeneous groups of loans that are not considered individually significant.
Incurred but not yet identified impairment
Individually assessed loans for which no evidence of impairment has been specifically identified on an individual basis are grouped together according to their credit risk characteristics. A collective impairment allowance is calculated to reflect impairment losses incurred at the balance sheet date which will only be individually identified in the future.
The collective impairment allowance is determined having taken into account:
• historical loss experience in portfolios of similar credit risk characteristics (for example, by industry sector, risk rating or product segment);
• the estimated period between impairment occurring and the loss being identified and evidenced by the establishment of an appropriate allowance against the individual loan; and
• management’s experienced judgement as to whether current economic and credit conditions are such that the actual level of inherent losses is likely to be greater or less than that suggested by historical experience.
The period between a loss occurring and its identification is estimated by local management for each relevant portfolio. In general, the periods used vary between four and twelve months although, in exceptional cases, longer periods are warranted.
The basis on which impairment allowances for incurred but not yet identified losses is established in each reporting entity is documented and reviewed by senior Finance and Credit Risk management to ensure conformity with Group policy.
Homogeneous groups of loans
Two methodologies are used to calculate impairment allowances where large numbers of relatively low-value assets are managed using a portfolio approach, typically:
• low-value, homogeneous small business accounts in certain countries or territories;
• residential mortgages that have not been individually assessed;
• credit cards and other unsecured consumer lending products; and
• motor vehicle financing.
When appropriate empirical information is available, the Group uses roll rate methodology. This employs a statistical analysis of historical trends of

197
default and the amount of consequential loss, based on the delinquency of accounts within a portfolio of homogeneous accounts. Other historical data and current economic conditions are also evaluated when calculating the appropriate level of impairment allowance required to cover inherent loss. In certain highly developed markets, models also take into account behavioural and account management trends revealed in, for example, bankruptcy and rescheduling statistics.
When the portfolio size is small, or when information is insufficient or not reliable enough to adopt a roll rate methodology, a formulaic approach is used that allocates progressively higher percentage loss rates the longer a customer’s loan is overdue. Loss rates reflect the discounted expected future cash flows for a portfolio.
Generally, historical experience is the most objective and relevant information from which to begin to assess inherent loss within each portfolio. In circumstances where historical loss experience provides less relevant information about the inherent loss in a given portfolio at the balance sheet date – for example, where there have been changes in economic conditions or regulations – management considers the more recent trends in the portfolio risk factors which may not be adequately reflected in its statistical models and, subject to guidance from Group Finance and GMO Risk, adjusts impairment allowances accordingly.
Roll rates, loss rates and the expected timing of future recoveries are regularly benchmarked against actual outcomes to ensure they remain appropriate.
Write-off of loans and advances
Loans are normally written off, either partially or in full, when there is no realistic prospect of further recovery. Where loans are secured, this is generally after receipt of any proceeds from the realisation of security. In the case of residential mortgages and second lien loans in HSBC Finance, loan carrying amounts in excess of net realisable value are written off at or before the time foreclosure is completed or when settlement is reached with the borrower. If there is no reasonable expectation of recovery, and foreclosure is pursued, unconstrained by delays required by law or regulation, the loan is normally written off no later than the end of the month in which the loan becomes 240 days contractually past due.
Unsecured personal facilities, including credit cards, are generally written off at between 150 and 210 days past due, the standard period being the end of the month in which the account becomes 180 days
contractually delinquent. This period may be extended, generally to 300 days past due but in no event exceeding 360 days past due, in the case of HSBC Finance’s unsecured personal facilities other than credit cards.
Cases of write-off periods exceeding 360 days past due are few but arise, for example, in a few countries where local regulation or legislation constrain earlier write-off, or where the realisation of collateral for secured real estate lending extends beyond this time.
In the event of bankruptcy or analogous proceedings, write-off may occur earlier than at the periods stated above. Collections procedures may continue after write-off.
Cross-border exposures
Management assesses the vulnerability of countries to foreign currency payment restrictions when considering impairment allowances on cross-border exposures. This assessment includes an analysis of the economic and political factors existing at the time. Economic factors include the level of external indebtedness, the debt service burden and access to external sources of funds to meet the debtor country’s financing requirements. Political factors taken into account include the stability of the country and its government, threats to security, and the quality and independence of the legal system.
Impairment allowances are assessed in respect of all qualifying exposures within these countries unless these exposures and the inherent risks are:
• performing, trade-related and of less than one year’s maturity;
• mitigated by acceptable security cover which is, other than in exceptional cases, held outside the country concerned;
• in the form of securities held for trading purposes for which a liquid and active market exists, and which are measured at fair value daily;
• performing facilities with a principal (excluding security) of US$1 million or below; or
• performing facilities with maturity dates shorter than three months.
Credit exposure
Maximum exposure to credit risk (Audited)
HSBC’s exposure to credit risk is spread over several asset classes, including derivatives, trading

H S B C H O L D I N G S P L C
Report of the Directors: Risk (continued) Credit risk > Credit exposure > Collateral
198
assets, loans and advances to customers, loans and advances to banks, and financial investments. The balance of exposure at 31 December 2008 represented a change in risk profile compared with a year ago as HSBC repositioned its balance sheet in the face of unprecedented turmoil in financial markets. The following commentary is on a constant currency basis.
Derivative asset balances rose significantly as the financial turmoil of 2008 led to heightened levels of volatility in the underlying markets to which the derivatives are referenced. The rise in asset balances was primarily driven by interest rate derivatives as the global fall in interest reference rates created significant gaps between the fixed and floating components of interest rate swaps, which in turn led to substantial mark-to-market increases in the value of interest rate swap positions. The widening credit spreads and significant volatility in credit and foreign exchange markets created the environment in which credit derivative positions and foreign exchange derivative assets increased.
HSBC reduced exposure to banks as it tightened lending limits in response to declining credit quality. Much of this lending was instead placed into government issued or guaranteed debt, which contributed to an increase in financial investments.
Loans and advances to customers in the commercial sector grew while personal lending declined, primarily due to the continued run-off of parts of the portfolio in North America. Amounts due from non-bank financial institutions increased due to the expansion of reverse repo lending with the London Clearing House in the UK and a reclassification of cash collateral in the US.
Within trading assets, debt securities and treasury and other bills increased, primarily due to the consolidation on 30 September 2008 of five Constant Net Asset Value funds containing assets upon consolidation of around US$40 billion held for trading. For further details see pages 180 to 181.
As a consequence of the significant increase in derivative balances, there was a decline in the proportion of total assets represented by most other asset classes. On a reported basis, the proportion of total assets represented by derivative assets increased by 12 percentage points while that deployed in loans and advances to customers declined by 5 percentage points and the proportion of trading assets declined by 2 percentage points. Loans and advances to banks as a proportion of total assets declined by 4 percentage points.
The most significant factor affecting HSBC’s exposure to credit risk during 2008 was the continuing deterioration in credit conditions in the US mortgage market. HSBC also experienced deterioration in credit quality in the commercial real estate sector. Loss experience remained concentrated in the personal lending portfolios, primarily in the US with 85 per cent of loan impairment charges and other credit risk provisions arising in Personal Financial Services in 2008 compared with 94 per cent in 2007. In 2008, 9 per cent of loan impairment charges and other credit risk provisions arose in Commercial Banking, compared with 6 per cent in 2007. In the UK, despite significant declines in house prices and activity in the housing market as a whole, the credit quality of HSBC’s mortgage business remained materially stable in 2008.
The following table presents the maximum exposure to credit risk from balance sheet and off-balance sheet financial instruments, before taking account of any collateral held or other credit enhancements (unless such credit enhancements meet offsetting requirements). For financial assets recognised on the balance sheet, the maximum exposure to credit risk equals their carrying amount; for financial guarantees granted, it is the maximum amount that HSBC would have to pay if the guarantees were called upon. For loan commitments and other credit-related commitments that are irrevocable over the life of the respective facilities, it is the full amount of the committed facilities.

199
Maximum exposure to credit risk (Audited)
At 31 December 2008 At 31 December 2007
Maximum exposure Offset
Net exposure to credit risk
Maximum exposure Offset
Net exposure to credit risk
US$m US$m US$m US$m US$m US$m
Items in the course of collection from other banks 6,003 – 6,003 9,777 – 9,777
Trading assets ..................................................... 405,451 (13,227) 392,224 394,492 (12,220) 382,272 – treasury and other eligible bills ................... 32,458 – 32,458 16,439 – 16,439– debt securities .............................................. 199,619 – 199,619 178,834 (1,417) 177,417– loans and advances to banks ....................... 73,055 – 73,055 100,440 (994) 99,446– loans and advances to customers ................ 100,319 (13,227) 87,092 98,779 (9,809) 88,970
Financial assets designated at fair value ............ 17,540 – 17,540 21,517 – 21,517 – treasury and other eligible bills ................... 235 – 235 181 – 181– debt securities .............................................. 16,349 – 16,349 21,150 – 21,150– loans and advances to banks ....................... 230 – 230 178 – 178– loans and advances to customers ................ 726 – 726 8 – 8
Derivatives .......................................................... 494,876 (383,308) 111,568 187,854 (121,709) 66,145
Loans and advances held at amortised cost ........ 1,086,634 (83,398) 1,003,236 1,218,914 (66,983) 1,151,931 – loans and advances to banks ....................... 153,766 (126) 153,640 237,366 (278) 237,088– loans and advances to customers ................ 932,868 (83,272) 849,596 981,548 (66,705) 914,843
Financial investments ......................................... 292,984 – 292,984 270,406 – 270,406 – treasury and other similar bills .................... 41,027 – 41,027 30,104 – 30,104– debt securities .............................................. 251,957 – 251,957 240,302 – 240,302
Other assets ......................................................... 40,859 (5) 40,854 43,245 (226) 43,019 – endorsements and acceptances .................... 10,482 (5) 10,477 12,248 (226) 12,022– accrued income and other ........................... 30,377 – 30,377 30,997 – 30,997
Financial guarantees ........................................... 52,318 – 52,318 56,440 – 56,440 Loan commitments and other credit-related
commitments1 ................................................. 604,022 – 604,022 764,457 – 764,457
3,000,687 (479,938) 2,520,749 2,967,102 (201,138) 2,765,964
1 The amount of the loan commitments reflects, where relevant, the expected level of take-up of pre-approved loan offers made by mailshots to personal customers. In addition to those amounts, there is a further maximum possible exposure to credit risk of US$35,849 million (2007: US$317,834 million), reflecting the full take-up of such irrevocable loan commitments.
Collateral and other credit enhancements (Audited)
Collateral held against financial instruments presented in the ‘Maximum exposure to credit risk’ table above is described in more detail below.
Items in the course of collection from other banks
Settlement risk arises in any situation where a payment in cash, securities or equities is made in the expectation of a corresponding receipt of cash, securities or equities. Daily settlement limits are established for counterparties to cover the aggregate of HSBC’s transactions with each one on any single day. Settlement risk on many transactions, particularly those involving securities and equities, is substantially mitigated by settling through assured payment systems or on a delivery-versus-payment basis.
Treasury, other eligible bills and debt securities
Collateral held as security for financial assets other than loans and advances is determined by the nature of the instrument. Debt securities, treasury and other eligible bills are generally unsecured, except for ABSs and similar instruments, which are secured by pools of financial assets.
Derivatives
The ISDA Master Agreement is HSBC’s preferred agreement for documenting derivatives activity. It provides the contractual framework within which dealing activity across a full range of over-the-counter products is conducted, and contractually binds both parties to apply close-out netting across all outstanding transactions covered by an agreement if either party defaults or other pre-agreed termination events occur. It is common, and HSBC’s preferred practice, for the parties to execute a Credit Support Annex (‘CSA’) in conjunction with the

H S B C H O L D I N G S P L C
Report of the Directors: Risk (continued) Credit risk > Credit exposure / Concentration
200
ISDA Master Agreement. Under a CSA, collateral is passed between the parties to mitigate the market-contingent counterparty risk inherent in the outstanding positions.
Loans and advances
It is HSBC’s policy, when lending, to do so on the basis of the customer’s capacity to repay, rather than rely primarily on the value of security offered. Depending on the customer’s standing and the type of product, facilities may be provided unsecured. Whenever available, collateral can be an important mitigant of credit risk.
The guidelines applied by operating companies in respect of the acceptability of specific classes of collateral or credit risk mitigation, and the determination of valuation parameters are subject to regular review to ensure that they are supported by empirical evidence and continue to fulfil their intended purpose. The principal collateral types employed by HSBC are as follows:
• in the personal sector, mortgages over residential properties;
• in the commercial and industrial sector, charges over business assets such as premises, stock and debtors;
• in the commercial real estate sector, charges over the properties being financed; and
• in the financial sector, charges over financial instruments such as cash, debt securities and equities in support of trading facilities.
In addition, credit derivatives, including credit default swaps and structured credit notes, and securitisation structures are used to manage credit risk in the Group’s loan portfolio.
HSBC does not disclose the fair value of collateral held as security or other credit enhancements on loans and advances past due but not impaired, or on individually assessed impaired loans and advances, as it is not practicable to do so.
Concentration of exposure (Audited)
Concentrations of credit risk arise when a number of counterparties or exposures have comparable economic characteristics, or such counterparties are engaged in similar activities or operate in the same geographical areas or industry sectors, so that their collective ability to meet contractual obligations is uniformly affected by changes in economic, political or other conditions.
Securities held for trading (Unaudited)
Total securities held for trading within trading assets were US$254 billion at 31 December 2008 (2007: US$247 billion). The largest concentration of these assets was government and government agency securities, which amounted to US$143 billion, or 56 per cent of overall trading securities (2007: US$115 billion, 46 per cent). This included US$32 billion (2007: US$16 billion) of treasury and other eligible bills. Corporate debt and other securities were US$82 billion or 32 per cent of overall trading securities, 8 percentage points higher than 2007’s level of 24 per cent at US$60 billion. Included within total securities held for trading were US$50 billion (2007: US$70 billion) of debt securities issued by banks and other financial institutions.
A more detailed analysis of securities held for trading is set out in Note 16 on the Financial Statements and an analysis of credit quality is provided on page 218.
Debt securities, treasury and other eligible bills (Unaudited)
At US$293 billion, total financial investments excluding equity securities were 8 per cent higher at 31 December 2008 than at the end of 2007. Debt securities, at US$252 billion, represented the largest concentration of financial investments at 86 per cent of the total, compared with US$240 billion (89 per cent) at 31 December 2007. HSBC’s holdings of corporate debt, ABSs and other securities were spread across a wide range of issuers and geographical regions, with 48 per cent invested in securities issued by banks and other financial institutions. In total, holdings in ABSs decreased by US$24 billion due to a combination of movements in fair values, principal amortisations and write-downs.
Investments in securities of governments and government agencies of US$114 billion were 38 per cent of overall financial investments, 5 percentage points higher than in 2007. US$41 billion of these investments comprised treasury and other eligible bills.
A more detailed analysis of financial investments is set out in Note 19 on the Financial Statements and an analysis by credit quality is provided on page 218.
The insurance businesses held diversified portfolios of debt and equity securities designated at fair value (2008: US$20 billion; 2007: US$34 billion) and debt securities classified as financial investments (2008: US$28 billion; 2007:

201
US$23 billion). A more detailed analysis of securities held by the insurance businesses is set out on page 262.
Derivatives (Unaudited)
Derivative assets at 31 December 2008 were US$495 billion, a rise of 163 per cent from 31 December 2007, primarily foreign exchange, interest rate and credit derivatives. The main drivers of growth were mark-to-market movements across the entire portfolio arising from volatility and movements in interest rates and credit spreads.
Loans and advances (Unaudited)
Loans and advances were well diversified across industry sectors and jurisdictions.
At constant exchange rates, gross loans and advances to customers (excluding the financial sector settlement accounts and reclassified ABSs) at 31 December 2008 rose by US$54 billion or 7 per cent from 31 December 2007.
Personal lending represented 46 per cent of total loans and advances to customers including the financial sector settlement accounts and reclassified ABSs. Residential mortgages of US$243 billion represented 25 per cent of total advances to customers, the Group’s largest concentration in a single exposure type.
Corporate, commercial and financial lending, including settlement accounts, amounted to 53 per cent of total loans and advances to customers at 31 December 2008. The largest industry concentrations were in non-bank financial institutions and commercial real estate lending at 10 per cent and 7 per cent, respectively, of total gross lending to customers.
Exposure to non-bank financial institutions principally comprised secured lending on trading accounts, primarily through repo facilities. During 2008, HSBC reduced unsecured exposure to hedge
fund trading accounts. HSBC had no material exposure to hedge funds affected by the administration of Lehman Brothers International (Europe).
HSBC managed its exposure to insurance institutions closely within existing limits and experienced no material loss during 2008.
Commercial, industrial and international trade lending rose strongly during 2008, increasing its proportion of total lending by 2 percentage points to 22 per cent of total gross loans and advances to customers on a reported basis. Within this category, the largest concentration of lending was to the service sector, which amounted to 6 per cent of total gross lending to customers.
Loans and advances to banks were widely distributed across major institutions.
Lending to banks was managed downwards through 2008. HSBC reduced limits to this sector in response to a deterioration in credit quality which was most visible in the collapse of a number of US and Icelandic banks to which the Group had advanced funds. The expansion of sovereign guarantees for some bank issuance increased appetite for these counterparties.
2008 compared with 2007 (Unaudited)
The commentary below analyses, on a constant currency basis, the changes in lending noted in the table below, compared with the position at 31 December 2007. On this basis, loans and advances to personal, corporate and commercial customers increased by 7 per cent, and total gross loans and advances rose by 1 per cent.
Total lending to personal customers was concentrated in North America (US$196 billion), the UK (US$108 billion) and Hong Kong (US$46 billion). Collectively, these regions accounted for 79 per cent of total personal lending, a decline of 1 percentage point from the level reported at 31 December 2007. Total lending to personal customers declined by 3 per cent to US$440 billion at 31 December 2008.

H S B C H O L D I N G S P L C
Report of the Directors: Risk (continued) Credit risk > Credit exposure > Concentration
202
Gross loans and advances by industry sector (Unaudited)
At 31 December
2007
Constantcurrency
effect
Movement on a constant
currency basis
At 31 December 2008
US$m US$m US$m US$m Gross loans and advances to customers Personal ......................................................................... 500,834 (47,831) (12,776) 440,227
Residential mortgages1 ............................................. 269,068 (30,164) 4,433 243,337 Other personal2 ......................................................... 231,766 (17,667) (17,209) 196,890
Corporate and commercial ........................................... 400,771 (59,671) 66,374 407,474 Commercial, industrial and international trade......... 202,038 (31,953) 39,755 209,840 Commercial real estate ............................................. 72,345 (9,224) 7,848 70,969 Other property-related .............................................. 33,907 (4,188) 1,020 30,739 Government .............................................................. 5,708 (650) 1,486 6,544 Other commercial3 .................................................... 86,773 (13,656) 16,265 89,382
Financial ....................................................................... 99,148 (11,391) 13,328 101,085 Non-bank financial institutions ................................ 96,781 (11,146) 13,901 99,536 Settlement accounts .................................................. 2,367 (245) (573) 1,549
Asset-backed securities reclassified ............................. – – 7,991 7,991
Gross loans and advances to customers ....................... 1,000,753 (118,893) 74,917 956,777
Gross loans and advances to banks .......................... 237,373 (20,125) (63,419) 153,829
1,238,126 (139,018) 11,498 1,110,606
1 Including Hong Kong Government Home Ownership Scheme loans of US$3,882 million at 31 December 2008 (2007: US$3,942 million). 2 Other personal loans and advances include second lien mortgages and other property-related lending. 3 Other commercial loans and advances include advances in respect of agriculture, transport, energy and utilities.
Residential mortgages rose slightly to US$243 billion at 31 December 2008, comprising 25 per cent of total loans and advances to customers (including the financial sector and settlement accounts). A significant increase in mortgage lending in the UK, combined with more modest increases in Hong Kong, Rest of Asia-Pacific and Latin America, more than offset a 15 per cent decrease in the value of mortgage lending in North America.
In Europe, residential mortgage lending rose by 22 per cent to US$87 billion. Mortgage lending rose by 26 per cent in the UK, driven by the successful launch of the RateMatcher campaign in April 2008, and a similarly successful campaign in First Direct. This was partly offset by a decline in France due to the sale of the regional banks in July 2008.
In Hong Kong, residential mortgage lending rose by 11 per cent due to successful repricing initiatives which allowed HSBC to become the market leader for new mortgage lending during the year. In response to the weakening local economy and declining house prices in the second half of 2008, HSBC tightened lending criteria and increased pricing on new loans.
In Rest of Asia-Pacific, mortgage lending rose by 11 per cent, driven by continued business
expansion in the Middle East. Balances in mainland China grew strongly as the branch network expanded.
In North America, mortgage lending declined by 15 per cent. In the US, total mortgage lending amounted to US$81 billion at 31 December 2008, a decline of 18 per cent since 31 December 2007. In the mortgage services business, balances declined by 21 per cent as there were no new originations and the portfolio continued to run-off. In consumer lending, balances declined by 7 per cent as a result of management actions taken to reduce risk in the portfolio, including further tightening underwriting criteria and increasing collateral requirements for new originations. In HSBC USA, balances declined by 32 per cent, primarily due to the sale of US$7.0 billion of mortgage portfolios during 2008 and the fact that the majority of loan originations continued to be sold in the secondary markets. In line with HSBC’s reduced risk appetite, the wholesale and third-party correspondent prime mortgage business of HSBC USA was closed in November 2008.
In Latin America, residential mortgage lending increased, driven by continued growth in fixed rate mortgage lending in Mexico.
Other personal lending declined by 8 per cent to US$197 billion at 31 December 2008, representing

203
21 per cent of total loans and advances to customers (including the financial sector and settlement accounts).
In Europe, other personal lending declined by 11 per cent from the end of 2007 to US$54 billion. The decrease was primarily attributable to the UK as a stronger focus on secured lending restricted originations in the unsecured portfolio. The sale of certain non-core credit card portfolios in the first half of 2008 also contributed to the decrease in the UK. In France, balances declined due to the sale of the regional banks in the second half of 2008. In Turkey, continued expansion of the branch network during 2008 resulted in higher balances, particularly in credit cards and overdrafts.
In Hong Kong, other personal lending declined by 2 per cent to US$13 billion. HSBC remained the market leader for credit cards in Hong Kong based on cards in circulation, cardholder spending and balances.
In Rest of Asia-Pacific, other personal lending rose by 12 per cent, primarily due to strong growth in the Middle East. Elsewhere in the region, balances rose in Malaysia and Indonesia.
In North America, other personal lending balances declined by 12 per cent to US$97 billion. In the US, consumer finance business and credit card lending fell due to the combined effect of tighter underwriting criteria and lower marketing expenditure. A reduction in non-credit card personal lending reflected the decision to cease new business in guaranteed direct mail loans and personal home-owner loans in the second half of 2007, and tighter underwriting criteria applied to originations in the remainder of the portfolio. In the mortgage services business, second lien balances declined due to the continued run-off of the portfolio following the cessation of originations in 2007. Lower vehicle finance lending at HSBC Finance reflected the discontinuation of certain product offerings and the cessation of new vehicle loan originations from the dealer and direct-to-consumer channels in July 2008. HSBC USA also discontinued originations of indirect vehicle finance loans, but second lien loans increased following a promotional campaign channelled through the branch network in the first half of 2008. In Canada, lower balances were attributable to the disposal of the vehicle finance businesses during the year.
In Latin America, other personal lending rose by 9 per cent to US$15 billion. Lending growth was primarily concentrated in Brazil and reflected strong demand for payroll loans and vehicle lending. In Mexico, balances were broadly in line with
31 December 2007 and the mix was adjusted towards customers of higher credit quality. Further growth was restricted as risk appetite was adjusted by closing certain products to new originations and tightening underwriting criteria on cards, leading to a sharp reduction in the number of cards issued in 2008.
Loans and advances to corporate and commercial customers rose by 19 per cent to US$407 billion, with strong growth across all regions. Lending was primarily concentrated in Europe, where it accounted for 54 per cent of advances to this sector, of which more than 40 per cent were in the UK.
In Europe, corporate and commercial advances rose by 24 per cent. In the UK, lending rose by 35 per cent, driven by growth in lending to large corporates. Balances declined in France due to the sale of the regional banks in July 2008.
In Hong Kong, corporate and commercial lending rose by 19 per cent, driven by higher lending in commercial, industrial and international trade, commercial real estate and other property-related sectors.
In Rest of Asia-Pacific, strong corporate and commercial lending growth was experienced in the Middle East and Singapore, which rose by 26 per cent and 50 per cent respectively and, to a lesser extent, in Malaysia, India and Taiwan, the latter due to the acquisition of the assets and liabilities of The Chinese Bank in March 2008. In the Middle East, the corporate and commercial loan book continued to grow, owing to an expansion of lending in UAE, particularly for trade and investment projects, in addition to general business growth. In Singapore, higher lending was driven by strong demand from the international trade sector. Lending in Japan declined due to the closure of inactive and unprofitable accounts, and lending in mainland China fell as a result of tightened government regulations and tighter lending criteria in response to the weakening local economy. This partly offset the strong growth elsewhere in the region.
In North America, corporate and commercial lending increased by 7 per cent, driven by growth in HSBC USA and, to a lesser extent, in Canada. In HSBC USA, higher lending to corporate and commercial clients reflected the targeted expansion of middle market activities and the drawdown of existing credit facilities, partly offset by a decline in commercial real estate activity as the bank managed down its lending exposures in light of lower risk appetite and a deterioration in market conditions. In Canada, corporate and commercial lending rose by

H S B C H O L D I N G S P L C
Report of the Directors: Risk (continued) Credit risk > Credit exposure > Concentration
204
9 per cent, particularly in Western Canada, as demand remained strong for commercial loans.
In Latin America, corporate and commercial lending rose by 20 per cent, driven by higher lending in Brazil as a result of strong growth in the trade loans portfolio and working capital products.
Loans and advances to the financial sector rose by 15 per cent with strong growth in the UK and North America, largely in collateralised lending. Lending balance were 46 per cent higher in the UK due to the increased use of secured funding facilities through the London Clearing House in the form of repos. In North America, higher lending was driven by HSBC USA due to the reclassification from ‘Other assets’ of cash collateral held with other institutions.
Loans and advances to banks fell by 29 per cent to US$154 billion due to a significant decline in placement activity in Hong Kong and Europe. This was driven by a reduction in money market and inter-bank placements in favour of treasury bills and bank securities. In the UK, a higher proportion of assets were invested in government and government-guaranteed debt. Elsewhere, growth in Latin America was primarily in Brazil, due to higher reverse repo balances.
The following tables analyse loans by industry sector and by the location of the principal operations of the lending subsidiary or, in the case of the operations of The Hongkong and Shanghai Banking Corporation Limited, HSBC Bank plc, HSBC Bank Middle East Limited and HSBC Bank USA N.A., by the location of the lending branch.
Gross loans and advances to customers by industry sector (Audited: 2008 to 2005; Unaudited: 2004) 2008 2007 2006 2005 2004 US$m US$m US$m US$m US$m
Personal .................................................................... 440,227 500,834 476,146 420,476 387,852 Residential mortgages1 ........................................ 243,337 269,068 265,337 238,546 227,847Other personal ..................................................... 196,890 231,766 210,809 181,930 160,005
Corporate and commercial ...................................... 407,474 400,771 343,107 278,709 231,772 Commercial, industrial and international trade ... 209,840 202,038 162,109 130,802 101,876Commercial real estate ........................................ 70,969 72,345 60,366 51,815 43,469Other property-related ......................................... 30,739 33,907 27,165 22,196 20,749Government ......................................................... 6,544 5,708 8,990 8,218 10,527Other commercial2 ............................................... 89,382 86,773 84,477 65,678 55,151
Financial .................................................................. 101,085 99,148 62,458 52,174 66,148 Non-bank financial institutions ........................... 99,536 96,781 59,204 50,032 52,329Settlement accounts ............................................. 1,549 2,367 3,254 2,142 13,819
Asset-backed securities reclassified ........................ 7,991 – – – –
Total gross loans and advances to customers3 ........ 956,777 1,000,753 881,711 751,359 685,772
Impaired loans4,6 ...................................................... 25,352 19,582 15,071 12,338 13,031 – as a percentage of gross loans and advances
to customers4 ................................................... 2.6% 2.0% 1.7% 1.6% 1.9%
Total impairment allowances5 ................................. 23,909 19,205 13,578 11,357 12,542 – as a percentage of total gross loans
and advances ................................................... 2.5% 1.9% 1.5% 1.5% 1.8%
1 Residential mortgages include Hong Kong Government Home Ownership Scheme loans of US$3,882 million (2007: US$3,942 million; 2006: US$4,078 million; 2005: US$4,680 million; 2004: US$5,383 million).
2 Other commercial loans and advances include advances in respect of agriculture, transport, energy and utilities. 3 Included within this total is credit card lending of US$75,266 million (2007: US$82,854 million; 2006: US$74,518 million; 2005:
US$66,020 million; 2004: US$56,222 million). 4 The figures for 2004 are net of suspended interest. 5 2004: Specific provisions on impaired loans. 6 Impaired loans for 2004-2007 have been restated as a result of the reclassification of an element of a credit card portfolio as impaired.
There has been no effect on impairment allowances.

205
Loans and advances to customers by industry sector and by geographical region (Audited)
Europe Hong Kong
Rest of Asia- Pacific
North America
Latin America
Gross loans and advances to customers
Gross loans by industry sector as a % of total gross loans
US$m US$m US$m US$m US$m US$m % At 31 December 2008 Personal ........................................ 141,532 46,087 37,411 195,534 19,663 440,227 46.0
Residential mortgages1 ............ 87,267 33,014 20,185 98,383 4,488 243,337 25.4 Other personal ......................... 54,265 13,073 17,226 97,151 15,175 196,890 20.6
Corporate and commercial .......... 219,640 52,186 66,126 47,291 22,231 407,474 42.5 Commercial, industrial and
international trade ............... 121,047 20,186 40,147 15,178 13,282 209,840 21.9 Commercial real estate ............ 32,704 14,233 8,144 13,504 2,384 70,969 7.4 Other property-related ............. 7,666 10,296 5,128 7,234 415 30,739 3.2 Government ............................. 1,864 951 1,760 352 1,617 6,544 0.7 Other commercial2 ................... 56,359 6,520 10,947 11,023 4,533 89,382 9.3
Financial ...................................... 62,620 2,680 5,646 27,746 2,393 101,085 10.6 Non-bank financial institutions 61,823 2,402 5,387 27,560 2,364 99,536 10.4 Settlement accounts ................. 797 278 259 186 29 1,549 0.2
Asset-backed securities reclassified 6,258 – – 1,733 – 7,991 0.9
Total gross loans and advances to customers3 ............................ 430,050 100,953 109,183 272,304 44,287 956,777 100.0
Percentage of loans and advances by geographical region ............ 44.9% 10.6% 11.4% 28.5% 4.6% 100.0%
Impaired loans ............................. 6,774 852 1,114 14,285 2,327 25,352 – as a percentage of gross loans
and advances to customers .. 1.6% 0.8% 1.0% 5.2% 5.3% 2.6%
Total impairment allowances ...... 3,859 733 1,227 16,090 2,000 23,909 – as a percentage of total gross
loans and advances .............. 0.9% 0.7% 1.1% 5.9% 4.5% 2.5%
At 31 December 2007 Personal ........................................ 168,549 43,033 36,910 230,562 21,780 500,834 50.1
Residential mortgages1 ............ 95,665 29,689 20,397 118,993 4,324 269,068 26.9 Other personal ......................... 72,884 13,344 16,513 111,569 17,456 231,766 23.2
Corporate and commercial .......... 225,282 43,716 60,442 48,898 22,433 400,771 40.0 Commercial, industrial and
international trade ............... 120,359 17,740 36,461 13,937 13,541 202,038 20.1 Commercial real estate ............ 36,672 12,301 7,592 14,561 1,219 72,345 7.2 Other property-related ............. 11,275 8,168 4,664 8,000 1,800 33,907 3.4 Government ............................. 2,299 332 1,667 248 1,162 5,708 0.6 Other commercial2 ................... 54,677 5,175 10,058 12,152 4,711 86,773 8.7
Financial ...................................... 62,375 3,265 5,426 22,380 5,702 99,148 9.9 Non-bank financial institutions 61,216 2,483 5,191 22,252 5,639 96,781 9.7 Settlement accounts ................. 1,159 782 235 128 63 2,367 0.2
Total gross loans and advances to customers3 ............................ 456,206 90,014 102,778 301,840 49,915 1,000,753 100 .0
Percentage of loans and advances by geographical region ............ 45.6% 9.0% 10.2% 30.2% 5.0% 100.0%
Impaired loans4 ............................ 6,254 433 1,088 9,662 2,145 19,582 – as a percentage of gross loans
and advances to customers .. 1.4% 0.5% 1.1% 3.2% 4.3% 2.0%
Total impairment allowances ...... 3,931 376 926 11,980 1,992 19,205 – as a percentage of total gross
loans and advances .............. 0.9% 0.4% 0.9% 4.0% 4.0% 1.9%
1 Residential mortgages in Hong Kong include Hong Kong Government Home Ownership Scheme loans of US$3,882 million (2007: US$3,942 million).

H S B C H O L D I N G S P L C
Report of the Directors: Risk (continued) Credit risk > Credit exposure > Concentration / Cross border
206
2 Other commercial loans and advances include advances in respect of agriculture, transport, energy and utilities. 3 Included within this total is credit card lending of US$75,266 million (2007: US$82,854 million). 4 The 2007 impaired loans for North America have been restated as a result of the reclassification of an element of a credit card portfolio
as impaired. There has been no effect on impairment allowances.
Additional disclosure on gross loans and advances to customers by principal country within Rest of Asia-Pacific and Latin America (Audited)
Residential mortgages US$m
Other personal US$m
Property- related US$m
Commercial, international trade and other US$m
Total US$m
At 31 December 2008 Rest of Asia-Pacific Australia ................................................. 3,598 783 1,621 3,350 9,352 India ....................................................... 1,112 1,482 493 3,332 6,419 Indonesia ................................................ 27 527 26 1,410 1,990 Japan ...................................................... 57 160 808 4,818 5,843 Mainland China ..................................... 1,303 12 2,784 7,423 11,522 Malaysia ................................................. 2,699 1,624 941 4,263 9,527 Middle East (excluding Saudi Arabia) ... 1,941 5,583 3,018 17,167 27,709
Egypt ................................................. – 275 125 2,106 2,506 United Arab Emirates ........................ 1,693 3,748 2,118 10,214 17,773 Other Middle East ............................. 248 1,560 775 4,847 7,430
Singapore ............................................... 4,209 3,301 2,448 3,521 13,479 South Korea ........................................... 2,153 682 34 2,497 5,366 Taiwan ................................................... 2,217 705 14 1,497 4,433 Other ...................................................... 869 2,367 1,085 9,222 13,543
20,185 17,226 13,272 58,500 109,183
Latin America Argentina ............................................... 41 707 60 1,648 2,456 Brazil ...................................................... 376 8,585 694 9,578 19,233 Mexico ................................................... 2,150 3,665 1,024 6,094 12,933 Panama ................................................... 1,105 1,076 569 1,877 4,627 Other ...................................................... 816 1,142 452 2,628 5,038
4,488 15,175 2,799 21,825 44,287 At 31 December 2007 Rest of Asia-Pacific Australia ................................................. 4,376 922 2,065 3,998 11,361 India ....................................................... 1,545 1,721 339 3,723 7,328 Indonesia ................................................ 24 497 12 1,171 1,704 Japan ...................................................... 29 126 566 3,541 4,262 Mainland China ..................................... 500 6 1,746 9,443 11,695 Malaysia ................................................. 2,632 1,508 787 4,024 8,951 Middle East (excluding Saudi Arabia) ... 1,036 4,441 2,870 13,536 21,883
Egypt ................................................. – 196 126 1,575 1,897 United Arab Emirates ........................ 895 2,936 2,159 8,222 14,212 Other Middle East ............................. 141 1,309 585 3,739 5,774
Singapore ............................................... 3,946 3,403 1,712 2,471 11,532 South Korea ........................................... 2,596 880 61 3,608 7,145 Taiwan ................................................... 2,061 648 – 1,072 3,781 Other ...................................................... 1,652 2,361 2,098 7,025 13,136 20,397 16,513 12,256 53,612 102,778
Latin America Argentina ............................................... 47 611 75 1,841 2,574 Brazil ...................................................... 329 10,110 426 8,601 19,466 Mexico ................................................... 2,208 4,696 1,434 10,476 18,814 Panama ................................................... 1,098 963 593 1,585 4,239 Other ...................................................... 642 1,076 491 2,613 4,822
4,324 17,456 3,019 25,116 49,915
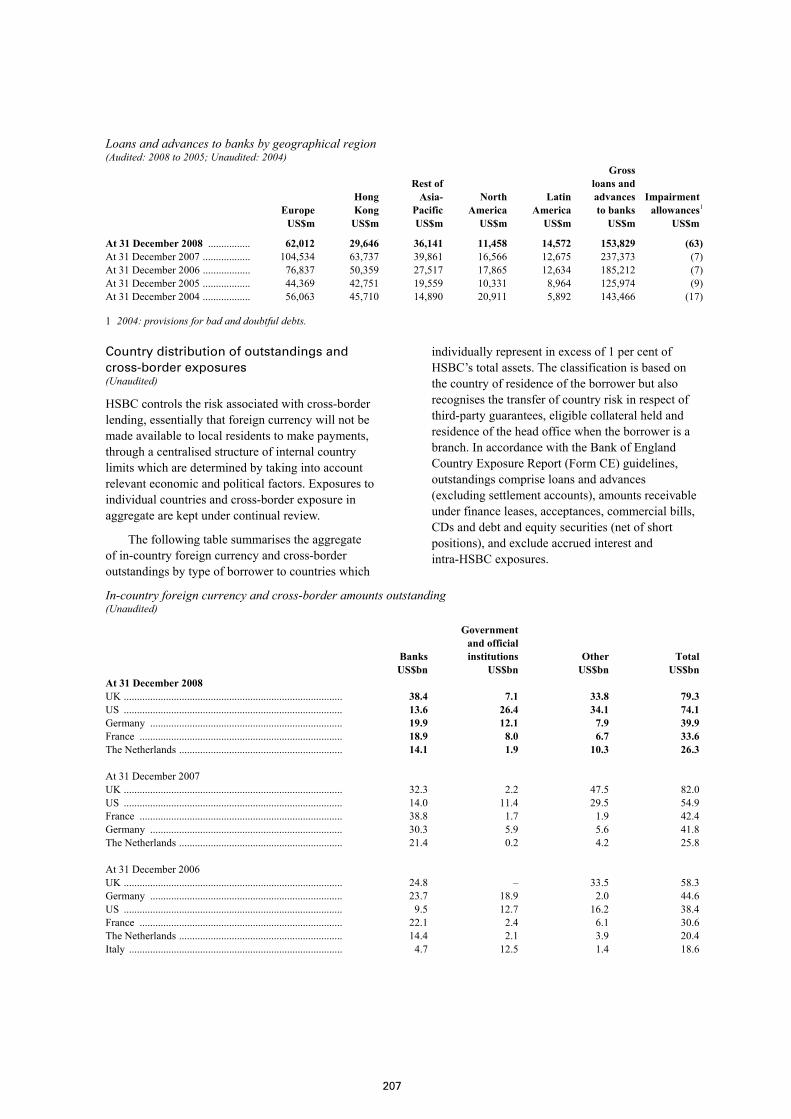
207
Loans and advances to banks by geographical region (Audited: 2008 to 2005; Unaudited: 2004)
Europe Hong Kong
Rest of Asia- Pacific
North America
Latin America
Gross loans and advances to banks
Impairment allowances1
US$m US$m US$m US$m US$m US$m US$m
At 31 December 2008 ................ 62,012 29,646 36,141 11,458 14,572 153,829 (63)At 31 December 2007 .................. 104,534 63,737 39,861 16,566 12,675 237,373 (7)At 31 December 2006 .................. 76,837 50,359 27,517 17,865 12,634 185,212 (7)At 31 December 2005 .................. 44,369 42,751 19,559 10,331 8,964 125,974 (9)At 31 December 2004 .................. 56,063 45,710 14,890 20,911 5,892 143,466 (17)
1 2004: provisions for bad and doubtful debts.
Country distribution of outstandings and cross-border exposures (Unaudited)
HSBC controls the risk associated with cross-border lending, essentially that foreign currency will not be made available to local residents to make payments, through a centralised structure of internal country limits which are determined by taking into account relevant economic and political factors. Exposures to individual countries and cross-border exposure in aggregate are kept under continual review.
The following table summarises the aggregate of in-country foreign currency and cross-border outstandings by type of borrower to countries which
individually represent in excess of 1 per cent of HSBC’s total assets. The classification is based on the country of residence of the borrower but also recognises the transfer of country risk in respect of third-party guarantees, eligible collateral held and residence of the head office when the borrower is a branch. In accordance with the Bank of England Country Exposure Report (Form CE) guidelines, outstandings comprise loans and advances (excluding settlement accounts), amounts receivable under finance leases, acceptances, commercial bills, CDs and debt and equity securities (net of short positions), and exclude accrued interest and intra-HSBC exposures.
In-country foreign currency and cross-border amounts outstanding (Unaudited)
Banks
Government and official institutions Other Total
US$bn US$bn US$bn US$bn At 31 December 2008 UK ................................................................................... 38.4 7.1 33.8 79.3 US ................................................................................... 13.6 26.4 34.1 74.1 Germany ......................................................................... 19.9 12.1 7.9 39.9 France ............................................................................. 18.9 8.0 6.7 33.6 The Netherlands .............................................................. 14.1 1.9 10.3 26.3 At 31 December 2007 UK ................................................................................... 32.3 2.2 47.5 82.0 US ................................................................................... 14.0 11.4 29.5 54.9 France ............................................................................. 38.8 1.7 1.9 42.4 Germany ......................................................................... 30.3 5.9 5.6 41.8 The Netherlands .............................................................. 21.4 0.2 4.2 25.8 At 31 December 2006 UK ................................................................................... 24.8 – 33.5 58.3 Germany ......................................................................... 23.7 18.9 2.0 44.6 US ................................................................................... 9.5 12.7 16.2 38.4 France ............................................................................. 22.1 2.4 6.1 30.6 The Netherlands .............................................................. 14.4 2.1 3.9 20.4 Italy ................................................................................. 4.7 12.5 1.4 18.6
H S B C H O L D I N G S P L C
Report of the Directors: The Management of Risk (continued) Credit risk > Areas of special interest > Personal lending
208
At 31 December 2008, HSBC had in-country foreign currency and cross-border amounts outstanding to counterparties in Japan of between 0.75 per cent and 1.0 per cent of total assets; in aggregate, US$24.4 billion.
At 31 December 2007, HSBC had in-country foreign currency and cross-border amounts outstanding to counterparties in Hong Kong, Belgium and Ireland of between 0.75 per cent and 1.0 per cent of total assets. The aggregate in-country foreign currency and cross-border amounts outstanding were Hong Kong, US$19.7 billion, Belgium, US$19.3 billion and Ireland, US$19.3 billion.
At 31 December 2006, HSBC had in-country foreign currency and cross-border amounts outstanding to counterparties in Australia and Hong Kong of between 0.75 per cent and 1 per cent of total assets. The aggregate in-country foreign currency and cross-border amounts outstanding were Australia, US$17.1 billion, Hong Kong, US$13.9 billion.
Areas of special interest
Personal lending (Unaudited)
HSBC provides a broad range of secured and unsecured personal lending products to meet customer needs. Given the diverse nature of the markets in which HSBC operates, the range is not standardised across all countries but is tailored to meet the demands of individual markets while using appropriate distribution channels and, wherever possible, common global IT platforms.
Personal lending includes advances to customers for asset purchase, such as residential property and motor vehicles, where the loans are typically secured on the assets being acquired. HSBC also offers loans secured on existing assets, such as first and second liens on residential property; unsecured lending products such as overdrafts, credit cards and payroll loans; and debt consolidation loans which may be secured or unsecured. At the end of February 2009, HSBC authorised the discontinuation as soon as
practicable of all new receivable originations of all products by the branch-based consumer lending business of HSBC Finance in North America (see page 70).
Various underwriting controls are applied before a loan is issued, and delinquency is managed through collection and customer management procedures. The expected occurrence and degree of delinquency varies according to the type of loan and the customer segment. Delinquency levels tend to increase in the normal course of portfolio ageing. As a result, loan impairment charges usually relate to lending originated in earlier accounting periods.
As discussed in Challenges and Uncertainties on page 12, rising unemployment has been the major factor in the deterioration in credit quality of personal lending portfolios in 2008. Further weakening in consumers’ confidence and capacity to service financial commitments may result in deteriorating payment patterns and increased delinquencies and default rates and, as a consequence, higher loan impairment allowances and write-offs. HSBC monitors the effect of these factors on its personal lending portfolios and keeps under review a range of measures designed to limit the Group’s exposure and mitigate the effect on customers.
Loan impairment allowances are sensitive to changes in the level of unemployment, particularly at the current time in North America, which affects customers’ future ability to repay their loans. For example, had there been an additional 1 per cent increase in unemployment in North America, loan impairment allowances could have been higher by between US$0.7 billion and US$1.5 billion as at 31 December 2008. The relationship between changes in unemployment and loan impairment charges cannot be predicted with any degree of certainty. For example, sharp increases in unemployment may not have a linear impact on the level of increase in loan impairment charges.
Please refer to page 205 for further analysis of gross loans and advances by region and pages 34 and 229 for discussion of loan impairment charges and other credit risk provisions.

209
Total personal lending (Unaudited)
UK Rest of Europe US1
Rest of North America
Hong Kong, Rest of Asia-Pacific and Latin America Total
US$m US$m US$m US$m US$m US$m At 31 December 2008 Total personal lending ........................................ 107,620 33,912 170,508 25,026 103,161 440,227
Residential mortgages ........................................ 78,346 8,921 80,946 17,437 57,687 243,337
Other personal lending ....................................... 29,274 24,991 89,562 7,589 45,474 196,890 – motor vehicle finance .................................. – 99 10,864 137 6,201 17,301– credit cards .................................................. 11,215 1,695 46,972 1,469 13,426 74,777– second lien mortgages ................................. 1,160 2 14,614 803 503 17,082– other ............................................................. 16,899 23,195 17,112 5,180 25,344 87,730
At 31 December 2007 Total personal lending ........................................ 128,400 40,149 199,336 31,226 101,723 500,834
Residential mortgages ........................................ 85,356 10,309 98,928 20,065 54,410 269,068
Other personal lending ....................................... 43,044 29,840 100,408 11,161 47,313 231,766 – motor vehicle finance .................................. 71 156 13,266 1,865 7,563 22,921– credit cards .................................................. 15,018 2,009 49,634 1,728 13,574 81,963– second lien mortgages ................................. 1,930 – 17,590 1,256 748 21,524– other ............................................................. 26,025 27,675 19,918 6,312 25,428 105,358
1 Includes residential mortgages of HSBC Bank USA and HSBC Finance.
The commentary that follows is on a constant currency basis.
At 31 December 2008, total personal lending was US$440 billion, a decline of 3 per cent from the balance at 31 December 2007. In 2008, personal lending accounted for 85 per cent of the Group’s loan impairment charges and other credit risk provisions. Within personal lending, total loan impairment charges and other credit risk provisions of US$21.2 billion were concentrated in North America (US$16.1 billion) and, to a lesser extent, in Latin America (US$2.1 billion) and Europe (US$2.0 billion). These loan impairment charges represented, respectively, 39 per cent, 5 per cent and 5 per cent of each region’s total Personal Financial Services’ net operating income before loan impairment charges and other credit risk provisions.
Total US personal lending at 31 December 2008 was 15 per cent less than at the end of 2007, at US$171 billion, as HSBC’s strategy to run off its existing portfolio and improve credit quality on new originations took effect. Residential mortgage balances fell by 18 per cent to US$81 billion, driven by decisions taken in 2007 to end new correspondent channel originations in Mortgage Services and limit new originations in the consumer lending business through tighter underwriting standards. Portfolio run-off, charge-off of impaired loans and the sale of US$8.2 billion of loans during 2008 from the US
real estate secured portfolios contributed to these lower balances.
Other personal lending in the US fell by 11 per cent to US$90 billion as a result of actions taken by HSBC since 2007 to reduce risk in the portfolio, including the elimination of guaranteed direct mail loans to new customers, the discontinuance of personal homeowner loans and a general tightening of underwriting criteria. Card balances declined by 5 per cent to US$47 billion as HSBC reduced credit lines, closed dormant accounts and curtailed marketing expenditure, which together lowered originations in line with HSBC’s reduced appetite for risk in this segment at this time.
Motor vehicle finance loans in the US fell by 18 per cent to US$11 billion, again reflecting reduced risk appetite and lower origination. In July, the decision was taken to discontinue all new motor vehicle loan originations from the dealer and direct-to-consumer channels within the North America vehicle finance business of HSBC Finance as management determined that the business was sub-scale and did not have sufficient market strength to provide an acceptable level of risk-adjusted returns.
In the UK, gross loans and advances to personal customers rose by 14 per cent to US$108 billion, due to strong growth in residential mortgage lending following successful campaigns during 2008 at HSBC Bank and First Direct. Other personal lending

H S B C H O L D I N G S P L C
Report of the Directors: Risk (continued) Credit risk > Areas of special interest > Mortgage lending
210
declined by 11 per cent to US$29 billion, driven by lower originations, reduced marketing activities and lower customer appetite for unsecured borrowing. Credit quality in the unsecured portfolios of M&S Money, HSBC Bank and Partnership Cards in the UK showed a slight deterioration in 2008, particularly in the second half of the year, due to the weakening UK economy.
In Latin America, in response to rising impairment charges and the weaker economic conditions, HSBC moderated loan growth from that achieved in the previous year, with gross loans and advances to personal customers rising by 11 per cent to US$20 billion compared with 31 per cent in 2007. Loan impairment charges were 20 per cent higher in Brazil but 57 per cent higher in Mexico following strong growth in recent years in lending portfolio seasoning and credit deterioration. As a consequence of this experience, in Mexico, HSBC’s other personal lending balances at 31 December 2008 were US$3.7 billion, 1 per cent lower than at 31 December 2007 as management realigned the business towards customers of higher credit quality.
Mortgage lending products (Unaudited)
The Group offers a wide range of mortgage products designed to meet customer needs, including capital repayment mortgages subject to fixed or variable interest rates and products designed to meet demand for housing loans with more flexible payment structures. HSBC underwrites both first lien residential mortgages and loans secured by second lien mortgages.
Interest-only mortgages are those for which customers make regular payments of interest during the life of the loan and repay the principal from the sale of their home or alternative sources of funds. Introductory interest-only mortgages are typically where the interest-only element is for a fixed term at the start of the loan, after which principal repayments commence.
Affordability mortgages include all products where the customer’s monthly payments are set at a low initial rate, either variable or fixed, before resetting to a higher rate once the introductory period is over. These include adjustable-rate mortgages (‘ARM’s), loans on which the interest rate is periodically changed based on a reference price. HSBC Finance no longer originates or acquires interest-only loans or ARMs.
Affordability mortgages are primarily offered in the US and the UK. Under the HFC and Beneficial brands, HSBC Finance and HFC Bank Ltd (‘HFC
UK’) offer a range of products predominantly designed for the needs of customers with non-standard or less favourable credit profiles. Offset mortgages are products linked to a current or savings account, where the interest earned is used to repay mortgage debt.
US mortgage lending
US mortgage lending, comprising residential mortgage and second lien lending, made up 22 per cent of the Group’s gross loans and advances to personal customers at 31 December 2008.
Balances declined by 18 per cent from 31 December 2007, as the Mortgage Services portfolio continued to run-off and tighter underwriting standards were applied to originations for the consumer lending portfolio. As the bulk of the mortgage lending products sold in the US consumer lending branch network are for refinancing and debt consolidation, rather than for house purchase, the limited availability of home equity severely restricts the number of eligible customers. As a consequence, HSBC began the process of repositioning its consumer lending business in 2008, reducing exposure to lower tiers of sub-prime credit and expanding its range of lending for real estate loans to include both government-sponsored entity and conforming loan products. At the end of February 2009, HSBC authorised the discontinuation as soon as practicable of all new receivable originations of all products by the branch-based consumer lending business of HSBC Finance in North America (see page 70).
Mortgage lending in HSBC USA also declined, following a series of management actions to reduce risk in the portfolio. These included closing the prime wholesale and third-party correspondent mortgage business in November 2008, selling US$7.0 billion in loans during 2008, and continuing to sell newly originated residential mortgages to the US government-sponsored mortgage agencies.
Affordability mortgage balances in HSBC Finance declined from US$19 billion at 31 December 2007 to US$14 billion at 31 December 2008. These mortgages continued to experience the heightened levels of delinquency that began to emerge in late 2006. They are no longer originated through the consumer lending branch network. In aggregate, HSBC Finance’s mortgage balances declined to US$74 billion at 31 December 2008 (31 December 2007: US$87 billion) as set out in the table on page 211. Within this, the portfolio of real estate secured business originated through the branch network was US$46 billion at 31 December

211
2008, of which approximately 95 per cent were fixed rate loans and 87 per cent were first lien. At 31 December 2008, the mortgage services business had approximately 250,000 accounts and US$28 billion in balances outstanding. Approximately 59 per cent were fixed rate loans and 84 per cent were first lien.
Further discussion of credit trends in the US mortgage lending portfolio and management actions taken to mitigate risk is provided in ‘US personal lending – credit quality’ on page 212.
HSBC Finance US mortgage lending1 (Unaudited) At 31 December 2008 At 31 December 2007
Mortgage services
Consumer lending
Other mortgage lending Total
Mortgage services
Consumer lending
Other mortgage lending2
Total US$m US$m US$m US$m US$m US$m US$m US$m
Fixed-rate ......................... 16,288 43,873 91 60,252 20,146 47,254 106 67,506 Other ................................ 11,339 2,324 35 13,698 16,070 2,970 39 19,079
Adjustable-rate ............ 9,530 2,324 33 11,887 12,361 2,970 37 15,368Interest-only ................ 1,809 – 2 1,811 3,709 – 2 3,711
27,627 46,197 126 73,950 36,216 50,224 145 86,585
First lien ........................... 23,188 40,334 93 63,615 29,475 43,366 108 72,949 Second lien ...................... 4,439 5,863 33 10,335 6,741 6,858 37 13,636
27,627 46,197 126 73,950 36,216 50,224 145 86,585
Stated income3 ................. 5,667 – – 5,667 8,292 – – 8,292
1 HSBC Finance mortgage lending is shown on a management basis and includes loans transferred to HSBC USA Inc. which are managed by HSBC Finance.
2 Restated to show HSBC Finance management basis, consistent with the current year, and US balances only. 3 Stated income lending forms a subset of total mortgage services lending across all categories.
UK mortgage lending
Mortgage lending in the UK rose significantly in 2008 and overall credit quality was maintained despite a significant deterioration in the housing market. The withdrawal of many competitors from the market and the consequent repricing of mortgage products allowed HSBC Bank to expand its share of the new lending market while staying within its targeted customer segments. In December 2008, HSBC announced that it will make available up to US$22 billion of new UK residential mortgages in 2009.
Total mortgage lending in the UK rose from US$64 billion at 31 December 2007 to US$80 billion at 31 December 2008. This was driven by the success of the RateMatcher mortgage campaign in the first half of 2008 in generating new business, and an increase at First Direct due to growth in offset mortgage lending following a similarly successful campaign.
The maintenance of good credit quality in difficult market conditions is attributable to the business model pursued by HSBC in the UK. HSBC Bank originates virtually all new business through its own salesforce and does not rely on business introduced through third parties. Also, HSBC does not allow customer self-certification of income. The
majority of lending is to existing customers holding a current or savings account relationship with the bank. At 31 December 2008, less than 2 per cent of the bank’s book consisted of lending to purchase property for rent to third parties, for which the bank applies higher collateral requirements.
In the UK, affordability mortgages have experienced relatively low levels of delinquency, reflecting the different credit profiles of the customers, compared with those in the US, and the tighter underwriting criteria.
Interest-only mortgage balances rose from US$22 billion at 31 December 2007 to US$32 billion at 31 December 2008, driven by an increase in balances at First Direct. The majority of these mortgages were offset mortgages linked to a current account and are classified as interest-only.
Second lien balances, which were all held by HFC UK, declined by US$770 million to US$1.2 billion at 31 December 2008 due to run-off and severely tighter underwriting criteria. In the first half of 2008, HFC UK ceased originating loans through brokers.
The credit quality of the UK mortgage portfolio remained broadly stable as a consequence of the business model and underwriting criteria described

H S B C H O L D I N G S P L C
Report of the Directors: Risk (continued) Credit risk > Areas of special interest > Mortgage lending / US personal lending
212
above. Additionally, HSBC Bank is now benefiting from having intentionally reduced its market share in 2006 and 2007 as property prices continued to rise. The portion of mortgages with a loan to value ratio greater than 90 per cent declined as virtually no new loans were originated at this level. The average loan to value ratio for new business in 2008 was 58.7 per cent, the lowest for 5 years.
At HSBC Bank, 30 days or more delinquency rates were unchanged from 31 December 2007 to 31 December 2008 at 1.8 per cent.
The following table shows the levels of mortgage lending products in the various portfolios in the US and the UK, together with the rest of the HSBC Group.
Mortgage lending products (Unaudited)
UK Rest of Europe US
Rest of North America
Hong Kong, Rest of Asia-Pacific and Latin America Total
US$m US$m US$m US$m US$m US$m At 31 December 2008 Residential mortgages ................................................. 78,346 8,921 80,946 17,437 57,687 243,337 Second lien mortgages ................................................. 1,160 2 14,614 803 503 17,082
Total mortgage lending ................................................ 79,506 8,923 95,560 18,240 58,190 260,419
Second lien as a percentage of total mortgage lending 1.5% 0.0% 15.3% 4.4% 0.9% 6.6%
Interest-only (including endowment) mortgages ........ 33,782 553 – 1,427 993 36,755 Affordability mortgages, including ARMs ................. 4,740 824 28,571 311 4,166 38,612 Other ............................................................................ 153 – – – 82 235
Total interest-only and affordability mortgages .......... 38,675 1,377 28,571 1,738 5,241 75,602
– as a percentage of total mortgage lending ........... 48.6% 15.4% 29.9% 9.5% 9.0% 29.0%
Negative equity mortgages1 ......................................... 367 – 7,655 86 1,635 9,743 Other loan to value ratios greater than 90 per cent2 .... 6,178 107 35,296 1,737 2,122 45,440
6,545 107 42,951 1,823 3,757 55,183
– as a percentage of total mortgage lending ........... 8.2% 1.2% 44.9% 10.0% 6.5% 21.2% At 31 December 2007 Residential mortgages ................................................. 85,356 10,309 98,928 20,065 54,410 269,068 Second lien mortgages ................................................. 1,930 – 17,590 1,256 748 21,524
Total mortgage lending ................................................ 87,286 10,309 116,518 21,321 55,158 290,592
Second lien as a percentage of total mortgage lending 2.2% – 15.1% 5.9% 1.4% 7.4%
Interest-only (including endowment) mortgages ........ 32,314 602 – 174 1,335 34,425 Affordability mortgages, including ARMs ................. 8,695 685 40,201 219 4,993 54,793 Other3 ........................................................................... 241 27 – 274 621 1,163
Total interest-only and affordability mortgages .......... 41,250 1,314 40,201 667 6,949 90,381
– as a percentage of total mortgage lending ........... 47.3% 12.7% 34.5% 3.1% 12.6% 31.1%
Negative equity mortgages1 ......................................... 646 – 11,079 107 525 12,357 Other loan to value ratios greater than 90 per cent2 .... 10,969 211 42,246 679 1,333 55,438
11,615 211 53,325 786 1,858 67,795
– as a percentage of total mortgage lending ........... 13.3% 2.0% 45.8% 3.7% 3.4% 23.3%
1 Negative equity arises when the value of the loan exceeds the value of available equity, generally based on values at origination date. 2 Loan to value ratios are generally based on values at origination date. 3 Balances at 31 December 2007 have been restated to exclude mortgages in the UK that are fixed for a period of time before reverting to
a standard variable rate.
US personal lending – credit quality (Unaudited)
The deterioration in credit quality which began in the sub-prime mortgage portfolio in 2006 accelerated in 2008 and spread across the remainder of the US
personal lending portfolio as the economy weakened, levels of unemployment and personal bankruptcy filings rose, and house price depreciation became more pronounced (the S&P/Case-Shiller 10-City Composite Index of house prices showed a

213
decline of 19 per cent in 2008). These factors restricted the ability of many customers to refinance and access equity retained in their homes.
Two months or more delinquencies in mortgages originated through the HSBC Finance
branch network rose most rapidly in those states most severely affected by continued house price depreciation and rising unemployment, particularly in California, Florida, New York, Virginia, Maryland, New Jersey, Illinois, Pennsylvania, Massachusetts and Ohio.
HSBC Finance: geographical concentration of US lending1,2 (Unaudited) Mortgage lending as a
percentage of: Other personal lending as a
percentage of:
total lending
total mortgage lending
total lending
total other personal lending
Percentage of total lending
% % % % %
California ............................................................................... 6 11 6 12 12 Florida .................................................................................... 4 7 3 7 7 New York ............................................................................... 3 6 3 6 6 Texas ...................................................................................... 2 3 4 8 6 Ohio ....................................................................................... 3 5 2 5 5 Pennsylvania .......................................................................... 3 5 2 5 5
1 By states which individually account for 5 per cent or more of HSBC Finance’s US customer loan portfolio. 2 HSBC Finance lending is shown on a management basis and includes loans transferred to HSBC USA Inc, which are managed by
HSBC Finance.
In the US real estate secured portfolios, two months and over contractual delinquency ratios at the end of 2008 were higher across the portfolio than during 2007 and the first half of 2008, for the reasons described above. There was also a significant effect on delinquency ratios from declining balances. As the portfolios aged, outstanding balances fell as new lending in certain portfolios ceased, risk mitigation efforts and changes to product offerings which began in 2007 and continued in 2008 resulted in lower originations and US$8.2 billion in mortgage portfolios were sold during the year.
Both dollar and percentage two months and over contractual delinquency in the real estate secured portfolios of HSBC Finance and HSBC USA increased following a voluntary one month suspension of final court proceedings in foreclosure cases relating to owner-occupied properties, implemented in December 2008, which was in addition to actions taken by a number of states to slow foreclosure proceedings. Within these portfolios, dollar delinquencies rose sharply in 2008 as credit quality in the consumer lending portfolio, most notably for first lien products, and in mortgage services, continued to deteriorate, particularly in the second half of the year. In mortgage services, the rise in the fourth quarter of 2008 was despite lower balances following portfolio run-off and the sale of portfolios during the year, and was partly caused by the above-mentioned action on foreclosure.
Residential mortgages
The unprecedented turmoil in the mortgage lending market continued in 2008. Investors remained unwilling to purchase securitised credit, and this resulted in a sharp contraction in the supply of liquidity to the mortgage market. Progressively fewer refinancing options were available for customers as house prices fell and housing equity declined, a number of market participants exited the sub-prime mortgage industry, and the remaining providers tightened their underwriting criteria.
Equity withdrawal had been the principal source of credit available to sub-prime borrowers dealing with unforeseen financial needs. With this source of funds heavily restricted, consumers faced increasing difficulty in maintaining their contractual payment schedules as they confronted the challenges of rising unemployment and increases in the costs of living, particularly in the first half of the year. Compounding the situation, mortgage interest rates remained high for much of 2008 as credit spreads on interbank lending widened due to the turmoil in the global financial system.
The increase in delinquency rates was accompanied by a rise in loss severities as falling house prices led to a reduction in the amounts recoverable from foreclosure and repossession. These factors were partly offset by a decline in lending balances as HSBC continued to manage down exposure in the US.

H S B C H O L D I N G S P L C
Report of the Directors: Risk (continued) Credit risk > Areas of special interest > US personal lending / Loan delinquency in US
214
Second lien loans have a risk profile characterised by higher loan-to-value ratios because, in many cases, the second lien loan was taken out to complete the refinancing or purchase of the property. For HSBC Finance second lien mortgages, the proportion of customers two months or more behind on contractual payments rose from 11.2 per cent at 31 December 2007 to 15.9 per cent at 31 December 2008. Loss on default of second lien loans typically approaches 100 per cent of the amount owed as any equity in the property is applied initially to the first lien loan, particularly during periods of house price depreciation when its value is eroded to the point where there is no surplus available to support the repayment of second liens.
Stated-income mortgages, which represented a small part of the HSBC Finance loan book, also continued to decline. These mortgages are of higher than average risk as they are underwritten on the basis of borrowers’ representations of annual income and are not verified by receipt of supporting documentation. These loan balances declined from US$8.3 billion at 31 December 2007 to US$5.7 billion at 31 December 2008. Two months or more delinquency rates on stated-income loans rose from 19.0 per cent at 31 December 2007 to 27.7 per cent at 31 December 2008. The percentage rise was primarily attributable to lower balances and portfolio ageing as the portfolio continued to run off.
In the mortgage services business, credit quality continued to deteriorate as 2005 and 2006 vintages continued to season and move into later stages of delinquency as economic conditions worsened. Amounts of two months or more delinquency in mortgage services rose by 9 per cent during the year to US$4.7 billion at 31 December 2008. These represented an increased proportion of a reducing portfolio, rising from 11.9 per cent to 17.0 per cent. An increase in foreclosures in process during the fourth quarter, arising from a voluntary one month suspension of final court proceedings in foreclosure cases relating to owner occupied properties, implemented in December 2008 and the actions taken by a number of states to slow foreclosure proceedings, affected total lending in mortgage services at 31 December 2008.
HSBC undertook several actions during 2008 to reposition HSBC Finance, including closure of more than 200 consumer lending branches, reducing the network to approximately 800 branches, and tightening credit criteria for originations. These actions followed the decisions taken in 2007 to cease purchasing mortgages from third-party correspondents and to close the wholesale business, Decision One, in September 2007, thereby ending new originations for the mortgage services business.
The branch-based consumer lending business continued to experience rising delinquency levels, particularly on first lien loans in the states most exposed to falling house prices and rising unemployment; 63 per cent of the increase in amounts of two months or more contractual delinquency was concentrated in the ten states noted above. Delinquencies rose across all vintages, with the most pronounced increase for first lien loans extended in 2006 and 2007. This trend was experienced across the rest of the industry in the US. Two months or more delinquencies rose from 4.2 per cent of loans and advances at 31 December 2007 to 12.1 per cent at 31 December 2008 and delinquent balances increased to US$5.6 billion. In this environment, HSBC took additional measures to tighten underwriting standards, including reducing the loan to value ratio for residential mortgages, ceasing to underwrite certain products and raising the credit requirements for certain risk factors. As a result, originations declined to 38 per cent of the levels recorded in 2007.
At HSBC USA, delinquencies rose as credit quality deterioration was experienced across the real estate secured portfolio, driven by house price depreciation and the US economic weakness. Delinquency rates of prime first lien mortgages were also affected by the sale of US$7.0 billion of mortgage portfolios during the year. Originations declined as HSBC’s risk appetite in the US reduced. Two months or more delinquencies in prime first lien mortgages rose from 1.1 per cent at 31 December 2007 to 3.4 per cent at 31 December 2008, and in second lien mortgages from 1.8 per cent to 3.5 per cent over the same period, on a management basis. The rise in delinquency was appreciably worse in third-party originations and, in response, HSBC USA closed its wholesale and third-party correspondent mortgage business in November 2008, curtailed certain stated-income mortgage products, tightened underwriting criteria and sold US$7.0 billion of mortgage portfolios during 2008. As a result, stated-income mortgage balances declined from US$2.4 billion at 31 December 2007 to US$2.2 billion at 31 December 2008.
HSBC has been proactive in approaching customers to provide financial assistance in restructuring their debts to avoid foreclosure and, as a result, HSBC has restructured and modified loans that it believes could be serviced on revised terms. For further details, see ‘US loan modifications’ on page 216.
The aggregate balances of loans which reached their first interest rate reset continued to decline in 2008. As interest rates fall, the effect of the reset on affordability becomes less pronounced.

215
Credit cards
US credit card portfolio two or more months delinquencies rose from 5.7 per cent at 31 December 2007 to 6.6 per cent at 31 December 2008. In the private label cards portfolio, two or more months delinquencies rose from 3.4 per cent at 31 December 2007 to 4.3 per cent at 31 December 2008. Higher delinquency rates in both portfolios were driven by continued deterioration in the US economy, significantly higher unemployment rates, portfolio seasoning and higher levels of personal bankruptcy filings.
Motor vehicle finance
Two months or more delinquencies in vehicle finance rose from 3.7 per cent at 31 December 2007 to 5.0 per cent at 31 December 2008, in part due to portfolio ageing following the decision in July 2008 to cease new originations in HSBC Finance
from the dealer and direct-to-consumer channels, having earlier terminated a number of dealer relationships, particularly in the Northeast of the US.
Other personal lending
Higher delinquency rates were experienced in the HSBC Finance unsecured lending portfolio, excluding credit cards. The increase was driven by a deterioration in credit quality due to the weakness in the US economy, combined with portfolio seasoning as the lending book aged. Balances declined due to tightened credit criteria which resulted in lower originations. Management actions were taken in 2007 and continued in 2008 to reduce risk in the portfolio including the tightening of underwriting criteria.
The following tables provide a detailed analysis of loan delinquency in the US.
Two months and over contractual delinquency1 (Unaudited) Quarter ended 31
December 2008
30 September 2008
30 June 2008
31 March 2008
31 December 2007
30 September 2007
30 June 2007
31 March 2007
US$m US$m US$m US$m US$m US$m US$m US$m In Personal Financial
Services in the US Residential mortgages ... 9,236 7,061 5,9842 5,7572 5,1672 4,077 3,183 2,871 Second lien mortgage
lending ....................... 1,790 1,616 1,585 1,638 1,602 1,249 945 872 Vehicle finance .............. 541 512 445 370 488 451 384 302 Credit card ..................... 2,029 1,871 1,700 1,782 1,830 1,581 1,314 1,274 Private label ................... 701 624 590 591 598 536 434 429 Personal non-credit card 2,998 2,745 2,606 2,650 2,634 2,238 2,000 1,881
Total ............................... 17,295 14,429 12,910 12,788 12,319 10,132 8,260 7,629
%3 %3 %3 %3 %3 %3 %3 %3
Residential mortgages ... 11.42 8.23 6.652 5.962 5.232 4.04 3.10 2.70 Second lien mortgage
lending ....................... 12.26 10.59 9.83 9.76 9.10 6.86 5.07 4.44 Vehicle finance .............. 4.98 4.27 3.48 2.83 3.68 3.40 2.91 2.30 Credit card ..................... 6.64 6.07 5.57 5.81 5.68 5.09 4.32 4.43 Private label ................... 4.26 3.97 3.65 3.66 3.43 3.28 2.72 2.65 Personal non-credit card 17.70 15.31 14.00 13.71 13.16 10.88 9.69 9.33
Total ............................... 10.16 8.13 7.01 6.64 6.18 5.05 4.10 3.74

H S B C H O L D I N G S P L C
Report of the Directors: Risk (continued) Credit risk > Areas of special interest > Renegotiated loans // Credit quality
216
Quarter ended 31
December 2008
30 September 2008
30 June 2008
31 March 2008
31 December 2007
30 September 2007
30 June 2007
31 March 2007
US$m US$m US$m US$m US$m US$m US$m US$m In mortgage services and
consumer lending Mortgage services: – first lien .................... 3,912 3,420 3,363 3,456 3,248 2,554 2,099 1,863 – second lien ............... 787 807 897 1,028 1,050 841 663 613
Total mortgage services . 4,699 4,227 4,260 4,484 4,298 3,395 2,762 2,476
Consumer lending: – first lien .................... 4,724 3,176 2,194 1,954 1,622 1,259 907 832 – second lien ............... 853 690 583 530 478 346 236 220
Total consumer lending . 5,577 3,866 2,777 2,484 2,100 1,605 1,143 1,052
%3 %3 %3 %3 %3 %3 %3 %3
Mortgage services: – first lien .................... 16.87 14.16 12.91 12.41 11.02 8.13 6.33 4.98 – second lien ............... 17.72 16.62 16.63 16.99 15.57 11.28 7.91 6.59
Total mortgage services . 17.01 14.57 13.55 13.22 11.87 8.73 6.65 5.30
Consumer lending: – first lien .................... 11.71 7.72 5.15 4.52 3.74 2.92 2.15 2.03 – second lien ............... 14.54 11.27 9.04 7.96 6.97 5.03 3.60 3.34
Total consumer lending . 12.07 8.18 5.66 4.98 4.18 3.21 2.34 2.21
1 Delinquency data for the period from 31 March 2007 to 30 June 2008 has been restated to include certain delinquent mortgage loans that were previously excluded due to system coding within the mortgage services loan servicing platform which had the effect of excluding certain delinquent mortgage loans from the calculation of delinquency ratios. This change affected mortgage services’ first and second lien delinquency percentages above. The effect on previously reported amounts was not material.
2 Delinquency data for the periods ending 31 December 2007 to 30 June 2008 has been restated to exclude certain delinquency balances of HSBC USA which related to residential mortgages classified as held for sale.
3 Expressed as a percentage of the relevant balance.
Renegotiated loans (Audited)
Restructuring activity is designed to manage customer relationships, maximise collection opportunities and, if possible, avoid foreclosure or repossession. Such activities include extended payment arrangements, approved external debt management plans, deferring foreclosure, modification, loan rewrites and/or deferral of payments pending a change in circumstances. Following restructuring, an overdue consumer account is normally reset from delinquent to current status. Restructuring policies and practices are based on indicators or criteria which, in the judgement of local management, indicate that repayment will probably continue. These policies are required to be kept under continual review and their application varies according to the nature of the market, the product, and the availability of empirical data. Criteria vary between products, but typically include receipt of one or more or, in the case of HSBC Finance, two or more, qualifying payments within a certain period, a minimum lapse of time from origination before restructuring may occur, and restrictions on the number and/or frequency of successive restructurings. When empirical evidence indicates an increased propensity to default on
restructured accounts, the use of roll rate methodology ensures this factor is taken into account when calculating impairment allowances.
Renegotiated loans that would otherwise be past due or impaired totalled US$35 billion at 31 December 2008 (2007: US$28 billion). Restructuring is most commonly applied to consumer finance portfolios. The largest concentration was in the US and amounted to US$31 billion (2007: US$24 billion) or 89 per cent (2007: 86 per cent) of the Group’s total renegotiated loans. The increase was due to a significant deterioration in credit quality in the US, where most restructurings related to loans secured on real estate.
US loan modifications (Unaudited)
In 2008, HSBC Finance continued to refine and expand its customer account management policies and practices. Through its ARM Reset Modification Programme, established in October 2006, HSBC Finance proactively contacts customers who have ARM loans nearing their first reset that HSBC Finance expects will be the most affected by a rate adjustment. By a variety of means, HSBC Finance

217
assesses the customer’s ability to make the adjusted payment and, as appropriate and in accordance with defined policies, HSBC Finance modifies the loans, allowing time for the customer to seek alternative financing or improve their individual situation. These loan modifications primarily provide for temporary interest rate relief for up to 12 months by either maintaining the current interest rate for that period or resetting the interest rate to one lower than that originally required at the reset date. At the end of the relief period, the interest rate on the loan will reset in accordance with the original loan terms, unless the borrower qualifies for, and is granted, a further modification. These loans are not included in the renegotiated loans figures quoted above, because they were not contractually delinquent at the time of the modification.
HSBC Finance also significantly expanded its Foreclosure Avoidance and Account Modification Programmes designed to provide relief to qualifying home owners by either loan restructuring or modification. Following a strategic review, in the first quarter of 2008 these programmes were expanded in the consumer lending business, to help those customers who did not qualify for assistance under previous programmes, and to help customers who required greater assistance than that available under previous programmes. Innovations included lowering the interest rate for qualifying customers on
fixed rate loans as well as ARMs, and implementing longer term modifications, providing assistance generally for two to five years. Under these expanded programmes, HSBC Finance modified over 92,000 loans in 2008 with an aggregate balance of US$13.5 billion. The ARM Reset Modification Programme covered some 13,000 loans, with an aggregate value of US$2.1 billion.
HSBC Finance also supports a variety of national and local efforts in home ownership preservation and foreclosure avoidance.
Credit quality of financial instruments (Audited)
The four credit quality classifications set out and defined below describe the credit quality of HSBC’s lending, debt securities portfolios and derivatives. These classifications each encompass a range of more granular, internal credit rating grades assigned to wholesale and retail lending business, as well as the external ratings attributed by external agencies to debt securities.
There is no direct correlation between the internal and external ratings at granular level, except to the extent each falls within a single quality classification.
Credit quality of HSBC’s lending, debt securities and other bills
Wholesale lending and derivatives
Retail lending1
Debt securities /other
Quality classification Strong ............................................................................................................... CRR1 to CRR2 EL1 to EL2 A- and above Medium ............................................................................................................ CRR3 to CRR5 EL3 to EL5 B+ to BBB+,
and unrated Sub-standard ..................................................................................................... CRR6 to CRR8 EL6 to EL8 B and below Impaired ........................................................................................................... CRR9 to CRR10 EL9 to EL10 Impaired
1 HSBC observes the disclosure convention that, in addition to those classified as EL9 to EL10, retail accounts classified EL1 to EL8 that are delinquent by 90 days or more are considered impaired, unless individually they have been assessed as not impaired (see page 219, ‘Past due but not impaired financial instruments’.
Quality classification definitions
• ‘Strong’: exposures demonstrate a strong capacity to meet financial commitments, with negligible or low probability of default and/or low levels of expected loss. Retail accounts operate within product parameters and only exceptionally show any period of delinquency.
• ‘Medium’: exposures require closer monitoring, with low to moderate default risk. Retail accounts typically show only short periods of delinquency, with any losses expected to be
minimal following the adoption of recovery processes.
• ‘Sub-standard’: exposures require varying degrees of special attention and default risk is of greater concern. Retail portfolio segments show longer delinquency periods of generally up to 90 days past due and/or expected losses are higher due to a reduced ability to mitigate these through security realisation or other recovery processes.
• ‘Impaired’: exposures have been assessed, individually or collectively, as impaired.

H S B C H O L D I N G S P L C
Report of the Directors: Risk (continued) Credit risk > Credit quality > Risk ratings / Past due but not impaired
218
Risk rating scales
Compared with previous years, the basis of reporting has been changed to replace the former uniform seven-grade portfolio quality scale, in order both to extend the range of financial instruments covered in the presentation of portfolio quality and to reflect the more risk-sensitive rating systems introduced under the Group’s Basel II programme.
The Customer Risk Rating (‘CRR’) 10-grade scale above summarises a more granular underlying 22-grade scale of obligor probability of default (‘PD’). All distinct customers Group-wide are rated using one of these two PD scales, depending on the degree of sophistication of the Basel II approach adopted for the exposure.
The Expected Loss (‘EL’) 10-grade scale for retail business summarises a more granular underlying EL scale for these customer segments; this combines obligor and facility/product risk factors in a composite measure.
For debt securities and certain other financial instruments, external ratings have been aligned to the four quality classifications. The ratings of Standard and Poor’s are cited, with those of other agencies being treated equivalently. Debt securities with short-term issue ratings are reported against the long-term rating of the issuer of those securities. If major rating agencies have different ratings for the same debt securities, a prudent rating selection is made in line with regulatory requirements.
Additional credit quality information in respect of HSBC’s consolidated holdings of ABSs and assets held in consolidated SIVs and conduits is provided on pages 153 to 158 and 175 to 176, respectively.
For the purpose of the following disclosure, retail loans which are past due up to 89 days and are not otherwise classified as EL9 or EL10, are separately classified as past due but not impaired.
The following tables set out the Group’s distribution of financial instruments by measures of credit quality:
Distribution of financial instruments by credit quality (Audited) Neither past due nor impaired Past due Impair-
Strong Medium Sub- standard
but not impaired4 Impaired4
ment allowances3 Total
US$m US$m US$m US$m US$m US$m US$m At 31 December 2008 Items in the course of collection from other
banks ........................................................... 4,541 1,396 – 66 – 6,003
Trading assets ................................................. 303,307 98,977 3,167 405,451 – treasury and other eligible bills1 .............. 32,314 92 52 32,458– debt securities1 ......................................... 175,681 22,841 1,097 199,619– loans and advances to banks ................... 60,400 12,514 141 73,055– loans and advances to customers ............ 34,912 63,530 1,877 100,319
Financial assets designated at fair value ........ 5,288 11,434 818 17,540 – treasury and other eligible bills1 .............. 204 31 – 235– debt securities1 ......................................... 4,129 11,402 818 16,349– loans and advances to banks ................... 230 – – 230– loans and advances to customers ............ 725 1 – 726
Derivatives ...................................................... 383,393 106,348 5,135 494,876
Loans and advances held at amortised cost .... 565,542 427,788 43,432 48,422 25,422 (23,972) 1,086,634 – loans and advances to banks ................... 118,684 33,766 1,268 41 70 (63) 153,766– loans and advances to customers2 ........... 446,858 394,022 42,164 48,381 25,352 (23,909) 932,868
Financial investments ..................................... 257,435 32,889 1,382 32 1,246 292,984 – treasury and other similar bills ................ 37,932 2,927 168 – – 41,027– debt securities .......................................... 219,503 29,962 1,214 32 1,246 251,957
Other assets ..................................................... 11,959 26,517 1,747 219 417 40,859 – endorsements and acceptances ................ 1,851 7,793 805 30 3 10,482– accrued income and other ....................... 10,108 18,724 942 189 414 30,377

219
Neither past due nor impaired Past due Impair-
Strong Medium Sub- standard
but not impaired4 Impaired4
ment allowances3 Total
US$m US$m US$m US$m US$m US$m US$m At 31 December 2007 Items in the course of collection from other
banks ........................................................... 7,599 2,178 – – – 9,777
Trading assets ................................................. 277,437 115,091 1,964 394,492 – treasury and other eligible bills1 .............. 15,766 670 3 16,439– debt securities1 ......................................... 150,893 27,636 305 178,834– loans and advances to banks ................... 82,678 17,757 5 100,440– loans and advances to customers ............ 28,100 69,028 1,651 98,779
Financial assets designated at fair value ........ 5,266 16,126 125 21,517 – treasury and other eligible bills1 .............. 36 145 – 181– debt securities1 ......................................... 5,052 15,973 125 21,150– loans and advances to banks ................... 178 – – 178– loans and advances to customers ............ – 8 – 8
Derivatives ...................................................... 150,141 36,745 968 187,854
Loans and advances held at amortised cost .... 662,415 476,554 30,242 49,321 19,594 (19,212) 1,218,914 – loans and advances to banks ................... 189,446 45,358 2,535 22 12 (7) 237,366– loans and advances to customers ............ 472,969 431,196 27,707 49,299 19,582 (19,205) 981,548
Financial investments ..................................... 236,901 33,117 388 – – 270,406 – treasury and other similar bills ................ 26,776 3,188 140 – – 30,104– debt securities .......................................... 210,125 29,929 248 – – 240,302
Other assets ..................................................... 10,775 31,097 1,144 92 137 43,245 – endorsements and acceptances ................ 2,612 9,122 477 27 10 12,248– accrued income and other ....................... 8,163 21,975 667 65 127 30,997
1 Impairment is not measured for assets held in trading portfolios or designated at fair value as assets in such portfolios are managed according to movements in fair value, and the fair value movement is taken directly to the income statement. Consequently, all such balances are reported under ‘neither past due nor impaired’.
2 Includes asset-backed securities that have been externally rated as strong (US$7,991 million), medium (nil) and sub-standard (nil). 3 Impairment allowances are not reported for financial instruments whereby the carrying amount is reduced directly for impairment and
not through the use of an allowance account. 4 The amounts for loans and advances for 2007 have been restated, as a result of a reclassification from ’Past due but not impaired’ to
‘Impaired’ of an element of a credit card portfolio. There has been no effect on impairment allowances.
Past due but not impaired gross financial instruments (Audited)
Examples of exposures past due but not impaired include overdue loans fully secured by cash collateral; mortgages that are individually assessed for impairment, and that are in arrears more than 90
days, but where the value of collateral is sufficient to repay both the principal debt and all potential interest for at least one year; and short-term trade facilities past due more than 90 days for technical reasons such as delays in documentation, but where there is no concern over the creditworthiness of the counterparty.
Past due but not impaired loans and advances to customers and banks by geographical region
Europe Hong Kong
Rest of Asia- Pacific
North America
Latin America
Gross loans and advances past due not impaired1
US$m US$m US$m US$m US$m US$m
At 31 December 2008 ........................................ 3,800 1,805 4,320 35,247 3,250 48,422 At 31 December 2007 ......................................... 3,143 2,031 4,951 36,604 2,592 49,321
1 Restated for 2007 as a result of a reclassification of an element of a credit card portfolio as impaired. There has been no effect on impairment allowances.

H S B C H O L D I N G S P L C
Report of the Directors: Risk (continued) Credit risk > Impaired loans and advances > 2008
220
Past due but not impaired loans and advances to customers and banks by industry sector At 31 December 2008 2007 US$m US$m
Banks ................................................................................................................................................. 41 22
Customers .......................................................................................................................................... 48,381 49,299 Personal1 ........................................................................................................................................ 39,592 42,091Corporate and commercial ............................................................................................................ 8,603 6,938Financial ........................................................................................................................................ 186 270
48,422 49,321
1 Restated for 2007 as a result of a reclassification of an element of a credit card portfolio as impaired. There has been no effect on impairment allowances.
Ageing analysis of days past due but not impaired gross financial instruments (Audited) Up to 29
days 30-59 days
60-89 days
90-180 days
Over 180 days Total
US$m US$m US$m US$m US$m US$m At 31 December 2008 Items in the course of collection from other banks 66 – – – – 66
Loans and advances held at amortised cost ........ 31,034 10,814 5,493 621 460 48,422 – loans and advances to banks ....................... 41 – – – – 41– loans and advances to customers ................ 30,993 10,814 5,493 621 460 48,381
Financial investments – debt securities .............................................. 32 – – – – 32
Other assets ......................................................... 45 22 118 7 27 219 – endorsements and acceptances .................... 21 6 1 2 – 30– other ............................................................. 24 16 117 5 27 189
31,177 10,836 5,611 628 487 48,739
At 31 December 2007 Loans and advances held at amortised cost ........ 33,931 10,546 3,992 489 363 49,321
– loans and advances to banks ....................... 22 – – – – 22– loans and advances to customers1 ............... 33,909 10,546 3,992 489 363 49,299
Other assets ......................................................... 57 16 8 6 5 92 – endorsements and acceptances .................... 21 3 – 2 1 27– other ............................................................. 36 13 8 4 4 65
33,988 10,562 4,000 495 368 49,413
1 Restated for 2007 as a result of a reclassification of an element of a credit card portfolio as impaired. There has been no effect on impairment allowances.
Impaired loans and advances
Impaired loans and advances to customers and banks by industry sector (Audited) Impaired loans and advances at
31 December 2008 Impaired loans and advances at
31 December 20071 Individually
assessed Collectively assessed Total
Individually assessed
Collectively assessed
Total
US$m US$m US$m US$m US$m US$m
Banks .......................................................... 70 – 70 12 – 12
Customers ................................................... 6,922 18,430 25,352 6,477 13,105 19,582 Personal .................................................. 538 18,071 18,609 1,548 12,850 14,398Corporate and commercial ..................... 6,086 357 6,443 4,799 254 5,053Financial ................................................. 298 2 300 130 1 131
6,992 18,430 25,422 6,489 13,105 19,594
1 Impaired loans for 2007 have been restated as a result of the reclassification of an element of a credit card portfolio as impaired. There has been no effect on impairment allowances.

221
2008 compared with 2007 (Unaudited)
Total impaired loans to customers were US$25.4 billion at 31 December 2008, an increase of 29 per cent since the end of 2007 (42 per cent at constant currency). Impaired loans were 3 per cent of gross customer loans and advances, a rise from 2 per cent at 31 December 2007.
The commentary that follows compares balances at 31 December 2008 with those at 31 December 2007, at constant exchange rates.
In Europe, impaired loans at US$6.8 billion were 32 per cent higher than at the end of 2007. The increase was driven by the UK where credit quality in the UK commercial portfolio deteriorated sharply in the final quarter of the year. A small number of exposures in the commercial real estate sector were particularly affected by a sharp deterioration in market conditions in the fourth quarter. UK mortgage impairments remained broadly stable despite the substantial increase in balances in the second half of the year and delinquency levels increased modestly from a low base. Unsecured personal lending in the UK also saw a slight increase in the levels of impaired loans, particularly in the second half of the year, as the economy weakened. A single financial sector loan in Europe also affected results. Impairment levels in France remained low in the personal sector. However, Commercial Banking experienced a rising number of small impairments during the second half of the year and a small number of larger impairments in the last quarter. In Turkey, impaired loans rose by 81 per cent due to increased delinquency in the personal lending portfolio and, particularly, in credit cards.
In Hong Kong, impaired loans increased from a previously low level to US$852 million. The deterioration was concentrated in the commercial lending portfolio and was attributable to a number of factors including exporters in Hong Kong being affected by reduced demand from the US and other developed countries. The sharp fall in the value of currencies and commodities left some customers’ balance sheets weakened, coupled with rising fraud encountered with certain counterparties.
In the Rest of Asia-Pacific impaired loans increased by 8 per cent to US$1.1 billion, primarily due to the deterioration in the commercial lending portfolio. In the last quarter of 2008 the number of export orders suffered a sharp fall and, together with a deterioration in credit quality around the region, caused a rise in impaired loans. Noticeable increases were recognised in Taiwan, Indonesia and India. In Taiwan the commercial loan portfolio started to deteriorate in the second half of the year as the fall in exports started to affect local businesses. In Indonesia and India, the increase in impaired loans was a result of the downgrade of a few individual customers as economic conditions worsened. Impaired personal loans rose as increased unemployment and bankruptcy rates affected the ability of customers to repay. India continued to show significant impaired loans as the economic conditions deteriorated and credit quality weakened. Active measures are being taken to reduce exposure in India and manage the personal lending portfolio.
In North America, impaired loans rose significantly, increasing by 49 per cent to US$14.3 billion at 31 December 2008. The US consumer finance business experienced a broad based deterioration in credit quality due to higher unemployment as the economy slowed. A full discussion of these developments and their effect on credit quality is provided in the ‘Areas of special interest’ commentary on page 208. In Canada, impaired loans rose from a low base as credit conditions weakened, with the loss concentrated in a single exposure in the commercial real estate portfolio. In the US, commercial and corporate credit quality declined due to downgrades as the economic environment deteriorated.
In Latin America, impaired loans increased by 37 per cent to US$2.3 billion. Impaired loans in Mexico rose by 32 per cent, largely in credit cards driven by portfolio growth in personal lending, seasoning and higher delinquency rates. In Brazil, impaired loans rose by 34 per cent due to growth in personal lending due to deterioration in payroll and vehicle finance loan portfolios, and weakness in a number of real estate portfolios and corporates exposed to the sharp rise in the value of the US dollar in the second half of the year.

H S B C H O L D I N G S P L C
Report of the Directors: Risk (continued) Credit risk > Impaired loans and advances > Collateral // Impairment allowances
222
Collateral and other credit enhancements obtained (Audited)
HSBC obtained assets by taking possession of collateral held as security, or calling upon other credit enhancements, as follows:
(Audited) Carrying amount
obtained in: 2008 2007 US$m US$m Nature of assets Residential property ................. 2,562 2,509 Commercial and industrial
property ............................... 21 18 Other ........................................ 382 373
2,965 2,900 Repossessed properties are made available for
sale in an orderly fashion, with the proceeds used to reduce or repay the outstanding indebtedness. If excess funds arise after the debt has been repaid, they are made available either to repay other secured lenders with lower priority or are returned to the
customer. HSBC does not generally occupy repossessed properties for its business use. The majority of repossessed properties arose in HSBC Finance in the US, which, compared with 2007 experienced higher levels of foreclosure and higher losses on sale due to declining house prices. The average time taken to sell a repossessed property during 2008 was 177 days and the average loss upon sale of foreclosed properties was 13 per cent. The December 2008 balance of repossessed property was lower than otherwise would have been the case due to several factors that occurred during the month: HSBC Finance implemented a voluntary one month suspension of final court proceedings in foreclosure cases relating to owner occupied properties in December 2008, some states suspended foreclosure activity, and there was a backlog in moving foreclosure proceedings through the courts. HSBC expects, subject to further state actions, that repossessed property levels will increase in the first quarter of 2009 as foreclosure proceedings normalise. A quarterly breakdown of foreclosure data is provided below:
HSBC Finance foreclosed properties in the US (Unaudited) Quarter ended
2008 31 December 2008
30 September 2008
30 June 2008
31 March 2008
Number of foreclosed properties at end of period ................ 9,589 9,589 11,182 10,870 10,203 Number of properties added to foreclosed inventory
in the year/quarter .............................................................. 20,051 3,398 5,562 5,773 5,318 Average loss on sale of foreclosed properties1 ...................... 13% 13% 10% 11% 16% Average total loss on foreclosed properties2 ......................... 42% 47% 42% 40% 39% Average time to sell foreclosed properties (days) ................. 177 180 174 171 181
1 The average loss on sale of foreclosed properties is calculated as cash proceeds after deducting selling costs and commissions, minus the book value of the property when it was moved to ‘Real estate owned’, divided by the book value of the property when it was moved to ‘Real estate owned’.
2 The average total loss on foreclosed properties sold during each quarter includes both the loss on sale and the cumulative write-downs recognised on the loans up to and upon classification as ‘Real estate owned’. This average total loss on foreclosed properties is expressed as a percentage of the book value of the property prior to its transfer to ‘Real estate owners’.

223
Impairment allowances and charges on loans and advances to customers and banks (Audited)
The tables below analyse by geographical region the impairment allowances recognised for impaired
loans and advances that are either individually assessed or collectively assessed, and collective impairment allowances on loans and advances classified as not impaired.
Impairment allowances on loans and advances to customers by geographical region (Audited)
Europe Hong Kong
Rest of Asia-Pacific
North America
Latin America
Total
US$m US$m US$m US$m US$m US$m At 31 December 2008 Gross loans and advances Individually assessed impaired loans1 ................ 3,817 813 865 832 595 6,922
Collectively assessed2 ......................................... 426,233 100,140 108,318 271,472 43,692 949,855 Impaired loans1 ............................................... 2,957 39 249 13,453 1,732 18,430Non-impaired loans3 ....................................... 423,276 100,101 108,069 258,019 41,960 931,425
Gross loans and advances ................................... 430,050 100,953 109,183 272,304 44,287 956,777
Impairment allowances Individually assessed ...................................... 2,005 411 448 192 228 3,284 Collectively assessed ...................................... 1,854 322 779 15,898 1,772 20,625
Total impairment allowances ............................. 3,859 733 1,227 16,090 2,000 23,909
% % % % % % Individually assessed allowances as a percentage
of individually assessed loans and advances . 52.5 50.6 51.8 23.1 38.3 47.4 Collectively assessed allowances as a percentage
of collectively assessed loans and advances .. 0.4 0.3 0.7 5.9 4.1 2.2 Total allowances as a percentage of total loans
and advances .................................................. 0.9 0.7 1.1 5.9 4.5 2.5 US$m US$m US$m US$m US$m US$m
At 31 December 2007 Gross loans and advances Individually assessed impaired loans1 ................ 4,558 378 678 421 442 6,477
Collectively assessed2 ......................................... 451,648 89,636 102,100 301,419 49,473 994,276 Impaired loans1,4 ............................................. 1,696 55 410 9,241 1,703 13,105Non-impaired loans3,4 ..................................... 449,952 89,581 101,690 292,178 47,770 981,171
Gross loans and advances ................................... 456,206 90,014 102,778 301,840 49,915 1,000,753
Impairment allowances Individually assessed ...................................... 1,846 132 349 119 253 2,699 Collectively assessed ...................................... 2,085 244 577 11,861 1,739 16,506
Total impairment allowances ............................. 3,931 376 926 11,980 1,992 19,205 % % % % % % Individually assessed allowances as a percentage
of individually assessed loans and advances . 40.5 34.9 51.5 28.3 57.2 41.7 Collectively assessed allowances as a percentage
of collectively assessed loans and advances .. 0.5 0.3 0.6 3.9 3.5 1.7 Total allowances as a percentage of total loans
and advances .................................................. 0.9 0.4 0.9 4.0 4.0 1.9
1 Impaired loans and advances are those classified as CRR 9, CRR 10, EL 9 or EL 10 and all retail loans 90 days or more past due. 2 Collectively assessed loans and advances comprise homogeneous groups of loans that are not considered individually significant, and
loans subject to individual assessment where no impairment has been identified on an individual basis, but on which a collective impairment allowance has been calculated to reflect losses which have been incurred but not yet identified.
3 Collectively assessed loans and advances not impaired are those classified as CRR1 to CRR8 and EL1 to EL8 but excluding retail loans 90 days past due.
4 The 2007 collectively assessed impaired loans and advances for North America have been increased from US$7,963 million to US$9,241 million as a result of the reclassification of an element of a credit card portfolio as impaired. There has been no effect on impairment allowances.

H S B C H O L D I N G S P L C
Report of the Directors: Risk (continued) Credit risk > Impairment allowances > Movements
224
Impairment allowances on loans and advances to customers and banks by industry sector (Audited) At 31 December 2008 At 31 December 2007 Individually
assessed allowances
Collectively assessed allowances
Total allowances
Individually assessed allowances
Collectively assessed allowances
Total allowances
US$m US$m US$m US$m US$m US$m
Banks1 ......................................................... 63 – 63 7 – 7
Customers ................................................... 3,284 20,625 23,909 2,699 16,506 19,205 Personal .................................................. 312 18,657 18,969 379 14,983 15,362Corporate and commercial ..................... 2,845 1,795 4,640 2,275 1,472 3,747Financial ................................................. 127 173 300 45 51 96
3,347 20,625 23,972 2,706 16,506 19,212
1 The impairment allowances on loans and advances to banks relates to the geographical region, Europe.
Impairment allowances as a percentage of loans and advances1 (Unaudited)
At 31 December 2008 2007 % % Banks
Individually assessed impairment allowances2 ............................................................................. 0.06 0.0
Customers3 ......................................................................................................................................... 2.63 2.01 Individually assessed impairment allowances3 ............................................................................. 0.36 0.28Collectively assessed impairment allowances3 ............................................................................. 2.27 1.73
1 Net of reverse repo transactions, settlement accounts and stock borrowings. 2 As a percentage of loans and advances to banks. 3 As a percentage of loans and advances to customers.
Movement in impairment allowances
The tables below describe details of the movements in HSBC’s loan impairment allowances (i) for loans
and advances, (ii) by industry segment for each of the past 5 years and (iii) by industry segment and geographical region for 2008 and 2007.
Movement in impairment allowances on loans and advances (Audited)
Banks Customers individually
assessed Individually assessed
Collectively assessed Total
US$m US$m US$m US$m
At 1 January 2008 ......................................................... 7 2,699 16,506 19,212 Amounts written off ..................................................... – (824) (17,131) (17,955)Recoveries of loans and advances written off in
previous years ......................................................... – 113 721 834 Charge to income statement ......................................... 54 2,010 22,067 24,131 Exchange and other movements ................................... 2 (714) (1,538) (2,250)
At 31 December 2008 .................................................. 63 3,284 20,625 23,972 At 1 January 2007 ......................................................... 7 2,565 11,013 13,585 Amounts written off ..................................................... – (897) (11,947) (12,844)Recoveries of loans and advances written off in
previous years ......................................................... – 129 876 1,005 Charge to income statement ......................................... – 796 16,381 17,177 Exchange and other movements ................................... – 106 183 289
At 31 December 2007 ................................................... 7 2,699 16,506 19,212
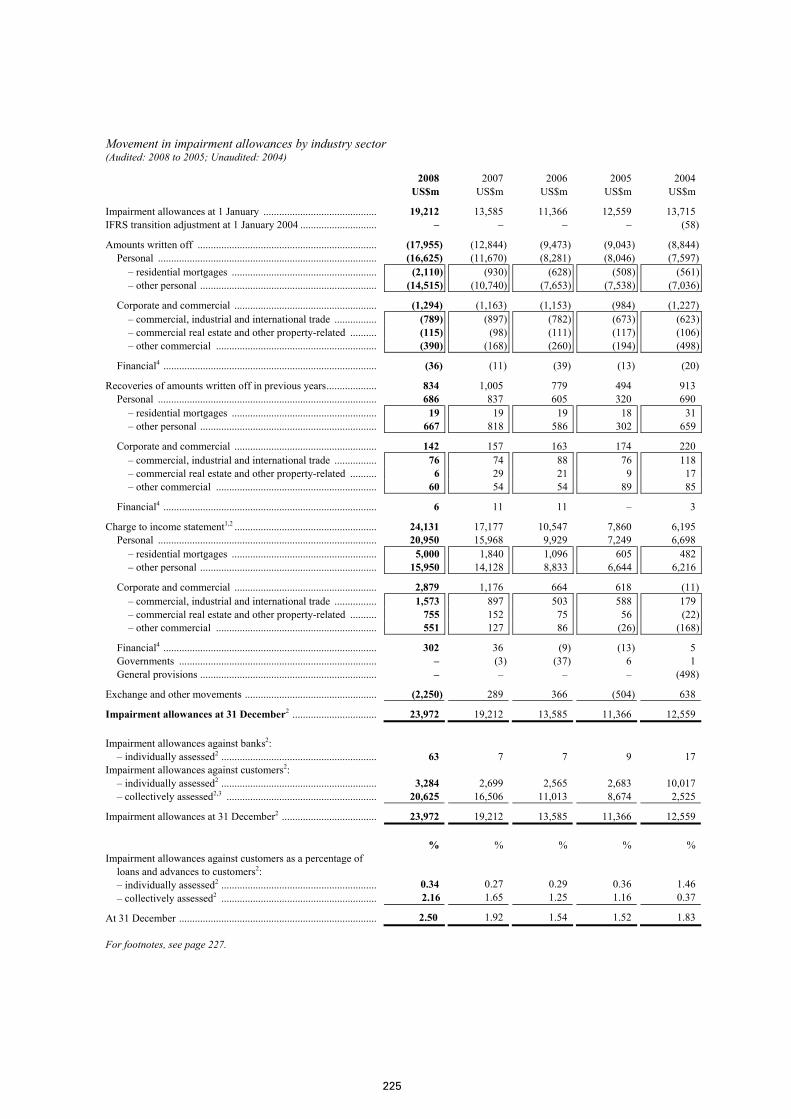
225
Movement in impairment allowances by industry sector (Audited: 2008 to 2005; Unaudited: 2004)
2008 2007 2006 2005 2004 US$m US$m US$m US$m US$m
Impairment allowances at 1 January ........................................... 19,212 13,585 11,366 12,559 13,715 IFRS transition adjustment at 1 January 2004 ............................. – – – – (58)
Amounts written off .................................................................... (17,955) (12,844) (9,473) (9,043) (8,844)Personal ................................................................................... (16,625) (11,670) (8,281) (8,046) (7,597)
– residential mortgages ....................................................... (2,110) (930) (628) (508) (561)– other personal ................................................................... (14,515) (10,740) (7,653) (7,538) (7,036)
Corporate and commercial ...................................................... (1,294) (1,163) (1,153) (984) (1,227)– commercial, industrial and international trade ................ (789) (897) (782) (673) (623)– commercial real estate and other property-related .......... (115) (98) (111) (117) (106)– other commercial ............................................................. (390) (168) (260) (194) (498)
Financial4 ................................................................................. (36) (11) (39) (13) (20)
Recoveries of amounts written off in previous years................... 834 1,005 779 494 913 Personal ................................................................................... 686 837 605 320 690
– residential mortgages ....................................................... 19 19 19 18 31– other personal ................................................................... 667 818 586 302 659
Corporate and commercial ...................................................... 142 157 163 174 220 – commercial, industrial and international trade ................ 76 74 88 76 118– commercial real estate and other property-related .......... 6 29 21 9 17– other commercial ............................................................. 60 54 54 89 85
Financial4 ................................................................................. 6 11 11 – 3
Charge to income statement1,2 ...................................................... 24,131 17,177 10,547 7,860 6,195 Personal ................................................................................... 20,950 15,968 9,929 7,249 6,698
– residential mortgages ....................................................... 5,000 1,840 1,096 605 482– other personal ................................................................... 15,950 14,128 8,833 6,644 6,216
Corporate and commercial ...................................................... 2,879 1,176 664 618 (11)– commercial, industrial and international trade ................ 1,573 897 503 588 179– commercial real estate and other property-related .......... 755 152 75 56 (22)– other commercial ............................................................. 551 127 86 (26) (168)
Financial4 ................................................................................. 302 36 (9) (13) 5 Governments ........................................................................... – (3) (37) 6 1 General provisions ................................................................... – – – – (498)
Exchange and other movements .................................................. (2,250) 289 366 (504) 638
Impairment allowances at 31 December2 ................................ 23,972 19,212 13,585 11,366 12,559
Impairment allowances against banks2: – individually assessed2 ........................................................... 63 7 7 9 17
Impairment allowances against customers2: – individually assessed2 ........................................................... 3,284 2,699 2,565 2,683 10,017 – collectively assessed2,3 ......................................................... 20,625 16,506 11,013 8,674 2,525
Impairment allowances at 31 December2 .................................... 23,972 19,212 13,585 11,366 12,559
% % % % % Impairment allowances against customers as a percentage of
loans and advances to customers2: – individually assessed2 ........................................................... 0.34 0.27 0.29 0.36 1.46 – collectively assessed2 ........................................................... 2.16 1.65 1.25 1.16 0.37
At 31 December ........................................................................... 2.50 1.92 1.54 1.52 1.83
For footnotes, see page 227.

H S B C H O L D I N G S P L C
Report of the Directors: Risk (continued) Credit risk > Impairment allowances > Movements
226
Movement in impairment allowances by industry sector and by geographical region (Audited)
2008
Europe Hong Kong
Rest of Asia- Pacific
North America
Latin America Total
US$m US$m US$m US$m US$m US$m
Impairment allowances at 1 January ........................... 3,938 376 926 11,980 1,992 19,212
Amounts written off .................................................... (2,483) (219) (838) (12,215) (2,200) (17,955)Personal ..................................................................... (1,947) (179) (799) (11,989) (1,711) (16,625)
– residential mortgages .......................................... (3) (1) (6) (2,030) (70) (2,110)– other personal ...................................................... (1,944) (178) (793) (9,959) (1,641) (14,515)
Corporate and commercial ........................................ (515) (38) (39) (214) (488) (1,294)– commercial, industrial and international trade ... (367) (33) (22) (153) (214) (789)– commercial real estate and other property-related (77) (2) (4) (12) (20) (115)– other commercial ................................................ (71) (3) (13) (49) (254) (390)
Financial4 .................................................................. (21) (2) – (12) (1) (36)
Recoveries of amounts written off in previous years .. 294 39 137 100 264 834 Personal ..................................................................... 275 36 124 54 197 686
– residential mortgages .......................................... – 7 1 – 11 19– other personal ...................................................... 275 29 123 54 186 667
Corporate and commercial ........................................ 19 3 8 45 67 142 – commercial, industrial and international trade ... 19 1 6 27 23 76– commercial real estate and other property-related – – 1 5 – 6– other commercial ................................................ – 2 1 13 44 60
Financial4 .................................................................. – – 5 1 – 6
Charge to income statement1 ....................................... 3,411 556 1,089 16,589 2,486 24,131 Personal ..................................................................... 1,961 160 860 16,006 1,963 20,950
– residential mortgages .......................................... 18 – 29 4,943 10 5,000– other personal ...................................................... 1,943 160 831 11,063 1,953 15,950
Corporate and commercial ........................................ 1,304 363 220 472 520 2,879 – commercial, industrial and international trade ... 537 316 171 213 336 1,573– commercial real estate and other property-related 540 28 21 132 34 755– other commercial ................................................ 227 19 28 127 150 551
Financial4 .................................................................. 146 33 9 111 3 302
Exchange and other movements .................................. (1,238) (19) (87) (364) (542) (2,250)
Impairment allowances at 31 December ................. 3,922 733 1,227 16,090 2,000 23,972
Impairment allowances against banks: – individually assessed ............................................ 63 – – – – 63
Impairment allowances against customers: – individually assessed ............................................ 2,005 411 448 192 228 3,284 – collectively assessed3 ........................................... 1,854 322 779 15,898 1,772 20,625
Impairment allowances at 31 December ..................... 3,922 733 1,227 16,090 2,000 23,972
% % % % % % Impairment allowances against customers as a
percentage of loans and advances to customers: – individually assessed ............................................ 0.47 0.41 0.41 0.07 0.51 0.34 – collectively assessed ............................................. 0.43 0.32 0.71 5.84 4.00 2.16
At 31 December ........................................................... 0.90 0.73 1.12 5.91 4.51 2.50

227
2007
Europe Hong Kong
Rest of Asia- Pacific
North America
Latin America Total
US$m US$m US$m US$m US$m US$m
Impairment allowances at 1 January ........................... 3,683 365 901 7,247 1,389 13,585
Amounts written off .................................................... (2,940) (251) (724) (7,444) (1,485) (12,844)Personal ..................................................................... (2,402) (180) (615) (7,273) (1,200) (11,670)
– residential mortgages .......................................... (7) (8) (16) (878) (21) (930)– other personal ...................................................... (2,395) (172) (599) (6,395) (1,179) (10,740)
Corporate and commercial ........................................ (533) (71) (109) (166) (284) (1,163)– commercial, industrial and international trade ... (371) (57) (94) (122) (253) (897)– commercial real estate and other property-related (72) (4) (5) (14) (3) (98)– other commercial ................................................ (90) (10) (10) (30) (28) (168)
Financial4 .................................................................. (5) – – (5) (1) (11)
Recoveries of amounts written off in previous years .. 542 43 124 62 234 1,005 Personal ..................................................................... 468 36 100 29 204 837
– residential mortgages .......................................... – 6 3 1 9 19– other personal ...................................................... 468 30 97 28 195 818
Corporate and commercial ........................................ 66 7 23 31 30 157 – commercial, industrial and international trade ... 14 5 10 21 24 74– commercial real estate and other property-related 19 1 7 1 1 29– other commercial ................................................ 33 1 6 9 5 54
Financial4 .................................................................. 8 – 1 2 – 11
Charge to income statement1 ....................................... 2,543 212 614 12,111 1,697 17,177 Personal ..................................................................... 2,035 157 550 11,854 1,372 15,968
– residential mortgages .......................................... 7 (14) 16 1,784 47 1,840– other personal ...................................................... 2,028 171 534 10,070 1,325 14,128
Corporate and commercial ........................................ 499 53 63 236 325 1,176 – commercial, industrial and international trade ... 353 57 82 125 280 897– commercial real estate and other property-related 119 (4) (21) 52 6 152– other commercial ................................................ 27 – 2 59 39 127
Financial4 .................................................................. 12 2 1 21 – 36 Governments ............................................................. (3) – – – – (3)
Exchange and other movements .................................. 110 7 11 4 157 289
Impairment allowances at 31 December ................. 3,938 376 926 11,980 1,992 19,212
Impairment allowances against banks: – individually assessed ............................................ 7 – – – – 7
Impairment allowances against customers: – individually assessed ............................................ 1,846 132 349 119 253 2,699 – collectively assessed3 ........................................... 2,085 244 577 11,861 1,739 16,506
Impairment allowances at 31 December ..................... 3,938 376 926 11,980 1,992 19,212
% % % % % % Impairment allowances against customers as a
percentage of loans and advances to customers: – individually assessed ............................................ 0.40 0.15 0.34 0.04 0.51 0.27 – collectively assessed ............................................. 0.46 0.27 0.56 3.93 3.48 1.65
At 31 December ........................................................... 0.86 0.42 0.90 3.97 3.99 1.92
1 See table below ‘Net loan impairment charge to the income statement by geographical region’. 2 In 2004, ‘Charge to income statement’ was ‘Net charge to profit and loss account’; ‘Impairment allowances’ were ‘Provisions’;
‘Individually assessed impairment allowances’ were ‘Specific provisions’; and ‘Collectively assessed impairment allowances’ were ‘General provisions’.
3 Collectively assessed impairment allowances (2004: ‘General provisions’) are allocated to geographical segments based on the location of the office booking the allowances or provisions. Consequently, the collectively assessed impairment allowances booked in Hong Kong may cover assets booked in branches located outside Hong Kong, principally in Rest of Asia-Pacific, as well as those booked in Hong Kong.
4 Includes movement in impairment allowances against banks.

H S B C H O L D I N G S P L C
Report of the Directors: Risk (continued) Credit risk > Impairment allowances > 2008
228
Individually and collectively assessed charge to impairment allowances by industry segment (Unaudited) 2008 2007 Individually
assessed US$m
Collectively assessed US$m
Total US$m
Individually assessed US$m
Collectively assessed US$m
Total US$m
Banks .................................................................. 54 – 54 – – – Personal ............................................................... 110 20,840 20,950 54 15,914 15,968
Residential mortgages .................................... 26 4,974 5,000 13 1,827 1,840Other personal ................................................ 84 15,866 15,950 41 14,087 14,128
Corporate and commercial ................................. 1,782 1,097 2,879 722 451 1,173 Commercial, industrial and international
trade ............................................................ 912 661 1,573 584 313 897Commercial real estate and other
property-related .......................................... 613 142 755 84 67 151Other commercial ........................................... 257 294 551 54 71 125
Financial ............................................................. 118 130 248 20 16 36
Total charge to income statement ....................... 2,064 22,067 24,131 796 16,381 17,177
Charge for impairment losses
The following tables analysing the net loan impairment charge to the income statement are
followed by a discussion of the material movements in loan impairment charges by region.
Net loan impairment charge to the income statement (Unaudited) 2008 2007 2006 2005 2004 US$m US$m US$m US$m US$m Individually assessed impairment allowances1
New allowances ....................................................................... 2,742 1,533 1,297 1,715 8,872 Release of allowances no longer required .............................. (565) (608) (711) (998) (1,266)Recoveries of amounts previously written off ........................ (113) (129) (128) (199) (913)
2,064 796 458 518 6,693
Collectively assessed impairment allowances1 New allowances net of allowance releases ............................. 22,788 17,257 10,740 8,425 – Release of allowances no longer required .............................. – – – (788) – Recoveries of amounts previously written off ........................ (721) (876) (651) (295) – General provisions ................................................................... – – – – (498)
22,067 16,381 10,089 7,342 (498)
Total charge for impairment losses1 ............................................ 24,131 17,177 10,547 7,860 6,195 Banks ...................................................................................... 54 – (3) (7) (10)Customers ............................................................................... 24,077 17,177 10,550 7,867 6,205
% % % % % Charge for impairment losses as a percentage of closing
gross loans and advances1 ...................................................... 2.17 1.39 0.99 0.90 0.91
US$m US$m US$m US$m US$m At 31 December Impaired loans1,2 .......................................................................... 25,422 19,594 15,086 12,360 13,057 Impairment allowances1 .............................................................. 23,972 19,212 13,585 11,366 12,542
1 In 2004, ‘Individually assessed impairment allowances’ were ‘Specific provisions’; ‘Collectively assessed impairment allowances’ were ‘General provisions’; ‘Total charge for impairment losses’ was ‘Bad and doubtful debt charge’; ‘Impaired loans’ were ‘Non-performing loans’ and ‘Impairment allowances’ were ‘Provisions’.
2 Impaired loans for 2007 have been restated as a result of the reclassification of an element of a credit card portfolio as impaired. There has been no effect on impairment allowances.

229
Net loan impairment charge to the income statement by geographical region (Unaudited)
Europe US$m
Hong Kong US$m
Rest of Asia- Pacific US$m
North America US$m
Latin America US$m
Total US$m
2008 Individually assessed impairment allowances
New allowances .............................................. 1,567 365 253 397 160 2,742 Release of allowances no longer required ..... (340) (25) (89) (80) (31) (565)Recoveries of amounts previously written off (38) (10) (20) (40) (5) (113)
1,189 330 144 277 124 2,064
Collectively assessed impairment allowances New allowances net of allowance releases .... 2,478 255 1,062 16,372 2,621 22,788 Recoveries of amounts previously written off (256) (29) (117) (60) (259) (721)
2,222 226 945 16,312 2,362 22,067
Total charge for impairment losses .................... 3,411 556 1,089 16,589 2,486 24,131 Banks ............................................................. 54 – – – – 54Customers ...................................................... 3,357 556 1,089 16,589 2,486 24,077
% % % % % % Charge for impairment losses as a percentage
of closing gross loans and advances .............. 0.68 0.43 0.75 5.85 4.22 2.17
US$m US$m US$m US$m US$m US$m At 31 December 2008 Impaired loans .................................................... 6,844 852 1,114 14,285 2,327 25,422 Impairment allowances ....................................... 3,922 733 1,227 16,090 2,000 23,972 2007 Individually assessed impairment allowances
New allowances .............................................. 781 103 211 228 210 1,533 Release of allowances no longer required ..... (388) (32) (96) (54) (38) (608)Recoveries of amounts previously written off (38) (14) (32) (26) (19) (129)
355 57 83 148 153 796
Collectively assessed impairment allowances New allowances net of allowance releases .... 2,692 184 623 11,999 1,759 17,257 Recoveries of amounts previously written off (504) (29) (92) (36) (215) (876)
2,188 155 531 11,963 1,544 16,381
Total charge for impairment losses .................... 2,543 212 614 12,111 1,697 17,177 Customers ...................................................... 2,543 212 614 12,111 1,697 17,177
% % % % % % Charge for impairment losses as a percentage
of closing gross loans and advances .............. 0.45 0.14 0.43 3.80 2.71 1.39
US$m US$m US$m US$m US$m US$m At 31 December 2007 Impaired loans1 ................................................... 6,266 433 1,088 9,662 2,145 19,594 Impairment allowances ....................................... 3,938 376 926 11,980 1,992 19,212
1 The 2007 impaired loans for North America have been restated as a result of the reclassification of an element of a credit card portfolio as impaired. There has been no effect on impairment allowances.
2008 compared with 2007 (Unaudited)
Loan impairment charges increased by 40 per cent to US$24.1 billion from US$17.2 billion in 2007. The commentary that follows is on a constant currency basis.
New allowances for loan impairment charges rose by 37 per cent compared with 2007. Releases
and recoveries of allowances declined by 10 per cent to US$1.4 billion.
In Europe, new loan impairment charges were US$4.0 billion, a rise of 24 per cent compared with 2007. This primarily reflected higher impairment charges in Global Banking and Markets following a significant charge against a single European commercial real estate corporate customer.
H S B C H O L D I N G S P L C
Report of the Directors: Risk (continued) Credit risk > Impairment allowances > Charges > 2008 / 2007
230
Impairment charges against banks rose in the UK due to exposures to the Icelandic banks in 2008. New loan impairment charges rose in Turkey as delinquency rates rose across credit cards, personal loans and corporate lending in light of the deteriorating economic environment. Elsewhere, impairment charges on the commercial portfolio rose in the UK, particularly in the final quarter of 2008 as the weakening property market led to higher impairment charges against construction companies and businesses dependent upon the real estate sector. In France, the impact of declining commercial credit quality more than offset lower balances. Impairment allowances against firms in the financial sector rose due to exposure to a single asset management firm in the UK. Credit quality in the UK personal lending portfolio remained broadly stable, reflecting the strength of HSBC’s loan book in a period of significant economic uncertainty. Mortgage lending in the UK remained well secured as risk mitigation actions taken since 2006 reduced risk exposure to some of the problems now being uncovered in the UK residential property market. Credit quality in the unsecured portfolios of M&S Money, HSBC Bank and Partnership Cards deteriorated slightly in 2008, particularly in the second half of the year, due to the weakening UK economy.
Releases and recoveries in Europe declined by 27 per cent, driven by the deterioration in economic conditions.
In Hong Kong, new loan impairment charges more than doubled from a low base, driven by deterioration in credit quality in the commercial portfolio in the second half of the year as the economy and trade flows weakened. Residential mortgage lending continued to be well-secured, as regulatory restrictions constrained origination loan-to-value ratios to below 70 per cent.
In Rest of Asia-Pacific, new loan impairment charges rose by 59 per cent to US$1.3 billion, primarily in India and the Middle East. Higher impairment charges in India were driven by a combination of rising delinquency rates in consumer lending, as credit conditions deteriorated, and increased lending. Increased charges in the Middle East were due to rising delinquencies as growth rates declined and the property market retreated as economic conditions deteriorated on the back of lower oil and gas prices.
New loan impairment charges in North America rose by 37 per cent to US$16.8 billion, driven by the continued deterioration in credit quality in the HSBC Finance loan portfolio and, to a lesser extent, in HSBC USA.
US credit quality showed significant deterioration across the portfolio, driven by the continued weakness of the US economy. The reasons behind the deterioration in US credit quality, the effects on the US personal lending portfolio and actions taken as a result are discussed in more detail on page 210. Partly offsetting the effect of the deterioration was a reduction in overall lending as HSBC continued to reduce its exposure in the US.
In US card and retail services, impairment charges rose, driven by portfolio seasoning, higher levels of personal bankruptcy filings and continued weakness in the US economy. Delinquency increased in the geographical regions most affected by house price falls and rising unemployment.
In Commercial Banking, impairment charges rose from a low base driven by deterioration in the commercial real estate loan book in the US, and higher impairment charges against firms in the manufacturing, export and commercial real estate sectors in Canada. Higher impairment charges in Global Banking and Markets reflected weaker credit fundamentals in the US in 2008. Impairment allowances against firms in the financial sector rose due to rising delinquencies, despite government intervention.
Releases and recoveries in North America rose by 55 per cent to US$180 million.
In Latin America, new loan impairment charges rose by 37 per cent to US$2.8 billion. The most significant increase was in Mexico, reflecting higher impairment charges in the credit card portfolio due to a combination of higher average balances from organic expansion and growing delinquency rates driven by a deterioration in credit quality as the 2006 and 2007 vintages continued to season and move into later stages of delinquency. Management action to improve the quality of new business included tightened underwriting, enhanced collection strategies and better managed customer acquisition channels. The commercial portfolio in Mexico also experienced higher impairment charges due to credit quality deterioration among small and medium sized enterprises as the economy weakened. In Brazil, higher impairment charges were driven by a combination of balance growth and credit quality deterioration in the vehicle finance and payroll loan portfolios.
2007 compared with 2006 (Unaudited)
Loan impairment charges rose by 63 per cent to US$17.2 billion from US$10.5 billion in 2006. The

231
commentary that follows is on a constant currency basis:
New allowances for loan impairment charges rose by 52 per cent, compared with 2006. Releases and recoveries of allowances increased by 1 per cent to US$1.6 billion.
In Europe, new loan impairment charges were US$3.5 billion, a rise of 8 per cent compared with 2006. This partly reflected growth in commercial lending, where charges remained low compared with historical amounts but rose from the exceptionally low levels experienced in 2005 and 2006. Increased charges also reflected growth in credit card lending in Turkey. In the UK, refinements to the methodology used to calculate roll rate percentages resulted in a higher charge in the consumer finance operations in the first half of the year. Excluding this, loan impairment charges were marginally lower than in 2006.
Releases and recoveries in Europe were broadly in line with 2006.
In Hong Kong, new loan impairment charges of US$287 million were recorded, an increase of 19 per cent, due to the growth in credit card balances and new corporate loan charges.
Releases and recoveries in Hong Kong decreased to US$75 million, primarily in the corporate sector. This reflected the low level of allowances added in recent years.
In Rest of Asia-Pacific, new loan impairment charges rose by 10 per cent to US$834 million, with higher loan impairment charges arising in the commercial loan books in Thailand and Malaysia. This was offset by a decline in loan impairment charges for personal lending, particularly in Taiwan and Indonesia, where charges returned to more regular levels after an upsurge in 2006 due to regulatory changes which affected collection activity and minimum payments.
With corporate and commercial loan impairment charges low in recent years, releases and recoveries decreased by 6 per cent to US$220 million.
New loan impairment charges in North America rose by 76 per cent to US$12.2 billion, driven by the continued deterioration in credit quality in the US consumer finance loan portfolio.
US credit quality deteriorated as mortgage delinquencies rose, house prices declined, refinancing credit became less available in the market and the macroeconomic outlook worsened.
Other factors affecting the rise in US loan impairment charges included normal seasoning of the portfolio, a higher proportion of unsecured personal lending and a return to historical norms from the unusually low levels of bankruptcy filings experienced in 2006, following changes enacted to US bankruptcy law in 2005.
Delinquency rates rose across all parts of the HSBC Finance personal lending portfolio, with mortgage services and consumer lending experiencing significant rises in delinquency which flowed through subsequent stages through to foreclosure. As the housing downturn began to have more effect on the broader economy, delinquency rates in credit cards and vehicle finance rose in the final quarter of 2007. A change in product mix in the cards portfolio towards higher yielding products also contributed to higher impairment charges as this segment of the portfolio seasoned.
Releases and recoveries in North America decreased to US$116 million. In the US consumer finance business, collection staff increased in all lending portfolios as part of the response to the deteriorating credit environment.
In Latin America, new loan impairment charges rose by 63 per cent to US$2.0 billion. The most significant increase was registered in Mexico, reflecting strong growth in balances, normal portfolio seasoning and a rise in delinquency rates in credit cards. Charges for commercial lending in Mexico fell as increased delinquency rates in the small and medium-sized business portfolios were offset by impairment allowance releases. Products with high credit losses were discontinued or restructured. Loan impairment charges in Brazil rose marginally, due to growth in store loans and credit cards.
Releases and recoveries in Latin America increased to US$272 million. In Brazil, credit models were changed during 2007 to align with credit behaviour in underlying portfolios.

H S B C H O L D I N G S P L C
Report of the Directors: Risk (continued) Credit risk > Impairment allowances / HSBC Holdings / Risk elements
232
Charge for impairment losses as a percentage of average gross loans and advances to customers (Unaudited) 2008 2007 2006 2005 2004 % % % % %
New allowances net of allowance releases1 ................................ 2.54 2.09 1.49 1.25 1.41 Recoveries1 .................................................................................. (0.09) (0.12) (0.10) (0.09) (0.35)
Total charge for impairment losses1 ............................................ 2.45 1.97 1.39 1.16 1.06
Amount written off net of recoveries .......................................... 1.75 1.36 1.15 1.26 1.26
1 In 2004, ‘New allowances’ were ‘New provisions’; ‘Recoveries’ were ‘Releases and recoveries’; and ‘Total charge for impairment losses’ was ‘Total provisions charged’.
Charge for impairment losses as a percentage of average gross loans and advances to customers by geographical region (Unaudited)
Europe Hong Kong
Rest of Asia- Pacific
North America
Latin America
Total
% % % % % % 2008 New allowances net of allowance releases ........ 0.86 0.63 1.06 5.73 5.32 2.54 Recoveries .......................................................... (0.07) (0.04) (0.12) (0.03) (0.51) (0.09)
Total charge for impairment losses .................... 0.79 0.59 0.94 5.70 4.81 2.45
Amount written off net of recoveries ................. 0.52 0.19 0.61 4.16 3.73 1.75 2007 New allowances net of allowance releases ........ 0.86 0.29 0.83 4.20 4.55 2.09 Recoveries .......................................................... (0.15) (0.05) (0.14) (0.02) (0.55) (0.12)
Total charge for impairment losses .................... 0.71 0.24 0.69 4.18 4.00 1.97
Amount written off net of recoveries ................. 0.67 0.23 0.67 2.55 2.95 1.36 HSBC Holdings (Audited)
Credit risk arises in HSBC Holdings primarily from transactions with Group subsidiaries and from guarantees issued in support of obligations assumed by certain Group operations in the normal conduct of their business.
These risks are reviewed and managed within regulatory and internal limits for exposures by the HSBC Global Risk function, which provides high-
level, centralised oversight and management of HSBC’s credit risks world-wide.
No collateral or other credit enhancements were held by HSBC Holdings in respect of its transactions with subsidiary undertakings.
HSBC Holdings’ maximum exposure to credit risk at 31 December 2008 is shown below. HSBC Holdings’ financial assets principally represent claims on Group subsidiaries in Europe and North America.
HSBC Holdings – maximum exposure to credit risk
Maximum exposure 2008 2007 US$m US$m
Derivatives ......................................................................................................................................... 3,682 2,660 Loans and advances to HSBC undertakings ..................................................................................... 11,804 17,242 Financial investments ........................................................................................................................ 2,629 3,022 Financial guarantees .......................................................................................................................... 47,341 38,457 Loan commitments and other credit-related commitments .............................................................. 3,241 3,638
68,697 65,019

233
All of the derivative transactions are with HSBC undertakings which are banking counterparties (2007: 100 per cent).
The credit quality of loans and advances to HSBC undertakings is assessed as satisfactory risk, with 100 per cent of the exposure being neither past due nor impaired (2007: 100 per cent).
The long-term debt ratings of HSBC Group issuers of financial investments are within the Standard & Poor’s ratings range of AA– to AA+ (2007: AA– to AA+).
Risk elements in the loan portfolio (Unaudited)
The disclosure of credit risk elements under the following headings reflects US accounting practice and classifications for publicly traded bank holding companies:
• loans accounted for on a non-accrual basis;
• accruing loans contractually past due 90 days or more as to interest or principal; and
• troubled debt restructurings not included in the above.
Interest forgone on impaired loans (Audited)
Interest income that would have been recognised under the original terms of impaired and restructured loans amounted to approximately US$1.9 billion in 2008 (2007: US$1.1 billion). Interest income from such loans of approximately US$702 million (2007: US$374 million) was recorded in 2008.
Troubled debt restructurings
The SEC requires separate disclosure of any loans whose terms have been modified because of problems with the borrower to grant concessions other than are warranted by market conditions. These are classified as ‘troubled debt restructurings’ (TDRs). The definition of TDRs differs from the ‘Renegotiated loans that would otherwise be past due or impaired’ quantified on page 216 insofar as for TDRs the delinquency status of the loan following restructuring may continue to be past due not impaired or, where appropriate, impaired. In addition, the classification of a loan as a TDR may be discontinued after the first year if the debt performs in accordance with the new terms.
Troubled debt restructurings increased by 47 per cent in 2008, reflecting measures taken to mitigate risk in the US consumer finance business in response to the deterioration in mortgage loans.
Unimpaired loans past due 90 days or more
Unimpaired loans contractually past due 90 days or more increased. Figures for 2004 to 2007 have been restated due to the reclassification of an element of the North America credit card portfolio as impaired. There has been no effect on impairment allowances.
Impaired loans
In accordance with IFRSs, HSBC recognises interest income on assets after they have been written down as a result of an impairment loss. In the following tables, HSBC represents information on its impaired loans and advances in accordance with the disclosure convention described on page 217.
Potential problem loans
Credit risk elements also cover potential problem loans. These are loans where information on possible credit problems among borrowers causes management to seriously doubt their ability to comply with the loan repayment terms. There are no potential problem loans other than those identified in the table of risk elements set out below, and as discussed in ‘Areas of special interest’ on page 210. ‘Areas of special interest’ includes further disclosure about certain homogeneous groups of loans which are collectively assessed for impairment, and represent the Group’s most significant exposures to potential problem loans, including ARMs and stated-income products. Collectively assessed loans and advances, as set out on page 223, although not classified as impaired until more than 90 days, are assessed collectively for losses that have been incurred but have not yet been individually identified. This policy is further described on page 196.
Risk elements
The following table provides an analysis of risk elements in the loan portfolios at 31 December for the past five years.

H S B C H O L D I N G S P L C
Report of the Directors: Risk (continued) Credit risk > Risk elements / Liquidity and funding > Policies / Primary sources of funding
234
Analysis of risk elements (Unaudited) At 31 December 2008
US$m 2007
US$m 2006
US$m 2005 US$m
2004 US$m
Impaired loans Europe ......................................................... 6,844 6,266 5,858 5,081 6,053 Hong Kong ................................................. 852 433 454 506 696 Rest of Asia-Pacific .................................... 1,114 1,088 1,188 945 1,172 North America1 ........................................... 14,285 9,662 6,108 4,602 4,204 Latin America ............................................. 2,327 2,145 1,478 1,226 932
25,422 19,594 15,086 12,360 13,057
Troubled debt restructurings Europe ......................................................... 366 648 360 239 213 Hong Kong ................................................. 165 146 189 198 436 Rest of Asia-Pacific .................................... 119 34 73 121 56 North America ............................................ 5,618 3,322 1,712 1,417 1,600 Latin America ............................................. 1,067 848 915 878 830
7,335 4,998 3,249 2,853 3,135
Unimpaired loans contractually past due 90 days or more as to principal or interest
Europe ......................................................... 635 202 237 592 68 Hong Kong ................................................. 43 49 79 74 67 Rest of Asia-Pacific .................................... 274 156 78 40 56 North America1 ........................................... 108 24 78 32 567 Latin America ............................................. 21 421 165 4 –
1,081 852 637 742 758
Trading loans classified as in default2 North America ............................................ 561 675 127 11 –
Risk elements on loans Europe ......................................................... 7,845 7,116 6,455 5,912 6,334 Hong Kong ................................................. 1,060 628 722 778 1,199 Rest of Asia-Pacific .................................... 1,507 1,278 1,339 1,106 1,284 North America ............................................ 20,572 13,683 8,025 6,062 6,371 Latin America ............................................. 3,415 3,414 2,558 2,108 1,762
34,399 26,119 19,099 15,966 16,950
Assets held for resale Europe ......................................................... 81 59 30 205 27 Hong Kong ................................................. 26 29 42 49 75 Rest of Asia-Pacific .................................... 13 7 17 31 21 North America ............................................ 1,758 1,172 999 582 664 Latin America ............................................. 113 101 91 103 44
1,991 1,368 1,179 970 831
Total risk elements Europe ......................................................... 7,926 7,175 6,485 6,117 6,361 Hong Kong ................................................. 1,086 657 764 827 1,274 Rest of Asia-Pacific .................................... 1,520 1,285 1,356 1,137 1,305 North America ............................................ 22,330 14,855 9,024 6,644 7,035 Latin America ............................................. 3,528 3,515 2,649 2,211 1,806
36,390 27,487 20,278 16,936 17,781
% % % % % Loan impairment allowances as a
percentage of risk elements on loans3 .... 70.8 75.5
71.6 71.2 74.1
1 Restated for 2004 to 2007 as a result of a reclassification from ‘Unimpaired loans contractually past due 90 days or more as to principal or interest’ to ‘Impaired’, in respect of an element of a credit card portfolio.
2 Classified as grades 6 and 7 in 2004 to 2007. 3 Ratio excludes trading loans classified as in default.

235
Liquidity and funding (Audited)
Liquidity risk is the risk that HSBC does not have sufficient financial resources to meet its obligations as they fall due, or will have to do so at an excessive cost. This risk arises from mismatches in the timing of cash flows. Funding risk (a form of liquidity risk) arises when the liquidity needed to fund illiquid asset positions cannot be obtained at the expected terms and when required.
The objective of HSBC’s liquidity and funding management framework is to ensure that all foreseeable funding commitments can be met when due, and that access to the wholesale markets is co-ordinated and cost-effective. To this end, HSBC maintains a diversified funding base comprising core retail and corporate customer deposits and institutional balances. This is augmented with wholesale funding and portfolios of highly liquid assets diversified by currency and maturity which are held to enable HSBC to respond quickly and smoothly to unforeseen liquidity requirements.
HSBC requires its operating entities to maintain strong liquidity positions and to manage the liquidity profiles of their assets, liabilities and commitments with the objective of ensuring that their cash flows are balanced appropriately and that all their anticipated obligations can be met when due.
HSBC adapts its liquidity and funding risk management framework in response to changes in the mix of business that it undertakes, and to changes in the nature of the markets in which it operates. HSBC has continuously monitored the impact of recent market events on the Group’s liquidity positions and has changed behavioural assumptions where justified. The impact of these recent market events is discussed more fully below. The liquidity and funding risk management framework will continue to evolve as the Group assimilates knowledge from the recent market events.
Policies and procedures (Audited)
The management of liquidity and funding is primarily undertaken locally in HSBC’s operating entities in compliance with practices and limits set by the Risk Management Meeting (‘RMM’). These limits vary according to the depth and liquidity of the market in which the entities operate. It is HSBC’s general policy that each banking entity should be self-sufficient when funding its own operations. Exceptions are permitted for certain short-term treasury requirements and start-up operations or branches which do not have access to local deposit
markets. These entities are funded from HSBC’s largest banking operations and within clearly defined internal and regulatory guidelines and limits. These limits place formal restrictions on the transfer of resources between HSBC entities and reflect the broad range of currencies, markets and time zones within which HSBC operates.
HSBC’s liquidity and funding management process includes:
• projecting cash flows by major currency under various stress scenarios and considering the level of liquid assets necessary in relation thereto;
• monitoring balance sheet liquidity and advances to deposits ratios against internal and regulatory requirements;
• maintaining a diverse range of funding sources with back-up facilities;
• managing the concentration and profile of debt maturities;
• managing contingent liquidity commitment exposures within pre-determined caps;
• maintaining debt financing plans;
• monitoring depositor concentration in order to avoid undue reliance on large individual depositors and ensure a satisfactory overall funding mix; and
• maintaining liquidity and funding contingency plans. These plans identify early indicators of stress conditions and describe actions to be taken in the event of difficulties arising from systemic or other crises, while minimising adverse long-term implications for the business.
Primary sources of funding (Audited)
Current accounts and savings deposits payable on demand or at short notice form a significant part of HSBC’s funding, and the Group places considerable importance on maintaining their stability. For deposits, stability depends upon preserving depositor confidence in HSBC’s capital strength and liquidity, and on competitive and transparent pricing.
HSBC also accesses professional markets in order to provide funding for non-banking subsidiaries that do not accept deposits, to maintain a presence in local money markets and to optimise the funding of asset maturities not naturally matched by core deposit funding. In aggregate, HSBC’s banking entities are liquidity providers to the interbank market, placing significantly more funds with other banks than they themselves borrow.

H S B C H O L D I N G S P L C
Report of the Directors: Risk (continued) Liquidity and funding > Primary sources of funding
236
The main operating subsidiary that does not accept deposits is HSBC Finance, which has historically funded itself principally by taking term funding in the professional markets and by securitising assets. At 31 December 2008,
US$111 billion (2007: US$142 billion) of HSBC Finance’s liabilities were drawn from professional markets, utilising a range of products, maturities and currencies.
Cash flows payable by HSBC under financial liabilities by remaining contractual maturities (Audited)
On demand US$m
Due within 3 months US$m
Due between 3 and 12 months US$m
Due between 1 and 5 years US$m
Due after 5 years US$m
At 31 December 2008 Deposits by banks ......................................................... 45,884 82,514 8,734 4,875 2,356 Customer accounts ........................................................ 698,187 332,207 69,721 34,537 5,798 Trading liabilities .......................................................... 247,652 – – – – Financial liabilities designated at fair value ................. 5,365 2,713 6,969 34,855 64,853 Derivatives .................................................................... 482,039 373 1,479 2,634 1,003 Debt securities in issue ................................................. 481 56,590 53,174 68,169 22,920 Subordinated liabilities ................................................. 92 686 1,646 9,718 41,701 Other financial liabilities .............................................. 19,474 26,180 5,473 1,472 1,022
1,499,174 501,263 147,196 156,260 139,653 Loan commitments ....................................................... 239,753 105,952 153,774 72,111 32,432
1,738,927 607,215 300,970 228,371 172,085
At 31 December 2007 Deposits by banks ......................................................... 42,793 78,429 11,445 4,208 5,199 Customer accounts ........................................................ 629,227 391,659 56,294 29,445 6,614 Trading liabilities .......................................................... 314,580 – – – – Financial liabilities designated at fair value ................. 11,730 2,083 8,286 43,147 68,726 Derivatives .................................................................... 181,009 113 873 1,663 613 Debt securities in issue ................................................. 635 90,718 59,626 109,054 38,782 Subordinated liabilities ................................................. 3 277 1,951 10,181 34,841 Other financial liabilities .............................................. 20,516 29,812 5,177 977 1,273
1,200,493 593,091 143,652 198,675 156,048 Loan commitments ....................................................... 312,146 155,142 155,565 113,072 28,532
1,512,639 748,233 299,217 311,747 184,580
The balances in the above table will not agree directly with the balances in the consolidated balance sheet as the table incorporates, on an undiscounted basis, all cash flows relating to principal and all future coupon payments (except for trading liabilities and trading derivatives). Also, loan commitments are generally not recognised on the balance sheet. Trading liabilities and trading derivatives have been included in the ‘On demand’ time bucket, and not by contractual maturity, because trading liabilities are typically held for short periods of time. The undiscounted cash flows payable under hedging derivative liabilities are classified according to their contractual maturity.
Cash flows payable in respect of customer accounts are primarily contractually repayable on demand or at short notice. However, in practice, short-term deposit balances remain stable as inflows and outflows broadly match and a significant portion of loan commitments expire without being drawn upon.
Advances to deposits ratio (Audited)
HSBC emphasises the importance of core current accounts and savings accounts as a source of funds to finance lending to customers, and discourages reliance on short-term professional funding. This is achieved by placing limits on Group banking entities which restrict their ability to increase loans and advances to customers without corresponding growth in current accounts and savings accounts. This measure is referred to as the ‘advances to deposits’ ratio.
Advances to deposits ratio limits are set by the RMM and monitored by Group Finance. The ratio describes loans and advances to customers as a percentage of the total of core customer current and savings accounts and term funding with a remaining term to maturity in excess of one year. Loans and advances to customers which are part of reverse repurchase arrangements, and where HSBC receives

237
securities which are deemed to be liquid, are excluded from the advances to deposits ratio, as are current accounts and savings accounts from customers deemed to be ‘non-core’. The definition of a non-core deposit includes a consideration of the size of the customer’s total deposit balances. Due to the distinction between core and non-core depositors, the Group’s measure of advances to deposits will be more restrictive than that which could be inferred from the published financial statements.
The three banking entities listed in the table below represented 70 per cent of HSBC’s total core deposits at 31 December 2008 (2007: 71 per cent). The table demonstrates that loans and advances to customers in HSBC’s principal banking entities are broadly financed by reliable and stable sources of funding. HSBC would meet any unexpected net cash outflows by selling securities and accessing additional funding sources such as interbank or collateralised lending markets. The Group also uses measures other than the advances to deposits ratio to manage liquidity risk, including the ratio of net liquid assets to customer liabilities and projected cash flow scenario analyses.
Ratio of net liquid assets to customer liabilities (Audited)
Net liquid assets are liquid assets less all funds maturing in the next 30 days from wholesale market sources and from customers who are deemed to be professional. For this purpose, HSBC defines liquid assets as cash balances, short-term interbank deposits and highly-rated debt securities available for immediate sale and for which a deep and liquid market exists. Contingent liquidity risk associated with committed loan facilities is not reflected in the ratios. The Group’s framework for monitoring this risk is outlined under ‘Contingent liquidity risk’ below.
Limits for the ratio of net liquid assets to customer liabilities are set for each bank operating entity, except for HSBC Finance. As HSBC Finance does not accept customer deposits, it is not appropriate to manage its liquidity using standard liquidity ratios. The liquidity and funding risk management framework of HSBC Finance is discussed below.
Ratios of net liquid assets to customer liabilities are provided in the following table, along with the US dollar equivalents of net liquid assets.
HSBC’s principal banking entities – the management of liquidity risk (Audited)
Advances to deposits ratios Ratio of net liquid assets
to customer liabilities Net liquid assets 2008 2007 2008 2007 2008 2007 % % % % US$bn US$bn HSBC Bank (UK operations)
Year-end ............................ 106.0 97.5 7.1 12.1 21.3 44.2 Maximum ......................... 106.7 101.7 14.1 21.5 52.5 80.6 Minimum .......................... 97.5 92.6 6.9 12.1 21.3 39.9 Average ............................. 101.5 97.1 10.0 15.6 35.8 52.4
The Hongkong and Shanghai Banking Corporation
Year-end ............................ 77.4 76.7 25.0 21.8 64.6 53.9 Maximum ......................... 82.9 82.2 25.0 24.1 64.6 56.9 Minimum .......................... 76.7 72.4 19.9 16.1 51.1 35.3 Average ............................. 80.6 76.4 21.9 20.8 56.5 48.2
HSBC Bank USA Year-end ............................ 103.7 114.9 31.5 15.8 27.4 17.1 Maximum ......................... 117.3 116.8 31.5 25.7 27.4 26.1 Minimum .......................... 103.7 107.0 15.8 15.8 17.1 17.1 Average ............................. 111.8 112.7 22.6 21.3 21.5 22.0
Total of HSBC’s other principal banking entities1
Year-end ............................ 85.2 88.4 26.5 21.0 83.5 66.1 Maximum ......................... 92.3 89.3 26.5 26.1 83.5 72.7 Minimum .......................... 82.7 86.2 19.4 21.0 66.1 58.8 Average ............................. 88.1 87.7 22.5 24.0 73.9 65.3
1 This comprises the Group’s other main banking subsidiaries and, as such, includes businesses spread across a range of locations, in many of which HSBC may require a higher ratio of net liquid assets to customer liabilities to reflect local market conditions.

H S B C H O L D I N G S P L C
Report of the Directors: Risk (continued) Liquidity and funding > Primary sources of funding / Contingent liquidity risk / Impact of market turmoil
238
Projected cash flow scenario analysis (Audited)
The Group uses a number of standard projected cash flow scenarios designed to model both Group-specific and market-wide liquidity crises, in which the rate and timing of deposit withdrawals and drawdowns on committed lending facilities are varied, and the ability to access interbank funding and term debt markets and to generate funds from asset portfolios is restricted. The scenarios are modelled by all Group banking entities and by HSBC Finance. The appropriateness of the assumptions under each scenario is regularly reviewed. In addition to the Group’s standard projected cash flow scenarios, individual entities are required to design their own scenarios tailored to reflect specific local market conditions, products and funding bases.
Limits for cumulative net cash flows under stress scenarios are set for each banking entity and for HSBC Finance. Both ratio and cash flow limits reflect the local market place, the diversity of funding sources available and the concentration risk from large depositors. Compliance with entity level limits is monitored centrally by Group Finance and reported regularly to the RMM.
HSBC Finance
As HSBC Finance does not accept customer deposits, it takes funding from the professional markets. HSBC Finance uses a range of measures to monitor funding risk, including projected cash flow scenario analysis and caps placed on the amount of unsecured term funding that can mature in any rolling three-month and rolling 12-month periods.
HSBC Finance also maintains access to committed sources of secured funding and has in place committed backstop lines for short-term refinancing CP programmes. At 31 December 2008, the maximum amounts of unsecured term funding maturing in any rolling three-month and rolling 12-month periods were US$6.0 billion and US$17.4 billion, respectively (2007: US$6.2 billion and US$17.7 billion). At 31 December 2008, HSBC Finance also had in place unused committed sources of secured funding for which eligible assets were held, of US$2.4 billion (2007: US$6.2 billion) and committed backstop lines from non-Group entities in support of CP programmes totalling US$7.3 billion (2007: US$9.3 billion).
Contingent liquidity risk (Audited)
In the normal course of business, Group entities provide customers with committed facilities, including committed backstop lines to conduit vehicles sponsored by the Group and standby facilities to corporate customers. These facilities increase the funding requirements of the Group when customers choose to raise drawdown levels over and above their normal utilisation rates. The liquidity risk consequences of increased levels of drawdown are analysed in the form of projected cash flows under different stress scenarios. The RMM also sets limits for non-cancellable contingent funding commitments by Group entity after due consideration of each entity’s ability to fund them. The limits are split according to the borrower, the liquidity of the underlying assets and the size of the committed line.
The Group’s contractual exposures at 31 December monitored under the contingent liquidity risk limit structure (Audited)
HSBC Bank HSBC Bank USA HSBC Bank Canada
The Hongkong and Shanghai Banking
Corporation 2008 2007 2008 2007 2008 2007 2008 2007 US$bn US$bn US$bn US$bn US$bn US$bn US$bn US$bn Conduits Client-originated assets1 .............
– total lines ............................. 5.6 11.0 11.2 9.5 0.3 0.7 – – – largest individual lines ........ 1.0 1.6 0.4 0.9 0.2 0.4 – –
HSBC-managed assets2 .............. 34.8 25.7 – – – – – – Other conduits3 ........................... – – 1.1 2.6 – 1.8 – –
Single-issuer liquidity facilities – five largest4 .......................... 6.0 10.0 5.0 5.9 1.5 1.1 1.0 1.3 – largest market sector5 .......... 7.3 11.7 3.5 4.2 2.4 1.5 1.7 2.3
1 These exposures relate to consolidated multi-seller conduits (see pages 174 to 176). These vehicles provide funding to Group customers by issuing debt secured by a diversified pool of customer-originated assets.
2 These exposures relate to consolidated securities investment conduits, primarily Solitaire and Mazarin (refer pages 178 to 179). These vehicles issue debt secured by ABSs which are managed by HSBC. Of the total contingent liquidity risk under this category, US$25.3 billion was already funded on-balance sheet at 31 December 2008 leaving a net contingent exposure of US$9.5 billion.
3 These exposures relate to third-party sponsored conduits (see page 187). 4 These figures represent the five largest committed liquidity facilities provided to customers other than those facilities to conduits. 5 These figures represent the total of all committed liquidity facilities provided to the largest market sector, other than those facilities to conduits.

239
In times of market stress, the Group may choose to provide non-contractual liquidity support to certain HSBC-sponsored vehicles or HSBC-promoted products. This support would only be provided after careful consideration of the potential funding requirement and the impact on the entity’s overall liquidity.
The impact of market turmoil on the Group’s liquidity risk position (Audited)
A significant aspect of the market turmoil continues to be its adverse effects on the liquidity and funding risk profile of the banking system.
At a systemic level, these may be characterised as follows:
• interbank funding costs increased as banks became reluctant to lend to each other beyond the very short-term;
• many asset classes previously considered to be liquid became illiquid;
• the ability of many market participants to issue either unsecured or secured debt has been restricted, although this has been partly mitigated following the introduction by some governments and central banks of term debt guarantee schemes; and
• special purpose entities with investments linked to US sub-prime mortgages, or to ABSs where the underlying credit exposures were not fully transparent, found it increasingly difficult to raise wholesale funding.
In general terms, the strains arising from the credit crisis were concentrated in the wholesale market. The retail market, the market from which HSBC derives its core current and savings accounts, (the importance of which as a source of funding for the Group is discussed under ‘Advances to deposits ratio’ above) was relatively unaffected. The Group’s limited dependence on wholesale markets for funding has been a significant competitive advantage to HSBC through the recent period of dislocation in the financial markets.
HSBC’s customer deposit base has grown between 30 June 2007, the reporting date closest to the onset of the market turmoil, and 31 December 2008 by US$134 billion. This growth in US dollar equivalent terms has been diluted by the significant strengthening of US dollar against other major currencies between these two reporting dates, and therefore under represents the growth in customer deposits on an underlying currency basis. As a net provider of funds to the interbank market, the Group
has not been significantly affected by the scarcity of interbank funding.
A number of central banks and governments have taken action to alleviate the effects of the market turmoil, these actions have included making available government guaranteed term funding facilities. In the US, bank issuance under such programmes became normal market practice during 2008. To date, only HSBC’s US based operations have participated in government guaranteed term debt issuance schemes. At 31 December 2008, US$2.65 billion had been issued by HSBC USA, Inc. under the Federal Deposit Insurance Corporation Temporary Liquidity Guarantee Programme.
The deterioration of the US sub-prime credit market has reduced the availability of term financing to entities with exposures to the US sub-prime market. However, HSBC Finance, by virtue of its position within the Group, continued to enjoy committed financing facilities, albeit at a lower level, and access to commercial paper markets at interest rates below interbank rates. Through planned balance sheet reductions, the issuance of cost effective retail debt, capital infusions from the HSBC Group, and the utilisation of alternative sources of funding, including funding from other members of the HSBC Group, HSBC Finance was able to eliminate the need to issue institutional term debt in 2008. Funding plans are in place to enable HSBC Finance to deal with continued stress in the credit markets. As part of these plans, asset portfolios totalling US$15.3 billion were transferred from HSBC Finance to HSBC Bank USA in January 2009, resulting in US$8.0 billion of net funding benefit to HSBC Finance.
HSBC Finance is eligible to participate in the US Federal Reserve’s Commercial Paper Funding Facility (CPFF), a new scheme aimed at providing support to US issuers in the commercial paper market. At 31 December 2008, HSBC Finance had issued US$520 million under the CPFF and is eligible to issue a maximum of US$12.0 billion prior to 30 October 2009, the current expiry date for the scheme.
The effect of the market turmoil on liquidity and funding elsewhere in HSBC was largely restricted to the Group’s activities that historically depended upon the asset-backed commercial paper markets for funding, specifically SIVs and conduits, and certain money market funds. This is discussed in detail on page 174.

H S B C H O L D I N G S P L C
Report of the Directors: Risk (continued) Liquidity and funding > HSBC Holdings // Market risk > Sensitivity / VAR
240
HSBC Holdings (Audited)
HSBC Holdings’ primary sources of cash are interest and capital receipts from its subsidiaries, which it deploys in short-term bank deposits. HSBC Holdings’ primary uses of cash are investments in subsidiaries, interest payments to debt holders and dividend payments to shareholders. On an ongoing basis, HSBC Holdings replenishes its liquid resources through the receipt of interest on, and repayment of, intra-group loans, from dividends paid by subsidiaries and from interest earned on its own liquid funds.
HSBC Holdings is also subject to contingent liquidity risk by virtue of loan commitments and guarantees given. Such commitments are only provided after due consideration of HSBC Holdings’ ability to finance these commitments and the likelihood of the need arising.
HSBC Holdings actively manages the cash flows from its subsidiaries to optimise the amount of cash held at the holding company level, and expects to continue doing so in the future. The ability of its subsidiaries to pay dividends or advance monies to HSBC Holdings depends on, among other things, their respective regulatory capital requirements, statutory reserves, and financial and operating performance. The wide range of HSBC’s activities means that HSBC Holdings is not dependent on a single source of profits to fund its dividend payments to shareholders. HSBC Holdings believes that, with its accumulated liquid assets, planned dividends and interest from subsidiaries it will be able to meet anticipated cash obligations. Also, during 2008 HSBC Holdings continued to have full access to capital markets at market rates and issued US$8.8 billion of capital instruments (2007: US$4.4 billion).
Cash flows payable by HSBC Holdings under financial liabilities by remaining contractual maturities (Audited)
On demand
Due within 3 months
Due between 3 and 12 months
Due between 1 and 5 years
Due after 5 years
US$m US$m US$m US$m US$m At 31 December 2008 Amounts owed to HSBC undertakings ................... – 133 539 3,590 – Financial liabilities designated at fair value ............ – 587 1,762 5,977 25,571 Derivatives ............................................................... 1,324 – – – – Subordinated liabilities ............................................ – 235 706 3,764 32,214 Other financial liabilities ......................................... – 1,805 – – –
1,324 2,760 3,007 13,331 57,785 Loan commitments .................................................. 3,241 – – – –
4,565 2,760 3,007 13,331 57,785
At 31 December 2007 Amounts owed to HSBC undertakings ................... – 109 1,801 1,192 – Financial liabilities designated at fair value ............ – 258 776 8,152 28,639 Derivatives ............................................................... 44 – – – – Subordinated liabilities ............................................ – 160 482 2,568 23,069 Other financial liabilities ......................................... – 1,398 – – –
44 1,925 3,059 11,912 51,708 Loan commitments .................................................. 3,638 – – – –
3,682 1,925 3,059 11,912 51,708
The balances in the above table will not agree directly with the balances in the balance sheet of HSBC Holdings as the table incorporates, on an undiscounted basis, all cash flows relating to principal and all future coupon payments (except for trading derivatives).
Also, loan commitments are generally not recognised on the balance sheet. Trading derivatives
are included in the ‘On demand’ time bucket, and not by contractual maturity, because trading derivatives are typically held for short periods of time. The undiscounted cash flows on hedging derivative liabilities are classified according to their contractual maturity.

241
Market risk (Audited)
The objective of HSBC’s market risk management is to manage and control market risk exposures in order to optimise return on risk while maintaining a market profile consistent with the Group’s status as one of the world’s largest banking and financial services organisations.
Market risk is the risk that movements in market risk factors, including foreign exchange rates and commodity prices, interest rates, credit spreads and equity prices will reduce HSBC’s income or the value of its portfolios.
HSBC separates exposures to market risk into trading and non-trading portfolios. Trading portfolios include those positions arising from market-making, proprietary position-taking and other marked-to-market positions so designated.
Non-trading portfolios include positions that arise from the interest rate management of HSBC’s retail and commercial banking assets and liabilities, financial investments designated as available for sale and held to maturity, and exposures arising from HSBC’s insurance operations.
Market risk arising in HSBC’s insurance businesses is discussed in ‘Risk management of insurance operations’ on pages 255 to 274.
The management of market risk is principally undertaken in Global Markets using risk limits approved by the GMB. Limits are set for portfolios, products and risk types, with market liquidity being a principal factor in determining the level of limits set. Traded Credit and Market Risk, an independent unit within Group Management Office, develops the Group’s market risk management policies and measurement techniques. Each major operating entity has an independent market risk management and control function which is responsible for measuring market risk exposures in accordance with the policies defined by Traded Credit and Market Risk, and monitoring and reporting these exposures against the prescribed limits on a daily basis.
Each operating entity is required to assess the market risks which arise on each product in its business and to transfer these risks to either its local Global Markets unit for management, or to separate books managed under the supervision of the local Asset and Liability Management Committee (‘ALCO’). The aim is to ensure that all market risks are consolidated within operations which have the necessary skills, tools, management and governance to manage such risks professionally. In certain cases where the market risks cannot be adequately
captured by the transfer process, simulation modelling is used to identify the impact of varying scenarios on valuations and net interest income.
HSBC uses a range of tools to monitor and limit market risk exposures. These include sensitivity analysis, value at risk (‘VAR’) and stress testing.
Sensitivity analysis
Sensitivity measures are used to monitor the market risk positions within each risk type, for example, present value of a basis point movement in interest rates, for interest rate risk. Sensitivity limits are set for portfolios, products and risk types, with the depth of the market being one of the principal factors in determining the level of limits set.
Value at risk (Audited)
VAR is a technique that estimates the potential losses that could occur on risk positions as a result of movements in market rates and prices over a specified time horizon and to a given level of confidence.
The VAR models used by HSBC are based predominantly on historical simulation. These models derive plausible future scenarios from past series of recorded market rates and prices, taking account of inter-relationships between different markets and rates such as interest rates and foreign exchange rates. The models also incorporate the effect of option features on the underlying exposures.
The historical simulation models used by HSBC incorporate the following features:
• potential market movements are calculated with reference to data from the past two years;
• historical market rates and prices are calculated with reference to foreign exchange rates and commodity prices, interest rates, equity prices and the associated volatilities; and
• VAR is calculated to a 99 per cent confidence level and for a one-day holding period.
HSBC routinely validates the accuracy of its VAR models by back-testing the actual daily profit and loss results, adjusted to remove non-modelled items such as fees and commissions, against the corresponding VAR numbers. Statistically, HSBC would expect to see losses in excess of VAR only 1 per cent of the time over a one-year period. The actual number of excesses over this period can therefore be used to gauge how well the models are performing.

H S B C H O L D I N G S P L C
Report of the Directors: Risk (continued) Market risk > Impact of market turmoil > VAR
242
Although a valuable guide to risk, VAR should always be viewed in the context of its limitations. For example:
• the use of historical data as a proxy for estimating future events may not encompass all potential events, particularly those which are extreme in nature;
• the use of a one-day holding period assumes that all positions can be liquidated or the risk offset in one day. This may not fully reflect the market risk arising at times of severe illiquidity, when a one-day holding period may be insufficient to liquidate or hedge all positions fully;
• the use of a 99 per cent confidence level, by definition, does not take into account losses that might occur beyond this level of confidence;
• VAR is calculated on the basis of exposures outstanding at the close of business and therefore does not necessarily reflect intra-day exposures; and
• VAR is unlikely to reflect loss potential on exposures that only arise under significant market moves.
Stress testing
In recognition of the limitations of VAR, HSBC augments it with stress testing to evaluate the potential impact on portfolio values of more extreme, although plausible, events or movements in a set of financial variables.
Stress testing is performed at a portfolio level, as well as on the consolidated positions of the Group, and covers the following scenarios:
• sensitivity scenarios, which consider the impact of market moves to any single risk factor or a set of factors. For example the impact resulting from a break of a currency peg that is unlikely to be captured within the VAR models;
• technical scenarios, which consider the largest move in each risk factor, without consideration of any underlying market correlation;
• hypothetical scenarios, which consider potential macro economic events; and
• historical scenarios, which incorporate historical observations of market moves during previous periods of stress which would not be captured within VAR.
Stress testing is governed by the ‘Stress Testing Review Group’ forum that coordinates the Group stress testing scenarios in conjunction with the
regional risk managers. Consideration is given to the actual market risk exposures, along with market events in determining the stress scenarios.
Stress testing results are reported to senior management and provide them with an assessment of the financial impact such events would have on the profit of HSBC. The daily losses experienced during 2008 were within the stress loss scenarios reported to senior management.
The following table provides an overview of the reporting of risks within this section:
Portfolio Trading Non-trading Risk type Foreign exchange ............... VAR VAR1
Interest rate ......................... VAR VAR2
Commodity ........................ VAR N/A Equity ................................. VAR Sensitivity Credit spread ...................... Sensitivity Sensitivity3
1 The structural foreign exchange risk is monitored using sensitivity analysis. See page 429.
2 The interest rate risk on the fixed-rate securities issued by HSBC Holdings is not included in the Group VAR. The management of this risk is described on page 249.
3 Credit spread VAR is reported for the credit derivatives transacted by Global Banking. See page 244.
The impact of market turmoil on market risk (Audited)
The years preceding the current market turmoil were characterised by historically low levels of volatility, with ample market liquidity. This period was associated with falling levels of VAR as the level of observed market volatility is a key determinant in the VAR calculation. As a consequence HSBC reduced the overall VAR limit to reflect the lower level of volatility, and associated VAR.
The tightening of both credit and liquidity within the wholesale markets observed during the latter half of 2007 led to an increase in market volatility, most noticeably in the credit spreads of financial institutions and ABSs/MBSs.
Credit spread volatility continued to increase during the first half of 2008, and as the effect of the market turmoil on the wider economy became more apparent, there was a larger increase in the volatility in other risk types, such as interest rates. Coupled with positions taken in anticipation of rate reductions, the increase in volatility led to an increase in the total VAR in early 2008.
Volatility across all asset classes continued to increase in the second half of 2008, as central banks coordinated a series of rate cuts, in an attempt to stimulate demand within the global economy. Although the increase in volatility led to a further

243
increase in total VAR during the second half of 2008, the overall impact was limited as a result of managing down the market risk exposures during this period (see ‘Value at risk of the trading and non-trading portfolios’ below).
Although the overall VAR limit for the Group was increased towards the end of 2008, as a result of the increased market volatility, the limit remained within the level set in early 2007.
Value at risk of the trading and non-trading portfolios
The VAR, both trading and non-trading, for the Group was as follows:
Value at risk (Audited) 2008 2007 US$m US$m
At 31 December ................. 191.2 70.1 Average .............................. 158.9 65.3 Minimum ........................... 59.8 43.8 Maximum ........................... 287.1 98.1
As a result of improvements in the Group VAR data collection process during 2008, all entities within the Group are now aggregated on a historical simulation basis, reflecting the full diversification effects across the Group’s VAR. The 2007 VAR has been adjusted, reducing the total VAR by US$25.2 million as at 31 December 2007. The maximum, minimum and average VARs have also been adjusted on a comparable basis in order to fairly present the trend.
The daily VAR, both trading and non-trading, for the Group was as follows:
Daily VAR (trading and non-trading) (US$m) (Unaudited)
0
50
100
150
200
250
300
350
Dec-06 Jun-07 Dec-07 Jun-08 Dec-08
USDm
The major contributor to the trading and non-trading VAR for the Group was Global Markets.
The histogram to the right illustrates the frequency of daily revenue arising from Global Markets’ trading, balance sheet management and other trading activities.
The average daily revenue earned in 2008 was US$21.7 million, compared with US$18.7 million in 2007. The standard deviation of these daily revenues was US$53.4 million compared with US$25.3 million in 2007. The standard deviation measures the variation of daily revenues about the mean value of those revenues.
An analysis of the frequency distribution of daily revenue shows that there were 66 days with negative revenue during 2008 compared with 35 days in 2007. The most frequent result was a daily revenue of between US$40 million and US$50 million with 28 occurrences, compared with between US$20 million and US$30 million with 71 occurrences in 2007.
Daily distribution of Global Markets’ trading, balance sheet management and other trading revenues1 (Unaudited)
2008 Number of days
20 1 1 1 1
01
4 53
2 2
5 68
9
15
20
2526 26
28
19
11 11
57
9
1
4
1 10
5
10
15
20
25
30
-180-170-160-150-140-130-120-110-100 -90 -80 -70 -60 -50 -40 -30 -20 -10 0 10 20 30 40 50 60 70 80 90 100 110 120 130 140 150
Profit and loss frequency
2007 Number of days
1 0 0 2 1 1 03 3
915
37
51
71
37
149
2 0 2 10
10
20
30
40
50
60
70
80
-110 -100 -90 -80 -70 -60 -50 -40 -30 -20 -10 0 10 20 30 40 50 60 70 80 130 140 150
Profit and loss frequency
1 The effect of any month-end adjustments, not attributable to a specific daily market move, is spread evenly over the days in the month in question.
For a description of HSBC’s fair value and price verification controls, see page 163.

H S B C H O L D I N G S P L C
Report of the Directors: Risk (continued) Market risk > Trading portfolios / Non-trading portfolios
244
Trading portfolios (Audited)
HSBC’s control of market risk is based on a policy of restricting individual operations to trading within a list of permissible instruments authorised for each site by Traded Credit and Market Risk, of enforcing rigorous new product approval procedures, and of restricting trading in the more complex derivative
products only to offices with appropriate levels of product expertise and robust control systems.
Market making and proprietary position taking is undertaken within Global Markets. The VAR for such trading activity at 31 December 2008 was US$72.5 million (2007: US$30.2 million). This is analysed below by risk type:
VAR by risk type for the trading activities (excluding Credit Spread VAR) (Audited)
Foreign exchange and commodity
Interest rate Equity Total1
US$m US$m US$m US$m
At 31 December 2008 .................................................. 29.8 63.4 13.9 72.5 At 31 December 20072 .................................................. 10.7 25.4 10.2 30.2
Average 2008 .......................................................................... 19.0 50.7 15.2 53.1 20072 ......................................................................... 9.5 22.9 7.9 23.7
Minimum 2008 .......................................................................... 8.7 21.4 8.2 22.6 20072 ......................................................................... 4.0 14.9 3.4 14.3
Maximum 2008 .......................................................................... 54.9 147.4 39.0 104.4 20072 ......................................................................... 23.0 36.1 15.1 38.8
1 The total VAR is non-additive across risk types due to diversification effects. 2 The VAR for 2007 has been adjusted on the same basis as Group VAR on page 243.
Credit spread risk
The risk associated with movements in credit spreads is primarily managed through sensitivity limits, stress testing, and VAR for those portfolios where VAR is calculated.
The Group is introducing credit spread as a separate risk type within the VAR models. At 31 December 2008, credit spread VAR was calculated for the London trading and New York credit derivatives portfolios. At that date, the total VAR for the trading activities, including credit spread VAR for the above portfolios, was US$106.4 million (2007: US$43.8 million) compared with a total VAR of US$72.5 million reported within the ‘VAR by risk type for the trading activities’ (see above), which excludes the credit spread VAR for these two portfolios.
The sensitivity of trading income to the effect of movements in credit spreads on the total trading activities of the Group was US$590.9 million at 31 December 2008 (2007: US$95.4 million). This sensitivity captures the credit spread exposure arising from positions taken throughout the Group, in addition to the London trading and New York credit derivative portfolios captured within credit spread VAR (see above). The sensitivity was calculated using simplified assumptions based on one-day movements in average market credit spreads
over a two-year period at a confidence level of 99 per cent, and assumes a simultaneous movement in credit spreads across issuers. It should be noted that diversification effects within the portfolio and with other risk types is likely to lead to a reduced impact on trading income.
The significant increase in the sensitivity at 31 December 2008, compared with 31 December 2007, was due to the effect of much higher volatility in credit spreads observed during 2008, in part reflecting increased market illiquidity. The actual positions within the trading portfolios exposed to credit spread risk were lower on 31 December 2008 than on 31 December 2007.
In addition to the above measure certain portfolios are also managed using default risk measures where appropriate.
The measurement of the credit spread impact on trading income as at 31 December 2008 excludes those positions that were reclassified as non-trading during the second half of 2008 following the amendment to IFRS. These positions are included within the 31 December 2007 comparative, as the reclassification took effect from 1 July 2008.
Credit spread risk also arises on credit derivative transactions entered into by Global Banking in order to manage the risk concentrations within the

245
corporate loan portfolio and so enhance capital efficiency. The mark-to-market of these transactions is taken through the income statement.
At 31 December 2008, the credit spread VAR on the credit derivatives transactions entered into by Global Banking was US$23.0 million (2007: US$19.7 million). The VAR shows the effect on trading income from a one-day movement in credit spreads over a two-year period, calculated to a 99 per cent confidence level.
Gap risk
Certain transactions are structured such that the risk to HSBC is negligible under a wide range of market conditions or events, but in which there exists a remote probability that a significant gap event could lead to loss. A gap event could be seen as a change in market price from one level to another with no trading opportunity in between, and where the price change breaches the threshold beyond which the risk profile changes from having no open risk to having full exposure to the underlying structure. Such movements may occur, for example, when there are adverse news announcements and the market for a specific investment becomes illiquid, making hedging impossible.
Given the characteristics of these transactions, they will make little or no contribution to VAR or to traditional market risk sensitivity measures. HSBC captures the risks for such transactions within its stress testing scenarios. Gap risk arising is monitored on an ongoing basis, and HSBC incurred no gap losses arising from movements in the underlying market price on such transactions in 2008.
ABSs/MBSs positions
The ABSs/MBSs exposures within the trading portfolios are managed within sensitivity and VAR limits, as described on page 241, and are included within the stress testing scenarios as described on page 242.
Non-trading portfolios (Audited)
The principal objective of market risk management of non-trading portfolios is to optimise net interest income.
Interest rate risk in non-trading portfolios arises principally from mismatches between the future yield on assets and their funding cost, as a result of interest rate changes. Analysis of this risk is complicated by having to make assumptions on embedded optionality within certain product areas such as the incidence of mortgage prepayments,
and from behavioural assumptions regarding the economic duration of liabilities which are contractually repayable on demand such as current accounts. The prospective change in future net interest income from non-trading portfolios will be reflected in the current realisable value of these positions, should they be sold or closed prior to maturity. In order to manage this risk optimally, market risk in non-trading portfolios is transferred to Global Markets or to separate books managed under the supervision of the local ALCO.
The transfer of market risk to books managed by Global Markets or supervised by ALCO is usually achieved by a series of internal deals between the business units and these books. When the behavioural characteristics of a product differ from its contractual characteristics, the behavioural characteristics are assessed to determine the true underlying interest rate risk. Local ALCOs are required to regularly monitor all such behavioural assumptions and interest rate risk positions to ensure they comply with interest rate risk limits established by GMB.
In certain cases, the non-linear characteristics of products cannot be adequately captured by the risk transfer process. For example, both the flow from customer deposit accounts to alternative investment products and the precise prepayment speeds of mortgages will vary at different interest rate levels, and where expectations about future moves in interest rates change. In such circumstances, simulation modelling is used to identify the impact of varying scenarios on valuations and net interest income.
Once market risk has been consolidated in Global Markets or ALCO-managed books, the net exposure is typically managed through the use of interest rate swaps within agreed limits. The VAR for these portfolios is included within the Group VAR (see ‘Value at risk of the trading and non-trading portfolios’ above).
Credit spread risk
At 31 December 2008, the sensitivity of equity to the effect of movements in credit spreads on the Group’s available-for-sale debt securities was US$1,092 million (2007: US$206 million). The sensitivity was calculated on the same basis as applied to the trading portfolio. Including the gross exposure for the SICs consolidated within HSBC’s balance sheet at 31 December 2008, the sensitivity increased to US$1,145 million. This sensitivity is struck, however, before taking account of any losses which would be absorbed by the capital note holders.

H S B C H O L D I N G S P L C
Report of the Directors: Risk (continued) Market risk > Non-trading portfolios / DBS / Sensitivity of NII
246
At 31 December 2008, the capital note holders would have absorbed the first US$2.2 billion (2007: US$2.3 billion) of any losses incurred by the SICs prior to HSBC incurring any equity losses.
The notable increase in this sensitivity at 31 December 2008, compared with 31 December 2007, was again due to the effect of higher volatility in credit spreads observed during 2008. The overall credit spread positions within the available-for-sale portfolios were lower on 31 December 2008 compared with 31 December 2007.
Equity securities classified as available for sale (Audited)
Market risk arises on equity securities held as available for sale. The fair value of these securities at 31 December 2008 was US$6.8 billion (2007: US$12.6 billion) and included private equity holdings of US$2.5 billion (2007: US$3.2 billion). Investments in private equity are primarily made through managed funds that are subject to limits on the amount of investment. Potential new commitments are subject to risk appraisal to ensure that industry and geographical concentrations remain within acceptable levels for the portfolio as a whole. Regular reviews are performed to substantiate the valuation of the investments within the portfolio. Funds typically invested for short-term cash management represented US$0.9 billion (2007: US$3.1 billion). Investments held to facilitate ongoing business, such as holdings in government-sponsored enterprises and local stock exchanges, represented US$1.0 billion (2007: US$1.7 billion). Other strategic investments represented US$2.4 billion (2007: US$4.6 billion). The fair value of the constituents of equity securities classified as available for sale can fluctuate considerably. A 10 per cent reduction in the value of the available-for-sale equities at 31 December 2008 would have reduced equity by US$0.7 billion (2007: US$1.3 billion). For details of the impairment incurred on available-for-sale equity securities see ‘Accounting policies’ on page 350.
US$1.0 billion of the reduction in the AFS Equities relates to funds that were consolidated within the Groups balance sheet as at 31 December 2008.
Defined benefit pension schemes (Audited)
Market risk also arises within HSBC’s defined benefit pension schemes to the extent that the obligations of the schemes are not fully matched by assets with determinable cash flows. Pension scheme
obligations fluctuate with changes in long-term interest rates, inflation, salary increases and the longevity of scheme members. Pension scheme assets will include equities and debt securities, the cash flows of which change as equity prices and interest rates vary. There are risks that market movements in equity prices and interest rates could result in asset valuations which, taken together with regular ongoing contributions, are insufficient over time to cover the level of projected obligations and these, in turn, could increase with a rise in inflation and members living longer. Management, together with the trustees who act on behalf of the pension scheme beneficiaries, assess these risks using reports prepared by independent external actuaries and take action and, where appropriate, adjust investment strategies and contribution levels accordingly. For example, in order to mitigate the risk of adverse movements in investments, interest rates and inflation, the Trustee of the HSBC Bank (UK) Pension Scheme has continued to implement a programme of initiatives proposed by HSBC, including reducing the equity content of the investment strategy, increasing the diversification of the scheme’s assets, and entering into long-term interest rate and inflation swaps.
The present value of HSBC’s defined benefit pension plans’ obligations was US$24.0 billion at 31 December 2008, compared with US$32.4 billion at 31 December 2007. Assets of the defined benefit schemes at 31 December 2008 comprised equity investments, 20 per cent (2007: 26 per cent); debt securities, 68 per cent (2007: 62 per cent); and other (including property), 12 per cent (2007: 12 per cent) (see Note 8 on the Financial Statements).
Increased corporate bond yields in the UK in 2008 have resulted in an increase of 110 basis points in the real discount rate (net of the increase in expected inflation) used to value the accrued benefits payable under the HSBC Bank (UK) Pension Scheme, the Group’s largest plan. The resulting decrease in the liabilities of the scheme has been largely offset by a reduction in the fair values of the plan assets of the scheme. As a consequence, the deficit on the HSBC Bank (UK) Pension Scheme has decreased to US$392 million from US$808 million.
Sensitivity of net interest income (Unaudited)
A principal part of HSBC’s management of market risk in non-trading portfolios is to monitor the sensitivity of projected net interest income under varying interest rate scenarios (simulation modelling). HSBC aims, through its management of

247
market risk in non-trading portfolios, to mitigate the effect of prospective interest rate movements which could reduce future net interest income, while balancing the cost of such hedging activities on the current net revenue stream.
For simulation modelling, businesses use a combination of scenarios relevant to local businesses and local markets and standard scenarios which are required throughout HSBC. The standard scenarios are consolidated to illustrate the combined pro forma effect on HSBC’s consolidated portfolio valuations and net interest income.
The table below sets out the effect on future net interest income of an incremental 25 basis points parallel fall or rise in all yield curves worldwide at
the beginning of each quarter during the 12 months from 1 January 2009. Assuming no management actions, a series of such rises would decrease planned net interest income for 2009 by US$463 million (2008: US$503 million), while a series of such falls would decrease planned net interest income by US$284 million (2008: increase US$525 million). These figures incorporate the effect of any option features in the underlying exposures.
Instead of assuming that all interest rates move together, HSBC groups its interest rate exposures into currency blocs whose rates are considered likely to move together. The sensitivity of projected net interest income, on this basis, is as follows:
Sensitivity of projected net interest income (Unaudited)
US dollar bloc US$m
Rest of Americas bloc US$m
Hong Kong dollar bloc US$m
Rest of Asia bloc US$m
Sterling bloc US$m
Euro bloc US$m
Total US$m
Change in 2009 projected net interest income arising from a shift in yield curves of:
+25 basis points at the beginning of each quarter ..... (243) 42 (45) 100 28 (345) (463)
–25 basis points at the beginning of each quarter ..... 41 (42) (285) (114) (235) 351 (284)
Change in 2008 projected net
interest income arising from a shift in yield curves of:
+25 basis points at the beginning of each quarter ..... (275) 96 9 77 (140) (270) (503)
–25 basis points at the beginning of each quarter ..... 272 (95) 11 (65) 142 260 525
The interest rate sensitivities set out in the table above are illustrative only and are based on simplified scenarios.
The figures represent the effect of the pro forma movements in net interest income based on the projected yield curve scenarios and the Group’s current interest rate risk profile. This effect, however, does not incorporate actions that would be taken by Global Markets or in the business units to mitigate the impact of this interest rate risk. In reality, Global Markets seeks proactively to change the interest rate risk profile to minimise losses and optimise net revenues. The projections above also assume that interest rates of all maturities move by the same amount and, therefore, do not reflect the potential impact on net interest income of some rates changing while others remain unchanged. The projections take account of the effect on net interest income of anticipated differences in changes
between interbank interest rates and interest rates linked to other bases (such as Central Bank rates or product rates over which the entity has discretion in terms of the timing and extent of rate changes). The projections make other simplifying assumptions too, including that all positions run to maturity.
HSBC’s exposure to the effect of movements in interest rates on its net interest income arises in two main areas: core deposit franchises and Global Markets.
• Core deposit franchises: these are exposed to changes in the cost of deposits raised and spreads on wholesale funds. In a low interest rate environment, the net interest income benefit of core deposits increases as interest rates rise and decreases as interest rates fall. This risk is asymmetrical in a very low interest rate environment, however, as there is limited room

H S B C H O L D I N G S P L C
Report of the Directors: Risk (continued) Market risk > Sensitivity of NII / Structural FX expenses / HSBC Holdings
248
to lower deposit pricing in the event of interest rate reductions.
• Residual interest rate risk is managed within Global Markets, under the Group’s policy of transferring interest rate risk to Global Markets to be managed within defined limits and with flexibility as to the instruments used.
The main drivers of the year on year movements in the sensitivity of the Group’s net interest income to the changes in interest rates tabulated above were:
• decreases in interest rates, particularly in US dollar, Hong Kong dollar and Sterling which have restricted the Group’s ability to pass on to depositors further rate reductions thereby increasing exposures to further rate falls; and
• Global Markets increased net trading asset positions, particularly in euro. The funding of
net trading assets is generally sourced from floating rate retail deposits and recorded in ‘Net interest income’ whereas the income from such assets is recorded in ‘Net trading income’.
Projecting the movement in net interest income from prospective changes in interest rates is a complex interaction of structural and managed exposures.
HSBC monitors the sensitivity of reported reserves to interest rate movements on a monthly basis by assessing the expected reduction in valuation of available-for-sale portfolios and cash flow hedges due to parallel movements of plus or minus 100 basis points in all yield curves. The table below describes the sensitivity of HSBC’s reported reserves to these movements at the end of 2008 and 2007 and the maximum and minimum month-end figures during these years:
Sensitivity of reported reserves to interest rate movements (Unaudited)
US$m
Maximum impact US$m
Minimum impact US$m
At 31 December 2008
+ 100 basis point parallel move in all yield curves ......................................... (2,740) (2,740) (1,737)As a percentage of total shareholders’ equity ................................................. (2.9%) (2.9%) (1.9%)
– 100 basis point parallel move in all yield curves ......................................... 2,477 2,609 1,944 As a percentage of total shareholders’ equity ................................................. 2.6% 2.8% 2.1% At 31 December 2007
+ 100 basis point parallel move in all yield curves ......................................... (1,737) (1,738) (1,519)As a percentage of total shareholders’ equity ................................................. (1.4%) (1.4%) (1.2%)
– 100 basis point parallel move in all yield curves ......................................... 1,977 2,048 1,430 As a percentage of total shareholders’ equity ................................................. 1.5% 1.6% 1.1%
The sensitivities are illustrative only and are based on simplified scenarios. The table shows the potential sensitivity of reserves to valuation changes in available-for-sale portfolios and from cash flow hedges following the pro forma movements in interest rates. These particular exposures form only a part of the Group’s overall interest rate exposures. The accounting treatment under IFRSs of the Group’s remaining interest rate exposures, while economically largely offsetting the exposures shown in the above table, does not require revaluation movements to go to reserves.
Structural foreign exchange exposures (Unaudited)
Structural foreign exchange exposures represent net investments in subsidiaries, branches or associates, the functional currencies of which are currencies other than the US dollar.
Exchange differences on structural exposures are recorded in the consolidated statement of recognised income and expense. The main operating (or functional) currencies in which HSBC’s business is transacted are the US dollar, the Hong Kong dollar, pound sterling, the euro, the Mexican peso, the Brazilian real and the Chinese renminbi. As the US dollar and currencies linked to it form the dominant currency bloc in which HSBC’s operations transact business, HSBC Holdings prepares its consolidated financial statements in US dollars. HSBC’s consolidated balance sheet is, therefore, affected by exchange differences between the US dollar and all the non-US dollar functional currencies of underlying subsidiaries.
HSBC hedges structural foreign exchange exposures only in limited circumstances. HSBC’s structural foreign exchange exposures are managed

249
with the primary objective of ensuring, where practical, that HSBC’s consolidated capital ratios and the capital ratios of individual banking subsidiaries are largely protected from the effect of changes in exchange rates. This is usually achieved by ensuring that, for each subsidiary bank, the ratio of structural exposures in a given currency to risk-weighted assets denominated in that currency is broadly equal to the capital ratio of the subsidiary in question.
The Group’s capital ratios were affected by the strengthening US dollar in the latter part of 2008. The effect on the Group’s consolidated tier 1 and total ratios is estimated to have been a reduction of approximately 40 basis points and approximately 50 basis points respectively. These movements were within approved tolerance levels.
HSBC may also transact hedges where a currency in which it has structural exposures is considered to be significantly overvalued and it is possible in practice to transact a hedge. Selective hedges were in place during 2007 and 2008. Hedging is undertaken using forward foreign exchange contracts which are accounted for under IFRSs as hedges of a net investment in a foreign operation, or by financing with borrowings in the same currencies as the functional currencies involved. There was no ineffectiveness arising from these hedges in the year ended 31 December 2008.
HSBC Holdings (Audited)
As a financial services holding company, HSBC Holdings has limited market risk activity. Its activities predominantly involve maintaining sufficient capital resources to support the Group’s diverse activities; allocating these capital resources across the Group’s businesses; earning dividend and interest income on its investments in the Group’s businesses; providing dividend payments to HSBC Holding’s equity shareholders and interest payments to providers of debt capital; and maintaining a supply of short-term cash resources. It does not take proprietary trading positions.
The main market risks to which HSBC Holdings is exposed are interest rate risk and foreign currency risk. Exposure to these risks arises from short-term cash balances, funding positions held, loans to subsidiaries, investments in long-term financial assets and financial liabilities including debt capital issued. The objective of HSBC Holding’s market risk management strategy is to reduce exposure to these risks and minimise volatility in reported income, cash flows and distributable reserves. Market risk for HSBC
Holdings is monitored by its Structural Positions Review Group.
A number of cross currency interest rate swaps entered into as part of HSBC Holdings’ management of interest rate risk arising on certain long-term debt capital issues do not qualify for hedge accounting treatment. Changes in the market values of these swaps are taken directly to the income statement. HSBC Holdings expects that these swaps will be held to final maturity with the accumulated changes in market value consequently trending to zero.
Certain loans to subsidiaries of a capital nature that are not denominated in the functional currency of either the provider or the recipient are accounted for as financial assets. Changes in the carrying amount of these assets due to exchange differences are taken directly to the income statement. These loans, and the associated foreign exchange exposures, are eliminated on a Group consolidated basis.
The principal tools used in the management of market risk are the projected sensitivity of HSBC Holdings’ net interest income to future changes in yield curves and interest rate gap re-pricing tables for interest rate risk, and VAR for foreign exchange rate risk.
Net interest income sensitivity
HSBC Holdings monitors net interest income sensitivity over a 5-year time horizon reflecting the longer-term perspective on interest rate risk management appropriate to a financial services holding company. The table below sets out the effect on HSBC Holdings’ future net interest income over a 5-year time horizon of an incremental 25 basis point parallel fall or rise in all yield curves worldwide at the beginning of each quarter during the 12 months from 1 January 2009.
Assuming no management action, a series of such rises would decrease HSBC Holdings’ planned net interest income for 2009 by US$60 million (2008: decrease of US$23 million) and decrease cumulative net interest income by US$554 million over a 5-year period from 1 January 2009 (2008: decrease of US$104 million), while a series of such falls would increase planned net interest income by US$60 million (2008: increase of US$23 million) and increase cumulative net interest income by US$554 million over a 5-year period from 1 January 2009 (2008: increase of US$104 million). These figures incorporate the impact of any option features in the underlying exposures.

H S B C H O L D I N G S P L C
Report of the Directors: Risk (continued) Market risk > HSBC Holdings > Interest repricing gap / VAR
250
Instead of assuming that all interest rates move together, HSBC groups its interest rate exposures into currency blocs whose interest rates are
considered likely to move together. The sensitivity of projected net interest income, on this basis, is described as follows:
Sensitivity of HSBC Holdings’ net interest income to interest rate movements (Unaudited) US dollar
bloc Sterling
bloc Euro bloc
Total
US$m US$m US$m US$m
Change in 2009 projected net interest income arising from a shift in yield curves of:
+ 25 basis points at the beginning of each quarter in 2009
0-1 year (81) 10 11 (60)2-3 years (351) 20 77 (254)4-5 years (358) 54 64 (240)
– 25 basis points at the beginning of each quarter in 2009
0-1 year 81 (10) (11) 60 2-3 years 351 (20) (77) 254 4-5 years 358 (54) (64) 240
Change in 2008 projected net interest income arising
from a shift in yield curves of:
+ 25 basis points at the beginning of each quarter in 2008
0-1 year (51) 16 12 (23)2-3 years (180) 69 83 (28)4-5 years (200) 69 78 (53)
– 25 basis points at the beginning of each quarter in 2008
0-1 year 51 (16) (12) 23 2-3 years 180 (69) (83) 28 4-5 years 200 (69) (78) 53
HSBC Holdings’ principal exposure to changes
in its net interest income from movements in interest rates arises on short-term cash balances, floating rate loans advanced to subsidiaries and fixed rate debt capital securities in issue which have been swapped to floating rate.
The interest rate sensitivities tabulated above are illustrative only and are based on simplified scenarios. The figures represent the effect of pro forma movements in net interest income based on the projected yield curve scenarios, HSBC Holdings’ current interest rate risk profile and assumed changes to that profile during the next five years. Changes to assumptions concerning the risk profile over the next five years can have a significant impact on the net interest income sensitivity for that period. The figures do not take into account the effect of actions that could be taken to mitigate this interest rate risk, however.
The projected increase in HSBC Holdings’ sensitivity to moves in interest rates is mainly due to new interest-bearing capital issues, the funds from which have been largely invested in non-interest bearing equity investments in subsidiaries.
Interest repricing gap table
The interest rate repricing gap table below analyses the full term structure of interest rate mismatches within HSBC Holdings’ balance sheet. The year on year increase in the negative net interest rate gap in the up to 1 year time bucket is due to an increase in non-interest bearing equity investments in subsidiaries which has been funded by new issues of interest bearing liabilities and by the capitalisation of interest bearing loans to subsidiaries.

251
Repricing gap analysis of HSBC Holdings (Audited)
Total Up to 1 year 1-5 years 5-10 years
More than 10 years
Non- interest bearing
US$m US$m US$m US$m US$m US$m At 31 December 2008 Cash at bank and in hand:
– balances with HSBC undertakings ............ 443 443 – – – – Derivatives .......................................................... 3,682 – – – – 3,682 Loans and advances to HSBC undertakings ...... 11,804 8,995 511 – 1,222 1,076 Financial investments ......................................... 2,629 – – 300 1,885 444 Investments in subsidiaries ................................. 81,993 1,459 1,094 – 875 78,565 Other assets ......................................................... 131 – – – – 131
Total assets .......................................................... 100,682 10,897 1,605 300 3,982 83,898 Amounts owed to HSBC undertakings .............. (4,042) (3,389) – – – (653)Financial liabilities designated at fair values ..... (16,389) (4,210) (4,410) (5,290) (3,448) 969 Derivatives .......................................................... (1,324) – – – – (1,324)Other liabilities ................................................... (1,816) – – – – (1,816)Subordinated liabilities ....................................... (14,017) (1,500) (2,187) (2,962) (7,152) (216)Total equity ......................................................... (62,587) – – – (3,650) (58,937)Other non-interest bearing liabilities .................. (507) – – – – (507)
Total liabilities and equity .................................. (100,682) (9,099) (6,597) (8,252) (14,250) (62,484)
Off-balance sheet items attracting interest rate sensitivity ........................................................ – (12,353) 4,410 5,046 3,760 (863)
Net interest rate risk gap ..................................... – (10,555) (582) (2,906) (6,508) 20,551
Cumulative interest rate gap ............................... – (10,555) (11,137) (14,043) (20,551) – At 31 December 2007 Total assets .......................................................... 92,948 19,136 – – 2,774 71,038 Total liabilities .................................................... (92,948) (6,597) (6,546) (8,755) (8,864) (62,186)
Off-balance sheet items attracting interest rate sensitivity ........................................................ – (13,619) 4,313 7,752 3,804 (2,250)
Net interest rate risk gap ..................................... – (1,080) (2,233) (1,003) (2,286) 6,602
Cumulative interest rate gap ............................... – (1,080) (3,313) (4,316) (6,602) –
As part of the continuous enhancement and development of HSBC’s management tools, the net interest income sensitivity projection over a 5-year horizon and the interest rate repricing table shown above have replaced the VAR analysis disclosed in the 2007 Annual Report and Accounts as the principal measures used to monitor interest rate risk for HSBC Holdings. These enhanced reports are considered to be more suitable risk management measures for the longer term profile of a bank holding company balance sheet.
Value at risk
Total foreign exchange VAR arising within HSBC Holdings in 2008 and 2007 was as follows:
HSBC Holdings – value at risk (Audited)
Foreign exchange 2008
US$m 2007
US$m
At 31 December ............................. 55.2 29.1 Average .......................................... 40.3 29.4 Minimum ....................................... 29.2 27.6 Maximum ....................................... 56.1 30.9
The foreign exchange risk largely arises from loans to subsidiaries of a capital nature that are not denominated in the functional currency of either the provider or the recipient and which are accounted for as financial assets. Changes in the carrying amount of these loans due to foreign exchange rate differences are taken directly to the income statement. These loans, and the associated foreign exchange exposures, are eliminated on a Group consolidated basis.

H S B C H O L D I N G S P L C
Report of the Directors: Risk (continued) Residual value risk > Operational risk > Legal risk // Pension risk
252
Residual value risk (Unaudited)
A significant part of a lessor’s return from operating leases is dependent upon its management of residual value risk. This arises from operating lease transactions to the extent that the values recovered from disposing of leased assets or re-letting them at the end of the lease terms (the ‘residual values’) differ from those projected at the inception of the leases. The business regularly monitors residual value exposure by reviewing the recoverability of the residual value projected at lease inception. This entails considering the potential of re-letting of operating lease assets and their projected disposal proceeds at the end of their lease terms. Provision is made to the extent that the carrying values of leased assets are impaired through residual values not being fully recoverable.
The net book value of equipment leased to customers on operating leases by the Group includes projected residual values at the end of current lease terms, to be recovered through re-letting or disposal in the following periods:
Residual values (Unaudited)
2008 2007 US$m US$m
Within 1 year ........................... 108 155 Between 1-2 years .................... 59 243 Between 2-5 years .................... 530 713 More than 5 years .................... 1,549 1,892
Total exposure ......................... 2,246 3,003
Operational risk (Unaudited)
Operational risk is the risk of loss arising through fraud, unauthorised activities, error, omission, inefficiency, systems failure or from external events. It is inherent to every business organisation and covers a wide spectrum of issues. The terms ‘error’, ‘omission’ and ‘inefficiency’ include process failures, systems/machine failures and human error.
The objective of HSBC’s operational risk management is to manage and control operational risk in a cost effective manner within targeted levels of operational risk consistent with the Group’s risk appetite, as defined by the Group Management Board.
A formal governance structure provides oversight over the management of operational risk. A Global Operational Risk and Control Committee, which reports to the Risk Management Meeting, meets quarterly to discuss key risk issues and review
the effective implementation of the Group’s operational risk management framework.
In each of HSBC’s subsidiaries, business managers are responsible for maintaining an acceptable level of internal control, commensurate with the scale and nature of operations. They are responsible for identifying and assessing risks, designing controls and monitoring the effectiveness of these controls. The operational risk management framework helps managers to fulfil these responsibilities by defining a standard risk assessment methodology and providing a tool for the systematic reporting of operational loss data.
A centralised database is used to record the results of the operational risk management process. Operational risk self-assessments are input and maintained by the business unit. To ensure that operational risk losses are consistently reported and monitored at Group level, all Group companies are required to report individual losses when the net loss is expected to exceed US$10,000.
Further details of the HSBC approach to Operational Risk Management can be found in the Capital and Risk Management Interim Pillar 3 Disclosures 2008.
Legal risk (Unaudited)
Each operating company is required to implement procedures to manage legal risk that conform to HSBC standards. Legal risk falls within the definition of operational risk and includes contractual risk, dispute risk, legislative risk and non-contractual rights risk.
• Contractual risk is the risk that the rights and/or obligations of an HSBC company within a contractual relationship are defective.
• Dispute risk is the risk that an HSBC company is subject to when it is involved in or managing a potential or actual dispute.
• Legislative risk is the risk that an HSBC company fails to adhere to the laws of the jurisdictions in which it operates.
• Non-contractual rights risk is the risk that an HSBC company’s assets are not properly owned or are infringed by others, or an HSBC company infringes another party’s rights.
HSBC has a global legal function to assist management in controlling legal risk. The function provides legal advice and support in managing claims against HSBC companies, as well as in respect of non-routine debt recoveries or other

253
litigation against third parties.
The GMO legal department oversees the global legal function and is headed by a Group General Manager who reports to the Group Chairman. There are legal departments in 54 of the countries in which HSBC operates. There are also regional legal functions in each of Europe, North America, Latin America, the Middle East, and Asia-Pacific.
Operating companies must notify the appropriate legal department immediately any litigation is either threatened or commenced against HSBC or an employee. The appropriate regional legal department must be immediately advised (and must in turn immediately advise the GMO legal department) of any action by a regulatory authority, where the proceedings are criminal, or where the claim might materially affect the Group’s reputation. Further, any claims which exceed US$1.5 million or equivalent must also be advised to the appropriate regional legal department and the regional legal department must immediately advise the GMO legal department if any such claim exceeds US$5 million. All such matters are then reported to the Risk Management Meeting of the Group Management Board in a monthly paper.
An exception report must be made to the local compliance function and escalated to the Head of Group Compliance in respect of any breach which has given rise to a fine and/or costs levied by a court of law or regulatory body where the amount is US$1,500 or more, and material or significant issues are reported to the Risk Management Meeting of GMB and/or the Group Audit Committee.
In addition, operating companies are required to submit quarterly returns detailing outstanding claims where the claim (or group of similar claims) exceeds US$10 million, where the action is by a regulatory authority, where the proceedings are criminal, where the claim might materially affect the Group’s reputation, or, where the GMO legal department has requested returns be completed for a particular claim. These returns are used for reporting to the Group Audit Committee and the Board of HSBC Holdings, and disclosure in the Interim Report and Annual Report and Accounts, if appropriate.
Global security and fraud risk (Unaudited)
Security and fraud risk issues are managed at Group level by Global Security and Fraud Risk. This unit, which has responsibility for physical, fraud, information and contingency risk, and security and business intelligence, is fully integrated within the central GMO Risk function. This facilitates
synergies between it and other risk functions, such as with Global Retail Risk Management in the selection, design and implementation of systems and processes to protect the Group against fraud by deterring fraudulent activity, detecting it where it does occur and mitigating its effects.
Pension risk (Unaudited)
HSBC operates a number of pension plans throughout the world, as described in Note 8 on the Financial Statements. Some of these pension plans are defined benefit plans, of which the largest is the HSBC Bank (UK) Pension Scheme.
In order to fund these benefits, sponsoring group companies (and in some instances, employees) make regular contributions in accordance with advice from actuaries and in consultation with the scheme’s Trustees (where relevant). The defined benefit plans invest these contributions in a range of investments designed to meet their long-term liabilities.
The level of these contributions has a direct impact on the cash flow of the Group and would normally be set to ensure that there are sufficient funds to meet the cost of the accruing benefits for the future service of active members. However, higher contributions will be required when plan assets are considered insufficient to cover the existing pension liabilities as a deficit exists. Contribution rates are typically revised annually or triennially, depending on the plan. The agreed contributions to the HSBC Bank (UK) Pension Scheme are revised triennially.
A deficit in a defined benefit plan may arise from a number of factors, including:
• investments delivering a return below that required to provide the projected plan benefits. This could arise, for example, when there is a fall in the market value of equities, or when increases in long-term interest rates cause a fall in the value of fixed income securities held;
• the prevailing economic environment leading to corporate failures, thus triggering write-downs in asset (both equity and debt) values;
• a change in either interest rates or inflation which causes an increase in the value of the scheme liabilities; and
• scheme members living longer than expected (known as longevity risk).
The plan’s investment strategy is determined in the light of the market risk inherent in the investments and the consequential impact on potential future contributions.
H S B C H O L D I N G S P L C
Report of the Directors: Risk (continued) Pension risk / Reputational risk / Sustainability risk / Insurance operations > Life business
254
Ultimate responsibility for investment strategy rests with either the Trustees or, in certain circumstances, a Management Committee. The degree of independence of the Trustees from HSBC differs in different jurisdictions. For example, the HSBC Bank (UK) Pension Scheme, which accounts for approximately 63 per cent of the obligations of the Group’s defined benefit pension plans, is overseen by a corporate Trustee. This scheme’s Trustee regularly monitors the market risks inherent in the scheme.
Reputational risk (Unaudited)
The safeguarding of HSBC’s reputation is of paramount importance to its continued prosperity and is the responsibility of every member of staff. HSBC regularly reviews its policies and procedures for safeguarding against reputational and operational risks. This is an evolutionary process which takes account of relevant developments and industry guidance such as The Association of British Insurers’ guidance on best practice when responding to environmental, social and governance (‘ESG’) risks.
HSBC has always aspired to the highest standards of conduct and, as a matter of routine, takes account of reputational risks to its business. Reputational risks can arise from a wide variety of causes, including ESG issues and operational risk events. As a banking group, HSBC’s good reputation depends upon the way in which it conducts its business, but it can also be affected by the way in which clients, to whom it provides financial services, conduct themselves. The training of Directors on appointment includes reputational matters.
A Group Reputational Risk Committee (‘GRRC’) has been established at which relevant Group functions with responsibility for activities and functions which attract reputational risk are represented. The primary role of the GRRC is to consider areas and activities presenting significant reputational risk and, where appropriate, to make recommendations to the Risk Management Meeting and GMB for policy or procedural changes to mitigate such risk.
Standards on all major aspects of business are set for HSBC and for individual subsidiaries, businesses and functions. Reputational risks, including ESG matters, are considered and assessed by the Board, GMB, the Risk Management Meeting, subsidiary company boards, board committees and senior management during the formulation of policy and the establishment of HSBC standards. These
policies, which form an integral part of the internal control system (see page 299), are communicated through manuals and statements of policy and are promulgated through internal communications and training. The policies cover ESG issues and set out operational procedures in all areas of reputational risk, including money laundering deterrence, counter-terrorist financing environmental impact, anti-corruption measures and employee relations. The policy manuals address risk issues in detail and co-operation between GMO departments and businesses is required to ensure a strong adherence to HSBC’s risk management system and its sustainability practices.
Sustainability risk (Unaudited)
Sustainability risks arise from the provision of financial services to companies or projects which run counter to the needs of sustainable development; in effect this risk arises when the environmental and social effects outweigh economic benefits. Within Group Management Office, a separate function, Group Corporate Sustainability, is mandated to manage these risks globally working through local offices as appropriate. Its risk management responsibilities include:
• formulating sustainability risk policies. This includes oversight of HSBC’s sustainability risk standards, management of the Equator Principles for project finance lending, and sector-based sustainability policies covering those sectors with high environmental, ethical or social impacts (forestry, freshwater infrastructure, chemicals, energy, mining and metals, and defence-related lending); undertaking an independent review of transactions where sustainability risks are assessed to be high, and supporting HSBC’s operating companies to assess similar risks of a lower magnitude;
• building and implementing systems-based processes to ensure consistent application of policies, reduce the costs of sustainability risk reviews and capture management information to measure and report on the effect of HSBC’s lending and investment activities on sustainable development; and
• providing training and capacity building within HSBC’s operating companies to ensure sustainability risks are identified and mitigated on a consistent basis and to either HSBC’s own standards, or international standards or local regulations, whichever is the higher.

255
Risk management of insurance operations (Audited)
HSBC operates a bancassurance model which provides insurance products for customers with whom the Group has a banking relationship. Insurance products are sold to all customer groups, mainly utilising retail branches, the internet and phone centres. Personal Financial Services customers attract the majority of sales and comprise the majority of policyholders. HSBC offers its customers a wide range of insurance and investment products, many of which complement other bank and consumer finance products.
Many of these insurance products are manufactured by HSBC subsidiaries. The Group underwrites the insurance risk and retains the risks and rewards associated with writing insurance contracts, retaining both the underwriting profit and the commission paid by the manufacturer to the bank distribution channel within the Group. HSBC’s exposure to risks associated with manufacturing insurance contracts in its subsidiaries and its management of these risks are discussed below.
Where the Group considers it operationally more effective, third parties are engaged to manufacture insurance products for sale through HSBC’s banking network. The Group works with a limited number of market-leading partners to provide the products. These arrangements earn HSBC a commission.
HSBC’s bancassurance business operates in all five of the Group’s geographical regions with over 30 legal entities, the majority of which are subsidiaries of banking legal entities, manufacturing insurance products. Management of these insurance manufacturers set their own control procedures in addition to complying with guidelines issued by the Group Insurance Head Office. This is headed by HSBC’s Managing Director of Insurance, supported by a Chief Operating Officer, Chief Financial Officer and Chief Risk Officer, the latter appointed in 2008. The role of Group Insurance Head Office includes setting the control framework for monitoring and measuring insurance risk in line with Group practices, and drawing up insurance-specific policies and guidelines for inclusion in the Group Instruction Manuals. The control framework for monitoring risk includes the Group Insurance Risk Committee, which oversees the status of the significant risk categories in the insurance
operations. Four sub-committees report to the Committee, focusing on market and liquidity risk, credit risk, operational and insurance risk. The processes and controls employed to monitor each risk are described under their respective headings below.
The main contracts manufactured by HSBC are as follows:
Life insurance business (Audited)
Life insurance contracts with discretionary participation features (‘DPF’) allow policyholders to participate in the profits generated from such business, which may take the form of annual bonuses and a final bonus, in addition to providing cover on death. Certain minimum return levels are also guaranteed. The largest portfolio is in Hong Kong.
Credit life insurance business is written to underpin banking and finance products. The policy pays a claim if the holder of the loan is unable to make repayments due to early death or unemployment.
Annuities are contracts providing regular payments of income from capital investment for either a fixed period or during the annuitant’s lifetime. Payments to the annuitant either begin on inception of the policy (immediate annuities) or at a designated future date (deferred annuities).
Term assurance and critical illness policies provide cover in the event of death (term assurance) and serious illness.
Linked life insurance contracts pay benefits to policyholders which are typically determined by reference to the value of the investments supporting the policies.
Investment contracts with DPF allow policyholders to participate in the profits generated by such business. The largest portfolio is written in France. Policyholders are guaranteed to receive a return on their investment plus any discretionary bonuses. In addition, certain minimum return levels are guaranteed.
Unit-linked investment contracts are those where the principal benefit payable is the value of assigned assets.
Other investment contracts include pension contracts written in Hong Kong.

H S B C H O L D I N G S P L C
Report of the Directors: Risk (continued) Insurance operations > Non-life / Insurance risk
256
Non-life insurance business (Audited)
Non-life insurance contracts include motor, fire and other damage to property, accident and health, repayment protection and commercial insurances.
Motor insurance business covers vehicle damage and liability for personal injury. For fire and other damage to property, the main focus in most markets is providing individuals with home and contents insurance, with cover for selected commercial customers largely written in Asia and Latin America.
A very limited portfolio of liability business is written, other than that included in the motor book.
Credit non-life insurance is concentrated in North America and Europe, and is originated in conjunction with the provision of loans. Payment protection insurance (‘PPI’) products were suspended in the UK pending a final report from the Competition Commission on their provision by the financial services industry. The report was issued in early 2009. The business is in the process of assessing the impact of the reported findings on credit protection products in the UK.
Given the nature of the contracts written by the Group, the risks to which HSBC’s insurance operations are exposed fall into two principal categories: insurance risk and financial risk. The following section describes the nature and extent of these risks and HSBC’s approach to managing them. The majority of the risk in the insurance business derives from manufacturing activities.
Insurance risk (Audited)
Insurance risk is a risk, other than financial risk, transferred from the holder of a contract to the issuer, in this case HSBC. The principal insurance risk faced by HSBC is that, over time, the combined cost of claims, administration and acquisition of the contract may exceed the aggregate amount of premiums received and investment income. The cost of a claim can be influenced by many factors, including mortality and morbidity experience, lapse and surrender rates and, if the policy has a savings element, the performance of the assets held to support the liabilities. Performance of the underlying assets is affected by changes in both interest rates and equity prices (see page 263).
HSBC’s insurance risk appetite is proposed by local businesses and authorised centrally. The Group manages its exposure to insurance risk by applying formal underwriting, reinsurance and claims-
handling procedures designed to ensure compliance with regulations. This is supplemented with stress testing.
Insurance contracts sold by HSBC relate, in the main, to core underlying banking activities, such as savings and investment products, and credit life products. The Group’s manufacturing focuses on personal lines, i.e. contracts written for individuals, which tend to be of higher volume and lower individual value than commercial lines. They thus contribute to diversifying insurance risk.
Life and non-life business insurance risks are controlled by high-level policies and procedures set centrally, supplemented as appropriate with measures which take account of specific local market conditions and regulatory requirements. For example, manufacturing entities are required to obtain authorisation from Group Insurance Head Office to write certain classes of business, with restrictions applying to commercial and liability non-life insurance, in particular.
Local ALCOs and Risk Management Committees are required to monitor certain risk exposures, mainly for life business where the focus is on reviewing the risks associated with the duration and cash flow matching of insurance assets and liabilities.
Reinsurance is also used as a means of mitigating exposure, in particular to aggregations of catastrophe risk. Specific examples are as follows:
• Accident and health insurance. Potential exposure to concentrations of claims arising from isolated events, such as earthquakes or a pandemic, are mitigated by the purchase of catastrophe reinsurance.
• Motor insurance. Reinsurance protection is arranged to avoid excessive exposure to larger losses, particularly from personal injury claims.
• Fire and other damage to property. Portfolios at risk from catastrophic losses are protected by reinsurance in accordance with information obtained from professional risk-modelling organisations.
Although reinsurance provides a means of managing insurance risk, such contracts expose the Group to counterparty risk, the risk of default by the reinsurer (see page 267).
The following tables provide an analysis of HSBC’s insurance risk exposures by geographical region and by type of business. By definition, HSBC is not exposed to insurance risk on investment

257
contracts, so they are not included in the insurance risk management analysis.
Life business tends to be longer-term in nature than non-life business and frequently involves an element of savings and investment in the contract. Accordingly, separate tables are provided for life and non-life businesses, reflecting their distinctive risk characteristics. The life insurance risk table provides an analysis of insurance liabilities as the best
available overall measure of insurance exposure, because provisions for life contracts are typically set by reference to expected future cash outflows relating to the underlying policies. The table for non life business uses written premiums as the best available measure of risk exposure because policies are typically priced by reference to the risk being underwritten.
Analysis of life insurance risk – liabilities to policyholders (Audited)
Europe Hong Kong
Rest of Asia- Pacific
North America
Latin America Total
US$m US$m US$m US$m US$m US$m At 31 December 2008 Life (non-linked)
Insurance contracts with DPF1 ....................... 1,015 11,213 216 – – 12,444 Credit life ........................................................ 252 – – 65 – 317 Annuities ........................................................ 379 – 28 805 1,363 2,575 Term assurance and other long-term
contracts ..................................................... 1,316 107 99 136 376 2,034
Total life (non-linked) ........................................ 2,962 11,320 343 1,006 1,739 17,370
Life (linked) ........................................................ 1,548 2,276 310 – 1,933 6,067
Investment contracts with DPF1,2 ....................... 17,732 – 34 – – 17,766
Insurance liabilities to policyholders .................. 22,242 13,596 687 1,006 3,672 41,203 At 31 December 2007 Life (non-linked) Insurance contracts with DPF1 ........................... 940 8,489 231 – – 9,660
Credit life ........................................................ 235 – – 82 – 317 Annuities ........................................................ 413 – 28 1,154 1,532 3,127 Term assurance and other long-term
contracts ..................................................... 675 74 85 125 307 1,266
Total life (non-linked) ........................................ 2,263 8,563 344 1,361 1,839 14,370
Life (linked) ........................................................ 1,720 2,019 467 – 2,193 6,399
Investment contracts with DPF1,2 ....................... 18,954 – 29 – – 18,983
Insurance liabilities to policyholders .................. 22,937 10,582 840 1,361 4,032 39,752
1 Insurance contracts and investment contracts with discretionary participation features (‘DPF’) can give policyholders the contractual right to receive, as a supplement to their guaranteed benefits, additional benefits that may be a significant portion of the total contractual benefits, but whose amount and timing is determined by HSBC. These additional benefits are contractually based on the performance of a specified pool of contracts or assets, or the profit of the company issuing the contracts.
2 Although investment contracts with DPF are financial investments, HSBC continues to account for them as insurance contracts as permitted by IFRS 4.
(Audited)
The above table of liabilities to life insurance policyholders highlights that the most significant products are investment contracts with DPF issued in France, insurance contracts with DPF issued in Hong Kong and unit-linked contracts issued in Hong Kong, Latin America and Europe.
The liabilities for long-term contracts are set by reference to a range of assumptions which include lapse and surrender rates, mortality and expense levels. These assumptions typically reflect each
entity’s own experience. Economic assumptions, such as investment returns and interest rates, are usually based on market observable data. Changes in underlying assumptions affect the liabilities. The sensitivity of profit after tax and shareholders’ equity to changes in both economic and non-economic assumptions are considered below.
Insurance risk arising from life insurance depends on the type of business, and varies considerably. The principal risks are mortality, morbidity, lapse, surrender and expense levels.

H S B C H O L D I N G S P L C
Report of the Directors: Risk (continued) Insurance operations > Insurance risk
258
The main contracts which generate exposure to mortality and morbidity risks are term assurance contracts and annuities. These risks are monitored on a regular basis, and are primarily mitigated by medical underwriting and by retaining the ability in certain cases to amend premiums in the light of experience. The risk associated with lapses and surrenders is generally mitigated by the application
of surrender charges, though other management actions, such as managing the level of bonus payments to policyholders, may be taken. Expense risk is generally managed through pricing. The level of expenses in the contract will be one of the factors considered when setting premiums rates.
Analysis of non-life insurance risk – net written insurance premiums1
(Audited)
Europe Hong Kong
Rest of Asia- Pacific
North America
Latin America Total
US$m US$m US$m US$m US$m US$m 2008 Accident and health ............................................ 14 155 5 3 27 204 Motor .................................................................. 350 15 14 – 273 652 Fire and other damage ........................................ 150 26 3 4 22 205 Liability ............................................................... – 14 4 – 34 52 Credit (non-life) .................................................. 99 – – 144 – 243 Marine, aviation and transport ............................ – 11 4 – 24 39 Other non-life insurance contracts ..................... 49 28 – 15 29 121
Total net written insurance premiums ................ 662 249 30 166 409 1,516
Net insurance claims incurred and movement in liabilities to policyholders ........................... (553) (121) (13) (98) (176) (961)
2007 Accident and health ............................................ 27 132 5 – 25 189 Motor .................................................................. 369 15 10 – 224 618 Fire and other damage ........................................ 178 23 7 2 19 229 Liability ............................................................... – 12 3 8 34 57 Credit (non-life) .................................................. 76 – – 157 – 233 Marine, aviation and transport ............................ – 12 4 – 18 34 Other non-life insurance contracts ..................... 30 24 – 30 24 108
Total net written insurance premiums ................ 680 218 29 197 344 1,468
Net insurance claims incurred and movement in liabilities to policyholders ........................... (598) (90) (10) (79) (151) (928)
2006 Accident and health ............................................ 26 97 5 – 10 138 Motor .................................................................. 185 15 13 – 157 370 Fire and other damage ........................................ 221 22 5 2 9 259 Liability ............................................................... 1 13 2 8 24 48 Credit (non-life) .................................................. 264 – – 173 – 437 Marine, aviation and transport ............................ 1 11 3 – 12 27 Other non-life insurance contracts ..................... 13 24 – 37 20 94
Total net written insurance premiums ................ 711 182 28 220 232 1,373
Net insurance claims incurred and movement in liabilities to policyholders ........................... (451) (76) (11) (79) (111) (728)
1 Net written insurance premiums represent gross written premiums less gross written premiums ceded to reinsurers.
(Audited)
The above table of non-life net written insurance premiums provides an overall summary of the non-life insurance activity of the Group. Motor business is written predominantly in Europe and Latin America and represented the largest class of non-life business in 2008. Fire and other damage to property business is written in all major markets, most significantly in Europe. Credit non-life insurance, which is originated in conjunction with
the provision of loans, is concentrated in the US and Europe.
The main risks associated with non-life business are underwriting risk and claims experience risk. Underwriting risk is the risk that HSBC does not charge premiums appropriate to the cover provided and claims experience risk is the risk that portfolio experience is worse than expected. HSBC manages these risks through pricing (for example, imposing

259
restrictions and deductibles in the policy terms and conditions), product design, risk selection, claims handling, investment strategy and reinsurance policy. The majority of non-life insurance contracts are renewable annually and the underwriters have the right to refuse renewal or to change the terms and conditions of the contract at that time.
Balance sheet of insurance manufacturing subsidiaries by type of contract (Audited)
A principal tool used by HSBC to manage its exposure to insurance risk, in particular for life insurance contracts, is asset and liability matching. Models are used to assess the effect of a range of future scenarios on the values of financial assets and associated liabilities, and ALCOs employ the outcomes in determining how the assets and liabilities should be matched. The scenarios include stresses applied to factors which affect insurance risk such as mortality and lapse rates. Of particular importance is the need to match the expected pattern of cash inflows with the benefits payable on the underlying contracts, which can extend for many years. The table below shows the composition of assets and liabilities and demonstrates that there
were sufficient assets to cover the liabilities to policyholders at the end of 2008. It may not always be possible to achieve a complete matching of asset and liability durations, partly because there is uncertainty over policyholder behaviour, which introduces uncertainty over the receipt of all future premiums and the timing of claims, and partly because the duration of liabilities may exceed the duration of the longest available dated fixed interest investments. In an environment where interest rates and yield curves are falling, insurance operations are exposed to re-investment risk as higher yielding assets held in the portfolio mature and are replaced with lower yielding assets. Given the objective to hold rather than trade investments, the current portfolio of assets includes debt securities issued at a time when coupon rates were higher than those observed in the current market. As a result, the current yield of the debt securities exceeds that which may be obtained on current issues. Management action has been taken in relation to certain participating contracts to reduce short-term bonus rates paid to policyholders to manage the immediate strain on the business. Should interest rates and yield curves stay low for prolonged periods, further management actions may be needed.
Insurance contracts Investment contracts Contracts with DPF
Unit- linked
Annu- ities
Term assur- ance1
Non-life
Contracts with DPF2
Unit- linked
Other
Other assets3 Total
US$m US$m US$m US$m US$m US$m US$m US$m US$m US$m At 31 December 2008 Financial assets:
– trading assets .............. – – – – 35 – – – 4 39 – financial assets
designated at fair value .................... 959 4,738 457 496 52 4,597 5,525 1,481 1,970 20,275
– derivatives .................. 27 3 – 26 – 60 170 91 24 401 – financial investments . 9,383 – 1,282 399 860 12,482 – 1,482 2,576 28,464 – other financial assets .. 1,967 400 639 1,288 1,106 173 443 685 2,110 8,811
Total financial assets .......... 12,336 5,141 2,378 2,209 2,053 17,312 6,138 3,739 6,684 57,990 Reinsurance assets ............. 6 956 311 320 430 – 60 2,083 PVIF4 ................................. – – – – – – – – 2,033 2,033 Other assets and
investment properties .... 121 3 32 71 257 459 55 54 935 1,987
Total assets ......................... 12,463 6,100 2,721 2,600 2,740 17,771 6,193 3,793 9,712 64,093 Liabilities under investment
contracts designated at fair value ........................ – – – – – – 6,012 3,271 – 9,283
Liabilities under investment contracts carried at amortised cost ................ – – – – – – – 284 – 284
Liabilities under insurance contracts ........ 12,444 6,067 2,575 2,351 2,480 17,766 – – – 43,683
Deferred tax ....................... 8 7 22 30 1 1 – 3 515 587 Other liabilities .................. – – – – – – – – 2,679 2,679
Total liabilities ................... 12,452 6,074 2,597 2,381 2,481 17,767 6,012 3,558 3,194 56,516
Total equity ........................ – – – – – – – – 7,577 7,577
Total equity and liabilities5 12,452 6,074 2,597 2,381 2,481 17,767 6,012 3,558 10,771 64,093

H S B C H O L D I N G S P L C
Report of the Directors: Risk (continued) Insurance operations > Insurance risk
260
Insurance contracts Investment contracts Contracts with DPF
Unit- linked
Annu- ities
Term assur- ance1
Non-life
Contracts with DPF2
Unit- linked
Other
Other assets3 Total
US$m US$m US$m US$m US$m US$m US$m US$m US$m US$m At 31 December 2007 Financial assets:
– trading assets .............. – – 37 – 22 – – – 35 94 – financial assets
designated at fair value .................... 3,424 5,799 610 559 130 6,210 12,379 1,610 2,992 33,713
– derivatives .................. 2 52 – – 1 78 250 3 30 416 – financial investments . 4,518 – 1,265 328 1,071 12,305 – 1,526 2,939 23,952 – other financial assets .. 1,896 520 1,047 716 1,175 3 762 714 1,483 8,316
Total financial assets .......... 9,840 6,371 2,959 1,603 2,399 18,596 13,391 3,853 7,479 66,491 Reinsurance assets ............. 4 57 337 264 653 – – – 54 1,369 PVIF4 .................................. – – – – – – – – 1,965 1,965 Other assets and
investment properties .... 65 2 30 104 193
399 46 52 1,196 2,087
Total assets ......................... 9,909 6,430 3,326 1,971 3,245 18,995 13,437 3,905 10,694 71,912 Liabilities under investment
contracts designated at fair value ........................ – – – – – – 12,725 3,328 – 16,053
Liabilities under investment contracts carried at amortised cost ................ – – – – – – – 312 – 312
Liabilities under insurance contracts ........ 9,660 6,399 3,127 1,583 2,854
18,983 – – – 42,606
Deferred tax ....................... – 7 3 22 3 – 6 – 582 623 Other liabilities .................. – – – – – – – – 3,888 3,888
Total liabilities ................... 9,660 6,406 3,130 1,605 2,857 18,983 12,731 3,640 4,470 63,482
Total equity ........................ – – – – – – – – 8,430 8,430
Total equity and liabilities6 9,660 6,406 3,130 1,605 2,857 18,983 12,731 3,640 12,900 71,912
1 Term assurance includes credit life insurance. 2 Although investment contracts with DPF are financial investments, HSBC continues to account for them as insurance contracts as
permitted by IFRS 4. 3 Other assets comprise shareholder assets. 4 Present value of in-force long-term insurance contracts and investment contracts with DPF. 5 Does not include assets, liabilities and shareholders’ funds of associated insurance company, Ping An Insurance, or joint venture
insurance companies, Hana Life and Canara HSBC Oriental Bank of Commerce Life Insurance Company Limited. 6 Does not include assets, liabilities and shareholders’ funds of associated insurance company, Ping An Insurance.

261
The table below shows the composition of assets and liabilities by region and demonstrates that there
were sufficient assets to cover the liabilities to policyholders for each region at the end of 2008.
Balance sheet of insurance manufacturing subsidiaries by geographical region (Audited)
Europe Hong Kong
Rest of Asia- Pacific
North America
Latin America Total
US$m US$m US$m US$m US$m US$m At 31 December 2008 Financial assets:
– trading assets ............................................... – – – – 39 39 – financial assets designated at fair value ...... 12,605 4,153 581 – 2,936 20,275 – derivatives ................................................... 258 117 – – 26 401 – financial investments ................................... 14,240 10,689 91 2,040 1,404 28,464 – other financial assets ................................... 4,143 2,906 289 585 888 8,811
Total financial assets .......................................... 31,246 17,865 961 2,625 5,293 57,990
Reinsurance assets .............................................. 920 1,004 20 13 126 2,083 PVIF1 .................................................................. 845 905 81 – 202 2,033 Other assets and investment properties .............. 933 400 9 354 291 1,987
Total assets ......................................................... 33,944 20,174 1,071 2,992 5,912 64,093
Liabilities under investment contracts designated at fair value ................................... 5,310 3,895 78 – – 9,283
Liabilities under investment contracts carried at amortised cost ................................. – – – – 284 284
Liabilities under insurance contracts .................. 23,752 13,873 745 1,237 4,076 43,683 Deferred tax ........................................................ 304 161 19 – 103 587 Other liabilities ................................................... 2,184 190 42 11 252 2,679
Total liabilities .................................................... 31,550 18,119 884 1,248 4,715 56,516
Total equity ......................................................... 2,394 2,055 187 1,744 1,197 7,577
Total equity and liabilities2 ................................. 33,944 20,174 1,071 2,992 5,912 64,093 At 31 December 2007 Financial assets:
– trading assets ............................................... – – – – 94 94 – financial assets designated at fair value ...... 22,824 6,733 796 – 3,360 33,713 – derivatives ................................................... 410 5 – 1 – 416 – financial investments ................................... 13,805 6,251 78 2,425 1,393 23,952 – other financial assets ................................... 3,345 3,259 197 653 862 8,316
Total financial assets .......................................... 40,384 16,248 1,071 3,079 5,709 66,491
Reinsurance assets .............................................. 1,095 48 28 83 115 1,369 PVIF1 .................................................................. 892 810 65 – 198 1,965 Other assets and investment properties .............. 787 926 7 52 315 2,087
Total assets ......................................................... 43,158 18,032 1,171 3,214 6,337 71,912
Liabilities under investment contracts designated at fair value ................................... 11,720 4,285 48 – – 16,053
Liabilities under investment contracts carried at amortised cost ................................. – – – – 312 312
Liabilities under insurance contracts .................. 24,788 10,843 903 1,652 4,420 42,606 Deferred tax ........................................................ 371 143 12 – 97 623 Other liabilities ................................................... 3,392 193 28 18 257 3,888
Total liabilities .................................................... 40,271 15,464 991 1,670 5,086 63,482
Total equity ......................................................... 2,887 2,568 180 1,544 1,251 8,430
Total equity and liabilities3 ................................. 43,158 18,032 1,171 3,214 6,337 71,912
1 Present value of in-force long-term insurance contracts and investment contracts with DPF. 2 Does not include assets, liabilities and shareholders’ funds of associated insurance company, Ping An Insurance, or joint venture
insurance companies, Hana Life and Canara HSBC Oriental Bank of Commerce Life Insurance Company Limited. 3 Does not include assets, liabilities and shareholders’ funds of associated insurance company, Ping An Insurance.

H S B C H O L D I N G S P L C
Report of the Directors: Risk (continued) Insurance operations > Financial risks > Market risk
262
Financial risks (Audited)
HSBC’s insurance businesses are exposed to a range of financial risks, including market risk, credit risk and liquidity risk. Market risk includes interest rate risk, equity risk and foreign exchange risk. The nature and management of these risks is described below.
Manufacturing subsidiaries are exposed to financial risks, for example, when the proceeds from financial assets are not sufficient to fund the obligations arising from non-linked insurance and investment contracts. Certain insurance-related activities undertaken by HSBC subsidiaries such as insurance broking, insurance management (including captive management) and the administration and intermediation of insurance, pensions and annuities are exposed to financial risks, but not to a significant extent.
Risk management procedures which reflect local market conditions and regulatory requirements may be implemented by HSBC’s insurance manufacturing subsidiaries in addition to policies provided for Group-wide application through the Group Instruction Manuals. In many jurisdictions, local regulatory requirements prescribe the type, quality and concentration of assets that these subsidiaries must maintain to meet insurance liabilities. Within each subsidiary, ALCOs are responsible for ensuring that exposures to financial risks remain within local requirements and risk mandates (as agreed with Group Insurance Head Office), and ensure compliance with the control framework established centrally through the Group Instruction Manuals.
The following table analyses the assets held in HSBC’s insurance manufacturing subsidiaries at 31 December 2008 by type of contract, and provides a view of the exposure to financial risk:
Financial assets held by insurance manufacturing subsidiaries (Audited) At 31 December 2008 Life linked Life non-linked Non-life Other contracts1 contracts2 insurance3 assets4 Total5
US$m US$m US$m US$m US$m Trading assets
Debt securities ...................................... – – 35 4 39
Financial assets designated at fair value Treasury bills ........................................ 31 197 – 8 236 Debt securities ...................................... 4,091 3,109 52 1,625 8,877 Equity securities ................................... 6,141 4,684 – 337 11,162
10,263 7,990 52 1,970 20,275
Financial investments Held-to-maturity:
Debt securities ...................................... – 10,411 170 510 11,091
Available-for-sale: Treasury bills ........................................ – 4 130 128 262 Other eligible bills ................................ – – 272 126 398 Debt securities ...................................... – 14,602 254 1,596 16,452 Equity securities ................................... – 11 34 216 261
– 14,617 690 2,066 17,373
Derivatives ................................................ 173 204 – 24 401 Other financial assets6 ............................... 843 4,752 1,106 2,110 8,811
11,279 37,974 2,053 6,684 57,990

263
At 31 December 2007 Life linked Life non-linked Non-life Other contracts1 contracts2 insurance3 assets4 Total7
US$m US$m US$m US$m US$m Trading assets
Debt securities ...................................... – 37 22 35 94
Financial assets designated at fair value Treasury bills ........................................ 51 – 96 34 181 Debt securities ...................................... 7,741 3,591 28 2,272 13,632 Equity securities ................................... 10,386 8,822 6 686 19,900
18,178 12,413 130 2,992 33,713
Financial investments Held-to-maturity:
Treasury bills ........................................ – – – – – Debt securities ...................................... – 6,253 144 408 6,805
– 6,253 144 408 6,805
Available-for-sale: Treasury bills ........................................ – 2 126 130 258 Other eligible bills ................................ – – 176 172 348 Debt securities ...................................... – 13,677 563 2,065 16,305 Equity securities ................................... – 10 62 164 236
– 13,689 927 2,531 17,147
Derivatives ................................................ 302 83 1 30 416 Other financial assets6 .............................. 1,282 4,376 1,175 1,483 8,316
19,762 36,851 2,399 7,479 66,491
1 Comprise life linked insurance contracts and linked long-term investment contracts. 2 Comprise life non-linked insurance contracts and non-linked long-term investment contracts. 3 Comprises non-life insurance contracts. 4 Comprise shareholder assets. 5 Does not include financial assets of associated insurance company, Ping An Insurance. 6 Comprise mainly loans and advances to banks, cash and intercompany balances with other non-insurance legal entities. 7 Does not include financial assets of insurance manufacturing associate, Ping An Insurance.
The table demonstrates that for linked contracts, HSBC typically designates assets at fair value. For non-linked contracts, the classification of the assets is driven by the nature of the underlying contract.
The table also shows that approximately 62.9 per cent of financial assets was invested in debt securities at 31 December 2008 (2007: 55.4 per cent) with 19.7 per cent (2007: 30.3 per cent) invested in equity securities.
In life linked insurance, premium income less charges levied is invested in a portfolio of assets. HSBC manages the financial risks of this product on behalf of the policyholders by holding appropriate assets in segregated funds or portfolios to which the liabilities are linked. Typically, HSBC retains some exposure to market risk as the market value of the linked assets influences the fees charged by HSBC and thereby affects the recoverability of expenses incurred by the Group in managing the product. The assets held to support life linked liabilities represented 19.4 per cent of the total financial assets of HSBC’s insurance manufacturing subsidiaries at the end of 2008 (2007: 29.7 per cent).
Market risk (Audited)
Insurance and investment products manufactured by HSBC’s insurance manufacturing subsidiaries typically comprise features or combinations of features which may not be easily or exactly replicated by investments. Market risk arises when mismatches occur between product liabilities and the investment assets which back them; for example, mismatches between asset and liability yields and maturities give rise to interest rate risk.
Description of market risk (Audited)
The main features of products manufactured by HSBC’s insurance manufacturing subsidiaries which generate market risk, and the market risk to which these features expose the subsidiaries, are discussed below.
Long-term insurance or investment products may incorporate either one investment return guarantee or a combination thereof, divided into the following categories:

H S B C H O L D I N G S P L C
Report of the Directors: Risk (continued) Insurance operations > Financial risks > Market risk
264
• annuities in payment;
• deferred annuities: these consist of two phases – the savings and investing phase and the retirement income phase;
• annual return: the annual return is guaranteed to be no lower than a specified rate. This may be the return credited to the policyholder every year, or the average annual return credited to the policyholder over the life of the policy, which may occur on the maturity date or the surrender date of the contract;
• capital: policyholders are guaranteed to receive no less than the premiums paid plus declared bonuses less expenses; and
• market performance: policyholders receive an investment return which is guaranteed to be
within a prescribed range of average investment returns earned by predetermined market participants on the specified product.
Subsidiaries manufacturing products with guarantees are usually exposed to falls in market interest rates as they result in lower yields on the assets supporting guaranteed investment returns payable to policyholders. In the current market environment, in which interest rates are falling, managing this risk is of increasing importance.
The table below shows, in respect of each category of guarantee, the total liabilities to policyholders established for guaranteed products, the range of investment returns (net of operating costs) implied by the guarantees, and the range of current yields of the investment portfolios supporting the guarantees.
Liabilities to policyholders1 (Audited)
2008 2007
Amount of reserve
Investment returns implied by guarantee2
Current yields
Amount of reserve
Investment returns implied by guarantee3
Current yields
US$m % % US$m % %
Annuities in payment .......................................... 744 0.0 – 11.5 6.5 – 28.0 716 0.0 – 8.5 5.1 – 18.1 Deferred annuities ............................................... 120 0.0 – 6.0 3.9 – 7.4 116 0.0 – 6.0 3.8 – 8.6 Deferred annuities ............................................... 576 6.0 – 9.0 5.4 – 5.4 609 6.0 – 9.0 5.7 Annual return ...................................................... 13,717 0.0 – 4.5 2.2 – 4.9 12,875 0.0 – 4.5 3.2 – 8.7 Annual return ...................................................... 302 4.5 – 6.0 3.4 – 7.3 352 4.5 – 6.0 3.2 – 8.5 Capital ................................................................. 13,346 0.0 2.0 – 4.3 11,311 0.0 3.8 – 4.8 Market performance4 .......................................... n/a n/a n/a 3,605 n/a n/a
1 The table excludes contracts where the market risk is 100 per cent reinsured. 2 Excluding guarantees from associated insurance company, Ping An Insurance, or joint venture insurance companies, Hana Life and
Canara HSBC Oriental Bank of Commerce Life Insurance Company Limited 3 Excluding guarantees from associate insurance company, Ping An Insurance. 4 There is no specific investment return implied by market performance guarantees because the guarantees are expressed as lying within
prescribed ranges of average market returns.
A certain number of these products have been discontinued, including the US$576 million deferred annuity portfolio in HSBC Finance where, as highlighted in the above table, the current portfolio yield is less than the guarantee. On acquisition of this block of business by HSBC Finance, a provision was established to mitigate the shortfall in yields. There has been no further deterioration in the shortfall since acquisition. There are a limited number of additional contracts where the current portfolio yield is less than the guarantee implied by the contract.
The proceeds from insurance and investment products with DPF are primarily invested in bonds with a proportion allocated to equity securities in order to provide customers with the potential for enhanced returns. Subsidiaries with portfolios of
such products are exposed to the risk of falls in the market price of equity securities when they cannot be fully reflected in the discretionary bonuses. An increase in market volatility could also result in an increase in the value of the guarantee to the policyholder.
Long-term insurance and investment products typically permit the policyholder to surrender the policy or let it lapse at any time. When the surrender value is not linked to the value realised from the sale of the associated supporting assets, the subsidiary is exposed to market risk. In particular, when customers seek to surrender their policies when asset values are falling, assets may have to be sold at a loss to fund redemptions.
A subsidiary holding a portfolio of long-term insurance and investment products, especially with

265
DPF, may attempt to reduce exposure to its local market by investing in assets in countries other than that in which it is based. These assets may be denominated in currencies other than the subsidiary’s local currency. It is often not cost effective for the subsidiary to hedge the foreign exchange exposure associated with these assets, and this exposes it to the risk that its local currency will strengthen against the currency of the related assets.
For unit-linked contracts, market risk is substantially borne by the policyholder, but HSBC typically remains exposed to market risk as the market value of the linked assets influences the fees HSBC earns for managing them.
How the risks are managed (Audited)
HSBC’s insurance manufacturing subsidiaries manage market risk by using some or all of the following techniques, depending on the nature of the contracts they write:
• for products with DPF, adjusting bonus rates to manage the liabilities to policyholders. Bonus rates are managed by regularly evaluating their sustainability. The effect is that a portion of the market risk is borne by the policyholder;
• as far as possible, matching assets to liabilities. For example, for products with annual return or capital guarantees, HSBC invests in bonds which produce returns at least equal to the investment returns implied by the guarantees;
• using derivatives in a limited number of instances;
• when designing new products with investment guarantees, evaluating the cost of the guarantee and considering this cost when determining the level of premiums or the price structure;
• periodically reviewing products identified as higher risk, which contain guarantees and embedded optionality features linked to savings and investment products. The scope of the review would include pricing, risk management and profitability (a control introduced during 2008). Guaranteed products which expose the Group to risk beyond the levels deemed acceptable in any of these categories are either altered or are no longer offered to customers;
• including features designed to mitigate market risk in new products, such as charging surrender penalties to recoup losses incurred when policyholders surrender their policies; and
• exiting, to the extent possible, investment portfolios whose risk is considered unacceptable – for example, by implementing asset reallocation strategies in order to manage risk exposures.
During 2008, the credit, market and liquidity risk functions in Group Insurance Head Office were strengthened by the creation of two new positions, Chief Credit Officer and Chief Market and Liquidity Risk Officer, both reporting to the Chief Risk Officer. Also, due diligence procedures were enhanced during the current lower yield environment to more critically assess embedded risk in respect of new products, for example, those including options and guarantees within the contract. When such product features are identified, the product proposal is reviewed by Group Insurance Head Office to ensure that the key risks are identified and that the related risk management procedures are adequate. The frequency with which management reviews certain exposures is increased in markets demonstrating increasing volatility to ensure that any matters arising are dealt with in a timely fashion.
Each insurance manufacturing subsidiary is required to have a market risk mandate which specifies the investment instruments in which it is permitted to invest and the maximum quantum of market risk which it is permitted to retain. It is the responsibility of the subsidiary’s ALCO and the Market and Liquidity Risk Committee (sub-committee to the Group Insurance Risk Committee) to ensure that each mandate is consistent with local regulations. All mandates are reviewed and agreed annually by Group Insurance Head Office, and aggregate limits are approved by the Risk Management Meeting of GMB. During 2008, market risk mandates were enhanced in some of the major insurance subsidiaries by introducing stop loss limits and management action limits designed to control risk in certain portfolios.
How the exposures to risks are measured (Audited)
HSBC’s insurance manufacturing subsidiaries monitor exposures against mandated limits regularly and report these quarterly to Group Insurance Head Office. Exposures are aggregated and reported to senior risk management forums in the Group, including the Group Insurance Market and Liquidity Risk Committee, Group Insurance Risk Committee and the Group Stress Test Review Group.
The standard measures used to quantify the market risks are as follows:

H S B C H O L D I N G S P L C
Report of the Directors: Risk (continued) Insurance operations > Financial risks > Market risk / Credit risk
266
• for interest rate risk, the sensitivities of the net present values of asset and expected liability cash flows, in total and by currency, to a one basis point parallel upward shift in the discount curves used to calculate the net present values;
• for equity price risk, the total market value of equity holdings and the market value of equity holdings by region and country; and
• for foreign exchange risk, the total net short foreign exchange position and the net foreign exchange positions by currency.
Although these measures are relatively straightforward to calculate and aggregate, there are limitations with them. The most significant limitation is that a parallel shift in yield curves of one basis point does not capture the non-linear relationships between the values of certain assets and liabilities and interest rates. Non-linearity arises, for example, from investment return guarantees and certain product features such as the ability of policyholders to surrender their policies. If the yields on investments held to support contracts with guarantees are less than the investment returns implied by the guarantees, shortfalls will be to the account of HSBC.
HSBC recognises these limitations and augments its standard measures with stress tests which examine the effect of a range of market rate scenarios on the aggregate annual profits and total equity of the insurance manufacturing subsidiaries.
HSBC’s insurance manufacturing subsidiaries report the results of their stress tests every quarter to Group Insurance Head Office, where the reports are consolidated and reviewed by the Group Insurance Market and Liquidity Risk Meeting and the Group Stress Test Review Group.
HSBC’s insurance manufacturing subsidiaries identify the assets and liabilities in their financial statements whose values are sensitive to each category of market risk and revalue them at various market rates. The outcome of the exercise is expressed in terms of the effect on profit for the year and total equity under the stress-tested assumptions, after taking into consideration tax and accounting treatments where material and relevant.
The following table illustrates the effect on the aggregated profit for the year and total equity under various interest rate, equity price, foreign exchange rate and credit spread scenarios. Where appropriate, the impact of the stress on the PVIF is included in the results of the stress tests. The relationship between the values of certain assets and liabilities and the risk factors may be non-linear and, therefore, the results disclosed cannot be extrapolated to measure sensitivities to different levels of stress. The sensitivities are stated before allowance for the effect of management actions which may mitigate changes in market rates, and for any factors such as policyholder behaviour that may change in response to changes in market risk.
Sensitivity of HSBC’s insurance subsidiaries to risk factors (Audited)
2008 2007
Effect on profit for the year
Effect on total equity
Effect on profit for the year
Effect on total equity
US$m US$m US$m US$m
+ 100 basis points parallel shift in yield curves ........... 94 (13) 67 (29)– 100 basis points parallel shift in yield curves ........... (82) 24 (71) 49 10 per cent increase in equity prices ............................ 10 10 147 151 10 per cent decrease in equity prices ............................ (12) (12) (145) (149)10 per cent increase in US dollar exchange rate
compared to all currencies ........................................ 28 29 12 12 10 per cent decrease in US dollar exchange rate
compared to all currencies ........................................ (28) (29) (12) (12)Sensitivity to credit spread increases ............................ (73) (134) (15) (30)

267
The sensitivity of the net profit after tax of HSBC’s insurance subsidiaries to the effects of increases in credit spreads is a fall of US$73 million (2007: US$15 million fall). The sensitivity is consistent with the other sensitivities noted above, and is calculated using simplified assumptions based on a one-day movement in credit spreads over a two-year period. A confidence level of 99 per cent, consistent with the Group’s VAR, has been applied. The effect of movements in credit spreads became more significant in 2008 due to increased volatility in credit spreads.
Credit risk (Audited)
Credit risk can give rise to losses through default and can lead to volatility in income statement and balance sheet figures through movements in credit spreads, principally on the US$33.2 billion (2007: US$29.8 billion) non-linked bond portfolio. The exposure of the income statement to the effect of changes in credit spreads is small (see the table on page 266). 49 per cent of the financial assets held by insurance subsidiaries are classified as either held to maturity or available for sale, and consequently any changes in the fair value of these financial investments, absent impairment, would have no impact on the profit after tax.
HSBC sells certain unit-linked life insurance contracts which are reinsured with a third-party. These insurance contracts include market return guarantees which are underwritten by the third-party. HSBC is exposed to credit risk to the extent that the third-party (the counterparty) is unable to meet the terms of the guarantees. As highlighted in ‘Market Risk’ above, the cost to the Group of market return guarantees increases when interest rates fall, equity markets fall or market volatility increases. In addition, when determined by reference to a discounted cash flow model in which the discount rate is based on current interest rates, guarantee costs increase in a falling interest rate environment. As a consequence of the rise in these costs, the Group’s counterparty exposure to the guarantees under the reinsurance agreement at 31 December 2008 was greater than at 31 December 2007. During 2008, sales of these contracts ceased, reflecting the adjusted risk appetite of the business
The exposure to credit risk products and the management of the risks associated with credit
protection products are included in the description of life and non-life insurance risk on pages 257 to 258. HSBC’s insurance manufacturing subsidiaries are responsible for the credit risk, quality and performance of their investment portfolios. Investment credit mandates and limits are set by the subsidiaries and approved by their local insurance ALCOs and Credit Risk functions before being submitted to Group Credit Risk for concurrence. The form and content of the mandates must accord with centrally set investment credit risk guidance regarding credit quality, industry sector concentration and liquidity restrictions, but allow for the inclusion of local regulatory and country-specific conditions. The assessment of the creditworthiness of issuers and counterparties is based primarily upon internationally recognised credit ratings and other publicly available information.
Investment credit exposures are monitored against limits by the local insurance manufacturing subsidiaries, and are aggregated and reported to Group Credit Risk, the Group Insurance Credit Risk Meeting and the Group Insurance Risk Committee. Stress testing is performed by Group Insurance Head Office on the investment credit exposures using credit spread sensitivities and default probabilities. The stresses are reported to the Group Insurance Risk Committee.
As noted above, under certain circumstances, the Group is able to dilute the effect of investment losses by sharing them with policyholders. However, when, for example, a contract includes a guarantee, losses which would result in a breach of the guaranteed benefits due to the policyholder are borne by the Group.
In response to adverse credit market conditions, various initiatives were introduced during 2008 to better manage and report credit risk, including an Early Warning Report which is produced on a weekly basis to identify investments which may be at risk of future impairment. This report is circulated to senior management in Group Insurance Head Office and the Regional Chief Risk Officers, and risk reduction strategies are implemented when considered appropriate. Similarly, a watch list of investments with current credit concerns is circulated weekly.

H S B C H O L D I N G S P L C
Report of the Directors: Risk (continued) Insurance operations > Financial risks > Credit risk
268
Credit quality (Audited)
The following table presents an analysis of treasury bills, other eligible bills and debt securities within HSBC’s insurance business by measures of credit quality. The definitions of the four credit quality classifications are included on page 217. Only assets
supporting non-linked liabilities are included in the table as financial risk on assets supporting linked liabilities is predominantly borne by the policyholder. 93.7 per cent (2007: 88.7 per cent) of the assets included in the table are invested in investments rated as ‘Strong’.
Treasury bills, other eligible bills and debt securities in HSBC’s insurance subsidiaries (Audited)
Neither past due nor impaired
Strong Medium Sub- standard Impaired1 Total
US$m US$m US$m US$m US$m At 31 December 2008
Supporting liabilities under non-linked insurance and investment contracts
Trading assets – debt securities .................................................................. 27 8 – 35
Financial assets designated at fair value .................................................... 2,704 654 – 3,358 – treasury and other eligible bills .......................................................... 197 – – 197– debt securities ..................................................................................... 2,507 654 – 3,161
Financial investments ................................................................................ 24,881 913 45 4 25,843 – treasury and other similar bills ........................................................... 404 2 – – 406– debt securities ..................................................................................... 24,477 911 45 4 25,437
27,612 1,575 45 4 29,236
Supporting shareholders’ funds2 Trading assets – debt securities .................................................................. 4 – – 4
Financial assets designated at fair value .................................................... 1,502 131 – 1,633 – treasury and other eligible bills .......................................................... 8 – – 8– debt securities ..................................................................................... 1,494 131 – 1,625
Financial investments ................................................................................ 2,033 228 99 – 2,360 – treasury and other similar bills ........................................................... 245 7 2 – 254– debt securities ..................................................................................... 1,788 221 97 – 2,106
3,539 359 99 – 3,997
Total3 Trading assets – debt securities .................................................................. 31 8 – 39
Financial assets designated at fair value .................................................... 4,206 785 – 4,991 – treasury and other eligible bills .......................................................... 205 – – 205– debt securities ..................................................................................... 4,001 785 – 4,786
Financial investments ................................................................................ 26,914 1,141 144 4 28,203 – treasury and other similar bills ........................................................... 649 9 2 – 660– debt securities ..................................................................................... 26,265 1,132 142 4 27,543
31,151 1,934 144 4 33,233

269
Neither past due nor impaired
Strong Medium Sub- standard Total
US$m US$m US$m US$m At 31 December 2007
Supporting liabilities under non-linked insurance and investment contracts Trading assets – debt securities ....................................................................................... – 59 – 59
Financial assets designated at fair value ........................................................................ 2,748 967 – 3,715 – treasury and other eligible bills ............................................................................... – 96 – 96– debt securities .......................................................................................................... 2,748 871 – 3,619
Financial investments ..................................................................................................... 19,352 1,575 14 20,941 – treasury and other similar bills ................................................................................ 290 14 – 304– debt securities .......................................................................................................... 19,062 1,561 14 20,637
22,100 2,601 14 24,715
Supporting shareholders’ funds2 Trading assets – debt securities ....................................................................................... – 35 – 35
Financial assets designated at fair value ........................................................................ 1,833 473 – 2,306 – treasury and other eligible bills ............................................................................... – 34 – 34– debt securities .......................................................................................................... 1,833 439 – 2,272
Financial investments ..................................................................................................... 2,537 233 5 2,775 – treasury and other similar bills ................................................................................ 290 7 5 302– debt securities .......................................................................................................... 2,247 226 – 2,473
4,370 741 5 5,116
Total4 Trading assets – debt securities ....................................................................................... – 94 – 94
Financial assets designated at fair value ........................................................................ 4,581 1,440 – 6,021 – treasury and other eligible bills ............................................................................... – 130 – 130– debt securities .......................................................................................................... 4,581 1,310 – 5,891
Financial investments ..................................................................................................... 21,889 1,808 19 23,716 – treasury and other similar bills ................................................................................ 580 21 5 606– debt securities .......................................................................................................... 21,309 1,787 14 23,110
26,470 3,342 19 29,831
1 Impairment is not measured for debt securities held in trading portfolios or designated at fair value, as assets in such portfolios are managed according to movements in fair value, and the fair value movement is taken directly through the income statement. Consequently, all such balances are reported under ‘neither past due nor impaired’.
2 Shareholders’ funds comprise solvency and unencumbered assets. 3 Does not include treasury bills, other eligible bills and debt securities held by associated insurance company, Ping An Insurance, or
joint venture insurance companies, Hana Life and Canara HSBC Oriental Bank of Commerce Life Insurance Company Limited. 4 Does not include treasury bills, other eligible bills and debt securities held by insurance manufacturing associate, Ping An Insurance.

H S B C H O L D I N G S P L C
Report of the Directors: Risk (continued) Insurance operations > Credit risk / Liquidity risk
270
Issuers of treasury bills, other eligible bills and debt securities in HSBC’s insurance subsidiaries (Audited)
Treasury bills
Other eligible bills
Debt securities
Total
US$m US$m US$m US$m At 31 December 2008 Governments ................................................................. 467 24 6,109 6,600 Local authorities ........................................................... – – 525 525 Asset-backed securities ................................................. – – 14 14 Corporates and other ..................................................... – 374 25,720 26,094
467 398 32,368 33,233 At 31 December 2007 Governments ................................................................. 388 – 7,140 7,528 Local authorities ........................................................... – – 175 175 Asset-backed securities ................................................. – – 201 201 Corporates and other ..................................................... – 348 21,579 21,927
388 348 29,095 29,831 (Audited)
Credit risk also arises when part of the insurance risk incurred by HSBC is assumed by reinsurers. The credit risk exposure to reinsurers is monitored by Group Insurance Head Office and is reported quarterly to the Group Insurance Risk Committee and the Group Insurance Credit Risk Meeting.
The split of liabilities ceded to reinsurers and outstanding reinsurance recoveries, analysed by Standard & Poor’s reinsurance credit rating data or their equivalent, is shown below. The Group’s exposure to third parties under the reinsurance agreement described in the Credit Risk section above is included in this table.
Reinsurers’ share of liabilities under insurance contracts (Audited)
Neither past due nor impaired
Strong Medium
Past due but not impaired Total
US$m US$m US$m US$m
At 31 December 2008 Linked insurance contracts ............................................................................................. 9 947 – 956 Non-linked insurance contracts ...................................................................................... 1,001 62 4 1,067
Total1 ............................................................................................................................... 1,010 1,009 4 2,023
Reinsurance debtors ........................................................................................................ 30 20 10 60 At 31 December 2007 Linked insurance contracts ............................................................................................. 35 22 – 57 Non-linked insurance contracts ...................................................................................... 998 257 3 1,258
Total2 ............................................................................................................................... 1,033 279 3 1,315
Reinsurance debtors ........................................................................................................ 37 9 8 54
1 Does not include reinsurers’ share of liabilities under insurance contracts and reinsurance debtors of associated insurance company, Ping An Insurance, or joint venture insurance companies, Hana Life and Canara HSBC Oriental Bank of Commerce Life Insurance Company Limited.
2 Does not include reinsurers’ share of liabilities under insurance contracts and reinsurance debtors of insurance manufacturing associate, Ping An Insurance.

271
Liquidity risk (Audited)
It is an inherent characteristic of almost all insurance contracts that there is uncertainty over the amount of claims liabilities that may arise, and the timing of their settlement and this leads to liquidity risk.
To fund the cash outflows arising from claims liabilities, HSBC’s insurance manufacturing subsidiaries primarily utilise liquidity from the following sources:
• cash inflows arising from premiums from new business, policy renewals and recurring premium products;
• cash inflows arising from interest and dividends on investments and principal repayments of maturing debt investments;
• cash resources; and
• cash inflows from the sale of investments.
HSBC’s insurance manufacturing subsidiaries manage liquidity risk by utilising some or all of the following techniques:
• matching cash inflows with expected cash outflows using specific cash flow projections or more general asset and liability matching techniques such as duration matching;
• maintaining sufficient cash resources;
• investing in good credit-quality investments with deep and liquid markets to the degree to which they exist;
• monitoring investment concentrations and restricting them where appropriate, for example, by debt issues or issuers; and
• establishing committed contingency borrowing facilities.
Every quarter, HSBC’s insurance manufacturing subsidiaries are required to complete and submit liquidity risk reports to Group Insurance Head Office for collation and review by the Group Insurance Market and Liquidity Risk Meeting. Liquidity risk is assessed in these reports by measuring changes in expected cumulative net cash flows under a series of stress scenarios designed to determine the effect of reducing expected available liquidity and accelerating cash outflows. This is achieved by, for example, assuming new business or renewals are lower, and surrenders or lapses are greater, than expected.
The following tables show the expected undiscounted cash flows for insurance contract liabilities and the remaining contractual maturity of investment contract liabilities at 31 December 2008. As indicated in the analyses of life and non-life insurance risks on pages 257 to 258, a significant proportion of the Group’s non-life insurance business is viewed as short term, with the settlement of liabilities expected to occur within one year of the period of risk. There is a greater spread of expected maturities for the life business where, in a large proportion of cases, the liquidity risk is borne in conjunction with policyholders (wholly in the case of unit-linked business).
The profile of the expected maturity of the insurance contracts as at 31 December 2008 remained comparable with 2007.
Expected maturity of insurance contract liabilities (Audited)
Expected cash flows (undiscounted) Within 1 year 1-5 years 5-15 years Over 15 years Total US$m US$m US$m US$m US$m At 31 December 2008 Non-life insurance .................................... 1,178 1,186 115 1 2,480 Life insurance (non-linked) ...................... 2,527 7,789 16,695 14,432 41,443 Life insurance (linked) ............................. 1,295 1,251 3,269 5,390 11,205
Total1 ......................................................... 5,000 10,226 20,079 19,823 55,128
At 31 December 2007 Non-life insurance .................................... 1,337 1,352 164 1 2,854 Life insurance (non-linked) ...................... 1,887 5,310 15,986 13,269 36,452 Life insurance (linked) ............................. 507 1,894 3,644 5,014 11,059
Total2 ......................................................... 3,731 8,556 19,794 18,284 50,365
1 Does not include insurance contracts issued by associated insurance company, Ping An Insurance, or joint venture insurance companies, Hana Life and Canara HSBC Oriental Bank of Commerce Life Insurance Company Limited.
2 Does not include insurance contracts issued by insurance manufacturing associate, Ping An Insurance.

H S B C H O L D I N G S P L C
Report of the Directors: Risk (continued) Insurance operations > Financial risks > Liquidity risk / PVIF
272
Remaining contractual maturity of investment contract liabilities (Audited) Liabilities under investment contracts by
insurance underwriting subsidiaries Linked
investment contracts
Other investment contracts
Investment contracts with DPF
Total US$m US$m US$m US$m At 31 December 2008 Remaining contractual maturity:
– due within 1 year ................................................... 178 314 – 492 – due between 1 and 5 years .................................... 610 21 34 665 – due between 5 and 10 years .................................. 482 31 – 513 – due after 10 years .................................................. 1,649 42 – 1,691 – undated1 ................................................................. 3,093 3,147 17,732 23,972
Total2 ............................................................................. 6,012 3,555 17,766 27,333
At 31 December 2007 Remaining contractual maturity:
– due within 1 year ................................................... 286 331 1 618 – due between 1 and 5 years .................................... 1,234 48 28 1,310 – due between 5 and 10 years .................................. 950 – – 950 – due after 10 years .................................................. 3,386 44 – 3,430 – undated1 ................................................................. 6,869 3,217 18,954 29,040
Total3 ............................................................................. 12,725 3,640 18,983 35,348
1 In most cases, policyholders have the option to terminate their contracts at any time and receive the surrender values of their policies. These may be significantly lower than the amounts shown above.
2 Does not include investment contracts issued by associated insurance company, Ping An Insurance, or joint venture insurance companies, Hana Life and Canara HSBC Oriental Bank of Commerce Life Insurance Company Limited.
3 Does not include investment contracts issued by insurance manufacturing associate, Ping An Insurance.
Present value of in-force long-term insurance business (Audited)
The HSBC life insurance business is accounted for using the embedded value approach which, inter alia, provides a comprehensive framework for the evaluation of insurance and related risks. The present value of the in-force long-term (‘PVIF’) asset at 31 December 2008 was US$2.0 billion (2007: US$2.0 billion). The present value of the shareholders’ interest in the profits expected to emerge from the book of in-force policies at 31 December can be stress-tested to assess the ability of the life business book to withstand adverse developments. A key feature of the life insurance business is the importance of managing the assets, liabilities and risks in a coordinated fashion rather than individually. This reflects the greater interdependence of these three elements for life insurance than is generally the case for non-life insurance.
The following table shows the effect on the PVIF of reasonably possible changes in the main economic assumptions, namely the risk-free and risk discount rates, across all insurance manufacturing subsidiaries.
Sensitivity of PVIF to changes in economic assumptions (Audited)
PVIF at 31 December 2008 2007 US$m US$m
+ 100 basis point shift in risk-free rate .............. 179 195
– 100 basis point shift in risk-free rate .............. (100) (232)
+ 100 basis point shift in risk discount rate ....... (109) (95)
– 100 basis point shift in risk discount rate ....... 122 106
Due to certain characteristics of the contracts, the relationships may be non-linear and the results of the stress-testing disclosed above should not be extrapolated to higher levels of stress. In calculating the various scenarios, all assumptions are held stable except when testing the effect of the shift in the risk-free rate, when consequential changes to investment returns, risk discount rates and bonus rates are also incorporated. The sensitivities shown are before actions that could be taken by management to mitigate effects and before consequential changes in policyholder behaviour.
The following table shows the movements recorded during the year in respect of total equity and PVIF of insurance operations:

273
Movements in total equity and PVIF of insurance operations (Audited)
2008 2007
Total equity
Of which includes: PVIF
Total equity
Of which includes: PVIF
US$m US$m US$m US$m
At 1 January ............................................................................... 8,430 1,965 5,949 1,549 Value of new business written during the year1 ........................ 452 452 380 380 Acquisitions of subsidiaries/portfolios ...................................... – – 652 390 Movements arising from in-force business:
– expected return ................................................................... (186) (186) (175) (175) – experience variances2 ......................................................... (36) (36) 53 53 – change in operating assumptions ....................................... (7) (7) (86) (86)
Investment return variances ....................................................... (94) (94) – – Changes in investment assumptions .......................................... 12 12 4 4 Return on net assets ................................................................... (310) – 1,235 – Disposals of subsidiaries/portfolios .......................................... – – (250) – Exchange differences and other ................................................ (93) (73) (91) (150) Capital transactions ................................................................... (591) – 759 –
At 31 December ......................................................................... 7,577 2,033 8,430 1,965
1 Value of net new business during the year is the present value of the projected stream of profits from the business. 2 Experience variances include the effect of the difference between demographic, expense and persistency assumptions used in the
previous PVIF calculation and actual experience observed during the year.
Non-economic assumptions (Audited)
The policyholder liabilities and PVIF are determined by reference to non-economic assumptions which include, for non-life manufacturers, claims costs and expense rates and, for life manufacturers, mortality and/or morbidity, lapse rates and expense rates. The table below shows the sensitivity of profit for the year to, and total equity at, 31 December 2008 to reasonably possible changes in these non-economic assumptions at that date across all insurance manufacturing subsidiaries, with comparatives for 2007.
The cost of claims is a risk associated with non-life insurance business. An increase in claims costs would have a negative effect on profit. The main exposures to this scenario are in the UK, Hong Kong and Latin America.
Mortality and morbidity risk is typically associated with life insurance contracts. The effect of an increase in mortality or morbidity on profit depends on the type of business being written. For a portfolio of term assurance contracts, an increase in mortality usually has a negative effect on profit as the number of claims increases. For a portfolio of annuity contracts, an increase in mortality rates typically has a positive effect on profit as the period
over which the benefit is being paid to the policyholder is shortened. However, when an annuity contract includes life cover, the positive effect on profit of the increase in mortality may be offset by the benefits payable under the life insurance. The largest exposures to mortality and morbidity risk exist in France, Hong Kong and the UK.
Sensitivity to lapse rates is dependent on the type of contracts being written. For insurance contracts, the cost of claims is funded by premiums received and income earned on the investment portfolio supporting the liabilities. For a portfolio of term assurance, an increase in lapse rates typically has a negative effect on profit due to the loss of future premium income on the lapsed policies. For a portfolio of annuity contracts, an increase in lapse rates has a positive effect on profit as the obligation to pay future benefits on the lapsed contracts is extinguished. France, Hong Kong and the UK are the sites which are most sensitive to a change in lapse rates.
Expense rate risk is the exposure to a change in expense rates. To the extent that increased expenses cannot be passed on to policyholders, an increase in expense rates will have a negative impact on profits.
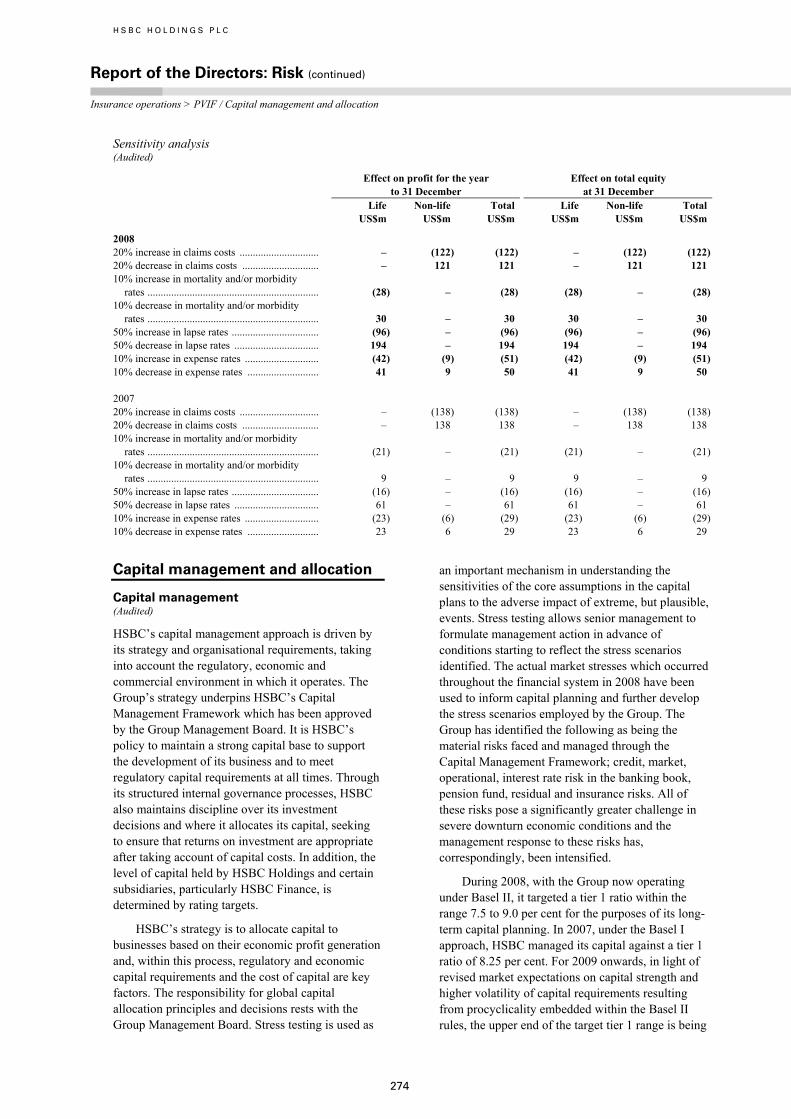
H S B C H O L D I N G S P L C
Report of the Directors: Risk (continued) Insurance operations > PVIF / Capital management and allocation
274
Sensitivity analysis (Audited)
Effect on profit for the year
to 31 December Effect on total equity
at 31 December Life Non-life Total Life Non-life Total
US$m US$m US$m US$m US$m US$m
2008 20% increase in claims costs .............................. – (122) (122) – (122) (122)20% decrease in claims costs ............................. – 121 121 – 121 121 10% increase in mortality and/or morbidity
rates ................................................................. (28) – (28) (28) – (28)10% decrease in mortality and/or morbidity
rates ................................................................. 30 – 30 30 – 30 50% increase in lapse rates ................................. (96) – (96) (96) – (96)50% decrease in lapse rates ................................ 194 – 194 194 – 194 10% increase in expense rates ............................ (42) (9) (51) (42) (9) (51)10% decrease in expense rates ........................... 41 9 50 41 9 50 2007 20% increase in claims costs .............................. – (138) (138) – (138) (138)20% decrease in claims costs ............................. – 138 138 – 138 138 10% increase in mortality and/or morbidity
rates ................................................................. (21) – (21) (21) – (21)10% decrease in mortality and/or morbidity
rates ................................................................. 9 – 9 9 – 9 50% increase in lapse rates ................................. (16) – (16) (16) – (16)50% decrease in lapse rates ................................ 61 – 61 61 – 61 10% increase in expense rates ............................ (23) (6) (29) (23) (6) (29)10% decrease in expense rates ........................... 23 6 29 23 6 29
Capital management and allocation
Capital management (Audited)
HSBC’s capital management approach is driven by its strategy and organisational requirements, taking into account the regulatory, economic and commercial environment in which it operates. The Group’s strategy underpins HSBC’s Capital Management Framework which has been approved by the Group Management Board. It is HSBC’s policy to maintain a strong capital base to support the development of its business and to meet regulatory capital requirements at all times. Through its structured internal governance processes, HSBC also maintains discipline over its investment decisions and where it allocates its capital, seeking to ensure that returns on investment are appropriate after taking account of capital costs. In addition, the level of capital held by HSBC Holdings and certain subsidiaries, particularly HSBC Finance, is determined by rating targets.
HSBC’s strategy is to allocate capital to businesses based on their economic profit generation and, within this process, regulatory and economic capital requirements and the cost of capital are key factors. The responsibility for global capital allocation principles and decisions rests with the Group Management Board. Stress testing is used as
an important mechanism in understanding the sensitivities of the core assumptions in the capital plans to the adverse impact of extreme, but plausible, events. Stress testing allows senior management to formulate management action in advance of conditions starting to reflect the stress scenarios identified. The actual market stresses which occurred throughout the financial system in 2008 have been used to inform capital planning and further develop the stress scenarios employed by the Group. The Group has identified the following as being the material risks faced and managed through the Capital Management Framework; credit, market, operational, interest rate risk in the banking book, pension fund, residual and insurance risks. All of these risks pose a significantly greater challenge in severe downturn economic conditions and the management response to these risks has, correspondingly, been intensified.
During 2008, with the Group now operating under Basel II, it targeted a tier 1 ratio within the range 7.5 to 9.0 per cent for the purposes of its long-term capital planning. In 2007, under the Basel I approach, HSBC managed its capital against a tier 1 ratio of 8.25 per cent. For 2009 onwards, in light of revised market expectations on capital strength and higher volatility of capital requirements resulting from procyclicality embedded within the Basel II rules, the upper end of the target tier 1 range is being

275
extended to 10 per cent.
HSBC’s capital management process continues to stress the advantages and flexibility afforded by a strong capital position and, through its policies, seeks to maintain a conservative stance with regard to equity leverage.
The Capital Management Framework covers the different capital measures within which HSBC manages its capital in a consistent and aligned manner. These include market capitalisation, invested capital, economic capital and regulatory capital. HSBC defines invested capital as the equity capital invested in HSBC by its shareholders. Economic capital is the capital requirement calculated internally by HSBC deemed necessary to support the risks to which it is exposed, and is set at a confidence level consistent with a target credit rating of AA. Regulatory capital is the capital which HSBC is required to hold as determined by the rules established by the FSA for the consolidated Group and by HSBC’s local regulators for individual Group companies.
An annual Group capital plan is prepared and approved by the Board with the objective of maintaining both the optimal amount of capital and the mix between the different components of capital. The Group’s policy is to hold capital in a range of different forms and from diverse sources and all capital raising is agreed with major subsidiaries as part of their individual and the Group’s capital management processes. HSBC Holdings and its major subsidiaries raise non-equity tier 1 capital and subordinated debt in accordance with the Group’s guidelines on market and investor concentration, cost, market conditions, timing, effect on composition and maturity profile.
Each subsidiary manages its own capital required to support planned business growth and meet local regulatory requirements within the context of the approved annual Group capital plan. As part of HSBC’s Capital Management Framework, capital generated in excess of planned requirements is returned to HSBC Holdings, normally by way of dividends.
HSBC Holdings is primarily the provider of equity capital to its subsidiaries. These investments are substantially funded by HSBC Holdings’ own capital issuance and profit retentions. HSBC Holdings seeks to maintain a prudent balance between the composition of its capital and that of its investment in subsidiaries.
Capital measurement and allocation (Audited)
In June 2006, the Basel Committee on Banking Supervision published ‘International Convergence of Capital Measurement and Capital Standards’, known as Basel II. Basel II is structured around three ‘pillars’: minimum capital requirements, supervisory review process and market discipline. The Capital Requirements Directive (‘CRD’) implements Basel II in the EU and the FSA then gives effect to the CRD by including the requirements of the CRD in its own rulebooks.
The FSA supervises HSBC on a consolidated basis and therefore receives information on the capital adequacy of, and sets capital requirements for, HSBC as a whole. Individual banking subsidiaries are directly regulated by their local banking supervisors, who set and monitor their capital adequacy requirements. Although HSBC calculates capital at a Group level using the Basel II framework, local regulators are at different stages of implementation and local rules may still be on a Basel I basis, notably in the US. In most jurisdictions, non-banking financial subsidiaries are also subject to the supervision and capital requirements of local regulatory authorities.
HSBC’s capital is divided into two tiers:
• Tier 1 capital comprises core equity tier 1 capital, non-innovative preference shares and innovative tier 1 securities. Core equity tier 1 capital comprises shareholders’ funds and minority interests in tier 1 capital, after adjusting for items reflected in shareholders’ funds which are treated differently for the purposes of capital adequacy. The book values of goodwill and intangible assets are deducted in arriving at core equity tier 1 capital.
• Tier 2 capital comprises qualifying subordinated loan capital, allowable collective impairment allowances, minority and other interests in tier 2 capital and unrealised gains arising on the fair valuation of equity instruments held as available-for-sale. Tier 2 capital also includes reserves arising from the revaluation of properties.
Various limits are applied to elements of the capital base. The amount of innovative tier 1 securities cannot exceed 15 per cent of overall tier 1 capital, qualifying tier 2 capital cannot exceed tier 1 capital, and qualifying term subordinated loan capital cannot exceed 50 per cent of tier 1 capital.

H S B C H O L D I N G S P L C
Report of the Directors: Risk (continued) Capital management and allocation
276
There are also limitations on the amount of collective impairment allowances which may be included as part of tier 2 capital. For regulatory purposes, banking associates are proportionally consolidated, rather than being recognised using the equity method used for financial reporting.
The carrying amounts of investments in the capital of banks that exceed certain limits and the excess of expected losses over impairment allowances are deducted 50 per cent from each of tier 1 and tier 2 capital in the published disclosures. This also applies to deductions of investments in insurance subsidiaries and associates, but the FSA has granted a transitional provision, until 31 December 2012, under which those insurance investments that were acquired before 20 July 2006 may be deducted from the total of tier 1 and tier 2 capital instead. HSBC has elected to apply this transitional provision.
The basis of calculating capital changed with effect from 1 January 2008 and the effect on both tier 1 capital and total capital is shown in the table below, ‘Capital Structure’. The Group’s capital base is reduced compared with Basel I by the extent to which expected losses exceed the total of individual and collective impairment allowances on IRB portfolios. These collective impairment allowances are no longer eligible for inclusion in tier 2 capital.
For disclosure purposes, this excess of expected losses over total impairment allowances in IRB portfolios is deducted 50 per cent from core equity tier 1 and 50 per cent from tier 2 capital. In addition, a tax credit adjustment is made to tier 1 capital to reflect the tax consequences insofar as they affect the availability of tier 1 capital to cover risks or losses.
Expected losses derived under Basel II rules represent losses that would be expected in the scenario of a severe downturn over a 12-month period. This definition differs from loan impairment allowances, which only address losses incurred within lending portfolios at the balance sheet date and are not permitted to recognise the additional level of conservatism that the regulatory measure requires by the adoption of through-the-cycle, downturn and stressed conditions that may not exist at the balance sheet date.
The effect of deducting the difference between expected losses and total impairment allowances is to equate the total effect on capital with the regulatory definition of expected losses. As expected losses are based on long-term estimates and incorporate through-the-cycle considerations, they are expected to be less volatile than actual loss experience. The impact of this deduction, however,
may vary from time to time as the accounting measure of impairment moves closer to or further away from the regulatory measure of expected losses.
The FSA’s rules permit the inclusion of profits in tier 1 capital to the extent that they have been verified in accordance with the FSA’s General Prudential Sourcebook by the external auditor. Verification procedures covering profits for the year to 31 December 2008 were completed by the external auditor on 2 March 2009 and therefore these profits have been included in the Group’s tier 1 capital. Technically, from 1 January 2008, the FSA’s regulatory reporting forms defer the recognition of these profits in tier 1 capital until the conclusion of the external auditor’s procedures.
Basel II provides three approaches of increasing sophistication to the calculation of pillar 1 credit risk capital requirements. The most basic, the standardised approach, requires banks to use external credit ratings to determine the risk weightings applied to rated counterparties, and groups other counterparties into broad categories and applies standardised risk weightings to these categories. The next level, the internal ratings-based (‘IRB’) foundation approach, allows banks to calculate their credit risk capital requirements on the basis of their internal assessment of the probability that a counterparty will default (‘PD’), but with quantification of exposure at default (‘EAD’) and loss given default (‘LGD’) estimates being subject to standard supervisory parameters. Finally, the IRB advanced approach allows banks to use their own internal assessment of not only PD but also the quantification of EAD and LGD. The regulatory measure of expected losses is calculated by multiplying PD by EAD and LGD. The capital resources requirement under the IRB approaches is intended to cover unexpected losses and is derived from a formula specified in the regulatory rules, which incorporates these factors and other variables such as maturity and correlation.
For credit risk, with FSA approval, HSBC has adopted the IRB advanced approach for the majority of its business with effect from 1 January 2008, with the remainder on either IRB foundation or standardised approaches. For consolidated group reporting, the FSA’s rules permit the use of other regulators’ standardised approaches where they are considered equivalent. The use of other regulators’ IRB approaches is subject to the agreement of the FSA. A rollout plan, over the next few years, is in place to extend coverage of the advanced approaches, for both local and consolidated Group

277
reporting, leaving a small residue of exposures on the standardised approach.
Market risk is derived from fluctuations on trading book assets arising from changes in values, income, interest and foreign exchange rates and is measured using VAR models with FSA permission or the standard rules prescribed by the FSA. Counterparty credit risk in the trading book and the non-trading book is the risk that the counterparty to a transaction may default before completing the satisfactory settlement of the transaction. Three counterparty credit risk calculation approaches are defined by Basel II to determine exposure values, being the standardised, mark to market and the internal model method. These exposure values are then used to determine capital requirements using one of the credit risk approaches, standardised, IRB foundation and IRB advanced. Across the Group, HSBC uses both VAR and standard rules approaches for market risk and the mark to market and internal model method approaches for counterparty credit risk. It is the longer-term aim of HSBC to migrate more positions from standard rules to VAR for market risk and from mark to market to internal model method for counterparty credit risk.
Basel II also introduces capital requirements for operational risk and, again, contains three levels of sophistication. The capital required under the basic indicator approach is a simple percentage of gross revenues, whereas under the standardised approach it is one of three different percentages of gross revenues allocated to each of eight defined business lines. Both these approaches use an average of the last three financial years’ revenues. Finally, the advanced measurement approach uses banks’ own statistical analysis and modelling of operational risk data to determine capital requirements. HSBC has adopted the standardised approach to the determination of Group operational risk capital requirements.
The second pillar of Basel II (Supervisory Review and Evaluation Process – ‘SREP’) involves both firms and regulators taking a view on whether a firm should hold additional capital against risks not covered in pillar 1. Part of the pillar 2 process is the Internal Capital Adequacy Assessment Process (‘ICAAP’) which is the firm’s self assessment of the levels of capital that it needs to hold. The pillar 2 process culminates in the FSA providing firms with Individual Capital Guidance (‘ICG’). The ICG replaces the trigger ratio and is set as a capital resources requirement higher than that required under pillar 1.
Pillar 3 of Basel II is related to market discipline and aims to make firms more transparent by requiring them to publish specific, prescribed details of their risks, capital and risk management under the Basel II framework. On 10 November 2008, HSBC published summary qualitative pillar 3 disclosures (‘Interim Pillar 3 Disclosures 2008’) for 30 June 2008 on the investor relations section of its website, www.hsbc.com. HSBC expects to publish the first full set of pillar 3 disclosures for 31 December 2008, including quantitative tables, during the first half of 2009.
During 2007, HSBC was supervised under Basel I. Under Basel I, banking operations are categorised as either trading book or banking book and risk-weighted assets are determined accordingly. Banking book risk-weighted assets are measured by means of a hierarchy of risk weightings classified according to the nature of each asset and counterparty, taking into account any eligible collateral or guarantees. Banking book off-balance sheet items giving rise to credit, foreign exchange or interest rate risk are assigned weights appropriate to the category of the counterparty, taking into account any eligible collateral or guarantees. Trading book risk-weighted assets are determined by taking into account market-related risks such as foreign exchange, interest rate and equity position risks, and counterparty risk.
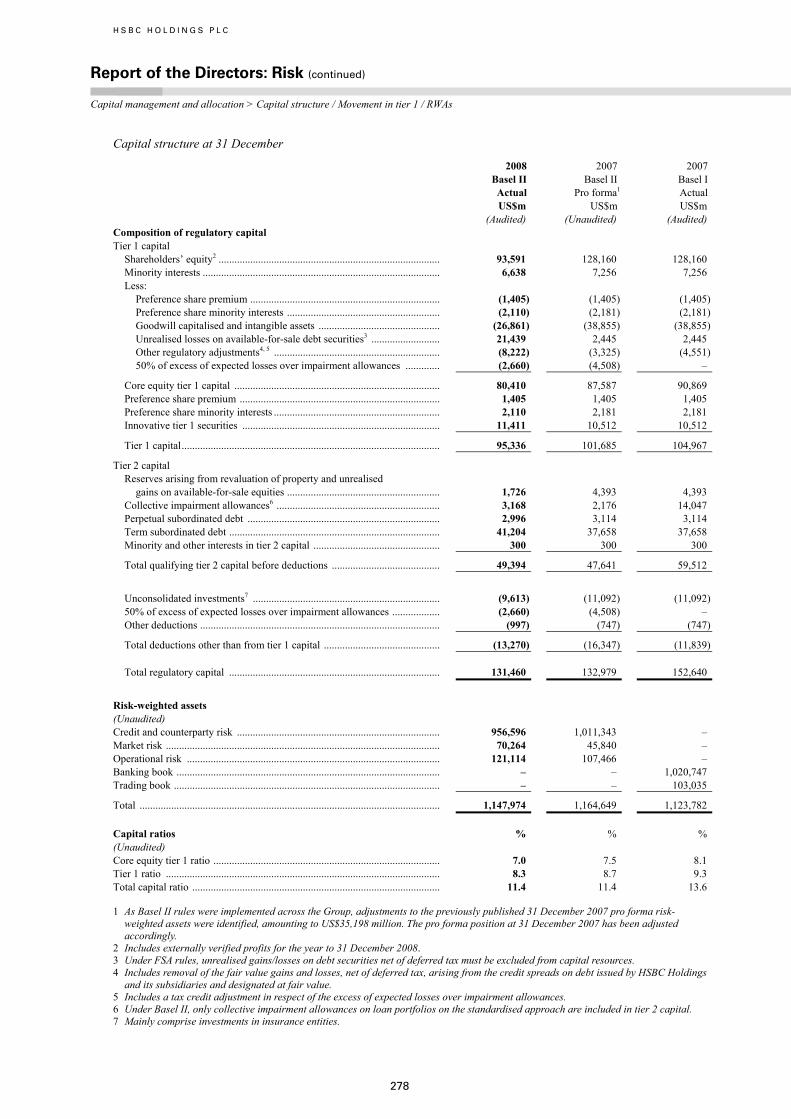
H S B C H O L D I N G S P L C
Report of the Directors: Risk (continued) Capital management and allocation > Capital structure / Movement in tier 1 / RWAs
278
Capital structure at 31 December
2008Basel IIActual
2007 Basel II
Pro forma1
2007 Basel IActual
US$m US$m US$m (Audited) (Unaudited) (Audited) Composition of regulatory capital Tier 1 capital
Shareholders’ equity2 .................................................................................... 93,591 128,160 128,160 Minority interests .......................................................................................... 6,638 7,256 7,256 Less: Preference share premium ........................................................................ (1,405) (1,405) (1,405) Preference share minority interests .......................................................... (2,110) (2,181) (2,181) Goodwill capitalised and intangible assets .............................................. (26,861) (38,855) (38,855) Unrealised losses on available-for-sale debt securities3 .......................... 21,439 2,445 2,445 Other regulatory adjustments4, 5 ............................................................... (8,222) (3,325) (4,551) 50% of excess of expected losses over impairment allowances ............. (2,660) (4,508) –
Core equity tier 1 capital .............................................................................. 80,410 87,587 90,869 Preference share premium ............................................................................ 1,405 1,405 1,405 Preference share minority interests ............................................................... 2,110 2,181 2,181 Innovative tier 1 securities ........................................................................... 11,411 10,512 10,512
Tier 1 capital.................................................................................................. 95,336 101,685 104,967
Tier 2 capital Reserves arising from revaluation of property and unrealised
gains on available-for-sale equities .......................................................... 1,726 4,393 4,393 Collective impairment allowances6 .............................................................. 3,168 2,176 14,047 Perpetual subordinated debt ......................................................................... 2,996 3,114 3,114 Term subordinated debt ................................................................................ 41,204 37,658 37,658 Minority and other interests in tier 2 capital ................................................ 300 300 300
Total qualifying tier 2 capital before deductions ......................................... 49,394 47,641 59,512
Unconsolidated investments7 ....................................................................... (9,613) (11,092) (11,092)50% of excess of expected losses over impairment allowances .................. (2,660) (4,508) – Other deductions ........................................................................................... (997) (747) (747)
Total deductions other than from tier 1 capital ............................................ (13,270) (16,347) (11,839) Total regulatory capital ................................................................................ 131,460 132,979 152,640
Risk-weighted assets (Unaudited) Credit and counterparty risk ............................................................................. 956,596 1,011,343 – Market risk ........................................................................................................ 70,264 45,840 – Operational risk ................................................................................................ 121,114 107,466 – Banking book .................................................................................................... – – 1,020,747 Trading book ..................................................................................................... – – 103,035
Total .................................................................................................................. 1,147,974 1,164,649 1,123,782 Capital ratios % % % (Unaudited) Core equity tier 1 ratio ...................................................................................... 7.0 7.5 8.1 Tier 1 ratio ........................................................................................................ 8.3 8.7 9.3 Total capital ratio .............................................................................................. 11.4 11.4 13.6
1 As Basel II rules were implemented across the Group, adjustments to the previously published 31 December 2007 pro forma risk-weighted assets were identified, amounting to US$35,198 million. The pro forma position at 31 December 2007 has been adjusted accordingly.
2 Includes externally verified profits for the year to 31 December 2008. 3 Under FSA rules, unrealised gains/losses on debt securities net of deferred tax must be excluded from capital resources. 4 Includes removal of the fair value gains and losses, net of deferred tax, arising from the credit spreads on debt issued by HSBC Holdings
and its subsidiaries and designated at fair value. 5 Includes a tax credit adjustment in respect of the excess of expected losses over impairment allowances. 6 Under Basel II, only collective impairment allowances on loan portfolios on the standardised approach are included in tier 2 capital. 7 Mainly comprise investments in insurance entities.

279
Source and application of tier 1 capital (Audited)
2008 Basel II US$m
2007 Basel I US$m
Movement in tier 1 capital (Audited) At 1 January ......................................................................................................................................... 104,967 87,842 Changes to tier 1 capital arising from transition to pro forma Basel II basis2 .................................... (3,282)
Opening pro-forma tier 1 capital under Basel II rules2 ....................................................................... 101,685 Consolidated profits attributable to shareholders of the parent company .......................................... 5,728 19,133 Dividends to shareholders ................................................................................................................... (11,301) (10,241) Add back: shares issued in lieu of dividends .................................................................................. 3,593 4,351 Decrease/(increase) in goodwill and intangible assets deducted ........................................................ 11,994 (2,366)Removal of own credit spread.............................................................................................................. (4,610) (2,205)Ordinary shares issued ......................................................................................................................... 470 477 Innovative tier 1 securities issued ....................................................................................................... 2,133 – Other (including exchange differences) 2 ............................................................................................ (14,356) 7,976
At 31 December ................................................................................................................................... 95,336 104,967
Movement in risk-weighted assets (Unaudited)
At 1 January ......................................................................................................................................... 1,123,782 938,678 Changes arising to risk-weighted assets from transition to pro forma Basel II basis1 ........................ 40,867
Opening Basel II pro forma risk-weighted assets ............................................................................... 1,164,649 Movements ........................................................................................................................................... (16,675) 185,104
At 31 December ................................................................................................................................... 1,147,974 1,123,782
1 As Basel II rules were implemented across the Group, adjustments to the previously published 31 December 2007 pro forma risk-weighted assets were identified, amounting to US$35,198 million. The pro forma position at 31 December 2007 has been adjusted accordingly.
2 Pro forma capital items as at 1 January 2008 are unaudited.
Movement in tier 1 capital (Audited)
HSBC complied with the FSA’s capital adequacy requirements throughout 2008 and 2007. Opening tier 1 capital at 1 January 2008 was reduced by US$3.3 billion arising from the transition to Basel II. Profits attributable to shareholders of the parent company of US$5.7 billion included goodwill write-offs of US$10.6 billion and profits from own credit spread, net of deferred tax, of US$4.7 billion, neither of which impact regulatory capital. The resulting contribution to tier 1 capital was therefore US$11.6 billion. Dividends to shareholders of US$11.3 billion were partly offset by shares issued, including those issued in lieu of dividends, of US$4.1 billion and innovative tier 1 securities issued of US$2.1 billion. The strengthening US dollar caused foreign currency translation differences, mainly on the investment in non-US dollar subsidiaries, which reduced tier 1 capital by US$11.8 billion.
Movement in risk-weighted assets (Unaudited)
Total RWAs increased by US$24 billion. The transition to Basel II at 1 January 2008 increased RWAs by US$41 billion, meaning that RWAs on a Basel II basis fell by US$17 billion during the year. Foreign exchange translation effects are estimated to have reduced RWAs by US$80 billion, again a result of the strengthening US dollar, particularly against sterling, resulting in an estimated underlying increase of US$63 billion. Of this underlying increase, US$26 billion was due to credit and counterparty risk RWAs, reflecting decreases in North America being more than offset by increases in both Europe and Asia. Market risk RWAs increased by US$24 billion primarily due to the impact of market volatility. Operational risk RWAs increased by US$13 billion because the three year averaging of gross revenues used in the calculation now includes revenues for 2008 in place of 2005.

H S B C H O L D I N G S P L C
Report of the Directors: Risk (continued) Capital management and allocation > RWAs / Biographies > Directors
280
Risk-weighted assets by principal subsidiary (Unaudited)
In order to give an indication of how HSBC’s capital is deployed, the table below analyses the disposition
of risk-weighted assets by principal subsidiary. The risk-weighted assets are calculated using FSA rules and exclude intra-HSBC items.
Risk-weighted assets by principal subsidiary (Unaudited)
2008 Basel II
US$m
2007 Basel I US$m
The Hongkong and Shanghai Banking Corporation ......................................................................... 247,626 256,761 Hang Seng Bank ............................................................................................................................ 44,211 55,043The Hongkong and Shanghai Banking Corporation and other subsidiaries ................................. 203,415 201,718
HSBC Bank ....................................................................................................................................... 379,695 423,941 HSBC Private Banking Holdings (Suisse) .................................................................................... 20,422 32,942HSBC France ................................................................................................................................. 65,557 76,188HSBC Bank and other subsidiaries ............................................................................................... 293,716 314,811
HSBC North America ........................................................................................................................ 373,955 336,998 HSBC Finance ............................................................................................................................... 187,660 135,757HSBC Bank Canada ...................................................................................................................... 35,336 50,659HSBC Bank USA and other subsidiaries ...................................................................................... 150,959 150,582
HSBC Mexico .................................................................................................................................... 21,037 18,513 HSBC Bank Middle East ................................................................................................................... 35,217 25,226 HSBC Bank Malaysia ........................................................................................................................ 11,182 8,601 HSBC Brazil ...................................................................................................................................... 30,851 27,365 HSBC Bank Panama .......................................................................................................................... 9,498 7,824 Bank of Bermuda ............................................................................................................................... 4,759 4,133 Other .................................................................................................................................................. 34,154 14,420
1,147,974 1,123,782

H S B C H O L D I N G S P L C
Report of the Directors: Governance
Biographies > Directors
281
PageCorporate Governance Report ...................... 281Directors ....................................................... 281Secretary........................................................ 286Adviser to the Board .................................... 286Group Managing Directors ........................... 286Group General Managers ............................. 287Board of Directors ........................................ 290
The Board ................................................. 290Corporate governance codes .................... 294Board committees ..................................... 296Internal control ......................................... 299Directors’ interests .................................... 301
Employees .................................................... 303Employee involvement .............................. 303Employment of disabled persons .............. 303Remuneration policy .................................. 303Employee share plans ............................... 304Subsidiary company share plans ............... 308Employee compensation and benefits ....... 311
Corporate sustainability ................................ 312Corporate sustainability committee .......... 312Sustainability at HSBC ............................. 312Sustainability risk ..................................... 312Social and community investment ............. 312Health and safety ...................................... 313Supplier payment policy ........................... 313
Dividends, shareholders and meetings ......... 313Dividends for 2008 ................................... 313Dividends for 2009 ................................... 313Communication with shareholders ........... 313Notifiable interests in share capital .......... 314Dealings in HSBC Holdings shares .......... 314Annual General Meeting ........................... 314
Corporate Governance Report
The information set out on pages 281 to 314 and information incorporated by reference constitutes the Corporate Governance Report of HSBC Holdings.
Directors
S K Green, Group Chairman
Age 60. An executive Director since 1998; Group Chief Executive from 2003 to 2006. Joined HSBC in 1982. Chairman of HSBC Bank plc and HSBC Private Banking Holdings (Suisse) SA. A Director of HSBC France, HSBC North America Holdings Inc. and The Hongkong and Shanghai Banking Corporation Limited. Executive Director, Corporate, Investment Banking and Markets from 1998 to 2003. Chairman of The British Bankers’ Association.
Mr Green is a career banker having joined The Hongkong and Shanghai Banking Corporation Limited in 1982 with responsibility for corporate planning activities. In 1992 he became Group Treasurer of HSBC Holdings plc, with responsibility for the HSBC Group’s treasury and capital markets businesses globally. He has worked in Hong Kong, New York, the Middle East and London and has immense international experience and knowledge of the HSBC Group.
M F Geoghegan, CBE, Group Chief Executive
Age 55. An executive Director since 2004. Joined HSBC in 1973. Chairman of the Group Management Board. Chairman of HSBC Bank USA, N.A., HSBC Bank Canada, HSBC Latin America Holdings (UK) Limited and HSBC USA Inc. Deputy Chairman of HSBC Bank plc. A Director of The Hongkong and Shanghai Banking Corporation Limited, and HSBC North America Holdings Inc. Chief Executive of HSBC Bank plc from 2004 to 2006. Responsible for all of HSBC’s business throughout South America from 2000 to 2003. President of HSBC Bank Brasil S.A. – Banco Múltiplo from 1997 to 2003.
Mr Geoghegan is a career banker with over 35 years’ international experience with HSBC. He has worked in the Americas, Asia, the Middle East and Europe. He established the Group’s operations in Brazil in 1997 following the creation of Banco HSBC Bamerindus S.A and in 2003 he was honoured with a CBE in recognition of his contribution to British business interests in Brazil.
† S A Catz
Age 47. President and Chief Financial Officer of Oracle Corporation. A non-executive Director since 1 May 2008. Managing Director of Donaldson, Lufkin & Jenrette from 1997 to 1999. Joined Oracle in 1999 and appointed to the Board of Directors in 2001.
Ms Catz brings to the Board a background in international business leadership, having helped

H S B C H O L D I N G S P L C
Report of the Directors: Governance (continued)
Biographies > Directors
282
transform Oracle into the second biggest producer of management software and the world’s leading supplier of software for information management.
† M K T Cheung, GBS, OBE
Age 61. A non-executive Director since 1 February 2009. A non-executive Director of Hang Seng Bank Limited, HKR International Limited, Hong Kong Exchanges and Clearing Limited and Sun Hung Kai Properties Limited. A non-official member of the Executive Council of the Hong Kong Special Administrative Region, Chairman of the Airport Authority Hong Kong, Chairman of the Council of the Hong Kong University of Science and Technology and a Council Member of the Open University of Hong Kong. A Director of The Association of Former Council Members of The Stock Exchange of Hong Kong Limited and The Hong Kong International Film Festival Society Limited. Chairman and Chief Executive Officer of KPMG Hong Kong from 1996 to 2003. Awarded the Gold Bauhinia Star by the Hong Kong Government in 2008.
Dr Cheung brings to the Board a wealth of experience in international business and financial accounting, particularly in Greater China and the wider Asian economy. He retired from KPMG Hong Kong in 2003 after more than 30 years distinguished service with the firm. He is a Chartered Accountant and a Fellow of the Institute of Chartered Accountants in England and Wales.
V H C Cheng, GBS, OBE
Age 60. Chairman of The Hongkong and Shanghai Banking Corporation Limited. An executive Director since 1 February 2008. Joined HSBC in 1978. Appointed a Group General Manager in 1995 and a Group Managing Director in 2005. Chairman of HSBC Bank (China) Company Limited and HSBC Global Asset Management (Hong Kong) Limited and a non-executive Director of HSBC Bank Australia Limited and HSBC Bank (Vietnam) Limited. A Director of Great Eagle Holdings Limited and a Member of the Exchange Fund Advisory Committee of the Hong Kong Monetary Authority. Vice Chairman of the China Banking Association. Appointed a member of the National Committee of the 11th Chinese People’s Political Consultative Conference (‘CPPCC’), and a senior adviser to the 11th Beijing Municipal Committee of the CPPCC. A Director of Swire Pacific Limited from 2005 to January 2008. Awarded the Gold Bauhinia Star by the Hong Kong Government in 2005.
Mr Cheng is a career banker with extensive international business experience particularly in Asia. Mr Cheng was Chairman of the Process Review Panel for the Securities and Futures Commission and is Chairman of the Standing Committee on Directorate Salaries and Conditions of Service of the Hong Kong Government. He is also Vice President of the Hong Kong Institute of Bankers. From 1989 to 1991, he was seconded to the Hong Kong Government’s Central Policy Unit and served as an adviser to the Governor of Hong Kong.
† J D Coombe Age 63. Non-executive Chairman of Hogg Robinson Group plc. A non-executive Director since 2005. A member of the Group Audit Committee and of the Remuneration Committee. A non-executive Director of Home Retail Group plc. A trustee of the Royal Academy Trust. Former appointments include: executive Director and Chief Financial Officer of GlaxoSmithKline plc; member of the Supervisory Board of Siemens AG; Chairman of The Hundred Group of Finance Directors and a member of the Accounting Standards Board.
Mr Coombe brings to the Board a wealth of experience in international business, financial accounting and the pharmaceutical industry. As Chief Financial Officer of GlaxoSmithKline he had responsibility for the Group’s financial operations globally. He is a Chartered Accountant and is a Fellow of the Institute of Chartered Accountants in England and Wales.
† J L Durán Age 44. A non-executive Director of France Telecom. A non-executive Director since 1 January 2008. Chief Executive of Carrefour SA until 31 December 2008. Former appointments at Carrefour SA include: Chairman of its Management Board of Directors; Chief Financial Officer and Managing Director, Organisation and Systems.
Mr Durán brings to the board a background in international finance, retail and consulting in developed and emerging markets. He joined Carrefour SA in 1991 and held a number of positions within Carrefour’s businesses in Spain, southern Europe and the Americas.
† R A Fairhead
Age 47. Chairman, Chief Executive Officer and Director of Financial Times Group Limited. A non-executive Director since 2004. Chairman of the Group Audit Committee and a member of the Nomination Committee. A Director of Pearson plc

283
and Chairman of Interactive Data Corporation. A non-executive Director of The Economist Newspaper Limited. Former appointments include: Executive Vice President, Strategy and Group Control of Imperial Chemical Industries plc; and Finance Director of Pearson plc.
Mrs Fairhead brings to the Board a wealth of experience in international industry, publishing, finance and general management. As the former Finance Director of Pearson plc she oversaw the day to day running of the finance function and was directly responsible for global financial reporting and control, tax and treasury. She has a Masters in Business Administration from the Harvard Business School.
D J Flint, CBE, Group Finance Director
Age 53. Joined HSBC as an executive Director in 1995. Chairman of HSBC Finance Corporation and a Director of HSBC North America Holdings Inc. A non-executive Director of BP p.l.c. and a member of the Consultative Committee of the Large Business Advisory Board of HM Revenue & Customs and the Business Government Forum on Tax and Globalisation. Co-Chairman of the Counterparty Risk Management Policy Group III. Chaired the Financial Reporting Council’s review of the Turnbull Guidance on Internal Control. Served on the Accounting Standards Board and the Standards Advisory Council of the International Accounting Standards Board from 2001 to 2004. A former partner in KPMG.
Mr Flint has extensive financial experience particularly in banking, multinational financial reporting, treasury and securities trading operations. In 2006 he was honoured with a CBE in recognition of his services to the finance industry. He is a member of the Institute of Chartered Accountants of Scotland and the Association of Corporate Treasurers and he is a Fellow of The Chartered Institute of Management Accountants.
A A Flockhart, CBE
Age 57. Chief Executive Officer of The Hongkong and Shanghai Banking Corporation Limited and Global Head of Commercial Banking. An executive Director since 1 May 2008. Joined HSBC in 1974. Appointed a Group Managing Director in 2006. Appointed Vice Chairman and a Director of HSBC Bank (Vietnam) Limited on 24 November 2008. A Director of Hang Seng Bank Limited, HSBC Bank Australia Limited, HSBC Bank (China) Company Limited and Chairman of HSBC Bank Malaysia Berhad. President and Group Managing Director
Latin America and the Caribbean from 2006 to July 2007. Chief Executive Officer, Mexico from 2002 to 2006. Senior Executive Vice-President, Commercial Banking, HSBC Bank USA, N.A. from 1999 to 2002. Managing Director of The Saudi British Bank from 1997 to 1999.
Mr Flockhart is a career banker, being an emerging markets specialist with over 30 years’ experience with HSBC across Latin America, the Middle East and Asia. In 2007 he was honoured with a CBE in recognition of his services to British business and charitable services and institutions in Mexico.
* W K L Fung, SBS, OBE
Age 60. Group Managing Director of Li & Fung Limited. A non-executive Director since 1998. Chairman of the Corporate Sustainability Committee. Non-executive Deputy Chairman of The Hongkong and Shanghai Banking Corporation Limited. A non-executive Director of Integrated Distribution Services Group Limited, Convenience Retail Asia Limited and an independent non-executive Director of Shui On Land Limited and VTech Holdings Limited. Former appointments include: non-executive Director of Bank of Communications; Chairman of the Hong Kong General Chamber of Commerce; the Hong Kong Exporters’ Association; and the Hong Kong Committee for the Pacific Economic Cooperation Council. Awarded the Silver Bauhinia Star by the Hong Kong Government in 2008.
Mr Fung brings to the Board 30 years’ experience in running a major international conglomerate specialising in supply chain management through the borderless manufacturing of global consumer products. During his leadership the family business of Li & Fung has become one of the largest trading companies in Hong Kong with over 80 offices worldwide.
S T Gulliver
Age 49. Chief Executive of Global Banking and Markets and HSBC Global Asset Management. An executive Director since 1 May 2008. Joined HSBC in 1980. Appointed a Group Managing Director in 2004. Chairman of HSBC France. A Director of HSBC Bank plc, HSBC North America Holdings Inc., HSBC Private Banking Holdings (Suisse) SA and The Hongkong and Shanghai Banking Corporation Limited. Deputy Chairman and member of the Supervisory Board of HSBC Trinkaus & Burkhardt AG. Co-Head of Global Banking and Markets from 2003 to 2006. Head of Global Markets

H S B C H O L D I N G S P L C
Report of the Directors: Governance (continued)
Biographies > Directors
284
from 2002 to 2003. Head of Treasury and Capital Markets in Asia-Pacific from 1996 to 2002.
Mr Gulliver is a career banker with over 28 years’ international experience with HSBC. He has held a number of key roles in the Group’s operations worldwide, including in London, Hong Kong, Tokyo, Kuala Lumpur and the United Arab Emirates. Global Banking and Markets is the wholesale banking division of the Group with operations in more than 60 countries and territories.
† J W J Hughes-Hallett, SBS
Age 59. Chairman of John Swire & Sons Limited. A non-executive Director since 2005. A member of the Group Audit Committee and of the Nomination Committee. A non-executive Director of The Hongkong and Shanghai Banking Corporation Limited from 1999 to 2004. A non-executive Director and former Chairman of Cathay Pacific Airways Limited and Swire Pacific Limited. A director of China Festival 2008. A trustee of the Dulwich Picture Gallery and the Esmée Fairbairn Foundation. A member of The Hong Kong Association, the Governing Body of the School of Oriental and African Studies, University of London and of the Governing Board of the Courtauld Institute of Art. Awarded the Silver Bauhinia Star by the Hong Kong Government in 2008.
Mr Hughes-Hallett brings to the Board a background in financial accounting and the management of a broad range of businesses in a number of international industries, including aviation, property, manufacturing and trading, in the United Kingdom, Far East and Australia. He is a Fellow of the Institute of Chartered Accountants in England and Wales.
† W S H Laidlaw
Age 53. Chief Executive Officer of Centrica plc. A non-executive Director since 1 January 2008. A member of the Remuneration Committee. Former appointments include: Executive Vice President of Chevron Corporation; independent non-executive Director of Hanson PLC; Chief Executive Officer of Enterprise Oil plc; and President and Chief Operating Officer of Amerada Hess Corporation.
Mr Laidlaw brings to the Board significant international experience, particularly in the energy sector, having had responsibility for businesses in four continents.
† J R Lomax
Age 63. Former Deputy Governor, Monetary Stability, at the Bank of England and member of the Monetary Policy Committee. A non-executive Director since 1 December 2008. A member of the Group Audit Committee since 1 March 2009. A non-executive director of The Scottish American Investment Company PLC. Former appointments include: Director of the Bank of England from 2003 to 30 June 2008; Serving as Permanent Secretary at the UK Government Departments for Transport and Work and Pensions and at the Welsh Office; and Vice President and Chief of Staff to the President of the World Bank from 1995 to 1996.
Ms Lomax brings to the board business experience in both the public and private sectors and a deep knowledge of the operation of the UK government and the financial system.
† Sir Mark Moody-Stuart, KCMG
Age 68. Chairman of Anglo American plc. A non-executive Director since 2001. Chairman of the Remuneration Committee and a member of the Corporate Sustainability Committee. A non-executive Director of Accenture Limited and Saudi Aramco. Chairman of the Global Business Coalition on HIV/AIDS and the Global Compact Foundation. Former appointments include: Director and Chairman of The ‘Shell’ Transport and Trading Company, plc; Chairman of the Committee of Managing Directors of the Royal Dutch/Shell Group of Companies; and a Governor of Nuffield Hospitals.
Sir Mark brings to the Board many years’ experience of leading global organisations and of having worked during his career in nine countries. He works with many non-governmental organisations to improve companies’ commitment to socially responsible activities. He is a member of the steering committee responsible for driving the global governance initiative of the World Economic Forum, an independent foundation committed to developing a world-class corporate governance system.
† G Morgan
Age 63. Non-executive chairman of SNC-Lavalin Group Inc. A non-executive Director since 2006. A member of the Remuneration Committee. A member of the Board of Trustees of The Fraser Institute and the Manning Centre for Building Democracy. A non-executive Director of HSBC Bank Canada from 1996 to 2006. Former appointments include: Founding President, Chief Executive Officer and Vice Chairman of EnCana Corporation; Director of Alcan Inc. and Lafarge North America, Inc.

285
Mr Morgan brings to the Board a background in technical, operational, financial and management positions and has led large international companies in the energy and engineering sectors. He has been recognised as Canada’s most respected Chief Executive Officer in a national poll of Chief Executives. He is currently a business columnist for Canada’s largest national newspaper.
† N R N Murthy, CBE
Age 62. Chairman and Chief Mentor and former Chief Executive Officer of Infosys Technologies Limited. A non-executive Director since 1 May 2008. A member of the Corporate Sustainability Committee. An independent non-executive Director of Unilever plc and New Delhi Television Limited and a Director of the United Nations Foundation. A former independent non-executive Director of DBS Group Holdings Limited and DBS Bank Limited.
Mr Murthy brings to the Board experience in information technology, corporate governance and education, particularly in India. He founded Infosys Technologies Limited in India in 1981 and was its Chief Executive Officer for 21 years. Under his leadership, Infosys established a global footprint and was listed on NASDAQ in 1999. During his career he has worked in France and India.
† S M Robertson, senior independent non-executive Director
Age 67. Non-executive Chairman of Rolls-Royce Group plc and the founder member of Simon Robertson Associates LLP. A non-executive Director since 2006 and senior independent non-executive Director since May 2007. A member of the Nomination Committee. A non-executive Director of Berry Bros. & Rudd Limited, The Economist Newspaper Limited and Royal Opera House, Covent Garden Limited. A trustee of the Eden Project Trust and of the Royal Opera House Endowment Fund. Former appointments include: Managing Director of Goldman Sachs International; and Chairman of Dresdner Kleinwort Benson.
Mr Robertson brings to the Board a background in international corporate advisory with a wealth of experience in mergers and acquisitions, merchant banking, investment banking and financial markets. During his career he has worked in France, Germany, the UK and the USA.
† J L Thornton
Age 55. A non-executive Director since 1 December 2008. Non-executive Chairman and Director of HSBC North America Holdings Inc since 1 December 2008. Professor and Director of the Global Leadership Program at the Tsinghua University School of Economics and Management. Chairman of the Brookings Institution Board of Trustees. Director of Ford Motor Company, Intel Corporation, Inc., News Corporation, Inc., National Committee on United States-China Relations and China Unicom (Hong Kong) Limited. Trustee of Asia Society, China Institute and The China Foreign Affairs University. Member of the Council on Foreign Relations, the China Securities Regulatory Commission International Advisory Committee and China Reform Forum International Advisory Committee. Former appointments include: Director of Industrial and Commercial Bank of China Limited from 2005 until 20 November 2008; and President Co-Chief Operating Officer of the Goldman Sachs Group, Inc. from 1999 until 2003.
Mr Thornton brings to the Board experience that bridges developed and developing economies and the public and private sectors. He has a deep knowledge of financial services and education systems, particularly in Asia. During his 23 year career with Goldman Sachs, he played a key role in the firm's global development and was Chairman of Goldman Sachs Asia.
† Sir Brian Williamson, CBE
Age 64. Chairman of Electra Private Equity plc. A non-executive Director since 2002. Chairman of the Nomination Committee. A Director of NYSE Euronext and Climate Exchange plc. A senior adviser to Fleming Family and Partners. Former appointments include: Chairman of London International Financial Futures and Options Exchange; Gerrard Group plc; Resolution Life Group Limited; and non-executive Director of Resolution plc, the Financial Services Authority and the Court of The Bank of Ireland.
Sir Brian brings to the board extensive experience in futures, options and commodities trading internationally. He established the London International Financial Futures and Options Exchange in the 1980s and led the Exchange’s development of its electronic trading platform in the mid-1990s. He is a member of the Guild for International Bankers.
* Non-executive Director † Independent non-executive Director

H S B C H O L D I N G S P L C
Report of the Directors: Governance (continued)
Biographies > Directors / Senior management
286
Secretary
R G Barber
Age 58. Group Company Secretary. Appointed a Group General Manager in 2006. Joined HSBC in 1980. Company Secretary of HSBC Holdings plc since 1990. Chairman of the Disclosure Committee. A member of the Listing Authority Advisory Committee of the Financial Services Authority and of the Primary Markets Group of the London Stock Exchange. Corporation Secretary of The Hongkong and Shanghai Banking Corporation Limited from 1986 to 1992 and Company Secretary of HSBC Bank plc from 1994 to 1996.
Adviser to the Board
D J Shaw
Age 62. An Adviser to the Board since 1998. Solicitor. A former partner in Norton Rose. A Director of The Bank of Bermuda Limited and HSBC Private Banking Holdings (Suisse) SA. A non-executive Director of Kowloon Development Company Limited and Shui On Land Limited.
Group Managing Directors
A Almeida
Age 52. Group Head of Human Resources. A Group Managing Director since 25 February 2008. Joined HSBC in 1992. Appointed a Group General Manager in June 2007. Global Head of Human Resources for Global Banking and Markets, Private Banking, Global Transaction Banking and HSBC Amanah from 1996 to June 2007.
E Alonso
Age 53. Group Managing Director and Head of HSBC Latin America and the Caribbean. A Group Managing Director since 1 May 2008. Joined HSBC in 1997. Appointed a Group General Manager in 2006. Chairman Grupo Financiero HSBC, S.A. de C.V. and HSBC México, S.A., Institución de Banca Múltiple, Grupo Financiero HSBC. Deputy Chief Executive of HSBC Investment Bank Brasil S.A. – Banco de Investimento. Director of HSBC Argentina Holdings S.A. and HSBC Bank Brasil S.A. – Banco Múltiplo. Managing Director of HSBC (Brasil) Administradora de Consorcio Ltda. and HSBC Serviços e Participaçoes Ltda. President of the Board of Directors of HSBC Bank (Panamá) S.A.
C C R Bannister
Age 50. Group Managing Director, Insurance. A Group Managing Director since 2006. Joined HSBC in 1994. Chairman of HSBC Insurance Holdings Limited and Director of HSBC Insurance Brokers Limited since 16 January 2009. Chief Executive Officer, HSBC Group Private Banking from 1998 to 2006. Deputy Chief Executive Officer, HSBC Securities (USA) Inc. from 1996 to 1997.
K M Harvey
Age 48. Group Chief Technology and Services Officer. A Group Managing Director since 1 October 2008. Joined HSBC Finance in 1989. Group Chief Information Officer from 2004 to 30 September 2008. President of HSBC Technology and Services (USA) Inc. from 2003 to 2004. Group Executive for HSBC North America from 1993 to 2002. Managing Director of Data Processing, HFC Bank Limited from 1992 to 1993. Director of Banking Systems, HSBC North America from 1990 to 1992.
A C Hungate
Age 42. Global Head of Personal Financial Services and Marketing. Joined HSBC as a Group Managing Director in September 2007. Chairman of HSBC Bank A.S. since 6 January 2009. Formerly Managing Director, Asia Pacific at Reuters. Worldwide Chief Marketing Officer of Reuters between 2002 and 2005.
D D J John
Age 58. Deputy Chairman and Chief Executive, HSBC Bank plc. A Group Managing Director since 2006. Joined HSBC Bank plc in 1971. Deputy Chief Executive of HSBC Bank plc from 2005 to 2006 and Chief Operating Officer from 2003 to 2005. Deputy Chairman and Chief Executive Officer, HSBC Bank Malaysia Berhad from 1999 to 2002.
B P McDonagh
Age 50. Chief Executive Officer, HSBC North America Holdings Inc. A Group Managing Director since 21 February 2008. Joined HSBC in 1979. A Director of HSBC Bank Canada, HSBC Finance Corporation, HSBC Latin America Holdings (UK) Limited and HSBC North America Holdings Inc. Chief Executive Officer, HSBC Finance Corporation and Chief Operating Officer of HSBC North America Holdings Inc. from February 2007 to 21 February 2008. Chief Operating Officer, HSBC Bank USA, N.A. from 2004 to 2006.

287
Y A Nasr
Age 54. Group Managing Director, Strategic Investments. Chairman and Chief Executive of HSBC Bank Middle East Limited. A Group Managing Director since 2004. Joined HSBC in 1976. Deputy Chairman of HSBC Bank Egypt S.A.E. and a Director of HSBC Private Banking Holdings (Suisse) SA. Deputy Chairman of HSBC Bank Middle East Limited from May 2007 to 1 December 2008. President, HSBC Bank Brasil S.A. – Banco Múltiplo from 2003 to 2006. President and Chief Executive Officer of HSBC USA Inc. and HSBC Bank USA, N.A. from 1999 to 2003. President and Chief Executive Officer of HSBC Bank Canada from 1997 to 1999.
B Robertson
Age 54. Group Chief Risk Officer. A Group Managing Director since 25 February 2008. Joined HSBC in 1975. Appointed a Group General Manager in 2003. Group General Manager, Group Credit and Risk from 2005 to September 2007. Head of Global Banking and Markets for North America from 2003 to 2005.
P A Thurston
Age 55. Managing Director, UK Banking. A Group Managing Director since 1 May 2008. Joined HSBC in 1975. Appointed a Group General Manager in 2003. A Director of HSBC Bank plc since 1 June 2008. Former Chairman of Grupo Financiero HSBC, S.A. de C.V. and former Chief Executive Officer of HSBC México, S.A., Institución de Banca Múltiple, Grupo Financiero HSBC.
Group General Managers
P Y Antika
Age 48. Chief Executive Officer, HSBC Turkey. Joined HSBC in 1990. Appointed a Group General Manager in 2005.
S Assaf
Age 48. Head of Global Markets. Joined HSBC in 1994. Appointed a Group General Manager on 29 May 2008.
R S Beck
Age 42. Group General Manager, Communications Director. Joined HSBC in 1989. Appointed a Group General Manager on 29 May 2008.
R E T Bennett
Age 57. Group General Manager, Legal and Compliance. Joined HSBC in 1979. Appointed a Group General Manager in 1998.
N S K Booker
Age 50. Chief Executive Officer, HSBC Finance Corporation and Deputy Chief Executive Officer, HSBC North America Holdings Inc. Joined HSBC in 1981. Appointed a Group General Manager in 2004.
P W Boyles
Age 53. Chief Executive Officer, HSBC France. Joined HSBC in 1975. Appointed a Group General Manager in 2006.
D C Budd
Age 55. Chairman of HFC Bank Limited and a Director of HSBC Bank plc. Joined HSBC in 1972. Appointed a Group General Manager in 2005.
Z J Cama
Age 61. Group General Manager International. Joined HSBC in 1968. Appointed a Group General Manager in 2001.
R P Contractor
Age 51. Group General Manager, Service Delivery. Joined HSBC in 1987. Appointed a Group General Manager on 27 October 2008.
S N Cooper
Age 41. President and Chief Executive Officer, HSBC Korea. Joined HSBC in 1989. Appointed a Group General Manager on 29 May 2008.

H S B C H O L D I N G S P L C
Report of the Directors: Governance (continued)
Biographies > Senior Management
288
J E Coverdale
Age 52. Managing Director, The Saudi British Bank. Joined HSBC in 1977. Appointed a Group General Manager on 29 May 2008.
T M Detelich
Age 52. President, Consumer and Mortgage Lending, HSBC Finance Corporation. Joined HSBC Finance Corporation in 1976. Appointed a Group General Manager in 2006.
I M Dorner
Age 54. Deputy Chairman and Chief Executive Officer, HSBC Bank Malaysia Berhad. Joined HSBC in 1986. Appointed a Group General Manager in 2007.
A S El Anwar
Age 62. Chairman and Chief Executive Officer, HSBC Bank Egypt S.A.E. Joined HSBC in 1991. Appointed a Group General Manager on 29 May 2008.
C Engel
Age 51. Regional Director Personal Financial Services, HSBC Asia Pacific. Joined HSBC in 2003. Appointed a Group General Manager on 29 May 2008.
D L Fried
Age 47. Regional Head of Insurance, HSBC Asia Pacific. Joined HSBC in 1984. Appointed a Group General Manager on 29 May 2008.
A Y M Fung
Age 48. Head of Global Markets and Treasurer, HSBC Asia Pacific. Joined HSBC in 1996. Appointed a Group General Manager on 29 May 2008.
J D Garner
Age 39. Group General Manager, Personal Financial Services and Direct Businesses, HSBC Bank plc. Joined HSBC in 2004. Appointed a Group General Manager in 2006.
J L Gordon
Age 56. President and Chief Executive Officer, HSBC Bank Canada. Joined HSBC in 1987. Appointed a Group General Manager in 2005.
M Hussain
Age 48. Chief Executive Officer, Global HSBC Amanah and Global Banking and Markets, Middle East and North Africa. Joined HSBC in 1993. Appointed a Group General Manager on 29 May 2008.
A M Keir
Age 50. Group General Manager, Commercial Banking, HSBC Europe and Global Co-Head Commercial Banking. Joined HSBC in 1981. Appointed a Group General Manager in 2006.
N L Kidwai
Age 51. Chief Executive Officer, HSBC India. Joined HSBC in 2002. Appointed a Group General Manager in 2006.
M J W King
Age 52. Group General Manager, Internal Audit. Joined HSBC in 1986. Appointed a Group General Manager in 2002.
P J Lawrence
Age 47. Head of Global Banking and Markets, HSBC USA. President and Chief Executive Officer, HSBC Bank USA, N.A. and HSBC USA Inc. Director of HSBC North America Holdings Inc. Joined HSBC in 1982. Appointed a Group General Manager in 2005.
M Leung
Age 56. Global Co-Head Commercial Banking. Joined HSBC in 1978. Appointed a Group General Manager in 2005.
A Long
Age 53. Head of Global Transaction Banking. Joined HSBC in 1977. Appointed a Group General Manager on 29 May 2008.
A M Losada
Age 54. President and Chief Executive Officer, HSBC Argentina. Joined HSBC in 1973. Appointed a Group General Manager on 29 May 2008
A M Mahoney
Age 46. Group General Manager and Head of International, HSBC Bank plc. Joined HSBC in 1983. Appointed a Group General Manager in 2006.

289
C M Meares
Age 51. Chief Executive Officer, Global Private Banking. Joined HSBC in 1980. Appointed a Group General Manager in 2006.
W G Menezes
Age 63. Group General Manager and Head of Group Cards. Joined HSBC Finance Corporation in 1996. Appointed a Group General Manager in 2006.
M S McCombe
Age 42. Global Chief Executive Officer, HSBC Global Asset Management. Joined HSBC in 1987. Appointed a Group General Manager on 29 May 2008.
K Newman
Age 51. Director of One HSBC. Joined HSBC in 1989. Appointed a Group General Manager in 2006.
R C F Or
Age 59. Vice-Chairman and Chief Executive, Hang Seng Bank Limited. A Director of The Hongkong and Shanghai Banking Corporation Limited. Joined HSBC in 1972. Appointed a Group General Manager in 2000.
K Patel
Age 60. Group General Manager, Chief Executive Officer, HSBC Africa. Joined HSBC in 1984.
Appointed a Group General Manager in 2000. Chairman, Emerging Europe and Africa from 2003 to 2006. Chairman, Global Investment Bank from 2000 to 2003.
L J Peña-Kegel
Age 49. Chief Executive, HSBC Mexico S.A. Joined HSBC on 15 May 2008. Appointed a Group General Manager on 29 May 2008.
R C Picot
Age 51. Group Chief Accounting Officer. Joined HSBC in 1993. Appointed a Group General Manager in 2003.
C D Spooner
Age 58. Head of Group Financial Planning & Tax. Joined HSBC in 1994. Appointed a Group General Manager in 2007.
P T S Wong
Age 57. Executive Director, Hong Kong and Mainland China, The Hongkong and Shanghai Banking Corporation Limited. Joined HSBC in 2005. Appointed a Group General Manager in 2005.
R J L Yorke
Age 41. President and Chief Executive Officer, HSBC China. Joined HSBC in 1989. Appointed a Group General Manager on 29 May 2008.
H S B C H O L D I N G S P L C
Report of the Directors: Governance (continued) Board of Directors > The Board > Group Chairman and Group Chief Executive
290
Board of Directors
The Board
The objective of the management structures within HSBC, headed by the Board of Directors of HSBC Holdings and led by the Group Chairman, is to deliver sustainable value to shareholders. Implementation of the strategy set by the Board is delegated to the Group Management Board under the leadership of the Group Chief Executive.
HSBC Holdings has a unitary Board of Directors. The authority of each Director is exercised in Board Meetings where the Board acts collectively as a unit. At 2 March 2009, the Board comprises the Group Chairman, Group Chief Executive, four other executive Directors and 15 non-executive Directors. The names and brief biographical particulars of the Directors are listed on pages 281 to 285. The Group Chairman, Group Chief Executive and four other executive Directors are employees who carry out executive functions in HSBC in addition to their duties as Directors. Non-executive Directors are not HSBC employees and do not participate in the daily business management of HSBC. Non-executive Directors bring an external perspective, constructively challenge and help develop proposals on strategy, scrutinise the performance of management in meeting agreed goals and objectives and monitor the reporting of performance. The non-executive Directors have a wealth of experience across a number of industries and business sectors, including the leadership of large, complex multinational enterprises. The roles of non-executive Directors as members of Board committees are described on pages 290 to 291. It is estimated that non-executive Directors devote 24 days per annum to HSBC business after an induction phase, with Committee members devoting significant additional time.
The Board is responsible for managing the business of HSBC Holdings and, in doing so, may exercise all of the powers of HSBC Holdings, subject to any relevant laws and regulations and to the Memorandum and Articles of Association. In particular, the Board may exercise all the powers of the Company to borrow money and to mortgage or charge all or any part of the undertaking, property or assets (present and future) of HSBC Holdings and may also exercise any of the powers conferred on it by the Companies Act 1985 and Companies Act 2006 (as appropriate) and/or by shareholders. The Board is able to delegate and confer on certain Directors holding executive office any of its powers, authorities and discretions (including the power to sub-delegate) for such time and on such terms as it
thinks fit. In addition, the Board may establish any local or divisional boards or agencies for managing the business of HSBC Holdings in any specified locality and delegate and confer on any local or divisional board, manager or agent so appointed any of its powers, authorities and discretions (including the power to sub-delegate) for such time and on such terms as it thinks fit. The Board may also, by power of attorney or otherwise, appoint any person or persons to be the agent of HSBC Holdings and may delegate to any such person or persons any of its powers, authorities and discretions (including the power to sub-delegate) for such time and on such terms as it thinks fit.
The Board sets the strategy for the Group and approves the operating plans presented by management for the achievement of the strategic objectives. The operating plans ensure the efficient disposition of HSBC’s resources for the achievement of these objectives. The Board delegates the management and day-to-day running of HSBC to the Group Management Board but retains to itself approval of certain matters including operating plans and performance targets, procedures for monitoring and control of operations, the authority or the delegation of authority to approve credit, market risk limits, acquisitions, disposals, investments, capital expenditure or realisation or creation of a new venture, specified senior appointments, and any substantial change in balance sheet management policy.
The Directors who served during the year were, Lord Butler, S A Catz, V H C Cheng, J D Coombe, Baroness Dunn, J L Durán, R A Fairhead, D J Flint, A A Flockhart, W K L Fung, M F Geoghegan, S K Green, S T Gulliver, J W J Hughes-Hallett, W S H Laidlaw, J R Lomax, Sir Brian Moffat, Sir Mark Moody-Stuart, G Morgan, N R N Murthy, S W Newton, S M Robertson, J L Thornton and Sir Brian Williamson.
The Board of Directors meets regularly and Directors receive information between meetings about the activities of committees and developments in HSBC’s business.
Eight Board meetings were held during 2008. The table that follows gives details of each Director’s attendance at meetings of the Board, Group Audit Committee, Nomination Committee and Remuneration Committee held whilst he or she was a Director or member during 2008.
During 2008, the non-executive Directors and the Group Chairman met twice without the other executive Directors. In addition, the non-executive

291
Directors met once without the Group Chairman to appraise the Group Chairman’s performance.
In addition to the meetings of the principal Committees referred to in the following pages,
12 other meetings of Committees of the Board (not shown in the table below) were held during the year to discharge business delegated by the Board.
All those who were Directors at the time attended the 2008 Annual General Meeting.
Attendance record
Board
Meetings (8)
Group AuditCommittee
Meetings (8)
Nomination Committee
Meetings (5)
Remuneration CommitteeMeetings (7)
Attended Attended Attended Attended
Lord Butler1 .............................................................................. 4 – – – S A Catz2 ................................................................................... 4 23 – – V H C Cheng4 ............................................................................ 7 – – – J D Coombe .............................................................................. 8 8 – 7 Baroness Dunn5 ........................................................................ 4 – 2 – J L Durán .................................................................................. 7 – – – R A Fairhead ............................................................................. 6 8 26 – D J Flint .................................................................................... 8 83 – – A A Flockhart2 .......................................................................... 4 13 – – W K L Fung .............................................................................. 8 – – – M F Geoghegan ........................................................................ 8 43 – 13
S K Green ................................................................................. 8 13 5 13
S T Gulliver2 ............................................................................. 4 23 – – J W J Hughes-Hallett ................................................................ 7 6 4 – W S H Laidlaw ......................................................................... 7 23 – 37
J R Lomax8 ............................................................................... – – – – Sir Brian Moffat5 ...................................................................... 5 13 2 – Sir Mark Moody-Stuart ............................................................ 8 23 – 7 G Morgan .................................................................................. 8 13 – 7 N R N Murthy2 .......................................................................... 4 13 – – S W Newton9 ............................................................................ 7 6 – – S M Robertson .......................................................................... 7 13 4 – J L Thornton8 ............................................................................ – – – – Sir Brian Williamson ................................................................ 8 13 5 –
1 Retired 30 May 2008 – eligible to attend 5 Board meetings. 2 Appointed 1 May 2008 – eligible to attend 4 Board meetings. 3 Attended by invitation, for all or part of meeting. 4 Appointed 1 February 2008 – eligible to attend 7 Board meetings. 5 Retired 30 May 2008 – eligible to attend 5 Board meetings and 2 Committee meetings. 6 Appointed a member on 30 May 2008 – eligible to attend 3 Committee meetings. 7 Appointed a member on 30 May 2008 – eligible to attend 3 Committee meetings. 8 Appointed 1 December 2008 – not eligible to attend any Board meetings. 9 Retired 10 October 2008 – eligible to attend 7 Board meetings and 6 Committee meetings.
Group Chairman and Group Chief Executive
The roles of Group Chairman and Group Chief Executive are separated and held by experienced full-time Directors.
There is a clear division of responsibilities at the head of the Company between the running of the Board and the executive responsibility for running HSBC’s business. The Group Chairman’s responsibilities include the long-term strategic development of HSBC, the development of relationships with governments and other significant external parties and performance management of the Group Chief Executive. The Group Chairman also monitors the performance of the Group Finance Director and, subject to the Group Chief Executive’s
recommendation, approves risk, capital allocation and capital investment decisions within authorities delegated by the Board. The Group Chief Executive has responsibility for developing business plans and delivering performance against these.
S K Green became Group Chairman at the conclusion of the Annual General Meeting in 2006 and M F Geoghegan succeeded S K Green as Group Chief Executive. The appointments were made after consulting with representatives of major institutional investors and explaining the succession planning and independent external search process undertaken. S K Green and M F Geoghegan stood for re-election at the 2006 Annual General Meeting and were both

H S B C H O L D I N G S P L C
Report of the Directors: Governance (continued) Board of Directors > Balance and independence / Development / Performance / Appointment
292
re-elected ahead of taking up their new roles from the conclusion of that Meeting.
Board balance and independence of Directors
The Board includes a strong presence of both executive and non-executive Directors such that no individual or small group can dominate the Board’s decision making. Following the 2009 Annual General Meeting, the Board will comprise 21 Directors, 14 of whom are independent non-executive Directors. The size of the Board is appropriate given the complexity and geographical spread of HSBC’s business and the significant time demands placed on the non-executive Directors, particularly those who serve as members of Board committees.
The Board has appointed S M Robertson as the senior independent non-executive Director. The principal role of the senior independent non-executive Director is to support the Group Chairman in his role, to lead the non-executive Directors in the oversight of the Group Chairman and to ensure there is a clear division of responsibility between the Group Chairman and Group Chief Executive. The senior independent non-executive Director is also available to shareholders to express concerns which the normal channels have failed to resolve or would be inappropriate.
The Board considers all of the non-executive Directors to be independent in character and judgement. W K L Fung has served on the Board for more than nine years, however, and in that respect only, does not meet the usual criteria for independence set out in the UK Combined Code on corporate governance. The Board has therefore determined S A Catz, M K T Cheung (appointed a Director with effect from 1 February 2009), J D Coombe, J L Durán, R A Fairhead, J W J Hughes-Hallett, W S H Laidlaw, J R Lomax, Sir Mark Moody-Stuart, G Morgan, N R N Murthy, S M Robertson, J L Thornton and Sir Brian Williamson to be independent. In reaching its determination of each non-executive Director’s independence the Board has concluded that there are no relationships or circumstances which are likely to affect a Director’s judgement and any relationships or circumstances which could appear to do so were considered not to be material.
When determining independence the Board considers that calculation of the length of service of a non-executive Director begins on the date of his or her first election by shareholders as a Director of HSBC Holdings. Given the complexity and
geographical spread of HSBC’s business, the experience of previous service on a subsidiary company Board can be a considerable benefit to HSBC and does not detract from a Director’s independence.
In accordance with the Rules Governing the Listing of Securities on The Stock Exchange of Hong Kong Limited, each non-executive Director determined by the Board to be independent has provided an annual confirmation of his or her independence to HSBC Holdings.
Information, induction and ongoing development
The Board regularly reviews reports on progress against financial objectives, on business developments and on investor and external relations and receives reports from the Chairmen of Board Committees and from the Group Chief Executive. The Board receives regular reports and presentations on strategy and developments in the customer groups and principal geographical areas. Regular reports are also provided to the Board, the Group Audit Committee and the Group Management Board on credit exposures and the loan portfolio, asset, liability and risk management, liquidity, litigation and compliance and reputational issues. The agenda and supporting papers are distributed in advance of all Board and Committee meetings to allow time for appropriate review and to facilitate full discussion at the meetings. All Directors have full and timely access to all relevant information and may take independent professional advice if necessary.
The Directors have free and open contact with management at all levels. Group Managing Directors and Group General Managers meet informally with Directors after Board meetings. Board offsite visits are made each year to enable Directors to see at first hand the operations of subsidiary companies in local environments and to meet management, employees and customers. In 2008 the Board visited Dubai.
Full, formal and tailored induction programmes, with particular emphasis on internal controls, are arranged for newly appointed Directors. The programmes consist of a series of meetings with other Directors and senior executives to enable new Directors to receive information and familiarise themselves with HSBC’s strategy, operations and internal controls. Prior to their appointment, each Director receives comprehensive guidance on the duties and liabilities of a Director of HSBC Holdings. Opportunities to update and develop skills and knowledge, through externally run seminars and

293
through briefings by senior executives, are provided to all Directors.
Performance evaluation
In November 2008, ICSA Board Evaluation Limited was commissioned to assist S K Green, Group Chairman, in conducting an evaluation of the effectiveness of the Board. This followed ICSA’s evaluation of the Board in 2007. His evaluation investigated the performance of the Board as a whole and, in that context, the main Board committees and individual Directors. The evaluation examined whether eight key areas met the Board’s needs and expectations: Board role and responsibilities; oversight; Board meetings; information received; support for the Board; Board composition; working together; and outcome and achievements. The report on the evaluation has been reviewed by the Board and has been used by the non-executive Directors, led by the senior independent non-executive Director, in their evaluation of the performance of the Group Chairman. The review concluded that the Board and its committees were functioning effectively. It is the intention of the Board of HSBC Holdings to continue to review its performance and that of its Directors annually.
Appointment, retirement and re-election of Directors
The Board may at any time appoint any person who is willing to act as a Director, either to fill a vacancy or as an addition to the existing Board, but the total number of Directors shall not exceed twenty-five. Any Director so appointed by the Board shall retire at the Annual General Meeting following his or her appointment and shall be eligible for re-election but is not taken into account in determining the number of Directors who are to retire by rotation at such meeting. The Board may appoint any Director to hold any employment or executive office and may revoke or terminate any such appointment. Shareholders may, by ordinary resolution, appoint a person as a Director or remove any Director before the expiration of his period of office. At each Annual General Meeting, one third of the Directors who are subject to retirement by rotation are required to retire and may offer themselves for re-election by shareholders. In addition to those required to retire by rotation, any Director who was not elected or re-elected at either of the preceding two Annual General Meetings and any non-executive Director who has served in office for a continuous period of nine years or more at the date of the Annual General Meeting is required to retire and may offer him or herself for re-election by shareholders.
J L Durán and W S H Laidlaw were appointed non-executive Directors on 1 January 2008. V H C Cheng was appointed an executive Director on 1 February 2008. On 1 May 2008 A A Flockhart and S T Gulliver were appointed executive Directors and S A Catz and N R N Murthy were appointed non-executive Directors. Lord Butler, Baroness Dunn and Sir Brian Moffat retired as Directors at the conclusion of the Annual General Meeting held on 30 May 2008. S W Newton retired as a Director on 10 October 2008. J R Lomax and J L Thornton were appointed non-executive Directors on 1 December 2008. M K T Cheung was appointed a non-executive Director on 1 February 2009.
All of the Directors will retire at the forthcoming Annual General Meeting and offer themselves for re-election. None of the non-executive Directors seeking re-election has a service contract. All of the executive Directors seeking re-election are employed on rolling contracts which require 12 months’ notice to be given by either party.
Following the performance evaluation of the Board, the Group Chairman has confirmed that all of the non-executive Directors continue to perform effectively and to demonstrate commitment to their roles.
Brief biographical particulars of all Directors are given on pages 281 to 285.
Relations with shareholders
The Board ensures all Directors, including non-executive Directors, develop an understanding of the views of major shareholders through attendance at analyst presentations and other meetings with institutional investors and their representative bodies. Directors also met with representatives of institutional shareholders in 2008 to discuss corporate governance matters.
All executive Directors and other senior executives hold regular meetings with institutional investors and report to the Board on those meetings.
Institutional shareholders were consulted on the framework of Directors’ remuneration and the proposed changes to the HSBC Share Plan which were approved at the 2008 Annual General Meeting.
During 2008, S M Robertson, senior independent non-executive Director, Sir Mark Moody-Stuart and other non-executive Directors met and corresponded with institutional investors and their representatives to discuss strategy, remuneration policy and governance. S M Robertson, the senior independent non-executive Director is also available to shareholders

H S B C H O L D I N G S P L C
Report of the Directors: Governance (continued) Board of Directors > Conflicts of interest / Corporate governance
294
should they have concerns which contact through the normal channels of Group Chairman, Group Chief Executive, Group Finance Director or other executives has failed to resolve or for which such contact would be inappropriate. Invitations to meet S M Robertson prior to his appointment as senior independent non-executive Director were extended to the Group’s largest shareholders. The senior independent non-executive Director may be contacted through the Group Company Secretary at 8 Canada Square, London E14 5HQ.
Conflicts of interest, indemnification of Directors, relevant audit information and contracts of significance
One of the amendments to HSBC Holdings’ Articles of Association approved by shareholders at the 2008 Annual General Meeting gave the Board authority, with effect from 1 October 2008, to approve Directors’ conflicts and potential conflicts of interest. The Board has adopted a policy and procedures for the approval of Director’s conflicts or potential conflicts of interest. The Board’s powers to authorise conflicts are operating effectively and the procedures are being followed. A review of situational conflicts which have been authorised, including the terms of authorisation, will be undertaken annually.
The Articles of Association of HSBC Holdings provide that Directors are entitled to be indemnified out of the assets of the Company against claims from third parties in respect of certain liabilities arising in connection with the performance of their functions, in accordance with the provisions of the UK Companies Act 2006. Such indemnity provisions have been in place during the financial year but have not been utilised by the Directors.
Each person who is a Director at the date of approval of this report confirms that so far as the Director is aware, there is no relevant audit information of which the Company’s auditor is unaware; and the Director has taken all the steps that he or she ought to have taken as a Director in order to make himself or herself aware of any relevant audit information and to establish that the Company’s auditor is aware of that information. This confirmation is given pursuant to section 234ZA of the UK Companies Act 1985 and should be interpreted in accordance therewith and subject to the provisions thereof.
None of the Directors had, during the year or at the end of the year, a material interest, directly or indirectly, in any contract of significance with HSBC Holdings or any of its subsidiary undertakings.
Corporate governance codes
HSBC is committed to high standards of corporate governance. HSBC Holdings has complied throughout the year with the applicable code provisions of the Combined Code on Corporate Governance issued by the Financial Reporting Council and the Code on Corporate Governance Practices in Appendix 14 to the Rules Governing the Listing of Securities on The Stock Exchange of Hong Kong Limited.
The Board of HSBC Holdings has adopted a code of conduct for transactions in HSBC Group securities by Directors that complies with The Model Code in the Listing Rules of the Financial Services Authority and with The Model Code for Securities Transactions by Directors of Listed Issuers (‘Hong Kong Model Code’) set out in the Rules Governing the Listing of Securities on The Stock Exchange of Hong Kong Limited, save that The Stock Exchange of Hong Kong Limited has granted certain waivers from strict compliance with the Hong Kong Model Code, primarily to take into account accepted practices in the UK, particularly in respect of employee share plans. Following a specific enquiry, each Director has confirmed he or she has complied with the code of conduct for transactions in HSBC Group securities throughout the year.
Differences in HSBC Holdings/New York Stock Exchange corporate governance practices
Under the NYSE’s corporate governance rules for listed companies and the applicable rules of the SEC, as a NYSE-listed foreign private issuer, HSBC Holdings must disclose any significant ways in which its corporate governance practices differ from those followed by US companies subject to NYSE listing standards. HSBC Holdings believes the following to be the significant differences between its corporate governance practices and NYSE corporate governance rules applicable to US companies.
US companies listed on the NYSE are required to adopt and disclose corporate governance guidelines. The Listing Rules of the UK Financial Services Authority require each listed company incorporated in the UK to include in its Annual Report and Accounts a narrative statement of how it has applied the principles of the Combined Code and a statement as to whether or not it has complied with the code provisions of the Combined Code throughout the accounting period covered by the Annual Report and Accounts. A company that has not complied with the Code provisions, or complied

295
with only some of the Code provisions or (in the case of provisions whose requirements are of a continuing nature) complied for only part of an accounting period covered by the report, must specify the Code provisions with which it has not complied, and (where relevant) for what part of the reporting period such non-compliance continued, and give reasons for any non-compliance. As stated above, HSBC Holdings complied throughout 2008 with the applicable code provisions of the Combined Code. The Combined Code does not require HSBC Holdings to disclose the full range of corporate governance guidelines with which it complies.
Under NYSE standards, companies are required to have a nominating/corporate governance committee, composed entirely of independent directors. In addition to identifying individuals qualified to become Board members, this committee must develop and recommend to the Board a set of corporate governance principles. HSBC’s Nomination Committee complies with the Combined Code, which requires a majority of members to be independent. All four members of the Committee are independent non-executive Directors. The Committee’s terms of reference do not require the Committee to develop and recommend corporate governance principles for HSBC Holdings. As stated above, HSBC Holdings is subject to the corporate governance principles of the Combined Code.
Pursuant to NYSE listing standards, non-management directors must meet on a regular basis without management present and independent directors must meet separately at least once per year. During 2008, HSBC Holdings’ non-executive Directors met twice as a group with the Group Chairman, but without other executive Directors present, and met once as a group without the Group Chairman or other executive Directors present. HSBC Holdings’ practice, in this regard, complies with the Combined Code.
In accordance with the requirements of the Combined Code, HSBC Holdings discloses in its annual report how the Board, its committees and the Directors are evaluated (on page 293) and it provides extensive information regarding Directors’ compensation in the Directors’ Remuneration Report (on pages 315 to 328). The terms of reference of HSBC Holdings’ Audit, Nomination and Remuneration Committees are available at www.hsbc.com/boardcommittees.
NYSE listing standards require US companies to adopt a code of business conduct and ethics for directors, officers and employees, and promptly disclose any waivers of the code for directors or
executive officers. In addition to the Group Business Principles and Values, which apply to the employees of all HSBC companies, pursuant to the requirements of the Sarbanes-Oxley Act the Board of HSBC Holdings has adopted a Code of Ethics applicable to the Group Chairman and the Group Chief Executive, as the principal executive officers, and to the Group Finance Director and Group Chief Accounting Officer. HSBC Holdings’ Code of Ethics is available on www.hsbc.com/codeofethics or from the Group Company Secretary at 8 Canada Square, London E14 5HQ. If the Board amends or waives the provisions of the Code of Ethics, details of the amendment or waiver will appear at the same website address. During 2008, HSBC Holdings made no amendments to its Code of Ethics and granted no waivers from its provisions. The Group Business Principles and Values are available on www.hsbc.com/businessprinciplesandvalues.
Under NYSE listing rules applicable to US companies, independent directors must comprise a majority of the Board of directors. Currently, two thirds of HSBC Holdings’ Directors are independent.
Under the Combined Code the HSBC Holdings Board determines whether a Director is independent in character and judgement and whether there are relationships or circumstances which are likely to affect, or could appear to affect, the Director’s judgement. Under the NYSE rules a director cannot qualify as independent unless the board affirmatively determines that the director has no material relationship with the listed company; in addition the NYSE rules prescribe a list of circumstances in which a director cannot be independent. The Combined Code requires a company’s board to assess director independence by affirmatively concluding that the director is independent of management and free from any business or other relationship that could materially interfere with the exercise of independent judgement.
Lastly, a chief executive officer of a US company listed on the NYSE must annually certify that he or she is not aware of any violation by the company of NYSE corporate governance standards. In accordance with NYSE listing rules applicable to foreign private issuers, HSBC Holdings’ Group Chief Executive is not required to provide the NYSE with this annual compliance certification. However, in accordance with rules applicable to both US companies and foreign private issuers, the Group Chief Executive is required promptly to notify the NYSE in writing after any executive officer becomes aware of any material non-compliance with the NYSE corporate governance standards applicable to HSBC Holdings.

H S B C H O L D I N G S P L C
Report of the Directors: Governance (continued) Board of Directors > Board committees
296
HSBC Holdings is required to submit annual and interim written affirmations of compliance with applicable NYSE corporate governance standards, similar to the affirmations required of NYSE-listed US companies.
Board committees
The Board has appointed a number of committees consisting of certain Directors, Group Managing Directors and, in the case of the Corporate Sustainability Committee, certain co-opted non-director members. The following are the principal committees:
Group Management Board
The Group Management Board meets frequently and operates as a general management committee under the direct authority of the Board. The objective of the Group Management Board is to maintain a reporting and control structure whereby all of the line operations of HSBC are accountable to individual members of the Group Management Board who report to the Group Chief Executive who in turn reports to the Group Chairman. The Board has set objectives and measures for the Group Management Board. These will align senior executives’ objectives and measures with the strategy and operating plans throughout HSBC. The members of the Group Management Board are M F Geoghegan (Chairman), V H C Cheng, D J Flint, A A Flockhart and S T Gulliver who are executive Directors, and A Almeida, E Alonso, C C R Bannister, K M Harvey, A C Hungate, D D J John, B P McDonagh, Y A Nasr, B Robertson and P A Thurston, all of whom are Group Managing Directors.
The Group Management Board exercises the powers, authorities and discretions of the Board in so far as they concern the management and day-to-day running of HSBC Holdings in accordance with such policies and directions as the Board may from time to time determine. Matters reserved for approval by the Board are described on page 290.
The Group Chief Executive reports to each meeting of the Board on the activities of the Group Management Board.
Group Audit Committee
The Group Audit Committee meets regularly with HSBC’s senior financial, credit and risk, internal audit, legal and compliance management and the external auditor to consider HSBC Holdings’ financial reporting, the nature and scope of audit reviews and the effectiveness of the systems of
internal control, compliance and risk management. The members of the Group Audit Committee throughout 2008 were, R A Fairhead (Chairman), J D Coombe and J W J Hughes-Hallett. J R Lomax was appointed a member of the Committee on 1 March 2009. S W Newton retired as a Director of HSBC Holdings and ceased to be a member of the Committee on 10 October 2008. All members of the Committee are independent non-executive Directors.
The Board has determined that R A Fairhead, J D Coombe and J W J Hughes-Hallett are independent according to SEC criteria, may be regarded as audit committee financial experts for the purposes of section 407 of the Sarbanes-Oxley Act and have recent and relevant financial experience.
Appointments to the Committee are made for periods of up to three years, extendable by no more than two additional three-year periods, so long as members continue to be independent.
Formal and tailored induction programmes are held for newly-appointed Committee members and appropriate training is provided on an ongoing and timely basis.
There were eight meetings of the Group Audit Committee during 2008. The table on page 291 gives details of Directors’ attendance at these meetings. Following each meeting the Committee reports to the Board on its activities.
At each meeting, the Committee has the opportunity to meet with the external auditor, without management present, to facilitate the discussion of any matter relating to its remit and any issue arising from the audit. Similar arrangements have been adopted for the Committee to meet with the internal auditor. The Committee also has the opportunity to meet with the Group Chief Executive at each of its meetings.
The terms of reference of the Committee, which are reviewed annually, are available at www.hsbc.com/boardcommittees. To ensure consistency of scope and approach by subsidiary company audit committees, the Group Audit Committee has established core terms of reference to guide subsidiary company Boards when adopting terms of reference for their audit committees. Subsidiary company audit committees are required to provide bi-annual certificates to the Committee or to an intermediate subsidiary company audit committee, relating to the financial statements and internal control procedures of the relevant subsidiary company.
The Group Audit Committee is accountable to the Board and assists it in meeting its responsibilities

297
for maintaining an effective system of internal control and compliance and for meeting its external financial reporting obligations. The Committee undertakes an annual review of the effectiveness of HSBC’s system of internal control, which is described on page 299, and reviews the Company’s financial statements before they are considered by the Board.
Regular reports are received on the risks involved in HSBC’s business and how they are controlled and monitored by management which enable the Committee to review the effectiveness of HSBC’s risk management framework. Each year the Committee agrees a schedule of presentations to be made to it by management during the ensuing year on the operation of the risk control framework within the Group. The presentations specifically address risk indicators and performance measures such as indicators of credit, liquidity and interest rate risk. During 2008 the Committee received frequent presentations on global market risk and liquidity and reports on the US mortgage services business, credit performance in the US and the impact of the tightening of liquidity in the money markets. Comprehensive reports are received at each regular meeting from the Group Chief Risk Officer, the Head of Group Compliance, the Group General Manager, Legal and Compliance and the Group General Manager Internal Audit. Periodic presentations are made by other function heads and line management.
The reports from the Group General Manager Internal Audit include information on frauds and special investigations and weakness in internal controls identified through internal audit reports or reviews of regulatory reports and external auditors’ reports. The Committee monitors and reviews the effectiveness of the internal audit function and receives summaries of periodic peer reviews of HSBC’s principal internal audit functions. HSBC has adopted the Principles of the International Institute of Internal Auditors, which include a periodic external quality assurance review of the internal audit function. The first such review, undertaken by Independent Audit Limited, was presented to the Committee in 2008.
The Committee receives regular updates on changes in law, regulations and accounting standards and practices and the preparations being made to respond to those requirements. During 2008, the Committee received regular updates on the review of internal financial reporting controls required by section 404 of the Sarbanes-Oxley Act and the implementation of the Basel II capital adequacy requirements.
The Committee has approved procedures for the receipt, retention and handling of complaints regarding accounting, internal accounting controls and auditing matters. The Committee receives regular reports regarding the nature, investigation and resolution of material complaints and concerns from the Head of Group Compliance.
The Committee is directly responsible on behalf of the Board for the selection, oversight and remuneration of the external auditor. The Committee reviews and monitors the external auditor’s independence and objectivity and the effectiveness of the audit process, taking into consideration relevant professional and regulatory requirements.
The Committee reviews the strategy and approves the terms for the engagement of the external auditor for the audit of the Annual Report and Accounts. Regular reports on the progress of the audit facilitate the Committee’s assessment of the effectiveness of the audit.
The Committee receives reports from the external auditor on its own policies and procedures regarding independence and quality control and oversees the appropriate rotation of audit partners within the external auditor. The external auditor provides the Committee with an annual confirmation of its independence in accordance with industry standards.
On the recommendation of the Committee the Board has approved a policy for the employment by HSBC of former employees of the external auditor or its affiliates. The Committee monitors this policy through the receipt of an annual report of those former employees of the external auditor employed by HSBC and the number of former employees of the external auditor currently employed in senior positions in HSBC. The reports enable the Committee to consider whether there has been any impairment, or appearance of impairment, of the auditor’s judgement or independence in respect of the audit.
The Group Audit Committee has established policies for the pre-approval of specific services that may be provided by the principal auditor, KPMG Audit Plc and its affiliates (‘KPMG’). These policies are kept under review and amended as necessary to meet the dual objectives of ensuring that HSBC benefits in a cost effective manner from the cumulative knowledge and experience of its auditor, while also ensuring that the auditor maintains the necessary degree of independence and objectivity. These pre-approval policies apply to all services where HSBC Holdings or any of its subsidiaries pays for the service, or is a beneficiary or addressee of the

H S B C H O L D I N G S P L C
Report of the Directors: Governance (continued) Board of Directors > Board committees / Internal control
298
service and has selected or influenced the choice of KPMG. All services entered into with KPMG during 2008 were pre-approved by the Committee or were entered into under pre-approval policies established by the Committee. A quarterly update on non-audit services provided by KPMG is presented to the Committee by management.
The pre-approved services relate to regulatory reviews, agreed-upon procedures reports, other types of attestation reports, the provision of advice and other non-audit services allowed under SEC independence rules. They fall into the categories of audit services, audit-related services, tax services and other services.
An analysis of the remuneration paid in respect of audit and non-audit services provided by KPMG for each of the last three years is disclosed in Note 9 on the Financial Statements.
The Committee has recommended to the Board that KPMG Audit Plc be reappointed auditor at the forthcoming Annual General Meeting.
Remuneration Committee
The role of the Remuneration Committee and its membership are set out in the Directors’ Remuneration Report on page 315.
Nomination Committee
The Nomination Committee is responsible for leading the process for Board appointments and for identifying and nominating, for approval by the Board, candidates for appointment to the Board. Before recommending an appointment to the Board, the Committee evaluates the balance of skills, knowledge and experience on the Board and, in the light of this, identifies the role and capabilities required for a particular appointment. Candidates are considered on merit against these criteria. Care is taken to ensure that appointees have enough time to devote to HSBC. Prospective Directors are asked to identify any significant other commitments and confirm they have sufficient time to discharge what is expected of them. In accordance with the Articles of Association all Directors are subject to election by shareholders at the Annual General Meeting following their appointment by the Board and to re-election at least every three years. The members of the Nomination Committee throughout 2008 were Sir Brian Williamson (Chairman), S M Robertson and J W J Hughes-Hallett. R A Fairhead was appointed a member of the Committee on 30 May 2008. Baroness Dunn and Sir Brian Moffat retired as Directors of HSBC Holdings and ceased to be members of the Committee on 30 May 2008. All
current members of the Committee are independent non-executive Directors.
There were five meetings of the Nomination Committee during 2008. The table on page 291 gives details of Directors’ attendance at these meetings.
Following each meeting the Committee reports to the Board on its activities.
The terms of reference of the Committee are available at www.hsbc.com/boardcommittees.
The appointments of S A Catz, M K T Cheung, J R Lomax, N R N Murthy and J L Thornton as non-executive Directors and V H C Cheng, A A Flockhart and S T Gulliver as executive Directors were made on the advice and recommendation of the Nomination Committee. An external consultancy was used in connection with the appointments of S A Catz, M K T Cheung, J R Lomax, N R N Murthy and J L Thornton.
The terms and conditions of appointment of non-executive Directors are available for inspection at 8 Canada Square, London E14 5HQ and will be made available for 15 minutes before the Annual General Meeting and during the Meeting itself.
The Committee makes recommendations to the Board concerning: plans for succession for both executive and non-executive Directors; the appointment of any Director to executive or other office; suitable candidates for the role of senior independent non-executive Director; the re-election by shareholders of Directors retiring by rotation; the renewal of the terms of office of non-executive Directors; membership of Board Committees, in consultation with the Group Chairman and the chairman of such committees as appropriate; any matters relating to the continuation in office of any Director at any time; and appointments and re-appointments to the boards of directors of major subsidiary companies as appropriate.
The Committee regularly reviews the structure, size and composition (including the skills, knowledge and experience required) of the Board and makes recommendations to the Board as appropriate. It keeps under review the leadership needs of HSBC, with a view to ensuring the continued ability of HSBC to compete effectively in the marketplace. The Board has satisfied itself that the Nomination Committee has in place appropriate plans for orderly succession to the Board and senior management positions as well as procedures to ensure an appropriate balance of skills and experience within HSBC and on the Board.

299
Corporate Sustainability Committee
The role of the Corporate Sustainability Committee and its membership are set out on page 312.
Internal control
The Directors are responsible for internal control in HSBC and for reviewing its effectiveness. Procedures have been designed for safeguarding assets against unauthorised use or disposition; for maintaining proper accounting records; and for the reliability of financial information used within the business or for publication. Such procedures are designed to manage rather than eliminate the risk of failure to achieve business objectives and can only provide reasonable and not absolute assurance against material misstatement, errors, losses or fraud. The procedures also enable HSBC Holdings to discharge its obligations under the Handbook of Rules and Guidance issued by the Financial Services Authority, HSBC’s lead regulator.
The key procedures that the Directors have established are designed to provide effective internal control within HSBC and accord with the Internal Control: Revised Guidance for Directors on the Combined Code issued by the Financial Reporting Council. Such procedures for the ongoing identification, evaluation and management of the significant risks faced by HSBC have been in place throughout the year and up to 2 March 2009, the date of approval of the Annual Report and Accounts 2008. In the case of companies acquired during the year, the internal controls in place are being reviewed against HSBC’s benchmarks and integrated into HSBC’s processes.
HSBC’s key internal control procedures include the following:
• Authority to operate the various subsidiaries and responsibilities for financial performance against plans and for capital expenditure are delegated to their respective chief executive officers within limits set by the Board of Directors of HSBC Holdings. Delegation of authority from the Board to individuals requires those individuals to maintain a clear and appropriate apportionment of significant responsibilities and to oversee the establishment and maintenance of systems of control appropriate to the business. The appointment of executives to the most senior positions within HSBC requires the approval of the Board of Directors of HSBC Holdings.
• Functional, operating, financial reporting and certain management reporting standards are
established by Group Management Office management committees, for application across the whole of HSBC. These are supplemented by operating standards set by functional and local management as required for the type of business and geographical location of each subsidiary.
• Systems and procedures are in place in HSBC to identify, control and report on the major risks including credit, changes in the market prices of financial instruments, liquidity, operational error, breaches of law or regulations, unauthorised activities, information risk, security and fraud. Exposure to these risks is monitored by risk management committees, asset and liability committees and executive committees in subsidiaries and, for HSBC as a whole, by the Group Management Board. A risk management meeting of the Group Management Board, chaired by the Group Finance Director, is held monthly to address asset, liability and risk management issues, its minutes are submitted to the Group Audit Committee and to the Board of Directors. The Group Operational Risk and Control Committee reviews the implementation of HSBC’s management framework for operational risk and internal control.
• A Disclosure Committee has been established to review material disclosures made by HSBC Holdings for any errors, misstatements or omissions. The membership of the Disclosure Committee, which is chaired by the Group Company Secretary, includes the heads of the Finance, Legal, Risk, Compliance, Corporate Communications, Investor Relations and Internal Audit functions and representatives from the principal regions, customer groups and global businesses.
• Processes are in place to identify new risks from changes in market conditions and practices or customer behaviours which could expose HSBC to heightened risk of loss or reputational damage. During 2008, attention was directed towards managing the impact on the Group of market volatilities and illiquidity; continued deterioration in the US personal financial services markets; Group exposure to various parts of the financial sector e.g. asset backed securities including mortgage-backed securities and collateralised debt obligations, monoline insurers, leveraged finance and money market funds; and the impact of government interventions to address the under-capitalisation and funding difficulties of certain financial institutions.

H S B C H O L D I N G S P L C
Report of the Directors: Governance (continued) Board of Directors > Internal control / Directors’ interests
300
• Periodic strategic plans are prepared for key customer groups, global product groups, support functions and certain geographies within the framework of the Group Strategic Roadmap. Rolling operating plans, informed by detailed analysis of risk appetite, are prepared and adopted by all major HSBC operating companies and set out the key business initiatives and the likely financial effects of those initiatives.
• Governance and oversight arrangements are in place to ensure that risk analytical models are fit for purpose, used accordingly and complemented by a variety of model-specific and enterprise-wide stress tests that evaluate the impact of severe yet plausible events and other unusual circumstances not fully captured by quantitative models.
• Centralised functional control is exercised over all computer system developments and operations. Common systems are employed for similar business processes wherever practicable. Credit and market risks are measured and reported on in subsidiaries and aggregated for review of risk concentrations on a Group-wide basis.
• Functional management in Group Management Office is responsible for setting policies, procedures and standards in the following areas of risk: credit; market; liquidity; operational; IT; fraud; business continuity; security; information; insurance; accounting; tax; legal and regulatory compliance; fiduciary; human resources; reputational; sustainability and purchasing. Authorities to enter into credit and market risk exposures are delegated with limits to line management of Group companies. The concurrence of Group Management Office is required, however, to credit proposals with specified high risk characteristics.
• Policies to guide subsidiary companies and management at all levels in the conduct of business to safeguard the Group’s reputation are established by the Board of HSBC Holdings and the Group Management Board, subsidiary company boards, board committees or senior management. Reputational risks can arise from environmental, social or governance issues, or as a consequence of operational risk events. As a banking group, HSBC’s good reputation depends upon the way in which it conducts its business but it can also be affected by the way in which clients, to which it provides financial services, conduct their business.
• The establishment and maintenance of appropriate systems of internal control is primarily the responsibility of business management. The internal audit function, which is centrally controlled, monitors the effectiveness of internal control structures across the whole of HSBC focussing on the areas of greatest risk to HSBC as determined using a risk-based approach. The head of this function reports to the Group Chairman and the Group Audit Committee.
• Management is responsible for ensuring that recommendations made by the internal audit function are implemented within an appropriate and agreed timetable. Confirmation to this effect must be provided to internal audit. Management must also confirm annually to internal audit that offices under their control have taken or are in the process of taking the appropriate actions to deal with all significant recommendations made by external auditors in management letters or by regulators following regulatory inspections.
The Group Audit Committee has kept under review the effectiveness of this system of internal control and has reported regularly to the Board of Directors. The key processes used by the Committee in carrying out its reviews include: regular business and operational risk assessments; regular reports from the heads of key risk functions including Internal Audit and Compliance; the production annually of reviews of the internal control framework applied at Group Management Office and major operating subsidiary level measured against HSBC benchmarks, which cover all internal controls, both financial and non-financial; semi-annual confirmations from chief executives of principal subsidiary companies as to whether there have been any material losses, contingencies or uncertainties caused by weaknesses in internal controls; internal audit reports; external audit reports; prudential reviews; and regulatory reports. The Group Audit Committee has reviewed a ‘Risk Map’ of the status of key risk areas which impact the Group and has considered the mitigating actions put in place. In addition, where unexpected losses have arisen or where incidents have occurred which indicate gaps in the control framework or in adherence to Group policies, the Group Audit Committee has reviewed special reports, prepared at the instigation of management, which analyse the cause of the issue, the lessons learned and the actions proposed by management to address the issue.
The Directors, through the Group Audit Committee, have conducted an annual review of the effectiveness of HSBC’s system of internal control

301
covering all material controls, including financial, operational and compliance controls and risk management systems. The Group Audit Committee has received confirmation that management has taken or is taking the necessary action to remedy any failings or weaknesses identified through the operation of HSBC’s framework of controls.
Directors’ interests
Pursuant to the requirements of the UK Listing Rules
and according to the register of Directors’ interests maintained by HSBC Holdings pursuant to section 352 of the Securities and Futures Ordinance of Hong Kong, the Directors of HSBC Holdings at 31 December 2008 had the following interests, all beneficial unless otherwise stated, in the shares and loan capital of HSBC and its associated corporations:
Directors’ interests HSBC Holdings ordinary shares of US$0.50
At 31 December 2008 At
1 January 2008 or date appointed if later
Beneficial owner
Child under 18 or spouse
Controlled corporation
Jointly with another person
Trustee Total interests1
V H C Cheng .............................. 241,4692 177,630 123,160 – – – 300,790 J D Coombe ................................ 46,327 13,250 – – – – 13,250 D J Flint ...................................... 112,781 88,456 – – – 31,0003 119,456 A A Flockhart ............................. 164,9302 172,583 – – – – 172,583 W K L Fung ................................ 328,000 208,000 – 120,000 – – 328,000 M F Geoghegan .......................... 385,189 477,434 – – – – 477,434 S K Green ................................... 536,652 622,066 – – 45,355 – 667,421 S T Gulliver ................................ 2,235,4312 2,194,407 85,454 – – – 2,279,861 J W J Hughes-Hallett .................. 554,435 – – – – 376,4274 376,427 W S H Laidlaw ........................... 24,500 20,693 – – – 1,0004 21,693 Sir Mark Moody-Stuart .............. 10,840 5,000 840 – – 5,0004 10,840 G Morgan .................................... 50,000 52,873 – – – – 52,873 S M Robertson ............................ 98,317 5,620 – – – 93,0004 98,620 Sir Brian Williamson .................. 23,164 24,496 – – – – 24,496
1 Details of executive Directors’ other interests in HSBC Holdings ordinary shares of US$0.50 arising from the HSBC Holdings savings-related share option plans, and the HSBC Share Plan are set out in the Directors’ Remuneration Report on pages 314 to 328. At 31 December 2008, the aggregate interests under the Securities and Futures Ordinance of Hong Kong of V H C Cheng, D J Flint, AA Flockhart, M F Geoghegan, S K Green and S T Gulliver in HSBC Holdings ordinary shares of US$0.50, including interests arising through employee share plans were: V H C Cheng – 791,228; D J Flint – 955,242; A A Flockhart – 558,559; M F Geoghegan - 2,211,264; S K Green – 2,456,279 and S T Gulliver – 3,536,102. Each Director’s total interests represents less than 0.033 per cent of the shares in issue.
2 V H C Cheng was appointed a Director on 1 February 2008 and A A Flockhart and S T Gulliver were appointed Directors on 1 May 2008.
3 Non-beneficial interest in 10,334 HSBC Holdings ordinary shares of US$0.50. 4 Non-beneficial.
M F Geoghegan has an interest as beneficial owner in 280,000 ordinary shares of HK$5.00 each in Hang Seng Bank (representing less than 0.02 per cent of the shares in issue), which he held throughout the year.
S K Green has an interest as beneficial owner in €75,000 of HSBC Holdings plc 5½ per cent Subordinated Notes 2009, which he held throughout the year.
As Directors of HSBC France, S K Green and S T Gulliver each have an interest as beneficial owner in one share of €5 in that company (representing less than 0.01 per cent of the shares in issue). S K Green has held this interest throughout
the year. S T Gulliver has held this interest since 1 January 2009. The Directors have waived their rights to receive dividends on these shares and have undertaken to transfer these shares to HSBC on ceasing to be Directors of HSBC France.
As Directors of HSBC Private Banking Holdings (Suisse), S K Green and S T Gulliver each have an interest as beneficial owner in one share of CHF1,000 in that company (representing less than 0.01 per cent of the shares in issue), which they held throughout the year. The Directors have waived their rights to receive dividends on these shares and have undertaken to transfer these shares to HSBC on ceasing to be Directors of HSBC Private Banking Holdings (Suisse).

H S B C H O L D I N G S P L C
Report of the Directors: Governance (continued) Board of Directors > Directors’ interests / Employees
302
No Directors held any short position as defined in the Securities and Futures Ordinance of Hong Kong in the shares and loan capital of HSBC and its associated corporations. Save as stated above, none of the Directors had an interest in any shares or debentures of HSBC or any associated corporation at the beginning or at the end of the year, and none of
the Directors or members of their immediate family was awarded or exercised any right to subscribe for any shares or debentures in any HSBC corporation during the year. Since the end of the year, the interests of each of the following Directors have increased by the number of HSBC Holdings ordinary shares shown against their name:
Increase in Directors’ Interests since 31 December 2008 HSBC Holdings ordinary shares of US$0.50
Beneficial owner
Child under 18 or spouse
Controlled corporation
Trustee
Beneficiary of a trust1
V H C Cheng .............................................................. 3,2742 2,2702 – – 9,041 J D Coombe ................................................................ 2452 – – – – D J Flint ...................................................................... 1,6963 – – 5712 15,367 A A Flockhart ............................................................. 3,1802 – – – 7,092 M F Geoghegan .......................................................... 4,4102 – – – 31,966
S K Green .................................................................... 11,1474 – – – 32,981
S T Gulliver ................................................................ – 82 – – 23,161
G Morgan .................................................................... 9742 – – – – S M Robertson ............................................................ 1032 – – – – Sir Brian Williamson .................................................. 4532 – – – –
1 Scrip dividend on awards held under the HSBC Share Plan. 2 Scrip dividend. 3 Comprises scrip dividend on shares held as beneficial owner (1,502 shares), the automatic reinvestment of dividend income by an
Individual Savings Account or Personal Equity Plan manager (114 shares), the acquisition of shares in the HSBC Holdings UK Share Ownership Plan through regular monthly contributions (49 shares) and the automatic reinvestment of dividend income on shares held in the plan (31 shares).
4 Comprises scrip dividend on shares held as beneficial owner (11,067 shares), the acquisition of shares in the HSBC Holdings UK Share Ownership Plan through regular monthly contributions (49 shares) and the automatic reinvestment of dividend income on shares held in the plan (31 shares).
Since the end of the year, the non-beneficial interests of J W J Hughes-Hallett as Trustee of two Trusts have decreased by 102,948 HSBC Holdings ordinary shares.
There have been no other changes in the share and loan capital interests of the Directors from 31 December to the date of this Report. Any subsequent changes up to the last practicable date before the publication of the Notice of Annual General Meeting will be set out in the notes to that Notice.
At 31 December 2008, Directors and Senior Management held, in aggregate, beneficial interests in 16,469,373 HSBC Holdings ordinary shares (0.14 per cent of the issued ordinary shares).
At 31 December 2008, executive Directors and Senior Management held, in aggregate, options to subscribe for 937,862 HSBC Holdings ordinary shares under the HSBC Holdings Executive Share Option Scheme, HSBC Holdings savings-related share option plans, HSBC Holdings Group Share Option Plan and HSBC Finance: 1996 Long-Term Executive Incentive Compensation Plan. These options are exercisable between 2009 and 2015 at prices ranging from £5.3496 to £7.8710 and US$10.66 to US$21.37 per share.

303
Employees
At 31 December 2008, HSBC employed 325,000 full and part-time employees worldwide, compared with 330,000 at 31 December 2007 and 312,000 at 31 December 2006. The main centres of employment are the UK with approximately 58,000 employees; the US 38,000, India 37,000, Hong Kong 30,000, Brazil 25,000, Mexico 20,000, mainland China 15,000 and France 11,000. HSBC negotiates with recognised unions. The five highest concentrations of union membership are in Argentina, Brazil, mainland China, Malta and Mexico. It is HSBC’s policy to maintain well-developed communications and consultation programmes with unions and there have been no material disruptions to its operations from labour disputes during the past five years.
The first Group People Strategy was in place for 2008. This prioritised leadership and people capability in general, robust performance management complementing a market competitive reward strategy, and improving employee engagement. Particular emphasis was given in 2008 to increasing international mobility to broaden the internationalism and diversity of employee experience, and training was focused on risk awareness, change management, customer orientation and performance. There was significant improvement in employee engagement (see non-financial KPIs in page 19) and a key component of performance management was aligned objectives which were cascaded down from the Group Management Board level for the first time.
HSBC continues to be committed to creating a diverse and inclusive work environment reflective of its customer base, international workforce, and communities in which it operates. It has a Group-wide strategy, with Group oversight, that aims to improve gender, ethnicity and age diversity to ensure the long-term sustainability of the organisation, taking into account strategic global demographic changes. There is a particular focus on increasing gender and ethnic diversity at senior management levels. Diversity initiatives are implemented at a country level taking local and national laws into account. Employee network groups and mentoring programmes are promoted and established, where possible, to facilitate open discussion of workplace issues for employees belonging to minority groups, and to foster an environment that celebrates diversity.
Employee involvement
HSBC continues to value open communication with its employees. Employees are encouraged to discuss
operational and strategic issues, and ways of improving performance with their line manager. Open communication throughout the organisation is encouraged and opportunities to share individual perspectives are created through networking events, management blogs, international assignments and learning and development programmes. Information is regularly given to employees about employment matters and the financial and economic factors affecting HSBC’s performance. This is communicated via management channels, internal seminars, training programmes, in-house magazines and an intranet site accessible to the majority of HSBC’s employees worldwide. The Group’s Global People Survey in turn annually assesses employee engagement with HSBC.
Employment of disabled persons
HSBC believes in providing equal opportunities to all employees. The employment of disabled persons is included in this commitment and the recruitment, training, career development and promotion of disabled persons is based on the aptitudes and abilities of the individual. Should employees become disabled during employment, every effort is made to continue their employment and, if necessary, appropriate training is provided.
Remuneration policy
As the quality and commitment of its human capital is deemed fundamental to HSBC’s success, the Board’s stated strategy is to attract, retain and motivate the very best people; this strategy is referenced to the overall business strategy and the commercial environment.
In a business that is based on trust and relationships, HSBC’s broad policy is to recruit those who are committed to making a long-term career with the organisation since trust and relationships are built over time.
Remuneration is an important component in people’s decisions on which company to join and to stay with, but it is not the overriding one. It is HSBC’s experience that people are attracted to an organisation with strong and sound values, one which is meritocratic and competitive, and which offers challenging career development; it is also this type of people that HSBC seeks to attract.
In line with the overall principles applied to executive Directors by the Remuneration Committee as described on page 315 in the Directors’ Remuneration Report:
• employees’ salaries are reviewed annually in the
H S B C H O L D I N G S P L C
Report of the Directors: Governance (continued)
Employees > Share plans
304
context of business performance, market practice and internal relativities. Allowances and benefits are largely determined by local market practice;
• employees participate in various variable pay arrangements. Discretionary variable pay is dependent on the achievement of objectives which derive from those determined at the Group level. Since 2008, these objectives typically cover four categories – Financial, Customer, Process and People. Targets which measure these objectives generally include profitability, expense control, customer recommendation, employee engagement, adherence to HSBC’s ethical standards, lending guidelines, internal controls and procedures, with an emphasis on risk management to maintain a strong and secure operating platform. Actual levels of pay will depend on the performance of the Group, that of constituent businesses, and of the individual, taking into account competitive market practice.
• to ensure that the interests of HSBC and its employees are aligned with those of its shareholders, and that HSBC’s approach to risk management supports the interests of all stakeholders, a proportion of variable pay awards above certain thresholds is required to be deferred into HSBC Restricted Shares. In addition, employees are encouraged to participate in HSBC Holdings savings-related share option plans and local share ownership arrangements.
Employee share plans
To help align the interests of employees with those of shareholders, share options are granted under all-employee share plans and discretionary awards of Performance Shares and Restricted Shares are made under the HSBC Share Plan. There have been no awards of discretionary share options since 30 September 2005.
Set out on pages 304 to 311 are particulars of outstanding employee share options, including those held by employees working under employment contracts that are regarded as ‘continuous contracts’ for the purposes of the Hong Kong Employment Ordinance. The options were granted at nil consideration. No options have been granted to substantial shareholders, suppliers of goods or services, or in excess of the individual limit for each share plan. No options were cancelled by HSBC during the year.
Employee share plans are subject to the
following limits on the number of HSBC Holdings ordinary shares that may be subscribed for. In any 10-year period not more than 10 per cent of the HSBC Holdings ordinary shares in issue from time to time (approximately 1,214 million HSBC Holdings ordinary shares at 2 March 2009) may in aggregate become issuable pursuant to the grant of options or be issued other than pursuant to options under all-employee share plans. In any 10-year period not more than 5 per cent of the HSBC Holdings ordinary shares in issue from time to time (approximately 607 million HSBC Holdings ordinary shares on 2 March 2009) may in aggregate be put under option under the HSBC Share Plan or be issuable pursuant to the HSBC Holdings Group Share Option Plan, the HSBC Executive Share Option Scheme, the HSBC Holdings Restricted Share Plan 2000 or the HSBC Share Plan. The number of HSBC Holdings ordinary shares that may be issued on exercise of all options granted on or after 27 May 2005 under the HSBC Share Plan and any other plans must not exceed 1,119,000,000 HSBC Holdings ordinary shares. Under the HSBC Holdings savings-related share option plans, the HSBC Share Plan, HSBC Holdings Group Share Option Plan and the HSBC Holdings Executive Share Option Scheme there were options outstanding over 231,257,004 HSBC Holdings ordinary shares at 31 December 2008. Particulars of options over HSBC Holdings shares held by Directors of HSBC Holdings are set out on page 326 of the Directors’ Remuneration Report.
The effect on earnings per share of granting share options and share awards is shown in diluted earnings per share on the face of the consolidated income statement, with further details disclosed in the Earnings per share Note 13 on the Financial Statements. The effect on basic earnings per share of dilutive share options and share awards would be to dilute it by 1.2 per cent.
All-employee share option plans
The HSBC Holdings Savings-Related Share Option Plan and the HSBC Holdings Savings-Related Share Option Plan: International are all-employee share plans under which eligible HSBC employees (those employed within the Group on the first working day of the year of grant) may be granted options to acquire HSBC Holdings ordinary shares. Employees may make contributions of up to £250 (or equivalent) each month over a period of one, three or five years which may be used on the first, third or fifth anniversary of the commencement of the relevant savings contract, at the employee’s election, to exercise the options. Alternatively, the employee

305
may elect to have the savings, plus (where applicable) any interest or bonus, repaid in cash. Options granted over a one-year period will be exercisable within three months following the first anniversary of the commencement of the savings contract. Options granted over three or five-year periods will be exercisable within six months following the third or fifth anniversary of the commencement of the relevant savings contract. In the case of redundancy, retirement on grounds of injury or ill health, retirement at or after normal retirement age, the transfer of the employing business to another party, or a change of control of the employing company, options may be exercised before completion of the relevant savings contract.
Under the HSBC Holdings Savings-Related Share Option Plan and the HSBC Holdings Savings-Related Share Option Plan: International the option exercise price is determined by reference to the average market value of the ordinary shares on the five business days immediately preceding the invitation date, then applying a discount of 20 per cent (except for the one-year options awarded under the US sub-plan where a 15 per cent discount is applied). The exercise period of the options awarded under all-employee share plans may be advanced to an earlier date in certain circumstances,
for example on retirement, and may be extended in certain circumstances, for example on the death of a participant, the executors may exercise the option up to six months beyond the normal exercise period. The closing price per HSBC Holdings ordinary share on 29 April 2008, the day before options were awarded in 2008 under the HSBC Holdings Savings-Related Share Option Plan and the HSBC Holdings Savings-Related Share Option Plan: International, was £8.71. The all-employee share option plans will terminate on 27 May 2015 unless the Directors resolve to terminate the plans at an earlier date.
To encourage greater participation in the HSBC Holdings Savings-Related Share Option Plan: International, two amendments were approved at the 2005 Annual General Meeting. The first was the introduction of the facility to save and have option prices expressed in US dollars, Hong Kong dollars and euros as well as in pounds sterling. Where applicable, the US dollars, Hong Kong dollars and euro exercise prices are converted from the sterling exercise price at the applicable exchange rate on the working day preceding the relevant invitation date. The second amendment was to provide the choice of options over one year in addition to three and five year terms.
HSBC Holdings Savings-Related Share Option Plan HSBC Holdings ordinary shares of US$0.50
Date of award
Exercise price (£)
Exercisable from
Exercisable until
Options at 1 January 2008
Options awarded during year
Options exercised during year1
Options lapsed during year
Options at 31 December 2008
2 May 2002 6.3224 1 Aug 2007 31 Jan 2008 86,920 – 63,438 23,482 – 23 Apr 2003 5.3496 1 Aug 2008 31 Jan 2009 10,402,796 – 9,900,129 131,349 371,318 21 Apr 2004 6.4720 1 Aug 2007 31 Jan 2008 132,967 – 90,953 42,014 – 21 Apr 2004 6.4720 1 Aug 2009 31 Jan 2010 4,941,092 – 65,740 227,458 4,647,894 24 May 2005 6.6792 1 Aug 2008 31 Jan 2009 3,522,870 – 3,190,140 132,372 200,358 24 May 2005 6.6792 1 Aug 2010 31 Jan 2011 4,938,431 – 49,280 338,748 4,550,403 26 Apr 2006 7.6736 1 Aug 2009 31 Jan 2010 3,817,398 – 30,546 627,424 3,159,428 26 Apr 2006 7.6736 1 Aug 2011 31 Jan 2012 3,062,172 – 14,045 411,234 2,636,893 25 Apr 2007 7.0872 1 Aug 2010 31 Jan 2011 5,767,372 – 20,411 1,041,305 4,705,656 25 Apr 2007 7.0872 1 Aug 2012 31 Jan 2013 4,075,471 – 6,641 513,887 3,554,943 30 Apr 2008 6.8160 1 Aug 2011 31 Jan 2012 – 7,169,605 843 435,469 6,733,293 30 Apr 2008 6.8160 1 Aug 2013 31 Jan 2014 – 6,142,429 277 194,292 5,947,860
1 The weighted average closing price of the shares immediately before the dates on which options were exercised was £8.38.

H S B C H O L D I N G S P L C
Report of the Directors: Governance (continued)
Employees > Share plans
306
HSBC Holdings Savings-Related Share Option Plan: International HSBC Holdings ordinary shares of US$0.50
Date of award
Exercise price
Exercisable from
Exercisable until
Options at 1 January 2008
Options awarded during year
Options exercised during year1
Options lapsed during year
Options at 31 December 2008
(£) 2 May 2002 6.3224 1 Aug 2007 31 Jan 2008 39,172 – 11,080 28,092 – 23 Apr 2003 5.3496 1 Aug 2008 31 Jan 2009 10,488 – 2,622 7,866 – 8 May 2003 5.3496 1 Aug 2008 31 Jan 2009 5,068,502 – 4,450,550 237,932 380,020 21 Apr 2004 6.4720 1 Aug 2007 31 Jan 2008 31,145 – – 31,145 – 21 Apr 2004 6.4720 1 Aug 2009 31 Jan 2010 12,365 – – 4,909 7,456 10 May 2004 6.4720 1 Aug 2007 31 Jan 2008 250,528 – 115,753 134,775 – 10 May 2004 6.4720 1 Aug 2009 31 Jan 2010 2,554,187 – 55,289 217,035 2,281,863 24 May 2005 6.6792 1 Aug 2008 31 Jan 2009 9,435,222 – 8,155,187 658,711 621,324 24 May 2005 6.6792 1 Aug 2010 31 Jan 2011 3,403,578 – 45,044 554,261 2,804,273 26 Apr 2006 7.6736 1 Aug 2007 31 Oct 2007 31,658 – – 31,658 – 26 Apr 2006 7.6736 1 Aug 2009 31 Jan 2010 1,804,327 – 4,016 274,736 1,525,575 26 Apr 2006 7.6736 1 Aug 2011 31 Jan 2012 406,743 – 423 82,646 323,674 25 Apr 2007 7.0872 1 Aug 2008 31 Oct 2008 1,543,966 – 1,214,997 328,705 264 25 Apr 2007 7.0872 1 Aug 2010 31 Jan 2011 3,436,093 – 2,620 616,589 2,816,884 25 Apr 2007 7.0872 1 Aug 2012 31 Jan 2013 975,763 – 885 201,033 773,845 30 Apr 2008 6.8160 1 Aug 2009 31 Oct 2009 – 1,988,482 267 148,344 1,839,871 30 Apr 2008 6.8160 1 Aug 2011 31 Jan 2012 – 3,467,432 – 175,661 3,291,771 30 Apr 2008 6.8160 1 Aug 2013 31 Jan 2014 – 1,253,627 – 58,051 1,195,576
(US$) 26 Apr 2006 13.3290 1 Aug 2007 31 Oct 2007 5,273 – – 5,273 – 26 Apr 2006 13.3290 1 Aug 2009 31 Jan 2010 1,475,871 – 24,208 303,234 1,148,429 26 Apr 2006 13.3290 1 Aug 2011 31 Jan 2012 385,965 – 4,700 75,912 305,353 25 Apr 2007 14.74782 1 Aug 2008 31 Oct 2008 671,449 – 513,054 158,395 – 25 Apr 2007 13.8803 1 Aug 2008 31 Oct 2008 337,780 – 251,207 86,573 – 25 Apr 2007 13.8803 1 Aug 2010 31 Jan 2011 2,687,923 – 10,926 632,354 2,044,643 25 Apr 2007 13.8803 1 Aug 2012 31 Jan 2013 760,659 – 1,496 168,994 590,169 30 Apr 2008 14.48762 1 Aug 2009 31 Oct 2009 – 615,822 – 66,288 549,534 30 Apr 2008 13.6354 1 Aug 2009 31 Oct 2009 – 425,697 – 26,231 399,466 30 Apr 2008 13.6354 1 Aug 2011 31 Jan 2012 – 1,979,660 294 142,021 1,837,345 30 Apr 2008 13.6354 1 Aug 2013 31 Jan 2014 – 537,563 – 30,357 507,206 (€) 26 Apr 2006 11.0062 1 Aug 2007 31 Oct 2007 847 – – 847 – 26 Apr 2006 11.0062 1 Aug 2009 31 Jan 2010 176,800 – – 52,429 124,371 26 Apr 2006 11.0062 1 Aug 2011 31 Jan 2012 35,495 – – 13,664 21,831 25 Apr 2007 10.4217 1 Aug 2008 31 Oct 2008 122,632 – 46,698 75,934 – 25 Apr 2007 10.4217 1 Aug 2010 31 Jan 2011 361,842 – – 107,360 254,482 25 Apr 2007 10.4217 1 Aug 2012 31 Jan 2013 125,856 – – 51,047 74,809 30 Apr 2008 8.6720 1 Aug 2009 31 Oct 2009 – 163,223 – 13,900 149,323 30 Apr 2008 8.6720 1 Aug 2011 31 Jan 2012 – 501,343 – 18,873 482,470 30 Apr 2008 8.6720 1 Aug 2013 31 Jan 2014 – 209,331 – 12,498 196,833 (HK$) 26 Apr 2006 103.4401 1 Aug 2007 31 Oct 2007 1,961 – – 1,961 – 26 Apr 2006 103.4401 1 Aug 2009 31 Jan 2010 3,891,154 – 10,582 1,569,459 2,311,113 26 Apr 2006 103.4401 1 Aug 2011 31 Jan 2012 1,024,842 – 7,221 443,256 574,365 25 Apr 2007 108.4483 1 Aug 2008 31 Oct 2008 2,108,126 – 1,747,467 360,659 – 25 Apr 2007 108.4483 1 Aug 2010 31 Jan 2011 4,481,255 – 12,548 2,100,755 2,367,952 25 Apr 2007 108.4483 1 Aug 2012 31 Jan 2013 1,332,074 – 4,137 651,814 676,123 30 Apr 2008 106.2478 1 Aug 2009 31 Oct 2009 – 2,941,862 – 1,243,237 1,698,625 30 Apr 2008 106.2478 1 Aug 2011 31 Jan 2012 – 4,174,635 412 1,417,928 2,756,295 30 Apr 2008 106.2478 1 Aug 2013 31 Jan 2014 – 1,380,594 – 420,900 959,694
1 The weighted average closing price of the shares immediately before the dates on which options were exercised was £8.32. 2 Exercisable at a 15 per cent discount to the average market value of the ordinary shares on the five business days immediately
preceding the invitation date.

307
Discretionary Share Plans
Note 10 on the Financial Statements gives detail on share-based payments, including awards of Performance Shares and Restricted Shares made in 2008.
The HSBC Share Plan was approved at the 2005 Annual General Meeting. Awards of Performance Shares are made under this Plan to executive Directors and other senior executives. The performance conditions for awards of Performance Shares are described under ‘Long-term incentive plan’ on page 318.
Awards of Performance Shares are directed to those senior executives who can influence corporate performance such as members of the Group Management Board.
Awards of Restricted Shares are typically made to other employees based on individual performance, business performance and competitive market practice.
Restricted Share awards define the number of shares to which the employee will become entitled, generally between one and three years from the date of the award, and normally subject to the individual remaining in employment. To date, all awards of Performance Shares and Restricted Shares have been satisfied by the transfer of existing shares.
Since September 2005, no awards of share options under the HSBC Share Plan have been granted. There may be particular circumstances in the future where option grants could be appropriate. No options were awarded under the HSBC Share Plan in 2008.
Prior to 2005, discretionary awards of share options, with vesting subject to the attainment of a predetermined TSR performance condition, were made to employees at all levels of HSBC.
The vesting of these options was subject to the attainment of pre-determined relative TSR performance criteria, except in HSBC France (which was acquired in 2000) where performance criteria were phased in. Under the HSBC Holdings Group Share Option Plan, the maximum grant of options which could be granted to an employee in any one year (together with the Performance Share awards
under the HSBC Holdings Restricted Share Plan 2000) was 150 per cent (or in exceptional circumstances 225 per cent) of the employee’s annual salary at the date of grant plus any bonus paid in the previous year.
Under the HSBC Holdings Executive Share Option Scheme the maximum value of options which could be granted to an employee in any one year was four times the employee’s relevant earnings.
Subject to the attainment of the relative TSR performance condition where applicable, options are generally exercisable between the third and the tenth anniversary of the date of grant. Employees of a subsidiary that is sold or transferred out of HSBC may exercise options awarded under the HSBC Holdings Group Share Option Plan or the HSBC Holdings Executive Share Option Scheme within six or twelve months respectively of the sale or transfer, regardless of whether the performance condition is met.
The maximum value of options that may be granted to an employee in any one year under the HSBC Plan (when taken together with any Performance Share award made under the HSBC Share Plan) is 700 per cent of the employee’s annual salary at the date of grant.
The exercise price of options granted under the HSBC Share Plan, and previously under the HSBC Holdings Group Share Option Plan, is the higher of the average market value of the ordinary shares on the five business days prior to the grant of the option or the market value of the ordinary shares on the date of grant of the option. The exercise price of options granted under the HSBC Holdings Executive Share Option Scheme was the market value of the ordinary shares on the business day prior to the grant of the option. The HSBC Share Plan will terminate on 27 May 2015 unless the Directors resolve to terminate the Plan at an earlier date.
The exercise period of the options awarded under discretionary share incentive plans may be advanced to an earlier date in certain circumstances, for example on the sale of a business, or may be extended in certain circumstances, for example on the death of a participant the executors may exercise the option beyond the normal exercise period.

H S B C H O L D I N G S P L C
Report of the Directors: Governance (continued) Employees > Share plans
308
HSBC Holdings Executive Share Option Scheme1 HSBC Holdings ordinary shares of US$0.50
Date of award
Exercise price (£)
Exercisable from
Exercisable until
Options at 1 January 2008
Options exercised during year2
Options lapsed during year
Options at 31 December 2008
16 Mar 1998 6.2767 16 Mar 2001 16 Mar 2008 427,641 414,141 13,500 – 29 Mar 1999 6.3754 3 Apr 2002 29 Mar 2009 9,794,913 2,872,548 64,352 6,858,013 10 Aug 1999 7.4210 10 Aug 2002 10 Aug 2009 91,058 19,958 – 71,100 31 Aug 1999 7.8710 31 Aug 2002 31 Aug 2009 4,000 – – 4,000 3 Apr 2000 7.4600 3 Apr 2003 3 Apr 2010 7,920,930 743,938 146,099 7,030,893
1 The HSBC Holdings Executive Share Option Scheme expired on 26 May 2000. No options have been granted under the Scheme since that date.
2 The weighted average closing price of the shares immediately before the dates on which options were exercised was £8.47.
HSBC Holdings Group Share Option Plan1 HSBC Holdings ordinary shares of US$0.50
Date of award
Exercise price (£)
Exercisable from
Exercisable until
Options at 1 January 2008
Options exercised during year2
Options lapsed during year
Options at 31 December 2008
4 Oct 2000 9.6420 4 Oct 2003 4 Oct 2010 306,641 – 7,625 299,016 23 Apr 2001 8.7120 23 Apr 2004 23 Apr 2011 27,166,097 245,744 772,167 26,148,186 30 Aug 2001 8.2280 30 Aug 2004 30 Aug 2011 153,518 5,750 – 147,768 7 May 2002 8.4050 7 May 2005 7 May 2012 29,562,689 512,200 680,556 28,369,933 30 Aug 2002 7.4550 30 Aug 2005 30 Aug 2012 354,600 3,450 210,500 140,650 2 May 2003 6.9100 2 May 2006 2 May 2013 28,957,295 2,548,099 548,952 25,860,244 29 Aug 2003 8.1300 29 Aug 2006 29 Aug 2013 394,784 13,010 14,130 367,644 3 Nov 2003 9.1350 3 Nov 2006 3 Nov 2013 4,069,800 – 458,000 3,611,800 30 Apr 2004 8.2830 30 Apr 2007 30 Apr 2014 53,842,886 375,872 2,779,812 50,687,202 27 Aug 2004 8.6500 27 Aug 2007 27 Aug 2014 312,000 – 12,800 299,200 20 Apr 2005 8.3620 30 Apr 2008 20 Apr 2015 7,095,295 30,000 404,525 6,660,770
1 The HSBC Holdings Group Share Option Plan expired on 26 May 2005. No options have been granted under the Plan since that date. 2 The weighted average closing price of the shares immediately before the dates on which options were exercised was £8.59.
HSBC Share Plan HSBC Holdings ordinary shares of US$0.50
Date of award
Exercise price (£)
Exercisable from
Exercisable until
Options at 1 January 2008
Options exercised during year
Options lapsed during year
Options at 31 December 2008
21 Jun 2005 8.794 21 Jun 2008 21 Jun 2009 449,455 – 224,728 224,727 30 Sep 2005 9.170 30 Sep 2008 30 Sep 2015 74,985 – – 74,985
Subsidiary company share plans
HSBC France and subsidiary company
When it was acquired in 2000, HSBC France and one of its subsidiary companies, HSBC Private Bank France, operated employee share option plans under
which options could be granted over their respective shares. No further options will be granted under either of these companies’ plans. The following are details of outstanding options to acquire shares in HSBC France and HSBC Private Bank France.

309
HSBC France Shares of €5 Date of award
Exercise price (€)
Exercisable from
Exercisable until
Options at 1 January 2008
Options exercised during year1
Options lapsed during year
Options at 31 December 20081
29 Apr 1998 73.48 7 Jun 2000 29 Apr 2008 100,379 100,379 – – 7 Apr 1999 81.71 7 Jun 2000 7 Apr 2009 304,402 120,775 – 183,627 12 Apr 2000 142.50 1 Jan 2002 12 Apr 2010 604,250 – – 604,250
1 Following exercise of the options, the HSBC France shares will be exchanged for HSBC Holdings ordinary shares in the same ratio as for the acquisition of HSBC France (13 HSBC Holdings ordinary shares for each HSBC France share). At 31 December 2008, The HSBC Holdings Employee Benefit Trust 2001 (No. 1) held 8,790,276 HSBC Holdings ordinary shares which may be exchanged for HSBC France shares arising from the exercise of these options.
HSBC Private Bank France Shares of €2
Date of award
Exercise price (€)
Exercisable from
Exercisable until
Options at 1 January 2008
Options exercised during year1
Options lapsed during year
Options at 31 December 20081
21 Dec 1999 10.84 21 Dec 2000 21 Dec 2009 33,250 7,000 – 26,250 10 Mar 2000 12.44 27 Jun 2004 31 Dec 2010 20,626 – – 20,626 15 May 2001 20.80 15 May 2002 15 May 2011 141,525 – – 141,525 1 Oct 2002 22.22 2 Oct 2005 1 Oct 2012 145,575 – – 145,575
1 Following exercise of the options, the HSBC Private Bank France shares will be exchanged for HSBC Holdings ordinary shares in the ratio of 1.83 HSBC Holdings ordinary shares for each HSBC Private Bank France share. At 31 December 2008, The CCF Employee Benefit Trust 2001 held 943,142 HSBC Holdings ordinary shares which may be exchanged for HSBC Private Bank France shares arising from the exercise of these options.
HSBC Finance and its subsidiaries
Following the acquisition of HSBC Finance in 2003, all outstanding options and equity-based awards over HSBC Finance common shares were converted into rights to receive HSBC Holdings ordinary shares in the same ratio as the share exchange offer for the acquisition of HSBC Finance (2.675 HSBC Holdings ordinary shares for each HSBC Finance common share) and the exercise prices per share were adjusted accordingly. No further options will be granted under any of these plans.
All outstanding options and other equity-based awards over HSBC Finance common shares granted before 14 November 2002, being the date the
transaction was announced, vested on completion of the acquisition. Options and equity-based awards granted on or after 14 November 2002 are exercisable on their original terms, save that they have been adjusted to reflect the exchange ratio.
The following are details of options and equity-based awards to acquire shares in HSBC Holdings.
At 31 December 2008, the HSBC (Household) Employee Benefit Trust 2003 held 1,687,279 HSBC Holdings ordinary shares and 196,455 American Depositary Shares, each of which represents five HSBC Holdings ordinary shares, which may be used to satisfy the exercise of employee share options.
HSBC Finance: 1996 Long-Term Executive Incentive Compensation Plan HSBC Holdings ordinary shares of US$0.50 Date of award
Exercise price (US$)
Exercisable from
Exercisable until
Options at 1 January 2008
Options exercised during year1
Options lapsed during year
Options at 31 December 2008
1 Jul 1998 19.21 1 Jul 1999 1 Jul 2008 80,250 – 80,250 – 9 Nov 1998 13.71 9 Nov 1999 9 Nov 2008 841,566 245,375 596,191 – 17 May 1999 16.99 17 May 2000 17 May 2009 334,375 – – 334,375 31 Aug 1999 13.96 31 Aug 2000 31 Aug 2009 300,938 – – 300,938 8 Nov 1999 16.96 8 Nov 2000 8 Nov 2009 4,250,577 – – 4,250,577 30 Jun 2000 15.70 30 Jun 2001 30 Jun 2010 26,846 – – 26,846 8 Feb 2000 13.26 8 Feb 2001 8 Feb 2010 66,875 – – 66,875 13 Nov 2000 18.40 13 Nov 2001 13 Nov 2010 5,728,514 – – 5,728,514 12 Nov 2001 21.37 12 Nov 2002 12 Nov 2011 7,571,322 – – 7,571,322 20 Nov 2002 10.66 20 Nov 2003 20 Nov 2012 2,454,298 12,038 40,125 2,402,135
1 The weighted average closing price of the shares immediately before the dates on which options were exercised was £8.34.

H S B C H O L D I N G S P L C
Report of the Directors: Governance (continued) Employees > Share plans / Compensation
310
HSBC Finance: 1996 Long-Term Executive Incentive Compensation Plan1 HSBC Holdings ordinary shares of US$0.50
Date of award
Vesting from
Vesting until
Rights at 1 January 2008
Rights vested during year2
Rights lapsed during year
Rights at 31 December 2008
2 Dec 2002 2 Dec 2005 2 Dec 2007 1,784 1,784 – – 2 Jan 2003 2 Jan 2006 2 Jan 2008 447 447 – – 15 Jan 2003 15 Jan 2006 15 Jan 2008 10,480 10,480 – – 3 Feb 2003 3 Feb 2006 3 Feb 2008 2,906 2,906 – – 14 Feb 2003 14 Feb 2006 14 Feb 2008 49,134 49,134 – – 3 Mar 2003 3 Mar 2006 3 Mar 2008 447 447 – –
1 Awards of Restricted Stock Rights which represent a right to receive shares for nil consideration if the employee remains in the employment of HSBC Finance at the date of vesting.
2 The weighted average closing price of the shares immediately before the dates on which rights vested was £8.56.
Renaissance Holdings, Inc: Amended and Restated 1997 Incentive Plan HSBC Holdings ordinary shares of US$0.50
Date of award
Exercise price (US$)
Exercisable from
Exercisable until
Options at 1 January 2008
Options exercised during year1
Options lapsed during year
Options at 31 December 2008
1 Jan 1998 1.25 1 Jan 1999 1 Jan 2008 1,424 – 1,424 – 1 Oct 1998 1.74 1 Oct 1999 1 Oct 2008 803 – 803 – 1 Jan 1999 2.24 1 Jan 2000 1 Jan 2009 5,024 5,024 – –
1 The weighted average closing price of the shares immediately before the dates on which options were exercised was £6.25.
Bank of Bermuda
Following the acquisition of Bank of Bermuda in 2004, all outstanding options over Bank of Bermuda shares were converted into rights to receive HSBC Holdings ordinary shares based on the consideration of US$40 for each Bank of Bermuda share and the average closing price of HSBC Holdings ordinary shares, derived from the London Stock Exchange Daily Official List, for the five business days preceding the closing date of the acquisition. No
further options will be granted under any of these plans.
All outstanding options over Bank of Bermuda shares vested on completion of the acquisition. The following are details of options to acquire shares in HSBC Holdings. At 31 December 2008, the HSBC (Bank of Bermuda) Employee Benefit Trust 2004 held 1,877,056 HSBC Holdings ordinary shares which may be used to satisfy the exercise of these options.
Bank of Bermuda: Executive Share Option Plan 1997 HSBC Holdings ordinary shares of US$0.50
Date of award
Exercise price (US$)
Exercisable from
Exercisable until
Options at 1 January 2008
Options exercised during year
Options lapsed during year
Options at 31 December 2008
1 Jul 1998 9.61 1 Jul 1999 1 Jul 2008 67,813 – 67,813 – 23 Feb 1999 7.40 23 Feb 2000 23 Feb 2009 4,904 – – 4,904 3 Aug 1999 7.10 3 Aug 2000 3 Aug 2009 7,634 – – 7,634 4 Feb 2000 7.21 4 Feb 2001 4 Feb 2010 31,678 – – 31,678 1 Jun 2000 7.04 1 Jun 2001 1 Jun 2010 61,649 – – 61,649 31 Jul 2000 10.11 31 Jul 2001 31 Jul 2010 27,744 – – 27,744 11 Jan 2001 14.27 11 Jan 2002 11 Jan 2011 53,943 – – 53,943

311
Bank of Bermuda: Share Option Plan 2000 HSBC Holdings ordinary shares of US$0.50
Date of award
Exercise price (US$)
Exercisable from
Exercisable until
Options at 1 January 2008
Options exercised during year1
Options lapsed during year
Options at 31 December 2008
11 Jan 2001 14.27 11 Jan 2002 11 Jan 2011 134,857 – – 134,8576 Feb 2001 16.41 6 Feb 2002 6 Feb 2011 573,191 1,466 15,372 556,35329 Mar 2001 15.39 29 Mar 2002 29 Mar 2011 270 – – 27016 Apr 2001 15.57 16 Apr 2002 16 Apr 2011 539 – – 5396 Jun 2001 18.35 6 Jun 2002 6 Jun 2011 8,091 – – 8,09116 Jul 2001 16.87 16 Jul 2002 16 Jul 2011 14,930 – – 14,93028 Aug 2001 15.39 28 Aug 2002 28 Aug 2011 13,486 – – 13,48626 Sep 2001 12.79 26 Sep 2002 26 Sep 2011 353,891 3,695 – 350,19630 Jan 2002 15.60 30 Jan 2003 30 Jan 2012 1,226 – – 1,2265 Feb 2002 16.09 5 Feb 2003 5 Feb 2012 756,739 3,548 12,730 740,46110 Jul 2002 15.84 10 Jul 2003 10 Jul 2012 12,260 – – 12,2604 Feb 2003 10.69 4 Feb 2004 4 Feb 2013 133,042 4,138 – 128,90421 Apr 2003 11.85 21 Apr 2004 21 Apr 2013 6,833 – – 6,833
1 The weighted average closing price of the shares immediately before the dates on which options were exercised was £8.15.
Bank of Bermuda: Directors’ Share Option Plan HSBC Holdings ordinary shares of US$0.50
Date of award
Exercise price (US$)
Exercisable from
Exercisable until
Options at 1 January 2008
Options exercised during year
Options lapsed during year
Options at 31 December 2008
22 Sep 1999 8.02 22 Sep 2000 22 Sep 2009 3,082 – – 3,08220 Sep 2000 11.31 20 Sep 2001 20 Sep 2010 4,046 – – 4,04628 Mar 2001 15.76 28 Mar 2002 28 Mar 2011 12,811 – – 12,8113 Apr 2002 16.01 3 Apr 2003 3 Apr 2012 24,520 – – 24,52030 Apr 2003 12.23 30 Apr 2004 30 Apr 2013 4,904 – – 4,904
Employee compensation and benefits
Note 8 on the Financial Statements gives details about employee compensation and benefits including pension plans.
Set out below is information in respect of the five individuals whose emoluments were the highest in HSBC for the year ended 31 December 2008.
Emoluments of 5 highest paid employees
£000
Basic salaries, allowances and benefits in kind .......................................................... 1,059
Pension contributions .................................. 74 Bonuses paid or receivable .......................... 16,386 Inducements to join paid or receivable ....... 16,050
Total ............................................................. 33,569
Total (US$000) ............................................ 61,567
Their emoluments were within the following bands:
Number of Employees
£2,600,001 – £2,700,000 ............................. 1£2,800,001 – £2,900,000 ............................. 1£3,200,001 – £3,300,000 ............................. 1£11,000,001 – £11,100,000 ......................... 1£13,700,001 – £13,800,000 ......................... 1
The aggregate remuneration of Directors and Senior Management for the year ended 31 December 2008 was US$49,835,745.
The aggregate amount set aside or accrued to provide pension, retirement or similar benefits for Directors and Senior Management for the year ended 31 December 2008 was US$1,916,120.
Executive Directors and members of Senior Management are generally subject to notice periods of up to 12 months and a normal retirement age of 65.

H S B C H O L D I N G S P L C
Report of the Directors: Governance (continued) Corporate sustainability / Dividends, shareholders and meetings
312
Corporate sustainability
Sustainability at HSBC is about the Group’s long-term approach to managing economic, social and environmental issues that are within its influence. First and foremost, this is about achieving sustainable profit growth so that HSBC can continue to reward shareholders and employees, build long-lasting relationships with customers and suppliers, and invest in the business and in the communities where the Group operates, for future growth.
This is central to the Group’s strategy and acknowledges that HSBC’s continuing financial success depends, in part, on its ability to identify and address non-financial considerations which are material to the business, and to mitigate the risks and maximise the opportunities arising from them.
Corporate Sustainability Committee
Sustainability at HSBC is embedded into the business and is overseen by the Corporate Sustainability Committee of the HSBC Holdings Board.
The Corporate Sustainability Committee is responsible for advising the HSBC board, committees of the board and executive management on corporate sustainability policies, including environmental, social and ethical issues. At an operational level, these issues are managed on a day-to-day basis primarily by Group Human Resources, Group Risk and Group Corporate Sustainability.
The terms of reference of the Committee are available at www.hsbc.com/boardcommittees. The members of the Committee throughout 2008 were W K L Fung (appointed Chairman on 30 May 2008) and Sir Mark Moody-Stuart, each of whom is a non-executive Director, G V I Davis and Lord May, who are non-director members of the Committee. Lord Butler retired as a Director of HSBC Holdings and ceased to be a member of the Committee on 30 May 2008. N R N Murthy was appointed a member of the Committee on 21 November 2008.
There were four meetings of the Corporate Sustainability Committee during 2008. Following each meeting, the Committee reports to the Board on its activities.
Sustainability at HSBC
HSBC understands the business imperative of investing in its employees, the communities it serves and the environment it relies on. The Group’s priorities are the long-term development and engagement of its employees, increasing its understanding of risk arising from environmental,
social or reputational issues and investing in education and entrepreneurship to allow communities to build capacity and individuals to thrive.
HSBC focuses its environmental initiatives primarily on addressing and responding to issues associated with climate change including energy, water management and biodiversity. Social initiatives are centred on helping to support education and on enabling access to financial services to the world’s poor.
Climate change has the potential to have a material impact on HSBC’s customers and therefore on HSBC’s long-term success. In 2008, HSBC built on its understanding and expertise on responding to climate change and Lord Stern continued to advise the Group Chairman on economic development and climate change. HSBC was one of the first financial institutions to adopt the Climate Principles, a voluntary framework for action on climate change that covers all areas of financial services.
HSBC also participates in the Prince of Wales’ Accounting for Sustainability project which seeks to develop systems to help public and private sector organisations account more accurately for the wider social and environmental costs of their activities.
Sustainability Risk
HSBC’s approach to managing sustainability risk is detailed on page 254.
Social and Community Investment
HSBC focuses its community investment activity on education and the environment because HSBC believes these are fundamental to building and developing communities and are prerequisites for economic growth. In 2008, HSBC made charitable donations totalling US$102 million (2007: US$101 million). Around half of the annual donation is channelled to education programmes and 25 per cent to environmental projects. The remainder is spent on country specific projects, disaster relief and matching staff contributions. No political donations were made during the year.
HSBC’s global education programme focuses on three major themes – financial literacy, disadvantaged children and environmental education. The global environmental programme is the HSBC Climate Partnership, a five year US$100 million commitment to working with The Climate Group, Earthwatch, Smithsonian Tropical Research Institute and WWF on tackling climate change.

313
HSBC reports on its sustainability strategy and progress annually in the HSBC Sustainability Report which is verified by an external auditor and prepared using the Global Reporting Initiative. PricewaterhouseCoopers has been appointed for the 2008 reporting period and will verify the Group sustainability strategy and governance structure, the content of the report, carbon neutrality status and adherence to the Equator Principles. The HSBC Sustainability Report 2008 will be issued on 22 May 2009 and will be available at www.hsbc.com/sustainability
Health and safety
The maintenance of appropriate health and safety standards throughout HSBC remains a key responsibility of all managers and HSBC is committed to proactively managing all health and safety risks associated with its business. HSBC’s objectives are to identify, remove, reduce or control material risks of fires and of accidents or injuries to employees and visitors.
Group standards, instructions and related policies and procedures are set by Group Corporate Real Estate and implemented by Health, Safety and Fire Co-ordinators (‘HSFCs’) based in each country in which HSBC operates. The HSFC may call upon regional and Group resource by way of support at any time.
Despite the considerable international pressure on terrorist networks over the past few years, the global threat from terrorism persists. HSBC remains committed to maintaining its preparedness and to ensuring the highest standards of health and safety wherever in the world it operates.
Group Security provides regular risk assessments in areas of increased risk to assist management in judging the level of terrorist threat. In addition, Regional Security functions conduct regular security reviews to ensure measures to protect HSBC staff, buildings, assets and information are appropriate for the level of threat.
Supplier payment policy
The Company does not currently subscribe to any code or standard on payment practice. It is the Company’s policy, however, to settle terms of payment with those suppliers when agreeing the terms of each transaction, to ensure that those suppliers are made aware of the terms of payment, and to abide by the terms of payment.
It is HSBC Holdings’ practice to organise payment to its suppliers through a central accounts
payable function operated by its subsidiary, HSBC Bank. Included in the balance with HSBC Bank is the amount due to trade creditors which, at 31 December 2008, represented 22 days’ average daily purchases of goods and services received from such creditors, calculated in accordance with the Companies Act 1985, as amended by Statutory Instrument 2007/3495.
Dividends, shareholders and meetings
Dividends for 2008
First, second and third interim dividends for 2008, each of US$0.18 per ordinary share, were paid on 9 July 2008, 8 October 2008 and 14 January 2009 respectively. Note 12 on the Financial Statements gives more information on the dividends declared in 2008. On 2 March 2009, the Directors declared a fourth interim dividend for 2008 of US$0.10 per ordinary share in lieu of a final dividend, which will be payable on 6 May 2009 in cash in US dollars, or in sterling or Hong Kong dollars at exchange rates to be determined on 27 April 2009, with a scrip dividend alternative. As the fourth interim dividend for 2008 was declared after the balance sheet date it has not been included as a creditor at 31 December 2008. The reserves available for distribution at 31 December 2008 are US$18,838 million.
A quarterly dividend of US$15.50 per 6.20 per cent non-cumulative US dollar preference share, Series A (‘Series A dollar preference share’), equivalent to a dividend of US$0.3875 per Series A American Depositary Share, each of which represents one-fortieth of a Series A dollar preference share, was paid on 17 March, 16 June, 15 September and 15 December 2008.
Dividends for 2009
The proposed timetable for interim dividends in respect of 2009 on the ordinary shares of US$0.50 is set out in the Shareholder Information section on page 448.
A quarterly dividend of US$15.50 per Series A dollar preference share (equivalent to a dividend of US$0.3875 per Series A American Depositary Share, each of which represents one-fortieth of a Series A dollar preference share) was declared on 11 February 2009 for payment on 16 March 2009.
Communication with shareholders
Communication with shareholders is given high priority. Extensive information about HSBC’s activities is provided in the Annual Report and

H S B C H O L D I N G S P L C
Report of the Directors: Governance (continued) Dividends, shareholders and meetings // Directors’ Remuneration Report
314
Accounts, Annual Review and the Interim Report which are sent to shareholders and are available on www.hsbc.com. There is regular dialogue with institutional investors and enquiries from individuals on matters relating to their shareholdings and the business of HSBC are welcomed and are dealt with in an informative and timely manner. All shareholders are encouraged to attend the Annual General Meeting or the informal meeting of shareholders held in Hong Kong to discuss the progress of HSBC.
Notifiable interests in share capital
As at 2 March 2009, the following disclosures of major holdings of voting rights have been made (and have not been amended or withdrawn) to the Company pursuant to the requirements of the Financial Services Authority Disclosure and Transparency Rule 5:
• Barclays PLC gave notice on 17 April 2007 that it had an indirect interest on 16 April 2007 in 518,233,657 HSBC Holdings ordinary shares, representing 4.47 per cent of the ordinary shares in issue at that date.
• Legal & General Group Plc gave notice on 18 April 2008 that it had a direct interest on 16 April 2008 in 593,425,216 HSBC Holdings ordinary shares, representing 5.00 per cent of the ordinary shares in issue at that date and gave notice on 21 April 2008 that on 18 April 2008 its holding of HSBC ordinary shares fell below 5.00 per cent of the ordinary shares in issue at that date.
As at 31 December 2008, according to the register maintained by HSBC Holdings pursuant to section 336 of the Securities and Futures Ordinance of Hong Kong, The Royal Bank of Scotland Group plc had given notice that on 2 December 2008 it had a long position of 606,742,842 HSBC Holdings ordinary shares, representing 5.01 per cent of the ordinary shares in issue, a short position of 532,705,395 HSBC Holdings ordinary shares, representing 4.40 per cent of the ordinary shares in issue and a lending pool of 11,562,000 HSBC Holdings ordinary shares, representing 0.10 per cent in ordinary shares in issue. Since 31 December 2008, The Royal Bank of Scotland Group plc has given notice that on 9 January 2009 it had a long position of 552,481,458 HSBC Holdings ordinary shares, representing 4.56 per cent of the ordinary shares in issue, a short position of 507,430,390 HSBC Holdings ordinary shares, representing 4.19 per cent of the ordinary shares in issue and a lending pool of 15,919,328, representing 0.13 per cent in ordinary
shares in issue.
In compliance with the Rules Governing the Listing of Securities on The Stock Exchange of Hong Kong Limited at least 25 per cent of the total issued share capital of HSBC Holdings has been held by the public at all times during 2008 and up to the date of this Report.
Dealings in HSBC Holdings shares
Except for dealings as intermediaries by HSBC Bank, HSBC Financial Products (France) and The Hongkong and Shanghai Banking Corporation, which are members of a European Economic Area exchange, neither HSBC Holdings nor any subsidiary has bought, sold or redeemed any securities of HSBC Holdings during the year ended 31 December 2008.
Annual General Meeting
The Annual General Meeting of HSBC Holdings will be held at the Barbican Hall, Barbican Centre, London EC2 on 22 May 2009 at 11.00am.
An informal meeting of shareholders will be held at Level 28, 1 Queen’s Road Central, Hong Kong on Tuesday 19 May 2009 at 4.30pm.
Resolutions to receive the Annual Report and Accounts, approve the Directors’ Remuneration Report, re-elect Directors and reappoint KPMG Audit Plc as Auditor will be submitted to the Annual General Meeting. KPMG Audit Plc has expressed its willingness to continue in office and the Group Audit Committee and the Board have recommended that KPMG Audit Plc be reappointed. Resolutions will also be submitted to the Annual General Meeting to renew the authorities for the allotment of shares, the disapplication of pre-emption rights and the purchase of ordinary shares. In addition, resolutions will be proposed to seek approval for changes to the Articles of Association and to continue to be able to call general meetings (other than Annual General Meetings) on 14 days’ notice.
A live webcast of the Annual General Meeting will be available on www.hsbc.com. From shortly after the conclusion of the Meeting until 30 June 2009 a recording of the proceedings will be available on www.hsbc.com.
On behalf of the Board S K Green, Group Chairman 2 March 2009

H S B C H O L D I N G S P L C
Directors’ Remuneration Report Remuneration Committee / Overall principles
315
PageRemuneration policy (unaudited) Remuneration Committee ............................. 315Overall principles .......................................... 315Application to executive Directors ................ 316HSBC performance and market context ........ 316Executive Director remuneration .................. 317
Salary ......................................................... 317Annual bonus ............................................. 317Long-term incentive plan ........................... 318Funding ...................................................... 321Total shareholder return ............................ 322Pensions ..................................................... 322Share ownership guidelines ....................... 322Service contracts ........................................ 322Other directorships .................................... 323
Non-executive Directors ............................... 323Fees ........................................................... 323
Remuneration review (audited) Directors’ emoluments .................................. 324Pensions ........................................................ 324Share plans .................................................... 326
Remuneration Committee
The Remuneration Committee meets regularly to consider human resource issues, particularly terms and conditions of employment, remuneration and retirement benefits. Within the authority delegated by the Board, the Committee is responsible for approving the remuneration policy of HSBC including the terms of bonus plans, share plans and other long-term incentive plans and for agreeing the individual remuneration packages of executive Directors and other senior Group employees taking into account the pay and conditions across the Group. No Directors are involved in deciding their own remuneration.
Following each meeting the Committee reports to the Board on its activities. The terms of reference of the Committee are available at www.hsbc.com/boardcommittees.
The members of the Remuneration Committee throughout 2008 were Sir Mark Moody-Stuart (Chairman), J D Coombe and G Morgan. At the conclusion of the Annual General Meeting on 30 May 2008 W S H Laidlaw became a member of the Committee.
There were seven meetings of the Remuneration Committee during 2008. The table on page 291 gives details of Directors’ attendance at these meetings.
The Committee appointed Deloitte LLP and Mercer Limited to provide independent advice on
executive remuneration issues during the year. Towers Perrin has been appointed by the Committee to provide remuneration data. As global firms, these firms also provided other consulting services to various parts of HSBC. Other consultants are used from time to time to advise on specific issues. During the year the Group Chief Executive provided regular briefings to the Committee. The Committee received advice from the Group Managing Director, Human Resources, A Almeida and the Head of Group Performance and Reward, J Beadle.
Overall principles
A global reward strategy for the Group was approved by the Remuneration Committee in 2007. This strategy provided a framework for the Remuneration Committee in carrying out its responsibilities during the year and includes the following key elements:
• An assessment of reward with reference to clear and relevant objectives set within a balanced scorecard framework. This framework facilitates a rounded approach to objective setting. Under this framework, objectives are set under four categories – Financial, Process (including risk mitigation), Customer and People. Whilst the achievement of financial objectives is very important, the other objectives relating to efficiency and risk mitigation, customer development and the productivity of the Group’s human capital are also key to financial performance and the development and sustainability of the Group over the short and medium term;
• A focus on total compensation (salary, bonus and the value of long term incentives) with variable pay (namely bonus and the value of long term incentives) differentiated by performance;
• The use of considered discretion to assess the extent to which performance has been achieved rather than applying a formulaic approach which, by its nature, may encourage inappropriate risk taking and cannot cover all scenarios;
• A significant proportion of variable pay being deferred into HSBC Holdings Restricted Shares to tie recipients to the future performance of the Group and to retain key talent; and
• A total remuneration package (salary, bonus, long-term incentive awards and other benefits) which is competitive in relation to comparable organisations in each of the markets in which HSBC operates.

H S B C H O L D I N G S P L C
Directors’ Remuneration Report (continued) Application / HSBC performance and market context / Executive Directors’ remuneration
316
The Committee also takes into account environmental, social and governance aspects when determining executive Directors’ remuneration and oversees senior management incentive structures to ensure that such structures take account of possible inadvertent consequences from these aspects.
Application to executive Directors
A number of specific changes to remuneration policy for executive Directors and other senior executives were made in 2007 and communicated to shareholders in the 2008 Directors’ Remuneration Report. These changes, which are described in this report, were made to ensure closer alignment with HSBC’s business strategy. They take into account competitive market practice and follow through the Group’s global reward strategy for this senior executive population.
In order to ensure that executive Directors’ remuneration packages are competitive, having regard to the market in which the Company competes for executive talent, the Remuneration Committee determined to consider market data from a defined remuneration comparator group. This initial group comprised nine global financial services companies, namely Banco Santander, Bank of America, Barclays, BNP Paribas, Citigroup, Deutsche Bank, Royal Bank of Scotland, Standard Chartered and UBS. These companies were selected on the basis of their broadly similar business coverage, size and international scope, and are subject to annual review for continuing relevance.
Executive Director salaries are targeted at the median of the remuneration comparator group, with an opportunity for top quartile total compensation through variable pay for higher levels of performance. The actual positioning of total compensation will depend on the performance of the Group and individual performance assessed against a combination of financial and non-financial objectives within an annual balanced scorecard.
The performance-related aspects of the remuneration package consist of a bonus of up to 400 per cent of salary and Performance Share awards with a face value of up to 700 per cent of salary. Taking into account the expected value of awards, the performance-related elements of pay make up around 80 per cent of the total remuneration package. Annual bonus payments and Performance Share awards are not pensionable.
A significant proportion of total compensation will be delivered in HSBC Holdings shares. Share ownership guidelines were increased for executive
Directors and other senior executives to achieve further alignment with shareholder interests.
The above approach applies to all executive Directors with the exception of the Group Chairman, S K Green, whose variable compensation since 2007 has, at his request, been delivered exclusively through awards of Performance Shares and is thus no longer eligible to receive annual bonus payments; and S T Gulliver, whose variable compensation arrangements take into account wholesale banking market practice.
The approach will be carefully and regularly reviewed during 2009 to take account of the volatile and challenging market conditions (see following section on HSBC Performance and Market Context) and, where appropriate, shareholders will be consulted on any proposed changes in policy. Any changes will also be described in future Directors’ Remuneration Reports.
The application of this policy to each component of executive Directors’ remuneration for 2008 is outlined in more detail below.
HSBC performance and market context
The last year was one of unprecedented volatility and turbulence in the global financial services sector which has continued into 2009. In determining remuneration levels for 2008 and considering approaches to remuneration for 2009, the Committee was mindful of this global market context. In this volatile market environment it is difficult to appropriately apply measures such as total shareholder return and earnings per share, and it is particularly important to take account of risk from a short and medium term perspective.
Within this market context, HSBC’s overall financial and non-financial performance was relatively strong in comparison to its peers.
The key achievements of the Group during 2008, with reference to its objectives set under the relevant balanced scorecard categories, are summarised below.
The financial objectives included a cost efficiency target ratio which, excluding the writing off of goodwill in the US, was met and improved on compared to 2007. Profit growth, as measured by earnings per share (‘EPS’), and return on capital, as measured by return on average total shareholder equity (‘ROE’), did not meet the targets set and were lower than the prior year, although the Group’s performance in these aspects relative to its peers remained strong.

317
Process objectives focused on efficiency and qualitative measures which, in themselves, impact financial performance and mitigate risk. Although the Group did not meet its target to reduce operational losses as a percentage of revenue, the overall management of risk mitigation was judged to be strong, taking into account sound relationships with global regulatory bodies and the global investment community.
The Group improved its customer development score compared to the prior year, as measured by customer recommendation and brand health in its Personal Financial Services businesses and met its overall 2008 target relating to brand health. Both were assisted by a significant increase in intra-group referrals.
Regarding the Group’s human capital, HSBC exceeded its 2008 employee engagement target as measured in a global staff survey. All regions and businesses improved their engagement scores compared to 2007 and the Group’s 2008 score also exceeded the sector and global norms despite the challenging market environment. Some 316,000 (93 per cent) of staff worldwide participated in the 2008 survey, a 5 per cent increase on the prior year. This high and improving level of participation evidences alignment of employees to the Group.
Management of risk
Since 2008 the Group’s Risk function has been involved in the approval of relevant incentive plans. Within the Group’s wholesale businesses, where appropriate, specific conditionality will be applied to the release of HSBC Restricted Shares issued by way of deferred bonuses. From 2009, the concept of imputing the cost of capital in the determination of bonus funding will be expanded progressively across the Group, starting with the Group’s wholesale businesses. Further information relating to the Group’s approach to risk management is set out on pages 191 to 192.
Executive Director remuneration
Salary
The Committee reviews salary levels for executive Directors each year.
Given the relative positioning of current salaries against the remuneration comparator group, no increases in salaries were made in 2008 other than to reflect promotions to the Board.
For 2009, there will be no increase to salaries for executive Directors. A similar approach has been
adopted for other executives across the Group other than in exceptional circumstances.
The table below shows salaries in 2008 and with effect from 1 March 2009.
Salary 2009 2008 £000 £000
D J Flint ........................ 700 700 M F Geoghegan ............ 1,070 1,070 S K Green ...................... 1,250 1,250 S T Gulliver1 .................. 800 800
HK$000 HK$000
V H C Cheng1 ................ 9,300 9,300 A A Flockhart1 .............. 8,000 8,000
1 V H C Cheng joined the Board on 1 February 2008 and A A Flockhart and S T Gulliver on 1 May 2008. The salaries shown above represent the full year equivalent salary for these individuals.
Annual bonus
In determining annual bonus awards, the Committee took into account the extent to which the Group’s annual objectives had been met under the balanced scorecard approach, the Group’s absolute and relative performance compared to its peers, and competitive market practice where discernable. The consequence of this is a material fall in bonus awards across the Group in 2008.
Within the policy parameters described above in the section Application to executive Directors, the Committee has determined that no cash bonuses will be paid to executive Directors for 2008. Instead, any bonuses will be in the form of HSBC Holdings Restricted Shares with vesting deferred for three years.
As noted above the Group Chairman, S K Green, is, at his request, no longer eligible to receive an annual bonus payment. In line with this, no bonus award is being made to him in respect of 2008. In view of general conditions in the financial markets, the Group Chief Executive, M F Geoghegan, the Group Finance Director, D J Flint, and the Chief Executive of Global Banking and Markets and HSBC Global Asset Management, S T Gulliver, have requested that they not be considered for a bonus in respect of 2008. The Remuneration Committee has therefore decided, in spite of the performance of HSBC and the wholesale businesses in relation to its comparators, not to award these individuals a deferred bonus.
Other executive Directors have been awarded bonuses in deferred form in line with performance under the balanced scorecard framework and the

H S B C H O L D I N G S P L C
Directors’ Remuneration Report (continued) Executive Directors’ remuneration > Long-term incentive plan
318
overall performance of the Group, as set out above, as well as their own part of the business.
For executive Directors with responsibility for Asia, performance against financial objectives was mixed. Whilst the target for return on equity was met, overall 2008 profitability did not meet its target. Performance against Process, Customer and People objectives was stronger and this included high customer recommendation and employee engagement scores.
For Global Banking and Markets, although the financial targets for 2008 were not met, the business remained profitable and relative performance against its peers was strong. Performance against Process, Customer and People objectives was strong and included high employee engagement scores and improved positions within global markets league tables.
The bonus awards, which are shown in the table below, have been fully deferred into HSBC Holdings Restricted Shares, issued under the HSBC Share Plan, with a vesting date three years from the date of the award. Bonus awards made in 2008, in respect of performance in 2007 are shown for reference.
Cash bonus 2009 2008 £000 £000
D J Flint1 ....................... – 800 M F Geoghegan1 ........... – 2,140 S K Green2 .................... – 1,750 S T Gulliver1 ................. – 5,592
HK$000 HK$000
V H C Cheng ................ – 23,864
US$000 US$000
A A Flockhart ............... – 2,598
Restricted Share Awards 2009 2008 £000 £000
D J Flint1 ....................... – – M F Geoghegan1 ........... – – S K Green2 .................... – – S T Gulliver1 .................. – 3,600
HK$000 HK$000
V H C Cheng ................ 18,533 9,832 A A Flockhart3 .............. 18,705 –
US$000 US$000
A A Flockhart3 .............. – 1,184
1 M F Geoghegan, D J Flint and S T Gulliver requested that they not be considered for a bonus in respect of 2008.
2 At the Chairman’s request, he is no longer eligible to receive an annual bonus payment.
3 The change in currency for A A Flockhart reflects a change of expatriate terms. The 2008 figure is on a gross equivalent basis.
Long-term incentive plan
Under the HSBC Share Plan, executive Directors, as with other participants in the Plan, are eligible to receive awards of Performance Shares with a face value at grant of up to a maximum of seven times salary. The performance conditions associated with these awards are detailed in the next section, ‘Arrangements from 2008’.
No awards of Performance Shares have been made to date in 2009. Awards may be granted later in 2009, taking into account performance and the market context at the time.
The face and expected values of individual awards made in 2008, in respect of the prior 2007 performance year, are shown for reference.
2008 Face value Expected value1
£000 £000
D J Flint ........................ 3,182 1,305 M F Geoghegan ............ 7,477 3,066 S K Green ...................... 8,750 3,587 S T Gulliver ................... 473 194
HK$000 HK$000
V H C Cheng ................. 17,231 7,065
US$000 US$000
A A Flockhart ................ 2,172 890
1 41 per cent of the face value for the 2008 award.
Arrangements from 2008
The performance measures for the long-term incentive awards of Performance Shares under the HSBC Share Plan were amended last year following approval by shareholders at the 2008 Annual General Meeting.
From 2008, the vesting of awards is based on three independent performance measures and an overriding ‘sustained improvement’ judgement by the Committee. The three Group measures are relative total shareholder return (40 per cent of the award); economic profit (40 per cent of the award); and growth in earnings per share (‘EPS’) (20 per cent of the award).
These measures provide a basis on which to measure HSBC’s absolute and relative performance over the long-term taking into account an external measure of value creation, a measure of the extent to which the return on capital invested in HSBC is in excess of a benchmark return and a direct measure of the profits generated for shareholders.

319
Awards will not vest unless the Remuneration Committee is satisfied that HSBC Holdings’ financial performance has shown a sustained improvement in the period since the award date. In determining whether HSBC Holdings has achieved such sustained improvement the Remuneration Committee will take account of all relevant factors, in particular, comparisons against the TSR comparator group in areas such as revenue growth and mix, cost efficiency, credit performance, cash return on cash invested, dividend performance and TSR.
The performance conditions are measured over a three year performance period and awards forfeited to the extent that they have not been met.
The performance measures and the targets described below apply for awards made in 2008. The Remuneration Committee will review annually whether the performance targets remain appropriate and challenging, or should be recalibrated, for awards made thereafter, taking into account factors such as economic expectations, the industry’s outlook and shareholders’ interests. The Committee will consult in accordance with institutional shareholder guidelines on any further changes proposed to the nature of the performance measures and their percentage split referred to above.
TSR award
TSR is measured against a comparator group comprising the largest global banks in the world as well as other banks against which HSBC competes for business on a regional and/or local level. These companies are:
Banco Bradesco HBOS Banco Itau ICBC Banco Santander JP Morgan Chase Bank of America Lloyds Banking Group Bank of China National Australia Bank Barclays Royal Bank of Canada BBVA Royal Bank of Scotland BNP Paribas Société Générale Citigroup Standard Chartered Credit Suisse Group UBS DBS Group UniCredito Italiano Deutsche Bank Wells Fargo Fortis Wachovia
During 2008, HBOS and Wachovia merged with other banks in the comparator group. The Committee determined that the comparator group will remain large enough to be statistically valid and as such it was not necessary to introduce any replacement banks.
To reflect the fact that the range of market capitalisations within the comparator group is very
wide, a free float market capitalisation (‘FFMC’) weighted method is used to calculate TSR performance. Under this approach, HSBC’s out-performance of the comparator group will be calculated by dividing the total FFMC of all of the companies that HSBC has outperformed in terms of TSR by the total FFMC of all of the companies in the comparator group.
The extent to which the TSR award will vest will be determined as follows:
If HSBC’s TSR outperforms companies comprising
Proportion of TSR Award vesting1
75 per cent of the total FFMC 100% 50 per cent of the total FFMC 20% < 50 per cent of the total FFMC nil
1 Vesting will occur in a straight line between 20 per cent and 100 per cent where HSBC’s performance falls between these incremental steps.
In line with the commitment made to shareholders in 2008, the Remuneration Committee reviewed the methodology and concluded that it continues to be appropriate. The Committee then wrote to HSBC Holdings’ sixty largest shareholders advising them of this conclusion and offering them the opportunity to comment.
Economic profit award
Economic Profit (‘EP’) is calculated as the average annual difference between return on invested capital and the Group’s benchmark cost of capital and is expressed as a percentage. EP is a key measure of shareholder value creation as it rewards management progressively to the extent that the return on the capital invested in HSBC by its shareholders is in excess of a threshold return, which itself exceeds the Group’s benchmark cost of capital.
For the awards made in 2008 the benchmark cost of capital is 10 per cent. Return on invested capital is based on the profit attributable to shareholders as defined in the Annual Report and Accounts.
The extent to which the EP award will vest will be determined as follows:
Average annual EP over three years
Proportion of EP Award vesting1
8 per cent or above 100% < 3 per cent nil
1 Vesting will occur in a straight line between 0 per cent and 100 per cent where HSBC’s performance falls between these incremental steps.

H S B C H O L D I N G S P L C
Directors’ Remuneration Report (continued) Executive Directors’ remuneration > Long-term incentive plan
320
Earnings per share award
Growth in Earnings per Share (EPS) is measured on a point to point basis, by comparing EPS in the third financial year of the performance period with EPS in the financial year preceding that in which the award is made. This approach is aimed at simplifying the use of EPS as a performance measure and takes into account feedback received during consultation with institutional shareholders.
EPS growth in Year 3 over the base EPS
Proportion of EPS award vesting1
28 per cent or above 100% 16 per cent 20% < 16 per cent nil
1 Vesting will occur in a straight line between 20% and 100% where HSBC’s performance falls between these incremental steps.
If events occur which cause the Remuneration Committee to consider that a performance condition has become unfair or impractical in either direction, the right is reserved to the Remuneration Committee, if it considers it appropriate to do so, to amend, relax or waive the condition.
Awards will vest in full, immediately in cases of death. In the event of redundancy, retirement on grounds of injury or ill health and where a participant ceases to be employed by HSBC due to a company ceasing to be part of HSBC, awards will normally vest at the end of the vesting period on a time-apportioned basis to the extent that the performance conditions have been satisfied. In the event of a change of control, awards will normally vest immediately and on a time-apportioned basis to the extent that the performance conditions have been satisfied. Awards will normally be forfeited if the participant is dismissed for cause or resigns from HSBC. In all circumstances the Committee retains discretion to ensure fair and reasonable treatment.
Arrangements from 2005 to 2007
Vesting of the awards of Performance Shares made under the HSBC Share Plan from 2005 to 2007 is based on two independent measures, relative TSR and growth in EPS. The performance conditions are measured over a three-year performance period and awards forfeited to the extent that they have not been met. The vesting of 50 per cent of the awards is based on TSR and the remaining 50 per cent on growth in EPS.
TSR award
The comparator group of 28 banks for the TSR award comprises the largest banks in the world,
on the basis of their market capitalisation, their geographic spread and the nature of their activities:
ABN AMRO1 Mitsubishi UFJ Financial Group2 Banco Santander Mizuho Financial Group Bank of America Morgan Stanley Bank of New York National Australia Bank Barclays Royal Bank of Canada BBVA Royal Bank of Scotland BNP Paribas Société Générale Citigroup Standard Chartered Crédit Agricole UBS Credit Suisse Group UniCredito Italiano Deutsche Bank US Bancorp HBOS1 Wachovia1 JP Morgan Chase Wells Fargo Lloyds Banking Group Westpac Banking Corporation
1 ABN AMRO, HBOS and Wachovia have delisted since the start of the performance period for the 2006 and 2007 awards. These comparators have been replaced from the point of delisting by Fortis, Commonwealth Bank of Australia and Toronto Dominion Bank respectively.
2 Mitsubishi UFJ Financial Group, Inc was previously known as Mitsubishi Tokyo Financial Group prior to the acquisition of UFJ Holdings on 1 October 2005.
The extent to which the TSR award will vest will be determined on a sliding scale based on HSBC’s relative TSR ranking, measured over the three years, against the comparator group as shown below:
If HSBC’s performance matches
Proportion of TSR Award vesting1
Banks ranking 1st to 7th 100% Bank ranking 8th 90% Bank ranking 9th 80% Bank ranking 10th 70% Bank ranking 11th 60% Bank ranking 12th 50% Bank ranking 13th 40% Bank ranking 14th 30% Banks ranking below 14th nil
1 Vesting will occur in a straight line where HSBC’s performance falls between these incremental steps.
Earnings per share award
The method for calculating EPS growth is described below. This is in line with the approach described in the 2005, 2006 and 2007 Directors’ Remuneration Reports, as well as in the circular containing the Notice of Annual General Meeting for 2005.
The percentage of the conditional award vesting will depend upon the absolute growth in EPS achieved over the three years (‘the performance period’). 30 per cent of the conditional shares will vest if the incremental EPS over the performance period is 24 per cent or more of EPS in the base year. The percentage of shares vesting will rise on a straight line proportionate basis to 100 per cent if HSBC’s incremental EPS over the performance period is 52 per cent or more of EPS in the base year.

321
In the interests of clarity, this has been set out in graphical form in the chart below.
0%
10%
20%
30%
40%
50%
60%
70%
80%
90%
100%
0% 10% 20% 30% 40% 50% 60%
Prop
ortio
n of
EPS
Aw
ard
Vest
ing
Total Incremental EPS Delivered
24% 52%
For the EPS element of the award, the base measure shall be EPS for the financial year preceding that in which the award is made (‘the base year’). Absolute growth in EPS will then be compared with the base year over three consecutive financial years commencing with the year in which the award is made. Incremental EPS will be calculated by expressing as a percentage of the EPS of the base year the difference each year of the three-year performance period between the EPS of that year and the EPS of the base year. These percentages will then be aggregated to arrive at the total incremental EPS for the performance period. As illustrated in the table below, an incremental EPS of 51 per cent over three years would equate to a compound annual growth rate of 8 per cent.
Illustration of incremental EPS of 51 per cent over three years.
Percentage difference between:
Year 1 EPS and Base Year
EPS +
Year 2 EPS and Base Year
EPS +
Year 3 EPS and Base year
EPS =
Total incremental EPS for the performance
period
8% 17% 26% 51%
If EPS in any of the Years 1, 2 or 3 is below the base year, then the percentage difference between that particular year and the base year is negative.
For this purpose, EPS means the profit attributable to the Shareholders (expressed in US dollars), excluding goodwill amortisation, divided by the weighted average number of Ordinary Shares in issue and held outside the Group during the year in question. In the event that the published EPS for the base year is restated during the performance period to adjust for changes in accounting standards, that restated EPS will be used for the purposes of the EPS performance condition.
In addition, awards will not vest unless the Remuneration Committee is satisfied that HSBC Holdings’ financial performance has shown a sustained improvement in the period since the award
date. In determining whether HSBC Holdings has achieved a sustained improvement in performance the Remuneration Committee will take account of all relevant factors but in particular comparisons against the comparator group in areas such as revenue growth and mix, cost efficiency, credit performance, cash return on cash invested, dividend performance and TSR.
If events occur which cause the Remuneration Committee to consider that a performance condition has become unfair or impractical in either direction, the right is reserved to the Remuneration Committee, if it considers it appropriate to do so, to amend, relax or waive the condition.
Awards will vest in full immediately in cases of death. In the event of redundancy, retirement on grounds of injury or ill health, early retirement by agreement, normal retirement and where a participant ceases to be employed by HSBC due to a company ceasing to be part of HSBC, awards will normally vest at the end of the vesting period on a time-apportioned basis to the extent that the performance conditions have been satisfied. In the event of a change of control, awards will normally vest immediately and on a time-apportioned basis to the extent that the performance conditions have been satisfied. Awards will normally be forfeited if the participant is dismissed for cause or resigns from HSBC. In all circumstances the Committee retains discretion to ensure fair and reasonable treatment.
Arrangements from 2002 to 2004
Between 2002 and 2004, awards of Performance Shares were made under the HSBC Holdings Restricted Share Plan 2000. Vesting was based on HSBC’s relative TSR performance over a three-year period from the date of the award, with full vesting of awards and transfer of shares to participants being no earlier than the fifth anniversary of the date of award.
Only one set of awards (the 2003 award) was outstanding at the start of 2008. At the second and final re-test of this award the performance targets were not met and therefore the award lapsed.
Funding
The dilution limits set out in the HSBC share plans comply with the Association of British Insurers’ guidelines. The Company’s policy to date is to fund long-term incentive awards of Performance Shares and Restricted Shares under the HSBC Share Plan through employee benefit trusts which undertake market purchases of HSBC Holdings’ shares.

H S B C H O L D I N G S P L C
Directors’ Remuneration Report (continued) Executive Directors’ remuneration > Long-term incentive plan > TSR // Non-executive Directors
322
Total shareholder return
Pursuant to the Directors’ Remuneration Report Regulations 2002, the graph below shows HSBC’s TSR performance against the FTSE 100 Index, for the five-year period ended 31 December 2008. The FTSE 100 Index has been chosen as this is a recognised broad equity market index of which HSBC Holdings is a member.
HSBC TSR and FTSE 100 Index
90%
100%
110%
120%
130%
140%
150%
160%
170%
180%
Dec 2003 Dec 2004 Dec 2005 Dec 2006 Dec 2007 Dec 2008
HSBC TSR FTSE 100
Source: Datastream
Pensions
The normal retirement age for executive Directors is 65 with the exception of V H C Cheng, where no retirement age is specified in keeping with local legislation. The pension entitlements of the executive Directors for 2008 are set out on page 324.
Share ownership guidelines
To ensure appropriate alignment with shareholders HSBC operates a formal share ownership policy, expressed as a number of shares, for executive Directors and the Group Managing Directors. The Committee considers that material share ownership by executives creates a community of interest between the leadership and shareholders.
To demonstrate further alignment with shareholders the share ownership guidelines were significantly increased from 2008.
Under the guidelines, the shareholding is expected to be achieved within five years of the executive’s appointment or three years from the date of approval of amendments to the HSBC Share Plan on 30 May 2008, whichever is the later.
The executive Directors and Group Managing Directors are now required to build and retain the following shareholdings.
Number of shares1
to be held
held at 31 December 2008
V H C Cheng .................................... 200,000 386,948 D J Flint ............................................ 200,000 109,122 A A Flockhart ................................... 200,000 238,639 M F Geoghegan ................................ 600,000 477,434 S K Green .......................................... 600,000 667,421 S T Gulliver ...................................... 200,000 3,230,453 Group Managing Directors ............... 125,000 –2
1 For the purposes of the guidelines, unvested awards of Restricted Shares held in employee benefit trusts are included. Unvested Performance Share awards are excluded.
2 A majority of the Group Managing Directors exceed the expected holdings; where the holdings are below, the executives are within five years of their appointment and working towards the expected level.
The Remuneration Committee will monitor compliance annually. The Committee will have full discretion in determining any penalties in cases of non-compliance, which could include a reduction of future awards of long-term incentives and/or an increase in the proportion of the annual bonus that is deferred into shares.
Service contracts
HSBC’s policy is to employ executive Directors on one-year rolling contracts although longer initial terms may be approved by the Remuneration Committee if considered appropriate. The Remuneration Committee will, consistent with the best interests of the Group, seek to minimise termination payments.
S K Green, M F Geoghegan, V H C Cheng, D J Flint, A A Flockhart and S T Gulliver have rolling service contracts with a notice period of 12 months for either party.
In the event of early termination of employment other than for cause, of S K Green, M F Geoghegan, V H C Cheng, D J Flint, A A Flockhart or S T Gulliver, HSBC is entitled to make a payment in lieu of notice equal to base salary, pension entitlements and other benefits.
D J Flint, AA Flockhart and S T Gulliver will be eligible to be considered for a bonus on termination of employment by HSBC other than for cause. S T Gulliver will also be eligible to be considered for a bonus upon termination of employment by either party within 12 months following a change of control.
On termination of employment by HSBC, other than for cause (or termination by either party within 12 months following a change of control), S K Green and M F Geoghegan will be eligible for a bonus calculated as not less than the average of the

323
previous two years of bonus payments received, pro-rated for any part year worked to termination.
Dates of service contracts – executive Directors Contract date
V H C Cheng ..................................... 29 August 2008 D J Flint ............................................. 14 October 2008 A A Flockhart .................................... 2 December 2008 M F Geoghegan ................................. 29 February 2008 S K Green .......................................... 28 February 2008 S T Gulliver ....................................... 5 September 2008
Other directorships
Executive Directors, if so authorised by either the Nomination Committee or the Board, may accept appointments as non-executive directors of suitable companies which are not part of HSBC. Approval will not be given for executive Directors to accept a non-executive directorship of more than one FTSE 100 company nor the chairmanship of such a company. When considering a non-executive appointment, the Nomination Committee or Board will take into account the expected time commitment of such appointment. The time commitment for executive Directors’ external appointments will be reviewed as part of the annual Board review. Any remuneration receivable in respect of an external appointment is normally paid to HSBC, unless otherwise approved by the Remuneration Committee. D J Flint has elected to donate his fees as a non-executive Director of BP p.l.c. to charity.
Non-executive Directors
Non-executive Directors are appointed for fixed terms not exceeding three years, subject to their re-election by shareholders at Annual General Meetings. Non-executive directors have no service contract and are not eligible to participate in HSBC’s share plans. Current non-executive Directors’ terms of appointment will expire as follows:
• in 2010, R A Fairhead, W K L Fung, Sir Mark Moody-Stuart and G Morgan;
• in 2011, S A Catz, J D Coombe, J L Dúran, J W J Hughes-Hallett, W S H Laidlaw and N R N Murthy; and
• in 2012, S M Robertson and Sir Brian Williamson.
J R Lomax and J L Thornton were appointed non-executive Directors with effect from 1 December 2008 and M K T Cheung was appointed a non-executive Director with effect from 1 February 2009. Subject to their re-election by shareholders at the Annual General Meeting in 2009, their terms of appointment will expire in 2012.
Fees
Non-executive Directors’ fees are regularly reviewed and compared with other large international companies. The current fee, which was approved by shareholders in 2006, is £65,000 per annum.
A fee of £30,000 per annum is payable to the senior independent non-executive Director. In addition, non-executive Directors receive the following fees for service on Board Committees:
Fees – non-executive Directors
Chairman, Audit Committee ................................. £50,000 p.a.Member, Audit Committee .................................... £20,000 p.a.
During 2008, 8 meetings of the Group Audit Committee were held.
Chairman, Remuneration Committee .................... £40,000 p.a.Member, Remuneration Committee ...................... £20,000 p.a.
During 2008, 7 meetings of the Remuneration Committee were held.
Chairman, Nomination Committee ....................... £30,000 p.a.Member, Nomination Committee .......................... £20,000 p.a.
During 2008, 5 meetings of the Nomination Committee were held.
Chairman, Corporate Sustainability Committee ... £30,000 p.a.Member, Corporate Sustainability Committee ...... £20,000 p.a.
During 2008, 4 meetings of the Corporate Sustainability Committee were held.

H S B C H O L D I N G S P L C
Directors’ Remuneration Report (continued) Directors emoluments / Pensions
324
Directors’ emoluments (Audited)
The emoluments of the Directors of HSBC Holdings for 2008 were as follows:
Fees Salary Allowance1 Benefits in kind2 Bonuses3
Total 2008
Total 2007
£000 £000 £000 £000 £000 £000 £000 Executive Directors V H C Cheng4 .................. – 534 67 545 – 1,146 – D J Flint ........................... – 700 385 22 – 1,107 1,878 A A Flockhart5 ................. – 229 – 355 – 584 – M F Geoghegan ............... – 1,070 535 62 – 1,667 3,536 S K Green ........................ – 1,250 – 15 – 1,265 3,012 S T Gulliver5 .................... – 533 – 14 – 547 –
Non-executive Directors Lord Butler6 ..................... 40 – – – – 40 103 S A Catz5 .......................... 43 – – – – 43 – J D Coombe ..................... 105 – – – – 105 105 Baroness Dunn6 ............... 35 – – – – 35 85 J L Dúran7 ........................ 65 – – – – 65 – R A Fairhead .................... 127 – – – – 127 103 W K L Fung8..................... 122 – – – – 122 122 J W J Hughes-Hallett ....... 105 – – – – 105 97 W S H Laidlaw7 ............... 77 – – – – 77 – J R Lomax9 ...................... 5 – – – – 5 – Sir Brian Moffat6 ............. 35 – – – – 35 110 Sir Mark Moody-Stuart ... 125 – – – – 125 125 G Morgan.......................... 85 – – – – 85 77 N R N Murthy5 ................. 45 – – – – 45 – S W Newton10 .................. 66 – – – – 66 77 S M Robertson ................. 115 – – – – 115 94 J L Thornton9,11 ................ 89 – – – – 89 – Sir Brian Williamson ....... 95 – – – – 95 91
Total12 .............................. 1,379 4,316 987 1,013 – 7,695 9,738
Total (US$000)12 ............. 2,529 7,916 1,810 1,858 – 14,113 19,493
1 Executive allowance paid to fund personal pension arrangements. 2 Benefits in kind for executive Directors include provision of company car, medical insurance, other insurance cover, accountancy
advice and travel assistance. V H C Cheng and A A Flockhart receive housing and other benefits in kind that are normal within the location in which they are employed.
3 These discretionary bonuses are in respect of 2008. See page 318 for comparison with 2007. 4 Appointed a Director on 1 February 2008. 5 Appointed a Director on 1 May 2008. 6 Retired as a Director on 30 May 2008. 7 Appointed a Director on 1 January 2008. 8 Includes fees as a non-executive Director of The Hongkong and Shanghai Banking Corporation. 9 Appointed a Director on 1 December 2008.
10 Retired as a Director on 10 October 2008. 11 Includes fees as non-executive Chairman of HSBC North America Holdings Inc. 12 Total emoluments for 2007 include the emoluments of Directors who retired in that year.
Pensions (Audited)
V H C Cheng ceased membership of, and accrual of benefits under, the HSBC Group Hong Kong Local Staff Retirement Benefit Scheme – Defined Benefit Section on 31 July 2008. The rules of the Scheme provide for a lump sum payment of benefit (rather than an annual pension) and Mr Cheng received a cash retirement benefit payment of HKD46,614,583 on 3 September 2008 in respect of reaching the age of 60, the normal retirement age under the Scheme. Mr Cheng’s accrued benefit and its transfer value
under the Scheme at 31 December 2007 was HKD32,906,250 and the increase of the accrued benefit and transfer value during 2008 (less personal contributions) was HKD13,708,333. As Mr Cheng has ceased membership of the Scheme, no accrued benefit or transfer value remained in the Scheme at 31 December 2008. The employer contribution to Mr Cheng’s retirement benefits Scheme for the period 1 January 2008 to 31 July 2008 was HKD626,250.
With effect from 1 August 2008 Mr Cheng has been a member of the Hong Kong Special Administrative Region Mandatory Provident Fund

325
(‘MPF’) and receives an executive allowance of 25 per cent of annual basic salary, less the mandatory contributions to the MPF by both the employer and employee, to fund personal pension arrangements. The mandatory employer contribution to the MPF in respect of Mr Cheng for the period 1 August 2008 to 31 December 2008 was HKD5,000.
D J Flint receives an executive allowance of 55 per cent of annual basic salary to fund personal pension arrangements.
A A Flockhart left the International Staff Retirement Benefits Scheme on 30 November 2008. With effect from 2 December 2008 employer contributions equivalent to 40 per cent of annual basic salary are now made to a personal pension plan in respect of Mr Flockhart. During 2008, employer contributions of HKD258,000 were paid into this plan.
Mr Geoghegan receives an executive allowance of 50 per cent of annual basic salary to fund personal pension arrangements. In 2008, an employer
contribution was made to the HSBC Asia Holdings Pension Plan of £225,000 from a bonus sacrifice in respect of 2007 (in 2007, an employer contribution of £215,000 was made arising entirely from a bonus sacrifice in respect of 2006). There were no other employer contributions made to this plan.
S K Green ceased membership of the HSBC Bank (UK) Pension Scheme on 5 April 2006. Since 6 April 2006, Mr Green has been entitled to receive benefits from an Employer Funded Retirement Benefits Scheme which together with entitlements from the HSBC Bank (UK) Pension Scheme will provide benefits to Mr Green that would be broadly comparable to an accrual rate of one-thirtieth of pensionable salary for each year of pensionable service.
S T Gulliver left the International Staff Retirement Benefits Scheme on 31 March 2006. Employer contributions equivalent to 30 per cent of annual basic salary are now made to a personal pension plan in respect of Mr Gulliver. During 2008, employer contributions of £225,000 were paid into this plan.
Accrued annual pension at 31 December 2008
Increase in accrued pension during 2008
Increase in accrued pension during 2008, excluding any increase for inflation
Transfer value of accrued pension at 31 December 20071
Transfer value of accrued pension at 31 December 20081
Increase of transfer value of accrued pension (less personal contributions) in 20081
Transfer value (less personal contributions) at 31 December 2008 relating to increase in accrued pensions during 2008, excluding any increase for inflation1
£000 £000 £000 £000 £000 £000 £000
A A Flockhart2 254 25 15 4,467 4,644 161 238 S K Green ........ 669 42 10 12,780 17,7163 4,9363 272 S T Gulliver4 .... 138 11 5 2,716 2,749 33 95
1 The transfer value represents a liability of HSBC’s pension funds and not a sum paid or due to the individual; it cannot therefore meaningfully be added to annual remuneration.
2 A A Flockhart left the International Staff Retirement Benefits Scheme (‘ISRBS’) on 30 November 2008. The ISRBS retains a liability for a contingent spouse’s pension equal to £126,000 per annum as at 31 December 2008. Mr Flockhart made personal contributions to the ISRBS amounting to £16,000 during the year.
3 During 2008, the Trustee of the HSBC Bank (UK) Pension Scheme decided to change the basis used to calculate transfer values from the Scheme for all Scheme members, in order to allow for lower expectations of future investment returns and improved longevity. The impact of this is reflected in the increase in the transfer value of accrued pension. If the Trustee had not changed the transfer value basis, the change in transfer value during 2008 would have been £2.48 million (£1.698 million during 2007).
4 S T Gulliver left the ISRBS on 31 March 2006. The ISRBS retains a liability for a contingent spouse’s pension equal to £61,000 per annum as at 31 December 2008.
The unfunded pension payments tabulated below, in respect of which provision has been made, were made during 2008 to five former Directors of HSBC Holdings.
The payments in respect of R Delbridge and Sir Brian Pearse were made by HSBC Bank plc as former Directors of that bank. The payment in respect of C F W de Croisset was made by HSBC France as a former Director of that bank.
2008 £
2007 £
B H Asher ................................... 97,752 93,812 C F W de Croisset ...................... 221,100 194,077 R Delbridge ................................ 140,601 134,934 Sir Brian Pearse .......................... 58,632 56,269 Sir William Purves ..................... 103,481 99,310
621,566 578,402

H S B C H O L D I N G S P L C
Directors’ Remuneration Report (continued) Share plans
326
Share plans (Audited)
At 31 December 2008, the undernamed Directors held Performance Share awards, Restricted Share
awards and options to acquire the number of HSBC Holdings ordinary shares set against their respective names.
HSBC Holdings savings-related share option plans (Audited) HSBC Holdings ordinary shares of US$0.50
Date of award
Exercise price (£)
Exercisable from1
Exercisable until
Options held at 1 January 2008 or date appointed if later
Options awarded during year
Options exercised during year
Options held at 31 December 2008
V H C Cheng2 ..... 23 Apr 2003 5.3496 1 Aug 2008 31 Jan 2009 3,0703 – 3,0703 – D J Flint .............. 25 Apr 2007 7.0872 1 Aug 2012 31 Jan 2013 2,310 – – 2,310 A A Flockhart4 .... 25 Apr 2007 7.0872 1 Aug 2010 31 Jan 2011 1,332 – – 1,332 S K Green ........... 23 Apr 2003 5.3496 1 Aug 2008 31 Jan 2009 3,070 – 3,0705 –
The HSBC Holdings savings-related share option plans are all-employee share plans under which eligible HSBC employees may be granted options to acquire HSBC Holdings ordinary shares. Employees may make contributions of up to £250 (or equivalent) each month over a period of one, three or five years which may be used on the first, third or fifth anniversary of the commencement of the relevant savings contract, at the employee’s election, to exercise the options. The plans help align the interests of employees with the creation of shareholder value and, as such, exercise of the options is not subject to any performance conditions. The options were awarded for nil consideration and are exercisable at a 20 per cent discount to the average market value of the ordinary shares on the five business days immediately preceding the invitation date. No options lapsed during the year. There are no performance criteria conditional upon which the outstanding options are exercisable and there have been no variations to the terms and conditions since the awards were made. The market value of the ordinary shares at 31 December 2008 was £6.62. The highest and lowest market values during the year were £9.2775 and £6.1225. Market value is the mid-market price derived from the London Stock Exchange Daily Official List on the relevant date. Under the Securities and Futures Ordinance of Hong Kong, the options are categorised as unlisted physically settled equity derivatives. 1 May be advanced to an earlier date in certain circumstances, e.g. retirement. 2 Appointed a Director on 1 February 2008. 3 At the date of exercise, 8 August 2008, the market value per share was £8.5850. 4 Appointed a Director on 1 May 2008. 5 At the date of exercise, 22 December 2008, the market value per share was £6.1225.
Awards of Performance Shares HSBC Holdings Restricted Share Plan 2000 (Audited) HSBC Holdings ordinary shares of US$0.50
Date of award
Year in which awards may vest
Awards held at 1 January 2008 or date appointed if later
Awards held at 31 December 20081
V H C Cheng2 ......................................................................................... 5 Mar 2003 2008 55,028 – D J Flint .................................................................................................. 5 Mar 2003 2008 136,192 – M F Geoghegan ...................................................................................... 5 Mar 2003 2008 63,558 – S K Green ............................................................................................... 5 Mar 2003 2008 136,192 –
Vesting of these awards was subject to the achievement of corporate performance conditions. Under the Securities and Futures Ordinance of Hong Kong, interests held through the HSBC Holdings Restricted Share Plan 2000 were categorised as the interests of a beneficiary of a trust.
1 The corporate performance conditions were not met and, under the rules of the Plan, the awards (including additional shares arising from scrip dividends) held by: V H C Cheng, 55,028 shares; D J Flint, 137,568 shares; M F Geoghegan, 64,200 shares; and S K Green, 137,568 shares, were forfeited on 4 April 2008. The awards held by A A Flockhart, 27,514 shares; and S T Gulliver, 55,028 shares, who were appointed as Directors on 1 May 2008, were also forfeited on 4 April 2008. As a consequence, the fourth interim dividend for 2007 did not accrue on these forfeited share awards.
2 Appointed a Director on 1 February 2008.

327
Awards of Performance Shares HSBC Share Plan (Audited) HSBC Holdings ordinary shares of US$0.50
Year in
Awards held at 1 January
Awards made during year or since date appointed if later1
Awards vested during year or since date appointed if later2 Awards
Date of award
which awards may vest
2008 or date appointed if later Number
Monetary value Number
Monetary value
held at 31 December 20083
£000 £000
V H C Cheng4 .................... 27 May 2005 2008 91,824 – – 47,002 405 –5
6 Mar 2006 2009 88,534 – – – – 92,689 5 Mar 2007 2010 172,636 – – – – 180,739 3 Jun 2008 2011 – 129,325 1,103 – – 130,852
D J Flint ............................. 27 May 2005 2008 194,796 – – 100,721 868 –5 6 Mar 2006 2009 175,296 – – – – 185,378 5 Mar 2007 2010 256,029 – – – – 270,755 3 Jun 2008 2011 – 372,940 3,182 – – 377,343
A A Flockhart6 ................... 27 May 2005 2008 779 – – 779 7 –5 6 Mar 2006 2009 66,401 – – – – 69,518 5 Mar 2007 2010 114,998 – – – – 120,395 3 Jun 2008 2011 – 127,174 1,085 – – 128,675
M F Geoghegan ................. 27 May 2005 2008 259,728 – – 134,295 1,157 –5 6 Mar 2006 2009 219,121 – – – – 231,724 5 Mar 2007 2010 581,884 – – – – 615,351 3 Jun 2008 2011 – 876,408 7,477 – – 886,755
S K Green .......................... 27 May 2005 2008 324,659 – – 167,868 1,446 –5 6 Mar 2006 2009 273,900 – – – – 289,653 5 Mar 2007 2010 436,413 – – – – 461,513 3 Jun 2008 2011 – 1,025,584 8,750 – – 1,037,692
S T Gulliver6 ...................... 27 May 2005 2008 1,559 – – 1,559 14 –5 6 Mar 2006 2009 110,667 – – – – 115,861 5 Mar 2007 2010 127,730 – – – – 133,725 3 Jun 2008 2011 – 55,409 473 – – 56,063
Vesting of these Performance Share awards is subject to the achievement of the corporate performance conditions set out on pages 318 to 319. Under the Securities and Futures Ordinance of Hong Kong, interests held through the HSBC Share Plan are categorised as the interests of a beneficiary of a trust.
1 At the date of the award, 3 June 2008, the market value per share was £8.56. The shares acquired by the Trustee of the Plan were purchased at an average price of £8.53173.
2 The Earnings Per Share element of the performance conditions was met and that element of the Performance Share Awards vested on 1 April 2008, when the market value per share was £8.61, as follows: V H C Cheng, 45,911 shares; D J Flint, 98,382 shares, M F Geoghegan, 131,176 shares; and S K Green, 163,970 shares. The awards held by A A Flockhart (32,794) shares, and S T Gulliver (65,587) shares, who were appointed as Directors on 1 May 2008, also vested on 1 April 2008. Awards representing the fourth interim dividend for 2007 vested on 7 May 2008, when the market value per share was £8.875, as follows: V H C Cheng, 1,091 shares; D J Flint, 2,339 shares; A A Flockhart, 779 shares; M F Geoghegan, 3,119 shares; S K Green, 3,898 shares; and S T Gulliver, 1,559 shares. The market value per share on the date of the award, 27 May 2005, was £8.68.
3 Includes additional shares arising from scrip dividends. 4 Appointed a Director on 1 February 2008. 5 The Total Shareholder Return element of the performance conditions was not met and, under the terms of the Plan, that element of the
Performance Share awards held by: V H C Cheng, 45,913 shares; D J Flint, 98,383 shares; M F Geoghegan, 131,177 shares; and S K Green, 163,971 shares was forfeited on 2 April 2008. The awards held by A A Flockhart, 32,795 shares; and S T Gulliver, 65,589 shares, who were appointed as Directors on 1 May 2008, were also forfeited on 2 April 2008. As a consequence, the fourth interim dividend for 2007 did not accrue on the forfeited shares.
6 Appointed a Director on 1 May 2008.

H S B C H O L D I N G S P L C
Directors’ Remuneration Report (continued) Share plans // Statement of Directors’ Responsibilities
328
Awards of Restricted Shares HSBC Share Plan (Audited) HSBC Holdings ordinary shares of US$0.50
Year in which
Awards held
Awards made during year or since date appointed if later
Awards vested during year or since date appointed if later
Awards held at 31
Date of award
awards may vest
on date appointed Number
Monetary value Number
Monetary value
December 20082
£000 £000
V H C Cheng3 ......................... 3 Mar 2008 2011 – 82,2951 646 – – 86,158
A A Flockhart4 ....................... 31 Oct 2007 2010 51,167 – – – – 53,568 3 Mar 2008 2011 11,929 – – – – 12,488
S T Gulliver4 .......................... 6 Mar 2006 20095 143,677 – – – – 150,421 5 Mar 2007 2009-20105 305,591 – – – – 319,934 3 Mar 2008 2009-20115 458,708 – – – – 480,237
Vesting of Restricted Share awards is normally subject to the Director remaining an employee on the vesting date. The vesting date may be advanced to an earlier date in certain circumstances, e.g. death or retirement. Under the Securities and Futures Ordinance of Hong Kong, interests held through the HSBC Share Plan are categorised as the interests of a beneficiary of a trust.
1 At the date of the award, 3 March 2008, the market value per share was £7.90. The shares acquired by the Trustee of the Plan were purchased at an average price of £7.848143.
2 Includes additional shares arising from scrip dividends. 3 Appointed a Director on 1 February 2008. 4 Appointed a Director on 1 May 2008. 5 33 per cent of the award vests on each of the first and second anniversaries of the date of the award, with the balance vesting on the
third anniversary of the date of the award.
On behalf of the Board 2 March 2009
Sir Mark Moody-Stuart, Chairman of Remuneration Committee

H S B C H O L D I N G S P L C
Statement of Directors’ Responsibilities in respect of the Annual Report and Accounts 2008 and the Financial Statements
329
The following statement, which should be read in conjunction with the Auditor’s statement of their responsibilities set out in their report on pages 330 and 331, is made with a view to distinguishing for shareholders the respective responsibilities of the Directors and of the Auditor in relation to the financial statements.
The Directors are responsible for preparing the Annual Report, the consolidated financial statements of HSBC Holdings and its subsidiaries (the ‘Group’) and holding company financial statements for HSBC Holdings (the ‘parent company’) in accordance with applicable law and regulations.
Company law requires the Directors to prepare Group and parent company financial statements for each financial year. The Directors are required to prepare the Group financial statements in accordance with IFRSs as adopted by the EU and have elected to prepare the parent company financial statements on the same basis. The Directors are also required to present additional information for US Shareholders. Accordingly these financial statements are framed to meet both UK and US requirements to give a consistent view to all shareholders.
The Group and parent company financial statements are required by law and IFRSs as adopted by the EU to present fairly the financial position of the Group and the parent company and the performance for that period; the Companies Act 1985 provides in relation to such financial statements that references in the relevant part of that Act to financial statements giving a true and fair view are references to their achieving a fair presentation. In addition, in order to meet certain US requirements, we are required to present our financial statements in accordance with IFRSs as adopted by the International Accounting Standards Board (‘IASB’). Currently, there are no differences in application to HSBC between IFRS endorsed by the EU and IFRS issued by the IASB.
In preparing each of the Group and parent company financial statements, the Directors are required to:
• select suitable accounting policies and then apply them consistently;
• make judgements and estimates that are reasonable and prudent; and
• state whether they have been prepared in accordance with IFRSs as adopted by the EU.
The Directors are required to prepare the financial statements on the going concern basis unless it is not appropriate. Since the Directors are satisfied that the Group and parent company have the resources to continue in business for the foreseeable future, the financial statements continue to be prepared on the going concern basis.
The Directors have responsibility for ensuring that sufficient accounting records are kept that disclose with reasonable accuracy at any time the financial position of the parent company and enable them to ensure that its financial statements comply with the Companies Act 1985.
The Directors have general responsibility for taking such steps as are reasonably open to them to safeguard the assets of the Group and to prevent and detect fraud and other irregularities. Under applicable law and regulations, the Directors also have responsibility for preparing a Directors’ Report, Directors’ Remuneration Report and the Corporate Governance statement on pages 281 to 314 that comply with that law and those regulations.
The Directors have responsibility for the maintenance and integrity of the Annual Report and Accounts as they appear on the company’s website. Legislation in the UK governing the preparation and dissemination of financial statements may differ from legislation in other jurisdictions.
The Directors, the names of whom are set out in the Report of Directors: Governance section on pages 281 of this Annual Report, confirms to the best of their knowledge:
• the consolidated financial statements, which have been prepared in accordance with IFRSs as issued by the IASB and in accordance with rule 4.1.12(3)(a) of the Disclosure and Transparency Rules, have been prepared in accordance with the applicable set of accounting standards and give a true and fair view of the assets, liabilities, financial position and profit or loss of the Group and the undertakings included in the consolidation taken as a whole; and
• the Management Report represented by the Directors’ Report has been prepared in accordance with rule 4.1.12(3)(b) of the Disclosure and Transparency Rules, and includes a fair review of the development and performance of the business and the position of the Group and the undertakings included in the consolidation taken as a whole, together with a description of the principal risks and uncertainties that the Group faces.
On behalf of the Board, S K Green Group Chairman 2 March 2009

H S B C H O L D I N G S P L C
Independent Auditor’s Report to the Members of HSBC Holdings plc
330
We have audited the Group and parent company financial statements (the ‘financial statements’) of HSBC Holdings plc for the year ended 31 December 2008 which comprise the Group Income Statement, the Group and parent company Balance Sheets, the Group and parent company Cash Flow Statements, the Group Statement of Recognised Income and Expense, the parent company Statement of Changes in Equity and the related notes. These financial statements have been prepared under the accounting policies set out therein. We have also audited the information in the Directors’ Remuneration Report that is described as having been audited.
This report is made solely to the company’s members, as a body, in accordance with section 235 of the Companies Act 1985 and, in respect of the separate opinion in relation to International Financial Reporting Standards (‘IFRSs’) as issued by the International Accounting Standards Board (‘IASB’), on terms that have been agreed. Our audit work has been undertaken so that we might state to the company’s members those matters we are required to state to them in an auditor’s report and, in respect of the separate opinion in relation to IFRSs as issued by the IASB, those matters that we have agreed to state to them in our report, and for no other purpose. To the fullest extent permitted by law, we do not accept or assume responsibility to anyone other than the company and the company’s members as a body, for our audit work, for this report, or for the opinions we have formed.
Respective responsibilities of directors and auditors
The directors’ responsibilities for preparing the Annual Report, the Directors Remuneration Report and the financial statements in accordance with applicable law and IFRSs as adopted by the EU are set out in the Statement of Directors’ Responsibilities on page 329.
Our responsibility is to audit the financial statements and the part of the Directors’ Remuneration Report to be audited in accordance with relevant legal and regulatory requirements and International Standards on Auditing (UK and Ireland).
We report to you our opinion as to whether the financial statements give a true and fair view and whether the financial statements and the part of the Directors’ Remuneration Report to be audited have been properly prepared in accordance with the Companies Act 1985 and, as regards the group financial statements, Article 4 of the IAS Regulation. We also report to you whether in our opinion the information given in the Directors’ Report is consistent with the financial statements.
In addition we report to you if, in our opinion, the company has not kept proper accounting records, if we have not received all the information and explanations we require for our audit, or if information specified by law regarding directors’ remuneration and other transactions is not disclosed.
We review whether the Corporate Governance Statement reflects the company’s compliance with the nine provisions of the 2006 Combined Code specified for our review by the Listing Rules of the Financial Services Authority, and we report if it does not. We are not required to consider whether the board’s statements on internal control cover all risks and controls, or form an opinion on the effectiveness of the group’s corporate governance procedures or its risk and control procedures.
We read the other information contained in the Annual Report and Accounts 2008 and consider whether it is consistent with the audited financial statements. We consider the implications for our report if we become aware of any apparent misstatements or material inconsistencies with the financial statements. Our responsibilities do not extend to any other information.
Basis of audit opinion
We conducted our audit in accordance with International Standards on Auditing (UK and Ireland) issued by the Auditing Practices Board. An audit includes examination, on a test basis, of evidence relevant to the amounts and disclosures in the financial statements and the part of the Directors’ Remuneration Report to be audited. It also includes an assessment of the significant estimates and judgements made by the directors in the preparation of the financial statements, and of whether the accounting policies are appropriate to the group’s and company’s circumstances, consistently applied and adequately disclosed.

331
We planned and performed our audit so as to obtain all the information and explanations which we considered necessary in order to provide us with sufficient evidence to give reasonable assurance that the financial statements and the part of the Directors’ Remuneration Report to be audited are free from material misstatement, whether caused by fraud or other irregularity or error. In forming our opinion we also evaluated the overall adequacy of the presentation of information in the financial statements and the part of the Directors’ Remuneration Report to be audited.
Opinion
In our opinion:
• the Group financial statements give a true and fair view, in accordance with IFRSs as adopted by the EU, of the state of the Group’s affairs as at 31 December 2008 and of its profit for the year then ended;
• the parent company financial statements give a true and fair view, in accordance with IFRSs as adopted by the EU as applied in accordance with the provisions of the Companies Act 1985, of the state of the parent company’s affairs as at 31 December 2008;
• the financial statements and the part of the Directors’ Remuneration Report to be audited have been properly prepared in accordance with the Companies Act 1985 and, as regards the group financial statements, Article 4 of the IAS Regulation; and
• the information given in the Directors’ Report is consistent with the financial statements.
Separate opinion in relation to IFRSs
As explained in Note 1a on the Group financial statements, the Group in addition to complying with its legal obligation to comply with IFRSs as adopted by the EU, has also complied with IFRSs as issued by the IASB. In our opinion, the Group financial statements give a true and fair view, in accordance with IFRSs, of the state of the Group’s affairs as at 31 December 2008 and of its profit for the year then ended.
KPMG Audit Plc 2 March 2009 Chartered Accountants Registered Auditor

H S B C H O L D I N G S P L C
Financial Statements
Contents / Consolidated income statement
332
Page
Financial Statements Consolidated income statement ..................... 333Consolidated balance sheet ........................... 334Consolidated statement of recognised
income and expense ................................... 335Consolidated cash flow statement ................. 336HSBC Holdings balance sheet ...................... 337HSBC Holdings statement of changes in
total equity ................................................. 338HSBC Holdings cash flow statement ............ 339
Notes on the Financial Statements 1 Basis of preparation ............................... 340 2 Summary of significant accounting
policies ............................................... 344 3 Net income from financial instruments
designated at fair value ....................... 360 4 Gains arising from dilution of interests
in associates ........................................ 360 5 Net earned insurance premiums ............. 361 6 Net insurance claims incurred and
movement in liabilities to policyholders ...................................... 362
7 Net operating income ............................. 363 8 Employee compensation and benefits .... 363 9 Auditors’ remuneration .......................... 37510 Share-based payments ........................... 37611 Tax expense ........................................... 38112 Dividends ............................................... 38413 Earnings per share .................................. 38414 Segmental analysis ................................. 385 By geographical region ...................... 385 By customer group ............................. 38515 Analysis of financial assets and
liabilities by measurement basis ......... 39216 Trading assets ........................................ 396
Page17 Financial assets designated at fair
value ................................................... 39718 Derivatives ............................................. 39819 Financial investments ............................ 40320 Transfers of financial assets not
qualifying for de-recognition ............. 40521 Interests in associates and joint
ventures .............................................. 40622 Goodwill and intangible assets .............. 40923 Property, plant and equipment ............... 41324 Investments in subsidiaries .................... 41625 Other assets ............................................ 41826 Trading liabilities ................................... 41927 Financial liabilities designated at fair
value ................................................... 41928 Debt securities in issue .......................... 42029 Other liabilities ...................................... 42130 Liabilities under insurance contracts ..... 42131 Provisions .............................................. 42432 Subordinated liabilities .......................... 42433 Maturity analysis of assets and
liabilities ............................................. 428
34 Foreign exchange exposures .................. 42935 Assets charged as security for
liabilities and collateral accepted as security for assets ............................... 430
36 Minority interests ................................... 43137 Called up share capital and other equity
instruments ......................................... 43138 Equity .................................................... 43639 Notes on the cash flow statement .......... 43940 Contingent liabilities, contractual
commitments and guarantees ............. 44041 Lease commitments ............................... 44242 Litigation ............................................... 44343 Related party transactions ...................... 44444 Events after the balance sheet date ........ 447

333
Consolidated income statement for the year ended 31 December 2008
2008 2007 2006 Notes US$m US$m US$m
Interest income .................................................................................... 91,301 92,359 75,879Interest expense ................................................................................... (48,738) (54,564) (41,393)
Net interest income .............................................................................. 42,563 37,795 34,486
Fee income ........................................................................................... 24,764 26,337 21,080Fee expense .......................................................................................... (4,740) (4,335) (3,898)
Net fee income ..................................................................................... 20,024 22,002 17,182
Trading income excluding net interest income ................................... 847 4,458 5,619Net interest income on trading activities ............................................. 5,713 5,376 2,603
Net trading income .............................................................................. 6,560 9,834 8,222
Changes in fair value of long-term debt issued and related derivatives ........................................................................... 6,679 2,812 (35)
Net income/(expense) from other financial instruments designated at fair value ..................................................................................... (2,827) 1,271 692
Net income from financial instruments designated at fair value ........ 3 3,852 4,083 657
Gains less losses from financial investments ...................................... 197 1,956 969 Gains arising from dilution of interests in associates ......................... 4 – 1,092 – Dividend income .................................................................................. 272 324 340 Net earned insurance premiums .......................................................... 5 10,850 9,076 5,668 Gains on disposal of French regional banks ....................................... 2,445 – – Other operating income ....................................................................... 1,808 1,439 2,546
Total operating income ..................................................................... 88,571 87,601 70,070
Net insurance claims incurred and movement in liabilities to policyholders .................................................................................. 6 (6,889) (8,608) (4,704)
Net operating income before loan impairment charges and other credit risk provisions .......................................................... 81,682 78,993 65,366
Loan impairment charges and other credit risk provisions ................. 7 (24,937) (17,242) (10,573)
Net operating income ........................................................................ 7 56,745 61,751 54,793
Employee compensation and benefits ................................................. 8 (20,792) (21,334) (18,500)General and administrative expenses .................................................. (15,260) (15,294) (12,823)Depreciation and impairment of property, plant and equipment ........ 23 (1,750) (1,714) (1,514)Goodwill impairment ........................................................................... 22 (10,564) – – Amortisation and impairment of intangible assets .............................. 22 (733) (700) (716)
Total operating expenses ................................................................... (49,099) (39,042) (33,553)
Operating profit ................................................................................. 7,646 22,709 21,240
Share of profit in associates and joint ventures ................................... 21 1,661 1,503 846
Profit before tax ................................................................................. 9,307 24,212 22,086
Tax expense ......................................................................................... 11 (2,809) (3,757) (5,215)
Profit for the year .............................................................................. 6,498 20,455 16,871 Profit attributable to shareholders of the parent company .................. 5,728 19,133 15,789 Profit attributable to minority interests ............................................... 770 1,322 1,082 US$ US$ US$
Basic earnings per ordinary share ....................................................... 13 0.47 1.65 1.40 Diluted earnings per ordinary share .................................................... 13 0.47 1.63 1.39 Dividends per ordinary share .............................................................. 12 0.93 0.87 0.76
The accompanying notes on pages 341 to 447, the audited sections of the ‘Report of the Directors: Risk’ on pages 188 to 280, ‘Critical accounting policies’ on pages 61 to 66 and ‘Impact of Market Turmoil’ on pages 144 to 187 form an integral part of these financial statements.

H S B C H O L D I N G S P L C
Financial Statements (continued)
Consolidated balance sheet / Statement of recognised income and expense
334
Consolidated balance sheet at 31 December 2008
2008 2007 Notes US$m US$m ASSETS
Cash and balances at central banks ........................................................................................ 52,396 21,765 Items in the course of collection from other banks ................................................................ 6,003 9,777 Hong Kong Government certificates of indebtedness ........................................................... 15,358 13,893 Trading assets ......................................................................................................................... 16 427,329 445,968 Financial assets designated at fair value ................................................................................ 17 28,533 41,564 Derivatives .............................................................................................................................. 18 494,876 187,854 Loans and advances to banks ................................................................................................. 153,766 237,366 Loans and advances to customers .......................................................................................... 932,868 981,548 Financial investments ............................................................................................................. 19 300,235 283,000 Interests in associates and joint ventures ............................................................................... 21 11,537 10,384 Goodwill and intangible assets ............................................................................................... 22 27,357 39,689 Property, plant and equipment ................................................................................................ 23 14,025 15,694 Other assets ............................................................................................................................. 25 37,822 39,493 Current tax assets .................................................................................................................... 2,552 896 Deferred tax assets .................................................................................................................. 11 7,011 5,284 Prepayments and accrued income .......................................................................................... 15,797 20,091
Total assets ............................................................................................................................. 2,527,465 2,354,266 LIABILITIES AND EQUITY
Liabilities Hong Kong currency notes in circulation .............................................................................. 15,358 13,893 Deposits by banks ................................................................................................................... 130,084 132,181 Customer accounts .................................................................................................................. 1,115,327 1,096,140 Items in the course of transmission to other banks ................................................................ 7,232 8,672 Trading liabilities .................................................................................................................... 26 247,652 314,580 Financial liabilities designated at fair value ........................................................................... 27 74,587 89,939 Derivatives .............................................................................................................................. 18 487,060 183,393 Debt securities in issue ........................................................................................................... 28 179,693 246,579 Retirement benefit liabilities .................................................................................................. 8 3,888 2,893 Other liabilities ....................................................................................................................... 29 72,384 35,013 Current tax liabilities .............................................................................................................. 1,822 2,559 Liabilities under insurance contracts ...................................................................................... 30 43,683 42,606 Accruals and deferred income ................................................................................................ 15,448 21,766 Provisions ............................................................................................................................... 31 1,730 1,958 Deferred tax liabilities ............................................................................................................ 11 1,855 1,859 Subordinated liabilities ........................................................................................................... 32 29,433 24,819
Total liabilities ........................................................................................................................ 2,427,236 2,218,850 Equity Called up share capital ............................................................................................................ 37 6,053 5,915 Share premium account .......................................................................................................... 38 8,463 8,134 Other equity instruments ........................................................................................................ 37 2,133 – Other reserves ......................................................................................................................... 38 (3,747) 33,014 Retained earnings ................................................................................................................... 38 80,689 81,097
Total shareholders’ equity ...................................................................................................... 93,591 128,160 Minority interests .................................................................................................................... 36 6,638 7,256
Total equity ............................................................................................................................. 100,229 135,416
Total equity and liabilities ...................................................................................................... 2,527,465 2,354,266
The accompanying notes on pages 341 to 447, the audited sections of the ‘Report of the Directors: Risk’ on pages 188 to 280, ‘Critical accounting policies’ on pages 61 to 66 and ‘Impact of Market Turmoil’ on pages 144 to 187 form an integral part of these financial statements.
S K Green, Group Chairman

335
Consolidated statement of recognised income and expense for the year ended 31 December 2008
2008 2007 2006 US$m US$m US$m
Available-for-sale investments: – fair value gains/(losses) taken to equity ................................................. (23,722) 756 1,582 – fair value gains transferred to the income statement on disposal ........... (1,316) (1,826) (665)– amounts transferred to the income statement in respect of
impairment losses..................................................................................... 1,779 86 21 Cash flow hedges:
– fair value gains/(losses) taken to equity ................................................. (1,720) 625 1,554 – fair value (gains)/losses transferred to income statement ...................... 1,754 (1,886) (2,198)
Share of changes in equity of associates and joint ventures ........................... (559) 372 20 Exchange differences ....................................................................................... (12,205) 5,946 4,675 Actuarial gains/(losses) on defined benefit plans ........................................... (1,609) 2,167 (78)
(37,598) 6,240 4,911
Tax on items taken directly to equity .............................................................. 1,879 (226) (44)
Total income and expense taken to equity during the year ............................. (35,719) 6,014 4,867
Profit for the year ............................................................................................. 6,498 20,455 16,871
Total recognised income and expense for the year ......................................... (29,221) 26,469 21,738
Total recognised income and expense for the year attributable to: – shareholders of the parent company ....................................................... (29,225) 24,801 20,527 – minority interests .................................................................................... 4 1,668 1,211
(29,221) 26,469 21,738
The accompanying notes on pages 341 to 447, the audited sections of the ‘Report of the Directors: Risk’ on pages 188 to 280, ‘Critical accounting policies’ on pages 61 to 66 and ‘Impact of Market Turmoil’ on pages 144 to 187 form an integral part of these financial statements.

H S B C H O L D I N G S P L C
Financial Statements (continued)
Consolidated cash flow statement / HSBC Holdings balance sheet
336
Consolidated cash flow statement for the year ended 31 December 2008
2008 2007 2006 Notes US$m US$m US$m
Cash flows from operating activities Profit before tax ...................................................................................... 9,307 24,212 22,086
Adjustments for: – non-cash items included in profit before tax .................................. 39 41,305 21,701 14,956 – change in operating assets ............................................................... 39 18,123 (176,538) (175,317)– change in operating liabilities ......................................................... 39 (63,413) 250,095 237,378 – elimination of exchange differences1 .............................................. 36,132 (18,602) (12,114)– net gain from investing activities .................................................... (4,195) (2,209) (2,014)– share of profits in associates and joint ventures ............................. (1,661) (1,503) (846)– dividends received from associates ................................................. 655 363 97 – contribution paid to defined benefit plans ...................................... (719) (1,393) (547)– tax paid ............................................................................................ (5,114) (5,088) (4,946)
Net cash generated from operating activities ......................................... 30,420 91,038 78,733
Cash flows from investing activities Purchase of financial investments .......................................................... (277,023) (260,980) (286,316)Proceeds from the sale and maturity of financial investments .............. 223,138 238,647 273,774 Purchase of property, plant and equipment ............................................ (2,985) (2,720) (2,400)Proceeds from the sale of property, plant and equipment ...................... 2,467 3,178 2,504 Proceeds from the sale of loan portfolios ............................................... 9,941 1,665 2,048 Net purchase of intangible assets ........................................................... (1,169) (950) (852)Net cash inflow/(outflow) from acquisition of an increase in stake
of subsidiaries ..................................................................................... 1,313 (623) (1,185)Net cash inflow from disposal of subsidiaries ....................................... 2,979 187 62 Net cash outflow from acquisition of an increase in stake
of associates ........................................................................................ (355) (351) (585)Net cash inflow from the consolidation of funds ................................... 16,500 1,600 – Proceeds from disposal of associates ..................................................... 101 69 874
Net cash (used in) investing activities .................................................... (25,093) (20,278) (12,076)
Cash flows from financing activities Issue of ordinary share capital ................................................................ 467 474 1,010 Issue of preference shares ....................................................................... – – 374 Issue of other equity instruments ........................................................... 2,133 – – Net purchases and sales of own shares for market-making and
investment purposes ........................................................................... (194) 126 46 Purchases of own shares to meet share awards and share
option awards ..................................................................................... (808) (636) (575)On exercise of share options .................................................................. 27 104 173 Subordinated loan capital issued ............................................................ 7,094 5,705 5,948 Subordinated loan capital repaid ............................................................ (350) (689) (903)Dividends paid to shareholders of the parent company ......................... (7,211) (6,003) (5,927)Dividends paid to minority interests ...................................................... (714) (718) (710)Dividends paid to holders of other equity instruments .......................... (92) – –
Net cash generated from/(used in) in financing activities ..................... 352 (1,637) (564)
Net increase in cash and cash equivalents .......................................... 5,679 69,123 66,093
Cash and cash equivalents at 1 January ................................................. 297,009 215,486 141,307 Exchange differences in respect of cash and cash equivalents .............. (23,816) 12,400 8,086
Cash and cash equivalents at 31 December ........................................... 39 278,872 297,009 215,486
1 Adjustment to bring changes between opening and closing balance sheet amounts to average rates. This is not done on a line-by-line basis, as details cannot be determined without unreasonable expense.
The accompanying notes on pages 341 to 447, the audited sections of the ‘Report of the Directors: Risk’ on pages 188 to 280, ‘Critical accounting policies’ on pages 61 to 66 and ‘Impact of Market Turmoil’ on pages 144 to 187 form an integral part of these financial statements.

337
HSBC Holdings balance sheet at 31 December 2008
2008 2007 Notes US$m US$m
ASSETS
Cash at bank and in hand: – balances with HSBC undertakings ................................................................................. 443 360
Derivatives .............................................................................................................................. 18 3,682 2,660 Loans and advances to HSBC undertakings .......................................................................... 11,804 17,242 Financial investments ............................................................................................................. 2,629 3,022 Investments in subsidiaries ..................................................................................................... 24 81,993 69,411 Property, plant and equipment ................................................................................................ 6 1 Other assets ............................................................................................................................. 25 21 Deferred tax assets .................................................................................................................. 11 42 7 Prepayments and accrued income .......................................................................................... 58 224
Total assets ............................................................................................................................. 100,682 92,948
LIABILITIES AND EQUITY
Liabilities Amounts owed to HSBC undertakings .................................................................................. 4,042 2,969 Financial liabilities designated at fair value ........................................................................... 27 16,389 18,683 Derivatives .............................................................................................................................. 18 1,324 44 Other liabilities ....................................................................................................................... 29 1,816 1,405 Current tax liabilities .............................................................................................................. 219 322 Accruals and deferred income ................................................................................................ 288 150 Subordinated liabilities ........................................................................................................... 32 14,017 8,544
Total liabilities ........................................................................................................................ 38,095 32,117 Equity Called up share capital ............................................................................................................ 37 6,053 5,915 Share premium account .......................................................................................................... 38 8,463 8,134 Other equity instruments ........................................................................................................ 37 2,133 – Merger reserve and other reserves ......................................................................................... 25,341 28,942 Other reserves ......................................................................................................................... 3,503 3,631 Retained earnings ................................................................................................................... 17,094 14,209
Total equity ............................................................................................................................. 62,587 60,831
Total equity and liabilities ...................................................................................................... 100,682 92,948
The accompanying notes on pages 341 to 447, the audited sections of the ‘Report of the Directors: Risk’ on pages 188 to 280, ‘Critical accounting policies’ on pages 61 to 66 and ‘Impact of Market Turmoil’ on pages 144 to 187 form an integral part of these financial statements.
S K Green, Group Chairman

H S B C H O L D I N G S P L C
Financial Statements (continued)
HSBC Holdings > Changes in equity / Cash flow statement
338
HSBC Holdings statement of changes in total equity for the year ended 31 December 2008
2008 2007 US$m US$m
Called up share capital At 1 January .................................................................................................................................. 5,915 5,786 Shares issued under employee share plans ................................................................................... 20 17 Shares issued in lieu of dividends ................................................................................................. 118 112
At 31 December ............................................................................................................................ 6,053 5,915
Share premium account At 1 January .................................................................................................................................. 8,134 7,789 Shares issued under employee share plans ................................................................................... 450 460 Shares issued in lieu of dividends and amounts arising thereon .................................................. (121) (115)
At 31 December ............................................................................................................................ 8,463 8,134
Other equity instruments At 1 January .................................................................................................................................. – – Capital securities issued1 ............................................................................................................... 2,133 –
At 31 December ............................................................................................................................ 2,133 –
Merger reserve and other reserves At 1 January .................................................................................................................................. 28,942 28,942 Realisation of merger reserve2 ...................................................................................................... (3,601) –
At 31 December ............................................................................................................................ 25,341 28,942
Other reserves Available-for-sale fair value reserve
At 1 January .................................................................................................................................. 482 246 Fair value changes taken to equity3 ............................................................................................... (356) 246 Tax on items taken directly to equity3 .......................................................................................... 64 (10)
At 31 December ............................................................................................................................ 190 482
Share-based payment reserve At 1 January .................................................................................................................................. 1,968 2,111 Exercise and lapse of share options and vesting of share awards ................................................ (75) (751)Cost of share-based payment arrangements .................................................................................. 14 29 Equity investments granted to employees of subsidiaries under employee share plans .............. 87 818 Other movements .......................................................................................................................... 1 (239)
At 31 December ............................................................................................................................ 1,995 1,968
Other paid-in capital At 1 January .................................................................................................................................. 1,181 936 Exercise and lapse of share options .............................................................................................. 137 245
At 31 December ............................................................................................................................ 1,318 1,181
Total other reserves at 31 December ................................................................................................. 3,503 3,631
Retained earnings At 1 January .................................................................................................................................. 14,209 10,588 Profit for the year attributable to shareholders ............................................................................. 7,644 9,499 Dividends to shareholders of the parent company ........................................................................ (11,301) (10,241)Shares issued in lieu of dividends and amounts arising thereon .................................................. 3,596 4,354 Transfer from merger reserve ........................................................................................................ 3,601 – Own shares adjustments ................................................................................................................ (647) 16 Tax on share based payments3 ...................................................................................................... (2) (7)Exchange differences and other movements3 ............................................................................... (6) –
At 31 December4 ........................................................................................................................... 17,094 14,209
1 See footnote 5 of Note 38. 2 See footnote 4 of Note 38. 3 The total expense taken directly to equity during the year was US$300 million (2007: net income US$229 million). 4 Retained earnings include 36,995,330 (US$562 million) of own shares held to fund employee share plans (2007: 30,706,713,
US$554 million).
The accompanying notes on pages 341 to 447, the audited sections of the ‘Report of the Directors: Risk’ on pages 188 to 280, ‘Critical accounting policies’ on pages 61 to 66 and ‘Impact of Market Turmoil’ on pages 144 to 187 form an integral part of these financial statements.
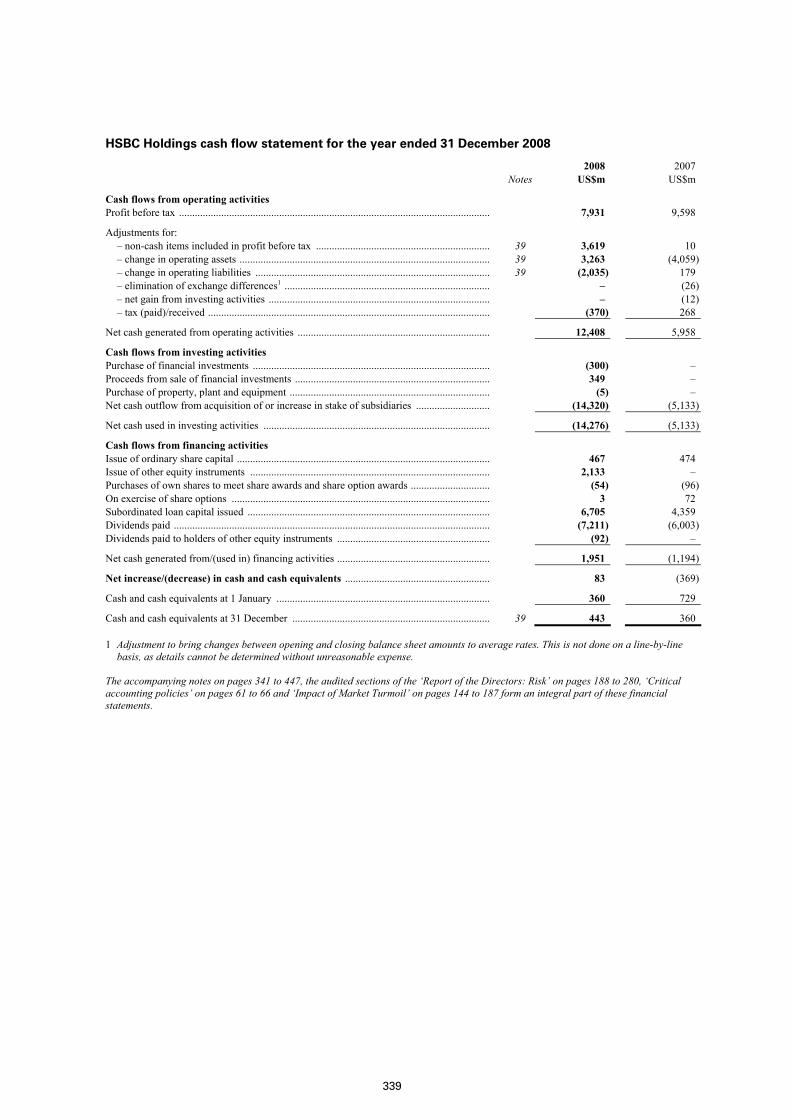
339
HSBC Holdings cash flow statement for the year ended 31 December 2008
2008 2007 Notes US$m US$m
Cash flows from operating activities Profit before tax ...................................................................................................................... 7,931 9,598
Adjustments for: – non-cash items included in profit before tax .................................................................. 39 3,619 10 – change in operating assets ............................................................................................... 39 3,263 (4,059)– change in operating liabilities ......................................................................................... 39 (2,035) 179 – elimination of exchange differences1 .............................................................................. – (26)– net gain from investing activities .................................................................................... – (12)– tax (paid)/received ........................................................................................................... (370) 268
Net cash generated from operating activities ......................................................................... 12,408 5,958
Cash flows from investing activities Purchase of financial investments .......................................................................................... (300) – Proceeds from sale of financial investments .......................................................................... 349 – Purchase of property, plant and equipment ............................................................................ (5) – Net cash outflow from acquisition of or increase in stake of subsidiaries ............................ (14,320) (5,133)
Net cash used in investing activities ...................................................................................... (14,276) (5,133)
Cash flows from financing activities Issue of ordinary share capital ................................................................................................ 467 474 Issue of other equity instruments ........................................................................................... 2,133 – Purchases of own shares to meet share awards and share option awards .............................. (54) (96)On exercise of share options .................................................................................................. 3 72 Subordinated loan capital issued ............................................................................................ 6,705 4,359 Dividends paid ........................................................................................................................ (7,211) (6,003)Dividends paid to holders of other equity instruments .......................................................... (92) –
Net cash generated from/(used in) financing activities .......................................................... 1,951 (1,194)
Net increase/(decrease) in cash and cash equivalents ....................................................... 83 (369)
Cash and cash equivalents at 1 January ................................................................................. 360 729
Cash and cash equivalents at 31 December ........................................................................... 39 443 360
1 Adjustment to bring changes between opening and closing balance sheet amounts to average rates. This is not done on a line-by-line basis, as details cannot be determined without unreasonable expense.
The accompanying notes on pages 341 to 447, the audited sections of the ‘Report of the Directors: Risk’ on pages 188 to 280, ‘Critical accounting policies’ on pages 61 to 66 and ‘Impact of Market Turmoil’ on pages 144 to 187 form an integral part of these financial statements.

H S B C H O L D I N G S P L C
Notes on the Financial Statements Note 1
340
1 Basis of preparation
(a) Compliance with International Financial Reporting Standards
The consolidated financial statements of HSBC and the separate financial statements of HSBC Holdings have been prepared in accordance with International Financial Reporting Standards (‘IFRSs’) as issued by the International Accounting Standards Board (‘IASB’) and as endorsed by the EU. EU-endorsed IFRSs may differ from IFRSs as issued by the IASB if, at any point in time, new or amended IFRSs have not been endorsed by the EU. At 31 December 2008, there were no unendorsed standards effective for the year ended 31 December 2008 affecting these consolidated and separate financial statements, and there was no difference between IFRSs endorsed by the EU and IFRSs issued by the IASB in terms of their application to HSBC. Accordingly, HSBC’s financial statements for the year ended 31 December 2008 are prepared in accordance with IFRSs as issued by the IASB.
IFRSs comprise accounting standards issued by the IASB and its predecessor body as well as interpretations issued by the International Financial Reporting Interpretations Committee (‘IFRIC’) and its predecessor body.
During 2008, HSBC adopted the following amendments to standards and interpretations:
• IFRIC 14 ‘IAS 19 – The Limit on a Defined Benefit Asset, Minimum Funding Requirements and their Interaction’ had no significant effect on the consolidated financial statements of HSBC or the separate financial statements of HSBC Holdings; and
• an amendment to IAS 39 ‘Financial Instruments: Recognition and Measurement’ (‘IAS 39’) and to IFRS 7 ‘Financial Instruments: Disclosures’ (‘IFRS 7’) – ‘Reclassification of Financial Assets’ (‘Reclassification Amendment’). On adoption of the Reclassification Amendment, HSBC reclassified US$18.7 billion of trading assets in accordance with the Reclassification Amendment. If this reclassification had not been made, the Group’s pre-tax profits would have been lower by US$3.5 billion. The adoption of the Reclassification Amendment had no effect on the separate financial statements of HSBC Holdings. Pages 144 to 187 of the ‘Report of the Directors: Impact of market turmoil’ provides detailed disclosures as required by the Reclassification Amendment.
(b) Differences between IFRSs and Hong Kong Financial Reporting Standards
There are no significant differences between IFRSs and Hong Kong Financial Reporting Standards in terms of their application to HSBC and consequently there would be no significant differences had the financial statements been prepared in accordance with Hong Kong Financial Reporting Standards. The Notes on the Financial Statements, taken together with the Report of the Directors, include the aggregate of all disclosures necessary to satisfy IFRSs and Hong Kong reporting requirements.
(c) Presentation of information
Disclosures under IFRS 4 and IFRS 7 relating to the nature and extent of risks have been included in the audited sections of the ‘Report of the Directors: Risk’ on pages 188 to 280.
Capital disclosures under IAS 1 ‘Presentation of Financial Statements’ (‘IAS 1’) have been included in the audited sections of ‘Capital management and allocation’ on pages 274 to 280.
Disclosures relating to the effect of the recent market turmoil on HSBC’s securitisation activities and structured products and disclosures under IFRS 7 relating to the fair value of financial instruments have been included in the audited section of ‘Report of the Directors: Impact of market turmoil’ on pages 144 to 187.
In publishing the parent company financial statements here together with the Group financial statements, HSBC Holdings has taken advantage of the exemption in section 230 of the Companies Act 1985 not to present its individual income statement and related notes that form a part of these financial statements.
HSBC has taken advantage of the exemption under Regulation 7 of the Partnerships and Unlimited Companies (Accounts) Regulations 1993 from certain partnerships that are consolidated by HSBC presenting their own individual financial statements under IFRSs.
The functional currency of HSBC Holdings plc is the US dollar, which is also the presentational currency of the consolidated financial statements of HSBC.

341
(d) Comparative information
As required by US public company reporting requirements, these consolidated financial statements include two years of comparative information for the consolidated income statement, consolidated cash flow statement, consolidated statement of recognised income and expense and related notes on the financial statements.
(e) Use of estimates and assumptions
The preparation of financial information requires the use of estimates and assumptions about future conditions. The use of available information and the application of judgement are inherent in the formation of estimates; actual results in the future may differ from those reported. Management believes that HSBC’s critical accounting policies where judgement is necessarily applied are those which relate to impairment of loans and advances, goodwill impairment, the valuation of financial instruments, the impairment of available-for-sale financial assets and deferred tax assets (see ‘Critical Accounting Policies’ on pages 61 to 66, which form an integral part of these financial statements).
Further information about key assumptions concerning the future, and other key sources of estimation uncertainty, are set out in these notes on the financial statements.
(f) Consolidation
The consolidated financial statements of HSBC comprise the financial statements of HSBC Holdings and its subsidiaries made up to 31 December, with the exception of the banking and insurance subsidiaries of HSBC Bank Argentina, whose financial statements are made up to 30 June annually to comply with local regulations. Accordingly, HSBC uses their audited interim financial statements, drawn up to 31 December annually.
Subsidiaries are consolidated from the date that HSBC gains control. The purchase method of accounting is used to account for the acquisition of subsidiaries by HSBC. The cost of an acquisition is measured at the fair value of the consideration given at the date of exchange, together with costs directly attributable to that acquisition. The acquired identifiable assets, liabilities and contingent liabilities are measured at their fair values at the date of acquisition. Any excess of the cost of acquisition over the fair value of HSBC’s share of the identifiable assets, liabilities and contingent liabilities acquired is recorded as goodwill. If the cost of acquisition is less than the fair value of HSBC’s share of the identifiable assets, liabilities and contingent liabilities of the business acquired, the difference is recognised immediately in the income statement.
Entities that are controlled by HSBC are consolidated until the date that control ceases.
In the context of Special Purpose Entities (‘SPE’s), the following circumstances may indicate a relationship in which, in substance, HSBC controls and consequently consolidates an SPE:
• the activities of the SPE are being conducted on behalf of HSBC according to its specific business needs so that HSBC obtains benefits from the SPE’s operation;
• HSBC has the decision-making powers to obtain the majority of the benefits of the activities of the SPE or, by setting up an ‘autopilot’ mechanism, HSBC has delegated these decision-making powers;
• HSBC has rights to obtain the majority of the benefits of the SPE and therefore may be exposed to risks incident to the activities of the SPE; or
• HSBC retains the majority of the residual or ownership risks related to the SPE or its assets in order to obtain benefits from its activities.
HSBC performs a re-assessment of consolidation whenever there is a change in the substance of the relationship between HSBC and an SPE.
All intra-HSBC transactions are eliminated on consolidation.
The consolidated financial statements of HSBC also include the attributable share of the results and reserves of joint ventures and associates. These are based on financial statements made up to 31 December, with the exception of the Bank of Communications, Ping An Insurance and Industrial Bank which are included on the basis of financial statements made up for the twelve months to 30 September. These are equity accounted three months in arrears in order to meet the requirements of the Group’s reporting timetable. HSBC has taken into account changes in the period from 1 October to 31 December that would have materially affected its results.

H S B C H O L D I N G S P L C
Notes on the Financial Statements (continued) Note 1
342
(g) Future accounting developments
Standards and Interpretations issued by the IASB and endorsed by the EU
IFRS 8 ‘Operating Segments’ (‘IFRS 8’), which replaces IAS 14 ‘Segment Reporting’ (‘IAS 14’), was issued on 30 November 2006 and is effective for annual periods beginning on or after 1 January 2009. This standard specifies how an entity should disclose information about its segments which enables users to evaluate the nature and financial effects of its business activities and the economic environments in which it operates. HSBC will adopt IFRS 8 with effect from 1 January 2009, and will accordingly present financial information for segments whose operating activities are regularly reviewed by the chief operating decision maker in order to make decisions about allocating resources and assessing performance. HSBC currently presents two sets of segment data in accordance with IAS 14, one geographical and one based on customer groups. Under IFRS 8, HSBC expects that its operating segments will be presented by geographic region. In addition, HSBC will continue to provide information on financial performance by customer group and global businesses alongside the geographical operating segment information in the ‘Operating and financial review’.
A revised IAS 1, which is applicable for annual periods beginning on or after 1 January 2009, was issued on 6 September 2007. The revised standard aims to improve users’ ability to analyse and compare information given in financial statements. The adoption of the revised standard will have no effect on the results reported in HSBC’s consolidated financial statements or the separate financial statements of HSBC Holdings. It will, however, result in certain presentational changes in the primary financial statements of HSBC and HSBC Holdings.
The IASB issued an amendment to IFRS 2 ‘Share-based Payment’ – ‘Vesting Conditions and Cancellations’ on 17 January 2008. The amendment, which is applicable for annual periods beginning on or after 1 January 2009, clarifies that vesting conditions comprise only service conditions and performance conditions. It also specifies the accounting treatment for a failure to meet a non-vesting condition. HSBC does not expect adoption of the amendment to have a significant effect on HSBC’s consolidated financial statements or the separate financial statements of HSBC Holdings.
The IASB issued a revised IAS 23 ‘Borrowing Costs’ on 29 March 2007, which is applicable for annual periods beginning on or after 1 January 2009. The revised standard eliminates the option of recognising borrowing costs immediately as an expense, to the extent that they are directly attributable to the acquisition, construction or production of a qualifying asset. HSBC does not expect adoption of the revised standard to have a significant effect on the consolidated financial statements or the separate financial statements of HSBC Holdings.
IFRIC 13 ‘Customer Loyalty Programmes’ (‘IFRIC 13’) was issued on 28 June 2007 and is effective for annual periods beginning on or after 1 July 2008. IFRIC 13 addresses how companies that grant their customers loyalty award credits (often called ‘points’) when buying goods or services should account for their obligation to provide free or discounted goods and services, if and when the customers redeem the points. IFRIC 13 requires companies to allocate some of the proceeds of the initial sale to the award credits and recognise these proceeds as revenue when they have fulfilled their obligations to provide goods or services. HSBC does not expect the adoption of this interpretation to have a significant effect on the consolidated financial statements. This interpretation will have no effect on the separate financial statements of HSBC Holdings.
Standards and Interpretations issued by the IASB but not endorsed by the EU
At 31 December 2008, the following amendments to standards and interpretations, effective for these consolidated financial statements, were issued by the IASB but not endorsed by the EU:
• an amendment to IAS 39 and to IFRS 7 – ‘Reclassification of Financial Assets – Effective Date and Transition’ was issued on 27 November 2008. The amendment, which clarifies the effective date of the Reclassification Amendment, will have no effect on the consolidated financial statements of HSBC or the separate financial statements of HSBC Holdings; and
• IFRIC 12 ‘Service Concession Arrangements’ was issued on 30 November 2006 and is effective for annual periods beginning on or after 1 January 2008. The adoption of this interpretation is not expected to have a significant effect on the consolidated financial statements of HSBC or the separate financial statements of HSBC Holdings.

343
A revised IFRS 3 ‘Business Combinations’ and an amended IAS 27 ‘Consolidated and Separate Financial Statements’, were issued on 10 January 2008. The revisions to the standards apply prospectively to business combinations for which the acquisition date is on or after the beginning of the first annual financial reporting period beginning on or after 1 July 2009. The main changes under the standards are that:
• acquisition-related costs are recognised as expenses in the income statement in the period they are incurred;
• equity interests held prior to control being obtained are remeasured to fair value at the time control is obtained, and any gain or loss is recognised in the income statement;
• changes in a parent’s ownership interest in a subsidiary that do not result in a change of control are treated as transactions between equity holders and reported in equity; and
• an option is available, on a transaction-by-transaction basis, to measure any non-controlling (previously referred to as minority) interests in the entity acquired either at fair value, or at the non-controlling interests’ proportionate share of the net identifiable assets of the entity acquired.
The effect that the changes will have on the consolidated financial statements of HSBC and the separate financial statements of HSBC Holdings will depend on the incidence and timing of business combinations occurring on or after 1 January 2010.
The IASB issued amendments to IAS 32 ‘Financial Instruments: Presentation’ and IAS 1 – ‘Puttable Financial Instruments and Obligations Arising on Liquidation’, on 14 February 2008. The amendments are applicable for annual periods beginning on or after 1 January 2009. HSBC does not expect the adoption of this amendment to have a significant effect on the consolidated financial statements or the separate financial statements of HSBC Holdings.
The IASB issued ‘Improvements to IFRSs’ on 22 May 2008, which comprises a collection of necessary, but not urgent, amendments to IFRSs. The amendments are primarily effective for annual periods beginning on or after 1 January 2009, with earlier application permitted. HSBC does not expect adoption of the amendments to have a significant effect on the consolidated financial statements or the separate financial statements of HSBC Holdings.
The IASB issued amendments to IFRS 1 ‘First-time Adoption of International Financial Reporting Standards’ and IAS 27 – ‘Determining the cost of an Investment in the Separate Financial Statements’, on 22 May 2008. The amendment is effective for annual periods beginning on or after 1 January 2009. These amendments are not expected to have a significant effect on the separate financial statements of HSBC Holdings and will have no effect on the consolidated financial statements.
The IASB issued an amendment to IAS 39 – ‘Eligible Hedged Items’ on 31 July 2008, which is applicable for annual periods beginning on or after 1 July 2009. The amendment clarifies how the existing principles underlying hedge accounting should be applied. This amendment will have no effect on the consolidated financial statements or the separate financial statements of HSBC Holdings.
IFRIC 15 ‘Agreements for the Construction of Real Estate’ (‘IFRIC 15’) was issued on 3 July 2008 and is effective for annual periods beginning on or after 1 January 2009. IFRIC 15 provides guidance on the recognition of revenue among real estate developers for sales of units. HSBC does not expect adoption of IFRIC 15 to have a significant effect on HSBC’s consolidated financial statements. This interpretation will have no effect on the separate financial statements of HSBC Holdings.
IFRIC 16 ‘Hedges of a Net Investment in a Foreign Operation’ (‘IFRIC 16’) was issued on 3 July 2008 and is effective for annual periods beginning on or after 1 October 2008. IFRIC 16 provides guidance on accounting for the hedge of a net investment in a foreign operation in an entity’s consolidated financial statements. The main change introduced by IFRIC 16 is to eliminate the possibility of an entity applying hedge accounting for a hedge of foreign exchange differences between the functional currency of a foreign operation and the presentation currency of the parent’s consolidated financial statements. The adoption of IFRIC 16 will have no effect on HSBC’s consolidated financial statements.
IFRIC 17 ‘Distributions of Non-cash Assets to Owners’ (‘IFRIC 17’) was issued on 27 November 2008 and is effective for annual periods beginning on or after 1 July 2009. IFRIC 17 provides guidance on how distributions of assets other than cash as dividends to shareholders should be accounted for. HSBC does not expect adoption

H S B C H O L D I N G S P L C
Notes on the Financial Statements (continued) Notes 1 and 2
344
of IFRIC 17 to have a significant effect on HSBC’s consolidated financial statements or the separate financial statements of HSBC Holdings.
IFRIC 18 ‘Transfers of Assets from Customers’ (‘IFRIC 18’) was issued on 29 January 2009 and is required to be applied prospectively to transfers of assets from customers received on or after 1 July 2009. IFRIC 18 clarifies the requirements of IFRSs for agreements in which an entity receives from a customer an item of property, plant, and equipment that the entity must then use either to connect the customer to a network or to provide the customer with ongoing access to a supply of goods or services (such as a supply of electricity, gas or water). HSBC does not expect adoption of IFRIC 18 to have an effect on HSBC’s consolidated financial statements or the separate financial statements of HSBC Holdings.
2 Summary of significant accounting policies
(a) Interest income and expense
Interest income and expense for all financial instruments except for those classified as held for trading or designated at fair value (other than debt securities issued by HSBC and derivatives managed in conjunction with such debt securities issued) are recognised in ‘Interest income’ and ‘Interest expense’ in the income statement using the effective interest method. The effective interest method is a way of calculating the amortised cost of a financial asset or a financial liability (or groups of financial assets or financial liabilities) and of allocating the interest income or interest expense over the relevant period.
The effective interest rate is the rate that exactly discounts estimated future cash receipts or payments through the expected life of the financial instrument or, where appropriate, a shorter period, to the net carrying amount of the financial asset or financial liability. When calculating the effective interest rate, HSBC estimates cash flows considering all contractual terms of the financial instrument but not future credit losses. The calculation includes all amounts paid or received by HSBC that are an integral part of the effective interest rate of a financial instrument, including transaction costs and all other premiums or discounts.
Interest on impaired financial assets is recognised using the rate of interest used to discount the future cash flows for the purpose of measuring the impairment loss.
(b) Non-interest income
Fee income is earned from a diverse range of services provided by HSBC to its customers. Fee income is accounted for as follows:
− income earned on the execution of a significant act is recognised as revenue when the act is completed (for example, fees arising from negotiating, or participating in the negotiation of, a transaction for a third-party, such as the arrangement for the acquisition of shares or other securities);
− income earned from the provision of services is recognised as revenue as the services are provided (for example, asset management, portfolio and other management advisory and service fees); and
− income which forms an integral part of the effective interest rate of a financial instrument is recognised as an adjustment to the effective interest rate (for example, certain loan commitment fees) and recorded in ‘Interest income’ (Note 2a).
Net trading income comprises all gains and losses from changes in the fair value of financial assets and financial liabilities held for trading, together with related interest income, expense and dividends.
Net income from financial instruments designated at fair value includes all gains and losses from changes in the fair value of financial assets and financial liabilities designated at fair value through profit or loss. Interest income and expense and dividend income arising on these financial instruments are also included in ‘Net income from financial instruments designated at fair value’, except for interest arising from debt securities issued, and derivatives managed in conjunction with those debt securities, which is recognised in ‘Interest expense’.
Dividend income is recognised when the right to receive payment is established. This is the ex-dividend date for equity securities.

345
(c) Segment reporting
HSBC’s segments are organised into five geographical regions, Europe, Hong Kong, Rest of Asia-Pacific, North America and Latin America, and four customer groups: Personal Financial Services; Commercial Banking; Global Banking and Markets; and Private Banking. The main items reported in the ‘Other’ segment are certain property activities, unallocated investment activities, centrally held investment companies and HSBC’s holding company and financing operations. The ‘Other’ segment also includes gains and losses on the disposal of certain significant subsidiaries or business units. Segment income and expenses include transfers between geographical regions and transfers between customer groups. These transfers are conducted on arm’s length terms and conditions.
In HSBC’s segmental analysis of the income statement by customer groups and global businesses, net trading income comprises all gains and losses from changes in the fair value of financial assets and financial liabilities classified as held for trading, together with third-party and intra-segment interest income and interest expense, and dividends received; in the consolidated income statement, intra-segment interest income and expense are eliminated.
(d) Determination of fair value
All financial instruments are recognised initially at fair value. In the normal course of business, the fair value of a financial instrument on initial recognition is the transaction price (that is, the fair value of the consideration given or received). In certain circumstances, however, the fair value will be based on other observable current market transactions in the same instrument, without modification or repackaging, or on a valuation technique whose variables include only data from observable markets, such as interest rate yield curves, option volatilities and currency rates. When such evidence exists, HSBC recognises a trading gain or loss on inception of the financial instrument. When unobservable market data have a significant impact on the valuation of financial instruments, the entire initial difference in fair value indicated by the valuation model from the transaction price is not recognised immediately in the income statement but is recognised over the life of the transaction on an appropriate basis, or when the inputs become observable, or the transaction matures or is closed out, or when HSBC enters into an offsetting transaction.
Subsequent to initial recognition, the fair values of financial instruments measured at fair value that are quoted in active markets are based on bid prices for assets held and offer prices for liabilities issued. When independent prices are not available, fair values are determined by using valuation techniques which refer to observable market data. These include comparison with similar instruments where market observable prices exist, discounted cash flow analysis, option pricing models and other valuation techniques commonly used by market participants. Fair values of financial instruments may be determined in whole or in part using valuation techniques based on assumptions that are not supported by prices from current market transactions or observable market data, where current prices or observable market data are not available.
Factors such as bid-offer spread, credit profile and model uncertainty are taken into account, as appropriate, when fair values are calculated using valuation techniques. Valuation techniques incorporate assumptions that other market participants would use in their valuations, including assumptions about interest rate yield curves, exchange rates, volatilities, and prepayment and default rates. Where a portfolio of financial instruments has quoted prices in an active market, the fair value of the instruments are calculated as the product of the number of units and quoted price and no block discounts are made.
If the fair value of a financial asset measured at fair value becomes negative, it is recorded as a financial liability until its fair value becomes positive, at which time it is recorded as a financial asset.
The fair values of financial liabilities are measured using quoted market prices where available, or using valuation techniques. These fair values include market participants’ assessments of the appropriate credit spread to apply to HSBC’s liabilities. The amount of change during the period, and cumulatively, in the fair value of designated financial liabilities and loans and advances that is attributable to changes in their credit spread is determined as the amount of change in the fair value that is not attributable to changes in market conditions that give rise to market risk.

H S B C H O L D I N G S P L C
Notes on the Financial Statements (continued) Note 2
346
(e) Reclassification of financial assets
Non-derivative financial assets (other than those designated at fair value through profit or loss upon initial recognition) may be reclassified out of the fair value through profit or loss category in particular circumstances:
• financial assets that would have met the definition of loans and receivables at initial recognition (if the financial asset had not been required to be classified as held for trading) may be reclassified out of the fair value through profit or loss category if there is the intention and ability to hold the financial asset for the foreseeable future or until maturity; and
• financial assets (except financial assets that would have met the definition of loans and receivables) may be reclassified out of the fair value through profit or loss category and into another category in rare circumstances.
When a financial asset is reclassified as described in the above circumstances, the financial asset is reclassified at its fair value on the date of reclassification. Any gain or loss already recognised in the income statement is not reversed. The fair value of the financial asset on the date of reclassification becomes its new cost or amortised cost, as applicable.
(f) Loans and advances to banks and customers
Loans and advances to banks and customers include loans and advances originated by HSBC which are not classified either as held for trading or designated at fair value. Loans and advances are recognised when cash is advanced to borrowers. They are derecognised when either borrowers repay their obligations, or the loans are sold or written off, or substantially all the risks and rewards of ownership are transferred. They are initially recorded at fair value plus any directly attributable transaction costs and are subsequently measured at amortised cost using the effective interest method, less impairment losses. Where loans and advances are hedged by derivatives designated and qualifying as fair value hedges, the carrying value of the loans and advances so hedged includes a fair value adjustment for the hedged risk only.
For certain leveraged finance and syndicated lending activities, HSBC may commit to underwrite loans on fixed contractual terms for specified periods of time, where the drawdown of the loan is contingent upon certain future events outside the control of HSBC. Where the loan arising from the lending commitment is expected to be held for trading, the commitment to lend is recorded as a trading derivative and measured at fair value through profit or loss. On drawdown, the loan is classified as held for trading and measured at fair value through profit or loss. Where it is not HSBC’s intention to trade the loan, a provision on the loan commitment is only recorded where it is probable that HSBC will incur a loss. This may occur, for example, where a loss of principal is probable or the interest rate charged on the loan is lower than the cost of funding. On inception of the loan, the hold portion is recorded at its fair value and subsequently measured at amortised cost using the effective interest method. However, where the initial fair value is lower than the cash amount advanced (for example, due to the rate of interest charged on the loan being below the market rate of interest), the write-down is charged to the income statement. The write-down will be recovered over the life of the loan, through the recognition of interest income using the effective interest rate method, unless the loan becomes impaired. The write-down is recorded as a reduction to other operating income.
Financial assets which have been reclassified out of the fair value through profit or loss category into the loans and receivables category are initially recorded at the fair value at the date of reclassification. The reclassified assets are subsequently measured at amortised cost, using the effective interest rate determined at the date of reclassification.
(g) Impairment of loans and advances
Losses for impaired loans are recognised promptly when there is objective evidence that impairment of a loan or portfolio of loans has occurred. Impairment allowances are calculated on individual loans and on groups of loans assessed collectively. Impairment losses are recorded as charges to the income statement. The carrying amount of impaired loans on the balance sheet is reduced through the use of impairment allowance accounts. Losses expected from future events are not recognised.

347
Individually assessed loans and advances
For all loans that are considered individually significant, HSBC assesses on a case-by-case basis at each balance sheet date whether there is any objective evidence that a loan is impaired. For those loans where objective evidence of impairment exists, impairment losses are determined considering the following factors:
– HSBC’s aggregate exposure to the customer;
– the viability of the customer’s business model and their capacity to trade successfully out of financial difficulties and generate sufficient cash flow to service debt obligations;
– the amount and timing of expected receipts and recoveries;
– the likely dividend available on liquidation or bankruptcy;
– the extent of other creditors’ commitments ranking ahead of, or pari passu with, HSBC and the likelihood of other creditors continuing to support the company;
– the complexity of determining the aggregate amount and ranking of all creditor claims and the extent to which legal and insurance uncertainties are evident;
– the realisable value of security (or other credit mitigants) and likelihood of successful repossession;
– the likely deduction of any costs involved in recovery of amounts outstanding;
– the ability of the borrower to obtain, and make payments in, the currency of the loan if not denominated in local currency; and
– when available, the secondary market price of the debt.
Impairment losses are calculated by discounting the expected future cash flows of a loan at its original effective interest rate, and comparing the resultant present value with the loan’s current carrying amount.
Collectively assessed loans and advances
Impairment is assessed on a collective basis in two circumstances:
– to cover losses which have been incurred but have not yet been identified on loans subject to individual assessment; and
– for homogeneous groups of loans that are not considered individually significant.
Incurred but not yet identified impairment
Individually assessed loans for which no evidence of loss has been specifically identified on an individual basis are grouped together according to their credit risk characteristics for the purpose of calculating an estimated collective loss. This reflects impairment losses that HSBC has incurred as a result of events occurring before the balance sheet date, which HSBC is not able to identify on an individual loan basis, and that can be reliably estimated. These losses will only be individually identified in the future. As soon as information becomes available which identifies losses on individual loans within the group, those loans are removed from the group and assessed on an individual basis for impairment.
The collective impairment allowance is determined after taking into account:
– historical loss experience in portfolios of similar credit risk characteristics (for example, by industry sector, loan grade or product);
– the estimated period between impairment occurring and the loss being identified and evidenced by the establishment of an appropriate allowance against the individual loan; and
– management’s experienced judgement as to whether current economic and credit conditions are such that the actual level of inherent losses at the balance sheet date is likely to be greater or less than that suggested by historical experience.
The period between a loss occurring and its identification is estimated by local management for each identified portfolio.
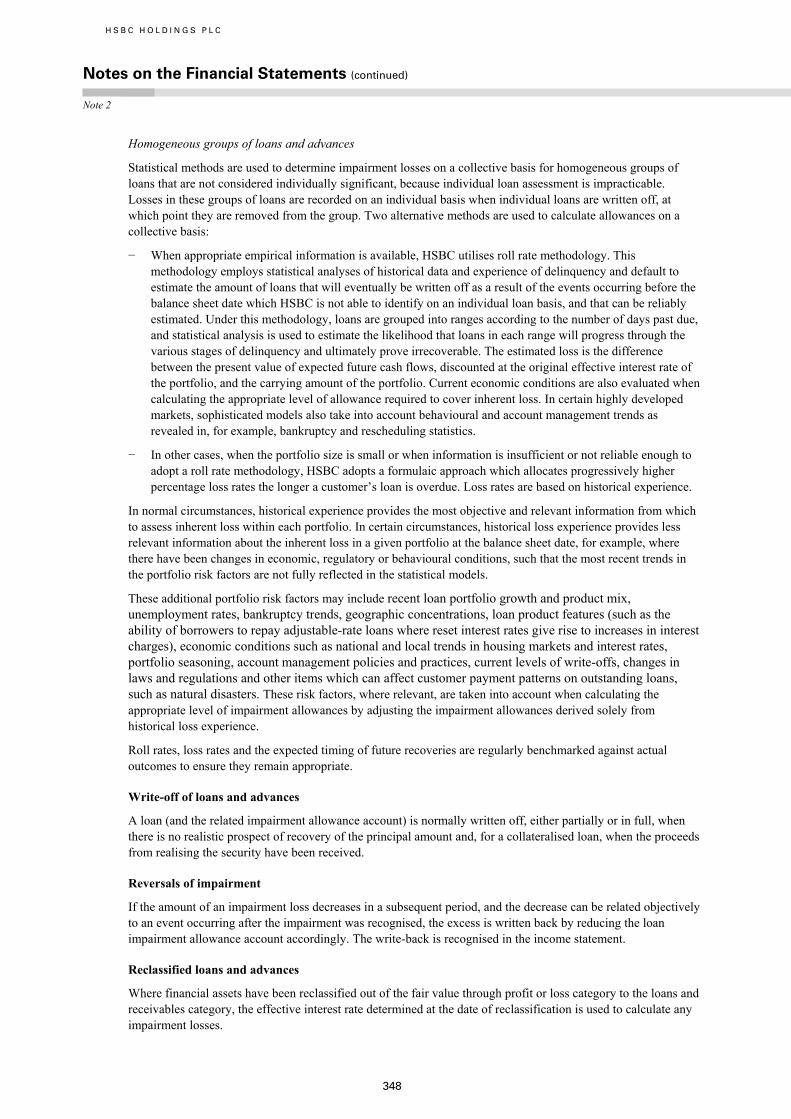
H S B C H O L D I N G S P L C
Notes on the Financial Statements (continued) Note 2
348
Homogeneous groups of loans and advances
Statistical methods are used to determine impairment losses on a collective basis for homogeneous groups of loans that are not considered individually significant, because individual loan assessment is impracticable. Losses in these groups of loans are recorded on an individual basis when individual loans are written off, at which point they are removed from the group. Two alternative methods are used to calculate allowances on a collective basis:
− When appropriate empirical information is available, HSBC utilises roll rate methodology. This methodology employs statistical analyses of historical data and experience of delinquency and default to estimate the amount of loans that will eventually be written off as a result of the events occurring before the balance sheet date which HSBC is not able to identify on an individual loan basis, and that can be reliably estimated. Under this methodology, loans are grouped into ranges according to the number of days past due, and statistical analysis is used to estimate the likelihood that loans in each range will progress through the various stages of delinquency and ultimately prove irrecoverable. The estimated loss is the difference between the present value of expected future cash flows, discounted at the original effective interest rate of the portfolio, and the carrying amount of the portfolio. Current economic conditions are also evaluated when calculating the appropriate level of allowance required to cover inherent loss. In certain highly developed markets, sophisticated models also take into account behavioural and account management trends as revealed in, for example, bankruptcy and rescheduling statistics.
− In other cases, when the portfolio size is small or when information is insufficient or not reliable enough to adopt a roll rate methodology, HSBC adopts a formulaic approach which allocates progressively higher percentage loss rates the longer a customer’s loan is overdue. Loss rates are based on historical experience.
In normal circumstances, historical experience provides the most objective and relevant information from which to assess inherent loss within each portfolio. In certain circumstances, historical loss experience provides less relevant information about the inherent loss in a given portfolio at the balance sheet date, for example, where there have been changes in economic, regulatory or behavioural conditions, such that the most recent trends in the portfolio risk factors are not fully reflected in the statistical models.
These additional portfolio risk factors may include recent loan portfolio growth and product mix, unemployment rates, bankruptcy trends, geographic concentrations, loan product features (such as the ability of borrowers to repay adjustable-rate loans where reset interest rates give rise to increases in interest charges), economic conditions such as national and local trends in housing markets and interest rates, portfolio seasoning, account management policies and practices, current levels of write-offs, changes in laws and regulations and other items which can affect customer payment patterns on outstanding loans, such as natural disasters. These risk factors, where relevant, are taken into account when calculating the appropriate level of impairment allowances by adjusting the impairment allowances derived solely from historical loss experience.
Roll rates, loss rates and the expected timing of future recoveries are regularly benchmarked against actual outcomes to ensure they remain appropriate.
Write-off of loans and advances
A loan (and the related impairment allowance account) is normally written off, either partially or in full, when there is no realistic prospect of recovery of the principal amount and, for a collateralised loan, when the proceeds from realising the security have been received.
Reversals of impairment
If the amount of an impairment loss decreases in a subsequent period, and the decrease can be related objectively to an event occurring after the impairment was recognised, the excess is written back by reducing the loan impairment allowance account accordingly. The write-back is recognised in the income statement.
Reclassified loans and advances
Where financial assets have been reclassified out of the fair value through profit or loss category to the loans and receivables category, the effective interest rate determined at the date of reclassification is used to calculate any impairment losses.

349
Following reclassification, where there is a subsequent increase in the estimates of future cash receipts as a result of increased recoverability of those cash receipts, the effect of that increase is recognised as an adjustment to the effective interest rate from the date of change in the estimate rather than as an adjustment to the carrying amount of the asset at the date of change in the estimate.
Assets acquired in exchange for loans
Non-financial assets acquired in exchange for loans as part of an orderly realisation are recorded as assets held for sale and reported in ‘Other assets’. The asset acquired is recorded at the lower of its fair value (less costs to sell) and the carrying amount of the loan (net of impairment allowance) at the date of exchange. No depreciation is charged in respect of assets held for sale. Any subsequent write-down of the acquired asset to fair value less costs to sell is recognised in the income statement, in ‘Other operating income’. Any subsequent increase in the fair value less costs to sell, to the extent this does not exceed the cumulative write-down, is also recognised in ‘Other operating income’, together with any realised gains or losses on disposal.
Renegotiated loans
Loans subject to collective impairment assessment whose terms have been renegotiated are no longer considered past due, but are treated as new loans for measurement purposes once the minimum number of payments required under the new arrangements have been received. Loans subject to individual impairment assessment, whose terms have been renegotiated, are subject to ongoing review to determine whether they remain impaired or should be considered past due. The carrying amount of loans that have been classified as renegotiated retain this classification until maturity or derecognition.
(h) Trading assets and trading liabilities
Treasury bills, debt securities, equity shares, loans, deposits, debt securities in issue, and short positions in securities are classified as held for trading if they have been acquired principally for the purpose of selling or repurchasing in the near term, or they form part of a portfolio of identified financial instruments that are managed together and for which there is evidence of a recent pattern of short-term profit-taking. These financial assets or financial liabilities are recognised on trade date, when HSBC enters into contractual arrangements with counterparties to purchase or sell the financial instruments, and are normally derecognised when either sold (assets) or extinguished (liabilities). Measurement is initially at fair value, with transaction costs taken to the income statement. Subsequently, their fair values are remeasured, and all gains and losses from changes therein are recognised in the income statement in ‘Net trading income’ as they arise.
(i) Financial instruments designated at fair value
Financial instruments, other than those held for trading, are classified in this category if they meet one or more of the criteria set out below, and are so designated by management. HSBC may designate financial instruments at fair value when the designation:
– eliminates or significantly reduces measurement or recognition inconsistencies that would otherwise arise from measuring financial assets or financial liabilities, or recognising gains and losses on them, on different bases. Under this criterion, the main classes of financial instruments designated by HSBC are:
Long-term debt issues. The interest payable on certain fixed rate long-term debt securities issued has been matched with the interest on ‘receive fixed/pay variable’ interest rate swaps as part of a documented interest rate risk management strategy. An accounting mismatch would arise if the debt securities issued were accounted for at amortised cost, because the related derivatives are measured at fair value with changes in the fair value recognised in the income statement. By designating the long-term debt at fair value, the movement in the fair value of the long-term debt will also be recognised in the income statement.
Financial assets and financial liabilities under investment contracts. Liabilities to customers under linked contracts are determined based on the fair value of the assets held in the linked funds, with changes recognised in the income statement. If no designation was made for the assets relating to the customer liabilities they would be classified as available-for-sale and the changes in fair value would be recorded directly in equity. These financial instruments are managed on a fair value basis and management information is also prepared on this basis. Designation at fair value of the financial assets and liabilities

H S B C H O L D I N G S P L C
Notes on the Financial Statements (continued) Note 2
350
under investment contracts allows the changes in fair values to be recorded in the income statement and presented in the same line.
– applies to groups of financial assets, financial liabilities or combinations thereof that are managed, and their performance evaluated, on a fair value basis in accordance with a documented risk management or investment strategy, and where information about the groups of financial instruments is reported to management on that basis. Under this criterion, certain financial assets held to meet liabilities under insurance contracts are the main class of financial instrument so designated. HSBC has documented risk management and investment strategies designed to manage such assets at fair value, taking into consideration the relationship of assets to liabilities in a way that mitigates market risks. Reports are provided to management on the fair value of the assets. Fair value measurement is also consistent with the regulatory reporting requirements under the appropriate regulations for these insurance operations.
– relates to financial instruments containing one or more embedded derivatives that significantly modify the cash flows resulting from those financial instruments, including certain debt issues and debt securities held.
The fair value designation, once made, is irrevocable. Designated financial assets and financial liabilities are recognised when HSBC enters into the contractual provisions of the arrangements with counterparties, which is generally on trade date, and are normally derecognised when sold (assets) or extinguished (liabilities). Measurement is initially at fair value, with transaction costs taken directly to the income statement. Subsequently, the fair values are remeasured, and gains and losses from changes therein are recognised in ‘Net income from financial instruments designated at fair value’.
(j) Financial investments
Treasury bills, debt securities and equity shares intended to be held on a continuing basis, other than those designated at fair value are classified as available-for-sale or held-to-maturity. Financial investments are recognised on trade date when HSBC enters into contractual arrangements with counterparties to purchase securities, and are normally derecognised when either the securities are sold or the borrowers repay their obligations.
(i) Available-for-sale financial assets are initially measured at fair value plus direct and incremental transaction costs. They are subsequently remeasured at fair value, and changes therein are recognised in equity in the ‘Available-for-sale fair value reserve’ until the financial assets are either sold or become impaired. When available-for-sale financial assets are sold, cumulative gains or losses previously recognised in equity are recognised in the income statement as ‘Gains less losses from financial investments’.
Interest income is recognised on available-for-sale debt securities using the effective interest rate, calculated over the asset’s expected life. Premiums and/or discounts arising on the purchase of dated investment securities are included in the calculation of their effective interest rates. Dividends are recognised in the income statement when the right to receive payment has been established.
At each balance sheet date an assessment is made of whether there is any objective evidence of impairment in the value of a financial asset. Impairment losses are recognised if, and only if, there is objective evidence of impairment as a result of one or more events that occurred after the initial recognition of the financial asset (a ‘loss event’) and that loss event (or events) has an impact on the estimated future cash flows of the financial asset that can be reliably estimated.
If the available-for-sale financial asset is impaired, the difference between the financial asset’s acquisition cost (net of any principal repayments and amortisation) and the current fair value, less any previous impairment loss recognised in the income statement, is removed from equity and recognised in the income statement.
Impairment losses for available-for-sale debt securities are recognised within ‘Loan impairment charges and other credit risk provisions’ in the income statement and impairment losses for available-for-sale equity securities are recognised within ‘Gains less losses from financial investments’ in the income statement.
Once an impairment loss has been recognised on an available-for-sale financial asset, the subsequent accounting treatment for changes in the fair value of that asset differs depending on the nature of the available-for-sale financial asset concerned:

351
– For an available-for-sale debt security, a subsequent decline in the fair value of the instrument is recognised in the income statement when there is further objective evidence of impairment as a result of further decreases in the estimated future cash flows of the financial asset. Where there is no further objective evidence of impairment, the decline in the fair value of the financial asset is recognised directly in equity. If the fair value of a debt security increases in a subsequent period, and the increase can be objectively related to an event occurring after the impairment loss was recognised in the income statement, the impairment loss is reversed through the income statement to the extent of the increase in fair value;
– For an available-for-sale equity security, all subsequent increases in the fair value of the instrument are treated as a revaluation and are recognised directly in equity. Impairment losses recognised on the equity security are not reversed through the income statement. Subsequent decreases in the fair value of the available-for-sale equity security are recognised in the income statement, to the extent that further cumulative impairment losses have been incurred in relation to the acquisition cost of the equity security.
(ii) Held-to-maturity investments are non-derivative financial assets with fixed or determinable payments and fixed maturities that HSBC positively intends, and is able, to hold until maturity. Held-to-maturity investments are initially recorded at fair value plus any directly attributable transaction costs, and are subsequently measured at amortised cost using the effective interest rate method, less any impairment losses.
(k) Sale and repurchase agreements (including stock lending and borrowing)
When securities are sold subject to a commitment to repurchase them at a predetermined price (‘repo’s), they remain on the balance sheet and a liability is recorded in respect of the consideration received. Securities purchased under commitments to sell (‘reverse repo’s) are not recognised on the balance sheet and the consideration paid is recorded in ‘Loans and advances to banks’ or ‘Loans and advances to customers’ as appropriate. The difference between the sale and repurchase price is treated as interest and recognised over the life of the agreement.
Securities lending and borrowing transactions are generally secured, with collateral taking the form of securities or cash advanced or received. The transfer of securities to counterparties under these agreements is not normally reflected on the balance sheet. Cash collateral advanced or received is recorded as an asset or a liability respectively.
Securities borrowed are not recognised on the balance sheet. If they are sold on to third parties, an obligation to return the securities is recorded as a trading liability and measured at fair value, and any gains or losses are included in ‘Net trading income’.
(l) Derivatives and hedge accounting
Derivatives are recognised initially, and are subsequently remeasured, at fair value. Fair values of exchange-traded derivatives are obtained from quoted market prices. Fair values of over-the-counter derivatives are obtained using valuation techniques, including discounted cash flow models and option pricing models.
Derivatives may be embedded in other financial instruments, for example, a convertible bond with an embedded conversion option. Embedded derivatives are treated as separate derivatives when their economic characteristics and risks are not clearly and closely related to those of the host contract; the terms of the embedded derivative would meet the definition of a stand-alone derivative if they were contained in a separate contract; and the combined contract is not held for trading or designated at fair value. These embedded derivatives are measured at fair value with changes therein recognised in the income statement.
Derivatives are classified as assets when their fair value is positive, or as liabilities when their fair value is negative. Derivative assets and liabilities arising from different transactions are only offset if the transactions are with the same counterparty, a legal right of offset exists, and the parties intend to settle the cash flows on a net basis.
The method of recognising fair value gains and losses depends on whether derivatives are held for trading or are designated as hedging instruments, and if the latter, the nature of the risks being hedged. All gains and losses from changes in the fair value of derivatives held for trading are recognised in the income statement. When derivatives are designated as hedges, HSBC classifies them as either: (i) hedges of the change in fair value of

H S B C H O L D I N G S P L C
Notes on the Financial Statements (continued) Note 2
352
recognised assets or liabilities or firm commitments (‘fair value hedges’); (ii) hedges of the variability in highly probable future cash flows attributable to a recognised asset or liability, or a forecast transaction (‘cash flow hedges’); or (iii) a hedge of a net investment in a foreign operation (‘net investment hedges’). Hedge accounting is applied to derivatives designated as hedging instruments in a fair value, cash flow or net investment hedge provided certain criteria are met.
Hedge accounting
At the inception of a hedging relationship, HSBC documents the relationship between the hedging instruments and the hedged items, its risk management objective and its strategy for undertaking the hedge. HSBC also requires a documented assessment, both at hedge inception and on an ongoing basis, of whether or not the hedging instruments, primarily derivatives, that are used in hedging transactions are highly effective in offsetting the changes attributable to the hedged risks in the fair values or cash flows of the hedged items. Interest on designated qualifying hedges is included in ‘Net interest income’.
Fair value hedge
Changes in the fair value of derivatives that are designated and qualify as fair value hedging instruments are recorded in the income statement, along with changes in the fair value of the hedged assets, liabilities or group thereof that are attributable to the hedged risk.
If a hedging relationship no longer meets the criteria for hedge accounting, the cumulative adjustment to the carrying amount of the hedged item is amortised to the income statement based on a recalculated effective interest rate over the residual period to maturity, unless the hedged item has been derecognised, in which case, it is released to the income statement immediately.
Cash flow hedge
The effective portion of changes in the fair value of derivatives that are designated and qualify as cash flow hedges is recognised in equity within the ‘Cash flow hedging reserve’. Any gain or loss in fair value relating to an ineffective portion is recognised immediately in the income statement.
Amounts accumulated in equity are recycled to the income statement in the periods in which the hedged item will affect profit or loss. However, when the forecast transaction that is hedged results in the recognition of a non-financial asset or a non-financial liability, the gains and losses previously deferred in equity are transferred from equity and included in the initial measurement of the cost of the asset or liability.
When a hedging instrument expires or is sold, or when a hedge no longer meets the criteria for hedge accounting, any cumulative gain or loss existing in equity at that time remains in equity until the forecast transaction is eventually recognised in the income statement. When a forecast transaction is no longer expected to occur, the cumulative gain or loss that was reported in equity is immediately transferred to the income statement.
Net investment hedge
Hedges of net investments in foreign operations are accounted for in a similar way to cash flow hedges. A gain or loss on the effective portion of the hedging instrument is recognised in equity; a gain or loss on the ineffective portion is recognised immediately in the income statement. Gains and losses accumulated in equity are included in the income statement on the disposal of the foreign operation.
Hedge effectiveness testing
To qualify for hedge accounting, HSBC requires that at the inception of the hedge and throughout its life, each hedge must be expected to be highly effective (prospective effectiveness), and demonstrate actual effectiveness (retrospective effectiveness) on an ongoing basis.
The documentation of each hedging relationship sets out how the effectiveness of the hedge is assessed. The method an HSBC entity adopts for assessing hedge effectiveness will depend on its risk management strategy.
For prospective effectiveness, the hedging instrument must be expected to be highly effective in offsetting changes in fair value or cash flows attributable to the hedged risk during the period for which the hedge is

353
designated. For actual effectiveness to be achieved, the changes in fair value or cash flows must offset each other in the range of 80 per cent to 125 per cent.
Hedge ineffectiveness is recognised in the income statement in ‘Net trading income’.
Derivatives that do not qualify for hedge accounting
All gains and losses from changes in the fair values of derivatives that do not qualify for hedge accounting are recognised immediately in the income statement. These gains and losses are reported in ‘Net trading income’, except where derivatives are managed in conjunction with financial instruments designated at fair value (other than derivatives managed in conjunction with debt securities issued by the Group), in which case gains and losses are reported in ‘Net income from financial instruments designated at fair value’. The interest on derivatives managed in conjunction with debt securities issued by the Group which are designated at fair value is recognised in ‘Interest expense’. All other gains and losses on these derivatives are reported in ‘Net income from financial instruments designated at fair value’.
(m) Derecognition of financial assets and liabilities
Financial assets are derecognised when the contractual right to receive cash flows from the assets has expired; or when HSBC has transferred its contractual right to receive the cash flows of the financial assets, and either:
– substantially all the risks and rewards of ownership have been transferred; or
– HSBC has neither retained nor transferred substantially all the risks and rewards, but has not retained control.
Financial liabilities are derecognised when they are extinguished, that is when the obligation is discharged, cancelled or expires.
(n) Offsetting financial assets and financial liabilities
Financial assets and financial liabilities are offset and the net amount reported in the balance sheet when there is a legally enforceable right to offset the recognised amounts and there is an intention to settle on a net basis, or realise the asset and settle the liability simultaneously.
(o) Subsidiaries, associates and joint ventures
HSBC classifies investments in entities which it controls as subsidiaries. Where HSBC is a party to a contractual arrangement whereby, together with one or more parties, it undertakes an economic activity that is subject to joint control, HSBC classifies its interest in the venture as a joint venture. HSBC classifies investments in entities over which it has significant influence, and that are neither subsidiaries nor joint ventures, as associates. For the purpose of determining this classification, control is considered to be the power to govern the financial and operating policies of an entity so as to obtain benefits from its activities.
HSBC Holdings’ investments in subsidiaries are stated at cost less any impairment losses. Reversals of impairment losses are recognised in the income statement if there has been a change in the estimates used to determine the recoverable amount of the investment.
Investments in associates and interests in joint ventures are recognised using the equity method. Under this method, such investments are initially stated at cost, including attributable goodwill, and are adjusted thereafter for the post-acquisition change in HSBC’s share of net assets.
Profits on transactions between HSBC and its associates and joint ventures are eliminated to the extent of HSBC’s interest in the respective associates or joint ventures. Losses are also eliminated to the extent of HSBC’s interest in the associates or joint ventures unless the transaction provides evidence of an impairment of the asset transferred.
(p) Goodwill and intangible assets
(i) Goodwill arises on business combinations, including the acquisition of subsidiaries, and on the acquisition of interests in joint ventures and associates, when the cost of acquisition exceeds the fair value of HSBC’s share of the identifiable assets, liabilities and contingent liabilities acquired. If HSBC’s interest in the fair

H S B C H O L D I N G S P L C
Notes on the Financial Statements (continued) Note 2
354
value of the identifiable assets, liabilities and contingent liabilities of an acquired business is greater than the cost of acquisition, the excess is recognised immediately in the income statement.
Intangible assets are recognised separately from goodwill when they are separable or arise from contractual or other legal rights, and their fair value can be measured reliably.
Goodwill is allocated to cash-generating units for the purpose of impairment testing, which is undertaken at the lowest level at which goodwill is monitored for internal management purposes. Impairment testing is performed at least annually, and whenever there is an indication that the cash-generating unit may be impaired, by comparing the recoverable amount from a cash-generating unit with the carrying amount of its net assets, including attributable goodwill. The recoverable amount of an asset is the higher of its fair value less cost to sell, and its value in use. Value in use is the present value of the expected future cash flows from a cash-generating unit. If the recoverable amount is less than the carrying value, an impairment loss is charged to the income statement. Goodwill is stated at cost less accumulated impairment losses.
Goodwill on acquisitions of interests in joint ventures and associates is included in ‘Interests in associates and joint ventures’.
At the date of disposal of a business, attributable goodwill is included in HSBC’s share of net assets in the calculation of the gain or loss on disposal.
(ii) Intangible assets include the present value of in-force long-term insurance business, computer software, trade names, mortgage servicing rights, customer lists, core deposit relationships, credit card customer relationships and merchant or other loan relationships. Intangible assets are subject to impairment review if there are events or changes in circumstances that indicate that the carrying amount may not be recoverable.
– Intangible assets that have an indefinite useful life, or are not yet ready for use, are tested for impairment annually. This impairment test may be performed at any time during the year, provided it is performed at the same time every year. An intangible asset recognised during the current period is tested before the end of the current year.
– Intangible assets that have a finite useful life, except for the value of in-force long-term insurance business, are stated at cost less amortisation and accumulated impairment losses and are amortised over their estimated useful lives. Estimated useful life is the lower of legal duration and expected useful life. The amortisation of mortgage servicing rights is included within ‘Net fee income’.
For the accounting policy governing the present value of in-force long-term insurance business (see Note 2y).
(iii) Intangible assets with finite useful lives are amortised, generally on a straight-line basis, over their useful lives as follows:
Trade names ........................................................................................................................... 10 years Mortgage servicing rights ...................................................................................................... generally between 5 and 12 yearsInternally generated software ................................................................................................. between 3 and 5 years Purchased software ................................................................................................................. between 3 and 5 years Customer/merchant relationships ........................................................................................... between 3 and 10 years Other ....................................................................................................................................... generally 10 years
(q) Property, plant and equipment
Land and buildings are stated at historical cost, or fair value at the date of transition to IFRSs (‘deemed cost’), less any impairment losses and depreciation calculated to write-off the assets over their estimated useful lives as follows:
– freehold land is not depreciated;
– freehold buildings are depreciated at the greater of two per cent per annum on a straight-line basis or over their remaining useful lives; and
– leasehold buildings are depreciated over the unexpired terms of the leases, or over their remaining useful lives.

355
Equipment, fixtures and fittings (including equipment on operating leases where HSBC is the lessor) are stated at cost less any impairment losses and depreciation calculated on a straight-line basis to write-off the assets over their useful lives, which run to a maximum of 35 years but are generally between 5 years and 20 years.
Property, plant and equipment is subject to an impairment review if there are events or changes in circumstances which indicate that the carrying amount may not be recoverable.
HSBC holds certain properties as investments to earn rentals or for capital appreciation, or both. Investment properties are included in the balance sheet at fair value with changes therein recognised in the income statement in the period of change. Fair values are determined by independent professional valuers who apply recognised valuation techniques.
(r) Finance and operating leases
Agreements which transfer to counterparties substantially all the risks and rewards incidental to the ownership of assets, but not necessarily legal title, are classified as finance leases. When HSBC is a lessor under finance leases the amounts due under the leases, after deduction of unearned charges, are included in ‘Loans and advances to banks’ or ‘Loans and advances to customers’ as appropriate. The finance income receivable is recognised in ‘Net interest income’ over the periods of the leases so as to give a constant rate of return on the net investment in the leases.
When HSBC is a lessee under finance leases, the leased assets are capitalised and included in ‘Property, plant and equipment’ and the corresponding liability to the lessor is included in ‘Other liabilities’. A finance lease and its corresponding liability are recognised initially at the fair value of the asset or, if lower, the present value of the minimum lease payments. Finance charges payable are recognised in ‘Net interest income’ over the period of the lease based on the interest rate implicit in the lease so as to give a constant rate of interest on the remaining balance of the liability.
All other leases are classified as operating leases. When acting as lessor, HSBC includes the assets subject to operating leases in ‘Property, plant and equipment’ and accounts for them accordingly. Impairment losses are recognised to the extent that residual values are not fully recoverable and the carrying value of the assets is thereby impaired. When HSBC is the lessee, leased assets are not recognised on the balance sheet. Rentals payable and receivable under operating leases are accounted for on a straight-line basis over the periods of the leases and are included in ‘General and administrative expenses’ and ‘Other operating income’, respectively.
(s) Income tax
Income tax comprises current tax and deferred tax. Income tax is recognised in the income statement except to the extent that it relates to items recognised directly in equity, in which case it is recognised in equity.
Current tax is the tax expected to be payable on the taxable profit for the year, calculated using tax rates enacted or substantively enacted by the balance sheet date, and any adjustment to tax payable in respect of previous years. Current tax assets and liabilities are offset when HSBC intends to settle on a net basis and the legal right to offset exists.
Deferred tax is recognised on temporary differences between the carrying amounts of assets and liabilities in the balance sheet and the amounts attributed to such assets and liabilities for tax purposes. Deferred tax liabilities are generally recognised for all taxable temporary differences and deferred tax assets are recognised to the extent that it is probable that future taxable profits will be available against which deductible temporary differences can be utilised.
Deferred tax is calculated using the tax rates expected to apply in the periods in which the assets will be realised or the liabilities settled, based on tax rates and laws enacted, or substantively enacted, by the balance sheet date. Deferred tax assets and liabilities are offset when they arise in the same tax reporting group and relate to income taxes levied by the same taxation authority, and when HSBC has a legal right to offset.
Deferred tax relating to actuarial gains and losses on post-employment benefits is recognised directly in equity. Deferred tax relating to fair value remeasurement of available-for-sale investments and cash flow hedging instruments which are charged or credited directly to equity, is also credited or charged directly to equity and is subsequently recognised in the income statement when the deferred fair value gain or loss is recognised in the income statement.

H S B C H O L D I N G S P L C
Notes on the Financial Statements (continued) Note 2
356
(t) Pension and other post-employment benefits
HSBC operates a number of pension and other post-employment benefit plans throughout the world. These plans include both defined benefit and defined contribution plans and various other post-employment benefits such as post-employment healthcare.
Payments to defined contribution plans and state-managed retirement benefit plans, where HSBC’s obligations under the plans are equivalent to a defined contribution plan, are charged as an expense as they fall due.
The defined benefit pension costs and the present value of defined benefit obligations are calculated at the reporting date by the schemes’ actuaries using the Projected Unit Credit Method. The net charge to the income statement mainly comprises the current service cost, plus the unwinding of the discount rate on plan liabilities, less the expected return on plan assets, and is presented in operating expenses. Past service costs are charged immediately to the income statement to the extent that the benefits have vested, and are otherwise recognised on a straight-line basis over the average period until the benefits vest. Actuarial gains and losses comprise experience adjustments (the effects of differences between the previous actuarial assumptions and what has actually occurred), as well as the effects of changes in actuarial assumptions. Actuarial gains and losses are recognised in ‘Equity’ and presented in the Statement of Recognised Income and Expense in the period in which they arise.
The defined benefit liability recognised in the balance sheet represents the present value of defined benefit obligations adjusted for unrecognised past service costs and reduced by the fair value of plan assets. Any net defined benefit surplus is limited to unrecognised past service costs plus the present value of available refunds and reductions in future contributions to the plan.
The costs of obligations arising from other defined post-employment benefits plans, such as defined benefit health-care plans, are accounted for on the same basis as defined benefit pension plans.
(u) Share-based payments
The cost of share-based payment arrangements with employees is measured by reference to the fair value of equity instruments on the date they are granted, and recognised as an expense on a straight-line basis over the vesting period, with a corresponding credit to the ‘Share-based payment reserve’. The fair value of equity instruments that are made available immediately, with no vesting period attached to the award, are expensed immediately.
Fair value is determined by using appropriate valuation models, taking into account the terms and conditions upon which the equity instruments were granted. Market performance conditions are taken into account when estimating the fair value of equity instruments at the date of grant, so that an award is treated as vesting irrespective of whether the market performance condition is satisfied, provided all other conditions are satisfied.
Vesting conditions, other than market performance conditions, are not taken into account in the initial estimate of the fair value at the grant date. They are taken into account by adjusting the number of equity instruments included in the measurement of the transaction, so that the amount recognised for services received as consideration for the equity instruments granted shall be based on the number of equity instruments that eventually vest. On a cumulative basis, no expense is recognised for equity instruments that do not vest because of a failure to satisfy non-market performance or service conditions.
Where an award has been modified, as a minimum, the expense of the original award continues to be recognised as if it had not been modified. Where the effect of a modification is to increase the fair value of an award or increase the number of equity instruments, the incremental fair value of the award or incremental fair value of the extra equity instruments is recognised in addition to the expense of the original grant, measured at the date of modification, over the modified vesting period.
A cancellation that occurs during the vesting period is treated as an acceleration of vesting, and recognised immediately for the amount that would otherwise have been recognised for services over the vesting period.
Where HSBC Holdings enters into share-based payment arrangements involving employees of subsidiaries, the cost is recognised in ‘Investment in subsidiaries’ and credited to the ‘Share-based payment reserve’ over the vesting period. Where the cost is recharged to the subsidiary, it is recognised as an inter-company debtor, not as an investment in subsidiary. Where a subsidiary has funded the share-based payment arrangement, ‘Investment in subsidiaries’ is reduced by the fair value of equity instruments.

357
(v) Foreign currencies
Items included in the financial statements of each of HSBC’s entities are measured using the currency of the primary economic environment in which the entity operates (‘the functional currency’). The consolidated financial statements of HSBC are presented in US dollars, which is the Group’s presentation currency.
Transactions in foreign currencies are recorded in the functional currency at the rate of exchange prevailing on the date of the transaction. Monetary assets and liabilities denominated in foreign currencies are translated into the functional currency at the rate of exchange ruling at the balance sheet date. Any resulting exchange differences are included in the income statement. Non-monetary assets and liabilities that are measured at historical cost in a foreign currency are translated into the functional currency using the rate of exchange at the date of the initial transaction. Non-monetary assets and liabilities measured at fair value in a foreign currency are translated into the functional currency using the rate of exchange at the date the fair value was determined. Any exchange component of a gain or loss on a non-monetary item is recognised directly in equity if the gain or loss on the non-monetary item is recognised directly in equity. Any exchange component of a gain or loss on a non-monetary item is recognised directly in the income statement if the gain or loss on the non-monetary item is recognised in the income statement.
In the consolidated financial statements, the assets, including related goodwill where applicable, and liabilities of branches, subsidiaries, joint ventures and associates whose functional currency is not US dollars, are translated into the Group’s presentation currency at the rate of exchange ruling at the balance sheet date. The results of branches, subsidiaries, joint ventures and associates whose functional currency is not US dollars are translated into US dollars at the average rates of exchange for the reporting period. Exchange differences arising from the retranslation of opening foreign currency net investments, and exchange differences arising from retranslation of the result for the reporting period from the average rate to the exchange rate prevailing at the period end, are recognised in equity in the ‘Foreign exchange reserve’. Exchange differences on a monetary item that is part of a net investment in a foreign operation are recognised in the income statement of the separate financial statements. In consolidated financial statements these exchange differences are recognised in the ‘Foreign exchange reserve’ in shareholders’ equity. On disposal of a foreign operation, exchange differences relating thereto and previously recognised in reserves are recognised in the income statement.
(w) Provisions
Provisions are recognised when it is probable that an outflow of economic benefits will be required to settle a current legal or constructive obligation, which has arisen as a result of past events, and for which a reliable estimate can be made of the amount of the obligation.
Contingent liabilities, which include certain guarantees and letters of credit pledged as collateral security, are possible obligations that arise from past events whose existence will be confirmed only by the occurrence, or non-occurrence, of one or more uncertain future events not wholly within the control of HSBC; or are present obligations that have arisen from past events but are not recognised because it is not probable that settlement will require the outflow of economic benefits, or because the amount of the obligations cannot be reliably measured. Contingent liabilities are not recognised in the financial statements but are disclosed unless the probability of settlement is remote.
(x) Financial guarantee contracts
Liabilities under financial guarantee contracts which are not classified as insurance contracts are recorded initially at their fair value, which is generally the fee received or receivable. Subsequently, financial guarantee liabilities are measured at the higher of the initial fair value, less cumulative amortisation, and the best estimate of the expenditure required to settle the obligations.
HSBC Holdings has issued financial guarantees to other Group entities. Where it has previously asserted explicitly that it regards such contracts as insurance contracts and has used accounting applicable to insurance contracts, HSBC may elect to account for guarantees as an insurance contract. This election is made on a contract by contract basis, but the election for each contract is irrevocable. Where these guarantees have been classified as insurance contracts, they are measured and recognised as insurance liabilities.

H S B C H O L D I N G S P L C
Notes on the Financial Statements (continued) Note 2
358
(y) Insurance contracts
Through its insurance subsidiaries, HSBC issues contracts to customers that contain insurance risk, financial risk or a combination thereof. A contract under which HSBC accepts significant insurance risk from another party by agreeing to compensate that party on the occurrence of a specified uncertain future event, is classified as an insurance contract. An insurance contract may also transfer financial risk, but is accounted for as an insurance contract if the insurance risk is significant.
While investment contracts with discretionary participation features are financial instruments, they continue to be treated as insurance contracts as permitted by IFRS 4.
Insurance contracts are accounted for as follows:
Premiums
Gross insurance premiums for non-life insurance business are reported as income over the term of the insurance contracts based on the proportion of risks borne during the accounting period. The unearned premium (the proportion of the business underwritten in the accounting year relating to the period of risk after the balance sheet date) is calculated on a daily or monthly pro rata basis.
Premiums for life insurance contracts are accounted for when receivable, except in unit-linked insurance contracts where premiums are accounted for when liabilities are established.
Reinsurance premiums are accounted for in the same accounting period as the premiums for the direct insurance contracts to which they relate.
Claims and reinsurance recoveries
Gross insurance claims for non-life insurance contracts include paid claims and movements in outstanding claims liabilities.
Gross insurance claims for life insurance contracts reflect the total cost of claims arising during the year, including claim handling costs and any policyholder bonuses allocated in anticipation of a bonus declaration. Claims arising during the year include maturities, surrenders and death claims.
Maturity claims are recognised when due for payment. Surrenders are recognised when paid or at an earlier date on which, following notification, the policy ceases to be included within the calculation of the related insurance liabilities. Death claims are recognised when notified.
Reinsurance recoveries are accounted for in the same period as the related claim.
Liabilities under insurance contracts
Outstanding claims liabilities for non-life insurance contracts are based on the estimated ultimate cost of all claims incurred but not settled at the balance sheet date, whether reported or not, together with related claim-handling costs and a reduction for the expected value of salvage and other recoveries. Liabilities for claims incurred but not reported are made on an estimated basis, using appropriate statistical techniques.
Liabilities under non-linked life insurance contracts are calculated by each life insurance operation based on local actuarial principles.
Liabilities under unit-linked life insurance contracts are at least equivalent to the surrender or transfer value which is calculated by reference to the value of the relevant underlying funds or indices.
A liability adequacy test is carried out on insurance liabilities to ensure that the carrying amount of the liabilities is sufficient in the light of current estimates of future cash flows. When performing the liability adequacy test, all contractual cash flows are discounted and compared with the carrying value of the liability. When a shortfall is identified it is charged immediately to the income statement.
Present value of in-force long-term insurance business
The value placed on insurance contracts that are classified as long-term insurance business and are in force at the balance sheet date is recognised as an asset.

359
The present value of in-force (‘PVIF’) long-term insurance business is determined by discounting future cash flows expected to emerge from business currently in force using appropriate assumptions in assessing factors such as future mortality, lapse rates and levels of expenses and a risk discount rate that reflects the risk premium attributable to the respective long-term insurance business. Movements in the PVIF long-term insurance business are included in ‘Other operating income’ on a gross of tax basis.
Future profit participation
Where contracts provide discretionary profit participation benefits to policyholders, insurance liabilities include the net unrealised gains recognised in connection with the assets backing the contracts to the extent that policyholders will benefit from such gains. This benefit may arise from the contractual terms, regulation, or past distribution policy. The corresponding movement in liability is recognised in equity or in the income statement in the same proportion to the net unrealised gains on the assets. In the case of net unrealised losses, a deferred participating asset is recognised only to the extent that its recoverability is highly probable.
Investment contracts
Customer liabilities under linked and certain non-linked investment contracts and the corresponding financial assets are designated at fair value. Movements in fair value are recognised in ‘Net income from financial investments designated at fair value’. Premiums receivable and amounts withdrawn are accounted for as increases or decreases in the liability recorded in respect of investment contracts.
Liabilities under linked investment contracts are at least equivalent to the surrender or transfer value which is calculated by reference to the value of the relevant underlying funds or indices.
Investment management fees receivable are recognised in the income statement over the period of the provision of the investment management services, in ‘Net fee income’.
The incremental costs directly related to the acquisition of new investment contracts or renewing existing investment contracts are deferred and amortised over the period during which the investment management services are provided.
(z) Debt securities issued and deposits by customers and banks
Financial liabilities are recognised when HSBC enters into the contractual provisions of the arrangements with counterparties, which is generally on trade date, and initially measured at fair value, which is normally the consideration received net of directly attributable transaction costs incurred. Subsequent measurement of financial liabilities, other than those measured at fair value through profit or loss and financial guarantees, is at amortised cost, using the effective interest method to amortise the difference between proceeds net of directly attributable transaction costs and the redemption amount over the expected life of the debt.
(aa) Share capital
Shares are classified as equity when there is no contractual obligation to transfer cash or other financial assets. Incremental costs directly attributable to the issue of equity instruments are shown in equity as a deduction from the proceeds, net of tax.
HSBC Holdings plc shares held by HSBC are recognised in ‘Total shareholders’ equity’ as a deduction from retained earnings until they are cancelled. When such shares are subsequently sold, reissued or otherwise disposed of, any consideration received is included in ‘Total shareholders’ equity’, net of any directly attributable incremental transaction costs and related income tax effects.
(ab) Cash and cash equivalents
For the purpose of the cash flow statement, cash and cash equivalents include highly liquid investments that are readily convertible to known amounts of cash and which are subject to an insignificant risk of change in value. Such investments are normally those with less than three months’ maturity from the date of acquisition, and include cash and balances at central banks, treasury bills and other eligible bills, loans and advances to banks, items in the course of collection from or in transmission to other banks, and certificates of deposit.

H S B C H O L D I N G S P L C
Notes on the Financial Statements (continued) Notes 3, 4 and 5
360
3 Net income from financial instruments designated at fair value
Net income from financial instruments designated at fair value includes:
• all gains and losses from changes in the fair value of financial assets and liabilities designated at fair value, including liabilities under investment contracts;
• all gains and losses from changes in the fair value of derivatives that are managed in conjunction with financial assets and liabilities designated at fair value; and
• interest income, interest expense and dividend income in respect of: – financial assets and liabilities designated at fair value; and – derivatives managed in conjunction with the above, except for interest arising from HSBC’s issued debt securities and derivatives managed in conjunction with those debt securities, which is recognised in ‘Interest expense’.
2008 2007 2006 US$m US$m US$m Net income/(expense) arising on: – financial assets held to meet liabilities under insurance and
investment contracts ....................................................................................... (5,064) 2,056 1,552 – other financial assets designated at fair value ................................................ 1,738 581 217 – derivatives managed in conjunction with financial assets
designated at fair value ................................................................................... 77 (18) 57
(3,249) 2,619 1,826
– liabilities to customers under investment contracts ....................................... 1,751 (940) (1,008)– HSBC’s long-term debt issued and related derivatives ................................. 6,679 2,812 (35)
– changes in own credit spread on long-term debt ....................................... 6,570 3,055 (388)– derivatives managed in conjunction with HSBC’s issued debt securities 4,413 2,476 242– other changes in fair value ......................................................................... (4,304) (2,719) 111
– other financial liabilities designated at fair value .......................................... (1,368) (395) (125)– derivatives managed in conjunction with other financial liabilities designated
at fair value ..................................................................................................... 39 (13) (1)
7,101 1,464 (1,169)
Net income from financial instruments designated at fair value ........................ 3,852 4,083 657
4 Gains arising from dilution of interests in associates
Gains arising from dilution of HSBC’s interests
HSBC’s interests after issue of new shares
HSBC’s interests before issue of new shares
US$m % % 2007 Industrial Bank1 ............................................................................................... 187 12.78 15.98 Ping An Insurance ........................................................................................... 485 16.78 19.90 Bank of Communications2 ............................................................................... 404 18.60 19.90 Financiera Independencia S.A. de C.V. .......................................................... 11 18.68 19.90 Vietnam Technological and Commercial Joint Stock Bank ........................... 5 14.44 15.00
Gains arising from dilution of interests in associates ..................................... 1,092
1 Investment held through Hang Seng Bank, a 62.14 per cent owned subsidiary of HSBC. The dilution gains therefore include a minority interest of US$71 million.
2 Subsequent to the dilution of its interests in Bank of Communications, HSBC increased its holding from 18.60 per cent to 19.01 per cent at 31 December 2007 (Note 21).
In 2007, certain HSBC associates issued new shares. HSBC did not subscribe and, as a result, its interests in the associates’ equity decreased. The assets of each associate substantially increased as a result of the new share issue and, as a consequence, HSBC’s share of the associates’ underlying net assets increased notwithstanding the reduction in the Group’s proportionate ownership interests. This increase is a gain arising from the dilution of the Group’s interests in the associates, and is presented in the income statement.

361
5 Net earned insurance premiums
Non-life insurance
Life insurance (non-linked)
Life insurance
(linked)
Investment contracts with DPF1 Total
US$m US$m US$m US$m US$m
2008 Gross written premiums ............................ 1,776 6,257 1,825 2,802 12,660 Movement in unearned premiums ............ 58 (171) – – (113)
Gross earned premiums ............................ 1,834 6,086 1,825 2,802 12,547
Gross written premiums ceded to reinsurers .......................................... (260) (878) (564) – (1,702)
Reinsurers’ share of movement in unearned premiums .......................... (3) 27 (19) – 5
Reinsurers’ share of gross earned premiums .............................................. (263) (851) (583) – (1,697)
Net earned insurance premiums ................ 1,571 5,235 1,242 2,802 10,850 2007 Gross written premiums ............................ 1,853 4,892 2,350 1,890 10,985 Movement in unearned premiums ............ 2 14 – – 16
Gross earned premiums ............................ 1,855 4,906 2,350 1,890 11,001
Gross written premiums ceded to reinsurers .......................................... (385) (357) (1,166) – (1,908)
Reinsurers’ share of movement in unearned premiums .......................... (22) – 5 – (17)
Reinsurers’ share of gross earned premiums .............................................. (407) (357) (1,161) – (1,925)
Net earned insurance premiums ................ 1,448 4,549 1,189 1,890 9,076
2006 Gross written premiums ............................ 1,824 3,640 848 8 6,320 Movement in unearned premiums ............ 122 14 (1) – 135
Gross earned premiums ............................ 1,946 3,654 847 8 6,455
Gross written premiums ceded to reinsurers .......................................... (451) (274) (14) – (739)
Reinsurers’ share of movement in unearned premiums .......................... (48) – – – (48)
Reinsurers’ share of gross earned premiums .............................................. (499) (274) (14) – (787)
Net earned insurance premiums ................ 1,447 3,380 833 8 5,668
1 Discretionary participation features.

H S B C H O L D I N G S P L C
Notes on the Financial Statements (continued) Notes 6, 7 and 8
362
6 Net insurance claims incurred and movement in liabilities to policyholders
Non-life insurance
Life insurance (non-linked)
Life insurance
(linked)
Investment contracts with DPF1 Total
US$m US$m US$m US$m US$m
2008 Claims, benefits and surrenders paid ........ 1,044 1,491 481 1,911 4,927Movement in liabilities ............................. – 3,989 458 (168) 4,279
Gross claims incurred and movement in liabilities ........................................... 1,044 5,480 939 1,743 9,206
Reinsurers’ share of claims, benefits and surrenders paid ............................... (158) (172) (44) – (374)
Reinsurers’ share of movement in liabilities ........................................... 75 (620) (1,398) – (1,943)
Reinsurers’ share of claims incurred and movement in liabilities ................... (83) (792) (1,442) – (2,317)
Net insurance claims incurred and movement in liabilities to policyholders ........................................ 961 4,688 (503) 1,743 6,889
2007 Claims, benefits and surrenders paid ........ 1,017 940 790 1,080 3,827Movement in liabilities ............................. 82 2,437 2,096 1,108 5,723
Gross claims incurred and movement in liabilities ........................................... 1,099 3,377 2,886 2,188 9,550
Reinsurers’ share of claims, benefits and surrenders paid ............................... (207) (169) (45) – (421)
Reinsurers’ share of movement in liabilities ........................................... 36 518 (1,075) – (521)
Reinsurers’ share of claims incurred and movement in liabilities .................. (171) 349 (1,120) – (942)
Net insurance claims incurred and movement in liabilities to policyholders ........................................ 928 3,726 1,766 2,188 8,608
2006 Claims, benefits and surrenders paid ........ 889 814 495 – 2,198Movement in liabilities ............................. 10 2,207 651 6 2,874
Gross claims incurred and movement in liabilities ........................................... 899 3,021 1,146 6 5,072
Reinsurers’ share of claims, benefits and surrenders paid ............................... (228) (154) (9) – (391)
Reinsurers’ share of movement in liabilities ........................................... 57 (54) 20 – 23
Reinsurers’ share of claims incurred and movement in liabilities .................. (171) (208) 11 – (368)
Net insurance claims incurred and movement in liabilities to policyholders ........................................ 728 2,813 1,157 6 4,704
1 Discretionary participation features.

363
7 Net operating income
Net operating income is stated after the following items of income, expense, gains and losses:
2008 2007 2006 US$m US$m US$m Income Interest recognised on impaired financial assets ............................................. 1,040 404 284 Fees earned on financial assets or liabilities not held for trading nor
designated at fair value, other than fees included in effective interest rate calculations on these types of assets and liabilities ............................. 14,511 15,140 11,182
Fees earned on trust and other fiduciary activities where HSBC holds or invests assets on behalf of its customers ................................................. 3,314 3,695 2,909
Income from listed investments ....................................................................... 11,425 10,944 7,304 Income from unlisted investments ................................................................... 11,359 10,429 9,192 Losses from the alleged fraud at Bernard L Madoff Investment
Securities LLC (charged against trading income) ....................................... (984) – –
Expense Interest on financial instruments, excluding interest on financial
liabilities held for trading or designated at fair value ................................. (45,525) (50,876) (38,158)Fees payable on financial assets or liabilities not held for trading nor
designated at fair value, other than fees included in effective interest rate calculations on these types of assets and liabilities ................ (1,866) (1,923) (1,826)
Fees payable relating to trust and other fiduciary activities where HSBC holds or invests assets on behalf of its customers ........................... (159) (163) (103)
Gains/(losses) Gain on disposal or settlement of loans and advances .................................... 94 64 24 Impairment of available-for-sale equity securities .......................................... (1,042) (42) – Gains on disposal of property, plant and equipment, intangible assets
and non-financial investments ..................................................................... 465 213 781 Gain on repurchase of 8 Canada Square ......................................................... 416 – –
Loan impairment charges and other credit risk provisions ...................... (24,937) (17,242) (10,573)Net impairment charge on loans and advances ........................................... (24,131) (17,177) (10,547)Impairment of available-for-sale debt securities ......................................... (737) (44) (21)Impairment in respect of other credit risk provisions ................................. (69) (21) (5)
8 Employee compensation and benefits
2008 2007 2006 US$m US$m US$m
Wages and salaries ........................................................................................... 18,169 18,535 16,186 Social security costs ......................................................................................... 1,625 1,587 1,194 Post-employment benefits ............................................................................... 998 1,212 1,120
20,792 21,334 18,500
The average number of persons employed by HSBC during the year was as follows:
2008 2007 2006
Europe .............................................................................................................. 87,864 86,918 84,170 Hong Kong ....................................................................................................... 30,030 27,702 27,328 Rest of Asia-Pacific ......................................................................................... 96,155 83,103 68,182 North America ................................................................................................. 53,090 58,117 57,654 Latin America .................................................................................................. 64,319 66,442 58,863
Total ................................................................................................................. 331,458 322,282 296,197

H S B C H O L D I N G S P L C
Notes on the Financial Statements (continued) Note 8
364
Post-employment benefit plans
Income statement charge
2008 2007 2006 US$m US$m US$m
Defined benefit pension plans ......................................................................... 477 694 602 – HSBC Bank (UK) Pension Scheme ......................................................... 255 490 342– Other plans ............................................................................................... 222 204 260
Defined contribution plans .............................................................................. 508 485 456
985 1,179 1,058 Defined benefit healthcare plans ..................................................................... 13 33 62
998 1,212 1,120
Net liabilities recognised on balance sheet in respect of defined benefit plans
2008 2007 US$m US$m
Defined benefit pension plans ........................................................................................................... 3,154 1,968 – HSBC Bank (UK) Pension Scheme ........................................................................................... 392 808– Other plans ................................................................................................................................. 2,762 1,160
Defined benefit healthcare plan ......................................................................................................... 734 925
3,888 2,893
HSBC pension plans
HSBC operates some 205 pension plans throughout the world, covering 86 per cent of HSBC’s employees, with a total pension cost of US$985 million (2007: US$1,179 million; 2006: US$1,058 million), of which US$678 million (2007: US$626 million; 2006: US$668 million) relates to plans outside the UK.
Progressively, HSBC has been moving to defined contribution plans for all new employees. The pension cost for defined contribution plans, which cover 50 per cent of HSBC’s employees, was US$508 million (2007: US$485 million; 2006: US$456 million).
Both HSBC’s and, where relevant and appropriate, the trustees’ long-term investment objectives for defined benefit plans are:
• to limit the risk of the assets failing to meet the liabilities of the plans over the long-term; and
• to maximise returns consistent with an acceptable level of risk so as to control the long-term costs of the defined benefit plans.
Both HSBC and, where relevant and appropriate, the trustees, consider that the investment policy should be consistent with meeting their mutual overall long-term investment objectives. In pursuit of these long-term objectives, a benchmark is established for the allocation of the defined benefit plan assets between asset classes. In addition, each permitted asset class has its own benchmarks, such as stock market or property valuation indices and desired levels of out-performance where relevant. This is intended to be reviewed at least triennially within 18 months of the date at which the actuarial valuation is made, or more frequently if circumstances or local legislation so require. The process generally involves an extensive asset and liability review.
Most of the Group’s defined benefit plans, which cover 36 per cent of HSBC’s employees, are funded plans with assets which, in the case of most of the larger plans, are held in trust or similar funds separate from HSBC. The plans are reviewed at least annually or in accordance with local practice and regulations by qualified actuaries. The actuarial assumptions used to calculate the defined benefit obligations and related current service costs vary according to the economic conditions of the countries in which they are situated.
The largest plan exists in the UK, where the HSBC Bank (UK) Pension Scheme covers employees of HSBC Bank plc and certain other employees of HSBC. This plan comprises a funded defined benefit plan (‘the principal plan’) which is closed to new entrants, and a defined contribution plan which was established on 1 July 1996 for new employees.
The principal plan holds a diversified portfolio of investments to meet future cash flow liabilities arising from accrued benefits as they fall due to be paid. The Trustee of the principal plan is required to produce a written

365
Statement of Investment Principles (‘SIP’). The SIP sets out the principles governing how decisions about investments are made.
In 2006, HSBC and the Trustee of the principal plan agreed to change the investment strategy in order to reduce the investment risk. This involved switching from a largely equity-based strategy to a strategy largely based on holding bonds together with a more diverse range of investments. The principal plan committed to undertake a programme including entering into swap arrangements whereby the principal plan is committed to making LIBOR-related interest payments in exchange for cash flows paid into the plan, based on a projection of the future benefit payments from the principal plan. The asset allocation for this strategy is:
%
Equities ................................................................................................................................................................................ 15.0 Bonds ................................................................................................................................................................................... 50.0 Alternative assets1 ................................................................................................................................................................ 10.0 Property ................................................................................................................................................................................ 10.0 Cash ..................................................................................................................................................................................... 15.0
100.0
1 Alternative assets include emerging market bonds, loans, and infrastructure assets.
At 31 December 2008, this strategy was substantially in place and details of the swap arrangements are included in Note 43.
The latest actuarial investigation of the principal plan was made at 31 December 2005. At that date, the market value of the HSBC Bank (UK) Pension Scheme’s assets was US$18,072 million (including assets relating to the defined benefit plan, the defined contribution plan, and additional voluntary contributions). The market value of the plan assets represented 89 per cent of the amount expected to be required, on the basis of the assumptions adopted, to provide the benefits accrued to members after allowing for expected future increases in earnings, and the resulting deficit amounted to US$2,065 million. The method adopted for this investigation was the projected unit method.
The expected cash flows from the plan were projected by reference to the Retail Price Index (‘RPI’) swap break-even curve at 31 December 2005. Salary increases were assumed to be 1 per cent per annum above RPI and inflationary pension increases, subject to a minimum of zero per cent and a maximum of 5 per cent, were assumed to be in line with RPI. The projected cash flows were discounted at the LIBOR swap curve at 31 December 2005 plus a margin for the expected return on the investment strategy of 110 basis points per annum. The mortality experience of the plan’s pensioners over the three year period since the previous valuation was analysed and the mortality assumption set on the basis of this with allowances for medium cohort improvements on the PA92 series of tables from the valuation date.
In anticipation of the results of the 2005 investigation, on 22 December 2005 HSBC Bank plc made an additional contribution of US$1,746 million to the principal plan in order to reduce the deficit of the plan. Following receipt of the valuation results, HSBC agreed with the Trustee to meet a schedule of additional future funding payments, as set out below:
US$m1 £m
2007 ...................................................................................................................................................... 587 300 2012 ...................................................................................................................................................... 678 465 2013 ...................................................................................................................................................... 678 465 2014 ...................................................................................................................................................... 678 465
1 The payment schedule has been agreed with the Trustee in pounds sterling and the equivalent US dollar amounts are shown at the exchange rate effective as at 31 December 2008. The amount for 2007 was paid in March 2007, and is shown above at the exchange rate at that time.
HSBC considers that the contributions set out above are sufficient to meet the deficit as at 31 December 2005 over the agreed period.
HSBC Bank plc also decided to make ongoing contributions to the principal plan in respect of the accrual of benefits of defined benefit section members at the rate of 36 per cent of pensionable salaries from 1 January 2007, until the completion of the next actuarial valuation, due as at 31 December 2008. During 2006 HSBC paid contributions at the rate of 20 per cent of pensionable salaries. A further 2 per cent of pensionable salaries is being paid over the period 1 January 2007 to 31 December 2014 to make good the difference in contributions during 2006.

H S B C H O L D I N G S P L C
Notes on the Financial Statements (continued) Note 8
366
The Trustee and the bank will monitor progress towards closing the deficit and reassess the deficit in the light of the triennial valuation that is currently being performed as at 31 December 2008. This valuation process is currently underway and is due to be completed no later than 31 March 2010. Future funding commitments will be determined on conclusion of the actuarial valuation.
As part of the 31 December 2005 valuation, calculations were also carried out as to the amount of assets that might be needed to meet the liabilities if the plan was discontinued and the members’ benefits bought out with an insurance company (although in practice this may not be possible for a plan of this size) or the Trustee continued to run the plan without the support of HSBC. The amount required under this approach was estimated at 31 December 2005 to be US$26,700 million. In estimating the solvency position for this purpose, a more prudent assumption about future mortality was made than for the assessment of the ongoing position and it was assumed that the Trustee would alter the investment strategy to be an appropriately matched portfolio of cash and interest and inflation swaps. An explicit allowance for expenses was also included.
The benefits payable from the defined benefit plan are expected to be as shown in the chart below:
Benefit payments (US$m)
0
200
400
600
800
1,000
1,200
1,400
1,600
2009 2019 2029 2039 2049 2059 2069 2079 2089 2099
In Hong Kong, the HSBC Group Hong Kong Local Staff Retirement Benefit Scheme covers employees of The Hongkong and Shanghai Banking Corporation and certain other employees of HSBC Group. The scheme comprises a funded defined benefit scheme (which provides a lump sum on retirement but is now closed to new members) and a defined contribution scheme. The latter was established on 1 January 1999 for new employees. The latest valuation of the defined benefit scheme was made at 31 December 2007. At that valuation date, the market value of the defined benefit scheme’s assets was US$1,183 million. On an ongoing basis, the actuarial value of the scheme’s assets represented 119 per cent of the actuarial present value of the benefits accrued to members, after allowing for expected future increases in salaries, and the resulting surplus amounted to US$192 million. On a wind-up basis, the scheme’s assets represents 125 per cent of the members’ vested benefits, based on current salaries, and the resulting surplus amounted to US$237 million. The attained age method has been adopted for the valuation and the major assumptions used in this valuation were a discount rate of 6 per cent per annum and long-term salary increases of 5 per cent per annum.
The HSBC North America (U.S.) Retirement Income Plan covers employees of HSBC Bank USA, HSBC Finance, and certain other employees of HSBC USA. It comprises a final average pay plan (now closed to new participants) and a cash balance plan. All new employees participate in the cash balance plan. The most recent actuarial valuation of the plan was made at 1 January 2008. At that date, the actuarial value of the plan's assets was equal to market value of US$2,616 million. The assets represented 105 per cent of the benefits accrued to members as valued under the provisions of the Pension Protection Act of 2006 that was effective for the plan year beginning 1 January 2008.The resulting surplus amounted to US$122 million. The method employed for this valuation was the projected unit method and the discount rate was determined using a full yield curve method, which resulted in an effective interest rate of 6.4 per cent per annum.
The HSBC Bank (UK) Pension Scheme, The HSBC Group Hong Kong Local Staff Retirement Benefit Scheme, and the HSBC North America (U.S.) Retirement Income Plan cover 35 per cent of HSBC’s employees.

367
HSBC healthcare benefits plans
HSBC also provides post-employment healthcare benefits under plans in the UK, the US, Canada, Mexico, France and Brazil, the majority of which are unfunded. Post-employment healthcare benefits plans are accounted for in the same manner as defined benefit pension plans. The plans are reviewed at least annually or in accordance with local practice and regulations by qualified actuaries. The actuarial assumptions used to calculate the defined benefit obligation and related current service cost vary according to the economic conditions of the countries in which they are situated. Total healthcare cost was US$13 million (2007: US$33 million; 2006: US$62 million).
Post-employment defined benefit plans’ principal actuarial financial assumptions
The principal actuarial financial assumptions used to calculate the Group’s obligations under its defined benefit pension and post-employment healthcare plans at 31 December 2008, were as follows. These assumptions will also form the basis for measuring periodic costs under the plans in 2009:
Healthcare cost trend
Discount rate
Inflation rate
Rate of increase for pensions1
Rate of pay increase
Initial rate
Ultimate rate
Year of ultimate rate
% % % % % %
UK ...................................... 6.50 2.90 3.00 3.40 6.90 6.90 n/a Hong Kong ......................... 1.19 n/a n/a 5.00 n/a n/a n/a US ...................................... 6.05 2.50 n/a 3.50 8.90 5.00 2018 Jersey .................................. 6.50 2.90 2.90 4.65 n/a n/a n/a Mexico ............................... 8.10 3.50 2.00 4.50 6.75 6.75 n/a Brazil .................................. 10.75 4.50 4.50 5.50 10.00 5.50 2018 France ................................. 5.75 2.00 2.00 3.00 n/a n/a n/a Canada ............................... 7.19 2.50 n/a 3.85 8.20 4.90 2012 Switzerland ........................ 2.60 1.50 n/a 2.39 n/a n/a n/a Germany ............................. 5.75 2.00 2.00 3.00 n/a n/a n/a
1 Rate of increase for pensions in payment and deferred pension.
The principal actuarial financial assumptions used to calculate the Group’s obligations under its defined benefit pension and post-employment healthcare plans at 31 December 2007, were as follows. These assumptions also formed the basis for measuring periodic costs under the plans in 2008:
Healthcare cost trend
Discount rate
Inflation rate
Rate of increase for pensions1
Rate of pay increase
Initial rate
Ultimate rate
Year of ultimate rate
% % % % % %
UK .......................................... 5.80 3.30 3.30 4.30 7.30 7.30 n/a Hong Kong ............................. 3.45 n/a n/a 5.02 n/a n/a n/a US .......................................... 6.55 2.50 n/a 3.75 9.60 5.00 2014 Jersey ...................................... 5.80 3.30 3.30 5.05 n/a n/a n/a Mexico ................................... 7.88 3.50 2.00 4.50 6.00 6.00 n/a Brazil ...................................... 10.75 4.50 4.50 4.50 10.50 5.50 2017 France ..................................... 5.50 2.00 2.00 3.00 6.00 6.00 n/a Canada ................................... 5.43 2.50 n/a 3.86 9.00 4.90 2012 Switzerland ............................ 3.30 1.50 n/a 2.38 n/a n/a n/a Germany ................................. 5.50 2.00 2.00 3.00 n/a n/a n/a
1 Rate of increase for pensions in payment and deferred pension.

H S B C H O L D I N G S P L C
Notes on the Financial Statements (continued) Note 8
368
The principal actuarial financial assumptions used to calculate the Group’s obligations under its defined benefit pension and post-employment healthcare plans at 31 December 2006, were as follows. These assumptions also formed the basis for measuring periodic costs under the plans in 2007:
Healthcare cost trend
Discount rate
Inflation rate
Rate of increase for pensions1
Rate of pay increase
Initial rate
Ultimate rate
Year of ultimate rate
% % % % % %
UK .......................................... 5.10 3.00 3.00 4.00 7.00 7.00 n/a Hong Kong ............................ 3.75 n/a n/a 3.00 n/a n/a n/a US .......................................... 5.90 2.50 n/a 3.75 10.50 5.00 2014 Jersey ..................................... 5.10 3.00 3.00 4.75 n/a n/a n/a Mexico ................................... 8.00 3.50 2.00 4.00 6.75 6.75 n/a Brazil ...................................... 10.75 4.50 4.50 4.50 11.00 5.50 2016 France .................................... 4.50 2.00 2.00 3.00 6.00 6.00 n/a Canada ................................... 5.19 2.50 n/a 3.47 9.90 4.90 2012 Switzerland ............................ 2.25 1.50 n/a 2.25 n/a n/a n/a Germany ................................. 4.50 2.00 2.00 3.00 n/a n/a n/a
1 Rate of increase for pensions in payment and deferred pension.
HSBC determines the discount rates to be applied to its obligations in consultation with the plans’ local actuaries, on the basis of current average yields of high quality (AA rated or equivalent) debt instruments, with maturities consistent with those of the defined benefit obligations. In countries where there is no deep market in corporate bonds, government bond yields have been used. The yield curve has been extrapolated where the term of the liabilities is longer than the duration of available bonds and the discount rate used then takes into account the term of the liabilities and the shape of the yield curve.
When determining the discount rate with reference to a bond index, an appropriate index for the specific region has been used. The expected return on plan assets represents the best estimate of long-term future asset returns, which takes into account historical market returns plus additional factors such as the current rate of inflation and interest rates.
Mortality assumptions are increasingly significant in measuring the Group’s obligations under its defined benefit pension and post-employment healthcare plans, particularly given the maturity of the plans. The mortality tables and average life expectancy at 65 used at 31 December 2008 were as follows:
Mortality table
Life expectancy at age 65 for a male
member currently:
Life expectancy at age 65 for a female member currently:
Aged 65 Aged 45 Aged 65 Aged 45
UK .......................................................................... PA921 20.8 22.8 24.1 26.2 Hong Kong ............................................................ n/a n/a n/a n/a n/a US .......................................................................... RP 2000 fully
generational 19.1 20.6 21.1 22.0 Jersey ..................................................................... 90% of PNA002 23.0 25.0 25.4 27.3 Mexico ................................................................... EMSSA-97, AA
generational scale from RP 2000 series 18.3
19.8 21.0 21.9 Brazil ...................................................................... RP 2000 fully
generational 19.1
20.6 21.1 22.0 France .................................................................... TG 05 23.1 25.9 26.6 29.4 Canada pension plans ............................................ Between UP94 C2015
and UP94 C2027 18.5
and 19.4 18.5
and 19.4 21.1
and 21.6 21.1
and 21.6 Canada healthcare plan .......................................... UP94 C2025 19.3 19.3 21.5 21.5 Switzerland ............................................................ BVG 20053 17.9 17.9 21.0 21.0 Germany ................................................................. Heubeck 2005 G 18.0 20.7 22.1 24.7
1 PA92 with standard improvements to 2005 and medium cohort with 1 per cent minimum improvement thereafter. 2 PNA00 year of birth and medium cohort with 1 per cent improvement thereafter. 3 3.5 per cent load, additional 5.0 per cent load for future mortality improvements.

369
The mortality tables and average life expectancy at 65 used at 31 December 2007 were as follows:
Mortality table
Life expectancy at age 65 for a male member currently:
Life expectancy at age 65 for a female member currently:
Aged 65 Aged 45 Aged 65 Aged 45
UK .......................................................................... PA921 20.4 21.7 23.4 24.6 Hong Kong ............................................................. n/a n/a n/a n/a n/a US .......................................................................... RP 2000 fully
generational 19.1 20.6 21.1 22.0 Jersey ...................................................................... PA922 21.9 23.0 24.8 25.8 Mexico ................................................................... EMSSA-97 16.5 16.5 19.9 19.9 Brazil ...................................................................... RP 2000 fully
generational 19.1
20.6 21.1 22.0 France ..................................................................... TG 05 22.9 25.7 26.4 29.3 Canada pension plans ............................................ Between UP94 C2015
and UP94 C2027 19.0 and 20.0
19.0 and 20.0
21.6 and 22.1
21.6 and 22.1
Canada healthcare plan .......................................... UP94 C2025 19.8 19.8 22.0 22.0 Switzerland ............................................................ BVG 2005 (3% load) 17.9 17.9 21.0 21.0 Germany ................................................................. Heubeck 2005 G 18.1 20.8 22.2 24.9
1 PA92 with standard improvements to 2005 and medium cohort improvements thereafter. 2 PA92 year of birth with medium cohort improvements.
Actuarial assumption sensitivities
The discount rate is sensitive to changes in market conditions arising during the reporting period. The mortality rates used are sensitive to experience from the plan member profile. The following table shows the effect of changes in these and the other key assumptions on the principal plan:
HSBC Bank (UK) Pension Scheme 2008 2007 US$m US$m
Discount rate Change in pension obligation at year end from a 25bps increase ..................................................... (559) (989)Change in pension obligation at year end from a 25bps decrease .................................................... 595 1,063 Change in 2009 pension cost from a 25bps increase ........................................................................ (9) (20)Change in 2009 pension cost from a 25bps decrease ........................................................................ 10 20 Rate of inflation Change in pension obligation at year end from a 25bps increase ..................................................... 525 1,063 Change in pension obligation at year end from a 25bps decrease .................................................... (493) (989)Change in 2009 pension cost from a 25bps increase ........................................................................ 45 82 Change in 2009 pension cost from a 25bps decrease ........................................................................ (41) (76) Rate of increase for pensions in payment and deferred pensions Change in pension obligation at year end from a 25bps increase ..................................................... 349 823 Change in pension obligation at year end from a 25bps decrease .................................................... (328) (758)Change in 2009 pension cost from a 25bps increase ........................................................................ 29 60 Change in 2009 pension cost from a 25bps decrease ........................................................................ (23) (56) Rate of pay increase Change in pension obligation at year end from a 25bps increase ..................................................... 172 240 Change in pension obligation at year end from a 25bps decrease .................................................... (168) (231)Change in 2009 pension cost from a 25bps increase ........................................................................ 16 22 Change in 2009 pension cost from a 25bps decrease ........................................................................ (15) (20) Investment return Change in 2009 pension cost from a 25bps increase ........................................................................ 36 56 Change in 2009 pension cost from a 25bps decrease ........................................................................ (36) (56) Mortality Change in pension obligation from each additional year of longevity assumed .............................. 365 683

H S B C H O L D I N G S P L C
Notes on the Financial Statements (continued) Note 8
370
The following table shows the effect of changes in the discount rate and in mortality rates on plans other than the principal plan: Other plans 2008 2007 US$m US$m
Change in defined benefit obligation at year end from a 25bps increase in discount rate ............... (255) (312)Change in 2009 defined benefit charge from a 25bps increase in discount rate .............................. (4) (8)Increase in defined benefit obligation from each additional year of longevity assumed ................. 91 137
Defined benefit pension plans
The calculation of the net liability under the Group’s defined benefit pension plans is set out below together with the expected rates of return and plan assets used to measure the net defined benefit pension costs in each subsequent year.
HSBC Bank (UK) Pension Scheme 2008 2007
Expected rates of return
Value
Expected rates of return Value
% US$m % US$m
Fair value of plan assets ............................................... 14,865 22,704 Equities ..................................................................... 8.1 2,242 8.3 4,580Bonds ........................................................................ 5.7 10,999 6.1 15,341Property .................................................................... 6.9 1,184 7.3 1,878Other ......................................................................... 5.7 440 5.1 905
Defined benefit obligation ............................................ (15,257) (23,512)Present value of funded obligations ......................... (15,257) (23,512)Present value of unfunded obligations ..................... – –
Net liability ................................................................... (392) (808)
Other plans 2008 2007
Expected rates of return1
Value
Expected rates of return1 Value
% US$m % US$m
Fair value of plan assets ............................................... 6,024 7,768 Equities ..................................................................... 8.3 1,856 8.3 3,439Bonds ........................................................................ 5.0 3,261 5.4 3,452Property .................................................................... 6.3 87 7.3 111Other ......................................................................... 3.8 820 5.7 766
Defined benefit obligation ............................................ (8,787) (8,873)Present value of funded obligations ......................... (8,271) (8,453)Present value of unfunded obligations ..................... (516) (420)
Effect of limit on plan surpluses ................................... (9) (55)Unrecognised past service cost ..................................... 10 –
Net liability ................................................................... (2,762) (1,160)
1 The expected rates of return are weighted on the basis of the fair value of the plan assets.
Plan assets include US$52 million (2007: US$86 million) of equities issued by HSBC and US$2,206 million (2007: US$572 million) of other assets issued by HSBC. The fair value of plan assets includes derivatives entered into with the HSBC Bank (UK) Pension Scheme with a positive fair value of US$1,779 million at 31 December 2008 (2007: US$248 million positive fair value) and US$388 million positive fair value (2007: US$63 million positive fair value) in respect of the HSBC International Staff Retirement Benefits Scheme. Further details of these swap arrangements are included in Note 43.

371
Changes in the present value of defined benefit obligations
HSBC Bank (UK) Pension Scheme Other plans 2008 2007 2008 2007
US$m US$m US$m US$m
At 1 January .................................................................. 23,512 24,332 8,873 7,916 Current service cost ...................................................... 387 454 357 347 Interest cost ................................................................... 1,227 1,247 466 398 Contributions by employees ......................................... 2 – 40 37 Actuarial (gains)/losses ................................................. (3,032) (2,395) 358 475 Benefits paid ................................................................. (873) (632) (596) (529)Past service cost – vested immediately ......................... – – 9 6 Past service cost – unvested benefits ............................ – – 10 – Disposals ....................................................................... – – (44) – Reduction in liabilities resulting from curtailments ..... – – (20) (63)Liabilities extinguished on settlements ........................ – – (81) (16)Exchange differences .................................................... (5,966) 506 (585) 302
At 31 December ............................................................ 15,257 23,512 8,787 8,873
Changes in the fair value of plan assets
HSBC Bank (UK) Pension Scheme Other plans 2008 2007 2008 2007
US$m US$m US$m US$m
At 1 January .................................................................. 22,704 20,587 7,768 7,116 Expected return on plan assets ..................................... 1,359 1,211 549 486 Contributions by HSBC ................................................ 462 1,058 238 211
– normal .................................................................... 462 471 223 199– special .................................................................... – 587 15 12
Contributions by employees ......................................... 2 – 40 37 Experience gains/(losses) ............................................. (2,861) 29 (1,452) 157 Benefits paid ................................................................. (873) (632) (576) (467)Assets distributed on settlements .................................. – – (40) (17)Exchange differences .................................................... (5,928) 451 (503) 245
At 31 December ............................................................ 14,865 22,704 6,024 7,768
The actual return on plan assets for the year ended 31 December 2008 was a negative return of US$2,405 million (2007: positive US$1,883 million). HSBC expects to make US$588 million of contributions to defined benefit pension plans during 2009. Benefits expected to be paid from the plans to retirees over each of the next five years, and in aggregate for the five years thereafter, are:
2009 2010 2011 2012 2013 2014-2018 US$m US$m US$m US$m US$m US$m
HSBC Bank (UK) Pension Scheme ..................... 729 766 804 845 887 5,149 Other significant plans .......................................... 435 423 455 489 522 3,093
Total expense recognised in the income statement in ‘Employee compensation and benefits’
HSBC Bank (UK) Pension Scheme Other plans 2008 2007 2006 2008 2007 2006
US$m US$m US$m US$m US$m US$m
Current service cost .................... 387 454 456 357 347 304 Interest cost ................................. 1,227 1,247 1,055 466 398 366 Expected return on plan assets ... (1,359) (1,211) (1,169) (549) (486) (421)Past service cost .......................... – – – 9 7 11 Gains on curtailments ................. – – – (20) (63) – (Gains)/losses on settlements ...... – – – (41) 1 –
Total expense .............................. 255 490 342 222 204 260

H S B C H O L D I N G S P L C
Notes on the Financial Statements (continued) Note 8
372
Summary
HSBC Bank (UK) Pension Scheme 2008 2007 2006 2005 2004
US$m US$m US$m US$m US$m
Defined benefit obligation ..................................... (15,257) (23,512) (24,332) (20,587) (19,998)Fair value of plan assets ........................................ 14,865 22,704 20,587 17,396 15,105
Net deficit .............................................................. (392) (808) (3,745) (3,191) (4,883) Experience gains/(losses) on plan liabilities ......... (49) (64) 540 70 401 Experience gains/(losses) on plan assets ............... (2,861) 29 – 1,623 506 Gains/(losses) from changes in actuarial assumptions
............................................................................ 3,081 2,459 (570) (2,038)
(1,357)
Total net actuarial gains/(losses) ........................... 171 2,424 (30) (345) (450)
Other plans 2008 2007 2006 2005 2004
US$m US$m US$m US$m US$m
Defined benefit obligation ..................................... (8,787) (8,873) (7,916) (7,102) (6,501)Fair value of plan assets ........................................ 6,024 7,768 7,116 6,356 5,823
Net deficit .............................................................. (2,763) (1,105) (800) (746) (678) Experience losses on plan liabilities ...................... (52) (354) (167) (113) (42)Experience gains on plan assets ............................ (1,452) 157 203 78 3 Losses from changes in actuarial assumptions ...... (306) (121) (44) (393) (243)
Total net actuarial gains/(losses) ........................... (1,810) (318) (8) (428) (282)
Actuarial gains and losses represent experience adjustments on plan assets and liabilities as well as adjustments arising from changes in actuarial assumptions. Total cumulative actuarial losses recognised in equity at 31 December 2008 were US$1,076 million (2007: gains of US$563 million).
The total effect of the limit on plan surpluses recognised within actuarial losses in equity during 2008 was a US$41 million gain excluding exchange differences of US$5 million (2007: US$42 million loss excluding exchange differences of US$4 million).
Defined benefit healthcare plans
2008 2007 Expected rates of return1 Value
Expected rates of return1 Value
% US$m % US$m
Fair value of plan assets ............................................... 128 146 Equities ..................................................................... 11.6 39 13.0 44 Bonds ........................................................................ 8.0 89 7.9 102
Defined benefit obligation ............................................ (839) (1,038)Present value of funded obligations ......................... (172) (191)Present value of unfunded obligations ..................... (667) (847)
Unrecognised past service cost ..................................... (23) (33)
Net liability ................................................................... (734) (925)
1 The expected rates of return are weighted on the basis of the fair value of the plan assets.

373
Changes in the present value of defined benefit obligations
2008 2007 US$m US$m
At 1 January ....................................................................................................................................... 1,038 1,106 Current service cost ........................................................................................................................... 19 25 Interest cost ........................................................................................................................................ 65 67 Contributions by employees .............................................................................................................. 2 2 Actuarial (gains)/losses ...................................................................................................................... 2 (109)Benefits paid ...................................................................................................................................... (76) (54)Past service cost:
– vested immediately ..................................................................................................................... – (2)– unvested benefits ........................................................................................................................ – (2)
Reduction in liabilities resulting from curtailments .......................................................................... (31) (42)Liabilities extinguished on settlements ............................................................................................. (38) (2)Exchange differences ......................................................................................................................... (142) 49
At 31 December ................................................................................................................................. 839 1,038
Changes in the fair value of plan assets
2008 2007 US$m US$m
At 1 January ....................................................................................................................................... 146 133 Expected return on plan assets .......................................................................................................... 12 13 Contributions by HSBC ..................................................................................................................... 19 19 Experience losses ............................................................................................................................... (14) (6)Benefits paid ...................................................................................................................................... (9) (11)Assets distributed on settlements........................................................................................................ (12) (2)Exchange differences ......................................................................................................................... (14) –
At 31 December ................................................................................................................................. 128 146
The actual return on plan assets for the year ended 31 December 2008 was a negative return of US$2 million (2007: positive US$7 million).
HSBC expects to make US$4 million (2007: US$18 million) of contributions to post-employment healthcare benefit plans during 2009. Benefits expected to be paid from the plans to retirees over each of the next five years, and in aggregate for the five years thereafter, are:
2009 2010 2011 2012 2013 2014-2018 US$m US$m US$m US$m US$m US$m
Significant plans ................................................. 44 48 50 52 54 294
Total expense recognised in the income statement in ‘Employee compensation and benefits’
2008 2007 2006 US$m US$m US$m
Current service cost ......................................................................................... 19 25 19 Interest cost ...................................................................................................... 65 67 64 Expected return on plan assets ........................................................................ (12) (13) (11)Past service cost ............................................................................................... (2) (4) (1)Losses on curtailments ..................................................................................... (31) (42) (8)Losses on settlements ...................................................................................... (26) – (1)
Total expense ................................................................................................... 13 33 62

H S B C H O L D I N G S P L C
Notes on the Financial Statements (continued) Notes 8 and 9
374
Summary
2008 2007 2006 2005 2004 US$m US$m US$m US$m US$m
Defined benefit obligation ..................................... (839) (1,038) (1,106) (1,004) (982) Fair value of plan assets ........................................ 128 146 133 107 79
Net deficit .............................................................. (711) (892) (973) (897) (903) Experience gains/(losses) on plan liabilities ......... (34) 15 (12) 19 (15) Experience gains/(losses) on plan assets ............... (14) (6) (1) 1 – Gains/(losses) from changes in actuarial assumptions
............................................................................ 32 94 (25) (63) 20
Total net actuarial gains/(losses) ........................... (16) 103 (38) (43) 5
Actuarial gains and losses represent experience adjustments on plan assets and liabilities as well as adjustments arising from changes in actuarial assumptions. Total cumulative net actuarial gains recognised in equity at 31 December 2008 were US$11 million (2007: gains of US$27 million).
The actuarial assumptions of the healthcare cost trend rates have a significant effect on the amounts recognised. A one percentage point change in assumed healthcare cost trend rates would have the following effects on amounts recognised in 2008:
2008 2007 1% increase 1% decrease 1% increase 1% decrease US$m US$m US$m US$m
Increase/(decrease) of the aggregate of the current service cost and interest cost .................................... 9 (7) 14 (10)
Increase/(decrease) of defined benefit obligation ........ 77 (62) 110 (100)
HSBC Holdings
Employee compensation and benefit expense in respect of HSBC Holdings’ employees in 2008 amounted to US$218 million (2007: US$257 million). The average number of persons employed by HSBC Holdings during 2008 was 730 (2007: 595).
Employees of HSBC Holdings who are members of defined benefit pension plans are principally members of either the HSBC Bank (UK) Pension Scheme or the HSBC International Staff Retirement Benefits Scheme. HSBC Holdings pays contributions to plans in accordance with schedules determined by the Trustees following consultation with qualified actuaries.
Directors’ emoluments
The aggregate emoluments of the Directors of HSBC Holdings, computed in accordance with Part I of Schedule 6 of the Companies Act 1985, were:
2008 2007 2006 US$000 US$000 US$000
Fees .................................................................................................................. 2,529 2,626 2,660 Salaries and other emoluments ........................................................................ 11,584 7,929 7,774 Bonuses ............................................................................................................ – 8,938 10,705
14,113 19,493 21,139
Gains on the exercise of share options ............................................................ 23 13 3 Vesting of Long-Term Incentive awards ......................................................... 7,147 4,563 18,975
In addition, there were payments under retirement benefit agreements with former Directors of US$1,139,968 (2007: US$1,183,960). The provision at 31 December 2008 in respect of unfunded pension obligations to former Directors amounted to US$15,164,791 (2007: US$18,491,117).
During the year, aggregate contributions to pension schemes in respect of Directors were US$664,174 (2007: US$545,854 which included US$460,564 arising from a Director’s waiver of bonus).

375
Discretionary bonuses for Directors are based on a combination of individual and corporate performance and are determined by the Remuneration Committee. Details of Directors’ remuneration, share options and conditional awards under the Restricted Share Plan 2000 and the HSBC Share Plan are included in the ‘Directors’ Remuneration Report’ on pages 315 to 328.
9 Auditors’ remuneration
Auditors’ remuneration in relation to the statutory audit amounted to US$54.9 million (2007: US$52.3 million; 2006: US$44.7 million). The following fees were payable by HSBC to the Group’s principal auditor, KPMG Audit Plc and its associates (together ‘KPMG’):
2008 2007 2006 US$m US$m US$m
Audit fees for HSBC Holdings’ statutory audit1 ............................................. 2.1 3.0 2.7 – fees relating to current year ..................................................................... 2.5 3.0 2.7– fees relating to prior year ........................................................................ (0.4) – –
Fees payable to KPMG for other services provided to HSBC ........................ 88.3 79.1 64.1 Audit-related services:
– audit of HSBC’s subsidiaries, pursuant to legislation2 ...................... 48.6 45.2 40.4– other services pursuant to legislation3 ................................................ 26.5 19.4 15.4
Tax services4 ................................................................................................ 3.1 2.9 2.0Other services:
– services relating to information technology5 ...................................... 0.6 0.4 0.6– services related to corporate finance transactions6 ............................. 1.4 1.8 1.6– all other services7 ................................................................................ 8.1 9.4 4.1
Total fees payable ............................................................................................ 90.4 82.1 66.8
1 Fees payable to KPMG Audit Plc for the statutory audit of the consolidated financial statements of HSBC and the separate financial statements of HSBC Holdings. They exclude amounts payable for the statutory audit of HSBC Holdings’ subsidiaries which have been included in ‘Fees payable to KPMG for other services provided to HSBC’.
2 Including fees payable to KPMG for the statutory audit of HSBC’s subsidiaries. 3 Including services for assurance and other services that relate to statutory and regulatory filings, including comfort letters and interim
reviews. Other services pursuant to legislation included no fees paid to KPMG in respect of work relating to preparation for reporting under section 404 of the Sarbanes-Oxley Act (2007: US$1.6 million; 2006: US$2.2 million). Other accounting firms were paid a total of US$1.2 million (2007: US$2.5 million; 2006: US$8.3 million) for work on this project.
4 Including tax compliance services and tax advisory services. 5 Including advice on IT security and business continuity and performing agreed-upon IT testing procedures. 6 Including fees payable to KPMG for transaction-related work, including US debt issuances. 7 Including other assurance and advisory services such as translation services, ad-hoc accounting advice and review of financial models.
No fees were payable by HSBC to KPMG for the following types of services: internal audit services, valuation and actuarial services, services related to litigation, and services related to recruitment and remuneration. The following fees were payable by HSBC’s associated pension schemes to KPMG:
2008 2007 2006 US$000 US$000 US$000
Audit fees ......................................................................................................... 720 612 581 Tax services ..................................................................................................... 73 14 23 All other services ............................................................................................. – 36 23
Total fees payable ............................................................................................ 793 662 627
No fees were payable by HSBC’s associated pension schemes to KPMG for the following types of services: other services pursuant to legislation, services relating to information technology, internal audit services, valuation and actuarial services, services related to litigation, services related to recruitment and remuneration, and services related to corporate finance transactions.
In addition to the above, KPMG estimate they have been paid fees of US$4.8 million (2007: US$3.4 million; 2006: US$2.1 million) by parties other than HSBC but where HSBC is connected with the contracting party and therefore may be involved in appointing KPMG. These fees arise from services such as auditing mutual funds managed by HSBC and reviewing the financial position of corporate concerns which borrow from HSBC.

H S B C H O L D I N G S P L C
Notes on the Financial Statements (continued) Note 10
376
Fees payable to KPMG for non-audit services for HSBC Holdings are not disclosed separately because such fees are disclosed on a consolidated basis for HSBC Group.
10 Share-based payments
During 2008, US$819 million was charged to the income statement in respect of share-based payment transactions settled in equity (2007: US$870 million; 2006: US$854 million). This expense, which was computed from the fair values of the share-based payment transactions when contracted, arose under employee share awards made in accordance with HSBC’s reward structures.
Calculation of fair values
Fair values of share options/awards, measured at the date of grant of the option/award, are calculated using a binomial lattice model methodology that is based on the underlying assumptions of the Black-Scholes model. When modelling options/awards with vesting dependent on HSBC’s Total Shareholder Return (‘TSR’) over a period, the TSR performance targets are incorporated into the model using Monte Carlo simulation. The expected life of options depends on the behaviour of option holders, which is incorporated into the option model on the basis of historic observable data. The fair values calculated are inherently subjective and uncertain due to the assumptions made and the limitations of the model used.
The significant weighted average assumptions used to estimate the fair value of the options granted were as follows:
1-year Savings- Related Share Option Plan
3-year Savings- Related Share Option Plans
5-year Savings- Related Share Option Plans
2008 Risk-free interest rate1 (%) .............................................................................. 4.5 4.5 4.5 Expected life2 (years) ....................................................................................... 1 3 5 Expected volatility3 (%) ................................................................................... 25 25 25 Share price at grant date (£) ............................................................................. 8.80 8.80 8.80
2007 Risk-free interest rate1 (%) .............................................................................. 5.6 5.5 5.4 Expected life2 (years) ....................................................................................... 1 3 5 Expected volatility3 (%) ................................................................................... 17 17 17 Share price at grant date (£) ............................................................................. 9.24 9.24 9.24
2006 Risk-free interest rate1 (%) .............................................................................. 4.7 4.8 4.7 Expected life2 (years) ....................................................................................... 1 3 5 Expected volatility3 (%) ................................................................................... 17 17 17 Share price at grant date (£) ............................................................................. 9.54 9.54 9.54
1 The risk-free rate was determined from the UK gilts yield curve for the UK Savings-Related Share Option Plans. A similar yield curve was used for the International Savings-Related Share Option Plans.
2 Expected life is not a single input parameter but a function of various behavioural assumptions. 3 Expected volatility is estimated by considering both historic average share price volatility and implied volatility derived from traded
options over HSBC shares of similar maturity to those of the employee options.
Expected dividends are incorporated into the valuation model for share options and awards, where applicable. The expected US dollar denominated dividend growth was determined to be 7 per cent for the first year (2007: 10 per cent for first 3 years) and 8 per cent thereafter (2007: 8 per cent), in line with consensus analyst forecasts.
The HSBC Share Plan
The HSBC Share Plan was adopted by HSBC Holdings in 2005. Under this plan, Performance Share awards, restricted share awards and share option awards may be made. The aim of the HSBC Share Plan is to align the interests of executives with the creation of shareholder value and recognise individual performance and potential. Awards are also made under this plan for recruitment and retention purposes.

377
Performance Share awards
Performance Shares are awarded to executive Directors and other senior executives after taking into account individual performance in the previous year. For awards made prior to 2008, each award is divided into two equal parts for testing attainment against pre-determined benchmarks. One half of the award is subject to a TSR measure, based on HSBC’s ranking against a comparator group of 28 major banks; the other half is subject to an earnings per share target. For each element of the award, shares are released to the employee on a sliding scale from 30 to 100 per cent of the award, depending on the scale of achievement against the benchmarks, providing that the minimum criteria for each performance measure has been met.
For awards made during 2008 and prospectively, each award is divided into three parts for testing attainment against pre-determined benchmarks. 40 per cent of the award is subject to a TSR measure, based on HSBC’s ranking against a comparator group of 26 major banks; 40 per cent is subject to an economic profit measure, calculated as the average annual difference between return on invested capital and HSBC’s benchmark cost of capital; and 20 per cent is subject to an earnings per share target. For the TSR and EPS elements of the awards, shares are released to the employee on a sliding scale from 20 to 100 per cent of the award, depending on the scale of achievement against the benchmarks. For the economic profit element of the awards, shares are released to the employee on a sliding scale from zero to 100 per cent, depending on the scale of achievement against the benchmark. In all cases, shares are only released when the minimum criteria for each performance measure has been met.
In determining whether HSBC Holdings has achieved such sustained improvement the Remuneration Committee will take account of all relevant factors, in particular, comparisons against the TSR comparator group in areas such as revenue growth and mix, cost efficiency, credit performance, cash return on cash invested, dividend performance and TSR.
2008 2007 Number Number (000s) (000s)
Outstanding at 1 January ................................................................................................................... 12,318 10,367 Additions during the year ................................................................................................................... 5,664 3,263 Released in the year ........................................................................................................................... (2,246) – Forfeited in the year ........................................................................................................................... (4,117) (1,312)
Outstanding at 31 December ............................................................................................................. 11,619 12,318
The weighted average fair value of shares awarded by HSBC for performance share awards in 2008 was US$13.61 (2007: US$13.24).
Restricted share awards
Restricted shares are awarded to other employees on the basis of their performance, potential and retention requirements, to aid recruitment or as a part-deferral of annual bonuses. Shares are awarded without corporate performance conditions and generally vest between one and three years from the date of award, providing the employees have remained continually employed by HSBC for this period.
2008 2007 Number Number (000s) (000s)
Outstanding at 1 January ................................................................................................................... 79,256 43,420 Additions during the year ................................................................................................................... 72,120 52,790 Released in the year ........................................................................................................................... (17,092) (8,781)Forfeited in the year ........................................................................................................................... (12,078) (8,173)
Outstanding at 31 December ............................................................................................................. 122,206 79,256
The weighted average fair value of shares awarded by HSBC for restricted share awards in 2008 was US$14.64 (2007: US$17.92).
Share options
Share options were granted in 2005 under the HSBC Share Plan to employees in France on the basis of their performance in the previous year. The share options are subject to the corporate performance conditions, which consist of an absolute earnings per share measure and a TSR measure based on HSBC Holdings’ ranking against a comparator group of 28 major banks. The options may vest after three years and are exercisable up to the tenth anniversary of the date of grant, after which they will lapse.

H S B C H O L D I N G S P L C
Notes on the Financial Statements (continued) Note 10
378
2008 2007
Number
Weighted average exercise price Number
Weighted average exercise price
(000s) £ (000s) £
Outstanding at 1 January .............................................. 524 8.85 628 8.84 Forfeited and expired in the year .................................. (224) 8.79 (104) 8.79
Outstanding at 31 December ........................................ 300 8.89 524 8.85
No options were granted in 2008 (2007: nil). The weighted average remaining contractual life of options outstanding at the balance sheet date was 2.1 years (2007: 2.4 years). The exercise price range of options outstanding at the balance sheet date was £8.79-£9.17. All of the options were exercisable. The options exercisable at the balance sheet date were 300 (2007: nil).
Savings-related share option plans
Savings-related share option plans invite eligible employees to enter into savings contracts to save up to £250 per month (or its equivalent in US dollars, Hong Kong dollars or euros), with the option to use the savings to acquire shares. The aim of the plans is to align the interests of all employees with the creation of shareholder value. The options are exercisable within three months following the first anniversary of the commencement of a one-year savings contract or within six months following either the third or the fifth anniversaries of the commencement of three-year or five-year savings contracts, respectively. The exercise price is set at a 20 per cent (2007: 20 per cent) discount to the market value immediately preceding the date of invitation (except for the one-year options granted under the US sub-plan where a 15 per cent discount is applied).
2008 2007
Number
Weightedaverageexercise
price
Number
Weighted average exercise price
(000s) £ (000s) £
Outstanding at 1 January .............................................. 89,739 6.83 87,837 6.58 Granted in the year ....................................................... 32,951 6.82 30,105 7.43 Exercised in the year...................................................... (30,126) 6.10 (17,951) 6.58 Forfeited and expired in the year .................................. (18,163) 7.04 (10,252) 6.58
Outstanding at 31 December ........................................ 74,401 6.97 89,739 6.83
The weighted average fair value of options granted during the year was US$3.89 (2007: US$4.24). The weighted average share price at the date the share options were exercised was US$15.48 (2007: US$17.93). The exercise price range and weighted average remaining contractual life for options outstanding at the balance sheet date were as follows:
2008 2007
Exercise price range (£) ..................................................................................................................... 5.35-7.67 5.35-7.93 Weighted average remaining contractual life (years) ....................................................................... 1.87 1.67 Of which exercisable:
Number (000s) ............................................................................................................................... 1,751 541 Weighted average exercise price (£) ............................................................................................. 6.03 6.44
HSBC Holdings Restricted Share Plan 2000
Performance Share awards made under the HSBC Holdings Restricted Share Plan 2000 (the ‘Restricted Share Plan’)
Performance share awards under the Restricted Share Plan were granted to senior executives from 2000 to 2004. The aim of the plan was to align the interests of executives with the creation of shareholder value. This was achieved by setting certain TSR targets against a peer group of major banks which would normally have to be attained in order for the awards to vest. In addition to these performance conditions, none of the outstanding awards will vest unless the Remuneration Committee is satisfied that, during the performance period, HSBC has achieved sustained growth. Following adoption of the HSBC Share Plan in 2005, no further awards will be made under this Plan other than from reinvested scrip dividends.

379
2008 2007 Number Number (000s) (000s)
Outstanding at 1 January ................................................................................................................... 4,811 12,328 Additions during the year1 ................................................................................................................. 159 301 Released in the year ........................................................................................................................... (11) (2,332)Forfeited in the year ........................................................................................................................... (4,959) (5,486)
Outstanding at 31 December ............................................................................................................. – 4,811
1 Additions during the year comprised reinvested scrip dividends.
There was no weighted average remaining vesting period at 31 December 2008 (2007: 0.2 years).
Restricted share awards made under the Restricted Share Plan
Restricted share awards under the Restricted Share Plan were granted to eligible employees from 2000 to 2005, after taking into account the employees’ performance in the previous year, their potential and retention requirements. Restricted shares were also awarded as part-deferral of annual bonuses or for recruitment purposes. Shares were awarded without corporate performance conditions and generally vest between one and three years from the date of award, providing the employees have remained continuously employed by HSBC for the period.
2008 Number
2007 Number
(000s) (000s)
Outstanding at 1 January ................................................................................................................... 19,299 38,670 Additions during the year1 ................................................................................................................. 934 199 Released in the year ........................................................................................................................... (16,405) (17,156)Forfeited in the year ........................................................................................................................... (1,111) (2,414)
Outstanding at 31 December ............................................................................................................. 2,717 19,299
1 Additions during the year comprised reinvested scrip dividends and reinstatement of awards.
The weighted average remaining vesting period as at 31 December 2008 was 0.5 years (2007: 0.3 years).
HSBC Holdings Group Share Option Plan
The HSBC Holdings Group Share Option Plan was a long-term incentive plan under which certain HSBC employees between 2000 and 2005 were awarded share options. The aim of the plan was to align the interests of those higher performing employees with the creation of shareholder value. This was achieved by setting certain TSR targets which would normally have to be attained in order for the awards to vest. Options were granted at market value and are normally exercisable between the third and tenth anniversaries of the date of grant, subject to vesting conditions. Options granted after May 2005 are made under the HSBC Share Plan.
2008 2007
Number
Weightedaverageexercise
price
Number
Weighted average exercise price
(000s) £ (000s) £
Outstanding at 1 January .............................................. 152,216 8.15 168,786 8.09 Exercised in the year ..................................................... (3,734) 7.38 (8,351) 7.64 Forfeited and expired in the year .................................. (5,889) 8.28 (8,219) 8.02
Outstanding at 31 December ........................................ 142,593 8.16 152,216 8.15
The weighted average share price at the date the share options were exercised was US$14.65 (2007: US$18.08). The number of options, weighted average exercise price, and weighted average remaining contractual life of options outstanding at the balance sheet date, analysed by exercise price range, were as follows:
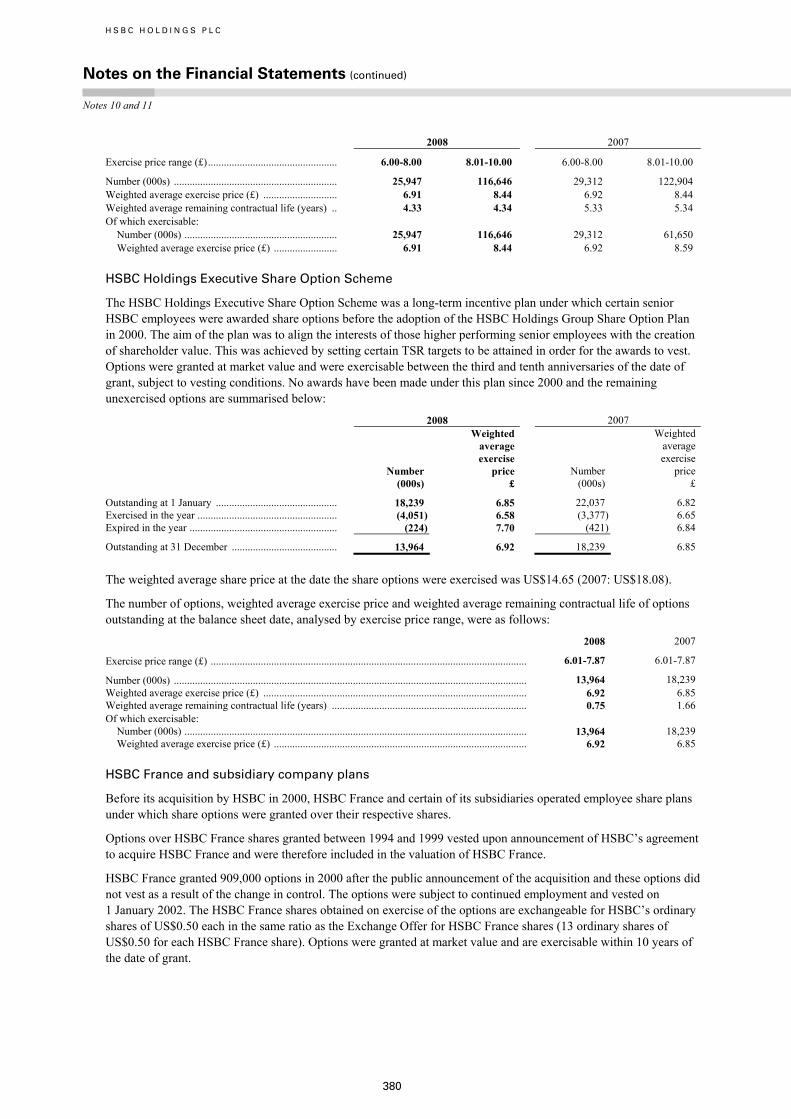
H S B C H O L D I N G S P L C
Notes on the Financial Statements (continued) Notes 10 and 11
380
2008 2007
Exercise price range (£)................................................. 6.00-8.00 8.01-10.00 6.00-8.00 8.01-10.00
Number (000s) .............................................................. 25,947 116,646 29,312 122,904 Weighted average exercise price (£) ............................ 6.91 8.44 6.92 8.44 Weighted average remaining contractual life (years) .. 4.33 4.34 5.33 5.34 Of which exercisable:
Number (000s) .......................................................... 25,947 116,646 29,312 61,650 Weighted average exercise price (£) ........................ 6.91 8.44 6.92 8.59
HSBC Holdings Executive Share Option Scheme
The HSBC Holdings Executive Share Option Scheme was a long-term incentive plan under which certain senior HSBC employees were awarded share options before the adoption of the HSBC Holdings Group Share Option Plan in 2000. The aim of the plan was to align the interests of those higher performing senior employees with the creation of shareholder value. This was achieved by setting certain TSR targets to be attained in order for the awards to vest. Options were granted at market value and were exercisable between the third and tenth anniversaries of the date of grant, subject to vesting conditions. No awards have been made under this plan since 2000 and the remaining unexercised options are summarised below:
2008 2007
Number
Weighted average exercise price Number
Weighted average exercise price
(000s) £ (000s) £
Outstanding at 1 January .............................................. 18,239 6.85 22,037 6.82 Exercised in the year ..................................................... (4,051) 6.58 (3,377) 6.65 Expired in the year ........................................................ (224) 7.70 (421) 6.84
Outstanding at 31 December ........................................ 13,964 6.92 18,239 6.85
The weighted average share price at the date the share options were exercised was US$14.65 (2007: US$18.08).
The number of options, weighted average exercise price and weighted average remaining contractual life of options outstanding at the balance sheet date, analysed by exercise price range, were as follows:
2008 2007
Exercise price range (£) ........................................................................................................................ 6.01-7.87 6.01-7.87
Number (000s) ...................................................................................................................................... 13,964 18,239 Weighted average exercise price (£) .................................................................................................... 6.92 6.85 Weighted average remaining contractual life (years) .......................................................................... 0.75 1.66 Of which exercisable:
Number (000s) .................................................................................................................................. 13,964 18,239 Weighted average exercise price (£) ................................................................................................ 6.92 6.85
HSBC France and subsidiary company plans
Before its acquisition by HSBC in 2000, HSBC France and certain of its subsidiaries operated employee share plans under which share options were granted over their respective shares.
Options over HSBC France shares granted between 1994 and 1999 vested upon announcement of HSBC’s agreement to acquire HSBC France and were therefore included in the valuation of HSBC France.
HSBC France granted 909,000 options in 2000 after the public announcement of the acquisition and these options did not vest as a result of the change in control. The options were subject to continued employment and vested on 1 January 2002. The HSBC France shares obtained on exercise of the options are exchangeable for HSBC’s ordinary shares of US$0.50 each in the same ratio as the Exchange Offer for HSBC France shares (13 ordinary shares of US$0.50 for each HSBC France share). Options were granted at market value and are exercisable within 10 years of the date of grant.

381
2008 2007
Number Exercise
price Number Exercise price
(000s) € (000s) €
Outstanding at 1 January .............................................. 604 142.5 648 142.5 Exercised in the year ..................................................... – 142.5 (42) 142.5
Outstanding and exercisable at 31 December .............. 604 142.5 604 142.5
The weighted average share price at the date the share options were exercised was nil (2007: US$18.08). The remaining contractual life for options outstanding at the balance sheet date was 1.3 years (2007: 2.3 years).
At the date of its acquisition in 2000, certain of HSBC France’s subsidiary companies also operated employee share option plans under which options could be granted over their respective shares. On exercise of certain of these options, the subsidiary shares are exchanged for HSBC ordinary shares. The total number of HSBC ordinary shares exchanged under such arrangements in 2008 was 12,810 (2007: 113,240).
HSBC Finance
Upon acquisition, HSBC Finance share options previously granted were converted to share options over HSBC ordinary shares of US$0.50 each at a rate of 2.675 HSBC share options (the same ratio as the Exchange Offer for HSBC Finance) for each HSBC Finance share option. Options granted under HSBC Finance’s own share option schemes prior to the announcement of the acquisition by HSBC in November 2002 vested as options over HSBC shares upon acquisition by HSBC. Options granted after the announcement of the acquisition in November 2002 but prior to its completion on 28 March 2003 generally vest equally over four years and expire ten years from the date of grant.
2008 2007
Number Exercise price
Number
Exercise price
(000s) US$ (000s) US$
Outstanding at 1 January .............................................. 2,455 10.66 3,126 10.66 Exercised in the year ..................................................... (12) 10.66 (671) 10.66 Expired in the year ........................................................ (41) 10.66 – 10.66
Outstanding and exercisable at 31 December .............. 2,402 10.66 2,455 10.66
The weighted average share price at the date the share options were exercised was US$14.65 (2007: US$18.08). The remaining contractual life for options outstanding at the balance sheet date was 3.9 years (2007: 4.9 years).
11 Tax expense
2008 2007 2006 US$m US$m US$m Current tax UK corporation tax charge – on current year profit ........................................ 1,738 1,372 772 UK corporation tax charge – adjustments in respect of prior years ................ (67) (46) (122)Overseas tax – on current year profit .............................................................. 1,732 3,976 4,600 Overseas tax – adjustments in respect of prior years ...................................... (29) (97) (48)
3,374 5,205 5,202
Deferred tax Origination and reversal of temporary differences ......................................... (504) (1,247) (51)Effect of changes in tax rates ........................................................................... (89) (35) – Adjustments in respect of prior years .............................................................. 28 (166) 64
(565) (1,448) 13
Tax expense ..................................................................................................... 2,809 3,757 5,215
The UK corporation tax rate applying to HSBC Holdings and its subsidiaries changed from 30 per cent to 28 per cent with effect from 1 April 2008 (2007: 30 per cent; 2006: 30 per cent). Overseas tax included Hong Kong profits tax of US$846 million (2007: US$1,137 million; 2006: US$751 million). The Hong Kong tax rate applying to the profits of subsidiaries assessable in Hong Kong changed from 17.5 per cent to 16.5 per cent with effect from 1 January 2008

H S B C H O L D I N G S P L C
Notes on the Financial Statements (continued) Note 11
382
(2007: 17.5 per cent; 2006: 17.5 per cent). Other overseas subsidiaries and overseas branches provided for taxation at the appropriate rates in the countries in which they operate.
The following table reconciles the tax expense which would apply if all profits had been taxed at the UK corporation tax rate:
2008 2007 2006 US$m % US$m % US$m % Analysis of tax expense Taxation at UK corporation tax rate of
28.5% (2007 and 2006: 30%)1 ....................... 2,652 28.5 7,264 30.0 6,626 30.0 Goodwill impaired .............................................. 3,010 32.3 – – – – Effect of taxing overseas profits in
principal locations at different rates ............... (1,339) (14.4) (1,460) (6.0) (568) (2.6)Tax-free gains ..................................................... (1,016) (10.9) (296) (1.2) (199) (0.9)Adjustments in respect of prior period
liabilities ......................................................... (67) (0.7) (309) (1.3) (106) (0.5)Low income housing tax credits2 ....................... (103) (1.1) (107) (0.4) (108) (0.5)Effect of profit in associates and joint
ventures .......................................................... (473) (5.1) (450) (1.9) (253) (1.1)Effect of previously unrecognised
temporary differences3 ................................... (98) (1.1) (485) (2.0) (122) (0.6)Release of deferred tax consequent on
restructuring of Group interests ..................... – – (359) (1.5) – – Impact of gains arising from dilution of
interests in associates4 .................................... – – (253) (1.0) – – Other items .......................................................... 243 2.7 212 0.8 (55) (0.2)
Overall tax expense ............................................ 2,809 30.2 3,757 15.5 5,215 23.6
1 The change in the UK corporation tax rate from 30 per cent to 28 per cent with effect from 1 April 2008 gave rise to a blended tax rate for 2008 of 28.5 per cent.
2 Low income housing tax credits arise in the US and are designed to encourage the provision of rental housing for low income households.
3 The effect of previously unrecognised temporary differences principally relates to the recognition of trading losses (2007 and 2006: capital losses).
4 The gains arising from the dilution of HSBC’s interests in associates were not subject to tax and, as such, there is a reconciling item which reduces the effective tax rate for 2007 (see Note 4).
In addition to the amount charged to the income statement, the aggregate amount of current and deferred tax, relating to items that are taken directly to total equity, was a US$1,879 million increase in total equity (2007: US$226 million reduction in total equity; 2006: US$44 million reduction in total equity).
The 2007 Finance Act reduction in the UK corporation tax rate from 30 per cent to 28 per cent, enacted in 2007 but commencing in 2008, resulted in a one off re-measurement of deferred tax assets and liabilities at 31 December 2007. It gave rise to a credit to the Group’s tax charge of US$28 million in 2007.
Deferred taxation
HSBC
2008 2007 US$m US$m
At 1 January ....................................................................................................................................... 3,425 2,145 Income statement credit ..................................................................................................................... 565 1,448 Equity:
– available-for-sale investments .................................................................................................... 582 (8)– cash flow hedges ........................................................................................................................ 92 470 – share-based payments ................................................................................................................. – (65)– actuarial gains and losses ........................................................................................................... 433 (642)
Foreign exchange and other adjustments .......................................................................................... 59 77
At 31 December ................................................................................................................................. 5,156 3,425

383
The amount of deferred taxation accounted for in the consolidated balance sheet, before offsetting balances within countries, comprised the following deferred tax assets and liabilities:
2008 2007 US$m US$m Deferred tax assets Retirement benefits ............................................................................................................................ 927 822 Loan impairment allowances ............................................................................................................. 5,891 4,484 Unused tax losses ............................................................................................................................... 282 272 Accelerated capital allowances .......................................................................................................... 99 97 Available-for-sale investments .......................................................................................................... 518 77 Cash flow hedges ............................................................................................................................... 1,145 570 Share-based payments ....................................................................................................................... 245 326 Other short-term temporary differences ............................................................................................ 457 900 9,564 7,548 Deferred tax liabilities Assets leased to customers ................................................................................................................ 916 1,285Revaluation of property ..................................................................................................................... 374 507 Accelerated capital allowances .......................................................................................................... 167 206 Other short-term temporary differences ............................................................................................ 419 202 Provision for tax on profit remitted from overseas ........................................................................... 78 102 Available-for-sale investments .......................................................................................................... 121 198 Cash flow hedges ............................................................................................................................... 280 96 Fee income ......................................................................................................................................... 930 943 Other temporary differences .............................................................................................................. 1,123 584 4,408 4,123 Net deferred tax assets before offsetting balances within countries ................................................. 5,156 3,425
After offsetting balances within countries, the balances as disclosed in the consolidated balance sheet are as follows:
2008 2007 US$m US$m
Deferred tax assets ............................................................................................................................. 7,011 5,284 Deferred tax liabilities ....................................................................................................................... (1,855) (1,859)
5,156 3,425
The amount of temporary differences, unused tax losses and unused tax credits for which no deferred tax asset is recognised in the balance sheet is US$878 million (2007: US$923 million). Of this amount, US$805 million (2007: US$750 million) has no expiry date and US$73 million (2007: US$173 million) is scheduled to expire within 10 years (2007: 10 years).
Deferred tax is not recognised in respect of the Group’s investments in subsidiaries, branches, associates and interests in joint ventures where remittance is not contemplated or where no additional tax is expected to arise. The aggregate amount of temporary differences associated with such investments is US$38,443 million (2007: US$29,947 million; 2006: US$22,424 million).
Of the total net deferred tax assets of US$7.0 billion at 31 December 2008 (2007: US$5.3 billion), US$5.0 billion (2007: US$3.7 billion) arises in respect of HSBC’s US operations where there has been a recent history of losses. The recognition of the deferred tax assets in respect of HSBC’s US operations is dependent on the capacity to carry back up to US$1.9 billion of net operating losses arising in 2009 (2007 capacity: US$7.3 billion) but mainly relies on the projection of future taxable profits. Management’s forecasts support the assumption that it is probable that the results of future operations will generate sufficient taxable income to utilise the deferred tax assets. These forecasts rely on continued liquidity and capital support to the US operations from HSBC, including tax planning strategies implemented in relation to such support.

H S B C H O L D I N G S P L C
Notes on the Financial Statements (continued) Notes 11, 12, 13 and 14
384
HSBC Holdings
Deferred tax asset/(liability) 2008 2007 US$m US$m Temporary differences:
– short-term timing differences ..................................................................................................... 1 1 – fair valued assets and liabilities ................................................................................................. 30 (14)– share-based payments ................................................................................................................. 11 20
42 7
12 Dividends
Dividends to shareholders of the parent company were as follows:
2008 2007 2006 Per share US$
Total US$m
Settled in scrip US$m
Per share US$
Total US$m
Settled in scrip US$m
Per share US$
Total US$m
Settled in scrip US$m
Dividends declared on ordinary shares In respect of previous year:
– fourth interim dividend ....................... 0.390 4,620 2,233 0.360 4,161 2,116 0.310 3,513 1,542 In respect of current year:
– first interim dividend ........................... 0.180 2,158 256 0.170 1,986 712 0.150 1,712 248 – second interim dividend ...................... 0.180 2,166 727 0.170 1,997 912 0.150 1,724 515 – third interim dividend .......................... 0.180 2,175 380 0.170 2,007 614 0.150 1,730 223
0.930 11,119 3,596 0.870 10,151 4,354 0.760 8,679 2,528
Quarterly dividends on preference shares classified as equity
March dividend ........................................... 15.50 22 15.50 22 15.50 22 June dividend .............................................. 15.50 23 15.50 23 15.50 23 September dividend .................................... 15.50 22 15.50 22 15.50 22 December dividend ..................................... 15.50 23 15.50 23 15.50 23
62.00 90 62.00 90 62.00 90
Quarterly coupons on capital securities classified as equity1
July coupon ................................................. 0.541 47 – – – – October coupon ........................................... 0.508 45 – – – –
1.049 92 – – – –
1 During April 2008, HSBC Holdings issued US$2,200 million of Perpetual Subordinated Capital Securities (‘Capital Securities’), which are classified as equity under IFRSs.
The Directors declared after the end of the year a fourth interim dividend in respect of the financial year ended 31 December 2008 of US$0.10 per ordinary share, a distribution of US$1,214 million. The fourth interim dividend will be payable on 6 May 2009 to shareholders on the Register at the close of business on 20 March 2009. No liability is recorded in the financial statements in respect of the fourth interim dividend for 2008.
On 15 January 2009, HSBC paid a further coupon on the Capital Securities of US$0.508 per security, a distribution of US$45 million. No liability is recorded in the balance sheet at 31 December 2008 in respect of this coupon payment.
13 Earnings per share
Basic earnings per ordinary share was calculated by dividing the profit attributable to ordinary shareholders of the parent company of US$5,546 million (2007: US$19,043 million; 2006: US$15,699 million) by the weighted average number of ordinary shares, excluding own shares held, outstanding in 2008 of 11,812 million (2007: 11,545 million; 2006: 11,210 million).

385
2008 2007 2006 US$m US$m US$m
Profit attributable to shareholders of the parent company .............................. 5,728 19,133 15,789 Dividend payable on preference shares classified as equity ........................... (90) (90) (90)Coupon payable on capital securities classified as equity .............................. (92) – –
Profit attributable to the ordinary shareholders of the parent company .......... 5,546 19,043 15,699
Diluted earnings per ordinary share was calculated by dividing the basic earnings, which require no adjustment for the effects of dilutive potential ordinary shares (including share options outstanding not yet exercised), by the weighted average number of ordinary shares outstanding, excluding own shares held, plus the weighted average number of ordinary shares that would be issued on ordinary conversion of dilutive potential ordinary shares in 2008 of 11,915 million (2007: 11,661 million; 2006: 11,320 million). The effect of dilutive potential ordinary shares on the weighted average number of ordinary shares outstanding was as follows:
Number of shares (millions) 2008 2007 2006
Weighted average number of ordinary shares outstanding ............................. 11,812 11,545 11,210 Weighted average number of dilutive potential ordinary shares .................... 103 116 110
– Savings-related Share Option Plan ........................................................... 11 20 27– Executive Share Option Scheme .............................................................. 3 5 10– Group Share Option Plan ......................................................................... 4 16 28– Restricted and performance share awards ................................................ 83 67 32– HSBC France share options ..................................................................... 1 5 8– HSBC Finance share options ................................................................... 1 3 5
Weighted average number of ordinary shares outstanding assuming dilution ......................................................................................................... 11,915 11,661 11,320
The weighted average number of dilutive potential ordinary shares excludes 145 million employee share options that were anti-dilutive (2007: 19 million; 2006: 20 million).
14 Segmental analysis
In the following segmental analysis, the benefit of shareholders’ funds impacts the analysis only to the extent that these funds are actually allocated to businesses in the segment by way of intra-HSBC capital and funding structures.
By geographical region
Geographical information is classified by the location of the principal operations of the subsidiary or, for The Hongkong and Shanghai Banking Corporation, HSBC Bank, HSBC Bank Middle East, HSBC Finance and HSBC Bank USA, by the location of the branch responsible for reporting the results or advancing the funds. Due to the nature of HSBC’s structure, the analysis of profits shown below includes intra-HSBC items between geographical regions with the elimination shown in a separate column. The Rest of Asia-Pacific geographical segment includes the Middle East, India and Australasia. Shared costs are included in segments on the basis of the actual recharges made.
By customer groups and global businesses
HSBC’s operations include a number of shared support services and GMO functions. The costs of these functions are allocated to customer groups and global businesses, where appropriate, on a systematic and consistent basis. In addition, a number of income and expense items include the effect of financial transactions entered into in the ordinary course of business between customer groups co-operating within the integrated HSBC Group. The analysis on pages 389 to 392 includes inter-segment amounts within each customer group with the elimination shown in a separate column.

H S B C H O L D I N G S P L C
Notes on the Financial Statements (continued) Note 14
386
By geographical region
Profit before tax Year ended 31 December 2008
Europe HongKong
Rest ofAsia-
Pacific
North
America
Latin
America
Intra- HSBC items Total
US$m US$m US$m US$m US$m US$m US$m
Interest income ............................ 35,117 9,530 11,517 25,897 11,632 (2,392) 91,301Interest expense .......................... (25,421) (3,832) (6,024) (10,679) (5,174) 2,392 (48,738)
Net interest income ..................... 9,696 5,698 5,493 15,218 6,458 – 42,563
Fee income .................................. 10,225 3,062 3,154 6,292 2,716 (685) 24,764Fee expense ................................. (2,733) (482) (596) (1,065) (549) 685 (4,740)
Net fee income ............................ 7,492 2,580 2,558 5,227 2,167 – 20,024
Trading income/(expense) excluding net interest income . 1,691 856 1,823 (3,879) 356 – 847
Net interest income on trading activities ................ 3,666 337 621 744 345 – 5,713
Net trading income ..................... 5,357 1,193 2,444 (3,135) 701 – 6,560
Changes in fair value of long- term debt issued and related derivatives .............................. 2,939 3 1 3,736 – – 6,679
Net income/(expense) from other financial instruments designated at fair value ........... (1,826) (1,194) (172) 1 364 – (2,827)
Net income from financial instruments designated at fair value ................................. 1,113 (1,191) (171) 3,737 364 – 3,852
Gains less losses from financial investments ............................. 418 (309) 32 (120) 176 – 197
Dividend income ......................... 130 41 4 77 20 – 272 Net earned insurance premiums . 5,299 3,247 197 390 1,717 – 10,850 Gains on disposal of French
regional banks ........................ 2,445 – – – – – 2,445 Other operating income .............. 2,096 817 1,064 23 300 (2,492) 1,808
Total operating income ............ 34,046 12,076 11,621 21,417 11,903 (2,492) 88,571
Net insurance claims incurred and movement in liabilities to policyholders .......................... (3,367) (1,922) 28 (238) (1,390) – (6,889)
Net operating income before loan impairment charges and other credit risk provisions .............................. 30,679 10,154 11,649 21,179 10,513 (2,492) 81,682
Loan impairment charges and other credit risk provisions .............. (3,754) (765) (1,131) (16,795) (2,492) – (24,937)
Net operating income1 .............. 26,925 9,389 10,518 4,384 8,021 (2,492) 56,745
Total operating expenses (excluding depreciation, amortisation and impairment) (14,979) (3,631) (5,440) (8,891) (5,603) 2,492 (36,052)
Depreciation of property, plant and equipment ........................ (865) (209) (188) (265) (223) – (1,750)
Amortisation of intangible assets ....................................... (228) (103) (35) (203) (164) – (733)
Goodwill impairment .................. – – – (10,564) – – (10,564)
Total operating expenses .......... (16,072) (3,943) (5,663) (19,923) (5,990) 2,492 (49,099)
Operating profit/(loss) .............. 10,853 5,446 4,855 (15,539) 2,031 – 7,646
Share of profit in associates and joint ventures ................... 16 15 1,613 11 6 – 1,661
Profit/(loss) before tax .............. 10,869 5,461 6,468 (15,528) 2,037 – 9,307

387
Year ended 31 December 2007
Europe Hong Kong
Rest of Asia-
Pacific
North
America
Latin
America
Intra- HSBC items Total
US$m US$m US$m US$m US$m US$m US$m
Interest income ............................ 33,144 12,580 10,158 30,183 9,471 (3,177) 92,359Interest expense .......................... (25,398) (7,097) (6,015) (15,336) (3,895) 3,177 (54,564)
Net interest income ..................... 7,746 5,483 4,143 14,847 5,576 – 37,795
Fee income .................................. 10,973 3,860 2,709 6,733 2,647 (585) 26,337Fee expense ................................. (2,542) (498) (463) (923) (494) 585 (4,335)
Net fee income ............................ 8,431 3,362 2,246 5,810 2,153 – 22,002
Trading income/(expense) excluding net interest income . 3,003 1,270 1,202 (1,289) 272 – 4,458
Net interest income/(expense) on trading activities ................ 3,940 (28) 441 747 276 – 5,376
Net trading income/(expense) ..... 6,943 1,242 1,643 (542) 548 – 9,834
Changes in fair value of long- term debt issued and related derivatives ............................... 1,059 2 1 1,750 – – 2,812
Net income from other financial instruments designated at fair value ........................................ 167 674 110 – 320 – 1,271
Net income from financial instruments designated at fair value ................................. 1,226 676 111 1,750 320 – 4,083
Gains less losses from financial investments ............................. 1,326 94 38 245 253 – 1,956
Gains arising from dilution of interests in associates .............. – – 1,081 – 11 – 1,092
Dividend income ......................... 171 31 8 105 9 – 324 Net earned insurance premiums .. 4,010 2,797 226 449 1,594 – 9,076 Other operating income .............. 1,193 845 798 360 228 (1,985) 1,439
Total operating income ............... 31,046 14,530 10,294 23,024 10,692 (1,985) 87,601
Net insurance claims incurred and movement in liabilities to policyholders .......................... (3,479) (3,208) (253) (241) (1,427) – (8,608)
Net operating income before loan impairment charges and other credit risk provisions ............................... 27,567 11,322 10,041 22,783 9,265 (1,985) 78,993
Loan impairment charges and other credit risk provisions .............. (2,542) (231) (616) (12,156) (1,697) – (17,242)
Net operating income1 ................ 25,025 11,091 9,425 10,627 7,568 (1,985) 61,751
Total operating expenses (excluding depreciation and amortisation) ........................... (15,451) (3,510) (4,572) (10,037) (5,043) 1,985 (36,628)
Depreciation of property, plant and equipment ........................ (848) (180) (159) (317) (210) – (1,714)
Amortisation of intangible assets ....................................... (226) (90) (33) (202) (149) – (700)
Total operating expenses ............ (16,525) (3,780) (4,764) (10,556) (5,402) 1,985 (39,042)
Operating profit .......................... 8,500 7,311 4,661 71 2,166 – 22,709
Share of profit in associates and joint ventures ................... 95 28 1,348 20 12 – 1,503
Profit before tax .......................... 8,595 7,339 6,009 91 2,178 – 24,212

H S B C H O L D I N G S P L C
Notes on the Financial Statements (continued) Note 14
388
Year ended 31 December 2006
Europe Hong Kong
Rest of Asia-
Pacific
North
America
Latin
America
Intra- HSBC items Total
US$m US$m US$m US$m US$m US$m US$m
Interest income ............................ 25,249 11,097 7,693 27,959 7,289 (3,408) 75,879Interest expense .......................... (16,960) (6,412) (4,646) (13,691) (3,092) 3,408 (41,393)
Net interest income ..................... 8,289 4,685 3,047 14,268 4,197 – 34,486
Fee income .................................. 9,583 2,448 1,912 5,611 1,975 (449) 21,080Fee expense ................................. (2,475) (392) (290) (845) (345) 449 (3,898)
Net fee income ............................ 7,108 2,056 1,622 4,766 1,630 – 17,182
Trading income excluding net interest income ....................... 2,842 924 935 617 301 – 5,619
Net interest income/(expense) on trading activities ................ 1,687 (307) 246 741 236 – 2,603
Net trading income ..................... 4,529 617 1,181 1,358 537 – 8,222
Changes in fair value of long- term debt issued and related derivatives .............................. 28 – – (63) – – (35)
Net income from other financial instruments designated at fair value ....................................... 116 260 79 – 237 – 692
Net income/(expense) from financial instruments designated at fair value ........... 144 260 79 (63) 237 – 657
Gains less losses from financial investments ............................. 624 162 41 58 84 – 969
Dividend income ......................... 183 61 5 85 6 – 340 Net earned insurance premiums . 1,298 2,628 174 492 1,076 – 5,668 Other operating income .............. 1,428 834 765 922 91 (1,494) 2,546
Total operating income ............... 23,603 11,303 6,914 21,886 7,858 (1,494) 70,070
Net insurance claims incurred and movement in liabilities to policyholders .......................... (531) (2,699) (192) (259) (1,023) – (4,704)
Net operating income before loan impairment charges and other credit risk provisions ............................... 23,072 8,604 6,722 21,627 6,835 (1,494) 65,366
Loan impairment charges and other credit risk provisions .............. (2,155) (172) (512) (6,796) (938) – (10,573)
Net operating income1 ................ 20,917 8,432 6,210 14,831 5,897 (1,494) 54,793
Total operating expenses (excluding depreciation and amortisation) ........................... (12,811) (3,002) (3,412) (9,669) (3,923) 1,494 (31,323)
Depreciation of property, plant and equipment ........................ (762) (171) (124) (284) (173) – (1,514)
Amortisation of intangible assets ....................................... (298) (96) (12) (240) (70) – (716)
Total operating expenses ............ (13,871) (3,269) (3,548) (10,193) (4,166) 1,494 (33,553)
Operating profit .......................... 7,046 5,163 2,662 4,638 1,731 – 21,240
Share of profit/(loss) in associates and joint ventures .. (72) 19 865 30 4 – 846
Profit before tax .......................... 6,974 5,182 3,527 4,668 1,735 – 22,086

389
Total assets At 31 December 2008 At 31 December 2007
US$m % US$m %
Europe .............................................................................................................. 1,343,011 53.1 1,236,633 52.5 Hong Kong ....................................................................................................... 407,151 16.1 356,894 15.2 Rest of Asia-Pacific ......................................................................................... 262,305 10.4 243,205 10.3 North America ................................................................................................. 552,612 21.9 549,285 23.3 Latin America .................................................................................................. 97,944 3.9 101,088 4.3 Intra-HSBC items ............................................................................................ (135,558) (5.4) (132,839) (5.6)
2,527,465 100.0 2,354,266 100.0
Total liabilities At 31 December 2008 At 31 December 2007
US$m % US$m %
Europe .............................................................................................................. 1,312,922 54.1 1,178,826 53.1 Hong Kong ....................................................................................................... 393,304 16.2 341,519 15.4 Rest of Asia-Pacific ......................................................................................... 241,674 10.0 225,592 10.2 North America ................................................................................................. 527,967 21.8 517,516 23.3 Latin America .................................................................................................. 86,927 3.6 88,236 4.0 Intra-HSBC items ............................................................................................ (135,558) (5.7) (132,839) (6.0)
2,427,236 100.0 2,218,850 100.0
Other disclosures
Europe HongKong
Rest of Asia-Pacific
NorthAmerica
Latin America
Intra-HSBC items Total
US$m US$m US$m US$m US$m US$m US$m Year ended 31 December 2008
Capital expenditure incurred2 ..... 2,078 440 511 726 617 – 4,372 Investment in associates and
joint ventures .......................... 137 153 11,111 128 8 – 11,537
1 Net operating income: External .................................. 25,887 8,205 9,396 5,236 8,021 – 56,745 Inter-segment .......................... 1,038 1,184 1,122 (852) – (2,492) –
Year ended 31 December 2007
Capital expenditure incurred2 ..... 1,722 441 277 833 599 – 3,872 Investment in associates and
joint ventures .......................... 158 155 9,867 127 77 – 10,384
1 Net operating income: External .................................. 23,772 10,168 8,456 11,784 7,571 – 61,751 Inter-segment .......................... 1,253 923 969 (1,157) (3) (1,985) –
Year ended 31 December 2006
Capital expenditure incurred2 ..... 1,508 324 235 899 2,017 – 4,983 Investment in associates and
joint ventures .......................... 1,321 128 6,322 541 84 – 8,396
1 Net operating income: External .................................. 19,664 7,970 5,592 15,694 5,873 – 54,793 Inter-segment .......................... 1,253 462 618 (863) 24 (1,494) –
2 Expenditure incurred on property, plant and equipment and intangible assets
By customer groups and global businesses
Total assets At 31 December 2008 At 31 December 2007
US$m % US$m %
Personal Financial Services ............................................................................. 514,419 20.4 621,356 26.4 Commercial Banking ....................................................................................... 249,218 9.9 307,944 13.1 Global Banking and Markets ........................................................................... 1,896,630 75.0 1,561,468 66.3 Private Banking ............................................................................................... 133,216 5.3 130,893 5.6 Other ................................................................................................................ 135,001 5.3 155,685 6.6 Intra-HSBC items ............................................................................................ (401,019) (15.9) (423,080) (18.0)
Total assets ....................................................................................................... 2,527,465 100.0 2,354,266 100.0

H S B C H O L D I N G S P L C
Notes on the Financial Statements (continued) Note 14
390
Profit before tax
Year ended 31 December 2008
Personal Financial Services
Commercial Banking
Global Banking & Markets
Private Banking Other
Intra- HSBC items
Total US$m US$m US$m US$m US$m US$m US$m
Net interest income/(expense) .... 29,419 9,494 8,541 1,612 (956) (5,547) 42,563
Net fee income ............................ 10,107 4,097 4,291 1,476 53 – 20,024
Trading income/(expense) excluding net interest income .................................... 175 369 157 408 (262) – 847
Net interest income/(expense) on trading activities ................ 79 17 324 14 (268) 5,547 5,713
Net trading income ...................... 254 386 481 422 (530) 5,547 6,560
Changes in fair value of long- term debt issued and related derivatives .............................. – – – – 6,679 – 6,679
Net income/(expense) from other financial instruments designated at fair value ........... (2,912) (224) (438) – 747 – (2,827)
Net income/(expense) from financial instruments designated at fair value ........... (2,912) (224) (438) – 7,426 – 3,852
Gains less losses from financial investments ............................. 663 193 (327) 64 (396) – 197
Dividend income ......................... 90 88 76 8 10 – 272 Net earned insurance premiums . 10,083 679 105 – (17) – 10,850 Gains on disposal of French
regional banks ........................ – – – – 2,445 – 2,445 Other operating income .............. 259 939 868 49 4,261 (4,568) 1,808
Total operating income ............ 47,963 15,652 13,597 3,631 12,296 (4,568) 88,571
Net insurance claims incurred and movement in liabilities to policyholders ...................... (6,474) (335) (79) – (1) – (6,889)
Net operating income1 ............... 41,489 15,317 13,518 3,631 12,295 (4,568) 81,682
Loan impairment charges and other credit risk provisions .............. (21,220) (2,173) (1,471) (68) (5) – (24,937)
Net operating income2 .............. 20,269 13,144 12,047 3,563 12,290 (4,568) 56,745
Operating expenses (excluding goodwill impairment) ............. (21,140) (6,581) (9,092) (2,116) (4,174) 4,568 (38,535)
Goodwill impairment .................. (10,564) – – – – – (10,564)
Operating profit ........................ (11,435) 6,563 2,955 1,447 8,116 – 7,646
Share of profit in associates and joint ventures ................... 461 631 528 – 41 – 1,661
Profit before tax ........................ (10,974) 7,194 3,483 1,447 8,157 – 9,307
Capital expenditure incurred3 ..... 1,901 536 1,115 61 759 4,372
1 Net operating income before loan impairment charges and other credit risk provisions. 2 Net operating income:
External .................................. 15,023 13,080 17,739 2,231 8,672 – 56,745Inter-segment .......................... 5,246 64 (5,692) 1,332 3,618 (4,568) -
3 Expenditure incurred on property, plant and equipment and intangible assets.

391
Year ended 31 December 2007
Personal Financial Services
Commercial Banking
Global Banking & Markets
Private Banking Other
Intra- HSBC items
Total US$m US$m US$m US$m US$m US$m US$m
Net interest income/(expense) .... 29,069 9,055 4,430 1,216 (542) (5,433) 37,795
Net fee income/(expense) ........... 11,742 3,972 4,901 1,615 (228) – 22,002
Trading income excluding net interest income ........................ 38 265 3,503 525 127 – 4,458
Net interest income/(expense) on trading activities ................ 140 31 (236) 9 (1) 5,433 5,376
Net trading income ...................... 178 296 3,267 534 126 5,433 9,834
Changes in fair value of long- term debt issued and related derivatives ............................... – – – – 2,812 – 2,812
Net income/(expense) from other financial instruments designated at fair value ........... 1,333 22 (164) (1) 81 – 1,271
Net income/(expense) from financial instruments designated at fair value ........... 1,333 22 (164) (1) 2,893 – 4,083
Gains less losses from financial investments ............................. 351 90 1,313 119 83 – 1,956
Gains arising from dilution in interests in associates .............. – – – – 1,092 – 1,092
Dividend income ......................... 55 8 222 7 32 – 324 Net earned insurance premiums .. 8,271 733 93 – (21) – 9,076 Other operating income .............. 387 165 1,218 58 3,523 (3,912) 1,439
Total operating income ............... 51,386 14,341 15,280 3,548 6,958 (3,912) 87,601
Net insurance claims incurred and movement in liabilities to policyholders ...................... (8,147) (391) (70) – – – (8,608)
Net operating income1 ................. 43,239 13,950 15,210 3,548 6,958 (3,912) 78,993
Loan impairment charges and other credit risk provisions .............. (16,172) (1,007) (38) (14) (11) – (17,242)
Net operating income2 ................ 27,067 12,943 15,172 3,534 6,947 (3,912) 61,751
Operating expenses ..................... (21,757) (6,252) (9,358) (2,025) (3,562) 3,912 (39,042)
Operating profit .......................... 5,310 6,691 5,814 1,509 3,385 – 22,709
Share of profit in associates and joint ventures ................... 590 454 307 2 150 – 1,503
Profit before tax .......................... 5,900 7,145 6,121 1,511 3,535 – 24,212
Capital expenditure incurred3 ..... 1,335 527 942 73 995 – 3,872
1 Net operating income before loan impairment charges and other credit risk provisions. 2 Net operating income:
External .................................. 21,059 11,442 23,595 2,144 3,511 – 61,751 Inter-segment .......................... 6,008 1,501 (8,423) 1,390 3,436 (3,912) –
3 Expenditure incurred on property, plant and equipment and intangible assets.

H S B C H O L D I N G S P L C
Notes on the Financial Statements (continued) Notes 14 and 15
392
Year ended 31 December 2006
Personal Financial Services
Commercial Banking
Global Banking & Markets
Private Banking Other
Intra- HSBC items
Total US$m US$m US$m US$m US$m US$m US$m
Net interest income/(expense) .... 26,076 7,514 3,168 1,011 (625) (2,658) 34,486
Net fee income ............................ 8,762 3,207 3,718 1,323 172 – 17,182
Trading income/(expense) excluding net interest income . 391 204 4,890 362 (228) – 5,619
Net interest income/(expense) on trading activities ................ 220 20 (379) 2 82 2,658 2,603
Net trading income/(expense) ..... 611 224 4,511 364 (146) 2,658 8,222
Changes in fair value of long- term debt issued and related derivatives .............................. – – – – (35) – (35)
Net income/(expense) from other financial instruments designated at fair value ........... 739 (22) 20 1 (46) – 692
Net income/(expense) from financial instruments designated at fair value ........... 739 (22) 20 1 (81) – 657
Gains less losses from financial investments ............................. 78 44 534 166 147 – 969
Dividend income ......................... 31 6 235 5 63 – 340 Net earned insurance premiums . 5,130 258 73 – 207 – 5,668 Other operating income .............. 782 250 1,378 61 3,254 (3,179) 2,546
Total operating income ............... 42,209 11,481 13,637 2,931 2,991 (3,179) 70,070
Net insurance claims incurred and movement in liabilities to policyholders ...................... (4,365) (96) (62) – (181) – (4,704)
Net operating income1 ................. 37,844 11,385 13,575 2,931 2,810 (3,179) 65,366
Loan impairment (charges)/ recoveries and other credit risk provisions ........................ (9,949) (697) 119 (33) (13) – (10,573)
Net operating income2 ................ 27,895 10,688 13,694 2,898 2,797 (3,179) 54,793
Operating expenses ..................... (18,818) (4,979) (7,991) (1,685) (3,259) 3,179 (33,553)
Operating profit/(loss) ................ 9,077 5,709 5,703 1,213 (462) – 21,240
Share of profit in associates and joint ventures ................... 380 288 103 1 74 – 846
Profit/(loss) before tax ................ 9,457 5,997 5,806 1,214 (388) – 22,086
Capital expenditure incurred3 ..... 2,150 1,083 1,021 45 684 – 4,983
1 Net operating income before loan impairment (charges)/recoveries and other credit risk provisions. 2 Net operating income:
External .................................. 23,238 9,692 20,034 1,661 168 – 54,793Inter-segment .......................... 4,657 996 (6,340) 1,237 2,629 (3,179) –
3 Expenditure incurred on property, plant and equipment and intangible assets.
15 Analysis of financial assets and liabilities by measurement basis
Financial assets and financial liabilities are measured on an ongoing basis either at fair value or at amortised cost. The summary of significant accounting policies in Note 2 describes how the classes of financial instruments are measured, and how income and expenses, including fair value gains and losses, are recognised. The following table analyses the carrying amounts of the financial assets and liabilities by category as defined in IAS 39 and by balance sheet heading.

393
HS
BC
A
t 31
Dec
embe
r 20
08
H
eld
for
tr
adin
g D
esig
nate
d at
fair
val
ue
H
eld-
to-
m
atur
ity
se
curi
ties
Loa
ns a
nd
rec
eiva
bles
A
vaila
ble-
fo
r-sa
le
se
curi
ties
Fi
nanc
ial
as
sets
and
li
abili
ties a
t
amor
tised
cost
Der
ivat
ives
d
esig
nate
d as
fair
val
ue
he
dgin
g in
stru
men
ts
Der
ivat
ives
d
esig
nate
d as
cas
h flo
w
he
dgin
g in
stru
men
ts
T
otal
U
S$m
U
S$m
U
S$m
U
S$m
U
S$m
U
S$m
U
S$m
U
S$m
U
S$m
Fi
nanc
ial a
sset
s
Cas
h an
d ba
lanc
es a
t cen
tral b
anks
....
......
......
......
......
......
......
......
......
......
– –
– –
– 52
,396
–
– 52
,396
Ite
ms i
n th
e co
urse
of c
olle
ctio
n fr
om o
ther
ban
ks ..
......
......
......
......
......
..–
– –
– –
6,00
3 –
– 6,
003
Hon
g K
ong
Gov
ernm
ent c
ertif
icat
es o
f ind
ebte
dnes
s ...
......
......
......
......
..–
– –
15,3
58
– –
– –
15,3
58
Trad
ing
asse
ts ..
......
......
......
......
......
......
......
......
......
......
......
......
......
......
.....
427,
329
– –
– –
– –
– 42
7,32
9 Fi
nanc
ial a
sset
s des
igna
ted
at fa
ir va
lue
......
......
......
......
......
......
......
......
..–
28,5
33
– –
– –
– –
28,5
33
Der
ivat
ives
.....
......
......
......
......
......
......
......
......
......
......
......
......
......
......
......
.48
8,38
5 –
– –
– –
839
5,65
2 49
4,87
6 Lo
ans a
nd a
dvan
ces t
o ba
nks
......
......
......
......
......
......
......
......
......
......
......
.–
– –
153,
766
– –
– –
153,
766
Loan
s and
adv
ance
s to
cust
omer
s ...
......
......
......
......
......
......
......
......
......
...–
– –
932,
868
– –
– –
932,
868
Fina
ncia
l inv
estm
ents
.....
......
......
......
......
......
......
......
......
......
......
......
......
..–
– 14
,013
–
286,
222
– –
– 30
0,23
5 O
ther
ass
ets
......
......
......
......
......
......
......
......
......
......
......
......
......
......
......
.....
– –
– 11
1
27,0
93
– –
27,1
05
Acc
rued
inco
me
......
......
......
......
......
......
......
......
......
......
......
......
......
......
....
– –
– –
– 13
,754
–
– 13
,754
Tota
l fin
anci
al a
sset
s ...
......
......
......
......
......
......
......
......
......
......
......
......
.....
915,
714
28,5
33
14,0
13
1,10
2,00
3 28
6,22
3 99
,246
83
9 5,
652
2,45
2,22
3
Fi
nanc
ial l
iabi
litie
s
Hon
g K
ong
curr
ency
not
es in
circ
ulat
ion
......
......
......
......
......
......
......
......
– –
– 15
,358
–
– –
– 15
,358
D
epos
its b
y ba
nks
......
......
......
......
......
......
......
......
......
......
......
......
......
......
.–
– –
– –
130,
084
– –
130,
084
Cus
tom
er a
ccou
nts .
......
......
......
......
......
......
......
......
......
......
......
......
......
.....
– –
– –
– 1,
115,
327
– –
1,11
5,32
7 Ite
ms i
n th
e co
urse
of t
rans
mis
sion
to o
ther
ban
ks .
......
......
......
......
......
...–
– –
– –
7,23
2 –
– 7,
232
Trad
ing
liabi
litie
s ....
......
......
......
......
......
......
......
......
......
......
......
......
......
....
247,
652
– –
– –
– –
– 24
7,65
2 Fi
nanc
ial l
iabi
litie
s des
igna
ted
at fa
ir va
lue
......
......
......
......
......
......
......
...–
74,5
87
– –
– –
– –
74,5
87
Der
ivat
ives
.....
......
......
......
......
......
......
......
......
......
......
......
......
......
......
......
.48
1,79
9 –
– –
– –
1,26
7 3,
994
487,
060
Deb
t sec
uriti
es in
issu
e ...
......
......
......
......
......
......
......
......
......
......
......
......
..–
– –
– –
179,
693
– –
179,
693
Oth
er li
abili
ties
......
......
......
......
......
......
......
......
......
......
......
......
......
......
.....
– –
– –
– 70
,003
–
– 70
,003
A
ccru
als
......
......
......
......
......
......
......
......
......
......
......
......
......
......
......
......
....
– –
– –
– 14
,072
–
– 14
,072
Su
bord
inat
ed li
abili
ties
......
......
......
......
......
......
......
......
......
......
......
......
.....
– –
– –
– 29
,433
–
– 29
,433
Tota
l fin
anci
al li
abili
ties
......
......
......
......
......
......
......
......
......
......
......
......
...72
9,45
1 74
,587
–
15,3
58
– 1,
545,
844
1,26
7 3,
994
2,37
0,50
1

H S B C H O L D I N G S P L C
Notes on the Financial Statements (continued) Note 15
394
HS
BC
A
t 31
Dec
embe
r 200
7
H
eld
for
tra
ding
D
esig
nate
d a
t fai
r val
ue
H
eld-
to-
m
atur
ity
se
curit
ies
Lo
ans a
nd
rec
eiva
bles
A
vaila
ble-
fo
r-sa
le
se
curit
ies
Fi
nanc
ial
as
sets
and
l
iabi
litie
s at
am
ortis
ed
co
st
Der
ivat
ives
desi
gnat
ed
as f
air v
alue
hedg
ing
ins
trum
ents
Der
ivat
ives
desi
gnat
ed
as c
ash
flow
hedg
ing
ins
trum
ents
Tota
l U
S$m
U
S$m
U
S$m
U
S$m
U
S$m
U
S$m
U
S$m
U
S$m
U
S$m
Fi
nanc
ial a
sset
s
Cas
h an
d ba
lanc
es a
t cen
tral b
anks
....
......
......
......
......
......
......
......
......
......
– –
– –
– 21
,765
–
– 21
,765
Ite
ms i
n th
e co
urse
of c
olle
ctio
n fr
om o
ther
ban
ks ..
......
......
......
......
......
..–
– –
– –
9,77
7 –
– 9,
777
Hon
g K
ong
Gov
ernm
ent c
ertif
icat
es o
f ind
ebte
dnes
s ...
......
......
......
......
..–
– –
13,8
93
– –
– –
13,8
93
Trad
ing
asse
ts ..
......
......
......
......
......
......
......
......
......
......
......
......
......
......
.....
445,
968
– –
– –
– –
– 44
5,96
8 Fi
nanc
ial a
sset
s des
igna
ted
at fa
ir va
lue
......
......
......
......
......
......
......
......
..–
41,5
64
– –
– –
– –
41,5
64
Der
ivat
ives
.....
......
......
......
......
......
......
......
......
......
......
......
......
......
......
......
.18
2,60
4 –
– –
– –
335
4,91
5 18
7,85
4 Lo
ans a
nd a
dvan
ces t
o ba
nks
......
......
......
......
......
......
......
......
......
......
......
.–
– –
237,
366
– –
– –
237,
366
Loan
s and
adv
ance
s to
cust
omer
s ...
......
......
......
......
......
......
......
......
......
...–
– –
981,
548
– –
– –
981,
548
Fina
ncia
l inv
estm
ents
.....
......
......
......
......
......
......
......
......
......
......
......
......
..–
– 9,
768
– 27
3,23
2 –
– –
283,
000
Oth
er a
sset
s ...
......
......
......
......
......
......
......
......
......
......
......
......
......
......
......
..–
– –
14
28
25,0
84
– –
25,1
26
Acc
rued
inco
me
......
......
......
......
......
......
......
......
......
......
......
......
......
......
....
– –
– –
– 18
,119
–
– 18
,119
Tota
l fin
anci
al a
sset
s ...
......
......
......
......
......
......
......
......
......
......
......
......
.....
628,
572
41,5
64
9,76
8 1,
232,
821
273,
260
74,7
45
335
4,91
5 2,
265,
980
Fina
ncia
l lia
bilit
ies
H
ong
Kon
g cu
rren
cy n
otes
in c
ircul
atio
n ...
......
......
......
......
......
......
......
...–
– –
13,8
93
– –
– –
13,8
93
Dep
osits
by
bank
s ...
......
......
......
......
......
......
......
......
......
......
......
......
......
....
– –
– –
– 13
2,18
1 –
– 13
2,18
1 C
usto
mer
acc
ount
s ....
......
......
......
......
......
......
......
......
......
......
......
......
......
..–
– –
– –
1,09
6,14
0 –
– 1,
096,
140
Item
s in
the
cour
se o
f tra
nsm
issi
on to
oth
er b
anks
....
......
......
......
......
......
– –
– –
– 8,
672
– –
8,67
2 Tr
adin
g lia
bilit
ies .
......
......
......
......
......
......
......
......
......
......
......
......
......
......
.31
4,58
0 –
– –
– –
– –
314,
580
Fina
ncia
l lia
bilit
ies d
esig
nate
d at
fair
valu
e ...
......
......
......
......
......
......
......
– 89
,939
–
– –
– –
– 89
,939
D
eriv
ativ
es ..
......
......
......
......
......
......
......
......
......
......
......
......
......
......
......
....
181,
009
– –
– –
– 40
3 1,
981
183,
393
Deb
t sec
uriti
es in
issu
e ...
......
......
......
......
......
......
......
......
......
......
......
......
..–
– –
– –
246,
579
– –
246,
579
Oth
er li
abili
ties
......
......
......
......
......
......
......
......
......
......
......
......
......
......
.....
– –
– –
– 32
,892
–
– 32
,892
A
ccru
als
......
......
......
......
......
......
......
......
......
......
......
......
......
......
......
......
....
– –
– –
– 19
,572
–
– 19
,572
Su
bord
inat
ed li
abili
ties
......
......
......
......
......
......
......
......
......
......
......
......
.....
– –
– –
– 24
,819
–
– 24
,819
Tota
l fin
anci
al li
abili
ties
......
......
......
......
......
......
......
......
......
......
......
......
...49
5,58
9 89
,939
–
13,8
93
– 1,
560,
855
403
1,98
1 2,
162,
660

395
HSBC Holdings
At 31 December 2008
Held for trading
Designated at fair value
Loans and receivables
Available- for-sale securities
Financial assets and liabilities at amortised cost Total
US$m US$m US$m US$m US$m US$m Financial assets Cash at bank and in hand .................................... – – – – 443 443 Derivatives .......................................................... 3,682 – – – – 3,682 Loans and advances to HSBC undertakings ...... – – 11,804 – – 11,804 Financial investments ......................................... – – – 2,629 – 2,629 Other assets ......................................................... – – – – 25 25
Total financial assets .......................................... 3,682 – 11,804 2,629 468 18,583
Financial liabilities Amounts owed to HSBC undertakings .............. – – – – 4,042 4,042 Financial liabilities designated at fair value ....... – 16,389 – – – 16,389 Derivatives .......................................................... 1,324 – – – – 1,324 Subordinated liabilities ....................................... – – – – 14,017 14,017 Other liabilities ................................................... – – – – 10 10 Accruals .............................................................. – – – – 288 288
Total financial liabilities ..................................... 1,324 16,389 – – 18,357 36,070
At 31 December 2007
Held for trading
Designated at fair value
Loans and receivables
Available- for-sale securities
Financial assets and liabilities at amortised cost Total
US$m US$m US$m US$m US$m US$m Financial assets Cash at bank and in hand .................................... – – – – 360 360 Derivatives .......................................................... 2,660 – – – – 2,660 Loans and advances to HSBC undertakings ...... – – 17,242 – – 17,242 Financial investments ......................................... – – – 3,022 – 3,022 Other assets ......................................................... – – – – 21 21
Total financial assets .......................................... 2,660 – 17,242 3,022 381 23,305
Financial liabilities Amounts owed to HSBC undertakings .............. – – – – 2,969 2,969 Financial liabilities designated at fair value ....... – 18,683 – – – 18,683 Derivatives .......................................................... 44 – – – – 44 Subordinated liabilities ....................................... – – – – 8,544 8,544 Other liabilities ................................................... – – – – 5 5 Accruals .............................................................. – – – – 150 150
Total financial liabilities ..................................... 44 18,683 – – 11,668 30,395

H S B C H O L D I N G S P L C
Notes on the Financial Statements (continued) Notes 16 and 17
396
16 Trading assets
2008 2007 US$m US$m Trading assets:
– not subject to repledge or resale by counterparties ................................................................... 340,675 308,286 – which may be repledged or resold by counterparties ............................................................... 86,654 137,682
427,329 445,968 Treasury and other eligible bills ........................................................................................................ 32,458 16,439 Debt securities ................................................................................................................................... 199,619 178,834 Equity securities ................................................................................................................................ 21,878 51,476
253,955 246,749 Loans and advances to banks ............................................................................................................ 73,055 100,440 Loans and advances to customers ..................................................................................................... 100,319 98,779
427,329 445,968
The following table provides an analysis of trading securities:
Fair value 2008 2007 US$m US$m
US Treasury and US Government agencies1 ..................................................................................... 26,621 17,335 UK Government ................................................................................................................................. 10,586 11,607 Hong Kong Government ................................................................................................................... 6,648 5,517 Other government .............................................................................................................................. 98,983 80,268 Asset-backed securities2 .................................................................................................................... 6,566 21,502 Corporate debt and other securities ................................................................................................... 82,673 59,044 Equity securities ................................................................................................................................ 21,878 51,476
253,955 246,749
1 Includes securities that are supported by an explicit guarantee issued by the US Government. 2 Excludes asset-backed securities included under US Treasury and US Government agencies.
Included within the above figures are debt securities issued by banks and other financial institutions of US$49,997 million (2007: US$69,818 million), of which US$3,449 million (2007: US$1,488 million) are guaranteed by various governments.
The following table analyses trading securities between those listed on a recognised exchange and those that are unlisted:
Treasury and other eligible bills
Debt securities
Equity securities
Total
US$m US$m US$m US$m Fair value at 31 December 2008 Listed on a recognised exchange1 ................................ 1 145,370 20,871 166,242 Unlisted ......................................................................... 32,457 54,249 1,007 87,713
32,458 199,619 21,878 253,955 Fair value at 31 December 2007 Listed on a recognised exchange1 ................................ 34 115,593 50,092 165,719 Unlisted ......................................................................... 16,405 63,241 1,384 81,030
16,439 178,834 51,476 246,749
1 Included within listed investments are US$3,870 million (2007: US$6,977 million) of investments listed in Hong Kong.

397
Loans and advances to banks held for trading consist of: 2008 2007 US$m US$m
Reverse repos ..................................................................................................................................... 48,188 80,476 Settlement accounts ........................................................................................................................... 4,337 8,227 Stock borrowing ................................................................................................................................. 1,888 8,259 Other .................................................................................................................................................. 18,642 3,478
73,055 100,440
Loans and advances to customers held for trading consist of: 2008 2007 US$m US$m
Reverse repos ..................................................................................................................................... 58,285 51,543 Stock borrowing ................................................................................................................................. 13,740 24,254 Settlement accounts ........................................................................................................................... 10,116 6,216 Other .................................................................................................................................................. 18,178 16,766
100,319 98,779
17 Financial assets designated at fair value
2008 2007 US$m US$m
Treasury and other eligible bills ........................................................................................................ 235 181 Debt securities ................................................................................................................................... 16,349 21,150 Equity securities ................................................................................................................................. 10,993 20,047
Securities designated at fair value ..................................................................................................... 27,577 41,378 Loans and advances to banks ............................................................................................................ 230 178 Loans and advances to customers ...................................................................................................... 726 8
28,533 41,564
Securities designated at fair value
Fair value 2008 2007 US$m US$m
US Treasury and US Government agencies1 ..................................................................................... 93 252 UK Government ................................................................................................................................. 992 788 Hong Kong Government ................................................................................................................... 284 314 Other government .............................................................................................................................. 3,624 4,427 Asset-backed securities2 .................................................................................................................... 6,492 8,132 Corporate debt and other securities ................................................................................................... 5,099 7,418 Equities .............................................................................................................................................. 10,993 20,047
27,577 41,378
1 Includes securities that are supported by an explicit guarantee issued by the US Government. 2 Excludes asset-backed securities included under US Treasury and US Government agencies.
Included within the above figures are debt securities issued by banks and other financial institutions of US$10,351 million (2007: US$14,401 million), of which US$14 million (2007: nil) are guaranteed by various governments.

H S B C H O L D I N G S P L C
Notes on the Financial Statements (continued) Notes 17 and 18
398
Treasury and other eligible bills
Debt securities
Equity securities
Total US$m US$m US$m US$m Fair value at 31 December 2008 Listed on a recognised exchange1 ................................ 80 3,490 8,140 11,710 Unlisted ......................................................................... 155 12,859 2,853 15,867
235 16,349 10,993 27,577 Fair value at 31 December 2007 Listed on a recognised exchange1 ................................ 50 8,659 15,449 24,158 Unlisted ......................................................................... 131 12,491 4,598 17,220
181 21,150 20,047 41,378
1 Included within listed investments are US$576 million of investments listed in Hong Kong (2007: US$1,502 million).
18 Derivatives
Fair values of derivatives by product contract type held by HSBC
Assets Liabilities Trading Hedging Total Trading Hedging Total US$m US$m US$m US$m US$m US$m At 31 December 2008 Foreign exchange ................................................ 115,803 2,010 117,813 115,311 826 116,137 Interest rate ......................................................... 259,672 4,481 264,153 252,131 4,435 256,566 Equities ............................................................... 18,660 – 18,660 21,913 – 21,913 Credit derivatives ................................................ 91,271 – 91,271 89,715 – 89,715 Commodity and other ......................................... 2,979 – 2,979 2,729 – 2,729
Total fair values .................................................. 488,385 6,491 494,876 481,799 5,261 487,060 At 31 December 2007 Foreign exchange ................................................ 52,018 3,490 55,508 50,608 371 50,979 Interest rate ......................................................... 83,982 1,759 85,741 83,374 2,013 85,387 Equities ............................................................... 20,229 1 20,230 19,458 – 19,458 Credit derivatives ................................................ 25,268 – 25,268 26,247 – 26,247 Commodity and other ......................................... 1,107 – 1,107 1,322 – 1,322
Total fair values .................................................. 182,604 5,250 187,854 181,009 2,384 183,393
The 163 per cent increase in the fair value of derivative assets during 2008 was driven by increased volatility and movement in yield curves, foreign exchange rates and credit spreads. The increase in the notional contract amounts of HSBC’s derivative assets in the year was only 8 per cent. However, IFRSs only permit netting of assets and liabilities with the same counterparty in very limited circumstances, even when there are contractually agreed netting arrangements in place.
Fair values of derivatives by product contract type held by HSBC Holdings with subsidiaries
2008 2007 Trading Trading Trading Trading assets liabilities assets liabilities US$m US$m US$m US$m
Foreign exchange .......................................................... 1,772 1,324 2,381 2 Interest rate ................................................................... 1,910 – 279 42
Total fair values ............................................................ 3,682 1,324 2,660 44
Derivatives are financial instruments that derive their value from the price of underlying items such as equities, bonds, interest rates, foreign exchange, credit spreads, commodities and equity or other indices. Derivatives enable users to increase, reduce or alter exposure to credit or market risks. HSBC makes markets in derivatives for its customers and uses derivatives to manage its exposure to credit and market risks.

399
Derivatives are carried at fair value and shown in the balance sheet as separate totals of assets and liabilities. A description of how the fair value of derivatives is derived is set out on page 165. Derivative assets and liabilities on different transactions are only set off if the transactions are with the same counterparty, a legal right of set-off exists and the cash flows are intended to be settled on a net basis.
Use of derivatives
HSBC transacts derivatives for three primary purposes: to create risk management solutions for clients, for proprietary trading purposes, and to manage and hedge HSBC’s own risks. Derivatives (except for derivatives which are designated as effective hedging instruments as defined in IAS 39) are held for trading. The held for trading classification includes two types of derivatives: those used in sales and trading activities, and those used for risk management purposes but which for various reasons do not meet the qualifying criteria for hedge accounting. The second category includes derivatives managed in conjunction with financial instruments designated at fair value. These activities are described more fully below.
HSBC’s derivative activities give rise to significant open positions in portfolios of derivatives. These positions are managed constantly to ensure that they remain within acceptable risk levels, with matching deals being utilised to achieve this where necessary. When entering into derivative transactions, HSBC employs the same credit risk management procedures to assess and approve potential credit exposures that are used for traditional lending.
Trading derivatives
Most of HSBC’s derivative transactions relate to sales and trading activities. Sales activities include the structuring and marketing of derivative products to customers to enable them to take, transfer, modify or reduce current or expected risks. Trading activities in derivatives are entered into principally for the purpose of generating profits from short-term fluctuations in price or margin. Positions may be traded actively or be held over a period of time to benefit from expected changes in exchange rates, interest rates, equity prices or other market parameters. Trading includes market-making, positioning and arbitrage activities. Market-making entails quoting bid and offer prices to other market participants for the purpose of generating revenues based on spread and volume; positioning means managing market risk positions in the expectation of benefiting from favourable movements in prices, rates or indices; arbitrage involves identifying and profiting from price differentials between markets and products.
As mentioned above, other derivatives classified as held for trading include non-qualifying hedging derivatives, ineffective hedging derivatives and the components of hedging derivatives that are excluded from assessing hedge effectiveness. Non-qualifying hedging derivatives are entered into for risk management purposes but do not meet the criteria for hedge accounting. These include derivatives managed in conjunction with financial instruments designated at fair value.
Gains and losses from changes in the fair value of derivatives, including the contractual interest, that do not qualify for hedge accounting are reported in ‘Net trading income’, except for derivatives managed in conjunction with financial instruments designated at fair value, where gains and losses are reported in ‘Net income from financial instruments designated at fair value’, together with the gains and losses on the hedged items. Where the derivatives are managed with debt securities in issue, the contractual interest is shown in ‘interest expense’ together with the interest payable on the issued debt. Substantially all of HSBC Holdings’ derivatives entered into with HSBC undertakings are managed in conjunction with financial liabilities designated at fair value.
Notional contract amounts of derivatives held for trading purposes by product type
The notional contract amounts of these instruments indicate the nominal value of transactions outstanding at the balance sheet date; they do not represent amounts at risk.
HSBC HSBC Holdings 2008 2007 2008 2007 US$m US$m US$m US$m
Foreign exchange .......................................................... 3,045,017 3,243,738 14,312 12,790 Interest rate ................................................................... 12,435,965 10,672,971 7,804 7,804 Equities ......................................................................... 221,053 286,927 – – Credit derivatives .......................................................... 1,583,337 1,893,802 – – Commodity and other ................................................... 63,103 33,188 – –
17,348,475 16,130,626 22,116 20,594

H S B C H O L D I N G S P L C
Notes on the Financial Statements (continued) Note 18
400
Credit derivatives
HSBC trades credit derivatives through its principal dealing operations and acts as a principal counterparty to a broad range of users, structuring deals to produce risk management products for its customers, or making markets in certain products. Risk is typically controlled through entering into offsetting credit derivative contracts with other counterparties.
HSBC manages the credit risk arising on buying and selling credit derivative protection by including the related credit exposures within its overall credit limit structure for the relevant counterparty. Trading of credit derivatives is restricted to a small number of offices within the major centres which have the control infrastructure and market skills to manage effectively the credit risk inherent in the products.
Credit derivatives are also deployed to a limited extent for the risk management of the Group’s loan portfolios.
The notional contract amount of credit derivatives of US$1,583,337 million (2007: US$1,893,802 million) consisted of protection bought of US$777,556 million (2007: US$926,794 million) and protection sold of US$805,781 million (2007: US$967,008 million).
The difference between the notional amounts bought and sold is attributable to HSBC selling protection on large, diversified, predominantly investment grade portfolios (including the most senior tranches) and then offsetting the risk on these positions by buying protection on the more subordinated tranches of the same portfolios. In addition, HSBC uses securities to mitigate risks on certain derivative positions and credit derivative contracts to reduce counterparty exposures. Consequently, while there is a mismatch in notional amounts of credit derivatives bought and sold this should not be interpreted as representing the open risk position. The credit derivative business operates within the market risk management framework described on pages 241 to 251.
Derivatives valued using models with unobservable inputs
The difference between the fair value at initial recognition (the transaction price) and the value that would have been derived had valuation techniques used for subsequent measurement been applied at initial recognition, less subsequent releases, is as follows:
2008 2007 US$m US$m
Unamortised balance at 1 January ..................................................................................................... 306 214 Deferral on new transactions ............................................................................................................. 326 384 Recognised in the income statement during the period:
– amortisation ................................................................................................................................ (168) (85)– subsequent to unobservable inputs becoming observable ......................................................... (118) (83)– maturity, termination or offsetting derivative ............................................................................ (99) (121)
Exchange differences ......................................................................................................................... (38) 4 Risk hedged ....................................................................................................................................... (5) (7)
Unamortised balance at 31 December1 .............................................................................................. 204 306
1 This amount is yet to be recognised in the consolidated income statement.
Hedging instruments
HSBC uses derivatives (principally interest rate swaps) for hedging purposes in the management of its own asset and liability portfolios and structural positions. This enables HSBC to optimise the overall cost to the Group of accessing debt capital markets, and to mitigate the market risk which would otherwise arise from structural imbalances in the maturity and other profiles of its assets and liabilities.
The accounting treatment of hedge transactions varies according to the nature of the instrument hedged and the type of hedge transactions. Derivatives may qualify as hedges for accounting purposes if they are fair value hedges, cash flow hedges, or hedges in net investment of foreign operations. These are described under the relevant headings below:

401
Notional contract amounts of derivatives held for hedging purposes by product type
The notional contract amounts of these instruments indicate the nominal value of transactions outstanding at the balance sheet date; they do not represent amounts at risk.
At 31 December 2008 At 31 December 2007
Cash flow hedge
Fair value hedge
Cash flow hedge
Fair value hedge
US$m US$m US$m US$m
Foreign exchange .......................................................... 14,931 2,602 21,641 3,116 Interest rate ................................................................... 229,785 27,305 248,134 34,897 Equities ......................................................................... – – – 24
244,716 29,907 269,775 38,037
Fair value hedges
HSBC’s fair value hedges principally consist of interest rate swaps that are used to protect against changes in the fair value of fixed-rate long-term financial instruments due to movements in market interest rates. For qualifying fair value hedges, all changes in the fair value of the derivative and in the fair value of the item in relation to the risk being hedged are recognised in the income statement. If the hedge relationship is terminated, the fair value adjustment to the hedged item continues to be reported as part of the basis of the item and is amortised to the income statement as a yield adjustment over the remainder of the hedging period.
Fair value of derivatives designated as fair value hedges
At 31 December 2008 At 31 December 2007 Fair value Fair value Assets Liabilities Assets Liabilities US$m US$m US$m US$m
Foreign exchange .......................................................... 265 10 163 65 Interest rate ................................................................... 574 1,257 171 338 Equities ......................................................................... – – 1 –
839 1,267 335 403
Gains or losses arising from fair value hedges
2008 2007 2006 US$m US$m US$m Gains/(losses): – on hedging instruments ............................................................................... (296) (186) 8 – on the hedged items attributable to the hedged risk .................................... 301 205 8
5 19 16
The gains and losses on ineffective portions of fair value hedges are recognised immediately in ‘Net trading income’.
Cash flow hedges
HSBC’s cash flow hedges consist principally of interest rate and cross-currency swaps that are used to protect against exposures to variability in future interest cash flows on non-trading assets and liabilities which bear interest at variable rates or which are expected to be re-funded or reinvested in the future. The amounts and timing of future cash flows, representing both principal and interest flows, are projected for each portfolio of financial assets and liabilities on the basis of their contractual terms and other relevant factors, including estimates of prepayments and defaults. The aggregate principal balances and interest cash flows across all portfolios over time form the basis for identifying gains and losses on the effective portions of derivatives designated as cash flow hedges of forecast transactions. Gains and losses are initially recognised directly in equity, in the cash flow hedging reserve, and are transferred to the income statement when the forecast cash flows affect the income statement.

H S B C H O L D I N G S P L C
Notes on the Financial Statements (continued) Notes 18 and 19
402
Fair value of derivatives designated as cash flow hedges
At 31 December 2008 At 31 December 2007 Fair value Fair value Assets Liabilities Assets Liabilities US$m US$m US$m US$m
Foreign exchange .......................................................... 1,745 816 3,327 306 Interest rate ................................................................... 3,907 3,178 1,588 1,675
5,652 3,994 4,915 1,981
The schedule of forecast principal balances on which interest cash flows are expected to arise as at 31 December 2008 is as follows:
3 months or less
More than 3 months but less than 1 year
5 years or less but more than 1 year
More than 5 years
US$m US$m US$m US$m At 31 December 2008 Assets ............................................................................ 99,426 71,491 52,988 2,081 Liabilities ...................................................................... (83,019) (77,656) (62,633) (7,817)
Net cash inflows/(outflows) exposure .......................... 16,407 (6,165) (9,645) (5,736) At 31 December 2007 Assets ............................................................................ 90,575 78,215 36,952 227 Liabilities ...................................................................... (89,891) (77,389) (68,189) (5,955)
Net cash inflows/(outflows) exposure .......................... 684 826 (31,237) (5,728)
This table reflects the interest rate repricing profile of the underlying hedged items.
The gains and losses on ineffective portions of such derivatives are recognised immediately in ‘Net trading income’. During the year to 31 December 2008, a loss of US$40 million (2007: loss of US$77 million; 2006: loss of US$122 million) was recognised due to hedge ineffectiveness.
Hedges of net investments in foreign operations
HSBC’s consolidated balance sheet is affected by exchange differences between the US dollar and all the non-US dollar functional currencies of subsidiaries. HSBC hedges structural foreign exchange exposures only in limited circumstances. Hedging is undertaken using forward foreign exchange contracts which are accounted for as hedges of a net investment in a foreign operation, or by financing with borrowings in the same currencies as the functional currencies involved.
At 31 December 2008, the fair values of outstanding financial instruments designated as hedges of net investments in foreign operations were liabilities of US$52 million (2007: US$450 million) and notional contract values of US$161 million (2007: US$1,204 million).
The ineffectiveness recognised in ‘Net trading income’ in the year ended 31 December 2008 that arose from hedges in foreign operations was nil (2007 and 2006: nil).

403
19 Financial investments
2008 2007 US$m US$m Financial investments:
– not subject to repledge or resale by counterparties ................................................................... 287,479 271,126 – which may be repledged or resold by counterparties ............................................................... 12,756 11,874
300,235 283,000
2008 2007 Carrying
amount Fair value
Carrying amount
Fairvalue
US$m US$m US$m US$m
Treasury and other eligible bills ................................... 41,027 41,027 30,104 30,104 – available-for-sale .................................................. 41,027 41,027 30,104 30,104
Debt securities .............................................................. 251,957 253,001 240,302 240,688 – available-for-sale .................................................. 237,944 237,944 230,534 230,534– held-to-maturity .................................................... 14,013 15,057 9,768 10,154
Equity securities ............................................................ 7,251 7,251 12,594 12,594 – available-for-sale .................................................. 7,251 7,251 12,594 12,594
Total financial investments ........................................... 300,235 301,279 283,000 283,386
Amortised cost
Fair value
US$m US$m
At 31 December 2008 US Treasury ....................................................................................................................................... 11,528 11,755 US Government agencies1 ................................................................................................................. 8,131 8,307 US Government sponsored entities1 .................................................................................................. 15,109 15,240 UK Government ................................................................................................................................. 16,077 16,217 Hong Kong Government ................................................................................................................... 966 989 Other government .............................................................................................................................. 60,755 61,528 Asset-backed securities2 .................................................................................................................... 55,685 36,052 Corporate debt and other securities ................................................................................................... 145,269 143,940 Equities .............................................................................................................................................. 5,901 7,251
319,421 301,279
At 31 December 2007 US Treasury ....................................................................................................................................... 6,799 6,831 US Government agencies1 ................................................................................................................. 5,709 5,732 US Government sponsored entities1 .................................................................................................. 14,732 14,533 UK Government ................................................................................................................................. 757 749 Hong Kong Government ................................................................................................................... 3,941 3,942 Other government .............................................................................................................................. 60,109 60,320 Asset-backed securities2 .................................................................................................................... 64,186 63,976 Corporate debt and other securities ................................................................................................... 114,955 114,709 Equities .............................................................................................................................................. 8,405 12,594
279,593 283,386
At 31 December 2006 US Treasury ....................................................................................................................................... 10,219 10,203 US Government agencies1 ................................................................................................................. 6,004 5,968 US Government sponsored entities1 .................................................................................................. 14,010 13,799 UK Government ................................................................................................................................. 7,515 7,502 Hong Kong Government ................................................................................................................... 1,085 1,080 Other government .............................................................................................................................. 37,828 38,198 Asset-backed securities2 .................................................................................................................... 26,752 26,750 Corporate debt and other securities ................................................................................................... 93,217 93,311 Equities .............................................................................................................................................. 6,295 8,297
202,925 205,108
1 Includes securities that are supported by an explicit guarantee issued by the US Government. 2 Excludes asset-backed securities included under US Government agencies and sponsored entities.

H S B C H O L D I N G S P L C
Notes on the Financial Statements (continued) Notes 19 and 20
404
Included within the above figures are debt securities issued by banks and other financial institutions of US$140,878 million (2007: US$142,863 million; 2006: US$86,649 million), of which US$39,213 million (2007: US$2,490 million; 2006: nil) are guaranteed by various governments.
The fair value of the debt securities issued by banks and other financial institutions was US$141,526 million (2007: US$143,023 million; 2006: US$86,596 million).
Treasury and other eligible bills available- for-sale
Debt securities available- for-sale
Debt securities held-to- maturity
Equity securities
Total US$m US$m US$m US$m US$m
Carrying amount at 31 December 2008 Listed on a recognised exchange .................................... 3,539 108,972 2,332 471 115,314 Unlisted ........................................................................... 37,488 128,972 11,681 6,780 184,921
41,027 237,944 14,013 7,251 300,235
Carrying amount at 31 December 2007 Listed on a recognised exchange .................................... 1,062 107,059 3,399 3,301 114,821 Unlisted ........................................................................... 29,042 123,475 6,369 9,293 168,179
30,104 230,534 9,768 12,594 283,000
The fair value of listed held-to-maturity debt securities as at 31 December 2008 was US$4,926 million (2007: US$3,469 million). Included within listed investments were US$1,475 million (2007: US$2,066 million) of investments listed in Hong Kong.
The maturities of investment in debt securities at their carrying amount are analysed as follows:
At 31 December 2008 2007 US$m US$m Remaining contractual maturity of total debt securities:
1 year or less .................................................................................................................................. 72,551 80,979 5 years or less but over 1 year ....................................................................................................... 93,824 76,306 10 years or less but over 5 years ................................................................................................... 28,141 34,175 Over 10 years ................................................................................................................................. 57,441 48,842
251,957 240,302 Remaining contractual maturity of debt securities available for sale:
1 year or less .................................................................................................................................. 71,967 80,498 5 years or less but over 1 year ....................................................................................................... 89,931 74,279 10 years or less but over 5 years ................................................................................................... 22,402 30,607 Over 10 years ................................................................................................................................. 53,644 45,150
237,944 230,534 Remaining contractual maturity of debt securities held to maturity:
1 year or less .................................................................................................................................. 584 481 5 years or less but over 1 year ....................................................................................................... 3,893 2,027 10 years or less but over 5 years ................................................................................................... 5,739 3,568 Over 10 years ................................................................................................................................. 3,797 3,692
14,013 9,768

405
The following table provides an analysis of contractual maturities and weighted average yields of investment debt securities as at 31 December 2008:
Within one year After one year but within five years
After five years but within ten years After ten years
Amount Yield Amount Yield Amount Yield Amount Yield US$m % US$m % US$m % US$m % Available-for-sale US Treasury ................................... 41 2.44 1,049 1.14 225 1.89 985 4.52 US Government agencies .............. – – 15 6.67 298 5.03 7,324 3.74 US Government-sponsored
agencies ..................................... 760 4.61
569 6.68
1,398 3.15
10,466 4.70 UK Government ............................. – – 446 2.47 – – 1,385 3.25 Hong Kong Government ............... 136 2.21 15 2.84 186 4.84 – – Other governments ......................... 20,604 3.30 17,182 6.00 3,609 4.56 2,493 3.38 Asset-backed securities .................. 1,088 1.57 2,626 1.87 6,021 2.34 45,765 2.04 Corporate debt and other
securities .................................... 49,065 4.28
68,760 3.53
12,460 3.76
3,648 4.22
Total amortised cost ....................... 71,694 90,662 24,197 72,066
Total carrying value ....................... 71,967 89,931 22,402 53,644 Held-to-maturity US Treasury ................................... – – 30 3.45 42 4.76 44 4.55 US Government agencies .............. – – – – 6 8.81 487 6.37 US Government-sponsored
agencies ..................................... – –
44 4.76
38 7.89
1,845 5.88 Hong Kong Government ............... 19 5.26 – – – – – – Other governments ......................... 148 4.73 149 4.70 301 4.32 532 6.58 Asset-backed securities .................. – – – – – – 185 5.95 Corporate debt and other
securities .................................... 417 3.84
3,670 4.28
5,352 4.58
704 4.83
Total amortised cost ....................... 584 3,893 5,739 3,797
Total carrying value ....................... 584 3,893 5,739 3,797
The maturity distributions of asset-backed securities are presented in the above table based upon contractual maturity dates. The weighted average yield for each range of maturities in the above table is calculated by dividing the annualised interest income for the year ended 31 December 2008 by the book amount of available-for-sale debt securities at that date. The yields do not include the effect of related derivatives.
20 Transfers of financial assets not qualifying for de-recognition
HSBC enters into transactions in the normal course of business by which it transfers recognised financial assets directly to third parties or to SPEs. These transfers may give rise to the full or partial derecognition of the financial assets concerned.
– Full derecognition occurs when HSBC transfers its contractual right to receive cash flows from the financial assets, or retains the right but assumes an obligation to pass on the cash flows from the asset, and transfers substantially all the risks and rewards of ownership. The risks include credit, interest rate, currency, prepayment and other price risks.
– Partial derecognition occurs when HSBC sells or otherwise transfers financial assets in such a way that some but not substantially all of the risks and rewards of ownership are transferred but control is retained. These financial assets are recognised on the balance sheet to the extent of HSBC’s continuing involvement.
The majority of financial assets that do not qualify for derecognition are (i) debt securities held by counterparties as collateral under repurchase agreements or (ii) equity securities lent under securities lending agreements. The following table analyses the carrying amount of financial assets that did not qualify for derecognition and their associated financial liabilities:
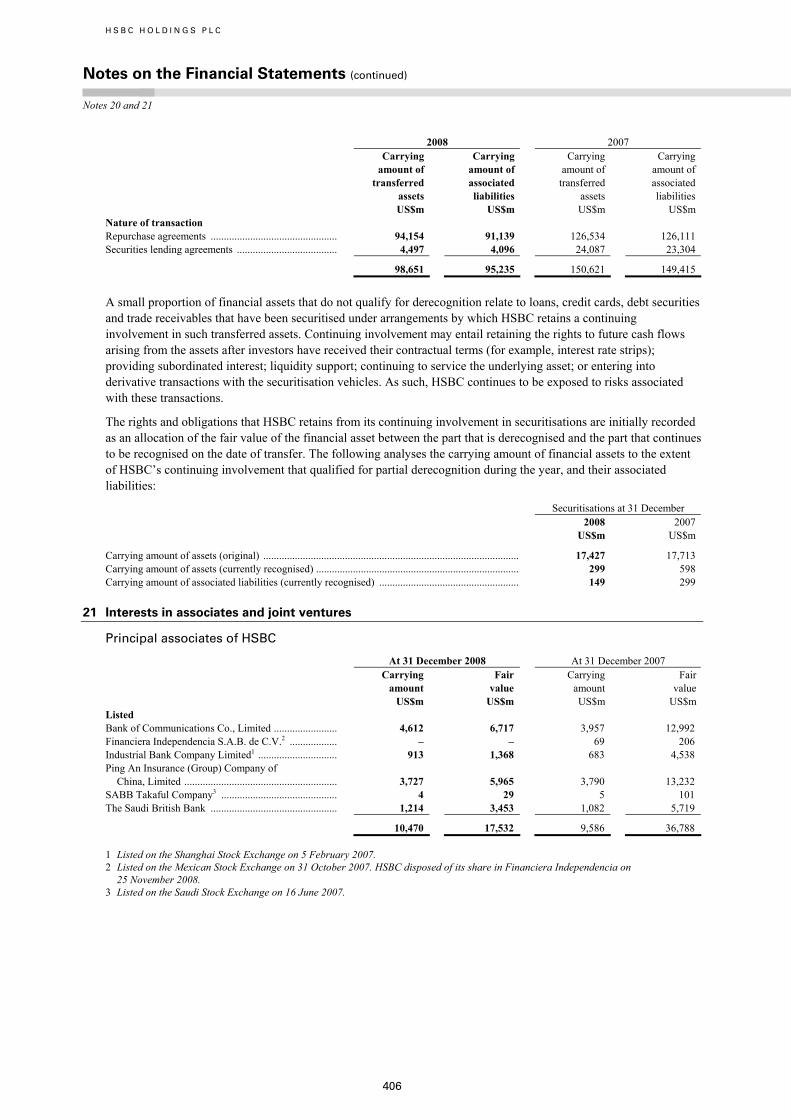
H S B C H O L D I N G S P L C
Notes on the Financial Statements (continued) Notes 20 and 21
406
2008 2007
Carrying amount of transferred assets
Carrying amount of associated liabilities
Carrying amount of transferred assets
Carrying amount of associated liabilities
US$m US$m US$m US$m Nature of transaction Repurchase agreements ................................................ 94,154 91,139 126,534 126,111 Securities lending agreements ...................................... 4,497 4,096 24,087 23,304
98,651 95,235 150,621 149,415
A small proportion of financial assets that do not qualify for derecognition relate to loans, credit cards, debt securities and trade receivables that have been securitised under arrangements by which HSBC retains a continuing involvement in such transferred assets. Continuing involvement may entail retaining the rights to future cash flows arising from the assets after investors have received their contractual terms (for example, interest rate strips); providing subordinated interest; liquidity support; continuing to service the underlying asset; or entering into derivative transactions with the securitisation vehicles. As such, HSBC continues to be exposed to risks associated with these transactions.
The rights and obligations that HSBC retains from its continuing involvement in securitisations are initially recorded as an allocation of the fair value of the financial asset between the part that is derecognised and the part that continues to be recognised on the date of transfer. The following analyses the carrying amount of financial assets to the extent of HSBC’s continuing involvement that qualified for partial derecognition during the year, and their associated liabilities:
Securitisations at 31 December 2008 2007 US$m US$m
Carrying amount of assets (original) ................................................................................................. 17,427 17,713 Carrying amount of assets (currently recognised) ............................................................................. 299 598 Carrying amount of associated liabilities (currently recognised) ..................................................... 149 299
21 Interests in associates and joint ventures
Principal associates of HSBC
At 31 December 2008 At 31 December 2007
Carrying amount
Fair value
Carrying amount
Fair value
US$m US$m US$m US$mListed Bank of Communications Co., Limited ........................ 4,612 6,717 3,957 12,992 Financiera Independencia S.A.B. de C.V.2 .................. – – 69 206 Industrial Bank Company Limited1 .............................. 913 1,368 683 4,538 Ping An Insurance (Group) Company of
China, Limited .......................................................... 3,727 5,965 3,790 13,232 SABB Takaful Company3 ............................................ 4 29 5 101 The Saudi British Bank ................................................ 1,214 3,453 1,082 5,719
10,470 17,532 9,586 36,788
1 Listed on the Shanghai Stock Exchange on 5 February 2007. 2 Listed on the Mexican Stock Exchange on 31 October 2007. HSBC disposed of its share in Financiera Independencia on
25 November 2008. 3 Listed on the Saudi Stock Exchange on 16 June 2007.

407
At 31 December 2008
Country of incorporation
HSBC’s interest in equity capital
Issued equity capital
Listed Bank of Communications Co., Limited ............................................................... PRC1 19.01% RMB48,994m Industrial Bank Company Limited3 ..................................................................... PRC1 12.78% RMB5,000m Ping An Insurance (Group) Company of China, Limited ................................... PRC1 16.78% RMB7,345m SABB Takaful Company ..................................................................................... Saudi Arabia 32.50% SR100m The Saudi British Bank ........................................................................................ Saudi Arabia 40.00% SR6,000m Unlisted Barrowgate Limited2,3 ........................................................................................... Hong Kong 24.64% – British Arab Commercial Bank Limited ............................................................. England 48.92% £32m fully paid £5m nil paid Vietnam Technological and Commercial Joint Stock Bank3 ............................... Vietnam 20.00% VND3,642,015m VocaLink ............................................................................................................. England 13.95% £100m Yantai City Commercial Bank3 ............................................................................ PRC 20.00% RMB2,000m Wells Fargo HSBC Trade Bank, N.A.4 ................................................................ United States 20.00% –
1 People’s Republic of China. 2 Issued equity capital is less than HK$1 million. 3 Investment held through Hang Seng Bank Limited, a 62.14 per cent owned subsidiary of HSBC. 4 Issued equity capital is less than US$1 million.
All the above investments in associates are owned by subsidiaries of HSBC Holdings.
Details of all HSBC associates and joint ventures will be annexed to the next Annual Return of HSBC Holdings filed with the UK Registrar of Companies.
HSBC had US$8,339 million (2007: US$7,747 million) of investments in associates and joint ventures listed in Hong Kong.
For the year ended 31 December 2008, HSBC’s share of associates and joint ventures’ tax on profit was US$515 million (2007: US$469 million), which is included within share of profit in associates and joint ventures in the income statement.
Summarised aggregate financial information on associates
2008 2007 US$m US$m HSBC’s share of:
– assets ........................................................................................................................................... 123,283 100,799 – liabilities ..................................................................................................................................... 114,578 94,178 – revenues ...................................................................................................................................... 5,939 5,568 – profit after tax ............................................................................................................................. 1,600 1,466
HSBC’s investment in Industrial Bank Company Limited was equity accounted with effect from May 2004, reflecting HSBC’s significant influence over this associate. HSBC’s significant influence was established as a result of representation on the Board of Directors, and in accordance with the Technical Support and Assistance Agreements, HSBC is assisting in the development of financial and operating policies.
HSBC’s investment in Ping An Insurance (Group) Company of China, Limited was equity accounted with effect from 31 August 2005, reflecting HSBC’s significant influence over this associate. HSBC’s significant influence was established as a result of representation on the Board of Directors.
HSBC’s significant influence in Bank of Communications Co., Limited was established as a result of representation on the Board of Directors, and in accordance with the Technical Support and Assistance Agreements, HSBC is assisting in the development of financial and operating policies and a number of staff have been seconded to assist in this process.
The statutory accounting reference date of Bank of Communications Co., Limited, Ping An Insurance (Group) Company of China, Limited and Industrial Bank Company Limited is 31 December. For the year ended 31 December 2008, these companies were included on the basis of financial statements made up for the twelve months to
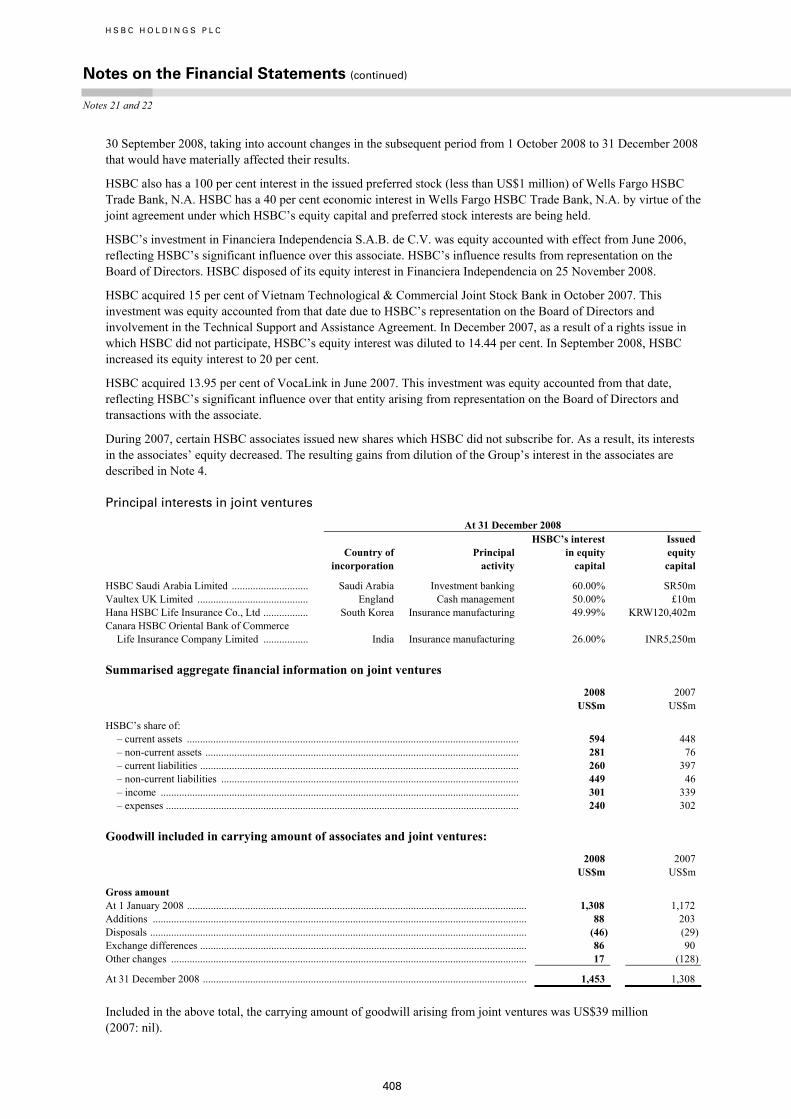
H S B C H O L D I N G S P L C
Notes on the Financial Statements (continued) Notes 21 and 22
408
30 September 2008, taking into account changes in the subsequent period from 1 October 2008 to 31 December 2008 that would have materially affected their results.
HSBC also has a 100 per cent interest in the issued preferred stock (less than US$1 million) of Wells Fargo HSBC Trade Bank, N.A. HSBC has a 40 per cent economic interest in Wells Fargo HSBC Trade Bank, N.A. by virtue of the joint agreement under which HSBC’s equity capital and preferred stock interests are being held.
HSBC’s investment in Financiera Independencia S.A.B. de C.V. was equity accounted with effect from June 2006, reflecting HSBC’s significant influence over this associate. HSBC’s influence results from representation on the Board of Directors. HSBC disposed of its equity interest in Financiera Independencia on 25 November 2008.
HSBC acquired 15 per cent of Vietnam Technological & Commercial Joint Stock Bank in October 2007. This investment was equity accounted from that date due to HSBC’s representation on the Board of Directors and involvement in the Technical Support and Assistance Agreement. In December 2007, as a result of a rights issue in which HSBC did not participate, HSBC’s equity interest was diluted to 14.44 per cent. In September 2008, HSBC increased its equity interest to 20 per cent.
HSBC acquired 13.95 per cent of VocaLink in June 2007. This investment was equity accounted from that date, reflecting HSBC’s significant influence over that entity arising from representation on the Board of Directors and transactions with the associate.
During 2007, certain HSBC associates issued new shares which HSBC did not subscribe for. As a result, its interests in the associates’ equity decreased. The resulting gains from dilution of the Group’s interest in the associates are described in Note 4.
Principal interests in joint ventures
At 31 December 2008
Country of incorporation
Principal activity
HSBC’s interest in equity capital
Issued equity capital
HSBC Saudi Arabia Limited ............................. Saudi Arabia Investment banking 60.00% SR50m Vaultex UK Limited .......................................... England Cash management 50.00% £10m Hana HSBC Life Insurance Co., Ltd ................. South Korea Insurance manufacturing 49.99% KRW120,402m Canara HSBC Oriental Bank of Commerce
Life Insurance Company Limited ................. India Insurance manufacturing 26.00% INR5,250m
Summarised aggregate financial information on joint ventures
2008 2007 US$m US$m
HSBC’s share of: – current assets .............................................................................................................................. 594 448 – non-current assets ....................................................................................................................... 281 76 – current liabilities ......................................................................................................................... 260 397 – non-current liabilities ................................................................................................................. 449 46 – income ........................................................................................................................................ 301 339 – expenses ...................................................................................................................................... 240 302
Goodwill included in carrying amount of associates and joint ventures:
2008 2007 US$m US$m
Gross amount At 1 January 2008 ................................................................................................................................. 1,308 1,172 Additions .............................................................................................................................................. 88 203 Disposals ............................................................................................................................................... (46) (29)Exchange differences ............................................................................................................................ 86 90 Other changes ....................................................................................................................................... 17 (128)
At 31 December 2008 ........................................................................................................................... 1,453 1,308
Included in the above total, the carrying amount of goodwill arising from joint ventures was US$39 million (2007: nil).

409
22 Goodwill and intangible assets
Goodwill and intangible assets includes goodwill arising on business combinations, the PVIF long-term insurance business, and other intangible assets.
Goodwill
Reconciliation of goodwill
Europe Hong Kong
Rest of Asia- Pacific
North America
Latin America Total
US$m US$m US$m US$m US$m US$m Gross amount At 1 January 2008 ....................................... 16,744 124 350 12,561 4,474 34,253 Additions ..................................................... 12 – 142 – 1 155 Disposals ..................................................... (415) – – (13) – (428)Exchange differences .................................. (775) (2) (59) (61) (609) (1,506)Other changes ............................................. (55) – – – – (55)
At 31 December 2008 ................................. 15,511 122 433 12,487 3,866 32,419 Accumulated impairment losses At 1 January 2008 ....................................... – – – – – – Impairment losses ....................................... – – – (10,564) – (10,564)
At 31 December 2008 ................................. – – – (10,564) – (10,564)
Net carrying amount at 31 December 2008 .................................. 15,511 122 433 1,923 3,866 21,855
Gross amount At 1 January 2007 ....................................... 15,234 124 325 12,527 4,262 32,472 Additions ..................................................... 42 – 6 – 143 191 Disposals ..................................................... (43) – – (12) – (55)Exchange differences .................................. 1,516 – 19 46 120 1,701 Other changes ............................................. (5) – – – (51) (56)
At 31 December 2007 ................................. 16,744 124 350 12,561 4,474 34,253
Impairment charges recognised
At 31 December 2008, HSBC recognised an impairment charge of US$10,564 million (2007: nil) in respect of Personal Financial Services – North America. This was a result of the very significant deterioration in the economic and credit conditions in North America and the resulting further restructuring in the Personal Financial Services – North America cash generating unit (‘CGU’) in the latter part of 2008. The reduction in the recoverable amount of the main business lines was driven by higher losses than were expected for 2008, including higher levels of impairment charges, contraction in new business from lending activities and a delay in the expected return to profitability of the business. The deterioration in the financial performance was particularly severe in the fourth quarter of 2008. In addition, the discount rate used increased as observed market discount rates increased for US consumer finance and banking businesses.
Impairment testing
Timing of impairment testing
HSBC’s impairment test in respect of goodwill allocated to each CGU is performed as at 1 July each year. In line with the accounting policy set out in Note 2, goodwill is also retested for impairment whenever there is an indication that goodwill may be impaired. Given the extraordinary market events experienced globally during 2008, HSBC performed an additional impairment test on all the CGU’s within the Group as at 31 December 2008. For the purpose of impairment testing, the Group’s CGUs are based on customer groups and global business separated by geographical region. The CGUs represent the lowest level at which goodwill is monitored by key management personnel.

H S B C H O L D I N G S P L C
Notes on the Financial Statements (continued) Note 22
410
Basis of the recoverable amount – Value in use or Fair value less costs to sell
The recoverable amount of all CGUs to which goodwill has been allocated was equal to its value in use (‘VIU’) at each respective testing date for 2007 and 2008.
For each significant CGU, the VIU is calculated by discounting management’s cash flow projections for each CGU. The pre-tax discount rate used is based on the cost of capital HSBC allocates to investments in the countries within which the CGU operates. The long-term growth rate is used to extrapolate the cash flows in perpetuity because of the long-term perspective within the Group of the business units making up the CGUs. However, due to the economic downturn in Personal Financial Services – North America, a 10 year cash flow projection was used.
Key assumptions in VIU calculation and management’s approach to determining the values assigned to each key assumption 2008 2007
Cash-generating unit
Goodwill at 31 December
2008 Discount rate
Nominal growth rate beyond initial cash flow projections
Goodwill at 1 July 2007
Discount rate
Nominal growth rate beyond initial cash flow projections
US$m % % US$m % %
Personal Financial Services – Europe ............... 4,422 10.0 3.5 4,197 10.3 5.2Commercial Banking – Europe ......................... 3,427 10.0 3.5 3,045 10.1 4.6Private Banking – Europe .................................. 4,470 9.0 3.5 4,694 10.0 3.8Global Banking and Markets – Europe ............. 3,451 11.0 3.5 3,894 10.1 4.4Personal Financial Services – North America ... – 13.6 3.9 10,564 12.3 4.0Personal Financial Services – Latin America .... 2,189 16.8 8.8 2,781 16.4 7.8
Total goodwill in the CGUs listed above .......... 17,959 29,175
At 31 December 2008, aggregate goodwill of US$3,896 million (1 July 2007: US$3,850 million) had been allocated to CGUs that were not considered individually significant. These CGUs do not carry on their balance sheets any significant intangible assets with indefinite useful lives, other than goodwill.
Nominal long-term growth rate: external data that reflects the market’s assessment of GDP and inflation for the countries within which the CGU operates. The rates used for 2007 and 2008 are taken as an average of the last 10 years.
Discount rate: the discount rate used to discount the cash flows is based on the cost of capital assigned to each CGU, which is derived using a Capital Asset Pricing Model (‘CAPM’). The CAPM depends on inputs reflecting a number of financial and economic variables including the risk-free rate in the country concerned and a premium to reflect the inherent risk of the business being evaluated. These variables are based on the market’s assessment of the economic variables and management’s judgement. In addition, for the purposes of testing goodwill for impairment, management supplements this process by comparing the discount rates derived using the internally generated CAPM with cost of capital rates produced by external sources. HSBC uses the externally-sourced cost of capital rates where, in management’s judgement, those rates reflect more accurately the current market and economic conditions. At 31 December 2008, the rates used in the impairment test for Personal Financial Services – Latin America was based on externally sourced rates.
Management’s judgement in estimating the cash flows of a CGU: the cash flow projections for each CGU are based on plans approved by the Group Management Board. The key assumptions in addition to the discount rate and nominal long-term growth rate for each significant CGU are discussed below.
Personal Financial Services – Europe and Commercial Banking – Europe: the assumptions included in the cash flow projections for Personal Financial Services – Europe and Commercial Banking – Europe reflect the economic environment and financial outlook of the European countries within these two segments. Key assumptions include the level of interest rates and the level and change in unemployment rates, particularly in the UK. While current economic conditions and the economic outlook in Europe remain challenging, management’s cash flow projections are based on these prevailing conditions. Despite the severity of the conditions at the balance sheet date, management does not expect these conditions to continue over the longer term. The downside risks to this assessment include the

411
risk of a prolonged and severe economic recession in the UK, accompanied by higher discount rates reflecting increased investor perceptions of risk. Management’s current assessment is that the probability of this downside risk scenario is low. Accordingly, based on the conditions at the balance sheet date, management determined that a reasonably possible change in any of the key assumptions described above would not cause an impairment to be recognised in respect of Personal Financial Services – Europe or Commercial Banking – Europe.
Private Banking – Europe: the revenues in Private Banking – Europe are predominately generated through HSBC’s client relationships. For 2009, the forecast cash flows reflect the downward pressure on brokerage and portfolio management fees, with the latter being affected by the decline in equity market values. Thereafter, the nominal long-term growth rates described in the table above have been used. Based on the conditions at the balance sheet date, management determined that a reasonably possible change in any of the key assumptions described above would not cause an impairment to be recognised in respect of Private Banking – Europe.
Global Banking and Markets – Europe: the cash flows generated by Global Banking and Markets – Europe are diversified and there is no one key assumption that drives the cash flow projection of this CGU.
The forecast cash flows in the 2009 plan continue to reflect challenging global economic conditions. One of the key factors which may impact the carrying value of this CGU is the level of impairment charges which may emerge in the future, particularly in respect of holdings of available-for-sale sub-prime and Alt-A Residential MBSs. Based on management’s current assessment of the credit quality of these securities, which includes stressed scenarios for collateral defaults and house prices, and the level of credit support available, management determined that based on the conditions at the balance sheet date a reasonably possible change in impairment of available-for-sale sub-prime and Alt-A Residential MBSs would not cause an impairment to be recognised in respect of Global Banking and Markets – Europe.
Personal Financial Services – Latin America: the assumptions included in the cash flow projections for Personal Financial Services – Latin America reflect the economic environment and financial outlook of the countries within this segment, with Brazil and Mexico being two of the largest countries included within this segment. Key assumptions include the growth in lending and deposit volumes, the credit quality of the loan portfolios and operational efficiency improvements. Based on the conditions at the balance sheet date, management determined that a reasonably possible change in any of the key assumptions described above would not cause an impairment to be recognised in respect of Personal Financial Services – Latin America.
The present value of in-force long-term insurance business
Movement on the PVIF
2008 2007 US$m US$m
At 1 January .................................................................................................................................................. 1,965 1,549 Value of new business written during the year ............................................................................................ 452 380 Acquisition of subsidiaries or portfolios ...................................................................................................... – 390 Movement from in-force business (including investment return variances and changes in
investment assumptions) .......................................................................................................................... (311) (204)Exchange differences and other movements ................................................................................................ (73) (150)
At 31 December ............................................................................................................................................ 2,033 1,965
PVIF-specific assumptions
The key assumptions used in the computation of PVIF for HSBC’s main life insurance operations were:
2008 2007 UK Hong Kong France UK Hong Kong France % % % % % %
Risk free rate ............................... 4.30 1.14 4.03 4.30 3.51 4.26 Risk discount rate ....................... 8.00 11.00 8.00 8.00 11.00 8.00 Expenses inflation ....................... 3.50 3.00 2.00 3.40 3.00 2.00
The PVIF represents the value of the shareholder’s interest in the in-force business of the life insurance operations. The calculation of the PVIF is based upon assumptions that take into account risk and uncertainty. To project these

H S B C H O L D I N G S P L C
Notes on the Financial Statements (continued) Notes 22 and 23
412
cash flows, a variety of assumptions regarding future experience is made by each insurance operation which reflects local market conditions and management’s judgement of local future trends. Some of the Group’s insurance operations incorporate risk margins separately into the projection assumptions for each product, while others incorporate risk margins into the overall discount rate. This is reflected in the wide range of risk discount rates applied.
Other intangible assets
The analysis of the movement of intangible assets, excluding the PVIF, was as follows:
Trade names
Mortgage servicing rights
Internallygenerated
software Purchased
software
Customer/ merchant relation-
ships Other Total US$m US$m US$m US$m US$m US$m US$m Cost At 1 January 2008 ....................... 63 1,202 3,473 760 1,866 165 7,529 Additions1 ................................... – 158 764 118 169 23 1,232 Acquisition of subsidiaries ......... 10 – – 68 4 267 349 Disposals ..................................... – – (43) (26) (25) (3) (97)Exchange differences .................. (8) – (561) (59) (264) (24) (916)Other changes ............................. 2 – (204) 6 (1) (7) (204)
At 31 December 2008 ................. 67 1,360 3,429 867 1,749 421 7,893 Accumulated amortisation At 1 January 2008 ....................... (44) (724) (2,167) (549) (541) (33) (4,058)Charge for the year2 .................... (6) (299) (365) (114) (227) (20) (1,031)Impairment .................................. – – – (1) – – (1)Disposals ..................................... – – 18 6 10 – 34 Exchange differences .................. 5 – 311 36 80 1 433 Other changes ............................. – – 211 (9) (3) – 199
At 31 December 2008 ................. (45) (1,023) (1,992) (631) (681) (52) (4,424)
Net carrying amount at 31 December 2008 ................. 22 337 1,437 236 1,068 369 3,469
Cost At 1 January 2007 ....................... 57 1,078 2,871 645 1,655 179 6,485 Additions1 ................................... – 124 587 104 140 6 961 Acquisition of subsidiaries ......... – – – – 4 – 4 Disposals ..................................... – – (7) (21) (6) (2) (36)Exchange differences .................. 6 – 81 38 83 1 209 Other changes ............................. – – (59) (6) (10) (19) (94)
At 31 December 2007 ................. 63 1,202 3,473 760 1,866 165 7,529 Accumulated amortisation At 1 January 2007 ....................... (21) (619) (1,772) (426) (320) (13) (3,171)Charge for the year2 .................... (20) (108) (327) (120) (209) (21) (805)Impairment .................................. – – (3) – – – (3)Disposals ..................................... – – – 18 6 1 25 Exchange differences .................. (3) – (51) (25) (17) – (96)Other changes ............................. – 3 (14) 4 (1) – (8)
At 31 December 2007 ................. (44) (724) (2,167) (549) (541) (33) (4,058)
Net carrying amount at 31 December 2007 .................
19 478 1,306 211
1,325
132 3,471
Net carrying amount at 1 January 2007 .......................
36 459 1,099 219
1,335
166 3,314
1 At 31 December 2008, HSBC had US$2 million (2007: US$47 million) of contractual commitments to acquire intangible assets. 2 The amortisation charge for the year is recognised within the income statement under ‘Amortisation and impairment of intangible
assets’, with the exception of the amortisation of mortgage servicing rights that is charged to net fee income.

413
23 Property, plant and equipment
HSBC
Property, plant and equipment
Freehold land and buildings
Long leasehold land and buildings
Short leasehold land and buildings1
Equipment, fixtures and fittings2
Equipment on operating leases
Total3
US$m US$m US$m US$m US$m US$m Cost or fair value At 1 January 2008 ............................................... 4,701 1,438 2,856 10,957 6,054 26,006 Additions at cost4 ................................................ 466 26 327 1,813 353 2,985 Acquisition of subsidiaries ................................. 29 – – 16 – 45 Fair value adjustments ........................................ (93) 4 (3) – – (92)Disposals ............................................................. (138) (102) (41) (803) (175) (1,259)Reclassified from/(to) held for sale .................... 16 469 (2) 98 – 581 Transfers ............................................................. – 3 (3) – – – Exchange differences .......................................... (611) (62) (214) (1,876) (1,685) (4,448)Other changes ..................................................... (244) (40) 4 115 – (165)
At 31 December 2008 ......................................... 4,126 1,736 2,924 10,320 4,547 23,653
Accumulated depreciation and impairment At 1 January 2008 ............................................... (344) (175) (826) (7,003) (1,964) (10,312)Depreciation charge for the year ........................ (82) (53) (184) (1,201) (187) (1,707)Disposals ............................................................. 7 2 14 537 57 617 Reclassified (from)/to held for sale .................... 1 (18) – (30) – (47)Transfers ............................................................. – (3) 3 – – – Impairment losses recognised ............................. (30) (2) – (11) – (43)Exchange differences .......................................... 73 9 107 1,257 561 2,007 Other changes ..................................................... 7 12 – (163) 1 (143)
At 31 December 2008 ......................................... (368) (228) (886) (6,614) (1,532) (9,628)
Net carrying amount at 31 December 2008 ........ 3,758 1,508 2,038 3,706 3,015 14,025 Cost or fair value At 1 January 2007 ............................................... 5,331 1,936 2,574 9,702 5,923 25,466 Additions at cost4 ................................................ 684 78 397 1,429 132 2,720 Acquisition of subsidiaries ................................. 93 – – – – 93 Fair value adjustments ........................................ 25 21 106 – – 152 Disposals ............................................................. (256) (37) (117) (542) (129) (1,081)Reclassified to held for sale ................................ (446) (596) (82) (160) – (1,284)Transfers ............................................................. – (5) 5 – – – Exchange differences .......................................... 237 1 49 450 128 865 Other changes ..................................................... (967) 40 (76) 78 – (925)
At 31 December 2007 ......................................... 4,701 1,438 2,856 10,957 6,054 26,006
Accumulated depreciation and impairment At 1 January 2007 ............................................... (342) (168) (723) (5,974) (1,835) (9,042)Depreciation charge for the year ........................ (93) (37) (167) (1,192) (205) (1,694)Disposals ............................................................. 41 7 95 469 115 727 Reclassified to held for sale ................................ 73 23 3 67 – 166 Impairment losses recognised ............................. (26) – (5) (3) – (34)Impairment losses reversed ................................ 14 – – – – 14 Exchange differences .......................................... (18) (1) (19) (282) (38) (358)Other changes ..................................................... 7 1 (10) (88) (1) (91)
At 31 December 2007 ......................................... (344) (175) (826) (7,003) (1,964) (10,312)
Net carrying amount at 31 December 2007 ........ 4,357 1,263 2,030 3,954 4,090 15,694
Net carrying amount at 1 January 2007 .............. 4,989 1,768 1,851 3,728 4,088 16,424
1 Including assets held on finance leases with a net book value of US$13 million (2007: US$13 million). 2 Including assets held on finance leases with a net book value of US$315 million (2007: US$397 million). 3 Including assets with a net book value of US$28 million (2007: US$422 million) pledged as security for liabilities. 4 At 31 December 2008, HSBC had US$1,498 million (2007: US$1,011 million) of contractual commitments to acquire property, plant
and equipment.

H S B C H O L D I N G S P L C
Notes on the Financial Statements (continued) Note 23
414
On 31 May 2007, HSBC entered into a contract for the sale and leaseback of the property and long leasehold land comprising 8 Canada Square, London to Metrovacesa, S.A. (‘Metrovacesa’) for £1,090 million (US$2,154 million). In the normal course of business, HSBC provided finance to Metrovacesa in respect of the debt element of this transaction at arm’s length market rates in the form of a bridging loan of £810 million (US$1,601 million) secured by a charge on the property. The equity portion of £280 million (US$553 million) was settled in cash by Metrovacesa on 31 May 2007. At 31 December 2007, the sale was not recognised in the financial statements because HSBC retained a significant interest by virtue of the loan provided to part-finance the purchase of the building. The equity portion received from Metrovacesa was presented in the balance sheet as deferred income at 31 December 2007 with a value of US$562 million.
On 4 December 2008, HSBC purchased Project Maple II, B.V., the subsidiary of Metrovacesa which owned 8 Canada Square, for £838 million (US$1,315 million). At this date the deferred income recognised by HSBC was released to the income statement. The net effect on the income statement for the year ended 31 December 2008 was £244 million (US$383 million), comprising a gain of £265 million (US$416 million) included within ‘Other operating income’ and a charge of £21 million (US$33 million) included within ‘Depreciation and impairment of property, plant and equipment’.
At 31 December 2008, the property has been reclassified to Property plant and equipment and Prepayments and accrued income (representing the long leasehold on the land) because it no longer meets the criteria for recognition as a non-current asset held for sale.
Leasehold land and buildings
Leasehold land and buildings are considered to be held under finance lease contracts where the value of the land cannot reliably be separated from the value of the lease, and the respective contracts do not meet the criteria for classification as operating leases.
Included within ‘Short leasehold land and buildings’ are the following amounts in respect of assets classed as improvements to buildings, which are carried at depreciated historical cost:
2008 2007
Cost Accumulated depreciation Cost
Accumulated depreciation
US$m US$m US$m US$m
At 1 January .................................................................. 1,490 (671) 1,277 (351)Additions ....................................................................... 314 – 294 – Disposals ....................................................................... (40) 12 (117) 94 Depreciation charge for the year .................................. – (116) – (123)Exchange differences .................................................... (141) 100 43 (10)Other changes ............................................................... (2) – (7) (281)
At 31 December ............................................................ 1,621 (675) 1,490 (671)
Net carrying amount at 31 December ........................... 946 819
Investment properties
The composition of the investment properties at fair value in the year was as follows:
Freehold land and buildings
Long leasehold land and buildings
Short leasehold land and buildings
Total US$m US$m US$m US$m
Fair value At 1 January 2008 .......................................................... 925 205 216 1,346 Additions at cost ............................................................ 78 – – 78 Fair value adjustments ................................................... (93) 4 (3) (92)Disposals ........................................................................ (2) – – (2)Transfers ........................................................................ – – (1) (1)Exchange differences ..................................................... (196) (15) 5 (206)Other changes ................................................................ (146) (6) – (152)
At 31 December 2008 .................................................... 566 188 217 971

415
Freehold land and buildings
Long leasehold land and buildings
Short leasehold land and buildings
Total US$m US$m US$m US$m
Fair value At 1 January 2007 .......................................................... 1,533 174 242 1,949 Acquisition of subsidiaries ............................................ 93 – – 93 Additions at cost ............................................................ 287 – – 287 Fair value adjustments ................................................... 25 21 106 152 Disposals ........................................................................ (3) – – (3)Reclassified as held for sale .......................................... (61) (5) (48) (114)Transfers ........................................................................ – (2) 4 2 Exchange differences ..................................................... 27 1 (1) 27 Other changes1 ............................................................... (976) 16 (87) (1,047)
At 31 December 2007 .................................................... 925 205 216 1,346
1 Mainly relating to investment properties of subsidiaries no longer qualifying for consolidation, because HSBC does not have the majority of the risks and rewards of ownership.
Investment properties are valued on an open market value basis as at 31 December each year by independent professional valuers who have recent experience in the location and type of properties. Investment properties in Hong Kong, the Macau Special Administrative Region and mainland China, which represent 25 per cent by value of HSBC’s investment properties subject to revaluation, were valued by an independent valuer who is a member of the Hong Kong Institute of Surveyors and who has recent experience in the locations and categories of the investment properties.
Included within ‘Other operating income’ was rental income of US$23 million (2007: US$42 million; 2006: US$153 million) earned by HSBC on its investment properties. Direct operating expenses of US$2 million (2007: US$3 million; 2006: US$61 million) incurred in respect of the investment properties during the year were recognised in ‘General and administrative expenses’. Direct operating expenses arising in respect of investment properties that did not generate rental income during 2008 amounted to nil (2007 and 2006: nil).
HSBC recognised no contractual obligations to purchase, construct, develop, maintain or enhance investment properties (2007: US$22 million).
HSBC Holdings had no investment properties at 31 December 2008 or 2007.
HSBC properties leased to customers
HSBC properties leased to customers included US$396 million at 31 December 2008 (2007: US$387 million) let under operating leases, net of accumulated depreciation of US$9 million (2007: US$18 million). None was held by HSBC Holdings.

H S B C H O L D I N G S P L C
Notes on the Financial Statements (continued) Note 24
416
24 Investments in subsidiaries
Principal subsidiaries of HSBC Holdings
At 31 December 2008
Country ofincorporationor registration
HSBC’s interest in equity capital %
Issued equity capital
Share class
Europe HFC Bank Limited ...................................................................... England 100 £109m
Ordinary £1 Preference £1
HSBC Global Asset Management (UK) Limited (formerly HSBC Investments (UK) Limited) ..........................................
England 100 £37m Ordinary £0.25 RP1 £1
HSBC Asset Finance (UK) Limited ............................................ England 100 £265m Ordinary £1 HSBC Bank A.S. ......................................................................... Turkey 100 TRL652m
A-Common TRL1 B-Common TRL1
HSBC Bank Malta p.l.c. .............................................................. Malta 70.03 €88m Ordinary €0.30 HSBC Bank plc ............................................................................ England 100 £797m
Ordinary £1 Preferred Ordinary £1 Series 2 Third Dollar Preference US$0.01 Third Dollar Preference US$0.01
HSBC France ............................................................................... France 99.99 €337m Shares €5.00 HSBC Bank International Limited .............................................. Jersey 100 £1m Ordinary £1 HSBC Life (UK) Limited ............................................................ England 100 £94m Ordinary £1 HSBC Private Banking Holdings (Suisse) S.A. .......................... Switzerland 100 CHF1m Ordinary CHF1,000 HSBC Trinkaus & Burkhardt AG ............................................... Germany 78.60 €70m Shares of no par valueMarks and Spencer Retail Financial Services Holdings
Limited ..................................................................................... England 100 £67m Ordinary £1
Hong Kong Hang Seng Bank Limited ............................................................ Hong Kong 62.14 HK$9,559m Ordinary HK$5.00 HSBC Insurance (Asia) Limited .................................................. Hong Kong 100 HK$125m Ordinary HK$1,000 HSBC Life (International) Limited ............................................. Bermuda 100 HK$327m Ordinary HK$1.00 The Hongkong and Shanghai Banking Corporation Limited ..... Hong Kong 100 HK$22,494m
Ordinary HK$2.50 CIP2 US$1.00 CRP3 US$1.00 NIP4 US$1.00
Rest of Asia-Pacific HSBC Bank Australia Limited .................................................... Australia 100 A$811m
Ordinary A$1.00 Pref A$10,000
HSBC Bank (China) Company Limited ...................................... PRC5 100 RMB8,000m Ordinary CNY1.00 HSBC Bank Egypt S.A.E. ........................................................... Egypt 94.53 E£1,073m Ordinary EGP84.00 HSBC Bank Malaysia Berhad ..................................................... Malaysia 100 RM$114m Ordinary RM0.50 HSBC Bank Middle East Limited ............................................... Jersey 100 US$631m
CRP3 US$1.00 Ordinary US$1.00
North America The Bank of Bermuda Limited .................................................... Bermuda 100 US$30m Common BMD1.00 HSBC Bank Canada .................................................................... Canada 100 C$1,225m
Class 1 Pref of NPV6
Class 2 Pref of NPV6
Common of NPV HSBC Bank USA, N.A. ............................................................... United States 100 US$2m Common US$100 HSBC Finance Corporation ......................................................... United States 100 US$3,038m Common US$0.01 HSBC Securities (USA) Inc. ....................................................... United States 100 –7 Common US$0.05 Latin America HSBC Bank Argentina S.A. ........................................................ Argentina 99.99 ARS1,244m
Ordinary-A ARS1.00 Ordinary-B ARS1.00
HSBC Bank Brasil S.A. – Banco Múltiplo ................................. Brazil 100 BRL2,289m
Ordinary BRL1.14 Ordinary BRL1.89 Ordinary BRL1.17
HSBC Mexico S.A. ...................................................................... Mexico 99.99 MXN2,471m Ordinary MXN2.00 HSBC Bank (Panama) S.A. ......................................................... Panama 100 US$315m Ordinary PAB 1.00

417
1 Redeemable Preference shares. 2 Cumulative Irredeemable Preference shares. 3 Cumulative Redeemable Preference shares. 4 Non-cumulative Irredeemable Preference shares. 5 People’s Republic of China. 6 Preference shares of nil par value. 7 Issued equity capital is less than US$1 million.
Details of the debt, subordinated debt and preference shares issued by the principal subsidiaries to parties external to the Group are included in the Notes 28 ‘Debt securities in issue’, 32 ‘Subordinated liabilities’ and 36 ‘Minority interests’, respectively.
All the above subsidiaries are included in the HSBC consolidated financial statements.
Details of all HSBC subsidiaries will be annexed to the next Annual Return of HSBC Holdings filed with the UK Registrar of Companies.
All the above make their financial statements up to 31 December except for HSBC Bank Argentina S.A., HSBC La Buenos Aires Seguros S.A. and Maxima S.A. AFJP, whose financial statements are made up to 30 June annually.
The principal countries of operation are the same as the countries of incorporation except for HSBC Bank Middle East Limited which operates mainly in the Middle East and HSBC Life (International) Limited which operates mainly in Hong Kong.
Subsidiaries which experience significant restrictions on their ability to transfer funds to HSBC in the form of cash dividends or to repay loans and advances
During 2008 and 2007, none of the Group’s subsidiaries experienced significant restrictions on paying dividends or repaying loans and advances.
Subsidiaries excluding SPEs where HSBC owns less than 50 per cent of the voting rights
Subsidiary
HSBC’s interest in equity capital
Description of relationship that gives HSBC control
% 2008 HSBC Private Equity Fund 3 .................................. 38.8 HSBC has control under IAS 27 because it is the investment
adviser/manager of the fund and has a significant equity interest.2007 HSBC Private Equity Fund 3 .................................. 38.8 HSBC has control under IAS 27 because it is the investment
adviser/manager of the fund and has a significant equity interest.
SPEs consolidated by HSBC where HSBC owns less than 50 per cent of the voting rights
Carrying value of total consolidated assets
Nature of SPE
US$bn 2008 Barion Funding Limited ....................................................................................... 4.5 Structured investment conduit Bryant Park Funding LLC .................................................................................... 5.5 Conduit Cullinan Funding Ltd ........................................................................................... 0.4 Structured investment vehicle HSBC Affinity Corporation I ............................................................................... 6.0 Securitisation HSBC Auto Receivables Corporation .................................................................. 3.5 Securitisation HSBC Corporate Money Fund (Euro) ................................................................. 0.6 Money market fund HSBC Home Equity Loan Corporation I ............................................................. 3.5 Securitisation HSBC Investor Prime Money Market Fund ......................................................... 10.5 Money market fund HSBC Receivables Funding, Inc I ....................................................................... 5.7 Securitisation HSBC Sterling Liquidity Fund ............................................................................. 7.7 Money market fund HSBC US Dollar Liquidity Fund ......................................................................... 25.0 Money market fund Malachite Funding Limited .................................................................................. 4.2 Structured investment conduit Mazarin Funding Limited ..................................................................................... 11.5 Structured investment conduit Metris Receivables Inc ......................................................................................... 3.6 Securitisation Metrix Funding Ltd .............................................................................................. 3.6 Securitisation Metrix Securities plc ............................................................................................. 4.2 Securitisation Regency Assets Limited ....................................................................................... 8.1 Conduit Solitaire Funding Ltd ............................................................................................ 12.1 Conduit Turquoise Receivable Trustee Ltd ....................................................................... 2.3 Securitisation

H S B C H O L D I N G S P L C
Notes on the Financial Statements (continued) Notes 24, 25, 26 and 27
418
Carrying value of total consolidated assets
Nature of SPE
US$bn 2007 Asscher Finance Limited ...................................................................................... 7.4 Structured investment vehicle Bryant Park Funding LLC .................................................................................... 5.3 Conduit Cullinan Funding Ltd ............................................................................................ 33.3 Structured investment vehicle Household Consumer Loan Corporation .............................................................. 9.3 Securitisation HSBC Affinity Corporation I ............................................................................... 5.8 Securitisation HSBC Auto Receivables Corporation .................................................................. 5.2 Securitisation HSBC Home Equity Loan Corporation I ............................................................. 8.2 Securitisation HSBC Receivables Funding, Inc I ........................................................................ 6.0 Securitisation Metris Receivables Inc ......................................................................................... 5.5 Securitisation Metrix Securities plc ............................................................................................. 4.0 Securitisation Metrix Funding Ltd .............................................................................................. 4.1 Securitisation Regency Assets Limited ....................................................................................... 9.1 Conduit Solitaire Funding Ltd ............................................................................................ 21.6 Conduit Turquoise Receivable Trustee Ltd ........................................................................ 2.3 Securitisation
In each of the above cases, HSBC has less than 50 per cent of the voting rights, but consolidates because it has the majority of risks and rewards of ownership of the SPE, or the substance of the relationship with the SPE is such that its activities are conducted on behalf of HSBC according to its specific business needs so that HSBC obtains benefit from the SPE’s operation. HSBC also consolidates a number of other individually insignificant SPEs where it owns less than 50 per cent of the voting rights. The consolidation of SPEs sponsored by HSBC is discussed on page 173.
Acquisitions
There were minor acquisitions and increases in investment in subsidiaries which increased goodwill by US$155 million. This included the acquisition of the assets, liabilities and operations of The Chinese Bank Co., Ltd in Taiwan, which was completed on 29 March 2008. This resulted in HSBC receiving a cash payment of US$1.6 billion from the Taiwan Government’s Central Deposit Insurance Corporation to deliver an agreed net asset position. The cash and cash equivalents held on the balance sheet of The Chinese Bank Co., Ltd at this date amounted to US$36 million.
Disposals
On 2 July 2008, HSBC completed the sale of seven French regional banks to Banque Fédérale des Banques Populaires for €2.1 billion (US$3.2 billion). The French regional banks generated net profits after tax of €62 million (US$95 million) for the period to 2 July 2008. The Group’s pre-tax profit on sale was US$2.4 billion.
The following assets and liabilities were attributable to the disposal of the French regional banks.
US$m Cash ..................................................................................................................................................................................... 413 Loans and advances to banks and customers ...................................................................................................................... 9,097 Other assets .......................................................................................................................................................................... 1,126
Total assets ......................................................................................................................................................................... 10,636
Deposits by banks ................................................................................................................................................................ 158 Customer accounts ............................................................................................................................................................... 10,285 Other liabilities .................................................................................................................................................................... 308
Total liabilities .................................................................................................................................................................... 10,751
25 Other assets
2008 2007 US$m US$m Bullion ............................................................................................................................................... 6,095 9,244 Assets held for sale ............................................................................................................................ 2,075 2,804 Reinsurers’ share of liabilities under insurance contracts (Note 30) ................................................ 2,023 1,315 Endorsements and acceptances .......................................................................................................... 10,482 12,248 Other accounts ................................................................................................................................... 17,147 13,882
37,822 39,493
419
Assets held for sale
2008 2007 US$m US$m Non-current assets held for sale Interests in associates ........................................................................................................................ 2 2 Property, plant and equipment ........................................................................................................... 2,007 2,502 Investment properties ........................................................................................................................ 2 111 Financial assets .................................................................................................................................. 62 185 Other .................................................................................................................................................. 2 4 Total assets classified as held for sale ............................................................................................... 2,075 2,804
Property, plant and equipment
The property, plant and equipment classified as held for sale is the result of repossession of property that had been pledged as collateral by customers. These assets are disposed of within 12 months of acquisition. Neither a gain nor loss was recognised on reclassifying these assets as held for sale. The majority arose within the geographical segment North America.
8 Canada Square has been reclassified out of ‘Assets held for sale’, as described in Note 23.
26 Trading liabilities
2008 US$m
2007 US$m
Deposits by banks .............................................................................................................................. 36,537 58,940 Customer accounts ............................................................................................................................. 113,053 102,710 Other debt securities in issue ............................................................................................................. 31,288 44,684 Other liabilities – net short positions ................................................................................................. 66,774 108,246
247,652 314,580
At 31 December 2008, the cumulative amount of change in fair value attributable to changes in credit risk was a gain of US$563 million (2007: gain of US$34 million).
27 Financial liabilities designated at fair value
HSBC
2008 2007 US$m US$m
Deposits by banks and customer accounts ........................................................................................ 6,618 7,724 Liabilities to customers under investment contracts ......................................................................... 9,283 16,053 Debt securities in issue (Note 28) ...................................................................................................... 34,969 38,587 Subordinated liabilities (Note 32) ..................................................................................................... 20,316 22,831 Preference shares (Note 32) ............................................................................................................... 3,401 4,744
74,587 89,939
The carrying amount at 31 December 2008 of financial liabilities designated at fair value was US$1,851 million less than the contractual amount at maturity (2007: US$648 million less). At 31 December 2008, the cumulative amount of the change in fair value attributable to changes in credit risk was a gain of US$7,978 million (2007: gain of US$1,619 million).
HSBC Holdings 2008 2007 US$m US$m Subordinated liabilities (Note 32):
– owed to third parties ................................................................................................................... 13,321 14,496 – owed to HSBC undertakings ...................................................................................................... 3,068 4,187
16,389 18,683

H S B C H O L D I N G S P L C
Notes on the Financial Statements (continued) Notes 27, 28, 29 and 30
420
The carrying amount at 31 December 2008 of financial liabilities designated at fair value was US$969 million less than the contractual amount at maturity (2007: US$130 million less). At 31 December 2008, the cumulative amount of the change in fair value attributable to changes in credit risk was a gain of US$2,638 million (2007: gain of US$548 million).
28 Debt securities in issue
2008 2007 US$m US$m
Bonds and medium term notes .......................................................................................................... 160,927 221,767 Other debt securities in issue ............................................................................................................. 85,023 108,083
245,950 329,850 Of which debt securities in issue reported as:
– trading liabilities (Note 26) ......................................................................................................... (31,288) (44,684)– financial liabilities designated at fair value (Note 27) ............................................................... (34,969) (38,587)
179,693 246,579
Certain debt securities in issue are managed on a fair value basis as part of HSBC’s interest rate risk management policies. The hedged portion of these debt securities is presented within the balance sheet caption ‘Financial liabilities designated at fair value’, with the remaining portion included within ‘Trading liabilities’. The following table analyses the carrying amount of bonds and medium-term notes in issue at 31 December with original maturities greater than one year:
2008 2007 US$m US$m Fixed rate Secured financing:
1.14% to 3.99%: due 2009 to 2013 ............................................................................................... 767 115 4.00% to 4.99%: due 2009 to 2016 ............................................................................................... 1,590 1,409 5.00% to 5.99%: due 2009 to 2017 ............................................................................................... 2,754 13,002 6.00% to 6.99%: due 2008 ............................................................................................................ – 459 7.00% to 8.99%: due 2009 to 2025 ............................................................................................... 14 521 9.00% to 9.99%: due 2009 to 2028 ............................................................................................... 462 –
Other fixed rate senior debt: 0.01% to 3.99%: due 2009 to 2069 ............................................................................................... 21,790 28,322 4.00% to 4.99%: due 2009 to 2046 ............................................................................................... 13,088 20,909 5.00% to 5.99%: due 2009 to 2036 ............................................................................................... 22,357 18,511 6.00% to 6.99%: due 2009 to 2036 ............................................................................................... 11,176 15,400 7.00% to 7.99%: due 2009 to 2032 ............................................................................................... 4,995 4,037 8.00% to 9.99%: due 2009 to 2036 ............................................................................................... 1,822 1,666 10.00% or higher: due 2009 to 2017 ............................................................................................. 884 867
81,699 105,218
Variable interest rate Secured financings – 1.00% to 9.99%: due 2009 to 2023 ................................................................ 27,741 47,404 FHLB advances – 5.00% to 5.99%: due 2009 to 2036 ..................................................................... 3,156 5,500 Other variable interest rate senior debt – 2.16% to 9.99%: due 2008 to 2057 ................................. 43,849 56,244
74,746 109,148
Structured notes Interest rate linked ............................................................................................................................. 348 770 Equity, equity index or credit-linked ................................................................................................. 4,134 6,631
4,482 7,401
Total bonds and medium-term notes ................................................................................................. 160,927 221,767

421
29 Other liabilities
HSBC HSBC Holdings 2008 2007 2008 2007 US$m US$m US$m US$m
Amounts due to investors in funds consolidated by HSBC ................................................................... 44,539 3,548 – –
Obligations under finance leases (Note 42) ................. 563 703 – – Dividend declared and payable by HSBC Holdings .... 1,795 1,393 1,795 1,393 Endorsements and acceptances ..................................... 10,482 12,248 – – Other liabilities ............................................................. 15,005 17,121 21 12 72,384 35,013 1,816 1,405
30 Liabilities under insurance contracts
Gross
Reinsurers’ share Net
US$m US$m US$m At 31 December 2008 Non-life insurance liabilities Unearned premium provision .......................................................................... 1,136 (159) 977 Notified claims ................................................................................................. 908 (230) 678 Claims incurred but not reported ..................................................................... 368 (41) 327 Other ................................................................................................................ 68 – 68
2,480 (430) 2,050 Life insurance liabilities to policyholders Life (non-linked) .............................................................................................. 17,370 (637) 16,733 Investment contracts with discretionary participation features1 ...................... 17,766 – 17,766 Life (linked) ..................................................................................................... 6,067 (956) 5,111
41,203 (1,593) 39,610
Total liabilities under insurance contracts ....................................................... 43,683 (2,023) 41,660 At 31 December 2007 Non-life insurance liabilities Unearned premium provision .......................................................................... 1,279 (181) 1,098 Notified claims ................................................................................................. 1,063 (380) 683 Claims incurred but not reported ..................................................................... 420 (49) 371 Other ................................................................................................................ 92 (43) 49
2,854 (653) 2,201 Life insurance liabilities to policyholders Life (non-linked) .............................................................................................. 14,370 (605) 13,765 Investment contracts with discretionary participation features1 ...................... 18,983 – 18,983 Life (linked) ..................................................................................................... 6,399 (57) 6,342
39,752 (662) 39,090
Total liabilities under insurance contracts ....................................................... 42,606 (1,315) 41,291
1 Though investment contracts with discretionary participation features are financial instruments, HSBC continued to treat them as insurance contracts as permitted by IFRS 4.

H S B C H O L D I N G S P L C
Notes on the Financial Statements (continued) Note 30
422
The movement of liabilities under insurance contracts during the year was as follows:
Non-life insurance liabilities
2008
Gross Reinsurers’
share Net US$m US$m US$m Unearned premium reserve (‘UPR’) At 1 January ..................................................................................................... 1,279 (181) 1,098 Changes in UPR recognised as (income)/expense .......................................... (58) 3 (55)
Gross written premiums .............................................................................. 1,776 (260) 1,516Gross earned premiums ............................................................................... (1,834) 263 (1,571)
Exchange differences and other movements ................................................... (85) 19 (66)
At 31 December ............................................................................................... 1,136 (159) 977
Notified and incurred but not reported claims At 1 January ..................................................................................................... 1,483 (429) 1,054
Notified claims ............................................................................................ 1,063 (380) 683Claims incurred but not reported ................................................................. 420 (49) 371
Claims paid in current year .............................................................................. (1,044) 158 (886)Claims incurred in respect of current year ...................................................... 975 (68) 907 Claims incurred in respect of prior years ........................................................ 69 (15) 54 Exchange differences and other movements ................................................... (207) 83 (124)
At 31 December ............................................................................................... 1,276 (271) 1,005 Notified claims ............................................................................................ 908 (230) 678Claims incurred but not reported ................................................................. 368 (41) 327
Other ................................................................................................................ 68 – 68
Total non-life insurance liabilities ................................................................... 2,480 (430) 2,050
2007
Gross Reinsurers’
share Net US$m US$m US$m Unearned premium reserve (‘UPR’) At 1 January ..................................................................................................... 1,262 (176) 1,086 Changes in UPR recognised as (income)/expense .......................................... (2) 22 20
Gross written premiums .............................................................................. 1,853 (385) 1,468Gross earned premiums ............................................................................... (1,855) 407 (1,448)
Exchange differences and other movements ................................................... 19 (27) (8)
At 31 December ............................................................................................... 1,279 (181) 1,098
Notified and incurred but not reported claims At 1 January ..................................................................................................... 1,409 (413) 996
Notified claims ............................................................................................ 949 (355) 594Claims incurred but not reported ................................................................. 460 (58) 402
Claims paid in current year .............................................................................. (1,017) 207 (810)Claims incurred in respect of current year ...................................................... 1,035 (189) 846 Claims incurred in respect of prior years ........................................................ 64 18 82 Exchange differences and other movements ................................................... (8) (52) (60)
At 31 December ............................................................................................... 1,483 (429) 1,054 Notified claims ............................................................................................ 1,063 (380) 683Claims incurred but not reported ................................................................. 420 (49) 371
Other ................................................................................................................ 92 (43) 49
Total non-life insurance liabilities ................................................................... 2,854 (653) 2,201

423
Life insurance liabilities to policyholders
Gross
Reinsurers’ share Net
US$m US$m US$m 2008 Life (non-linked) At 1 January ..................................................................................................... 14,370 (605) 13,765 Benefits paid .................................................................................................... (1,491) 172 (1,319)Increase in liabilities to policyholders ............................................................. 5,480 (792) 4,688 Exchange differences and other movements ................................................... (989) 588 (401)
At 31 December ............................................................................................... 17,370 (637) 16,733
Investment contracts with discretionary participation features At 1 January ..................................................................................................... 18,983 – 18,983 Benefits paid .................................................................................................... (1,911) – (1,911)Increase in liabilities to policyholders ............................................................. 1,743 – 1,743 Exchange differences and other movements ................................................... (1,049) – (1,049)
At 31 December ............................................................................................... 17,766 – 17,766
Life (linked) At 1 January ..................................................................................................... 6,399 (57) 6,342 Benefits paid .................................................................................................... (481) 44 (437)Increase in liabilities to policyholders ............................................................. 939 (1,442) (503)Exchange differences and other movements1 .................................................. (790) 499 (291)
At 31 December ............................................................................................... 6,067 (956) 5,111
Total liabilities to policyholders ...................................................................... 41,203 (1,593) 39,610 2007 Life (non-linked) At 1 January ..................................................................................................... 11,026 (1,046) 9,980 Benefits paid .................................................................................................... (940) 169 (771)Increase in liabilities to policyholders ............................................................. 3,377 349 3,726 Acquisitions of subsidiaries ............................................................................. 702 – 702 Exchange differences and other movements ................................................... 205 (77) 128
At 31 December ............................................................................................... 14,370 (605) 13,765
Investment contracts with discretionary participation features At 1 January ..................................................................................................... 20 – 20 Benefits paid .................................................................................................... (1,080) – (1,080)Increase in liabilities to policyholders ............................................................. 2,188 – 2,188 Acquisitions of subsidiaries ............................................................................. 16,406 – 16,406 Exchange differences and other movements ................................................... 1,449 – 1,449
At 31 December ............................................................................................... 18,983 – 18,983
Life (linked) At 1 January ..................................................................................................... 3,685 (58) 3,627 Benefits paid .................................................................................................... (790) (45) (835)Increase in liabilities to policyholders ............................................................. 2,886 (1,120) 1,766 Acquisitions of subsidiaries ............................................................................. 339 – 339 Exchange differences and other movements1 .................................................. 279 1,166 1,445
At 31 December ............................................................................................... 6,399 (57) 6,342
Total liabilities to policyholders ...................................................................... 39,752 (662) 39,090
1 Includes amounts arising under reinsurance agreements.
The increase in liabilities to policyholders represents the aggregate of all events giving rise to additional liabilities to policyholders in the year. These include death claims, surrenders, lapses, the setting up of liability to policyholders at the initial inception of the policy, the declaration of bonuses and other amounts attributable to policyholders.

H S B C H O L D I N G S P L C
Notes on the Financial Statements (continued) Notes 31 and 32
424
31 Provisions
2008 2007 US$m US$m
At 1 January ....................................................................................................................................... 1,958 1,763 Additional provisions/increase in provisions1 ................................................................................... 738 1,307 Provisions utilised .............................................................................................................................. (624) (986)Amounts reversed .............................................................................................................................. (147) (318)Exchange differences and other movements ..................................................................................... (195) 192
At 31 December ................................................................................................................................. 1,730 1,958
1 The increase in provisions includes the unwinding of discounts of US$3 million (2007: US$1 million) in relation to vacant space provisions and US$21 million (2007: US$24 million) in relation to Brazilian provisions for civil and fiscal labour claims.
Included within Provisions are:
(i) Provisions for onerous property contracts of US$85 million (2007: US$56 million), of which US$20 million (2007: US$33 million) relates to discounted future costs associated with leasehold properties that became vacant as a consequence of HSBC’s move to Canary Wharf in 2002. The provisions cover rent voids while finding new tenants, shortfalls in expected rent receivable compared with rent payable and the cost of refurbishing the buildings to attract tenants. Uncertainties arise from movements in market rents, delays in finding new tenants and the timing of rental reviews.
(ii) Labour, civil and fiscal litigation provisions in HSBC’s Brazil operations of US$334 million (2007: US$391 million). These relate to labour and overtime litigation claims brought by employees after leaving the bank. The provisions are based on the expected number of departing employees, their individual salaries and historical trends. The timing of the settlement of these claims is uncertain.
(iii) Provisions of US$439 million (2007: US$444 million) have been made in respect of costs arising from contingent liabilities and contractual commitments (Note 40), including guarantees of US$35 million (2007: US$29 million) and commitments of US$192 million (2007: US$125 million).
32 Subordinated liabilities
HSBC
2008 2007 US$m US$m Subordinated liabilities
At amortised cost ........................................................................................................................... 29,433 24,819 – subordinated liabilities .............................................................................................................. 24,618 19,308– preferred securities .................................................................................................................... 4,815 5,511
Designated at fair value (Note 27) ................................................................................................ 23,717 27,575 – subordinated liabilities .............................................................................................................. 20,316 22,831– preferred securities .................................................................................................................... 3,401 4,744
53,150 52,394 Subordinated liabilities
HSBC Holdings ............................................................................................................................. 23,544 18,931 Other HSBC ................................................................................................................................... 29,606 33,463
53,150 52,394

425
HSBC’s subordinated liabilities
2008 2007 US$m US$m
Amounts owed to third parties by HSBC Holdings (see below) ................................................. 23,544 18,931
Other HSBC subordinated liabilities €1,400m 5.3687% non-cumulative step-up perpetual preferred securities1 ........................ 1,532 2,018 US$1,350m 9.547% non-cumulative step-up perpetual preferred securities, Series 11 ........... 1,337 1,335 US$1,200m Undated floating rate primary capital notes .......................................................... 1,214 1,207 €800m Callable subordinated floating rate notes 20163 ................................................... 1,116 1,176 £700m 5.844% non-cumulative step-up perpetual preferred securities2 .......................... 1,021 1,404 US$1,000m 4.625% subordinated notes 2014 .......................................................................... 1,001 1,001 US$1,000m 5.911% trust preferred securities 20354 ................................................................ 992 992 US$1,000m 5.875% subordinated notes 2034 .......................................................................... 953 990 US$900m 10.176% non-cumulative step-up perpetual preferred securities, Series 21 ......... 900 900 £600m 4.75% subordinated notes 2046 ............................................................................ 863 1,186 €600m 8.03% non-cumulative step-up perpetual preferred securities1 ............................ 834 878 €600m 4.25% callable subordinated notes 20166 .............................................................. 831 881 €750m 5.13% non-cumulative step-up perpetual preferred securities1 ............................ 790 1,039 US$750m Undated floating rate primary capital notes .......................................................... 750 750 US$1,250m 4.61% non-cumulative step-up perpetual preferred securities1 ............................ 745 1,130 £500m 8.208% non-cumulative step-up perpetual preferred securities1 .......................... 724 996 US$750m 5.625% subordinated notes 2035 .......................................................................... 715 653 US$700m 7.00% subordinated notes 2039 ............................................................................ 694 – £500m 4.75% callable subordinated notes 20205 ............................................................. 675 931 £500m 5.375% subordinated notes 2033 .......................................................................... 659 931 €500m Callable subordinated floating rate notes 20208 ................................................... 567 676 £350m Callable subordinated variable coupon notes 20177 ............................................. 518 712 US$500m Undated floating rate primary capital notes .......................................................... 500 500 US$500m 6.00% subordinated notes 2017 ............................................................................ 498 498 £350m 5% callable subordinated notes 20239 .................................................................. 481 672 £350m 5.375% callable subordinated step-up notes 203010 ............................................. 461 652 US$450m Callable subordinated floating rate notes 20163 ................................................... 449 448 £300m 6.5% subordinated notes 2023 .............................................................................. 436 598 US$300m 7.65% subordinated notes 2025 ............................................................................ 384 359 £300m 5.862% non-cumulative step-up perpetual preferred securities2 .......................... 333 558 £225m 6.25% subordinated notes 2041 ............................................................................ 325 447 US$300m 6.95% subordinated notes 2011 ............................................................................ 324 325 US$300m Undated floating rate primary capital notes, Series 3 ........................................... 300 301 US$300m Callable subordinated floating rate notes 201711 .................................................. 299 299 CAD400m 4.80% subordinated notes 2022 ............................................................................ 277 389 US$250m 7.20% subordinated debentures 2097 ................................................................... 218 218 BRL500m Subordinated certificate of deposit 2016 .............................................................. 215 281 US$200m 7.75% subordinated notes 2009 ............................................................................ 203 202 US$200m 7.808% capital securities 2026 ............................................................................. 200 200 US$200m 8.38% capital securities 2027 ............................................................................... 200 200 US$200m 6.625% subordinated notes 2009 .......................................................................... 198 199 CAD200m 4.94% subordinated debentures 2021 ................................................................... 163 207 BRL608m Subordinated debentures 2008 .............................................................................. – 341 US$250m 5.875% subordinated notes 2008 .......................................................................... – 248 Other subordinated liabilities each less than US$200m ....................................... 3,711 3,535
29,606 33,463
53,150 52,394
Subordinated loan capital is repayable at par on maturity, but some is repayable prior to maturity at the option of the borrower, generally subject to prior notification to the Financial Services Authority, and, where relevant, the consent of the local banking regulator, and in certain cases at a premium over par. Interest rates on the floating rate loan capital are related to interbank offered rates. On the remaining subordinated loan capital, interest is payable at fixed rates up to 10.176 per cent.
1 See ‘Step-up perpetual preferred securities’ below, note (a) ‘Guaranteed by HSBC Holdings’. 2 See ‘Step-up perpetual preferred securities’ below, note (b) ‘Guaranteed by HSBC Bank’. 3 The interest margin on the €800m and US$450m callable subordinated floating rate notes 2016 increases by 0.5 per cent from
March 2011 and July 2011, respectively.

H S B C H O L D I N G S P L C
Notes on the Financial Statements (continued) Note 32
426
4 The distributions on the trust preferred securities change in November 2015 to three-month dollar LIBOR plus 1.926 per cent. 5 The interest rate on the 4.75 per cent callable subordinated notes 2020 changes in September 2015 to three-month sterling LIBOR plus
0.82 per cent. 6 The interest rate on the 4.25 per cent callable subordinated notes changes in March 2011 to three-month EURIBOR plus 1.05 per cent. 7 The interest rate on the callable subordinated variable coupon notes 2017 is fixed at 5.75 per cent until June 2012. Thereafter, the rate
per annum is the sum of the gross redemption yield of the then prevailing five-year UK gilt plus 1.70 per cent. 8 The interest margin on the callable subordinated floating rate notes 2020 increases by 0.5 per cent from September 2015. 9 The interest rate on the 5 per cent callable subordinated notes 2023 changes in March 2018 to become the rate per annum which is the
sum of the gross redemption yield of the prevailing five-year UK gilt plus 1.80 per cent. 10 The interest rate on the 5.375 per cent callable subordinated step-up notes 2030 changes in November 2025 to three month sterling
LIBOR plus 1.50 per cent. 11 The interest margin on the callable subordinated floating rate notes 2017 increases by 0.5 per cent from July 2012.
Footnotes 3 to 10 all relate to notes that are repayable at the option of the borrower on the date of the change of the interest rate, and at subsequent interest rate reset dates and interest payment dates in some cases, subject to prior notification to the Financial Services Authority and, where relevant, the consent of the local banking regulator.
Step-up perpetual preferred securities
(a) Guaranteed by HSBC Holdings
The seven issues of non-cumulative step-up perpetual preferred securities (footnote 1) were made by Jersey limited partnerships and are guaranteed, on a subordinated basis, by HSBC Holdings. The proceeds of the issues were on-lent to HSBC Holdings by the limited partnerships by issue of subordinated notes. The preferred securities qualify as innovative tier 1 capital for HSBC. The preferred securities, together with the guarantee, are intended to provide investors with rights to income and capital distributions and distributions upon liquidation of HSBC Holdings that are equivalent to the rights that they would have had if they had purchased non-cumulative perpetual preference shares of HSBC Holdings.
The preferred securities are perpetual, but redeemable in 2014, 2010, 2030, 2012, 2016, 2013 and 2015, respectively, at the option of the general partner of the limited partnerships. If not redeemed, the distributions payable step-up and become floating rate or, for the sterling issue, for each successive five-year period the sum of the then five-year benchmark UK gilt plus a margin. There are limitations on the payment of distributions if prohibited under UK banking regulations or other requirements, if a payment would cause a breach of HSBC’s capital adequacy requirements, or if HSBC Holdings has insufficient distributable reserves (as defined).
HSBC Holdings has covenanted that if it is prevented under certain circumstances from paying distributions on the preferred securities in full, it will not pay dividends or other distributions in respect of its ordinary shares, or effect repurchase or redemption of its ordinary shares, until after a distribution has been paid in full.
If (i) HSBC’s total capital ratio falls below the regulatory minimum ratio required, or (ii) the Directors expect that, in view of the deteriorating financial condition of HSBC Holdings, the former will occur in the near term, then the preferred securities will be substituted by preference shares of HSBC Holdings having economic terms which are in all material respects equivalent to those of the preferred securities and the guarantee taken together.
(b) Guaranteed by HSBC Bank
The two issues of non-cumulative step-up perpetual preferred securities (footnote 2) were made by Jersey limited partnerships and are guaranteed, on a subordinated basis, by HSBC Bank. The proceeds of the issues were on-lent to HSBC Bank by the limited partnerships by issue of subordinated notes. The preferred securities qualify as innovative tier 1 capital for HSBC and for HSBC Bank on a solo and consolidated basis and, together with the guarantee, are intended to provide investors with rights to income and capital distributions and distributions upon liquidation of HSBC Bank that are equivalent to the rights they would have had if they had purchased non-cumulative perpetual preference shares of HSBC Bank.
The two issues of preferred securities are perpetual, but redeemable in 2031 and 2020, respectively, at the option of the general partner of the limited partnerships. If not redeemed, the distributions payable step-up and become floating rate. The same limitations on the payment of distributions apply to HSBC Bank as to HSBC Holdings, as described above. HSBC Bank has provided a similar covenant to that provided by HSBC Holdings, also as described above.
If (i) any of the two issues of preferred securities are outstanding in November 2048 or April 2049, respectively, or (ii) the total capital ratio of HSBC Bank on a solo and consolidated basis falls below the regulatory minimum ratio required, or (iii) in view of the deteriorating financial condition of HSBC Bank, the Directors expect (ii) to

427
occur in the near term, then the preferred securities will be substituted by preference shares of HSBC Bank having economic terms which are in all material respects equivalent to those of the preferred securities and the guarantee taken together.
HSBC Holdings
2008 2007 US$m US$m Subordinated liabilities:
– At amortised cost ...................................................................................................................... 14,017 8,544 – Designated at fair value (Note 27) ............................................................................................ 16,389 18,683
30,406 27,227
HSBC Holdings subordinated borrowings
2008
US$m 2007 US$m
Amounts owed to third parties €2,000m Callable subordinated floating rate notes 20141 ................................................... 2,805 2,905 US$2,500m 6.5% subordinated notes 2037 .............................................................................. 2,669 2,495 €1,600m 6.25% subordinated notes 2018 ............................................................................ 2,231 – US$2,000m 6.5% subordinated notes 2036 .............................................................................. 2,052 2,058 US$1,500m 6.8% subordinated notes 2038 .............................................................................. 1,484 – US$1,400m 5.25% subordinated notes 2012 ............................................................................ 1,455 1,413 €1,000m 5.375% subordinated notes 2012 .......................................................................... 1,403 1,488 £900m 6.375% callable subordinated notes 20222 ........................................................... 1,330 1,858 £750m 7.0% subordinated notes 2038 .............................................................................. 1,140 – US$1,000m 7.5% subordinated notes 2009 .............................................................................. 1,068 1,077 £650m 6.75% subordinated notes 2028 ............................................................................ 938 – £650m 5.75% subordinated notes 2027 ............................................................................ 878 1,262 €700m 3.625% callable subordinated notes 20203 ........................................................... 840 922 US$750m Callable subordinated floating rate note 20161 .................................................... 750 750 US$750m Callable subordinated floating rate notes 20151 ................................................... 750 750 US$488m 7.625% subordinated notes 2032 .......................................................................... 609 609 £250m 9.875% subordinated bonds 20184 ....................................................................... 441 619 €300m 5.5% subordinated notes 2009 .............................................................................. 432 457 US$222m 7.35% subordinated notes 2032 ............................................................................ 269 268
23,544 18,931
Amounts owed to HSBC undertakings €1,400m 5.3687% fixed/floating subordinated notes 2043 –
HSBC Capital Funding (Euro 2) LP ..................................................................... 1,532 2,018 US$1,350m 9.547% subordinated step-up cumulative notes 2040 –
HSBC Capital Funding (Dollar 1) LP .................................................................. 1,337 1,335 US$900m 10.176% subordinated step-up cumulative notes 2040 –
HSBC Capital Funding (Dollar 1) LP .................................................................. 900 900 €600m 8.03% subordinated step-up cumulative notes 2040 –
HSBC Capital Funding (Euro 1) LP ..................................................................... 834 878 €750m 5.13% fixed/floating subordinated notes 2044 –
HSBC Capital Funding (Euro 3) LP ..................................................................... 790 1,039 US$1,250m 4.61% fixed/floating subordinated notes 2043 –
HSBC Capital Funding (Dollar 2) LP .................................................................. 745 1,130 £500m 8.208% subordinated step-up cumulative notes 2040 –
HSBC Capital Funding (Sterling 1) LP ................................................................ 724 996
6,862 8,296
30,406 27,227
1 The interest margins on the callable subordinated floating rate notes 2014, 2015 and 2016 increase by 0.5 per cent from September 2009, March 2010 and October 2011 respectively. The notes are repayable from their step up date at the option of the borrower, subject to the prior notification of the Financial Services Authority (‘FSA’).
2 The interest rate on the 6.375 per cent callable subordinated notes 2022 changes in October 2017 to become three-month sterling LIBOR plus 1.3 per cent. The notes may be redeemed at par from October 2017 at the option of the borrower, subject to the prior notification of the FSA.
3 The interest rate on the 3.625 per cent callable subordinated notes 2020 changes in June 2015 to become three-month EURIBOR plus 0.93 per cent. The notes may be redeemed at par from June 2015 at the option of the borrower, subject to the prior notification of the FSA.

H S B C H O L D I N G S P L C
Notes on the Financial Statements (continued) Notes 32, 33 and 34
428
4 The interest rate on the 9.875 per cent subordinated bonds 2018 changes in April 2013 to become the higher of (i) 9.875 per cent or (ii) the sum of the yield on the relevant benchmark treasury stock plus 2.5 per cent. The bonds may be redeemed in April 2013 at par and redemption has also been allowed from April 1998, subject to the prior notification of the FSA, for an amount based on the redemption yields of the relevant benchmark treasury stocks.
33 Maturity analysis of assets and liabilities
The following is an analysis, by remaining contractual maturities at the balance sheet date, of asset and liability line items that represent amounts expected to be recovered or settled within one year, and after more than one year.
Trading assets and liabilities are excluded because they are not held for collection or settlement over the period of contractual maturity.
HSBC At 31 December 2008
Due withinone year
Due after more than
one year Total US$m US$m US$m Assets Financial assets designated at fair value .......................................................... 4,735 23,798 28,533 Loans and advances to banks .......................................................................... 146,268 7,498 153,766 Loans and advances to customers .................................................................... 407,582 525,286 932,868 Financial investments ...................................................................................... 111,027 189,208 300,235 Other financial assets ....................................................................................... 27,642 6,308 33,950
697,254 752,098 1,449,352
Liabilities Deposits by banks ............................................................................................ 123,835 6,249 130,084 Customer accounts ........................................................................................... 1,083,426 31,901 1,115,327 Financial liabilities designated at fair value .................................................... 7,368 67,219 74,587 Debt securities in issue .................................................................................... 107,094 72,599 179,693 Other financial liabilities ................................................................................. 70,898 4,860 75,758 Subordinated liabilities .................................................................................... 745 28,688 29,433
1,393,366 211,516 1,604,882
At 31 December 2007
Due withinone year
Due after more than
one year Total US$m US$m US$m Assets Financial assets designated at fair value .......................................................... 5,752 35,812 41,564 Loans and advances to banks .......................................................................... 222,674 14,692 237,366 Loans and advances to customers .................................................................... 438,246 543,302 981,548 Financial investments ...................................................................................... 103,492 179,508 283,000 Other financial assets ....................................................................................... 24,087 6,390 30,477
794,251 779,704 1,573,955
Liabilities Deposits by banks ............................................................................................ 124,475 7,706 132,181 Customer accounts ........................................................................................... 1,066,148 29,992 1,096,140 Financial liabilities designated at fair value .................................................... 6,217 83,722 89,939 Debt securities in issue .................................................................................... 143,651 102,928 246,579 Other financial liabilities ................................................................................. 33,056 4,352 37,408 Subordinated liabilities .................................................................................... 341 24,478 24,819
1,373,888 253,178 1,627,066

429
HSBC Holdings
At 31 December 2008
Due withinone year
Due after more than
one year Total US$m US$m US$m Assets Loans and advances to HSBC undertakings ................................................... 4,842 6,962 11,804 Financial investments ...................................................................................... – 2,629 2,629 Other financial assets ....................................................................................... 25 – 25
4,867 9,591 14,458
Liabilities Amounts owed to HSBC undertakings ........................................................... 176 3,866 4,042 Financial liabilities designated at fair value .................................................... 1,500 14,889 16,389 Other financial liabilities ................................................................................. 1,805 11 1,816 Subordinated liabilities .................................................................................... – 14,017 14,017
3,481 32,783 36,264
At 31 December 2007
Due withinone year
Due after more than
one year Total US$m US$m US$m Assets Loans and advances to HSBC undertakings ................................................... 7,371 9,871 17,242 Financial investments ...................................................................................... 346 2,676 3,022 Other financial assets ....................................................................................... 21 – 21
7,738 12,547 20,285
Liabilities Amounts owed to HSBC undertakings ........................................................... 1,906 1,063 2,969 Financial liabilities designated at fair value .................................................... – 18,683 18,683 Other financial liabilities ................................................................................. 1,397 8 1,405 Subordinated liabilities .................................................................................... – 8,544 8,544
3,303 28,298 31,601
34 Foreign exchange exposures
Structural foreign exchange exposures
HSBC’s structural foreign exchange exposures are represented by the net asset value of its foreign exchange equity and subordinated debt investments in subsidiaries, branches, joint ventures and associates. Gains or losses on structural foreign exchange exposures are recognised directly in equity. HSBC’s management of its structural foreign exchange exposures is discussed in the ‘Report of the Directors: The Management of Risk’ on page 242.
In its separate financial statements, HSBC Holdings recognises its foreign exchange gains and losses on structural foreign exchange exposures in the income statement.

H S B C H O L D I N G S P L C
Notes on the Financial Statements (continued) Notes 34, 35, 36 and 37
430
Net structural foreign exchange exposures
2008 2007 US$m US$m Currency of structural exposure Euro .................................................................................................................................................... 23,137 23,985 Pound sterling .................................................................................................................................... 15,319 24,527 Chinese renminbi ............................................................................................................................... 11,927 10,892 Mexican pesos ................................................................................................................................... 4,127 5,247 Hong Kong dollars ............................................................................................................................. 3,929 4,635 UAE dirhams ..................................................................................................................................... 3,472 2,182 Canadian dollars ................................................................................................................................ 3,423 4,136 Brazilian reais .................................................................................................................................... 3,381 4,007 Indian rupees ...................................................................................................................................... 3,252 2,699 Swiss francs ....................................................................................................................................... 2,192 2,657 Turkish lira ......................................................................................................................................... 1,505 1,796 Korean won ........................................................................................................................................ 1,243 1,282 Malaysian ringgit ............................................................................................................................... 1,148 1,044 Australian dollars ............................................................................................................................... 690 940 Singapore dollars ............................................................................................................................... 534 432 Saudi riyals1 ....................................................................................................................................... 530 404 Egyptian pounds ................................................................................................................................ 517 392 Argentine pesos ................................................................................................................................. 510 370 Taiwanese dollars .............................................................................................................................. 485 382 Vietnamese dong ............................................................................................................................... 483 331 Philippine pesos ................................................................................................................................. 445 459 Thai baht ............................................................................................................................................ 404 384 Costa Rican colon .............................................................................................................................. 378 375 Honduran lempira .............................................................................................................................. 341 325 Qatari rial ........................................................................................................................................... 272 197 Russian rouble ................................................................................................................................... 268 114 Japanese yen ...................................................................................................................................... 263 300 Indonesian rupiah .............................................................................................................................. 221 221 Omani rial .......................................................................................................................................... 210 140 Colombian peso ................................................................................................................................. 185 202 Chilean pesos ..................................................................................................................................... 176 214 South African rand ............................................................................................................................. 151 148 Jordanian dinar ................................................................................................................................... 147 116 New Zealand dollars .......................................................................................................................... 124 169 Bahraini dinar .................................................................................................................................... 114 106 Others, each less than US$100 million .............................................................................................. 732 686 Maltese lira ........................................................................................................................................ – 270
Total ................................................................................................................................................... 86,235 96,766
1 After deducting sales of Saudi riyals amounting to nil (2007: US$750 million) in order to manage the foreign exchange risk of the investments.
All resulting exchange differences on consolidation of foreign operations are recognised in a separate component of equity. Shareholders’ equity would decrease by US$1,830 million (2007: US$2,426 million) if euro and sterling foreign currency exchange rates weakened by 5 per cent relative to the US dollar.
35 Assets charged as security for liabilities and collateral accepted as security for assets
Financial assets pledged to secure liabilities were as follows:
Assets pledged at 31 December 2008 2007 US$m US$m
Treasury bills and other eligible securities ........................................................................................ 3,434 7,200 Loans and advances to banks ............................................................................................................ 6,949 7,389 Loans and advances to customers ...................................................................................................... 70,209 78,755 Debt securities ................................................................................................................................... 185,224 219,956 Equity shares ...................................................................................................................................... 4,326 19,257 Other .................................................................................................................................................. 439 3,933
270,581 336,490

431
These transactions are conducted under terms that are usual and customary to collateralised transactions, including, where relevant, standard securities lending and repurchase agreements.
Collateral accepted as security for assets
The fair value of assets accepted as collateral that HSBC is permitted to sell or repledge in the absence of default is US$225,748 million (2007: US$329,893 million). The fair value of any such collateral that has been sold or repledged was US$159,256 million (2007: US$212,956 million). HSBC is obliged to return equivalent securities.
These transactions are conducted under terms that are usual and customary to standard securities borrowing and reverse repurchase agreements.
36 Minority interests
2008 2007 US$m US$m Minority interests attributable to holders of ordinary shares in subsidiaries .................................... 4,227 4,775 Preference shares issued by subsidiaries ........................................................................................... 2,411 2,481
6,638 7,256
Preference shares issued by subsidiaries
2008 2007 US$m US$m
US$575m 6.36% non-cumulative preferred stock, Series B1 .................................................. 559 559 US$518m Floating rate non-cumulative preferred stock, Series F2 ........................................ 518 518 US$374m Floating rate non-cumulative preferred stock, Series G3......................................... 374 374 US$374m 6.50% non-cumulative preferred stock, Series H3 .................................................. 374 374 CAD175m Non-cumulative redeemable class 1 preferred shares, Series C4............................. 143 178 CAD175m Non-cumulative class 1 preferred shares, Series D4 ............................................... 143 178 US$150m
Depositary shares each representing 25% interest in a share of adjustable-rate cumulative preferred stock, Series D5 ........................................ 150 150
US$150m Cumulative preferred stock6 .................................................................................... 150 150
2,411 2,481
1 The Series B preferred stock is redeemable at the option of HSBC Finance Corporation, in whole or in part, from 24 June 2010 at par. 2 The Series F preferred stock is redeemable at par at the option of HSBC USA Inc., in whole or in part, on any dividend payment date on
or after 7 April 2010. 3 The Series G and Series H preferred stock are redeemable at par at the option of HSBC USA Inc., in whole or in part, at any time from
1 January 2011 and 1 July 2011, respectively. 4 The Series C and Series D preferred stock are redeemable at a declining premium above par at the option of HSBC Bank Canada, in
whole or in part, from 30 June 2010 and 31 December 2010, respectively. 5 The preferred stock has been redeemable at the option of HSBC USA Inc., in whole or in part, from 1 July 1999 at par. 6 The preferred stock has been redeemable at the option of HSBC USA Inc., in whole or in part, from 1 October 2007 at par.
All redemptions are subject to prior notification to the Financial Services Authority and, where relevant, the local banking regulator.
37 Called up share capital and other equity instruments
Authorised
At 31 December 2008 and 2007, the authorised ordinary share capital of HSBC Holdings was US$7,500 million divided into 15,000 million ordinary shares of US$0.50 each.
At 31 December 2008 and 2007, the authorised preference share capital of HSBC Holdings was 10 million non-cumulative preference shares of £0.01 each, 10 million non-cumulative preference shares of US$0.01 each, and 10 million non-cumulative preference shares of €0.01 each.
At 31 December 2008 and 2007, the authorised non-voting deferred share capital of HSBC Holdings was £301,500 divided into 301,500 non-voting deferred shares of £1 each.

H S B C H O L D I N G S P L C
Notes on the Financial Statements (continued) Note 37
432
Issued
2008 2007 US$m US$m
HSBC Holdings ordinary shares ....................................................................................................... 6,053 5,915
Number US$m HSBC Holdings ordinary shares At 1 January 2008 .............................................................................................................................. 11,829,052,317 5,915 Shares issued under HSBC Finance share plans ............................................................................... 65,198 – Shares issued under HSBC employee share plans ............................................................................ 40,578,468 20 Shares issued in lieu of dividends ..................................................................................................... 235,569,099 118
At 31 December 2008 ........................................................................................................................ 12,105,265,082 6,053 At 1 January 2007 .............................................................................................................................. 11,572,207,735 5,786 Shares issued under HSBC Finance share plans ............................................................................... 685,005 – Shares issued under HSBC employee share plans ............................................................................ 32,620,922 17 Shares issued in lieu of dividends ..................................................................................................... 223,538,655 112
At 31 December 2007 ........................................................................................................................ 11,829,052,317 5,915
All ordinary shares in issue confer identical rights in respect of capital, dividends, voting and otherwise. Number US$m HSBC Holdings non-cumulative preference shares of US$0.01 each
At 1 January 2008 and 31 December 2008 ....................................................................................... 1,450,000 –
At 1 January 2007 and 31 December 2007 ....................................................................................... 1,450,000 –
Dividends on the HSBC Holdings non-cumulative dollar preference shares in issue are paid quarterly at the sole and absolute discretion of the Board of Directors. The Board of Directors will not declare a dividend on the preference shares in issue if payment of the dividend would cause HSBC Holdings not to meet the applicable capital adequacy requirements of the FSA or the profit of HSBC Holdings available for distribution as dividends is not sufficient to enable HSBC Holdings to pay in full both dividends on the preference shares in issue and dividends on any other shares that are scheduled to be paid on the same date and that have an equal right to dividends. HSBC Holdings may not declare or pay dividends on any class of its shares ranking lower in the right to dividends than the preference shares in issue nor redeem nor purchase in any manner any of its other shares ranking equal with or lower than the preference shares in issue unless it has paid in full, or set aside an amount to provide for payment in full, the dividends on the preference shares in issue for the then-current dividend period. The preference shares in issue carry no rights to conversion into ordinary shares of HSBC Holdings. Holders of the preference shares in issue will only be entitled to attend and vote at general meetings of shareholders of HSBC Holdings if the dividend payable on the preference shares in issue has not been paid in full for four consecutive dividend payment dates. In such circumstances, holders of the preference shares in issue will be entitled to vote on all matters put to general meetings until such time as HSBC Holdings has paid a full dividend on the preference shares in issue. HSBC Holdings may redeem the preference shares in issue in whole at any time on or after 16 December 2010, subject to prior notification to the FSA.
HSBC Holdings non-voting deferred shares
The 301,500 non-voting deferred shares were in issue throughout 2007 and 2008 and are held by a subsidiary of HSBC Holdings. Holders of the non-voting deferred shares are not entitled to receive dividends on these shares. In addition, on winding-up or other return of capital, holders are entitled to receive the amount paid up on their shares after distribution to ordinary shareholders of £10 million in respect of each ordinary share held by them.
Other equity instruments
On 9 April 2008, HSBC Holdings issued, in bearer form, 88 million 8.125 per cent Perpetual Subordinated Capital Securities (‘Capital Securities’), each with a par value of US$25 and with an aggregate nominal value of US$2,200 million. The securities were issued at par value, raising US$2,133 million, net of issuance costs. The Capital Securities were issued to support the development of and to strengthen further HSBC’s capital base. Coupon payments on the Capital Securities are paid quarterly in arrears from 15 July 2008 and may be deferred at the discretion of HSBC Holdings. The Capital Securities have no fixed maturity and are redeemable at HSBC’s option on

433
or after 15 April 2013 at their principal amounts together with any accrued, unpaid and deferred coupon payments. While any coupon payments are unpaid or deferred, HSBC Holdings will not declare, pay dividends or make distributions or similar periodic payments in respect of, or repurchase, redeem or otherwise acquire any securities of lower or equal rank. At the Company’s discretion, and subject to certain conditions being satisfied, the Capital Securities may be exchanged on any coupon payment date for non-cumulative preference shares to be issued by HSBC Holdings and which would rank pari passu with the dollar preference shares in issue at 2 March 2009. The preference shares will be issued at a nominal value of US$0.01 per share and a premium of US$24.99 per share, with both such amounts being subscribed and fully paid.
Shares under option
Details of the options outstanding to subscribe for HSBC Holdings ordinary shares under the HSBC Holdings Group Share Option Plan, HSBC Holdings Executive Share Option Scheme, the HSBC Share Plan and HSBC Holdings savings-related share option plans are given in Note 10. In aggregate, options outstanding under these plans were as follows:
Number of HSBC Holdings ordinary shares
Period of exercise Exercise price
31 December 2008 ........................................ 211,226,573 2009 to 2015 £5.3496 – 9.642 11,344,167 2009 to 2014 HK$103.4401 – 108.4483 1,304,119 2009 to 2014 €8.6720 – 11.0062 7,382,145 2009 to 2014 US$13.3290 – 14.7478 31 December 2007 ......................................... 240,726,775 2008 to 2015 £5.3496 – 9.642 12,839,412 2008 to 2013 HK$103.4401 – 108.4483 823,472 2008 to 2013 €10.4217 – 11.0062 6,324,920 2008 to 2013 US$13.3290 – 14.7478 31 December 2006 ......................................... 269,423,027 2007 to 2015 £5.0160 – 9.642 6,661,998 2007 to 2012 HK$103.4401 270,473 2007 to 2012 €11.0062 2,932,100 2007 to 2012 US$13.3290 – 14.1621
HSBC France and subsidiary company plans
Following the acquisition of HSBC France in 2000, outstanding employee share options over HSBC France shares vested. On exercise of the options, the HSBC France shares are exchangeable for HSBC Holdings ordinary shares in the same ratio as for the acquisition of HSBC France (13 HSBC Holdings ordinary shares for each HSBC France share).
During 2008, 221,154 (2007: 280,850) HSBC France shares were issued following the exercise of employee share options and were exchanged for 2,875,002 HSBC Holdings ordinary shares. These shares were delivered from the HSBC Holdings Employee Benefit Trust 2001 (No. 1) (2007: 3,651,050 HSBC Holdings ordinary shares). During 2008, no options over HSBC France shares lapsed (2007: nil). During 2007 and 2008 no HSBC France shares previously issued following the exercise of employee share options were exchanged for HSBC Holdings ordinary shares. At 31 December 2008, The HSBC Holdings Employee Benefit Trust 2001 (No. 1) held 8,790,276 (2007: 11,665,278) HSBC Holdings ordinary shares which may be exchanged for HSBC France shares arising from the exercise of options.
HSBC France options effectively outstanding over HSBC Holdings ordinary shares under this arrangement were as follows:
Number of HSBC France shares exchangeable for HSBC Holdings ordinary shares Period of exercise Exercise price
31 December 2008 ............................................... 787,877 2009 to 2010 €81.71 – 142.50 31 December 2007 ................................................ 1,009,031 2008 to 2010 €73.48 – 142.50 31 December 2006 ................................................ 1,287,881 2007 to 2010 €37.05 – 142.50

H S B C H O L D I N G S P L C
Notes on the Financial Statements (continued) Note 37
434
HSBC Private Bank France plan
There are also outstanding options over the shares of HSBC Private Bank France, a subsidiary of HSBC France.
On exercise of options over shares of HSBC Private Bank France, the HSBC Private Bank France shares are exchangeable for HSBC Holdings ordinary shares in the ratio of 1.83 HSBC Holdings shares for each HSBC Private Bank France share. During 2008, 7,000 (2007: 61,880) HSBC Private Bank France shares were issued following the exercise of employee share options and exchanged for 12,810 (2007: 113,234) HSBC Holdings ordinary shares, such shares being delivered from The CCF Employee Benefit Trust 2001 (Private Banking France). During 2008, no options over HSBC Private Bank France shares lapsed (2007: nil). During 2008, no (2007: 8,819) HSBC Private Bank France shares previously issued following the exercise of employee share options were exchanged for HSBC Holdings ordinary shares (2007: 16,137). There were 333,976 HSBC Private Bank France employee share options exchangeable for HSBC Holdings ordinary shares outstanding at 31 December 2008 (2007: 340,976). At 31 December 2008, The CCF Employee Benefit Trust 2001 (Private Banking France) held 943,142 (2007: 955,952) HSBC Holdings ordinary shares which may be exchanged for HSBC Private Bank France shares arising from the exercise of options.
HSBC Private Bank France options effectively outstanding over HSBC Holdings ordinary shares under this arrangement were as follows:
Number of HSBC Private Bank France shares exchangeable for HSBC Holdings ordinary shares
Period of exercise
Exercise price
31 December 2008 ............................................... 333,976 2009 to 2012 €10.84 – 22.22 31 December 2007 ................................................ 340,976 2008 to 2012 €10.84 – 22.22 31 December 2006 ................................................ 411,675 2007 to 2012 €10.84 – 22.22
HSBC Finance and subsidiary company plans
Following the acquisition of HSBC Finance in 2003, all outstanding options and equity-based awards over HSBC Finance common shares were converted into rights to receive HSBC Holdings ordinary shares in the same ratio as the share exchange offer for HSBC Finance (2.675 HSBC Holdings ordinary shares for each HSBC Finance common share) and the exercise prices per share adjusted accordingly. During 2008, options and equity-based awards over 327,635 (2007: 5,370,104) HSBC Holdings ordinary shares were exercised and 169,138 (2007: 4,602,172) HSBC Holdings ordinary shares delivered from The HSBC (Household) Employee Benefit Trust 2003 to satisfy the exercise of these options. During 2008, options over 718,793 (2007: 399,823) HSBC Holdings ordinary shares lapsed. At 31 December 2008, The HSBC (Household) Employee Benefit Trust 2003 held a total of 1,687,279 (2007: 1,856,417) HSBC Holdings ordinary shares and 196,455 (2007: 196,455) ADSs, which may be used to satisfy the exercise of these options and equity-based awards under the HSBC Finance share plans. Each ADS represents five HSBC Holdings ordinary shares.
Options (and, in 2007 and 2006, equity-based awards) outstanding over HSBC Holdings ordinary shares under the HSBC Finance share plans were as follows:
Number of HSBC Holdings ordinary shares Period of exercise Exercise price
31 December 2008 ............................................... 20,681,582 2009 to 2012 US$10.66 – US$21.37 31 December 2007 ................................................ 21,728,010 2008 to 2012 nil – US$21.37 31 December 2006 ................................................ 27,497,937 2007 to 2012 nil – US$21.37
Bank of Bermuda plan
Following the acquisition of Bank of Bermuda in 2004, all outstanding employee share options over Bank of Bermuda shares were converted into rights to receive HSBC Holdings ordinary shares based on the consideration of US$40 for each Bank of Bermuda share and the average closing price of HSBC Holdings ordinary shares, derived from the London Stock Exchange Daily Official List, for the five business days preceding the closing date of the acquisition. During 2008, options over 12,847 HSBC Holdings ordinary shares were exercised (2007: 377,046) and delivered from the HSBC (Bank of Bermuda) Employee Benefit Trust 2004 to satisfy the exercise of these options. During 2008, options over 95,915 (2007: 11,228) HSBC Holdings ordinary shares lapsed. At 31 December 2008, the

435
HSBC (Bank of Bermuda) Employee Benefit Trust 2004 held 1,877,056 (2007: 1,889,903) HSBC Holdings ordinary shares which may be used to satisfy the exercise of options.
Options outstanding over HSBC Holdings ordinary shares under the Bank of Bermuda share plans were as follows:
Number of HSBC Holdings ordinary shares Period of exercise Exercise price
31 December 2008 ............................................... 2,205,321 2009 to 2013 US$7.04 – 18.35 31 December 2007 ................................................ 2,314,083 2008 to 2013 US$7.04 – 18.35 31 December 2006 ................................................ 2,710,368 2007 to 2013 US$7.04 – 18.35
Maximum obligation to deliver HSBC Holdings ordinary shares
At 31 December 2008, the maximum obligation to deliver HSBC Holdings ordinary shares under all of the above option arrangements, together with Performance Share and Restricted Share awards under the HSBC Holdings Restricted Share Plan 2000 and the HSBC Share Plan, was 400,887,713 (2007: 417,044,591). The total number of shares at 31 December 2008 held by employee benefit trusts that may be used to satisfy such obligations to deliver HSBC Holdings ordinary shares was 164,985,811 (2007: 149,423,898).

436
H S B C H O L D I N G S P L C
Notes on the Financial Statements (continued)
Note 38 38
E
qu
ity
20
08
O
ther
res
erve
s
Cal
led
up
sh
are
ca
pita
l
Shar
e p
rem
ium
1
O
ther
equi
ty
in
stru
-
men
ts5
Ret
aine
d
earn
ings
2
Ava
ilabl
e-
fo
r-sa
le
fai
r va
lue
re
serv
e
Cas
h flo
w
he
dgin
g
rese
rve3
Fore
ign
exc
hang
e
rese
rve
Sh
are-
ba
sed
pa
ymen
t
rese
rve
M
erge
r
rese
rve4
T
otal
shar
e-
hold
ers’
equi
ty
Min
ority
in
tere
sts3
T
otal
equi
ty
U
S$m
U
S$m
U
S$m
U
S$m
U
S$m
U
S$m
U
S$m
U
S$m
U
S$m
U
S$m
U
S$m
U
S$m
At 1
Janu
ary
......
......
......
......
......
......
......
......
......
....
5,91
5 8,
134
– 81
,097
85
0 (9
17)
10,0
55
1,96
8 21
,058
12
8,16
0 7,
256
135,
416
Sh
ares
issu
ed u
nder
em
ploy
ee sh
are
plan
s ...
......
.. 20
45
0 –
– –
– –
– –
470
– 47
0
Shar
es is
sued
in li
eu o
f div
iden
ds a
nd
amou
nts a
risin
g th
ereo
n1 .....
......
......
......
......
.....
118
(1
21)
– 3,
596
– –
– –
– 3,
593
– 3,
593
C
apita
l sec
uriti
es is
sued
5 .....
......
......
......
......
......
...
– –
2,13
3 –
– –
– –
– 2,
133
2,
133
Pr
ofit
for t
he y
ear .
......
......
......
......
......
......
......
......
. –
– –
5,72
8 –
– –
– –
5,72
8 77
0 6,
498
D
ivid
ends
to sh
areh
olde
rs ..
......
......
......
......
......
....
– –
– (1
1,30
1)–
– –
– –
(11,
301)
(813
)(1
2,11
4)
Ow
n sh
ares
adj
ustm
ent .
......
......
......
......
......
......
....
– –
– (1
,002
)–
– –
– –
(1,0
02)
– (1
,002
) Sh
are
of c
hang
es re
cogn
ised
dire
ctly
in th
e e
quity
of a
ssoc
iate
s or j
oint
ven
ture
s ...
......
.....
– –
– (5
59)
– –
– –
– (5
59)
– (5
59)
Act
uaria
l los
ses o
n de
fined
ben
efit
plan
s ...
......
....
– –
– (1
,457
)–
– –
– –
(1,4
57)
(152
)(1
,609
) Ex
chan
ge d
iffer
ence
s ...
......
......
......
......
......
......
....
– –
– (1
4,07
0)2,
120
(30)
–
– –
(11,
980)
(225
)(1
2,20
5)
Fair
valu
e lo
sses
take
n to
equ
ity .
......
......
......
......
. –
– –
– (2
3,20
6)(1
,762
) –
– –
(24,
968)
(474
)(2
5,44
2)
Am
ount
s tra
nsfe
rred
to th
e in
com
e st
atem
ent3 ..
...
– –
– –
(1,3
01)
1,77
2
– –
– 47
1 (3
3)43
8 Im
pairm
ents
take
n to
the
inco
me
stat
emen
t ...
......
–
– –
– 1,
701
– –
– –
1,70
1 78
1,
779
Ex
erci
se a
nd la
pse
of sh
are
optio
ns a
nd
vest
ing
of sh
are
awar
ds ..
......
......
......
......
......
....
– –
–
827
– –
– (8
48)
– (2
1)–
(21)
C
ost o
f sha
re-b
ased
pay
men
t arr
ange
men
ts ..
......
. –
– –
–
– –
819
– 81
9 –
819
O
ther
mov
emen
ts ..
......
......
......
......
......
......
......
......
–
– –
(252
)74
5
82
56
–
(35)
73
38
Tax
on it
ems t
aken
dire
ctly
to o
r tra
nsfe
rred
fr
om e
quity
....
......
......
......
......
......
......
......
......
...
– –
– 41
1 1,
332
96
– –
– 1,
839
40
1,87
9
Tran
sfer
s ...
......
......
......
......
......
......
......
......
......
......
–
– –
17,6
71
(2,1
20)
30
(11,
980)
– (3
,601
)–
– –
Net
incr
ease
in m
inor
ity in
tere
st a
risin
g on
ac
quis
ition
s, di
spos
als a
nd c
apita
l iss
uanc
e ...
.. –
– –
– –
– –
– –
– 11
8 11
8
At 3
1 D
ecem
ber .
......
......
......
......
......
......
......
......
...
6,05
3 8,
463
2,13
3 80
,689
(2
0,55
0)(8
06)
(1,8
43)
1,99
5 17
,457
93
,591
6,
638
100,
229
Cum
ulat
ive
good
will
am
ount
ing
to U
S$5,
138
mill
ion
has b
een
char
ged
agai
nst r
eser
ves i
n re
spec
t of a
cqui
sitio
ns o
f sub
sidi
arie
s pr
ior t
o 1
Janu
ary
1998
, inc
ludi
ng U
S$3,
469
mill
ion
char
ged
agai
nst t
he
mer
ger r
eser
ve a
risi
ng o
n th
e ac
quis
ition
of H
SBC
Ban
k pl
c. T
he b
alan
ce o
f US$
1,66
9 m
illio
n ha
s bee
n ch
arge
d ag
ains
t ret
aine
d ea
rnin
gs.

437
2007
Oth
er re
serv
es
Cal
led
up
sh
are
ca
pita
l
Shar
e
prem
ium
1
Ret
aine
d
earn
ings
2
Ava
ilabl
e-
fo
r-sa
le
fai
r val
ue
re
serv
e
Cas
h flo
w
he
dgin
g
rese
rve3
Fore
ign
exc
hang
e
rese
rve
Sh
are-
base
d
paym
ent
re
serv
e
Mer
ger
re
serv
e4
To
tal
sh
are-
ho
lder
s’
eq
uity
Min
ority
inte
rest
s3
Tota
l
equi
ty
US$
m
US$
m
US$
m
US$
m
US$
m
US$
m
US$
m
US$
m
US$
m
US$
m
US$
m
At 1
Janu
ary
......
......
......
......
......
......
......
......
......
......
......
......
......
5,
786
7,78
9 65
,397
2,
005
(101
) 4,
307
2,11
1 21
,058
10
8,35
2 6,
576
114,
928
Sh
ares
issu
ed u
nder
em
ploy
ee sh
are
plan
s ...
......
......
......
......
....
17
460
– –
– –
– –
477
– 47
7
Shar
es is
sued
in li
eu o
f div
iden
ds a
nd a
mou
nts
aris
ing
ther
eon1 ..
......
......
......
......
......
......
......
......
......
......
......
. 11
2 (1
15)
4,35
4 –
– –
– –
4,35
1 –
4,35
1
Prof
it fo
r the
yea
r ....
......
......
......
......
......
......
......
......
......
......
......
–
– 19
,133
–
– –
– –
19,1
33
1,32
2 20
,455
D
ivid
ends
to sh
areh
olde
rs ..
......
......
......
......
......
......
......
......
......
–
– (1
0,24
1)–
– –
– –
(10,
241)
(788
)(1
1,02
9)
Ow
n sh
ares
adj
ustm
ent .
......
......
......
......
......
......
......
......
......
......
–
– (5
10)
– –
– –
– (5
10)
– (5
10)
Shar
e of
cha
nges
reco
gnis
ed d
irect
ly in
the
equi
ty o
f as
soci
ates
or j
oint
ven
ture
s ...
......
......
......
......
......
......
......
.....
– –
372
– –
– –
– 37
2 –
372
A
ctua
rial g
ains
/(los
ses)
on
defin
ed b
enef
it pl
ans
......
......
......
.. –
– 2,
234
– –
– –
– 2,
234
(67)
2,16
7
Exch
ange
diff
eren
ces
......
......
......
......
......
......
......
......
......
......
...
– –
5,45
9 29
1 (2
8)
26
– –
5,74
8 19
8 5,
946
Fa
ir va
lue
gain
s tak
en to
equ
ity ..
......
......
......
......
......
......
......
....
– –
– 52
6 61
6
– –
– 1,
142
239
1,38
1
Am
ount
s tra
nsfe
rred
to th
e in
com
e st
atem
ent3 ..
......
......
......
.....
– –
– (1
,799
)(1
,899
) –
– –
(3,6
98)
(14)
(3,7
12)
Impa
irmen
ts ta
ken
to th
e in
com
e st
atem
ent
......
......
......
......
.....
– –
– 86
–
– –
– 86
–
86
Exer
cise
and
laps
e of
shar
e op
tions
and
ves
ting
of
shar
e aw
ards
.....
......
......
......
......
......
......
......
......
......
......
......
.. –
– 75
8 –
– –
(751
)–
7 –
7
Cos
t of s
hare
-bas
ed p
aym
ent a
rran
gem
ents
.....
......
......
......
......
–
– –
– –
– 87
0 –
870
– 87
0
Oth
er m
ovem
ents
.....
......
......
......
......
......
......
......
......
......
......
.....
– –
320
1 (6
) –
(262
)–
53
(91)
(38)
Ta
x on
item
s tak
en d
irect
ly to
or t
rans
ferr
ed fr
om e
quity
....
...
– –
(720
)31
47
3
– –
– (2
16)
(10)
(226
) Tr
ansf
ers
......
......
......
......
......
......
......
......
......
......
......
......
......
.....
– –
(5,4
59)
(291
)28
5,
722
– –
– –
– N
et in
crea
se in
min
ority
inte
rest
aris
ing
on a
cqui
sitio
ns,
disp
osal
s and
cap
ital i
ssua
nce
......
......
......
......
......
......
......
....
– –
– –
– –
– –
– (1
09)
(109
)
At 3
1 D
ecem
ber .
......
......
......
......
......
......
......
......
......
......
......
.....
5,91
5 8,
134
81,0
97
850
(917
) 10
,055
1,
968
21,0
58
128,
160
7,25
6 13
5,41
6
Cum
ulat
ive
good
will
am
ount
ing
to U
S$5,
138
mill
ion
has b
een
char
ged
agai
nst r
eser
ves i
n re
spec
t of a
cqui
sitio
ns o
f sub
sidi
arie
s pr
ior t
o 1
Janu
ary
1998
, inc
ludi
ng U
S$3,
469
mill
ion
char
ged
agai
nst t
he
mer
ger r
eser
ve a
risi
ng o
n th
e ac
quis
ition
of H
SBC
Ban
k pl
c. T
he b
alan
ce o
f US$
1,66
9 m
illio
n ha
s bee
n ch
arge
d ag
ains
t ret
aine
d ea
rnin
gs.

H S B C H O L D I N G S P L C
Notes on the Financial Statements (continued)
Notes 38 and 39
438
2006
Oth
er re
serv
es
Cal
led
up
sh
are
ca
pita
l
Shar
e
prem
ium
1
Ret
aine
d
earn
ings
2
Ava
ilabl
e-
fo
r-sa
le
fai
r val
ue
re
serv
e
Cas
h flo
w
he
dgin
g
rese
rve3
Fore
ign
exc
hang
e
rese
rve
Sh
are-
base
d
paym
ent
re
serv
e
Mer
ger
re
serv
e4
To
tal
sh
are-
ho
lder
s’
eq
uity
Min
ority
inte
rest
s3
Tota
l
equi
ty
US$
m
US$
m
US$
m
US$
m
US$
m
US$
m
US$
m
US$
m
US$
m
US$
m
US$
m
At 1
Janu
ary
......
......
......
......
......
......
......
......
......
......
......
......
......
5,
667
6,89
6 56
,223
1,
104
233
(2
84)
1,53
5 21
,058
92
,432
5,
794
98,2
26
Shar
es is
sued
und
er e
mpl
oyee
shar
e pl
ans
......
......
......
......
......
. 40
97
5 –
– –
– –
– 1,
015
– 1,
015
Sh
ares
issu
ed in
lieu
of d
ivid
ends
and
am
ount
s aris
ing
ther
eon1
79
(82)
2,52
8 –
– –
– –
2,52
5 –
2,52
5
Prof
it fo
r the
yea
r ....
......
......
......
......
......
......
......
......
......
......
......
–
– 15
,789
–
– –
– –
15,7
89
1,08
2 16
,871
D
ivid
ends
to sh
areh
olde
rs ..
......
......
......
......
......
......
......
......
......
–
– (8
,769
)–
– –
– –
(8,7
69)
(785
)(9
,554
) O
wn
shar
es a
djus
tmen
t ....
......
......
......
......
......
......
......
......
......
...
– –
(529
)–
– –
– –
(529
)–
(529
) Sh
are
of c
hang
es re
cogn
ised
dire
ctly
in th
e eq
uity
of
asso
ciat
es o
r joi
nt v
entu
res
......
......
......
......
......
......
......
......
.. –
– 20
–
– –
– –
20
– 20
A
ctua
rial g
ains
/(los
ses)
on
defin
ed b
enef
it pl
ans
......
......
......
.. –
– (9
2)–
– –
– –
(92)
14
(78)
Ex
chan
ge d
iffer
ence
s ...
......
......
......
......
......
......
......
......
......
......
–
– 4,
446
89
(8)
26
38
– 4,
591
84
4,67
5
Fair
valu
e ga
ins t
aken
to e
quity
.....
......
......
......
......
......
......
......
. –
– –
1,51
4 1,
560
–
– –
3,07
4 62
3,
136
A
mou
nts t
rans
ferr
ed to
the
inco
me
stat
emen
t3 .....
......
......
......
.. –
– –
(622
)(2
,219
) –
– –
(2,8
41)
(22)
(2,8
63)
Impa
irmen
ts ta
ken
to th
e in
com
e st
atem
ent
......
......
......
......
.....
– –
– 21
–
– –
– 21
–
21
Exer
cise
and
laps
e of
shar
e op
tions
and
ves
ting
of
shar
e aw
ards
.....
......
......
......
......
......
......
......
......
......
......
......
.. –
– 68
4 –
– –
(623
)–
61
– 61
C
ost o
f sha
re-b
ased
pay
men
t arr
ange
men
ts ..
......
......
......
......
...
– –
– –
– –
854
– 85
4 –
854
O
ther
mov
emen
ts ..
......
......
......
......
......
......
......
......
......
......
......
.. –
– (1
02)
(9)
2
– 34
5 –
236
(103
)13
3
Tax
on it
ems t
aken
dire
ctly
to o
r tra
nsfe
rred
from
equ
ity .
......
–
– (3
55)
(3)
323
–
– –
(35)
(9)
(44)
Tr
ansf
ers
......
......
......
......
......
......
......
......
......
......
......
......
......
.....
– –
(4,4
46)
(89)
8
4,56
5 (3
8)–
– –
– N
et in
crea
se in
min
ority
inte
rest
aris
ing
on a
cqui
sitio
ns,
disp
osal
s and
cap
ital i
ssua
nce
......
......
......
......
......
......
......
....
– –
– –
– –
– –
– 45
9 45
9
At 3
1 D
ecem
ber .
......
......
......
......
......
......
......
......
......
......
......
.....
5,78
6 7,
789
65,3
97
2,00
5 (1
01)
4,30
7 2,
111
21,0
58
108,
352
6,57
6 11
4,92
8
Cum
ulat
ive
good
will
am
ount
ing
to U
S$5,
138
mill
ion
has b
een
char
ged
agai
nst r
eser
ves i
n re
spec
t of a
cqui
sitio
ns o
f sub
sidi
arie
s pr
ior t
o 1
Janu
ary
1998
, inc
ludi
ng U
S$3,
469
mill
ion
char
ged
agai
nst t
he
mer
ger r
eser
ve a
risi
ng o
n th
e ac
quis
ition
of H
SBC
Ban
k pl
c. T
he b
alan
ce o
f US$
1,66
9 m
illio
n ha
s bee
n ch
arge
d ag
ains
t ret
aine
d ea
rnin
gs.
1 Sh
are
prem
ium
incl
udes
the
dedu
ctio
n of
US$
3 m
illio
n in
resp
ect o
f iss
uanc
e co
sts i
ncur
red
duri
ng th
e ye
ar (2
007:
US$
3 m
illio
n; 2
006:
US$
3 m
illio
n).
2 Re
tain
ed e
arni
ngs i
nclu
de 1
94,7
51,8
29 (U
S$3,
094
mill
ion)
of o
wn
shar
es h
eld
with
in H
SBC
’s in
sura
nce
busi
ness
, ret
irem
ent f
unds
for t
he b
enef
it of
pol
icyh
olde
rs o
r ben
efic
iari
es w
ithin
em
ploy
ee tr
usts
fo
r the
settl
emen
t of s
hare
s exp
ecte
d to
be
deliv
ered
und
er e
mpl
oyee
shar
e sc
hem
es o
r bon
us p
lans
, and
the
mar
ket-m
akin
g ac
tiviti
es in
Glo
bal M
arke
ts (2
007:
158
, 706
,463
(US$
2,64
9 m
illio
n); 2
006:
14
8,32
3,10
2 (U
S$2,
305
mill
ion)
). 20
06 n
umbe
rs h
ave
been
rest
ated
to c
onfo
rm w
ith th
e cu
rren
t yea
r’s p
rese
ntat
ion.
3
Amou
nts t
rans
ferr
ed to
the
inco
me
stat
emen
t in
resp
ect o
f cas
h flo
w h
edge
s inc
lude
US$
152
mill
ion
(200
7: U
S$57
mill
ion:
200
6: U
S$47
9 m
illio
n) ta
ken
to ‘N
et in
tere
st in
com
e’ a
nd U
S$1,
602
mill
ion
(200
7: U
S$1,
829
mill
ion;
200
6: U
S$1,
719
mill
ion)
take
n to
‘Net
trad
ing
inco
me’
. 4
Stat
utor
y sh
are
prem
ium
relie
f und
er S
ectio
n 13
1 of
the
Com
pani
es A
ct 1
985
was
take
n in
resp
ect o
f the
acq
uisi
tion
of H
SBC
Fra
nce
in 2
000
and
HSB
C F
inan
ce in
200
3 an
d th
e sh
ares
issu
ed w
ere
reco
rded
at t
heir
nom
inal
val
ue o
nly.
The
fair
val
ue d
iffer
ence
s of U
S$8,
290
mill
ion
and
US$
12,7
68 m
illio
n in
resp
ect o
f HSB
C F
ranc
e an
d H
SBC
Fin
ance
, res
pect
ivel
y, w
ere
reco
gnis
ed a
s a m
erge
r re
serv
e. T
he m
erge
r res
erve
cre
ated
on
the
acqu
isiti
on o
f HSB
C F
inan
ce su
bseq
uent
ly b
ecam
e at
tach
ed to
HSB
C O
vers
eas H
oldi
ngs (
UK
) Lim
ited
(‘HO
HU
’), f
ollo
win
g a
num
ber o
f int
er-g
roup
re
orga
nisa
tions
. At 3
1 D
ecem
ber 2
008,
an
amou
nt o
f US$
3,60
1 m
illio
n w
as tr
ansf
erre
d fr
om th
is re
serv
e to
reta
ined
ear
ning
s as a
resu
lt of
impa
irm
ent i
n H
SBC
Hol
ding
s' in
vest
men
t in
HO
HU
. 5
Dur
ing
Apri
l 200
8, H
SBC
Hol
ding
s iss
ued
US$
2,20
0 m
illio
n of
Per
petu
al S
ubor
dina
ted
Cap
ital S
ecur
ities
(‘C
apita
l Sec
uriti
es’)
, inc
ludi
ng U
S$67
mill
ion
of is
suan
ce c
osts
, whi
ch a
re c
lass
ified
as e
quity
un
der I
FRSs
.

439
39 Notes on the cash flow statement
Non-cash items included in profit before tax
HSBC HSBC Holdings 2008 2007 2006 2008 2007 US$m US$m US$m US$m US$m
Depreciation, amortisation and impairment ............... 13,367 2,522 2,528 3,601 (25)Gains arising from dilution of interests in associates.. – (1,092) – – – Revaluations on investment property ......................... 92 (152) (164) – – Share-based payment expense .................................... 819 870 854 14 29 Loan impairment losses gross of recoveries and
other credit risk provisions ..................................... 25,034 18,247 11,352 – – Provisions ................................................................... 591 989 498 – – Impairment of financial investments .......................... 1,779 39 – – – Charge for defined benefit plans ................................ 490 727 664 – – Accretion of discounts and amortisation of
premiums ................................................................ (867) (449) (776) 4 6
41,305 21,701 14,956 3,619 10
Change in operating assets
HSBC HSBC Holdings 2008 2007 2006 2008 2007 US$m US$m US$m US$m US$m
Change in loans to HSBC undertakings ..................... – – – 3,129 (2,786)Change in prepayments and accrued income ............. 4,178 (5,069) (2,478) 166 (183)Change in net trading securities and net derivatives .. (23,293) (4,972) (13,620) (16) (1,094)Change in loans and advances to banks ..................... 22,596 (8,922) (11,505) – – Change in loans and advances to customers .............. 7,279 (131,886) (132,987) – – Change in financial assets designated at fair value .... 12,757 (13,360) (4,883) (12) – Change in other assets ................................................ (5,394) (12,329) (9,844) (4) 4
18,123 (176,538) (175,317) 3,263 (4,059)
Change in operating liabilities
HSBC HSBC Holdings 2008 2007 2006 2008 2007 US$m US$m US$m US$m US$m
Change in accruals and deferred income .................... (6,169) 5,119 3,549 138 39 Change in deposits by banks ...................................... (3,038) 32,594 28,378 – – Change in customer accounts ..................................... 32,372 199,806 149,849 – – Change in debt securities in issue ............................... (67,152) (12,489) 42,253 – – Change in financial liabilities designated at fair value (15,352) 12,304 8,382 (2,299) 148 Change in other liabilities ........................................... (4,074) 12,761 4,967 126 (8)
(63,413) 250,095 237,378 (2,035) 179
Cash and cash equivalents
HSBC HSBC Holdings 2008 2007 2006 2008 2007 US$m US$m US$m US$m US$m
Cash at bank with HSBC undertakings ...................... – – – 443 360 Cash and balances at central banks ............................ 52,396 21,765 12,732 – – Items in the course of collection from other banks .... 6,003 9,777 14,144 – – Loans and advances to banks of one month or less ... 165,066 232,320 162,998 – – Treasury bills, other bills and certificates of deposit
less than three months ............................................ 62,639 41,819 38,237 – – Less: items in the course of transmission to
other banks .............................................................. (7,232) (8,672) (12,625) – –
Total cash and cash equivalents ................................. 278,872 297,009 215,486 443 360

H S B C H O L D I N G S P L C
Notes on the Financial Statements (continued)
Notes 39 and 40
440
Interest and dividends
HSBC HSBC Holdings 2008 2007 2006 2008 2007 US$m US$m US$m US$m US$m
Interest paid ................................................................. (60,342) (63,626) (47,794) (2,525) (2,397)Interest received .......................................................... 107,019 103,393 85,143 1,619 1,627 Dividends received ..................................................... 1,876 1,833 1,525 10,779 9,187
40 Contingent liabilities, contractual commitments and guarantees
HSBC
HSBC Holdings 2008 2007 2008 2007 US$m US$m US$m US$m Guarantees and contingent liabilities
Guarantees and irrevocable letters of credit pledged as collateral security ............................... 72,895 77,885 47,341 38,457
Other contingent liabilities ....................................... 259 334 – –
73,154 78,219 47,341 38,457
Commitments Documentary credits and short-term trade-related
transactions ........................................................... 9,789 13,510 – – Forward asset purchases and forward forward
deposits placed ..................................................... 197 490 – – Undrawn note issuing and revolving
underwriting facilities .......................................... – 109 – – Undrawn formal standby facilities, credit lines
and other commitments to lend ............................ 594,036 750,348 3,241 3,638
604,022 764,457 3,241 3,638
The above table discloses the nominal principal amounts of commitments excluding capital commitments, which are separately disclosed below, guarantees and other contingent liabilities; mainly credit-related instruments including both financial and non-financial guarantees and commitments to extend credit. Contingent liabilities arising from litigation against the Group are disclosed in Note 42. Nominal principal amounts represent the amounts at risk should contracts be fully drawn upon and clients default. The amount of the loan commitments shown above reflects, where relevant, the expected level of take-up of pre-approved loan offers made by mailshots to personal customers. As a significant portion of guarantees and commitments is expected to expire without being drawn upon, the total of the nominal principal amounts is not representative of future liquidity requirements.
Guarantees
HSBC provides guarantees and similar undertakings on behalf of both third-party customers and other entities within the HSBC Group. These guarantees are generally provided in the normal course of HSBC’s banking business. The principal types of guarantees provided, and the maximum potential amount of future payments which HSBC could be required to make at 31 December 2008, were as follows:

441
At 31 December 2008 At 31 December 2007
Guarantees infavour of
third parties
Guarantees by HSBCHoldings
in favour ofother HSBC
Group entities
Guarantees in favour of third parties
Guarantees by HSBC Holdings
in favour of other HSBC
Group entities US$m US$m US$m US$m Guarantee type Financial guarantee contracts1 ...................................... 20,879 47,341 25,086 38,457 Standby letters of credit which are financial
guarantee contracts2 .................................................. 11,171 – 8,357 – Other direct credit substitutes3 ...................................... 4,613 – 4,938 – Performance bonds4 ...................................................... 15,304 – 12,969 – Bid bonds4 ..................................................................... 627 – 1,119 – Standby letters of credit related to particular
transactions4 .............................................................. 4,791 – 8,235 – Other transaction-related guarantees4 ........................... 15,028 – 16,940 – Other items .................................................................... 482 – 241 –
72,895 47,341 77,885 38,457
1 Financial guarantees are contracts that require the issuer to make specified payments to reimburse the holder for a loss incurred because a specified debtor fails to make payment when due in accordance with the original or modified terms of a debt instrument. The amounts in the above table are nominal principal amounts.
2 Standby letters of credit which are financial guarantee contracts are irrevocable obligations on the part of HSBC to pay third parties when customers fail to make payments when due.
3 Other direct credit substitutes include re-insurance letters of credit and trade-related letters of credit issued without provision for the issuing entity to retain title to the underlying shipment.
4 Performance bonds, bid bonds, standby letters of credit and other transaction-related guarantees are undertakings by which the obligation on HSBC to make payment depends on the outcome of a future event.
The amounts disclosed in the above table reflect HSBC’s maximum exposure under a large number of individual guarantee undertakings. The risks and exposures arising from guarantees are captured and managed in accordance with HSBC’s overall credit risk management policies and procedures. Approximately half of the above guarantees have a term of less than one year. Guarantees with terms of more than one year are subject to HSBC’s annual credit review process.
Financial Services Compensation Scheme
The UK Financial Services Compensation Scheme (‘FSCS’) has provided compensation to consumers following the collapse of a number of deposit takers such as Bradford & Bingley plc, Heritable Bank plc, Kaupthing Singer & Friedlander Limited, Landsbanki ‘Icesave’ and London Scottish Bank plc. The compensation paid out to consumers is currently funded through loans from the Bank of England and HM Treasury. HSBC Bank plc (‘the bank’) could be liable to pay a proportion of the outstanding borrowings that the FSCS has borrowed from HM Treasury which at 16 December 2008 stood at £19.7 billion (US$28.7 billion). The bank is also obligated to pay its share of forecast management expenses based on the bank’s market share of deposits protected under the FSCS. The bank has provided £86 million (US$125.4 million) as at 31 December 2008 in respect of the share of forecast management expense, including interest costs, for the 2008/9 and 2009/10 levy years. This accrual is based on the bank’s estimated share of total market protected deposits at 31 December 2007 and 2008, respectively. However, the ultimate FSCS levy to the industry as a result of the 2008 collapses cannot currently be estimated reliably as it is dependent on various uncertain factors including the potential recoveries of assets by the FSCS and changes in the interest rate, the level of protected deposits and the population of FSCS members at the time.
Commitments
In addition to the commitments disclosed on page 440, at 31 December 2008, HSBC had US$1,541 million (2007: US$942 million) of capital commitments contracted but not provided for and US$267 million (2007: US$194 million) of capital commitments authorised but not contracted for.

H S B C H O L D I N G S P L C
Notes on the Financial Statements (continued)
Notes 40, 41 and 42
442
Agreement to acquire Bank Ekonomi
In October 2008, HSBC entered into an agreement to acquire 88.89 per cent of PT Bank Ekonomi Raharja Tbk (Bank Ekonomi), in Indonesia, for cash consideration of US$608 million. Following acquisition of this initial stake, HSBC would be required under Indonesian law to make a mandatory tender offer for a further holding of up to 10.11 per cent, taking HSBC’s share to 99 per cent. The transaction is pending regulatory approval.
Associates
HSBC’s share of associates’ contingent liabilities amounted to US$17,943 million at 31 December 2008 (2007: US$18,437 million). No matters arose where HSBC was severally liable.
41 Lease commitments
Finance lease commitments
HSBC leases land and buildings (including branches) and equipment from third parties under finance lease arrangements to support its operations. 2008 2007
Total future minimum payments
Future interest charges
Present value of finance lease commitments
Total future minimum payments
Future interest charges
Present value of finance lease commitments
US$m US$m US$m US$m US$m US$m Lease commitments:
– no later than one year ................................. 55 (28) 27 39 (24) 15 – later than one year and no later than five
years ............................................................ 188 (130) 58 128 (101) 27 – later than five years .................................... 736 (258) 478 835 (174) 661
979 (416) 563 1,002 (299) 703
At 31 December 2008, future minimum sublease payments of US$458 million (2007: US$465 million) are expected to be received under non-cancellable subleases at the balance sheet date.
Operating lease commitments
At 31 December 2008, HSBC was obligated under a number of non-cancellable operating leases for properties, plant and equipment on which the future minimum lease payments extend over a number of years.
2008 2007
Land andbuildings Equipment
Land and buildings Equipment
US$m US$m US$m US$m Future minimum lease payments under non-cancellable
operating leases: – no later than one year ........................................... 757 9 788 11 – later than one year and no later than five years ... 1,791 9 2,010 14 – later than five years .............................................. 1,573 – 1,736 –
4,121 18 4,534 25
In 2008, US$861 million (2007: US$849 million; 2006: US$781 million) was charged to ‘General and administrative expenses’ in respect of lease and sublease agreements, of which US$636 million (2007: US$838 million; 2006: US$762 million) related to minimum lease payments, US$22 million (2007: US$8 million; 2006: US$19 million) to contingent rents, and US$204 million (2007: US$3 million; 2006: nil) to sublease payments.
The contingent rent represents escalation payments made to landlords for operating, tax and other escalation expenses.
Finance lease receivables
HSBC leases a variety of assets to third parties under finance leases, including transport assets (such as aircraft), property and general plant and machinery. At the end of lease terms, assets may be sold to third parties or leased for further terms. Lessees may participate in any sales proceeds achieved. Lease rentals arising during the lease terms will either be fixed in quantum or be varied to reflect changes in, for example, tax or interest rates. Rentals are calculated to recover the cost of assets less their residual value, and earn finance income.

443
2008 2007
Total future minimum payments
Unearnedfinanceincome
Presentvalue
Total futureminimum payments
Unearned finance income
Present value
US$m US$m US$m US$m US$m US$m Lease receivables:
– no later than one year ...... 3,013 (389) 2,624 2,958 (528) 2,430 – later than one year and
no later than five years .... 8,783 (1,186) 7,597 8,741 (1,500) 7,241 – later than five years ......... 8,114 (2,334) 5,780 9,194 (2,789) 6,405
19,910 (3,909) 16,001 20,893 (4,817) 16,076
At 31 December 2008, unguaranteed residual values of US$197 million (2007: US$224 million) had been accrued, and the accumulated allowance for uncollectible minimum lease payments receivable amounted to US$21 million (2007: US$23 million).
During the year, a total of US$10 million (2007: US$44 million) was received as contingent rents and recognised in the income statement.
Operating lease receivables
HSBC leases a variety of different assets to third parties under operating lease arrangements, including transport assets (such as rolling stock), property and general plant and machinery.
2008 2007
Land andbuildings Equipment
Land and buildings Equipment
US$m US$m US$m US$m Future minimum lease payments under
non-cancellable operating leases: – no later than one year ........................................... 37 678 50 838 – later than one year and no later than five years ... 31 625 14 1,363 – later than five years .............................................. 21 110 10 400
89 1,413 74 2,601
42 Litigation
On 27 July 2007, the UK Office of Fair Trading (‘OFT’) issued High Court legal proceedings against a number of UK financial institutions, including HSBC Bank, to determine the legal status and enforceability of certain of the charges applied to their personal customers in relation to unauthorised overdrafts (the ‘charges’). Pending the resolution of the proceedings, the Financial Services Authority (‘FSA’) has granted firms (including HSBC Bank) a waiver enabling them to place relevant complaints about the charges on hold and the County Courts have stayed all individual customer claims.
Certain preliminary issues in these proceedings have been heard in the Commercial Division of the High Court. This has confirmed that HSBC Bank’s current and historic charges are capable of being tested for fairness but are not capable of being penalties. HSBC Bank (and all the other financial institutions involved in the legal proceedings) appealed the finding that the current charges are capable of being tested for fairness. The Court of Appeal delivered its judgement on 26 February 2009, confirming the decision of the High Court that the charges of HSBC Bank (and all of the other financial institutions involved in the legal proceedings) are capable of being tested for fairness. HSBC Bank is considering applying for leave to appeal to the House of Lords.
The proceedings remain at an early stage and may, allowing for appeals on the issues, take some time to conclude. A wide range of outcomes is possible, depending upon the outcome of any appeal to the House of Lords and, to the extent applicable, upon the Court’s assessment of the fairness of each charge across the period under review. Since July 2001, there have been a variety of charges applied by HSBC Bank across different charging periods under the then existing contractual arrangements. HSBC Bank considers the charges to be and to have been valid and enforceable, and intends strongly to defend its position.
If, contrary to HSBC Bank’s current assessment, the Court should ultimately (after appeals) reach an adverse decision that results in a liability, a large number of different outcomes is possible, each of which would have a different financial impact. Given that there is limited authority on how an assessment of fairness should be conducted, HSBC

H S B C H O L D I N G S P L C
Notes on the Financial Statements (continued)
Notes 42 and 43
444
Bank’s estimate of the potential financial impact is that it could be in the order of approximately £350 million (US$510 million), as published in the Interim Report 2008. To make an estimate of the potential financial impact at this stage with any precision is extremely difficult, owing to (among other things) the complexity of the issues, the number of permutations of possible outcomes, and the early stage of the proceedings. In addition, the assumptions made by HSBC Bank may prove to be incorrect.
On 11 December 2008 Bernard L Madoff (‘Madoff’) was arrested and charged in the United States District Court for the Southern District of New York with one count of securities fraud. That same day, the US Securities and Exchange Commission (‘SEC’) filed securities fraud charges against Madoff and his firm Bernard L Madoff Investment Securities LLC (‘Madoff Securities’), a broker dealer and investment advisor registered with the SEC. The criminal complaint and SEC complaint each alleged that Madoff had informed senior Madoff Securities employees, in substance, that his investment advisory business was a fraud. On 15 December 2008, on the application of the Securities Investor Protection Corporation, the United States District Court for the Southern District of New York appointed a trustee for the liquidation of the business of Madoff Securities, and removed the liquidation proceeding to the United States Bankruptcy Court for the Southern District of New York. On 9 February 2009, on Madoff’s consent, the United States District Court for the Southern District of New York entered a partial judgement in the SEC action, permanently enjoining Madoff from violating certain antifraud provisions of the US securities laws, ordering Madoff to pay disgorgement, prejudgement interest and a civil penalty in amounts to be determined at a later time, and continuing certain other relief previously imposed, including a freeze on Madoff’s assets. The relevant US authorities are continuing their investigations into the alleged fraud. There remains significant uncertainty as to the facts of the alleged fraud and the extent of any assets of, and remaining within, Madoff Securities.
Various non-US HSBC group companies provide custodial, administration and similar services to a number of funds incorporated outside the United States of America whose assets were invested with Madoff Securities. Based on information provided by Madoff Securities, as at 30 November 2008, the aggregate net asset value of these funds (which would include principal amounts invested and unrealised gains) was US$8.4 billion.
Proceedings concerning Madoff and Madoff Securities have already been issued in various jurisdictions against numerous defendants and HSBC expects further proceedings to be brought, including by the Madoff Securities trustee. Various HSBC group companies have been named as defendants in suits in the United States anticipated to seek class action status and cases in the Commercial List of the Irish courts. All of the cases where HSBC group companies are named as a defendant are at a very early stage. HSBC considers that it has good defences to these claims and will continue to defend them vigorously. HSBC is unable reliably to estimate the liability, if any, that might arise as a result of such claims.
Various HSBC group companies have also received requests for information from various regulatory authorities in connection with the alleged fraud by Madoff. HSBC group companies are co-operating with these requests for information.
These actions apart HSBC is party to legal actions in a number of jurisdictions including the UK, Hong Kong and the US arising out of its normal business operation. HSBC considers that none of the actions is material, and none is expected to result in a significant adverse effect on the financial position of HSBC, either individually or in the aggregate. Management believes that adequate provisions have been made in respect of the litigation arising out of its normal business operations. HSBC has not disclosed any contingent liability associated with these legal actions because it is not practical to do so.
43 Related party transactions
Related parties of the Group and HSBC Holdings include subsidiaries, associates, joint ventures and post-employment benefit plans for HSBC employees, Key Management Personnel, close family members of Key Management Personnel and entities which are controlled, jointly controlled or significantly influenced, or for which significant voting power is held, by Key Management Personnel or their close family members.
Key Management Personnel are defined as those persons having authority and responsibility for planning, directing and controlling the activities of HSBC Holdings, being the Directors and Group Managing Directors of HSBC Holdings.

445
Compensation of Directors and other Key Management Personnel
HSBC 2008 2007 2006 US$m US$m U$m
Short-term employee benefits ............................................................................ 31 62 76 Post-employment benefits ................................................................................. 5 4 3 Termination benefits .......................................................................................... – 9 – Share-based payments ....................................................................................... 16 40 61
52 115 140
Transactions, arrangements and agreements involving related parties
Particulars of transactions, arrangements and agreements entered into by subsidiaries of HSBC Holdings with Directors, disclosed pursuant to section 232 of the Companies Act 1985, are shown below:
2008 2007
Number of persons
Balance at 31 December
Number of persons1
Balance at 31 December1
US$000 US$000 Directors ...................................................................... 19 14 Loans ............................................................................. 1,758 649 Credit cards ................................................................... 293 204 Guarantees .................................................................... – –
1 Comparative figures have been restated to show Directors, excluding their connected persons following a change to section 232 and Part 2 of Schedule 6 of the Companies Act.
Particulars of transactions with related parties, disclosed pursuant to the requirements of IAS 24, are shown below. The disclosure of the year-end balance and the highest amounts outstanding during the year in the table below is considered to be the most meaningful information to represent the amount of the transactions and the amount of outstanding balances during the year.
2008 2007
Balance at 31 December
Highest amounts outstanding during year
Balance at 31 December
Highest amounts outstanding during year
US$000 US$000 US$000 US$000 Key Management Personnel and their related parties Loans ............................................................................. 216,983 474,115 325,648 804,845 Credit cards ................................................................... 400 933 323 1,077 Guarantees .................................................................... 25,249 42,178 27,044 30,317
Some of the transactions were connected transactions, as defined by the Rules Governing The Listing of Securities on The Stock Exchange of Hong Kong Limited but were exempt from any disclosure requirements under the provisions of those Rules.
The above transactions were made in the ordinary course of business and on substantially the same terms, including interest rates and security, as for comparable transactions with persons of a similar standing or, where applicable, with other employees. The transactions did not involve more than the normal risk of repayment or present other unfavourable features.
Shareholdings, options and other securities of Directors and other Key Management Personnel
At 31 December
2008 (000s)
2007 (000s)
Number of options held over HSBC Holdings ordinary shares made under employee share plans ..................................................................................................................................... 943 36
Number of HSBC Holdings ordinary shares held beneficially and non-beneficially ....................... 16,733 12,358 Number of HSBC Holdings preference shares held beneficially and non-beneficially ................... 8 8 Number of HSBC Holdings 8.125% Perpetual Subordinated Capital Securities held
beneficially and non-beneficially .................................................................................................. 21 –
17,705 12,402

H S B C H O L D I N G S P L C
Notes on the Financial Statements (continued)
Notes 43 and 44
446
Transactions with other related parties of HSBC
Associates and joint ventures
The Group provides certain banking and financial services to associates and joint ventures, including loans, overdrafts, interest and non-interest bearing deposits and current accounts. Details of the interests in associates and joint ventures are given in Note 21. Transactions and balances during the year with associates and joint ventures were as follows:
2008 2007
Highest balance during the year1
Balance at 31 December1
Highest balance during the year1
Balance at 31 December1
US$m US$m US$m US$m Amounts due from joint ventures:
– unsubordinated ...................................................... 424 343 632 603 Amounts due from associates:
– subordinated .......................................................... 59 59 15 15 – unsubordinated ...................................................... 1,060 280 7,310 823
1,543 682 7,957 1,441
Amounts due to joint ventures ...................................... 66 64 71 27 Amounts due to associates ............................................ 735 293 5,243 327
801 357 5,314 354
1 The disclosure of the year-end balance and the highest balance during the year is considered the most meaningful information to represent transactions during the year.
The above outstanding balances arose from the ordinary course of business and on substantially the same terms, including interest rates and security, as for comparable transactions with third-party counterparties.
Post-employment benefit plans
At 31 December 2008, US$3.5 billion (2007: US$4.1 billion) of HSBC post-employment benefit plan assets were under management by HSBC companies. Fees of US$26 million (2007: US$42 million) were earned by HSBC companies for these management services provided to its post-employment benefit plans. HSBC’s post-employment benefit plans had placed deposits of US$430 million (2007: US$506 million) with its banking subsidiaries, on which interest payable to the schemes amounted to US$55 million (2007: US$40 million). The above outstanding balances arose from the ordinary course of business and on substantially the same terms, including interest rates and security, as for comparable transactions with third-party counterparties.
HSBC Bank (UK) Pension Scheme entered into swap transactions with HSBC as part of the management of the inflation and interest rate sensitivity of its liabilities. At 31 December 2008, the gross notional value of the swaps was US$17.7 billion (2007: US$21.2 billion), the swaps had a positive fair value of US$1.8 billion (2007: positive fair value of US$248 million) to the scheme and HSBC had delivered collateral of US$2.4 billion (2007: US$759 million) to the scheme in respect of these swaps, on which HSBC earned interest amounting to US$59 million (2007: US$15 million). All swaps were executed at prevailing market rates and within standard market bid/offer spreads.
In order to satisfy diversification requirements, there are special collateral provisions for the swap transactions between HSBC and the scheme. The collateral agreement stipulates that the scheme never posts collateral to HSBC. Collateral is posted to the scheme by HSBC at an amount that provides the Trustee with a high level of confidence that would be sufficient to replace the swaps in the event of default by HSBC Bank plc. With the exception of the special collateral arrangements detailed above, all other aspects of the swap transactions between HSBC and the scheme are on substantially the same terms as comparable transactions with third-party counterparties.
HSBC International Staff Retirements Benefits Scheme entered into swap transactions with HSBC to manage the inflation and interest rate sensitivity of the liabilities and selected assets. At 31 December 2008, the gross notional value of the swaps was US$1.5 billion (2007: US$1.7 billion), and the swaps had a net positive fair value of US$388 million to the scheme (2007: US$63 million).

447
HSBC Holdings
Details of HSBC Holdings’ principal subsidiaries are shown in Note 24. Transactions and balances during the year with subsidiaries were as follows:
2008 2007
Highest balance during the year1
Balance at 31 December1
Highest balance during the year1
Balance at 31 December1
Subsidiaries US$m US$m US$m US$m Assets Cash at bank .................................................................. 443 443 729 360 Derivatives .................................................................... 3,682 3,682 2,660 2,660 Loans and advances ...................................................... 17,242 11,804 17,242 17,242 Financial investments ................................................... 2,844 2,629 3,389 2,676 Investments in subsidiaries ........................................... 86,233 81,993 69,411 69,411
Total related party assets .............................................. 110,444 100,551 93,431 92,349
Liabilities Amounts owed to HSBC undertakings ........................ 4,042 4,042 3,191 2,969 Derivatives .................................................................... 1,324 1,324 290 44 Subordinated liabilities:
– cost ......................................................................... 4,168 3,795 4,109 4,109 – fair value ................................................................ 4,186 3,067 4,231 4,187
Total related party liabilities ......................................... 13,720 12,228 11,821 11,309
Guarantees .................................................................... 56,733 47,341 38,457 38,457 Commitments ................................................................ 3,638 3,241 3,985 3,638
1 The disclosure of the year-end balance and the highest balance during the year is considered the most meaningful information to represent transactions during the year. The above outstanding balances arose in the ordinary course of business and are on substantially the same terms, including interest rates and security, as for comparable transactions with third-party counterparties, with the exception of US$476 million (2007: US$654 million) in respect of loans from HSBC subsidiaries to HSBC Holdings made at an agreed zero per cent interest rate.
Some employees of HSBC Holdings are members of the HSBC Bank (UK) Pension Scheme, which is sponsored by a separate Group company. HSBC Holdings incurs a charge for these employees equal to the contributions paid into the scheme on their behalf. Disclosure in relation to the scheme is made in Note 8 to the accounts.
44 Events after the balance sheet date
A fourth interim dividend for 2008 of US$0.10 per ordinary share (US$1,214 million) (2007: US$0.39 per ordinary share, US$4,628 million) was declared by the Directors after 31 December 2008.
In late February 2009, it was decided to discontinue all originations by the branch-based consumer lending business of HSBC Finance. HSBC Finance will continue to service and collect the existing portfolio as it runs off. Closure costs of approximately US$265 million are expected to be incurred, mainly relating to one-off termination and other employee benefit costs, and charges for impairment of fixed assets associated with the consumer lending branch network, a substantial portion of which will be recorded in the first half of 2009.
On 2 March 2009, HSBC Holdings plc announced its proposal to raise £12.5 billion (US$17.7 billion) (net of expenses) by way of a fully underwritten rights issue of 5,060 million new ordinary shares at a price of 254 pence per share on the basis of 5 new ordinary shares for every 12 existing ordinary shares. The proposal is subject to authorisation by the shareholders at a general meeting on 19 March 2009.
These accounts were approved by the Board of Directors on 2 March 2009 and authorised for issue.

H S B C H O L D I N G S P L C
Shareholder Information Enforceability of judgements / Exchange controls / Dividends / Nature of trading market
448
PageInformation about the enforceability of
judgements made in the US ........................ 448Exchange controls and other limitations
affecting equity security holders ................ 448Fourth interim dividend for 2008 ................... 448Interim dividends for 2009 ............................. 449Dividends on the ordinary shares of HSBC
Holdings ..................................................... 449Nature of trading market ................................ 449Shareholder profile ........................................ 451Memorandum and Articles of Association .... 451Annual General Meeting ................................ 452Interim Management Statements and
Interim results ............................................. 452Actuaries ........................................................ 452Shareholder enquiries and communications ... 453Investor relations ............................................ 454Where more information about HSBC is
available ..................................................... 454Taxation of shares and dividends ................... 455History and development of HSBC ............... 457Organisational structure ................................. 459
Information about the enforceability of judgements made in the US
HSBC Holdings is a public limited company incorporated in England and Wales. Most of HSBC Holdings’ Directors and executive officers live outside the US. As a result, it may not be possible to serve process on such persons or HSBC Holdings in
the US or to enforce judgements obtained in US courts against them or HSBC Holdings based on civil liability provisions of the securities laws of the US. There is doubt as to whether English courts would enforce:
• certain civil liabilities under US securities laws in original actions; or
• judgements of US courts based upon these civil liability provisions.
In addition, awards of punitive damages in actions brought in the US or elsewhere may be unenforceable in the UK. The enforceability of any judgement in the UK will depend on the particular facts of the case as well as the laws and treaties in effect at the time.
Exchange controls and other limitations affecting equity security holders
There are currently no UK laws, decrees or regulations which would prevent the import or export of capital or remittance of distributable profits by way of dividends and other payments to holders of HSBC Holdings’ equity securities who are not residents of the UK. There are also no restrictions under the laws of the UK or the terms of the Memorandum and Articles of Association of HSBC Holdings concerning the right of non-resident or foreign owners to hold HSBC Holdings’ equity securities or, when entitled to vote, to do so.
Fourth interim dividend for 2008
The Directors have declared a fourth interim dividend for 2008 of US$0.10 per ordinary share. Information on the scrip dividend scheme and currencies in which shareholders may elect to have the cash dividend paid will be sent to shareholders on or about 31 March 2009. The timetable for the dividend is:
2009
Shares quoted ex-dividend in London, Hong Kong, Paris and Bermuda .............................................................................. 18 March ADSs quoted ex-dividend in New York ................................................................................................................................ 18 MarchRecord date for dividend and closure of Hong Kong Overseas Branch Register of shareholders for one day ................... 20 MarchMailing of Annual Report and Accounts 2008 and/or Annual Review 2008, Notice of Annual General Meeting and
dividend documentation .................................................................................................................................................... 31 March Final date for receipt by registrars of forms of election, Investor Centre electronic instructions and revocations of
standing instructions for scrip dividends .......................................................................................................................... 23 April Exchange rate determined for payment of dividends in sterling and Hong Kong dollars .................................................... 27 April Payment date: dividend warrants, new share certificates or transaction advices and notional tax vouchers mailed and
shares credited to stock accounts in CREST ..................................................................................................................... 6 May

449
Interim dividends for 2009
The Board has adopted a policy of paying quarterly interim dividends on the ordinary shares. Under this policy it is intended to have a pattern of three equal interim dividends with a variable fourth interim dividend. It is envisaged that the first interim dividend in respect of 2009 will be US$0.08 per ordinary share. The proposed timetables for the dividends in respect of 2009 are:
Interim dividends for 2009 First Second Third Fourth
Announcement .......................................................... 5 May 2009 3 August 2009 2 November 2009 1 March 2010 ADSs quoted ex-dividend in New York .................. 20 May 2009 19 August 2009 18 November 2009 17 March 2010 Shares quoted ex-dividend in London,
Hong Kong, Paris and Bermuda .......................... 20 May 2009 19 August 2009 18 November 2009 17 March 2010 Record date in Hong Kong ....................................... 22 May 2009 21 August 2009 19 November 2009 18 March 2010 Record date in London, Paris and Bermuda ............. 22 May 2009 21 August 2009 20 November 20091 19 March 20101
Closure of the Overseas Branch Register of shareholders in Hong Kong for one day .............. 22 May 2009 21 August 2009
Payment date ............................................................. 8 July 2009 7 October 2009 13 January 2010 5 May 2010
1 Removals to and from the Overseas Branch Register of shareholders in Hong Kong will not be permitted on these dates.
Dividends on the ordinary shares of HSBC Holdings
HSBC Holdings has paid dividends on its ordinary shares every year without interruption since it became the HSBC Group holding company by a scheme of arrangement in 1991. The dividends declared, per ordinary share, for each of the last five years were:
First interim
Second interim
Third interim
Fourth interim1 Total2
2008 US$ ....................................... 0.180 0.180 0.180 0.100 0.640 £ ............................................ 0.090 0.100 0.124 0.069 0.383 HK$ ...................................... 1.403 1.398 1.395 0.775 4.971
2007 US$ ....................................... 0.170 0.170 0.170 0.390 0.900 £ ............................................ 0.085 0.084 0.086 0.194 0.449 HK$ ....................................... 1.328 1.322 1.325 3.041 7.016
2006 US$ ....................................... 0.150 0.150 0.150 0.360 0.810 £ ............................................ 0.082 0.079 0.078 0.183 0.422 HK$ ....................................... 1.164 1.167 1.168 2.799 6.298
2005 US$ ....................................... 0.140 0.140 0.140 0.310 0.730 £ ............................................ 0.077 0.079 0.079 0.169 0.404 HK$ ....................................... 1.088 1.086 1.085 2.403 5.662
2004 US$ ....................................... 0.130 0.130 0.130 0.270 0.660 £ ............................................ 0.071 0.072 0.069 0.141 0.353 HK$ ....................................... 1.013 1.014 1.013 2.104 5.144
1 The fourth interim dividend for 2008 of US$0.10 per share has been translated into pounds sterling and Hong Kong dollars at the closing rate on 31 December 2008. The dividend will be paid on 6 May 2009.
2 The above dividends declared are accounted for as disclosed in Note 12 on the Financial Statements.
Dividends are declared in US dollars and, at the election of the shareholder, paid in cash in one of, or in a combination of, US dollars, sterling and Hong Kong dollars, or, subject to the Board’s determination that a scrip dividend is to be offered in respect of that dividend, may be satisfied in whole or in part by the issue of new shares in lieu of a cash dividend.
Nature of trading market
HSBC Holdings ordinary shares are listed or admitted to trading on the London Stock Exchange, the Hong Kong Stock Exchange (‘HKSE’), Euronext Paris, the New York Stock Exchange (‘NYSE’) and the Bermuda Stock Exchange. HSBC Holdings maintains its principal share register in England and overseas branch share registers in Hong Kong and Bermuda (collectively, the ‘share register’).
As at 31 December 2008, there were a total of 217,633 holders of record of HSBC Holdings ordinary shares.

H S B C H O L D I N G S P L C
Shareholder Information (continued) Nature of trading market / Shareholder profile / Memorandum and Articles
450
As at 31 December 2008, a total of 14,601,549 of the HSBC Holdings ordinary shares were registered in the HSBC Holdings’ share register in the name of 13,196 holders of record with addresses in the US. These shares represented 0.12 per cent of the total HSBC Holdings ordinary shares in issue.
As at 31 December 2008, there were 10,041 holders of record of ADSs holding approximately 114 million ADSs, representing approximately 569 million HSBC Holdings ordinary shares. 9,845 of these holders had addresses in the US, holding approximately 113.7 million ADSs, representing 568.6 million HSBC Holdings ordinary shares. As at 31 December 2008, approximately 4.7 per cent of the HSBC Holdings ordinary shares were represented by ADSs held by holders of record with addresses in the US.
The following table shows, for the years, calendar quarters and months indicated, the highest and lowest prices for the HSBC Holdings ordinary shares and ADSs. These are based on mid-market prices at close of business on the London Stock Exchange, HKSE, Euronext Paris, NYSE and the Bermuda Stock Exchange.
Past share price performance should not be regarded as a guide to future performance.
High and low mid-market closing prices
London Hong Kong New York Paris Bermuda US$0.50 shares US$0.50 shares ADSs1 US$0.50 shares US$0.50 shares
High Low High Low High Low High Low High Low pence pence HK$ HK$ US$ US$ euro euro US$ US$
2008 ...................... 928 612 136.3 73.3 87.7 45.6 11.9 6.4 17.7 9.0 2007 ...................... 964 803 152.8 129.6 99.5 82.5 14.4 11.2 19.6 16.5 2006 ...................... 1028 914 151.2 124.5 98.4 80.5 15.4 13.3 19.6 16.4 2005 ...................... 950 825 133.5 120.1 85.8 77.5 13.9 12.0 17.1 15.7 2004 ...................... 954 784 136.5 109.5 87.8 70.0 13.6 11.8 17.3 14.5 2008 4th Quarter ............. 928 612 123.6 73.3 82.5 45.6 11.9 6.4 16.0 9.0 3rd Quarter ............. 920 716 129.6 112.8 84.0 71.9 11.8 9.0 16.6 14.3 2nd Quarter ............. 897 776 136.3 120.9 87.7 76.6 11.4 9.8 17.7 15.8 1st Quarter .............. 842 712 131.7 104.4 83.7 69.9 11.4 9.5 16.8 14.1 2007 4th Quarter ............. 964 803 152.8 129.6 99.5 82.5 13.9 11.2 19.6 16.5 3rd Quarter ............. 917 861 145.8 135.8 93.8 87.2 13.7 12.8 18.8 17.1 2nd Quarter ............. 955 886 147.1 136.3 95.2 88.0 14.0 13.2 18.7 17.7 1st Quarter .............. 953 880 145.4 133.0 93.1 85.8 14.4 12.8 18.8 17.2 2009 January .................. 682 485 77.5 55.0 49.6 33.8 7.3 5.2 9.9 7.0 2008 December .............. 763 612 87.7 73.3 56.7 45.6 8.7 6.4 10.5 9.0 November .............. 790 626 95.0 74.8 63.0 45.8 9.7 7.2 12.1 9.6 October .................. 928 663 123.6 75.0 82.5 52.0 11.9 8.4 16.0 11.4 September ............. 920 796 126.0 114.9 81.8 72.9 11.8 10.1 16.1 14.8 August ................... 869 806 129.4 117.8 84.0 76.2 11.0 10.2 16.3 15.2 July ........................ 847 716 129.6 112.8 84.0 71.9 10.8 9.0 16.6 14.3
1 In New York each ADS represents 5 underlying ordinary shares.
Stock symbols
HSBC Holdings ordinary shares trade under the following stock symbols:
London Stock Exchange HSBA Hong Kong Stock Exchange 5 New York Stock Exchange (ADS) HBC Euronext Paris HSB Bermuda Stock Exchange HSBC

451
Shareholder profile
At 31 December 2008 the register of members recorded the following details:
Ordinary shares held Number of shareholders
Total shares held
1-100 .................................................................................................................................................. 34,307 1,096,309 101-400 .............................................................................................................................................. 36,669 9,352,754 401-500 .............................................................................................................................................. 10,430 4,718,343 501-1,000 ........................................................................................................................................... 33,322 25,102,571 1,001-5,000 ........................................................................................................................................ 68,515 158,400,107 5,001-10,000 ...................................................................................................................................... 16,039 113,367,551 10,001-20,000 .................................................................................................................................... 8,723 121,509,773 20,001-50,000 .................................................................................................................................... 5,319 163,350,441 50,001-200,000 .................................................................................................................................. 2,659 250,022,876 200,001-500,000 ................................................................................................................................ 679 214,879,617 500,001 and above ............................................................................................................................. 971 11,043,464,740
Total ................................................................................................................................................... 217,633 12,105,265,082
Memorandum and Articles of Association
The disclosure under the caption ‘Memorandum and Articles of Association’ contained in HSBC Holdings’ Annual Reports on Form 20-F for the years ended 31 December 2000 and 2001 is incorporated by reference herein, together with the disclosure below.
Interested directors
Subject to the provisions of the Companies Act 2006 and provided that the Articles are complied with, a Director, notwithstanding his office:
• may enter into or otherwise be interested in any contract, arrangement, transaction or proposal with HSBC Holdings or in which HSBC Holdings is otherwise interested;
• may hold any other office or place of profit under HSBC Holdings (except that of auditor or auditor of a subsidiary of HSBC Holdings) in conjunction with the office of Director and may act by himself or through his firm in a professional capacity for HSBC Holdings, and in any such case on such terms as to remuneration and otherwise as the Board may arrange;
• may be a director or other officer, or employed by, or a party to any transaction or arrangement with or otherwise interested in, any company promoted by HSBC Holdings or in which HSBC Holdings is otherwise interested or as regards which HSBC Holdings has any powers of appointment; and
• shall not be liable to account to HSBC Holdings for any profit, remuneration or other benefit realised by any such office, employment, contract, arrangement, transaction or proposal or from any interest in any body corporate and no such contract, arrangement, transaction, proposal or interest shall be avoided on the grounds of any such interest or benefit nor shall the receipt of any such profit, remuneration or any other benefit constitute a breach of his duty under the Companies Act 2006 not to accept benefits from third parties.
Since 1 October 2008, the Board may authorise any matter proposed to it which would, if not so authorised, involve a breach by a Director of his duty to avoid conflicts of interest under the Companies Act 2006, including, without limitation, any matter which relates to a situation in which a Director has, or can have, an interest which conflicts, or possibly may conflict, with the interest of HSBC Holdings (including the exploitation of any property, information or opportunity, whether or not HSBC Holdings could take advantage of it, but excluding any situation which cannot reasonably be regarded as likely to give rise to a conflict of interest). Any such authorisation will be effective only if:
• any requirement as to quorum at the meeting at which the matter is considered is met without counting the Director in question or any other interested Director; and
• the matter was agreed to without their voting or would have been agreed to if their votes had not been counted.

H S B C H O L D I N G S P L C
Shareholder Information (continued) Annual General Meeting / Interim Management Statements / Actuaries / Enquiries
452
The Board may (whether at the time of the giving of the authorisation or subsequently) make any such authorisation subject to any limits or conditions it expressly imposes but such authorisation is otherwise given to the fullest extent permitted. The Board may vary or terminate any such authorisation at any time.
A Director shall be under no duty to HSBC Holdings with respect to any information which he obtains or has obtained otherwise than as a Director of HSBC Holdings and in respect of which he has a duty of confidentiality to another person.
Annual General Meeting
The 2009 Annual General Meeting will be held at the Barbican Hall, Barbican Centre, London EC2 on Friday 22 May 2009 at 11 am.
An informal meeting of shareholders will be held at Level 28, 1 Queen’s Road Central, Hong Kong on Tuesday, 19 May 2009 at 4.30 pm.
All resolutions considered at the 2008 Annual General Meeting were passed on a poll as follows:
Total votes Resolution For1 Against Vote withheld2
1 To receive the Report and Accounts for 2007 ........................................... 4,378,043,313 10,278,857 2,300,035 2 To approve the Directors’ Remuneration Report for 2007 ....................... 3,564,669,072 467,114,424 328,531,356 3 To re-elect the following as Directors: (a) S A Catz ............................................................................................. 4,375,443,604 15,493,924 4,853,194 (b) V H C Cheng ..................................................................................... 4,374,705,038 16,651,751 4,560,793 (c) J D Coombe ....................................................................................... 4,349,432,760 41,839,567 4,614,758 (d) J L Durán ............................................................................................ 4,375,677,125 15,302,707 4,915,245 (e) D J Flint ............................................................................................. 4,374,609,502 16,771,975 4,536,647 (f) A A Flockhart .................................................................................... 4,373,920,231 17,415,825 4,580,796 (g) W K L Fung ....................................................................................... 4,259,101,744 76,102,878 60,005,424 (h) S T Gulliver ....................................................................................... 4,372,071,648 17,464,424 6,374,625 (i) J W J Hughes-Hallett ......................................................................... 4,372,359,698 18,870,339 4,659,213 (j) W S H Laidlaw .................................................................................. 4,375,327,024 15,801,272 4,735,846 (k) N R N Murthy .................................................................................... 4,375,645,536 15,587,234 4,671,202 (l) S W Newton ...................................................................................... 4,374,735,344 16,524,200 4,612,269 4 To reappoint the Auditor at remuneration to be determined by the
Group Audit Committee ........................................................................ 4,304,372,153 12,720,218 72,285,220 5 To authorise the Directors to allot shares .................................................. 4,356,107,796 29,620,845 4,880,817 6 To disapply pre-emption rights (Special Resolution) ................................ 4,332,361,701 47,782,336 10,450,441 7 To authorise the Company to purchase its own Ordinary Shares ............. 4,305,412,056 12,665,996 71,358,559 8 To alter the Articles of Association (Special Resolution) ......................... 4,327,487,122 53,604,562 9,091,619 9 To alter the Articles of Association with effect from 1 October 2008
(Special Resolution) .............................................................................. 4,360,324,406 21,054,665 8,805,451 10 To amend the rules of the HSBC Share Plan ............................................. 3,684,549,040 399,610,155 290,185,238
1 Includes discretionary votes. 2 A ‘Vote withheld’ is not a ‘vote’ in law and is not counted in the calculation of the votes ‘For’ and ‘Against’ the resolution.
Interim Management Statements and Interim results
Interim Management Statements are expected to be issued on 8 May 2009 and 5 November 2009 respectively. The interim results for the six months to 30 June 2009 are expected to be issued on 3 August 2009.
Actuaries
Actuaries preparing the latest valuations for the main retirement benefit schemes are:
HSBC Bank (UK) Pension Scheme: C G Singer, Fellow of the Institute of Actuaries, of Watson Wyatt Limited;
HSBC Group Hong Kong Local Staff Retirement Benefit Scheme: Estella Chiu, Fellow of the Society of Actuaries of the United States of America, of HSBC Insurance (Asia) Limited, a subsidiary of HSBC Holdings; and
HSBC North America (US) Retirement Income Plan: Jennifer Jakubowski, Fellow of the Society of Actuaries, Enrolled Actuary and member of the American Academy of Actuaries, and Emily Carlson, Associate of the Society of Actuaries.
Disclosures relating to the latest valuations are included in Note 8 on the Financial Statements.

453
Shareholder enquiries and communications
Enquiries
Any enquiries relating to your shareholding, for example transfers of shares, change of name or address, lost share certificates or dividend cheques, should be sent to the Registrars:
Principal Register Hong Kong Overseas Branch Register: Bermuda Overseas Branch Register:
Computershare Investor Services PLC PO Box 1064 The Pavilions Bridgwater Road Bristol BS99 3FA United Kingdom Telephone: 44 (0) 870 702 0137 Email: [email protected]
Computershare Hong Kong Investor Services Limited Hopewell Centre Rooms 1806-1807 18th Floor 183 Queen’s Road East Hong Kong Telephone: 852 2862 8555 Email: [email protected]
Corporate Shareholder Services The Bank of Bermuda Limited 6 Front Street Hamilton HM 11 Bermuda Telephone: 1 441 299 6737 Email: bob.bda.shareholder.services@
bob.hsbc.com Investor Centre: www.computershare.com/investor/uk
Investor Centre: www.computershare.com/hk/investors
Investor Centre: www.computershare.com/investor/bm
Any enquiries relating to ADSs should be sent to the depositary:
BNY Mellon Shareowner Services PO Box 358516 Pittsburgh, PA 15252-8516 USA Telephone (US): 1 887 283 5786 Telephone (International): 1 201 680 6825 Email: [email protected] Website: www.bnymellon.com/shareowner
Any enquiries relating to shares held through Euroclear France, the settlement and central depositary system for Euronext Paris, should be sent to the paying agent:
HSBC France 103, avenue des Champs Elysées 75419 Paris Cedex 08 France Telephone: 33 1 40 70 22 56
If you have been nominated to receive general shareholder communications directly from HSBC Holdings it is important to remember that your main contact in terms of your investment remains as it was (so the registered shareholder, or perhaps custodian or broker, who administers the investment on your behalf). Therefore any changes or queries relating to your personal details and holding (including any administration thereof) must continue to be directed to your existing contact at your investment manager or custodian. HSBC Holdings cannot guarantee dealing with matters directed to it in error.
Further copies of this Annual Report and Accounts 2008 may be obtained by writing to the following departments:
For those in Europe, the Middle East and Africa:
For those in Asia-Pacific: For those in the Americas:
Group Communications HSBC Holdings plc 8 Canada Square London E14 5HQ UK
Group Public Affairs The Hongkong and Shanghai Banking
Corporation Limited 1 Queen’s Road Central Hong Kong
Internal Communications HSBC–North America 26525 N Riverwoods Boulevard Mettawa Illinois 60045 USA

H S B C H O L D I N G S P L C
Shareholder Information (continued) Enquiries / Investor relations / Where information is available / Taxation of shares and dividends
454
Electronic communications
Shareholders may at any time choose to receive corporate communications in printed form or to receive a notification of its availability on HSBC’s website. To receive future notifications of the availability of a corporate communication on HSBC’s website by email, or revoke or amend an instruction to receive such notifications by email, go to www.hsbc.com/ecomms. If you provide an email address to receive electronic communications from HSBC we will also send notifications of your dividend entitlements by email. If you received a notification of the availability of this document on HSBC’s website and would like to receive a printed copy of it, or if you would like to receive future corporate communications in printed form, please write or send an email to the appropriate Registrars at the address given above. Printed copies will be provided without charge.
Chinese translation
A Chinese translation of this Annual Report and Accounts 2008 is available upon request after 31 March 2009 from the Registrars:
Computershare Hong Kong Investor Services Limited Hopewell Centre, Rooms 1806-07, 18th Floor 183 Queen’s Road East Hong Kong
Computershare Investor Services PLC PO Box 1064, The Pavilions Bridgwater Road Bristol BS99 3FA UK
Please also contact the Registrars if you wish to receive Chinese translations of future documents or if you have received a Chinese translation of this document and do not wish to receive such translations in future. 本年報及賬目備有中譯本,各界人士可向股份登記處索取(地址見上文)。
閣下如欲於日後收取相關文件的中譯本,或已收到本文件的中譯本但不希望繼續收取有關譯本,均請聯絡股
份登記處 Investor relations
Enquiries relating to HSBC’s strategy or operations may be directed to:
Manager Investor Relations HSBC Holdings plc 8 Canada Square London E14 5HQ UK
Investor Relations Officer HSBC North America Holdings Inc. 26525 N. Riverwoods Boulevard Mettawa, Illinois 60045 USA
Head of Investor Relations (Asia) The Hongkong and Shanghai Banking Corporation Limited 1 Queen’s Road Central Hong Kong
Telephone: 44 (0)20 7991 8041 1 224 544 4400 852 2822 4929 Facsimile: 44 (0)20 7991 4663 1 224 552 4400 852 2845 0113 Email: [email protected] [email protected] [email protected]
Where more information about HSBC is available
This Annual Report and Accounts 2008, and other information on HSBC, may be viewed on HSBC’s website: www.hsbc.com.
Reports, statements or information that HSBC Holdings files with the Securities and Exchange Commission are available at www.sec.gov. Investors can also request hard copies of these documents
upon payment of a duplicating fee, by writing to the SEC at the Office of Investor Education and Advocacy, 100 F Street N.E. Washington, DC 20549-0123 or by emailing [email protected]. Investors should call the Commission at (202) 551 8090 if they require further assistance. Investors may also obtain the reports and other information that HSBC Holdings files at the offices of the New York Stock Exchange, Inc., 11 Wall Street, New York, NY 10005.