
HSBC Finance Corporation
97
UNITED STATES SECURITIES AND EXCHANGE COMMISSION Washington, D.C. 20549 FORM 10-Q (Mark One) ¥ QUARTERLY REPORT PURSUANT TO SECTION 13 OR 15(d) OF THE SECURITIES EXCHANGE ACT OF 1934 For the quarterly period ended September 30, 2008 OR n TRANSITION REPORT PURSUANT TO SECTION 13 OR 15(d) OF THE SECURITIES EXCHANGE ACT OF 1934 For the transition period from to Commission file number 1-8198 HSBC FINANCE CORPORATION (Exact name of registrant as specified in its charter) Delaware (State of Incorporation) 86-1052062 (I.R.S. Employer Identification No.) 26525 North Riverwoods Boulevard, Mettawa, Illinois (Address of principal executive offices) 60045 (Zip Code) (224) 544-2000 Registrant’s telephone number, including area code Indicate by check mark whether the registrant (1) has filed all reports required to be filed by Section 13 or 15(d) of the Securities Exchange Act of 1934 during the preceding 12 months (or for such shorter period that the registrant was required to file such reports), and (2) has been subject to such filing requirements for the past 90 days. Yes ¥ No n Indicate by check mark whether the registrant is a large accelerated filer, an accelerated filer, a non-accelerated filer, or a smaller reporting company. See the definitions of “large accelerated filer,” “accelerated filer” and “smaller reporting company” in Rule 12b-2 of the Exchange Act. (Check one): Large accelerated filer n Accelerated filer n Non-accelerated filer ¥ Smaller reporting company n (Do not check if a smaller reporting company) Indicate by check mark whether the registrant is a shell company (as defined in Rule 12b-2 of the Exchange Act). Yes n No ¥ As of October 31, 2008, there were 60 shares of the registrant’s common stock outstanding, all of which are owned by HSBC Investments (North America) Inc.
-
Upload
quarterlyearningsreports2 -
Category
Documents
-
view
124 -
download
2
Transcript of HSBC Finance Corporation

UNITED STATES SECURITIES ANDEXCHANGE COMMISSION
Washington, D.C. 20549
FORM 10-Q
(Mark One)
¥ QUARTERLY REPORT PURSUANT TO SECTION 13 OR 15(d)OF THE SECURITIES EXCHANGE ACT OF 1934
For the quarterly period ended September 30, 2008OR
n TRANSITION REPORT PURSUANT TO SECTION 13 OR 15(d)OF THE SECURITIES EXCHANGE ACT OF 1934
For the transition period from to
Commission file number 1-8198
HSBC FINANCE CORPORATION(Exact name of registrant as specified in its charter)
Delaware(State of Incorporation)
86-1052062(I.R.S. Employer Identification No.)
26525 North Riverwoods Boulevard, Mettawa, Illinois(Address of principal executive offices)
60045(Zip Code)
(224) 544-2000Registrant’s telephone number, including area code
Indicate by check mark whether the registrant (1) has filed all reports required to be filed by Section 13 or 15(d) of the SecuritiesExchange Act of 1934 during the preceding 12 months (or for such shorter period that the registrant was required to file such reports), and(2) has been subject to such filing requirements for the past 90 days. Yes ¥ No n
Indicate by check mark whether the registrant is a large accelerated filer, an accelerated filer, a non-accelerated filer, or a smallerreporting company. See the definitions of “large accelerated filer,” “accelerated filer” and “smaller reporting company” in Rule 12b-2 ofthe Exchange Act. (Check one):
Large accelerated filer n Accelerated filer n Non-accelerated filer ¥ Smaller reporting company n
(Do not check if a smaller reporting company)
Indicate by check mark whether the registrant is a shell company (as defined in Rule 12b-2 of the ExchangeAct). Yes n No ¥
As of October 31, 2008, there were 60 shares of the registrant’s common stock outstanding, all of which are owned by HSBCInvestments (North America) Inc.
HSBC FINANCE CORPORATION
FORM 10-Q
TABLE OF CONTENTS
Part I. FINANCIAL INFORMATIONItem 1. Financial Statements
Consolidated Statement of Income (Loss) . . . . . . . . . . . . . . . . . . . . . . . . . . . . . . . . . . . . . . . . 3Consolidated Balance Sheet . . . . . . . . . . . . . . . . . . . . . . . . . . . . . . . . . . . . . . . . . . . . . . . . . . 4
Consolidated Statement of Changes in Shareholders’ Equity . . . . . . . . . . . . . . . . . . . . . . . . . . 5
Consolidated Statement of Cash Flows . . . . . . . . . . . . . . . . . . . . . . . . . . . . . . . . . . . . . . . . . . 6
Notes to Consolidated Financial Statements . . . . . . . . . . . . . . . . . . . . . . . . . . . . . . . . . . . . . . 8
Item 2. Management’s Discussion and Analysis of Financial Condition and Results of Operations . . . . 38
Forward-Looking Statements . . . . . . . . . . . . . . . . . . . . . . . . . . . . . . . . . . . . . . . . . . . . . . . . . 38
Executive Overview . . . . . . . . . . . . . . . . . . . . . . . . . . . . . . . . . . . . . . . . . . . . . . . . . . . . . . . . 38
Basis of Reporting . . . . . . . . . . . . . . . . . . . . . . . . . . . . . . . . . . . . . . . . . . . . . . . . . . . . . . . . . 45
Receivables Review . . . . . . . . . . . . . . . . . . . . . . . . . . . . . . . . . . . . . . . . . . . . . . . . . . . . . . . . 49
Results of Operations. . . . . . . . . . . . . . . . . . . . . . . . . . . . . . . . . . . . . . . . . . . . . . . . . . . . . . . 52
Segment Results – IFRS Management Basis . . . . . . . . . . . . . . . . . . . . . . . . . . . . . . . . . . . . . . 60
Credit Quality . . . . . . . . . . . . . . . . . . . . . . . . . . . . . . . . . . . . . . . . . . . . . . . . . . . . . . . . . . . . 66
Liquidity and Capital Resources . . . . . . . . . . . . . . . . . . . . . . . . . . . . . . . . . . . . . . . . . . . . . . . 79
Risk Management . . . . . . . . . . . . . . . . . . . . . . . . . . . . . . . . . . . . . . . . . . . . . . . . . . . . . . . . . 83
Reconciliations to GAAP Financial Measures . . . . . . . . . . . . . . . . . . . . . . . . . . . . . . . . . . . . . 86
Item 4. Controls and Procedures . . . . . . . . . . . . . . . . . . . . . . . . . . . . . . . . . . . . . . . . . . . . . . . . . . . . 87
Part II. OTHER INFORMATIONItem 1. Legal Proceedings . . . . . . . . . . . . . . . . . . . . . . . . . . . . . . . . . . . . . . . . . . . . . . . . . . . . . . . . . 87
Item 6. Exhibits. . . . . . . . . . . . . . . . . . . . . . . . . . . . . . . . . . . . . . . . . . . . . . . . . . . . . . . . . . . . . . . . . 89
Signature . . . . . . . . . . . . . . . . . . . . . . . . . . . . . . . . . . . . . . . . . . . . . . . . . . . . . . . . . . . . . . . . . . . . . . . . 90
2

Part I. FINANCIAL INFORMATION
Item 1. Financial Statements
HSBC Finance Corporation
CONSOLIDATED STATEMENT OF INCOME (LOSS) (UNAUDITED)
2008 2007 2008 2007
Three Months EndedSeptember 30,
Nine Months EndedSeptember 30,
(in millions)
Finance and other interest income . . . . . . . . . . . . . . . . . . . . . . . . . . . $ 3,844 $ 4,571 $12,194 $13,677Interest expense:
HSBC affiliates . . . . . . . . . . . . . . . . . . . . . . . . . . . . . . . . . . . . . . . 250 192 773 566Non-affiliates . . . . . . . . . . . . . . . . . . . . . . . . . . . . . . . . . . . . . . . . . 1,284 1,780 4,217 5,389
Net interest income . . . . . . . . . . . . . . . . . . . . . . . . . . . . . . . . . . . . . . 2,310 2,599 7,204 7,722Provision for credit losses . . . . . . . . . . . . . . . . . . . . . . . . . . . . . . . . . 3,821 3,134 9,944 6,480
Net interest income (loss) after provision for credit losses . . . . . . . . . (1,511) (535) (2,740) 1,242
Other revenues:Insurance revenue . . . . . . . . . . . . . . . . . . . . . . . . . . . . . . . . . . . . . 108 127 321 361Investment income (loss) . . . . . . . . . . . . . . . . . . . . . . . . . . . . . . . . (22) 29 23 78Derivative income (expense). . . . . . . . . . . . . . . . . . . . . . . . . . . . . . 30 4 61 (48)Gain on debt designated at fair value and related derivatives . . . . . . 1,709 519 2,021 533Fee income . . . . . . . . . . . . . . . . . . . . . . . . . . . . . . . . . . . . . . . . . . 472 653 1,384 1,840Enhancement services revenue . . . . . . . . . . . . . . . . . . . . . . . . . . . . 175 167 532 465Taxpayer financial services revenue (expense) . . . . . . . . . . . . . . . . . 10 (27) 165 216Gain on receivable sales to HSBC affiliates . . . . . . . . . . . . . . . . . . 66 94 188 298Servicing and other fees from HSBC affiliates . . . . . . . . . . . . . . . . 125 126 381 374Other (expense) income . . . . . . . . . . . . . . . . . . . . . . . . . . . . . . . . . (127) (10) (266) (18)
Total other revenues . . . . . . . . . . . . . . . . . . . . . . . . . . . . . . . . . . . . . 2,546 1,682 4,810 4,099
Costs and expenses:Salaries and employee benefits . . . . . . . . . . . . . . . . . . . . . . . . . . . . 508 544 1,432 1,666Sales incentives . . . . . . . . . . . . . . . . . . . . . . . . . . . . . . . . . . . . . . . 10 51 50 175Occupancy and equipment expenses . . . . . . . . . . . . . . . . . . . . . . . . 54 66 172 206Other marketing expenses . . . . . . . . . . . . . . . . . . . . . . . . . . . . . . . 75 161 296 594Other servicing and administrative expenses . . . . . . . . . . . . . . . . . . 329 278 1,095 641Support services from HSBC affiliates . . . . . . . . . . . . . . . . . . . . . . 256 288 790 848Amortization of intangibles . . . . . . . . . . . . . . . . . . . . . . . . . . . . . . 42 63 139 189Policyholders’ benefits . . . . . . . . . . . . . . . . . . . . . . . . . . . . . . . . . . 51 64 154 184Goodwill impairment charge . . . . . . . . . . . . . . . . . . . . . . . . . . . . . 71 881 71 881
Total costs and expenses . . . . . . . . . . . . . . . . . . . . . . . . . . . . . . . . . . 1,396 2,396 4,199 5,384
Loss from continuing operations before income tax expense(benefit) . . . . . . . . . . . . . . . . . . . . . . . . . . . . . . . . . . . . . . . . . . . . (361) (1,249) (2,129) (43)
Income tax expense (benefit) . . . . . . . . . . . . . . . . . . . . . . . . . . . . . . . (90) (172) (683) 239
Income (loss) from continuing operations . . . . . . . . . . . . . . . . . . . . . (271) (1,077) (1,446) (282)Discontinued Operations (Note 2):
Loss from discontinued U.K. Operations . . . . . . . . . . . . . . . . . . . . . - (31) (15) (288)Income tax benefit . . . . . . . . . . . . . . . . . . . . . . . . . . . . . . . . . . . . . - (6) - (72)
Loss from discontinued operations . . . . . . . . . . . . . . . . . . . . . . . . . . - (25) (15) (216)
Net loss. . . . . . . . . . . . . . . . . . . . . . . . . . . . . . . . . . . . . . . . . . . . . . . $ (271) $(1,102) $ (1,461) $ (498)
The accompanying notes are an integral part of the consolidated financial statements.
3
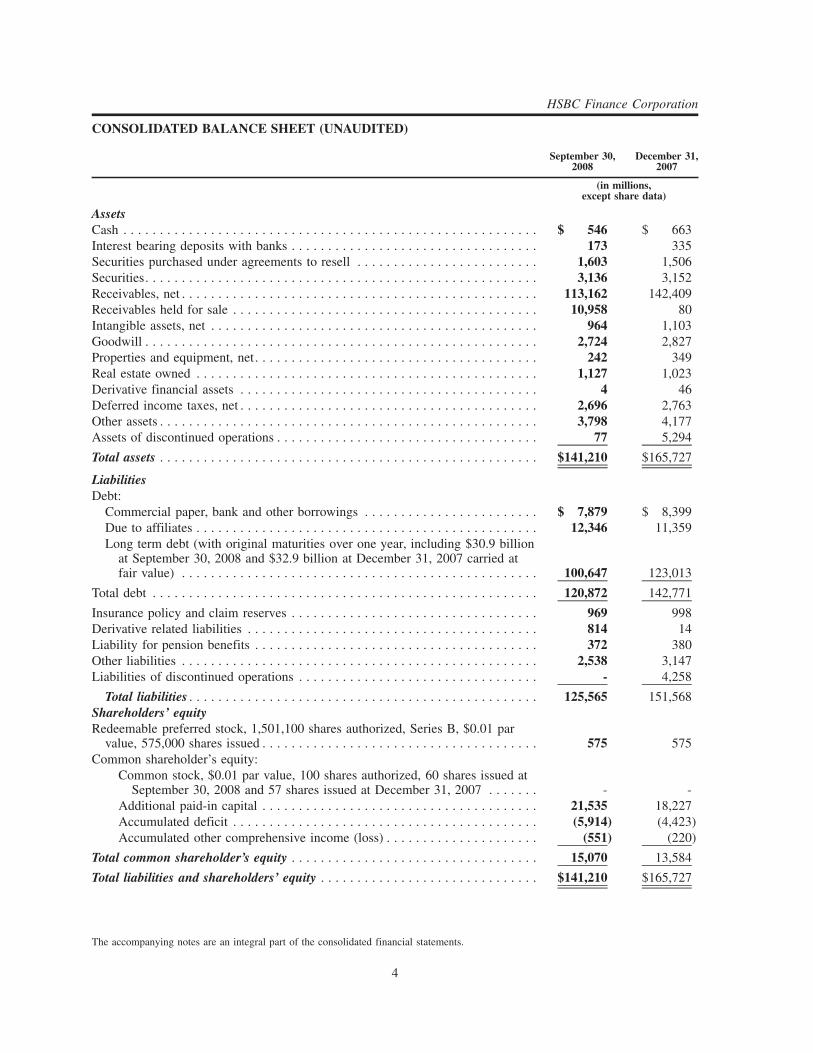
CONSOLIDATED BALANCE SHEET (UNAUDITED)
September 30,2008
December 31,2007
(in millions,except share data)
AssetsCash . . . . . . . . . . . . . . . . . . . . . . . . . . . . . . . . . . . . . . . . . . . . . . . . . . . . . . . . . $ 546 $ 663Interest bearing deposits with banks . . . . . . . . . . . . . . . . . . . . . . . . . . . . . . . . . . 173 335Securities purchased under agreements to resell . . . . . . . . . . . . . . . . . . . . . . . . . 1,603 1,506Securities. . . . . . . . . . . . . . . . . . . . . . . . . . . . . . . . . . . . . . . . . . . . . . . . . . . . . . 3,136 3,152Receivables, net . . . . . . . . . . . . . . . . . . . . . . . . . . . . . . . . . . . . . . . . . . . . . . . . . 113,162 142,409Receivables held for sale . . . . . . . . . . . . . . . . . . . . . . . . . . . . . . . . . . . . . . . . . . 10,958 80Intangible assets, net . . . . . . . . . . . . . . . . . . . . . . . . . . . . . . . . . . . . . . . . . . . . . 964 1,103Goodwill . . . . . . . . . . . . . . . . . . . . . . . . . . . . . . . . . . . . . . . . . . . . . . . . . . . . . . 2,724 2,827Properties and equipment, net. . . . . . . . . . . . . . . . . . . . . . . . . . . . . . . . . . . . . . . 242 349Real estate owned . . . . . . . . . . . . . . . . . . . . . . . . . . . . . . . . . . . . . . . . . . . . . . . 1,127 1,023Derivative financial assets . . . . . . . . . . . . . . . . . . . . . . . . . . . . . . . . . . . . . . . . . 4 46Deferred income taxes, net . . . . . . . . . . . . . . . . . . . . . . . . . . . . . . . . . . . . . . . . . 2,696 2,763Other assets . . . . . . . . . . . . . . . . . . . . . . . . . . . . . . . . . . . . . . . . . . . . . . . . . . . . 3,798 4,177Assets of discontinued operations . . . . . . . . . . . . . . . . . . . . . . . . . . . . . . . . . . . . 77 5,294
Total assets . . . . . . . . . . . . . . . . . . . . . . . . . . . . . . . . . . . . . . . . . . . . . . . . . . . . $141,210 $165,727
LiabilitiesDebt:
Commercial paper, bank and other borrowings . . . . . . . . . . . . . . . . . . . . . . . . $ 7,879 $ 8,399Due to affiliates . . . . . . . . . . . . . . . . . . . . . . . . . . . . . . . . . . . . . . . . . . . . . . . 12,346 11,359Long term debt (with original maturities over one year, including $30.9 billion
at September 30, 2008 and $32.9 billion at December 31, 2007 carried atfair value) . . . . . . . . . . . . . . . . . . . . . . . . . . . . . . . . . . . . . . . . . . . . . . . . . 100,647 123,013
Total debt . . . . . . . . . . . . . . . . . . . . . . . . . . . . . . . . . . . . . . . . . . . . . . . . . . . . . 120,872 142,771
Insurance policy and claim reserves . . . . . . . . . . . . . . . . . . . . . . . . . . . . . . . . . . 969 998Derivative related liabilities . . . . . . . . . . . . . . . . . . . . . . . . . . . . . . . . . . . . . . . . 814 14Liability for pension benefits . . . . . . . . . . . . . . . . . . . . . . . . . . . . . . . . . . . . . . . 372 380Other liabilities . . . . . . . . . . . . . . . . . . . . . . . . . . . . . . . . . . . . . . . . . . . . . . . . . 2,538 3,147Liabilities of discontinued operations . . . . . . . . . . . . . . . . . . . . . . . . . . . . . . . . . - 4,258
Total liabilities . . . . . . . . . . . . . . . . . . . . . . . . . . . . . . . . . . . . . . . . . . . . . . . . 125,565 151,568Shareholders’ equityRedeemable preferred stock, 1,501,100 shares authorized, Series B, $0.01 par
value, 575,000 shares issued . . . . . . . . . . . . . . . . . . . . . . . . . . . . . . . . . . . . . . 575 575Common shareholder’s equity:
Common stock, $0.01 par value, 100 shares authorized, 60 shares issued atSeptember 30, 2008 and 57 shares issued at December 31, 2007 . . . . . . . - -
Additional paid-in capital . . . . . . . . . . . . . . . . . . . . . . . . . . . . . . . . . . . . . . 21,535 18,227Accumulated deficit . . . . . . . . . . . . . . . . . . . . . . . . . . . . . . . . . . . . . . . . . . (5,914) (4,423)Accumulated other comprehensive income (loss) . . . . . . . . . . . . . . . . . . . . . (551) (220)
Total common shareholder’s equity . . . . . . . . . . . . . . . . . . . . . . . . . . . . . . . . . . 15,070 13,584
Total liabilities and shareholders’ equity . . . . . . . . . . . . . . . . . . . . . . . . . . . . . . $141,210 $165,727
The accompanying notes are an integral part of the consolidated financial statements.
4
HSBC Finance Corporation

CONSOLIDATED STATEMENT OF CHANGES IN SHAREHOLDERS’ EQUITY (UNAUDITED)Nine months ended September 30, 2008 2007
(in millions)
Preferred stockBalance at beginning and end of period . . . . . . . . . . . . . . . . . . . . . . . . . . . . . . . . . . . $ 575 $ 575
Common shareholder’s equityAdditional paid-in capital
Balance at beginning of period . . . . . . . . . . . . . . . . . . . . . . . . . . . . . . . . . . . . . . . . $18,227 $17,279
Excess of book value over consideration received on sale of U.K. Operations to anHSBC affiliate . . . . . . . . . . . . . . . . . . . . . . . . . . . . . . . . . . . . . . . . . . . . . . . . . . (196) -
Capital contribution from parent company. . . . . . . . . . . . . . . . . . . . . . . . . . . . . . . . 3,500 200
Employee benefit plans, including transfers and other . . . . . . . . . . . . . . . . . . . . . . . 4 (9)
Balance at end of period. . . . . . . . . . . . . . . . . . . . . . . . . . . . . . . . . . . . . . . . . . . . . $21,535 $17,470
(Accumulated deficit) retained earningsBalance at beginning of period . . . . . . . . . . . . . . . . . . . . . . . . . . . . . . . . . . . . . . . . $ (4,423) $ 1,877
Adjustment to initially apply the fair value method of accounting under FASBstatement No. 159, net of tax . . . . . . . . . . . . . . . . . . . . . . . . . . . . . . . . . . . . . . . - (542)
Balance at beginning of period, as adjusted . . . . . . . . . . . . . . . . . . . . . . . . . . . . . . . (4,423) 1,335
Net income (loss) . . . . . . . . . . . . . . . . . . . . . . . . . . . . . . . . . . . . . . . . . . . . . . . . . . (1,461) (498)
Dividend equivalents on HSBC’s Restricted Share Plan . . . . . . . . . . . . . . . . . . . . . . (3) (5)
Dividends:
Preferred stock . . . . . . . . . . . . . . . . . . . . . . . . . . . . . . . . . . . . . . . . . . . . . . . . . . (27) (27)
Common stock . . . . . . . . . . . . . . . . . . . . . . . . . . . . . . . . . . . . . . . . . . . . . . . . . . - (690)
Balance at end of period. . . . . . . . . . . . . . . . . . . . . . . . . . . . . . . . . . . . . . . . . . . . . $ (5,914) $ 115
Accumulated other comprehensive income (loss)Balance at beginning of period . . . . . . . . . . . . . . . . . . . . . . . . . . . . . . . . . . . . . . . . $ (220) $ 359
Net change in unrealized gains (losses), net of tax, on:Derivatives classified as cash flow hedges . . . . . . . . . . . . . . . . . . . . . . . . . . . . . . 195 (293)
Securities available for sale and interest-only strip receivables . . . . . . . . . . . . . . . (102) (2)
Actuarial gains, transition obligation and prior service costs relating to pension andpostretirement benefits . . . . . . . . . . . . . . . . . . . . . . . . . . . . . . . . . . . . . . . . . . . . (3) -
Foreign currency translation adjustments . . . . . . . . . . . . . . . . . . . . . . . . . . . . . . . . . (41) 88
Other comprehensive income (loss), net of tax . . . . . . . . . . . . . . . . . . . . . . . . . . . . 49 (207)
Reclassification of foreign currency translation and pension adjustments toadditional paid-in capital resulting from sale of U.K. Operations . . . . . . . . . . . . . (380) -
Balance at end of period. . . . . . . . . . . . . . . . . . . . . . . . . . . . . . . . . . . . . . . . . . . . . $ (551) $ 152
Total common shareholder’s equity . . . . . . . . . . . . . . . . . . . . . . . . . . . . . . . . . . . . . . . . $15,070 $17,737
Comprehensive income (loss)Net income (loss) . . . . . . . . . . . . . . . . . . . . . . . . . . . . . . . . . . . . . . . . . . . . . . . . . . . $ (1,461) $ (498)
Other comprehensive income (loss) . . . . . . . . . . . . . . . . . . . . . . . . . . . . . . . . . . . . . . 49 (207)
Comprehensive income (loss) . . . . . . . . . . . . . . . . . . . . . . . . . . . . . . . . . . . . . . . . . . . . $ (1,412) $ (705)
The accompanying notes are an integral part of the consolidated financial statements.
5
HSBC Finance Corporation

STATEMENT OF CASH FLOWS (UNAUDITED)Nine months ended September 30, 2008 2007
(in millions)
Cash flows from operating activitiesNet income (loss) . . . . . . . . . . . . . . . . . . . . . . . . . . . . . . . . . . . . . . . . . . . . . . . . . . . . . . . . . . $ (1,461) $ (498)Loss from discontinued operations . . . . . . . . . . . . . . . . . . . . . . . . . . . . . . . . . . . . . . . . . . . . . . (15) (216)
Income (loss) from continuing operations . . . . . . . . . . . . . . . . . . . . . . . . . . . . . . . . . . . . . . . . . (1,446) (282)Adjustments to reconcile net income (loss) to net cash provided by (used in) operating activities:
Provision for credit losses . . . . . . . . . . . . . . . . . . . . . . . . . . . . . . . . . . . . . . . . . . . . . . . . . . 9,944 6,480Gain on receivable sales to HSBC affiliates . . . . . . . . . . . . . . . . . . . . . . . . . . . . . . . . . . . . . . (188) (298)Loss on sale of real estate owned, including lower of cost or fair value adjustments . . . . . . . . . . 329 152Lower of cost or fair value adjustment on receivables transferred to held for sale included in
other income . . . . . . . . . . . . . . . . . . . . . . . . . . . . . . . . . . . . . . . . . . . . . . . . . . . . . . . . . . 298Insurance policy and claim reserves . . . . . . . . . . . . . . . . . . . . . . . . . . . . . . . . . . . . . . . . . . . (31) (13)Depreciation and amortization . . . . . . . . . . . . . . . . . . . . . . . . . . . . . . . . . . . . . . . . . . . . . . . 192 253Gain on sale of Mastercard shares . . . . . . . . . . . . . . . . . . . . . . . . . . . . . . . . . . . . . . . . . . . . . - (113)Mark-to-market on debt designated at fair value and related derivatives . . . . . . . . . . . . . . . . . . . (1,876) (776)Other-than-temporary impairments on available for sale securities. . . . . . . . . . . . . . . . . . . . . . . 55 -Goodwill impairment . . . . . . . . . . . . . . . . . . . . . . . . . . . . . . . . . . . . . . . . . . . . . . . . . . . . . . 71 881Net change in other assets . . . . . . . . . . . . . . . . . . . . . . . . . . . . . . . . . . . . . . . . . . . . . . . . . . 255 (376)Net change in other liabilities . . . . . . . . . . . . . . . . . . . . . . . . . . . . . . . . . . . . . . . . . . . . . . . . (577) (349)Net change in receivables held for sale, originated with intent to sell . . . . . . . . . . . . . . . . . . . . (33) 1,409Foreign exchange and SFAS No. 133 movements on long term debt and net change in non-FVO
related derivative assets and liabilities . . . . . . . . . . . . . . . . . . . . . . . . . . . . . . . . . . . . . . . . (392) 2,065Excess tax benefits from share-based compensation arrangements . . . . . . . . . . . . . . . . . . . . . . . - (8)Other, net . . . . . . . . . . . . . . . . . . . . . . . . . . . . . . . . . . . . . . . . . . . . . . . . . . . . . . . . . . . . . . 426 (16)
Cash provided by operating activities – continuing operations . . . . . . . . . . . . . . . . . . . . . . . . . . . 7,027 9,009Cash provided by operating activities – discontinued operations . . . . . . . . . . . . . . . . . . . . . . . . . . 186 151
Net cash provided by operating activities . . . . . . . . . . . . . . . . . . . . . . . . . . . . . . . . . . . . . . . . . 7,213 9,160
Cash flows from investing activitiesSecurities:
Purchased . . . . . . . . . . . . . . . . . . . . . . . . . . . . . . . . . . . . . . . . . . . . . . . . . . . . . . . . . . . . . (387) (823)Matured . . . . . . . . . . . . . . . . . . . . . . . . . . . . . . . . . . . . . . . . . . . . . . . . . . . . . . . . . . . . . . . 460 589Sold . . . . . . . . . . . . . . . . . . . . . . . . . . . . . . . . . . . . . . . . . . . . . . . . . . . . . . . . . . . . . . . . . 164 95
Net change in short-term securities available for sale . . . . . . . . . . . . . . . . . . . . . . . . . . . . . . . . . (463) 1,220Net change in securities purchased under agreements to resell . . . . . . . . . . . . . . . . . . . . . . . . . . . (97) (1,310)Net change in interest bearing deposits with banks . . . . . . . . . . . . . . . . . . . . . . . . . . . . . . . . . . . 155 (322)Proceeds from sale of Mastercard shares . . . . . . . . . . . . . . . . . . . . . . . . . . . . . . . . . . . . . . . . . . - 17Receivables:
Net (originations) collections . . . . . . . . . . . . . . . . . . . . . . . . . . . . . . . . . . . . . . . . . . . . . . . . 4,336 (4,468)Purchases and related premiums . . . . . . . . . . . . . . . . . . . . . . . . . . . . . . . . . . . . . . . . . . . . . . (37) (210)
Proceeds from sales of real estate owned . . . . . . . . . . . . . . . . . . . . . . . . . . . . . . . . . . . . . . . . . . 1,395 1,016Cash received on sales of receivables held in portfolio to a third party . . . . . . . . . . . . . . . . . . . . . 1,696 2,147Net cash received in sale of U.K. Operations to an affiliate . . . . . . . . . . . . . . . . . . . . . . . . . . . . . 259 -Properties and equipment:
Purchases . . . . . . . . . . . . . . . . . . . . . . . . . . . . . . . . . . . . . . . . . . . . . . . . . . . . . . . . . . . . . . (140) (96)Sales . . . . . . . . . . . . . . . . . . . . . . . . . . . . . . . . . . . . . . . . . . . . . . . . . . . . . . . . . . . . . . . . . 21 2
Cash provided by (used in) investing activities – continuing operations . . . . . . . . . . . . . . . . . . . . . 7,362 (2,143)Cash provided by (used in) investing activities – discontinued operations . . . . . . . . . . . . . . . . . . . 107 487
Net cash provided by investing activities . . . . . . . . . . . . . . . . . . . . . . . . . . . . . . . . . . . . . . . . . . 7,469 (1,656)
6

Nine months ended September 30, 2008 2007
(in millions)
Cash flows from financing activitiesDebt:
Net change in short-term debt and deposits . . . . . . . . . . . . . . . . . . . . . . . . . . . . . . . . . . . . . . (497) (1,643)Net change in due to affiliates . . . . . . . . . . . . . . . . . . . . . . . . . . . . . . . . . . . . . . . . . . . . . . . 1,015 (329)Long term debt issued . . . . . . . . . . . . . . . . . . . . . . . . . . . . . . . . . . . . . . . . . . . . . . . . . . . . . 4,467 16,265Long term debt retired . . . . . . . . . . . . . . . . . . . . . . . . . . . . . . . . . . . . . . . . . . . . . . . . . . . . . (23,295) (21,235)
Insurance:Policyholders’ benefits paid . . . . . . . . . . . . . . . . . . . . . . . . . . . . . . . . . . . . . . . . . . . . . . . . . (78) (83)Cash received from policyholders . . . . . . . . . . . . . . . . . . . . . . . . . . . . . . . . . . . . . . . . . . . . . 42 36
Capital contribution from parent . . . . . . . . . . . . . . . . . . . . . . . . . . . . . . . . . . . . . . . . . . . . . . . . 3,500 200Shareholders’ dividends . . . . . . . . . . . . . . . . . . . . . . . . . . . . . . . . . . . . . . . . . . . . . . . . . . . . . . (27) (717)Excess tax benefits from share-based compensation arrangements . . . . . . . . . . . . . . . . . . . . . . . . - 8
Cash used in financing activities – continuing operations . . . . . . . . . . . . . . . . . . . . . . . . . . . . . . . (14,873) (7,498)Cash used in financing activities – discontinued operations . . . . . . . . . . . . . . . . . . . . . . . . . . . . . (45) (402)
Net cash used in financing activities . . . . . . . . . . . . . . . . . . . . . . . . . . . . . . . . . . . . . . . . . . . . . (14,918) (7,900)
Effect of exchange rate changes on cash . . . . . . . . . . . . . . . . . . . . . . . . . . . . . . . . . . . . . . . . . . 8 (8)
Net change in cash . . . . . . . . . . . . . . . . . . . . . . . . . . . . . . . . . . . . . . . . . . . . . . . . . . . . . . . . . (228) (404)Cash at beginning of period(1) . . . . . . . . . . . . . . . . . . . . . . . . . . . . . . . . . . . . . . . . . . . . . . . . . 783 871
Cash at end of period(2) . . . . . . . . . . . . . . . . . . . . . . . . . . . . . . . . . . . . . . . . . . . . . . . . . . . . . $ 555 $ 467
Supplemental Noncash Investing ActivitiesTransfer of receivables to real estate owned . . . . . . . . . . . . . . . . . . . . . . . . . . . . . . . . . . . . . . . . $ 1,868 $ 1,513
Transfer of receivables to held for sale . . . . . . . . . . . . . . . . . . . . . . . . . . . . . . . . . . . . . . . . . . . $ 12,222 $ -
(1) Cash at beginning of period includes $120 million and $133 million for discontinued operations as of January 1, 2008 and 2007, respectively.(2) Cash at end of period includes $9 million and $130 million for discontinued operations as of September 30, 2008 and 2007, respectively.
The accompanying notes are an integral part of the consolidated financial statements.
7
STATEMENT OF CASH FLOWS (UNAUDITED) (Continued)

NOTES TO CONSOLIDATED FINANCIAL STATEMENTS (UNAUDITED)
1. Organization and Basis of Presentation
HSBC Finance Corporation and subsidiaries is an indirect wholly owned subsidiary of HSBC North AmericaHoldings Inc. (“HSBC North America”), which is an indirect wholly owned subsidiary of HSBC Holdings plc(“HSBC”). The accompanying unaudited interim consolidated financial statements of HSBC Finance Corporationand its subsidiaries have been prepared in accordance with accounting principles generally accepted in the UnitedStates of America (“U.S. GAAP”) for interim financial information and with the instructions to Form 10-Q andArticle 10 of Regulation S-X. Accordingly, they do not include all of the information and footnotes required bygenerally accepted accounting principles for complete financial statements. In the opinion of management, allnormal and recurring adjustments considered necessary for a fair presentation of financial position, results ofoperations and cash flows for the interim periods have been made. HSBC Finance Corporation may also be referredto in this Form 10-Q as “we,” “us” or “our.” These unaudited interim consolidated financial statements should beread in conjunction with our Annual Report on Form 10-K for the year ended December 31, 2007 (the “2007Form 10-K”). Certain reclassifications have been made to prior period amounts to conform to the current periodpresentation. Unless otherwise indicated, information included in these notes to consolidated financial statementsrelates to continuing operations for all periods presented. In May 2008 we completed the sale of our United King-dom operations to an affiliate. See Note 2, “Discontinued Operations,” for further details.
The preparation of financial statements in conformity with U.S. GAAP requires the use of estimates andassumptions that affect reported amounts and disclosures. Actual results could differ from those estimates. Interimresults should not be considered indicative of results in future periods.
2. Discontinued Operations
In May 2008, we sold all of the common stock of Household International Europe Limited, the holding company forour United Kingdom operations (“U.K. Operations”) to HSBC Overseas Holdings (UK) Limited (“HOHU”), asubsidiary of HSBC. The sales price was GBP 181 million (equivalent to $359 million in May 2008). With this sale,our operations are now limited to North America. At the time of the sale, the assets of the U.K. Operations consistedprimarily of net receivables of $4.6 billion and the liabilities consisted primarily of amounts due to HSBC affiliatesof $3.6 billion. As a result of this transaction, HOHU assumed the liabilities of our U.K. Operations outstanding atthe time of the sale. Because the sale was between affiliates under common control, the book value of the investmentin our U.K. Operations in excess of the consideration received which totaled $576 million was recorded as adecrease to common shareholder’s equity. Of this amount, $196 million was reflected as a decrease to additionalpaid in capital and $380 million was reflected as a decrease to other comprehensive income, primarily related toforeign currency translation adjustments. There was no tax benefit recorded as a result of this transaction. Our U.K.Operations were previously reported in the International Segment.
The following summarizes the operating results of our U.K. Operations for the periods presented:
2008(1) 2007 2008(1) 2007
Three Months EndedSeptember 30,
Nine Months EndedSeptember 30,
(in millions)
Net interest income and other revenues. . . . . . . . . . . . . . . . . . $- $206 $189 $ 588
Provision for credit losses . . . . . . . . . . . . . . . . . . . . . . . . . . . - 54 94 323
Loss before income tax benefit . . . . . . . . . . . . . . . . . . . . . . . . - (31) (15) (288)
Income tax benefit . . . . . . . . . . . . . . . . . . . . . . . . . . . . . . . . . - (6) - (72)
Loss from discontinued operations . . . . . . . . . . . . . . . . . . . . . - (25) (15) (216)
(1) Amounts shown for 2008 represent totals from the beginning of the period through May 31, 2008, the effective date of the sale.
The following summarizes the assets and liabilities of our U.K. Operations at December 31, 2007 which are nowreported as Assets of discontinued operations and Liabilities of discontinued operations in our consolidated balancesheet.
8

December 31,2007
(in millions)
Cash . . . . . . . . . . . . . . . . . . . . . . . . . . . . . . . . . . . . . . . . . . . . . . . . . . . . . . . . . . . . . . . . . . . . . $ 120
Receivables, net of credit loss reserves of $327 million . . . . . . . . . . . . . . . . . . . . . . . . . . . . . . . 4,966
Intangible assets, net . . . . . . . . . . . . . . . . . . . . . . . . . . . . . . . . . . . . . . . . . . . . . . . . . . . . . . . . . 4
Properties and equipment, net . . . . . . . . . . . . . . . . . . . . . . . . . . . . . . . . . . . . . . . . . . . . . . . . . . 66
Other assets . . . . . . . . . . . . . . . . . . . . . . . . . . . . . . . . . . . . . . . . . . . . . . . . . . . . . . . . . . . . . . . 138
Assets of discontinued operations. . . . . . . . . . . . . . . . . . . . . . . . . . . . . . . . . . . . . . . . . . . . . . . . $5,294
Commercial paper, bank and other borrowings . . . . . . . . . . . . . . . . . . . . . . . . . . . . . . . . . . . . . . $ 25
Due to affiliates . . . . . . . . . . . . . . . . . . . . . . . . . . . . . . . . . . . . . . . . . . . . . . . . . . . . . . . . . . . . 3,543
Long term debt . . . . . . . . . . . . . . . . . . . . . . . . . . . . . . . . . . . . . . . . . . . . . . . . . . . . . . . . . . . . . 472
Other liabilities . . . . . . . . . . . . . . . . . . . . . . . . . . . . . . . . . . . . . . . . . . . . . . . . . . . . . . . . . . . . . 218
Liabilities of discontinued operations . . . . . . . . . . . . . . . . . . . . . . . . . . . . . . . . . . . . . . . . . . . . . $4,258
Assets of discontinued operations at September 30, 2008 includes $9 million of cash in non-interest bearingaccounts and $68 million due from an HSBC affiliate related to a subsegment of this disposal group which isexpected to be received in the fourth quarter of 2008 upon the dissolution of certain legal entities.
3. Pending Transfer of Canadian Operations
In July 2008, we decided to sell the common stock of HSBC Financial Corporation Limited, the holding companyfor our Canadian business (“Canadian Operations”) to an HSBC affiliate. It is anticipated that ultimate ownership ofthe Canadian Operations will reside with HSBC Bank Canada. The aggregate sales price of approximately$377 million (based on the current exchange rate) was established after reviewing the results of an independentvaluation. As a result of this valuation, a goodwill impairment charge was recorded. The sale is expected to close inthe fourth quarter of 2008, subject to obtaining regulatory approval. Because the sale of our Canadian Operations isbetween affiliates under common control, any differences between the book value of the investment in our CanadianOperations and the consideration received will be recorded directly to common shareholder’s equity. At Septem-ber 30, 2008, assets in our Canadian Operations totaled $4.4 billion, consisting primarily of net receivables of$3.8 billion, available-for-sale securities of $441 million and goodwill of $96 million. At September 30, 2008,liabilities which totaled $4.0 billion, consisting primarily of long term debt of $3.8 billion. As a result of thisdecision, our operations will be entirely limited to the United States. Upon completion of the sale, we will report theresults of our Canadian Operations as discontinued operations.
4. Restructuring Activities
As discussed in prior filings, we have been engaged in a continuing, comprehensive evaluation of the strategies andopportunities of our operations. In light of the unprecedented developments in the retail credit markets, particularlyin the residential mortgage industry, this evaluation has resulted in decisions to lower the risk profile of ouroperations, to reduce our capital and liquidity requirements by reducing the size of our balance sheet and torationalize and maximize the efficiency of our operations. As a result, a number of strategic actions have beenundertaken since mid-2007.
Card and Retail Services Business As a result of our decision in the fourth quarter of 2007 to slow credit cardreceivable growth and in an effort to optimize our facility and staffing capacity, in June 2008 we decided to close ourservicing facilities located in Jacksonville, Florida and White Marsh, Maryland (the “Servicing Facilities”) duringthe third quarter of 2008. The servicing activities performed in the Servicing Facilities have been redeployed toother facilities in our Card and Retail Services businesses. Additionally, we decided to eliminate positions in anumber of different functions across our Card and Retail Services businesses. The following summarizes the
9
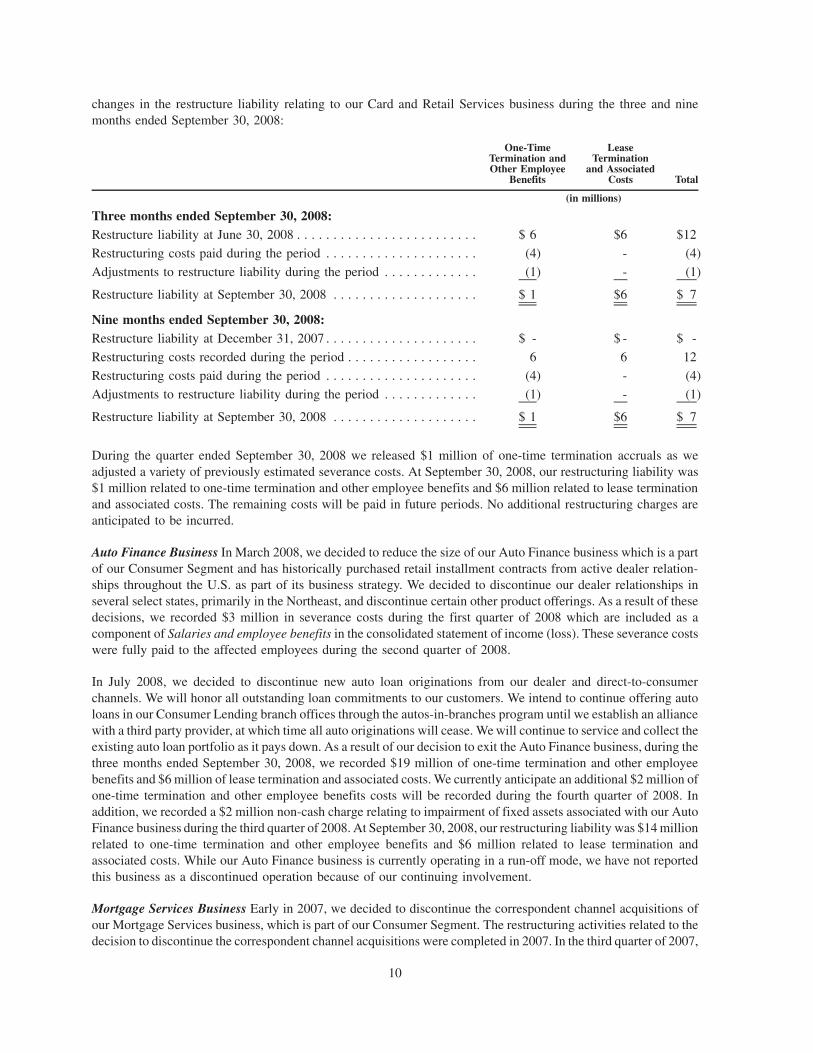
changes in the restructure liability relating to our Card and Retail Services business during the three and ninemonths ended September 30, 2008:
One-TimeTermination andOther Employee
Benefits
LeaseTermination
and AssociatedCosts Total
(in millions)
Three months ended September 30, 2008:Restructure liability at June 30, 2008 . . . . . . . . . . . . . . . . . . . . . . . . . $ 6 $6 $12
Restructuring costs paid during the period . . . . . . . . . . . . . . . . . . . . . (4) - (4)
Adjustments to restructure liability during the period . . . . . . . . . . . . . (1) - (1)
Restructure liability at September 30, 2008 . . . . . . . . . . . . . . . . . . . . $ 1 $6 $ 7
Nine months ended September 30, 2008:Restructure liability at December 31, 2007 . . . . . . . . . . . . . . . . . . . . . $ - $ - $ -
Restructuring costs recorded during the period . . . . . . . . . . . . . . . . . . 6 6 12
Restructuring costs paid during the period . . . . . . . . . . . . . . . . . . . . . (4) - (4)
Adjustments to restructure liability during the period . . . . . . . . . . . . . (1) - (1)
Restructure liability at September 30, 2008 . . . . . . . . . . . . . . . . . . . . $ 1 $6 $ 7
During the quarter ended September 30, 2008 we released $1 million of one-time termination accruals as weadjusted a variety of previously estimated severance costs. At September 30, 2008, our restructuring liability was$1 million related to one-time termination and other employee benefits and $6 million related to lease terminationand associated costs. The remaining costs will be paid in future periods. No additional restructuring charges areanticipated to be incurred.
Auto Finance Business In March 2008, we decided to reduce the size of our Auto Finance business which is a partof our Consumer Segment and has historically purchased retail installment contracts from active dealer relation-ships throughout the U.S. as part of its business strategy. We decided to discontinue our dealer relationships inseveral select states, primarily in the Northeast, and discontinue certain other product offerings. As a result of thesedecisions, we recorded $3 million in severance costs during the first quarter of 2008 which are included as acomponent of Salaries and employee benefits in the consolidated statement of income (loss). These severance costswere fully paid to the affected employees during the second quarter of 2008.
In July 2008, we decided to discontinue new auto loan originations from our dealer and direct-to-consumerchannels. We will honor all outstanding loan commitments to our customers. We intend to continue offering autoloans in our Consumer Lending branch offices through the autos-in-branches program until we establish an alliancewith a third party provider, at which time all auto originations will cease. We will continue to service and collect theexisting auto loan portfolio as it pays down. As a result of our decision to exit the Auto Finance business, during thethree months ended September 30, 2008, we recorded $19 million of one-time termination and other employeebenefits and $6 million of lease termination and associated costs. We currently anticipate an additional $2 million ofone-time termination and other employee benefits costs will be recorded during the fourth quarter of 2008. Inaddition, we recorded a $2 million non-cash charge relating to impairment of fixed assets associated with our AutoFinance business during the third quarter of 2008. At September 30, 2008, our restructuring liability was $14 millionrelated to one-time termination and other employee benefits and $6 million related to lease termination andassociated costs. While our Auto Finance business is currently operating in a run-off mode, we have not reportedthis business as a discontinued operation because of our continuing involvement.
Mortgage Services Business Early in 2007, we decided to discontinue the correspondent channel acquisitions ofour Mortgage Services business, which is part of our Consumer Segment. The restructuring activities related to thedecision to discontinue the correspondent channel acquisitions were completed in 2007. In the third quarter of 2007,
10
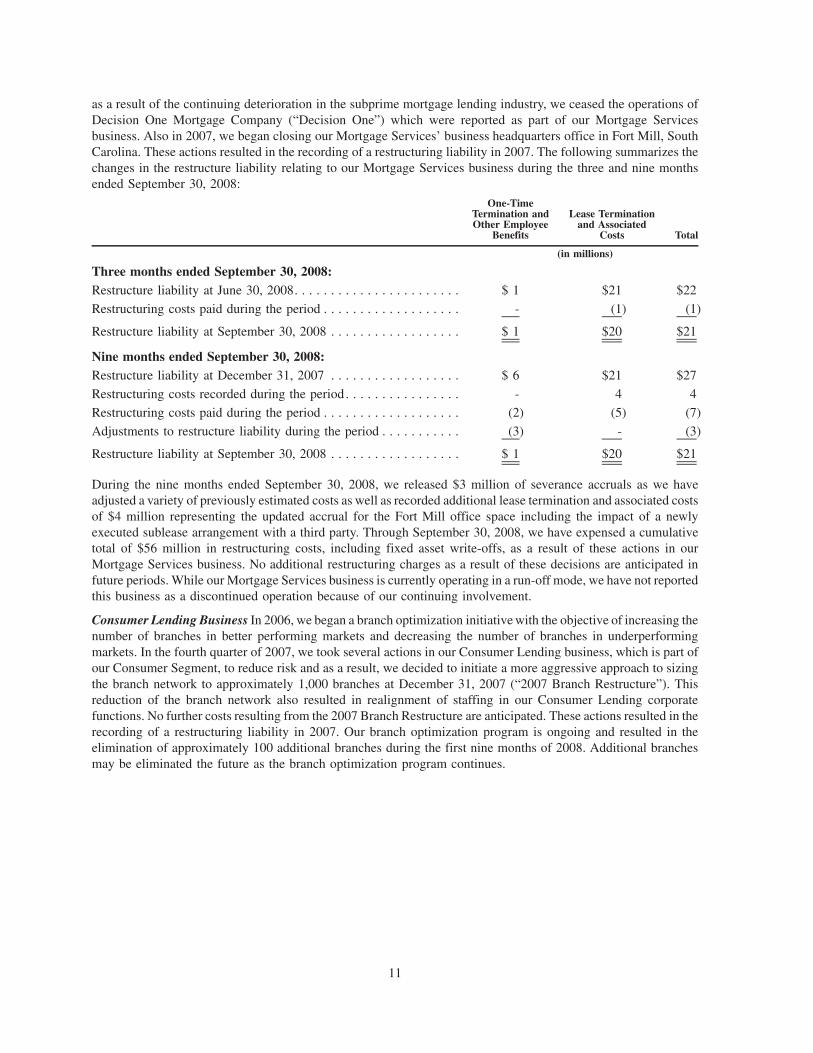
as a result of the continuing deterioration in the subprime mortgage lending industry, we ceased the operations ofDecision One Mortgage Company (“Decision One”) which were reported as part of our Mortgage Servicesbusiness. Also in 2007, we began closing our Mortgage Services’ business headquarters office in Fort Mill, SouthCarolina. These actions resulted in the recording of a restructuring liability in 2007. The following summarizes thechanges in the restructure liability relating to our Mortgage Services business during the three and nine monthsended September 30, 2008:
One-TimeTermination andOther Employee
Benefits
Lease Terminationand Associated
Costs Total
(in millions)
Three months ended September 30, 2008:Restructure liability at June 30, 2008. . . . . . . . . . . . . . . . . . . . . . . $ 1 $21 $22
Restructuring costs paid during the period . . . . . . . . . . . . . . . . . . . - (1) (1)
Restructure liability at September 30, 2008 . . . . . . . . . . . . . . . . . . $ 1 $20 $21
Nine months ended September 30, 2008:Restructure liability at December 31, 2007 . . . . . . . . . . . . . . . . . . $ 6 $21 $27
Restructuring costs recorded during the period . . . . . . . . . . . . . . . . - 4 4
Restructuring costs paid during the period . . . . . . . . . . . . . . . . . . . (2) (5) (7)
Adjustments to restructure liability during the period . . . . . . . . . . . (3) - (3)
Restructure liability at September 30, 2008 . . . . . . . . . . . . . . . . . . $ 1 $20 $21
During the nine months ended September 30, 2008, we released $3 million of severance accruals as we haveadjusted a variety of previously estimated costs as well as recorded additional lease termination and associated costsof $4 million representing the updated accrual for the Fort Mill office space including the impact of a newlyexecuted sublease arrangement with a third party. Through September 30, 2008, we have expensed a cumulativetotal of $56 million in restructuring costs, including fixed asset write-offs, as a result of these actions in ourMortgage Services business. No additional restructuring charges as a result of these decisions are anticipated infuture periods. While our Mortgage Services business is currently operating in a run-off mode, we have not reportedthis business as a discontinued operation because of our continuing involvement.
Consumer Lending Business In 2006, we began a branch optimization initiative with the objective of increasing thenumber of branches in better performing markets and decreasing the number of branches in underperformingmarkets. In the fourth quarter of 2007, we took several actions in our Consumer Lending business, which is part ofour Consumer Segment, to reduce risk and as a result, we decided to initiate a more aggressive approach to sizingthe branch network to approximately 1,000 branches at December 31, 2007 (“2007 Branch Restructure”). Thisreduction of the branch network also resulted in realignment of staffing in our Consumer Lending corporatefunctions. No further costs resulting from the 2007 Branch Restructure are anticipated. These actions resulted in therecording of a restructuring liability in 2007. Our branch optimization program is ongoing and resulted in theelimination of approximately 100 additional branches during the first nine months of 2008. Additional branchesmay be eliminated the future as the branch optimization program continues.
11

The following summarizes the changes in restructure liability relating to our Consumer Lending business during thethree and nine months ended September 30, 2008:
One-TimeTermination andOther Employee
Benefits
Lease Terminationand Associated
Costs Total
(in millions)
Three months ended September 30, 2008:Restructure liability at June 30, 2008 . . . . . . . . . . . . . . . . . . . . . . $ 1 $ 2 $ 3
Restructuring costs paid during the period . . . . . . . . . . . . . . . . . . . - (1) (1)
Restructure liability at September 30, 2008 . . . . . . . . . . . . . . . . . . $ 1 $ 1 $ 2
Nine months ended September 30, 2008:Restructure liability at December 31, 2007 . . . . . . . . . . . . . . . . . . $ 7 $ 14 $ 21
Restructuring costs paid during the period . . . . . . . . . . . . . . . . . . . (5) (12) (17)
Adjustments to restructure liability during the period . . . . . . . . . . . (1) (1) (2)
Restructure liability at September 30, 2008 . . . . . . . . . . . . . . . . . . $ 1 $ 1 $ 2
During the nine months ended September 30, 2008, we decreased the restructuring liability by $2 million as we havefinalized a variety of previously estimated severance costs and lease termination costs. Through September 30,2008, we have expensed a cumulative total of $29 million in restructuring costs, including fixed asset write-offs, as aresult of these actions in our Consumer Lending business.
Facility in Carmel, Indiana In the third quarter of 2007, we closed our loan underwriting, processing andcollections center in Carmel, Indiana (the “Carmel Facility”) to optimize our facility and staffing capacity given theoverall reductions in business volumes. The collection activities performed in the Carmel Facility have beenredeployed to other facilities in our Consumer Lending business. The following summarizes the changes inrestructure liability relating to the Carmel Facility during the three and nine months ended September 30, 2008:
One-TimeTermination andOther Employee
Benefits
Lease Terminationand Associated
Costs Total
(in millions)
Three months ended September 30, 2008:Restructure liability at June 30, 2008. . . . . . . . . . . . . . . . . . . . . . . $ - $ 1 $ 1
Restructuring costs paid during the period . . . . . . . . . . . . . . . . . . . - (1) (1)
Restructure liability at September 30, 2008 . . . . . . . . . . . . . . . . . . $ - $ - $ -
Nine months ended September 30, 2008:Restructure liability at December 31, 2007 . . . . . . . . . . . . . . . . . . $ 4 $ 2 $ 6
Restructuring costs paid during the period . . . . . . . . . . . . . . . . . . . (2) (2) (4)
Adjustments to restructure liability during the period . . . . . . . . . . . (2) - (2)
Restructure liability at September 30, 2008 . . . . . . . . . . . . . . . . . . $ - $ - $ -
During the nine months ended September 30, 2008, we reduced the restructuring liability by $2 million as weadjusted a variety of previously estimated severance costs. No additional costs were recorded during the ninemonths ended September 30, 2008 and no additional costs are anticipated in future periods. Through September 30,2008, we have expensed a cumulative total of $5 million in restructuring costs as a result of closing the CarmelFacility.
Canadian Business During the fourth quarter of 2007, we tightened underwriting criteria for various real estate andunsecured products in our Canadian business, which is reported in the “All Other” caption in our segment reporting,resulting in lower volumes. This led to a decision to close our mortgage operations in Canada which underwrote
12

loans sourced through brokers as well as to close 29 branches prior to November 1, 2007. These actions resulted inthe recording of a restructuring liability in 2007. The following summarizes the changes in the restructure liabilityin our Canadian business during the three and nine months ended September 30, 2008:
One-TimeTermination andOther Employee
Benefits
Lease Terminationand Associated
Costs Total
(in millions)
Three months ended September 30, 2008:Restructure liability at June 30, 2008. . . . . . . . . . . . . . . . . . . . . . . $ 1 $ 1 $ 2Restructuring costs paid during the period . . . . . . . . . . . . . . . . . . . (1) - (1)
Restructure liability at September 30, 2008 . . . . . . . . . . . . . . . . . . $ - $ 1 $ 1
Nine months ended September 30, 2008:Restructure liability at December 31, 2007 . . . . . . . . . . . . . . . . . . $ 1 $ 4 $ 5Restructuring costs recorded during the period . . . . . . . . . . . . . . . . 2 - 2Restructuring costs paid during the period . . . . . . . . . . . . . . . . . . . (3) (2) (5)Adjustments to restructure liability during the period . . . . . . . . . . . - (1) (1)
Restructure liability at September 30, 2008 . . . . . . . . . . . . . . . . . . $ - $ 1 $ 1
During the nine months ended September 30, 2008, we recorded an additional restructuring charge of $2 millionrelating to previously estimated severance costs and reduced the restructuring liability by $1 million as we adjusteda variety of previously estimated lease terminations and associated costs. Through September 30, 2008, we haveexpensed a cumulative total of $14 million in restructuring costs as a result of these Canadian branch closures. As aresult of the lower origination volumes discussed above, we are evaluating the appropriate scope and geographicdistribution of our Canadian branches in efforts to optimize management efficiencies as well as to reduce expenses.
Summary of Restructuring Activities The following table summarizes the net expense for all restructuringactivities recorded during the nine months ended September 30, 2008:
One-TimeTermination andOther Employee
Benefits(1)(3)
Lease Terminationand Associated
Costs(2)(3) Total
(in millions)
Card and Retail Services . . . . . . . . . . . . . . . . . . . . . . . . . . . . . . . . $ 5 $ 6 $11
Auto Finance . . . . . . . . . . . . . . . . . . . . . . . . . . . . . . . . . . . . . . . . 22 6 28Mortgage Services . . . . . . . . . . . . . . . . . . . . . . . . . . . . . . . . . . . . (3) 4 1
Consumer Lending . . . . . . . . . . . . . . . . . . . . . . . . . . . . . . . . . . . . (1) (1) (2)
Carmel Facility . . . . . . . . . . . . . . . . . . . . . . . . . . . . . . . . . . . . . . . (2) - (2)
Canadian Business . . . . . . . . . . . . . . . . . . . . . . . . . . . . . . . . . . . . 2 (1) 1
$23 $14 $37
(1) One-time termination and other employee benefits are included as a component of Salaries and employee benefits in the consolidatedstatement of income.
(2) Lease termination and associated costs are included as a component of Occupancy and equipment expenses in the consolidated statement ofincome.
(3) During the three months ended September 30, 2008, we incurred a net expense of $18 million in one-time termination and other employeebenefits and $6 million in lease termination and other associated costs.
13

5. Securities
Securities consisted of the following available-for-sale investments:
September 30, 2008Amortized
Cost
GrossUnrealized
Gains
GrossUnrealized
LossesFair
Value
(in millions)
Corporate debt securities . . . . . . . . . . . . . . . . . . . . . . . . . . . . . $2,000 $6 $(125) $1,881Money market funds . . . . . . . . . . . . . . . . . . . . . . . . . . . . . . . . 221 - - 221U.S. government sponsored enterprises(1) . . . . . . . . . . . . . . . . . 331 2 (5) 328U.S. government and Federal agency debt securities . . . . . . . . . 109 - (1) 108Non-government mortgage backed securities. . . . . . . . . . . . . . . 173 - (42) 131Other . . . . . . . . . . . . . . . . . . . . . . . . . . . . . . . . . . . . . . . . . . . 444 1 (12) 433
Subtotal . . . . . . . . . . . . . . . . . . . . . . . . . . . . . . . . . . . . . . . . . . 3,278 9 (185) 3,102Accrued investment income . . . . . . . . . . . . . . . . . . . . . . . . . . . 34 - - 34
Total securities available for sale . . . . . . . . . . . . . . . . . . . . . . . $3,312 $9 $(185) $3,136
December 31, 2007Amortized
Cost
GrossUnrealized
Gains
GrossUnrealized
LossesFair
Value
(in millions)
Corporate debt securities . . . . . . . . . . . . . . . . . . . . . . . . . . . . . $2,173 $18 $(28) $2,163
Money market funds . . . . . . . . . . . . . . . . . . . . . . . . . . . . . . . . 194 - - 194
U.S. government sponsored enterprises(1) . . . . . . . . . . . . . . . . . 253 2 (2) 253
U.S. government and Federal agency debt securities . . . . . . . . . 37 1 - 38
Non-government mortgage backed securities. . . . . . . . . . . . . . . 208 - (3) 205
Other . . . . . . . . . . . . . . . . . . . . . . . . . . . . . . . . . . . . . . . . . . . 274 1 (9) 266
Subtotal . . . . . . . . . . . . . . . . . . . . . . . . . . . . . . . . . . . . . . . . . . 3,139 22 (42) 3,119
Accrued investment income . . . . . . . . . . . . . . . . . . . . . . . . . . . 33 - - 33
Total securities available for sale . . . . . . . . . . . . . . . . . . . . . . . $3,172 $22 $(42) $3,152
(1) Includes primarily mortgage-backed securities issued by the Federal National Mortgage Association and the Federal Home Loan MortgageCorporation which collectively represent $126 million and $156 million of total fair value at September 30, 2008 and December 31, 2007,respectively.
We have recorded other-than-temporary impairment charges of $40 million during the three months endedSeptember 30, 2008 and $55 million in the year-to-date period. At September 30, 2008, the evaluation of ourinvestments in perpetual preferred securities, which are included in the “Other” caption in the table above, wasperformed in accordance with guidance issued in October 2008 by the Securities and Exchange Commission(“SEC”). This guidance allowed registrants to evaluate perpetual preferred securities similar to a debt securityprovided there has been no evidence of deterioration in the credit of the issuer. Prior to applying this guidance,perpetual preferred securities were assessed for impairment using an equity-like impairment model. At Septem-ber 30, 2008, unrealized losses on certain perpetual preferred securities of $11 million are reflected as a componentof other comprehensive income.
In the third quarter of 2008, we sold all our Fannie Mae and Freddie Mac preferred equity shares and recorded a lossof $13 million.
14

A summary of gross unrealized losses and related fair values as of September 30, 2008 and December 31, 2007,classified as to the length of time the losses have existed follows:
September 30, 2008
Numberof
Securities
GrossUnrealized
Losses
AggregateFair Value ofInvestments
Numberof
Securities
GrossUnrealized
Losses
AggregateFair Value ofInvestments
Less Than One Year Greater Than One Year
(dollars are in millions)
Corporate debt securities . . . . . . . 553 $(85) $1,215 100 $(40) $263U.S. government sponsored
enterprises . . . . . . . . . . . . . . . 19 (2) 76 13 (3) 22U.S. government and Federal
agency debt securities . . . . . . . 1 - 5 1 (1) 5Non-government mortgage
backed securities . . . . . . . . . . . 26 (20) 91 7 (22) 33Other . . . . . . . . . . . . . . . . . . . . . 42 (10) 78 18 (2) 13
December 31, 2007
Numberof
Securities
GrossUnrealized
Losses
AggregateFair Value ofInvestments
Numberof
Securities
GrossUnrealized
Losses
AggregateFair Value ofInvestments
Less Than One Year Greater Than One Year
(dollars are in millions)
Corporate debt securities . . . . . . . 146 $(8) $445 340 $(20) $798
U.S. government sponsoredenterprises . . . . . . . . . . . . . . . 3 - 15 38 (2) 75
U.S. government and Federalagency debt securities . . . . . . . - - - 4 - 9
Non-government mortgagebacked securities . . . . . . . . . . . 8 (1) 52 9 (2) 32
Other . . . . . . . . . . . . . . . . . . . . . 46 (9) 79 35 - 94
The gross unrealized losses on our securities available for sale have increased during the first nine months of 2008 asthe impact of wider credit spreads, particularly in the third quarter of 2008, were only partially offset by decreases ininterest rates. The contractual terms of these securities do not permit the issuer to settle the securities at a price lessthan the par value of the investment. Substantially all of our remaining securities are rated A- or better, and we havethe ability and intent to hold these investments until maturity or a market price recovery. Accordingly, other than thecorporate debt and preferred equity securities discussed below, these securities are not considered other-than-tem-porarily impaired.
Approximately 73 percent of our non-government mortgage backed and asset backed securities, which totaled$178 million at September 30, 2008, are rated “AAA.” The level of subprime assets supporting these securities isapproximately $23 million.
15
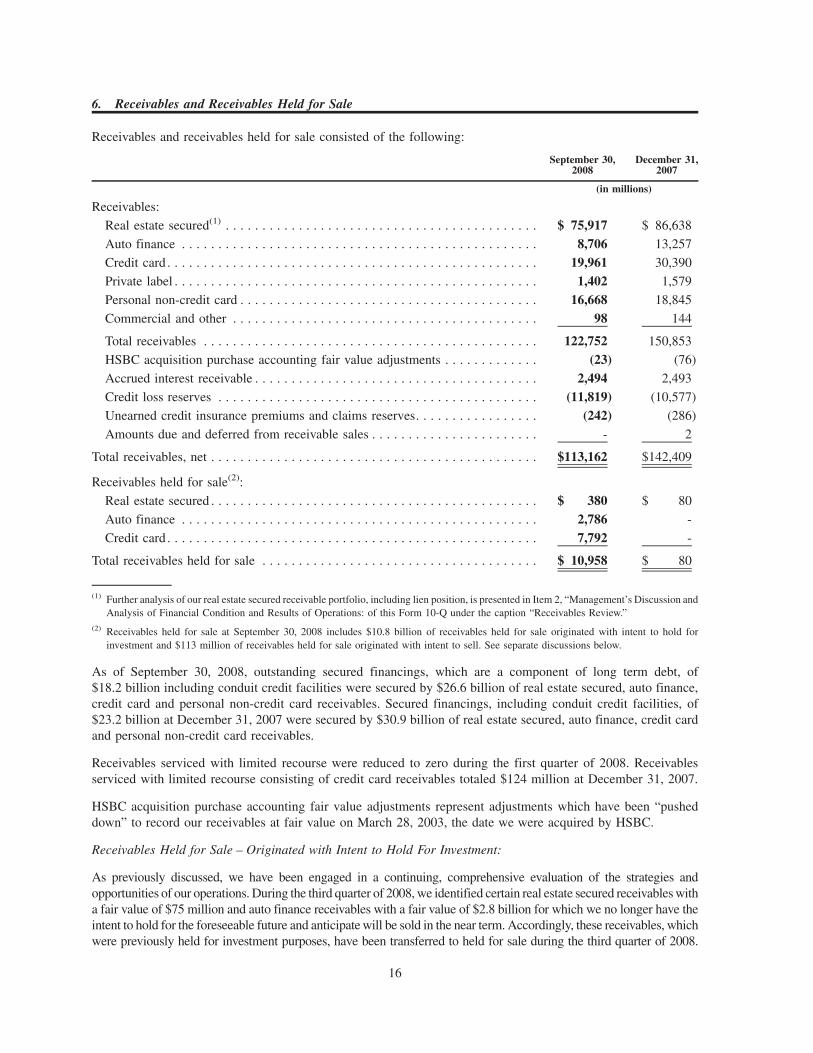
6. Receivables and Receivables Held for Sale
Receivables and receivables held for sale consisted of the following:
September 30,2008
December 31,2007
(in millions)
Receivables:
Real estate secured(1) . . . . . . . . . . . . . . . . . . . . . . . . . . . . . . . . . . . . . . . . . . . $ 75,917 $ 86,638
Auto finance . . . . . . . . . . . . . . . . . . . . . . . . . . . . . . . . . . . . . . . . . . . . . . . . . 8,706 13,257
Credit card . . . . . . . . . . . . . . . . . . . . . . . . . . . . . . . . . . . . . . . . . . . . . . . . . . . 19,961 30,390
Private label . . . . . . . . . . . . . . . . . . . . . . . . . . . . . . . . . . . . . . . . . . . . . . . . . . 1,402 1,579
Personal non-credit card . . . . . . . . . . . . . . . . . . . . . . . . . . . . . . . . . . . . . . . . . 16,668 18,845
Commercial and other . . . . . . . . . . . . . . . . . . . . . . . . . . . . . . . . . . . . . . . . . . 98 144
Total receivables . . . . . . . . . . . . . . . . . . . . . . . . . . . . . . . . . . . . . . . . . . . . . . 122,752 150,853
HSBC acquisition purchase accounting fair value adjustments . . . . . . . . . . . . . (23) (76)
Accrued interest receivable . . . . . . . . . . . . . . . . . . . . . . . . . . . . . . . . . . . . . . . 2,494 2,493
Credit loss reserves . . . . . . . . . . . . . . . . . . . . . . . . . . . . . . . . . . . . . . . . . . . . (11,819) (10,577)
Unearned credit insurance premiums and claims reserves. . . . . . . . . . . . . . . . . (242) (286)
Amounts due and deferred from receivable sales . . . . . . . . . . . . . . . . . . . . . . . - 2
Total receivables, net . . . . . . . . . . . . . . . . . . . . . . . . . . . . . . . . . . . . . . . . . . . . . $113,162 $142,409
Receivables held for sale(2):
Real estate secured . . . . . . . . . . . . . . . . . . . . . . . . . . . . . . . . . . . . . . . . . . . . . $ 380 $ 80
Auto finance . . . . . . . . . . . . . . . . . . . . . . . . . . . . . . . . . . . . . . . . . . . . . . . . . 2,786 -
Credit card . . . . . . . . . . . . . . . . . . . . . . . . . . . . . . . . . . . . . . . . . . . . . . . . . . . 7,792 -
Total receivables held for sale . . . . . . . . . . . . . . . . . . . . . . . . . . . . . . . . . . . . . . $ 10,958 $ 80
(1) Further analysis of our real estate secured receivable portfolio, including lien position, is presented in Item 2, “Management’s Discussion andAnalysis of Financial Condition and Results of Operations: of this Form 10-Q under the caption “Receivables Review.”
(2) Receivables held for sale at September 30, 2008 includes $10.8 billion of receivables held for sale originated with intent to hold forinvestment and $113 million of receivables held for sale originated with intent to sell. See separate discussions below.
As of September 30, 2008, outstanding secured financings, which are a component of long term debt, of$18.2 billion including conduit credit facilities were secured by $26.6 billion of real estate secured, auto finance,credit card and personal non-credit card receivables. Secured financings, including conduit credit facilities, of$23.2 billion at December 31, 2007 were secured by $30.9 billion of real estate secured, auto finance, credit cardand personal non-credit card receivables.
Receivables serviced with limited recourse were reduced to zero during the first quarter of 2008. Receivablesserviced with limited recourse consisting of credit card receivables totaled $124 million at December 31, 2007.
HSBC acquisition purchase accounting fair value adjustments represent adjustments which have been “pusheddown” to record our receivables at fair value on March 28, 2003, the date we were acquired by HSBC.
Receivables Held for Sale – Originated with Intent to Hold For Investment:
As previously discussed, we have been engaged in a continuing, comprehensive evaluation of the strategies andopportunities of our operations. During the third quarter of 2008, we identified certain real estate secured receivables witha fair value of $75 million and auto finance receivables with a fair value of $2.8 billion for which we no longer have theintent to hold for the foreseeable future and anticipate will be sold in the near term. Accordingly, these receivables, whichwere previously held for investment purposes, have been transferred to held for sale during the third quarter of 2008.
16
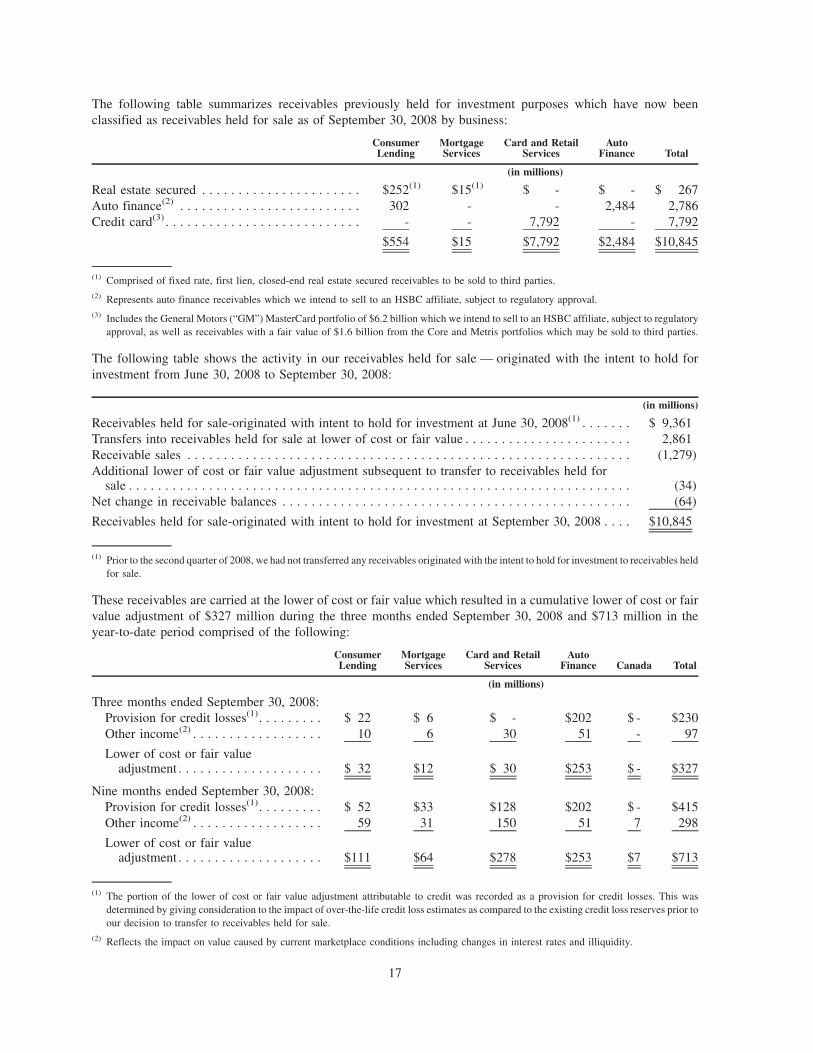
The following table summarizes receivables previously held for investment purposes which have now beenclassified as receivables held for sale as of September 30, 2008 by business:
ConsumerLending
MortgageServices
Card and RetailServices
AutoFinance Total
(in millions)
Real estate secured . . . . . . . . . . . . . . . . . . . . . . $252(1) $15(1) $ - $ - $ 267Auto finance(2) . . . . . . . . . . . . . . . . . . . . . . . . . 302 - - 2,484 2,786Credit card(3) . . . . . . . . . . . . . . . . . . . . . . . . . . . - - 7,792 - 7,792
$554 $15 $7,792 $2,484 $10,845
(1) Comprised of fixed rate, first lien, closed-end real estate secured receivables to be sold to third parties.(2) Represents auto finance receivables which we intend to sell to an HSBC affiliate, subject to regulatory approval.(3) Includes the General Motors (“GM”) MasterCard portfolio of $6.2 billion which we intend to sell to an HSBC affiliate, subject to regulatory
approval, as well as receivables with a fair value of $1.6 billion from the Core and Metris portfolios which may be sold to third parties.
The following table shows the activity in our receivables held for sale — originated with the intent to hold forinvestment from June 30, 2008 to September 30, 2008:
(in millions)
Receivables held for sale-originated with intent to hold for investment at June 30, 2008(1) . . . . . . . $ 9,361Transfers into receivables held for sale at lower of cost or fair value . . . . . . . . . . . . . . . . . . . . . . . 2,861Receivable sales . . . . . . . . . . . . . . . . . . . . . . . . . . . . . . . . . . . . . . . . . . . . . . . . . . . . . . . . . . . . . (1,279)Additional lower of cost or fair value adjustment subsequent to transfer to receivables held for
sale . . . . . . . . . . . . . . . . . . . . . . . . . . . . . . . . . . . . . . . . . . . . . . . . . . . . . . . . . . . . . . . . . . . . . (34)Net change in receivable balances . . . . . . . . . . . . . . . . . . . . . . . . . . . . . . . . . . . . . . . . . . . . . . . . (64)
Receivables held for sale-originated with intent to hold for investment at September 30, 2008 . . . . $10,845
(1) Prior to the second quarter of 2008, we had not transferred any receivables originated with the intent to hold for investment to receivables heldfor sale.
These receivables are carried at the lower of cost or fair value which resulted in a cumulative lower of cost or fairvalue adjustment of $327 million during the three months ended September 30, 2008 and $713 million in theyear-to-date period comprised of the following:
ConsumerLending
MortgageServices
Card and RetailServices
AutoFinance Canada Total
(in millions)
Three months ended September 30, 2008:Provision for credit losses(1). . . . . . . . . $ 22 $ 6 $ - $202 $ - $230Other income(2) . . . . . . . . . . . . . . . . . . 10 6 30 51 - 97
Lower of cost or fair valueadjustment . . . . . . . . . . . . . . . . . . . . $ 32 $12 $ 30 $253 $ - $327
Nine months ended September 30, 2008:Provision for credit losses(1). . . . . . . . . $ 52 $33 $128 $202 $ - $415Other income(2) . . . . . . . . . . . . . . . . . . 59 31 150 51 7 298
Lower of cost or fair valueadjustment . . . . . . . . . . . . . . . . . . . . $111 $64 $278 $253 $7 $713
(1) The portion of the lower of cost or fair value adjustment attributable to credit was recorded as a provision for credit losses. This wasdetermined by giving consideration to the impact of over-the-life credit loss estimates as compared to the existing credit loss reserves prior toour decision to transfer to receivables held for sale.
(2) Reflects the impact on value caused by current marketplace conditions including changes in interest rates and illiquidity.
17

Receivables Held for Sale – Originated with Intent to Sell:
As discussed more fully in Note 11, “Related Party Transactions,” during the second quarter of 2008, we launched anew program with HSBC Bank USA to originate and sell real estate secured receivables to the Federal Home LoanMortgage Corporation. These receivables are considered held for sale at the time of origination and are carried at thelower of cost or fair value. At September 30, 2008, we had $32 million of receivables held for sale under thisprogram.
Additionally, we continue to report as held for sale certain receivables of our Mortgage Services business andSolstice Capital Group Inc. (“Solstice”), a subsidiary of our Consumer Lending business, which were classified asheld for sale at the time of origination. Receivables held for sale in our Mortgage Services business totaled$55 million at September 30, 2008 and $71 million at December 31, 2007. Receivables held for sale related toSolstice totaled $26 million at September 30, 2008 and $9 million at December 31, 2007.
Purchased Receivable Portfolios:
In November 2006, we acquired $2.5 billion of real estate secured receivables from Champion Mortgage(“Champion”) a division of KeyBank, N.A. These acquired receivables were subject to the requirements ofStatement of Position 03-3, “Accounting for Certain Loans or Debt Securities Acquired in a Transfer” (“SOP 03-3”)to the extent there was evidence of deterioration of credit quality since origination and for which it was probable, atacquisition, that all contractually required payments would not be collected and that the associated line of credit hadbeen closed. The carrying amount of Champion real estate secured receivables subject to the requirements ofSOP 03-3 was $68 million at September 30, 2008 and $73 million at December 31, 2007 and is included in the realestate secured receivables in the table above. The outstanding contractual balance of these receivables was$78 million at September 30, 2008 and $92 million at December 31, 2007. At September 30, 2008, no credit lossreserve for the acquired Champion receivables subject to SOP 03-3 has been established as there has been nodecrease to the expected future cash flows since the acquisition. There was a reclassification to accretable yieldfrom non-accretable yield of $2 million during the quarter ended September 30, 2008. This reclassification fromnon-accretable difference represents an increase to the estimated cash flows to be collected on the underlyingChampion portfolio. There were no additions to accretable yield or reclassifications from non-accretable yieldduring the quarter ended September 30, 2007.
As part of our acquisition of Metris Companies Inc. (“Metris”) on December 1, 2005, we acquired $5.3 billion ofcredit card receivables which were also subject to the requirements of SOP 03-3. The carrying amount of the creditcard receivables acquired from Metris which were subject to SOP 03-3 was $60 million at September 30, 2008 and$105 million at December 31, 2007 and is included in the credit card receivables in the table above. The outstandingcontractual balance of these receivables was $92 million at September 30, 2008 and $159 million at December 31,2007. At September 30, 2008, no credit loss reserve for the acquired Metris receivables subject to SOP 03-3 hasbeen established as there has been no decrease to the expected future cash flows since the acquisition. There was areclassification to accretable yield from non-accretable difference of $3 million during the quarter ended Sep-tember 30, 2008. This reclassification from non-accretable difference represents an increase to the estimated cashflows to be collected on the underlying Metris portfolio. There was a reclassification to accretable yield from non-accretable yield of $5 million during the quarter ended September 30, 2007.
The following summarizes the accretable yield on Champion and Metris receivables at September 30, 2008 and2007:
Three months ended September 30, 2008 2007
(in millions)
Accretable yield beginning of period . . . . . . . . . . . . . . . . . . . . . . . . . . . . . . . . . . . . . . . . . . . . $(34) $(50)
Accretable yield amortized to interest income during the period . . . . . . . . . . . . . . . . . . . . . . . . 8 11
Reclassification from non-accretable difference . . . . . . . . . . . . . . . . . . . . . . . . . . . . . . . . . . . . . (5) (5)
Accretable yield at end of period . . . . . . . . . . . . . . . . . . . . . . . . . . . . . . . . . . . . . . . . . . . . . . . $(31) $(44)
18
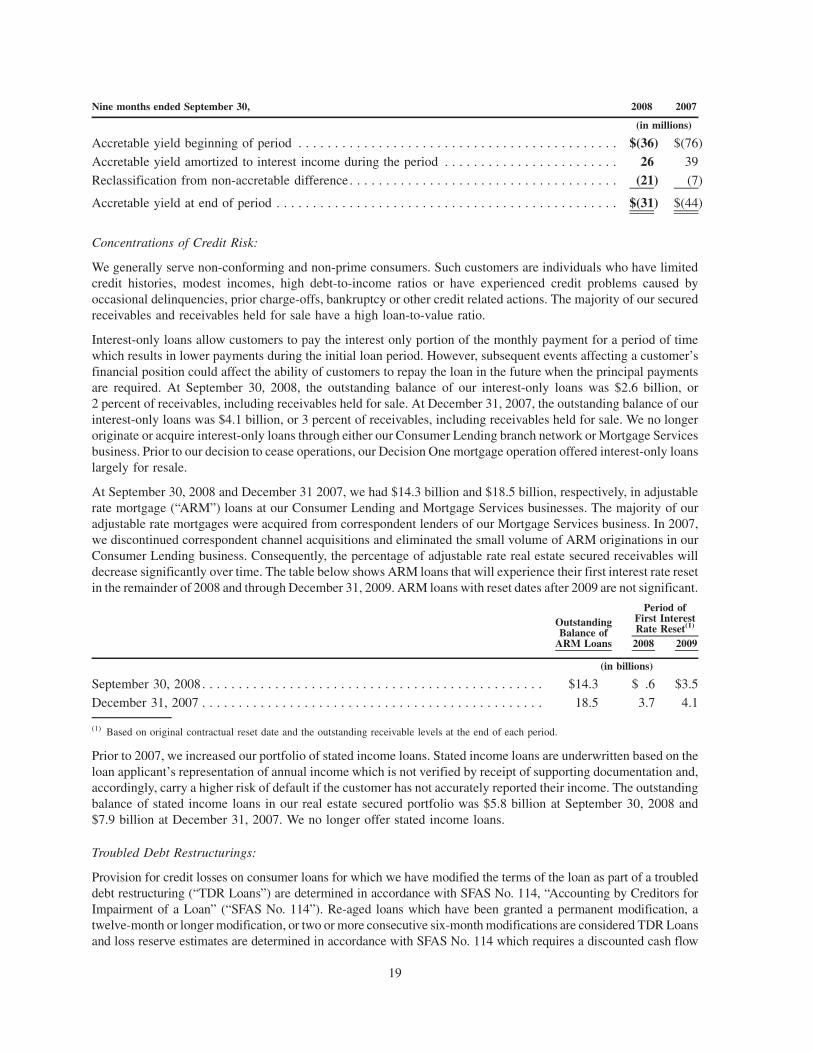
Nine months ended September 30, 2008 2007
(in millions)
Accretable yield beginning of period . . . . . . . . . . . . . . . . . . . . . . . . . . . . . . . . . . . . . . . . . . . . $(36) $(76)
Accretable yield amortized to interest income during the period . . . . . . . . . . . . . . . . . . . . . . . . 26 39
Reclassification from non-accretable difference . . . . . . . . . . . . . . . . . . . . . . . . . . . . . . . . . . . . . (21) (7)
Accretable yield at end of period . . . . . . . . . . . . . . . . . . . . . . . . . . . . . . . . . . . . . . . . . . . . . . . $(31) $(44)
Concentrations of Credit Risk:
We generally serve non-conforming and non-prime consumers. Such customers are individuals who have limitedcredit histories, modest incomes, high debt-to-income ratios or have experienced credit problems caused byoccasional delinquencies, prior charge-offs, bankruptcy or other credit related actions. The majority of our securedreceivables and receivables held for sale have a high loan-to-value ratio.
Interest-only loans allow customers to pay the interest only portion of the monthly payment for a period of timewhich results in lower payments during the initial loan period. However, subsequent events affecting a customer’sfinancial position could affect the ability of customers to repay the loan in the future when the principal paymentsare required. At September 30, 2008, the outstanding balance of our interest-only loans was $2.6 billion, or2 percent of receivables, including receivables held for sale. At December 31, 2007, the outstanding balance of ourinterest-only loans was $4.1 billion, or 3 percent of receivables, including receivables held for sale. We no longeroriginate or acquire interest-only loans through either our Consumer Lending branch network or Mortgage Servicesbusiness. Prior to our decision to cease operations, our Decision One mortgage operation offered interest-only loanslargely for resale.
At September 30, 2008 and December 31 2007, we had $14.3 billion and $18.5 billion, respectively, in adjustablerate mortgage (“ARM”) loans at our Consumer Lending and Mortgage Services businesses. The majority of ouradjustable rate mortgages were acquired from correspondent lenders of our Mortgage Services business. In 2007,we discontinued correspondent channel acquisitions and eliminated the small volume of ARM originations in ourConsumer Lending business. Consequently, the percentage of adjustable rate real estate secured receivables willdecrease significantly over time. The table below shows ARM loans that will experience their first interest rate resetin the remainder of 2008 and through December 31, 2009. ARM loans with reset dates after 2009 are not significant.
OutstandingBalance of
ARM Loans 2008 2009
Period ofFirst InterestRate Reset(1)
(in billions)
September 30, 2008. . . . . . . . . . . . . . . . . . . . . . . . . . . . . . . . . . . . . . . . . . . . . . . $14.3 $ .6 $3.5
December 31, 2007 . . . . . . . . . . . . . . . . . . . . . . . . . . . . . . . . . . . . . . . . . . . . . . . 18.5 3.7 4.1
(1) Based on original contractual reset date and the outstanding receivable levels at the end of each period.
Prior to 2007, we increased our portfolio of stated income loans. Stated income loans are underwritten based on theloan applicant’s representation of annual income which is not verified by receipt of supporting documentation and,accordingly, carry a higher risk of default if the customer has not accurately reported their income. The outstandingbalance of stated income loans in our real estate secured portfolio was $5.8 billion at September 30, 2008 and$7.9 billion at December 31, 2007. We no longer offer stated income loans.
Troubled Debt Restructurings:
Provision for credit losses on consumer loans for which we have modified the terms of the loan as part of a troubleddebt restructuring (“TDR Loans”) are determined in accordance with SFAS No. 114, “Accounting by Creditors forImpairment of a Loan” (“SFAS No. 114”). Re-aged loans which have been granted a permanent modification, atwelve-month or longer modification, or two or more consecutive six-month modifications are considered TDR Loansand loss reserve estimates are determined in accordance with SFAS No. 114 which requires a discounted cash flow
19

analysis to assess impairment. Interest income on TDR Loans is recognized in the same manner as loans which arenot TDRs. The following table presents information about our TDR Loans:
September 30,2008
December 31,2007
(in millions)
TDR Loans(1):Real estate secured:
Mortgage Services . . . . . . . . . . . . . . . . . . . . . . . . . . . . . . . . . . . . . . . . . . . . . $2,538 $1,531Consumer Lending . . . . . . . . . . . . . . . . . . . . . . . . . . . . . . . . . . . . . . . . . . . . . 1,513 730Canada and all other . . . . . . . . . . . . . . . . . . . . . . . . . . . . . . . . . . . . . . . . . . . 63 67
Total real estate secured . . . . . . . . . . . . . . . . . . . . . . . . . . . . . . . . . . . . . . . . . . . 4,114 2,328Auto finance . . . . . . . . . . . . . . . . . . . . . . . . . . . . . . . . . . . . . . . . . . . . . . . . . . . 166 144Credit card . . . . . . . . . . . . . . . . . . . . . . . . . . . . . . . . . . . . . . . . . . . . . . . . . . . . 398 329Private label . . . . . . . . . . . . . . . . . . . . . . . . . . . . . . . . . . . . . . . . . . . . . . . . . . . 7 5Personal non-credit card . . . . . . . . . . . . . . . . . . . . . . . . . . . . . . . . . . . . . . . . . . . 545 500
Total TDR Loans . . . . . . . . . . . . . . . . . . . . . . . . . . . . . . . . . . . . . . . . . . . . . . . . $5,230 $3,306
September 30,2008
December 31,2007
(in millions)
Credit loss reserves for TDR Loans:Real estate secured:
Mortgage Services . . . . . . . . . . . . . . . . . . . . . . . . . . . . . . . . . . . . . . . . . . . . . $267 $ 84Consumer Lending . . . . . . . . . . . . . . . . . . . . . . . . . . . . . . . . . . . . . . . . . . . . . 217 65Canada and all other . . . . . . . . . . . . . . . . . . . . . . . . . . . . . . . . . . . . . . . . . . . 14 9
Total real estate secured . . . . . . . . . . . . . . . . . . . . . . . . . . . . . . . . . . . . . . . . . . . 498 158Auto finance . . . . . . . . . . . . . . . . . . . . . . . . . . . . . . . . . . . . . . . . . . . . . . . . . . . 39 29Credit card . . . . . . . . . . . . . . . . . . . . . . . . . . . . . . . . . . . . . . . . . . . . . . . . . . . . 78 56Private label . . . . . . . . . . . . . . . . . . . . . . . . . . . . . . . . . . . . . . . . . . . . . . . . . . . 1 1Personal non-credit card . . . . . . . . . . . . . . . . . . . . . . . . . . . . . . . . . . . . . . . . . . . 103 88
Total credit loss reserves for TDR Loans(2) . . . . . . . . . . . . . . . . . . . . . . . . . . . . . $719 $332
Three months ended September 30, 2008 2007
(in millions)
Average balance of TDR Loans(1) . . . . . . . . . . . . . . . . . . . . . . . . . . . . . . . . . . . . . . . . . . . $4,948 $2,489Interest income recognized on TDR Loans(1) . . . . . . . . . . . . . . . . . . . . . . . . . . . . . . . . . . . 85 70
Nine months ended September 30, 2008 2007
(in millions)
Average balance of TDR Loans(1) . . . . . . . . . . . . . . . . . . . . . . . . . . . . . . . . . . . . . . . . . . . $4,287 $2,039
Interest income recognized on TDR Loans(1) . . . . . . . . . . . . . . . . . . . . . . . . . . . . . . . . . . . 207 91
(1) Includes TDR balances reported as receivables held for sale. As a result, the TDR loan balances above include $62 million of credit cardTDR loans held for sale for which there are no credit loss reserves as they are carried at lower of cost or fair value.
(2) Included in credit loss reserves.
20

7. Credit Loss Reserves
An analysis of credit loss reserves for continuing operations was as follows:
2008 2007 2008 2007
Three MonthsEnded September 30,
Nine MonthsEnded September 30,
(in millions)
Credit loss reserves at beginning of period . . . . . . . . . . . . . . . . . . $10,934 $ 6,808 $10,577 $ 6,366
Provision for credit losses. . . . . . . . . . . . . . . . . . . . . . . . . . . . . . . 3,821 3,134 9,944 6,480
Charge-offs . . . . . . . . . . . . . . . . . . . . . . . . . . . . . . . . . . . . . . . . . (2,857) (1,840) (8,360) (5,119)
Recoveries . . . . . . . . . . . . . . . . . . . . . . . . . . . . . . . . . . . . . . . . . . 179 181 575 566
Receivables transferred to held for sale . . . . . . . . . . . . . . . . . . . . . (249) - (894) -
Other, net . . . . . . . . . . . . . . . . . . . . . . . . . . . . . . . . . . . . . . . . . . (9) 11 (23) 1
Credit loss reserves at end of period . . . . . . . . . . . . . . . . . . . . . . . $11,819 $ 8,294 $11,819 $ 8,294
As discussed more fully in Note 6, “Receivables and Receivables Held for Sale,” $10.8 billion of receivables whichwere previously held for investment purposes are classified as receivables held for sale as of September 30, 2008.Credit loss reserves associated with the transfer of receivables to receivables held for sale of $249 million during thethree months ended September 30, 2008 and $894 million in the year-to-date period were transferred to receivablesheld for sale as part of the lower of cost or fair value adjustment.
Further analysis of credit quality and credit loss reserves and our credit loss reserve methodology are presented inItem 2, “Management’s Discussion and Analysis of Financial Condition and Results of Operations” of thisForm 10-Q under the caption “Credit Quality.”
8. Intangible Assets
Intangible assets consisted of the following:
Gross
HistoricalImpairment
ChargesAccumulatedAmortization
CarryingValue
(in millions)
September 30, 2008Purchased credit card relationships and related programs . . . . $1,736 $ - $ 820 $ 916Retail services merchant relationships . . . . . . . . . . . . . . . . . . 270 - 270 -
Other loan related relationships . . . . . . . . . . . . . . . . . . . . . . . 333 158 171 4Trade names . . . . . . . . . . . . . . . . . . . . . . . . . . . . . . . . . . . . . 700 700 - -
Technology, customer lists and other contracts . . . . . . . . . . . . 282 - 238 44
Total. . . . . . . . . . . . . . . . . . . . . . . . . . . . . . . . . . . . . . . . . . . $3,321 $858 $1,499 $ 964
December 31, 2007Purchased credit card relationships and related programs . . . . $1,736 $ - $ 717 $1,019
Retail services merchant relationships . . . . . . . . . . . . . . . . . . 270 - 257 13
Other loan related relationships . . . . . . . . . . . . . . . . . . . . . . . 333 158 169 6
Trade names . . . . . . . . . . . . . . . . . . . . . . . . . . . . . . . . . . . . . 700 700 - -
Technology, customer lists and other contracts . . . . . . . . . . . . 282 - 217 65
Total. . . . . . . . . . . . . . . . . . . . . . . . . . . . . . . . . . . . . . . . . . . $3,321 $858 $1,360 $1,103
21
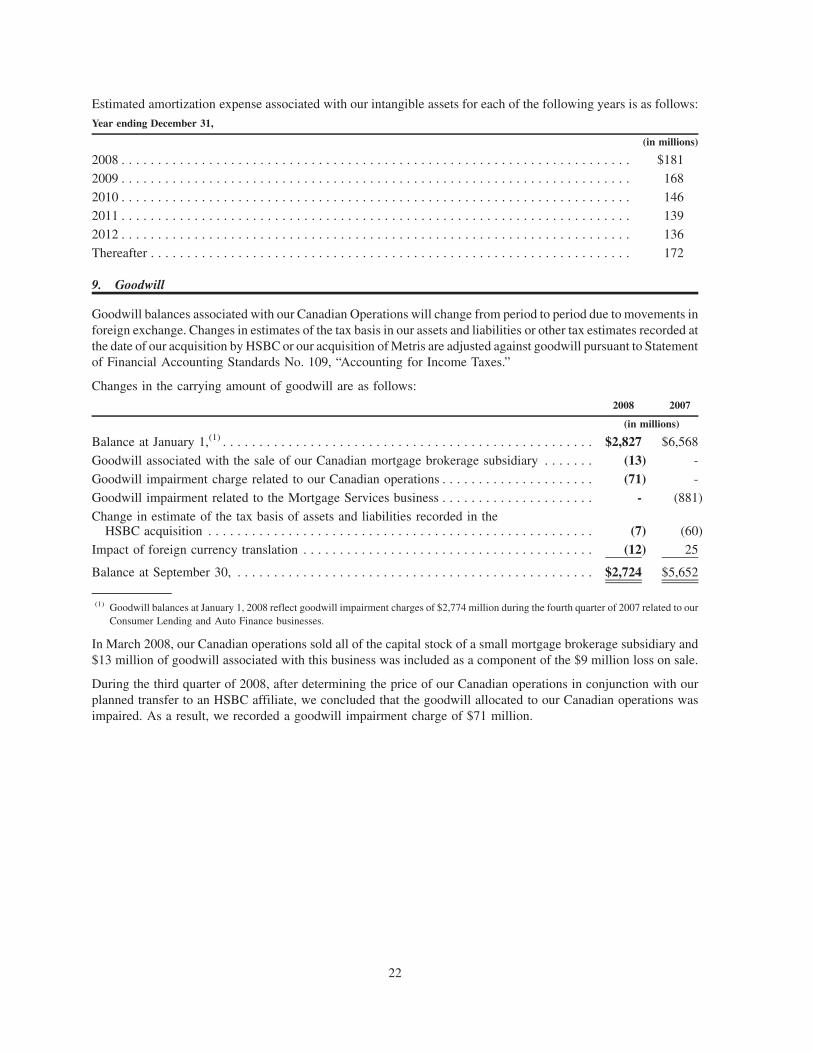
Estimated amortization expense associated with our intangible assets for each of the following years is as follows:
Year ending December 31,
(in millions)
2008 . . . . . . . . . . . . . . . . . . . . . . . . . . . . . . . . . . . . . . . . . . . . . . . . . . . . . . . . . . . . . . . . . . . . . . $181
2009 . . . . . . . . . . . . . . . . . . . . . . . . . . . . . . . . . . . . . . . . . . . . . . . . . . . . . . . . . . . . . . . . . . . . . . 168
2010 . . . . . . . . . . . . . . . . . . . . . . . . . . . . . . . . . . . . . . . . . . . . . . . . . . . . . . . . . . . . . . . . . . . . . . 146
2011 . . . . . . . . . . . . . . . . . . . . . . . . . . . . . . . . . . . . . . . . . . . . . . . . . . . . . . . . . . . . . . . . . . . . . . 139
2012 . . . . . . . . . . . . . . . . . . . . . . . . . . . . . . . . . . . . . . . . . . . . . . . . . . . . . . . . . . . . . . . . . . . . . . 136
Thereafter . . . . . . . . . . . . . . . . . . . . . . . . . . . . . . . . . . . . . . . . . . . . . . . . . . . . . . . . . . . . . . . . . . 172
9. Goodwill
Goodwill balances associated with our Canadian Operations will change from period to period due to movements inforeign exchange. Changes in estimates of the tax basis in our assets and liabilities or other tax estimates recorded atthe date of our acquisition by HSBC or our acquisition of Metris are adjusted against goodwill pursuant to Statementof Financial Accounting Standards No. 109, “Accounting for Income Taxes.”
Changes in the carrying amount of goodwill are as follows:
2008 2007
(in millions)
Balance at January 1,(1) . . . . . . . . . . . . . . . . . . . . . . . . . . . . . . . . . . . . . . . . . . . . . . . . . . . $2,827 $6,568
Goodwill associated with the sale of our Canadian mortgage brokerage subsidiary . . . . . . . (13) -
Goodwill impairment charge related to our Canadian operations . . . . . . . . . . . . . . . . . . . . . (71) -
Goodwill impairment related to the Mortgage Services business . . . . . . . . . . . . . . . . . . . . . - (881)
Change in estimate of the tax basis of assets and liabilities recorded in theHSBC acquisition . . . . . . . . . . . . . . . . . . . . . . . . . . . . . . . . . . . . . . . . . . . . . . . . . . . . . (7) (60)
Impact of foreign currency translation . . . . . . . . . . . . . . . . . . . . . . . . . . . . . . . . . . . . . . . . (12) 25
Balance at September 30, . . . . . . . . . . . . . . . . . . . . . . . . . . . . . . . . . . . . . . . . . . . . . . . . . $2,724 $5,652
(1) Goodwill balances at January 1, 2008 reflect goodwill impairment charges of $2,774 million during the fourth quarter of 2007 related to ourConsumer Lending and Auto Finance businesses.
In March 2008, our Canadian operations sold all of the capital stock of a small mortgage brokerage subsidiary and$13 million of goodwill associated with this business was included as a component of the $9 million loss on sale.
During the third quarter of 2008, after determining the price of our Canadian operations in conjunction with ourplanned transfer to an HSBC affiliate, we concluded that the goodwill allocated to our Canadian operations wasimpaired. As a result, we recorded a goodwill impairment charge of $71 million.
22
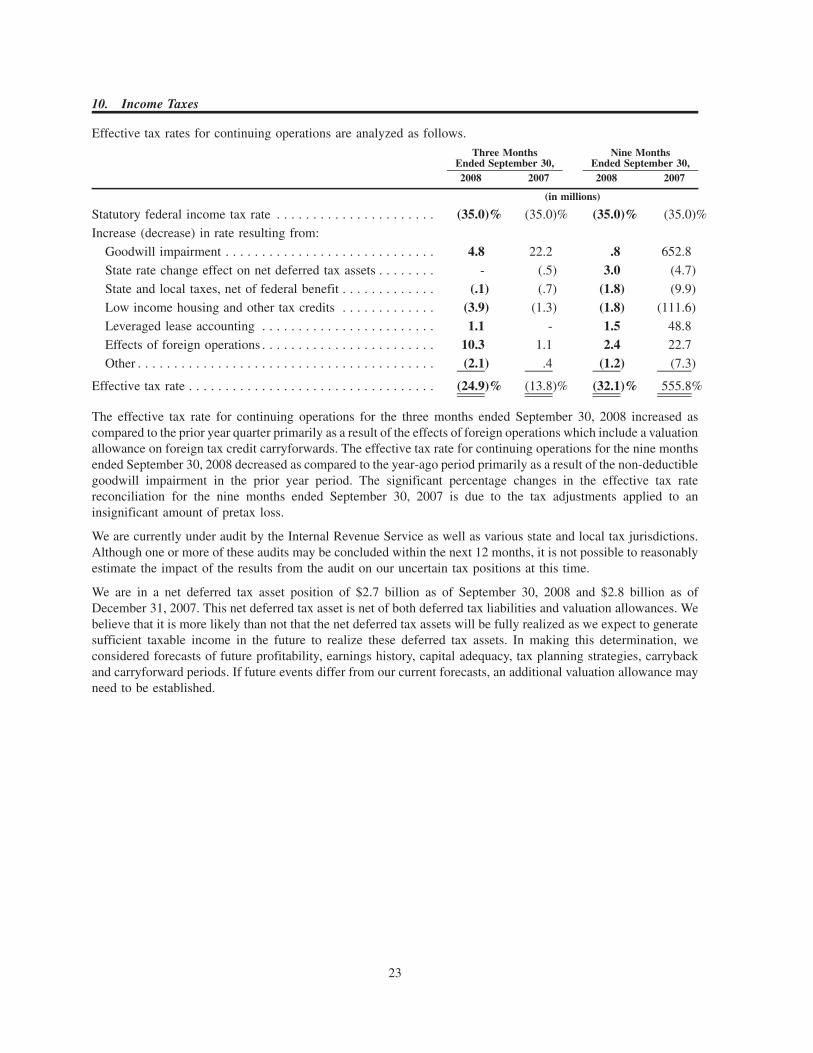
10. Income Taxes
Effective tax rates for continuing operations are analyzed as follows.
2008 2007 2008 2007
Three MonthsEnded September 30,
Nine MonthsEnded September 30,
(in millions)
Statutory federal income tax rate . . . . . . . . . . . . . . . . . . . . . . (35.0)% (35.0)% (35.0)% (35.0)%
Increase (decrease) in rate resulting from:
Goodwill impairment . . . . . . . . . . . . . . . . . . . . . . . . . . . . . 4.8 22.2 .8 652.8
State rate change effect on net deferred tax assets . . . . . . . . - (.5) 3.0 (4.7)
State and local taxes, net of federal benefit . . . . . . . . . . . . . (.1) (.7) (1.8) (9.9)
Low income housing and other tax credits . . . . . . . . . . . . . (3.9) (1.3) (1.8) (111.6)
Leveraged lease accounting . . . . . . . . . . . . . . . . . . . . . . . . 1.1 - 1.5 48.8
Effects of foreign operations . . . . . . . . . . . . . . . . . . . . . . . . 10.3 1.1 2.4 22.7
Other . . . . . . . . . . . . . . . . . . . . . . . . . . . . . . . . . . . . . . . . . (2.1) .4 (1.2) (7.3)
Effective tax rate . . . . . . . . . . . . . . . . . . . . . . . . . . . . . . . . . . (24.9)% (13.8)% (32.1)% 555.8%
The effective tax rate for continuing operations for the three months ended September 30, 2008 increased ascompared to the prior year quarter primarily as a result of the effects of foreign operations which include a valuationallowance on foreign tax credit carryforwards. The effective tax rate for continuing operations for the nine monthsended September 30, 2008 decreased as compared to the year-ago period primarily as a result of the non-deductiblegoodwill impairment in the prior year period. The significant percentage changes in the effective tax ratereconciliation for the nine months ended September 30, 2007 is due to the tax adjustments applied to aninsignificant amount of pretax loss.
We are currently under audit by the Internal Revenue Service as well as various state and local tax jurisdictions.Although one or more of these audits may be concluded within the next 12 months, it is not possible to reasonablyestimate the impact of the results from the audit on our uncertain tax positions at this time.
We are in a net deferred tax asset position of $2.7 billion as of September 30, 2008 and $2.8 billion as ofDecember 31, 2007. This net deferred tax asset is net of both deferred tax liabilities and valuation allowances. Webelieve that it is more likely than not that the net deferred tax assets will be fully realized as we expect to generatesufficient taxable income in the future to realize these deferred tax assets. In making this determination, weconsidered forecasts of future profitability, earnings history, capital adequacy, tax planning strategies, carrybackand carryforward periods. If future events differ from our current forecasts, an additional valuation allowance mayneed to be established.
23

11. Related Party Transactions
In the normal course of business, we conduct transactions with HSBC and its subsidiaries. These transactions occurat prevailing market rates and terms and include funding arrangements, derivative execution, purchases and sales ofreceivables, servicing arrangements, information technology services, item and statement processing services,banking and other miscellaneous services. The following tables present related party balances and the income and(expense) generated by related party transactions:
September 30,2008
December 31,2007
(in millions)
Assets and (Liabilities):Cash . . . . . . . . . . . . . . . . . . . . . . . . . . . . . . . . . . . . . . . . . . . . . . . . . . . . . . . . . $ 486 $ 475Securities. . . . . . . . . . . . . . . . . . . . . . . . . . . . . . . . . . . . . . . . . . . . . . . . . . . . . . 62 -Securities purchased under agreements to resell . . . . . . . . . . . . . . . . . . . . . . . . . 600 415Derivative financial assets (liability), net . . . . . . . . . . . . . . . . . . . . . . . . . . . . . . . (811) 34Affiliate preferred stock received in sale of U.K. credit card business(1) . . . . . . . . 270 301Other assets . . . . . . . . . . . . . . . . . . . . . . . . . . . . . . . . . . . . . . . . . . . . . . . . . . . . 289 634Due to affiliates . . . . . . . . . . . . . . . . . . . . . . . . . . . . . . . . . . . . . . . . . . . . . . . . . (12,346) (11,359)Other liabilities . . . . . . . . . . . . . . . . . . . . . . . . . . . . . . . . . . . . . . . . . . . . . . . . . (104) (471)
2008 2007 2008 2007
Three MonthsEnded
September 30,
Nine MonthsEnded
September 30,
(in millions)
Income/(Expense):Interest expense – HSBC affiliates . . . . . . . . . . . . . . . . . . . . . . . . . . . . . . $(250) $(192) $(773) $(566)Interest income from HSBC affiliates . . . . . . . . . . . . . . . . . . . . . . . . . . . . 4 11 30 30HSBC affiliate income:
Gain (loss) on receivable sales to HSBC affiliates:Daily sales of domestic private label receivable originations . . . . . . . . 26 79 89 242Daily sales of credit card receivables . . . . . . . . . . . . . . . . . . . . . . . . . 38 31 97 72Sales of real estate secured receivables . . . . . . . . . . . . . . . . . . . . . . . 2 (16) 2 (16)
Servicing and other fees from HSBC affiliates:HSBC Bank USA, National Association (“HSBC Bank USA”):
Real estate secured servicing, sourcing, underwriting and pricingrevenue . . . . . . . . . . . . . . . . . . . . . . . . . . . . . . . . . . . . . . . . . . . 1 3 5 7
Domestic private label and card receivable servicing and relatedfees . . . . . . . . . . . . . . . . . . . . . . . . . . . . . . . . . . . . . . . . . . . . . . 105 104 323 310
Other servicing, processing, origination and support revenues . . . . . 12 11 32 36HSBC Technology and Services (USA) Inc. (“HTSU”) . . . . . . . . . . . 4 4 12 10Other HSBC affiliates . . . . . . . . . . . . . . . . . . . . . . . . . . . . . . . . . . . . 3 4 9 11
Taxpayer financial services loan origination and other fees . . . . . . . . . . . . - - (13) (19)Support services from HSBC affiliates:
HTSU . . . . . . . . . . . . . . . . . . . . . . . . . . . . . . . . . . . . . . . . . . . . . . . . . (198) (240) (615) (706)HSBC Global Resourcing (UK) Ltd. . . . . . . . . . . . . . . . . . . . . . . . . . . (43) (35) (129) (108)Other HSBC affiliates . . . . . . . . . . . . . . . . . . . . . . . . . . . . . . . . . . . . . . (15) (13) (46) (34)
Stock based compensation expense with HSBC . . . . . . . . . . . . . . . . . . . . . (15) (25) (48) (85)
(1) Balance may fluctuate between periods due to foreign currency exchange rate impact.
24
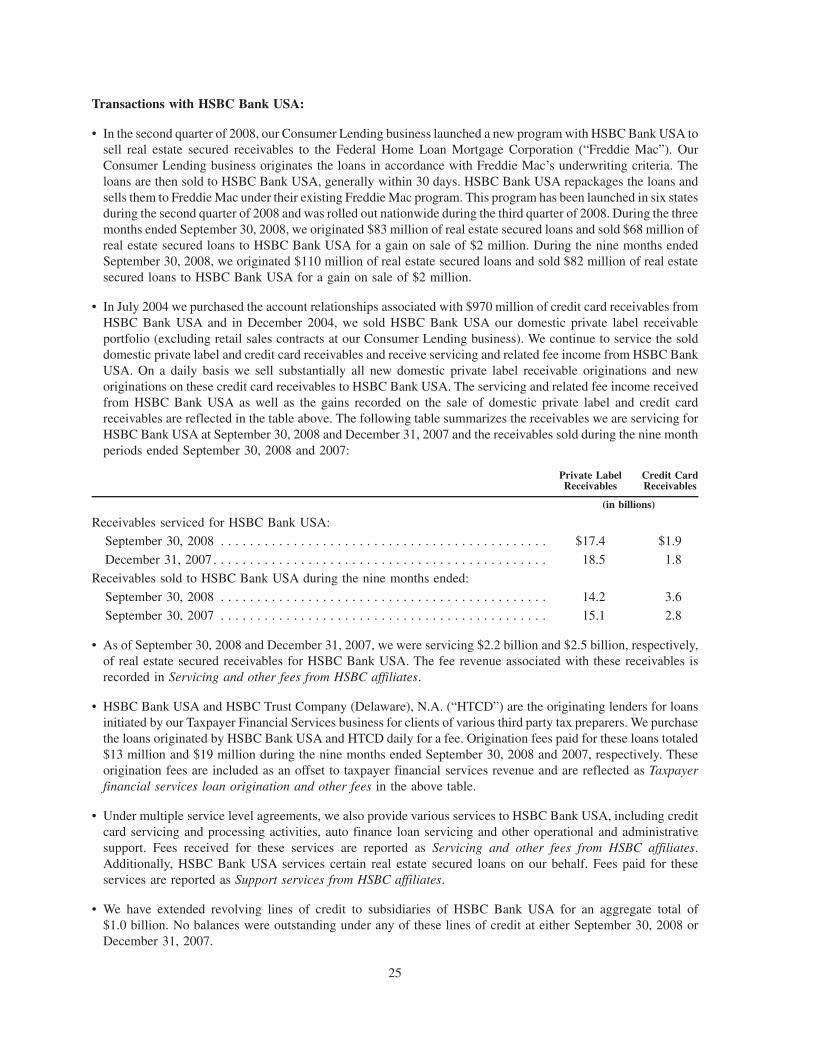
Transactions with HSBC Bank USA:
• In the second quarter of 2008, our Consumer Lending business launched a new program with HSBC Bank USA tosell real estate secured receivables to the Federal Home Loan Mortgage Corporation (“Freddie Mac”). OurConsumer Lending business originates the loans in accordance with Freddie Mac’s underwriting criteria. Theloans are then sold to HSBC Bank USA, generally within 30 days. HSBC Bank USA repackages the loans andsells them to Freddie Mac under their existing Freddie Mac program. This program has been launched in six statesduring the second quarter of 2008 and was rolled out nationwide during the third quarter of 2008. During the threemonths ended September 30, 2008, we originated $83 million of real estate secured loans and sold $68 million ofreal estate secured loans to HSBC Bank USA for a gain on sale of $2 million. During the nine months endedSeptember 30, 2008, we originated $110 million of real estate secured loans and sold $82 million of real estatesecured loans to HSBC Bank USA for a gain on sale of $2 million.
• In July 2004 we purchased the account relationships associated with $970 million of credit card receivables fromHSBC Bank USA and in December 2004, we sold HSBC Bank USA our domestic private label receivableportfolio (excluding retail sales contracts at our Consumer Lending business). We continue to service the solddomestic private label and credit card receivables and receive servicing and related fee income from HSBC BankUSA. On a daily basis we sell substantially all new domestic private label receivable originations and neworiginations on these credit card receivables to HSBC Bank USA. The servicing and related fee income receivedfrom HSBC Bank USA as well as the gains recorded on the sale of domestic private label and credit cardreceivables are reflected in the table above. The following table summarizes the receivables we are servicing forHSBC Bank USA at September 30, 2008 and December 31, 2007 and the receivables sold during the nine monthperiods ended September 30, 2008 and 2007:
Private LabelReceivables
Credit CardReceivables
(in billions)
Receivables serviced for HSBC Bank USA:September 30, 2008 . . . . . . . . . . . . . . . . . . . . . . . . . . . . . . . . . . . . . . . . . . . . . $17.4 $1.9
December 31, 2007 . . . . . . . . . . . . . . . . . . . . . . . . . . . . . . . . . . . . . . . . . . . . . . 18.5 1.8
Receivables sold to HSBC Bank USA during the nine months ended:
September 30, 2008 . . . . . . . . . . . . . . . . . . . . . . . . . . . . . . . . . . . . . . . . . . . . . 14.2 3.6
September 30, 2007 . . . . . . . . . . . . . . . . . . . . . . . . . . . . . . . . . . . . . . . . . . . . . 15.1 2.8
• As of September 30, 2008 and December 31, 2007, we were servicing $2.2 billion and $2.5 billion, respectively,of real estate secured receivables for HSBC Bank USA. The fee revenue associated with these receivables isrecorded in Servicing and other fees from HSBC affiliates.
• HSBC Bank USA and HSBC Trust Company (Delaware), N.A. (“HTCD”) are the originating lenders for loansinitiated by our Taxpayer Financial Services business for clients of various third party tax preparers. We purchasethe loans originated by HSBC Bank USA and HTCD daily for a fee. Origination fees paid for these loans totaled$13 million and $19 million during the nine months ended September 30, 2008 and 2007, respectively. Theseorigination fees are included as an offset to taxpayer financial services revenue and are reflected as Taxpayerfinancial services loan origination and other fees in the above table.
• Under multiple service level agreements, we also provide various services to HSBC Bank USA, including creditcard servicing and processing activities, auto finance loan servicing and other operational and administrativesupport. Fees received for these services are reported as Servicing and other fees from HSBC affiliates.Additionally, HSBC Bank USA services certain real estate secured loans on our behalf. Fees paid for theseservices are reported as Support services from HSBC affiliates.
• We have extended revolving lines of credit to subsidiaries of HSBC Bank USA for an aggregate total of$1.0 billion. No balances were outstanding under any of these lines of credit at either September 30, 2008 orDecember 31, 2007.
25

• In the nine months ended September 30, 2007, we sold approximately $646 million of real estate securedreceivables originated by our subsidiary, Decision One, to HSBC Bank USA and recorded a pre-tax loss on thesesales of $16 million.
Transactions with HSBC Holdings plc:
• At September 30, 2008 and December 31, 2007, a commercial paper back-stop credit facility of $2.5 billion fromHSBC supported our domestic issuances of commercial paper. No balances were outstanding under this creditfacility at September 30, 2008 and December 31, 2007. The annual commitment fee requirement to supportavailability of this line is included as a component of Interest expense – HSBC affiliates.
• During 2003, Household Capital Trust VIII issued $275 million in mandatorily redeemable preferred securities toHSBC. Interest expense recorded on the underlying junior subordinated notes totaled $4 million during the threemonths ended September 30, 2008 and 2007 and $13 million during the nine months ended September 30, 2008and 2007. This interest expense is included in Interest expense – HSBC affiliates in the consolidated statement ofincome.
• Employees of HSBC Finance Corporation participate in one or more stock compensation plans sponsored byHSBC. These expenses are recorded in Salary and employee benefits and are reflected in the above table as Stockbased compensation expense with HSBC.
Transactions with HTSU:
• We had extended a revolving line of credit to HTSU which was terminated in May 2008 and replaced by a line ofcredit from an affiliate. The balance outstanding under this line of credit was $.6 billion at December 31, 2007 andwas included in other assets. Interest income associated with this line of credit was recorded in interest incomeand reflected as Interest income from HSBC affiliates in the table above.
• Technology services in North America are centralized within HTSU. Technology related assets and softwarepurchased subsequent to January 1, 2004 are generally purchased and owned by HTSU. HTSU also providescertain item processing and statement processing activities which are included in Support services from HSBCaffiliates. We also receive revenue from HTSU for rent on certain office space, which has been recorded as areduction of occupancy and equipment expenses, and for certain administrative costs, which has been recorded asa component of servicing and other fees from HSBC affiliates. Rental revenue from HTSU recorded as areduction of occupancy and equipment expense was $12 million during both the three months ended Septem-ber 30, 2008 and the year-ago quarter. During both the nine months ended September 30, 2008 and the year-agoperiod, rental revenue from HTSU was $36 million.
Transactions with HSBC Bank plc (“HBEU”):
• We had a revolving credit facility from HBEU to fund our operations in the U.K. of $5.7 billion at December 31,2007. Upon the sale of our U.K. Operations, this credit facility was assumed by HOHU. At December 31, 2007,$3.5 billion was outstanding under the HBEU lines for the U.K. which is now reported in Liabilities ofdiscontinued operations. Annual commitment fee requirements to support availability of these lines is included asa component of Loss from discontinued U.K. operations.
• In September 2008, we borrowed $1 billion from an existing uncommitted credit facility with HBEU. Theborrowing is for 60 days and matures in November 2008. We may request renewal of this borrowing for anadditional period of time at its current maturity in November 2008.
• Technology services in the United Kingdom are centralized within a subsidiary of HBEU. Operating expensesrelating to information technology which were billed to us by HBEU prior to the sale of our U.K. Operations toHOHU in May 2008 are included as a component of Loss from discontinued U.K. operations.
• In December 2005, we sold our U.K. credit card business, including $2.5 billion of receivables, the associatedcardholder relationships and the related retained interests in securitized credit card receivables to HBEU for anaggregate purchase price of $3.0 billion. We retained the collection operations related to the credit card operationsand entered into a service level agreement to provide collection services and other support services, includingcomponents of the compliance, financial reporting and human resource functions, for the sold credit card
26

operations to HBEU for a fee. We received $10 million during 2008 under this service level agreement which isincluded as a component of Loss from discontinued U.K. operations. We received $8 million and $24 millionduring the three and nine months ended September 30, 2007, respectively, under this service level agreementwhich is included as a component of Loss from discontinued U.K. operations. This service level agreement wastransferred to HOHU as a result of the sale of our U.K. Operations.
Transactions with other HSBC affiliates:
• As previously discussed in Note 2, “Discontinued Operations,” in May 2008 we sold all of the common stock ofthe holding company of our U.K. Operations to HOHU for GBP 181 million (equivalent to $359 million in May2008). Because this sale was between affiliates under common control, the book value of the investment in ourU.K. Operations in excess of the consideration received which totaled $576 million was recorded as a decrease tocommon shareholder’s equity. Of this amount, $196 million was reflected as a decrease to additional paid incapital and $380 million was reflected as a decrease to foreign currency translation adjustments within othercomprehensive income.
• The notional value of derivative contracts outstanding with HSBC subsidiaries totaled $83.7 billion at September 30,2008 and $90.4 billion at December 31, 2007. When the fair value of our agreements with affiliate counterpartiesrequires the posting of collateral, it is provided in either the form of cash and recorded on the balance sheet or in theform of securities which are not recorded on our balance sheet. At September 30, 2008, the fair value of ouragreements with affiliate counterparties required the affiliate to provide collateral of $3.5 billion which was receivedin cash and offset against the fair value amount recognized for derivative instruments that have been offset under thesame master netting arrangement in accordance with FASB Staff Position No. FIN 39-1, “Amendment of FASBInterpretation No. 39,” (“FSP 39-1”) and recorded in our balance sheet as a reduction of derivative related assets. AtDecember 31, 2007, the fair value of our agreements with affiliate counterparties required the affiliate to providecollateral of $3.8 billion which was received in cash and offset against the fair value amount recognized forderivative instruments in accordance with FSP 39-1. No collateral was provided in the form of securities atSeptember 30, 2008 or December 31, 2007.
• Due to affiliates includes amounts owed to subsidiaries of HSBC as a result of direct debt issuances (other thanpreferred stock).
• We purchase from HSBC Securities (USA) Inc. (“HSI”) securities under agreement to resell. Interest incomerecognized on these securities totaled $4 million during the three months ended September 30, 2008 and$15 million during the nine months ended September 30, 2008 and is reflected as Interest income from HSBCaffiliates in the table above. Interest income recognized on these securities totaled $3 million during the threemonths ended September 30, 2007 and $6 million during the nine months ended September 30, 2007.
• During the second quarter of 2008 we extended a revolving line of credit of $.4 billion to HSI. This line of creditwas terminated in September 2008 and replaced by a line of credit from another affiliate.
• We use an HSBC affiliate located outside of the United States to provide various support services to ouroperations including among other areas, customer service, systems, collection and accounting functions. Theexpenses related to these services are included as a component of Support services from HSBC affiliates in thetable above.
• Support services from HSBC affiliates also includes banking services and other miscellaneous services providedby other subsidiaries of HSBC, including HSBC Bank USA.
• Through August 2008, our Canadian business originated and serviced auto loans for an HSBC affiliate in Canada.Fees received for these services are included in other income and are reflected in Servicing and other fees fromother HSBC affiliates in the above table.
• We utilize HSBC Markets (USA) Inc., an affiliated HSBC entity, to lead manage the underwriting of a majority ofour ongoing debt issuances. There were no fees paid to the affiliate for such services during the three and ninemonths ended September 30, 2008. During the three and nine months ended September 30, 2007, we paid fees tothe affiliate for such services of $1 million and $12 million, respectively. For debt not accounted for under the fairvalue option, these fees are amortized over the life of the related debt.
27

• In the second quarter of 2007, we sold $2.2 billion of loans from the Mortgage Services portfolio to third parties.HSBC Markets (USA) Inc., an affiliated HSBC entity, assisted in the transaction by placing the loans withinterested third parties. Fees paid for these services totaled $4 million and were included as a component of theapproximately $20 million loss realized on the sale of this loan portfolio.
• Domestic employees of HSBC Finance Corporation participate in a defined benefit pension plan and other post-retirement benefit plans sponsored by HSBC North America. See Note 12, “Pension and Other PostretirementBenefits,” for additional information on this pension plan.
12. Pension and Other Postretirement Benefits
The components of pension expense for the domestic defined benefit pension plan reflected in our consolidatedstatement of income are shown in the table below and reflect the portion of the pension expense of the combinedHSBC North America pension plan which has been allocated to HSBC Finance Corporation:
2008 2007 2008 2007
Three MonthsEnded
September 30,
Nine MonthsEnded
September 30,
(in millions)
Service cost – benefits earned during the period . . . . . . . . . . . . . . . . . . . . . . . . $ 13 $ 12 $ 43 $ 38
Interest cost. . . . . . . . . . . . . . . . . . . . . . . . . . . . . . . . . . . . . . . . . . . . . . . . . . . 19 17 55 49
Expected return on assets. . . . . . . . . . . . . . . . . . . . . . . . . . . . . . . . . . . . . . . . . (22) (21) (64) (63)
Recognized losses . . . . . . . . . . . . . . . . . . . . . . . . . . . . . . . . . . . . . . . . . . . . . . 1 2 1 4
(Gains) losses on curtailment . . . . . . . . . . . . . . . . . . . . . . . . . . . . . . . . . . . . . . - - - -
Net periodic benefit cost . . . . . . . . . . . . . . . . . . . . . . . . . . . . . . . . . . . . . . . . . $ 11 $ 10 $ 35 $ 28
We sponsor additional defined benefit pension plans for our Canadian based employees. Pension expense for ourCanadian defined benefit pension plans which is included in continuing operations was $.7 million and $2.1 million,respectively for the three and nine months ended September 30, 2008. Pension expense for our Canadian definedbenefit pension plans was $.6 million and $1.8 million, respectively, for the three and nine months endedSeptember 30, 2007.
Components of the net periodic benefit cost for our postretirement benefits other than pensions are as follows:
2008 2007 2008 2007
Three MonthsEnded
September 30,
Nine MonthsEnded
September 30,
(in millions)
Service cost – benefits earned during the period . . . . . . . . . . . . . . . . . . . . . $1 $ 2 $ 3 $ 4
Interest cost . . . . . . . . . . . . . . . . . . . . . . . . . . . . . . . . . . . . . . . . . . . . . . . . 2 3 10 10
Expected return on assets . . . . . . . . . . . . . . . . . . . . . . . . . . . . . . . . . . . . . . - - - -
Recognized (gains) losses. . . . . . . . . . . . . . . . . . . . . . . . . . . . . . . . . . . . . . - (1) (2) (1)
(Gains) losses on curtailment . . . . . . . . . . . . . . . . . . . . . . . . . . . . . . . . . . . - - (4) -
Net periodic benefit cost . . . . . . . . . . . . . . . . . . . . . . . . . . . . . . . . . . . . . . $3 $ 4 $ 7 $13
13. Business Segments
Through 2007, we reported the results of operations in three business segments: Consumer, Credit Card Servicesand International. In May 2007, we decided to integrate our Retail Services business, which had historically beenincluded in the Consumer Segment, into our Credit Card Services business. In the first quarter of 2008, wecompleted the integration of management reporting for our Credit Card Services and Retail Services business which
28
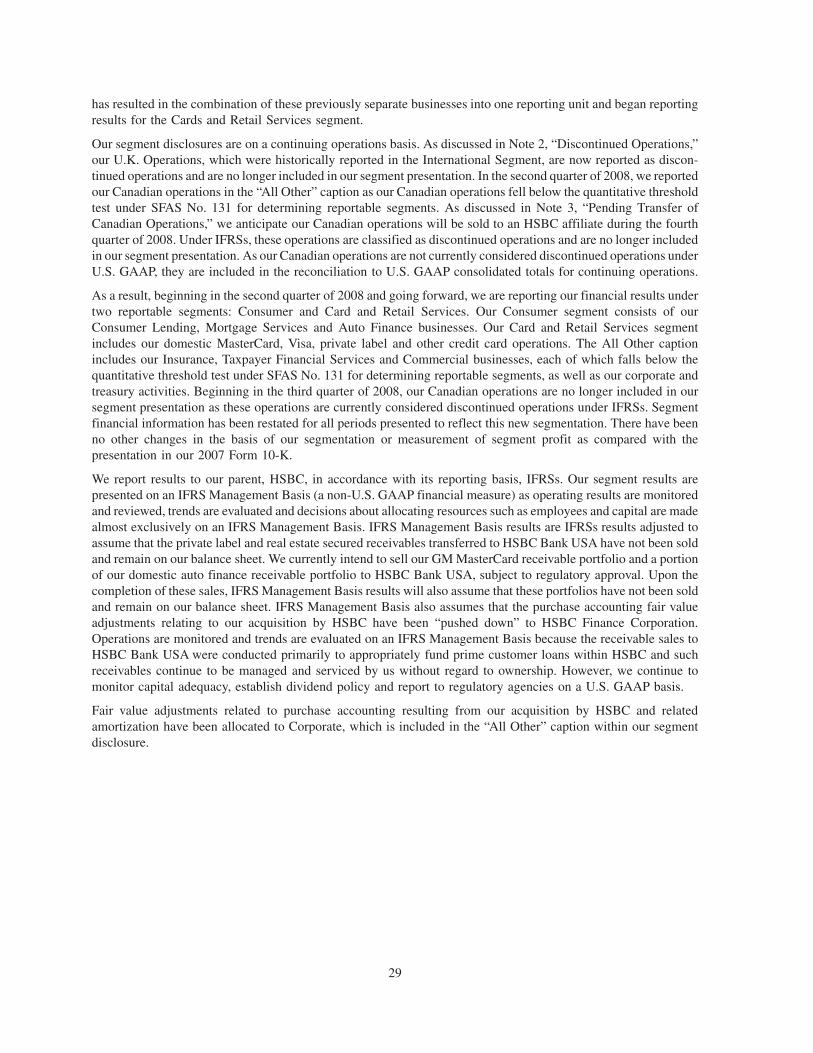
has resulted in the combination of these previously separate businesses into one reporting unit and began reportingresults for the Cards and Retail Services segment.
Our segment disclosures are on a continuing operations basis. As discussed in Note 2, “Discontinued Operations,”our U.K. Operations, which were historically reported in the International Segment, are now reported as discon-tinued operations and are no longer included in our segment presentation. In the second quarter of 2008, we reportedour Canadian operations in the “All Other” caption as our Canadian operations fell below the quantitative thresholdtest under SFAS No. 131 for determining reportable segments. As discussed in Note 3, “Pending Transfer ofCanadian Operations,” we anticipate our Canadian operations will be sold to an HSBC affiliate during the fourthquarter of 2008. Under IFRSs, these operations are classified as discontinued operations and are no longer includedin our segment presentation. As our Canadian operations are not currently considered discontinued operations underU.S. GAAP, they are included in the reconciliation to U.S. GAAP consolidated totals for continuing operations.
As a result, beginning in the second quarter of 2008 and going forward, we are reporting our financial results undertwo reportable segments: Consumer and Card and Retail Services. Our Consumer segment consists of ourConsumer Lending, Mortgage Services and Auto Finance businesses. Our Card and Retail Services segmentincludes our domestic MasterCard, Visa, private label and other credit card operations. The All Other captionincludes our Insurance, Taxpayer Financial Services and Commercial businesses, each of which falls below thequantitative threshold test under SFAS No. 131 for determining reportable segments, as well as our corporate andtreasury activities. Beginning in the third quarter of 2008, our Canadian operations are no longer included in oursegment presentation as these operations are currently considered discontinued operations under IFRSs. Segmentfinancial information has been restated for all periods presented to reflect this new segmentation. There have beenno other changes in the basis of our segmentation or measurement of segment profit as compared with thepresentation in our 2007 Form 10-K.
We report results to our parent, HSBC, in accordance with its reporting basis, IFRSs. Our segment results arepresented on an IFRS Management Basis (a non-U.S. GAAP financial measure) as operating results are monitoredand reviewed, trends are evaluated and decisions about allocating resources such as employees and capital are madealmost exclusively on an IFRS Management Basis. IFRS Management Basis results are IFRSs results adjusted toassume that the private label and real estate secured receivables transferred to HSBC Bank USA have not been soldand remain on our balance sheet. We currently intend to sell our GM MasterCard receivable portfolio and a portionof our domestic auto finance receivable portfolio to HSBC Bank USA, subject to regulatory approval. Upon thecompletion of these sales, IFRS Management Basis results will also assume that these portfolios have not been soldand remain on our balance sheet. IFRS Management Basis also assumes that the purchase accounting fair valueadjustments relating to our acquisition by HSBC have been “pushed down” to HSBC Finance Corporation.Operations are monitored and trends are evaluated on an IFRS Management Basis because the receivable sales toHSBC Bank USA were conducted primarily to appropriately fund prime customer loans within HSBC and suchreceivables continue to be managed and serviced by us without regard to ownership. However, we continue tomonitor capital adequacy, establish dividend policy and report to regulatory agencies on a U.S. GAAP basis.
Fair value adjustments related to purchase accounting resulting from our acquisition by HSBC and relatedamortization have been allocated to Corporate, which is included in the “All Other” caption within our segmentdisclosure.
29

Reconciliation of our IFRS Management Basis segment results to the U.S. GAAP consolidated totals are as follows:
Consumer
Cardand
RetailServices
AllOther
Adjustments/Reconciling
Items
IFRSManagement
BasisContinuingOperation
Totals
ManagementBasis
Adjustments(4)IFRS
Adjustments(5)
IFRSReclass-
ifications(6)
U.S. GAAPContinuingOperation
Totals(in millions)
Three months ended September 30, 2008:Net interest income . . . . . . . . . . . . . . . . $ 1,356 $ 1,263 $ 130 $ - $ 2,749 $ (356) $ (171) $ 88 $ 2,310Other operating income (Total other
revenues) . . . . . . . . . . . . . . . . . . . . . (13) 807 1,668 (68)(1) 2,394 (21) 63 110 2,546Loan impairment charges (Provision for
credit losses) . . . . . . . . . . . . . . . . . . 2,678 1,491 23 - 4,192 (438) 28 39 3,821Operating expenses (Total costs and
expenses) . . . . . . . . . . . . . . . . . . . . 491 525 130 - 1,146 14 89 147 1,396Profit (loss) before tax . . . . . . . . . . . . . . (1,826) 54 1,645 (68) (195) 47 (225) 12 (361)Income (loss) from continuing operations . . (1,167) 30 1,020 (43) (160) 33 (151) 7 (271)Customer loans (Receivables) . . . . . . . . . . 104,210 46,506 109 - 150,825 (29,879) (454) 2,260 122,752Assets . . . . . . . . . . . . . . . . . . . . . . . . 99,168 44,230 25,293 (8,142)(3) 160,549 (19,151) (5,042) 4,777 141,133Intersegment revenues . . . . . . . . . . . . . . 59 4 5 (68)(1) - - - - -
Three months ended September 30, 2007:Net interest income . . . . . . . . . . . . . . . . $ 1,750 $ 1,296 $ (188) $ - $ 2,858 $ (398) $ 43 $ 96 $ 2,599Other operating income (Total other
revenues) . . . . . . . . . . . . . . . . . . . . . (130) 1,106 653 (84)(1) 1,545 10 (67) 194 1,682Loan impairment charges (Provision for
credit losses) . . . . . . . . . . . . . . . . . . 2,292 1,058 - 1(2) 3,351 (305) 47 41 3,134Operating expenses (Total costs and
expenses) . . . . . . . . . . . . . . . . . . . . 587 578 1,474 - 2,639 6 (452) 203 2,396Profit (loss) before tax . . . . . . . . . . . . . . (1,259) 766 (1,009) (85) (1,587) (89) 381 46 (1,249)Income (loss) from continuing operations . . (794) 484 (1,083) (53) (1,446) (63) 402 30 (1,077)Customer loans (Receivables) . . . . . . . . . . 120,226 47,623 149 - 167,998 (20,640) (125) 4,741 151,974Assets . . . . . . . . . . . . . . . . . . . . . . . . 118,367 46,952 30,615 (8,203)(3) 187,731 (20,064) (5,308) 4,236 166,595Intersegment revenues . . . . . . . . . . . . . . 58 21 5 (84)(1) - - - - -
Nine months ended September 30, 2008:Net interest income . . . . . . . . . . . . . . . . $ 4,401 $ 3,828 $ 118 $ - $ 8,347 $ (1,069) $ (366) $ 292 $ 7,204Other operating income (Total other
revenues) . . . . . . . . . . . . . . . . . . . . . (15) 2,424 2,255 (176)(1) 4,488 (72) (46) 440 4,810Loan impairment charges (Provision for
credit losses) . . . . . . . . . . . . . . . . . . 6,987 3,750 36 - 10,773 (1,188) 230 129 9,944Operating expenses (Total costs and
expenses) . . . . . . . . . . . . . . . . . . . . 1,403 1,643 458 - 3,504 38 139 518 4,199Profit (loss) before tax . . . . . . . . . . . . . . (4,004) 859 1,879 (176) (1,442) 9 (781) 85 (2,129)Income (loss) from continuing operations . . (2,560) 540 1,136 (112) (996) 12 (520) 58 (1,446)Intersegment revenues . . . . . . . . . . . . . . 150 13 13 (176)(1) - - - - -
Nine months ended September 30, 2007:Net interest income . . . . . . . . . . . . . . . . $ 5,439 $ 3,556 $ (607) $ - $ 8,388 $ (1,038) $ 85 $ 287 $ 7,722Other operating income (Total other
revenues) . . . . . . . . . . . . . . . . . . . . . (86) 2,880 1,202 (225)(1) 3,771 91 (127) 364 4,099Loan impairment charges (Provision for
credit losses) . . . . . . . . . . . . . . . . . . 4,521 2,491 (2) 4(2) 7,014 (693) 46 113 6,480Operating expenses (Total costs and
expenses) . . . . . . . . . . . . . . . . . . . . 1,805 1,845 1,759 - 5,409 6 (457) 426 5,384Profit (loss) before tax . . . . . . . . . . . . . . (973) 2,100 (1,162) (229) (264) (260) 369 112 (43)Income (loss) from continuing operations . . (614) 1,335 (1,060) (144) (483) (179) 308 72 (282)Intersegment revenues . . . . . . . . . . . . . . 158 54 13 (225)(1) - - - - -
(1) Eliminates intersegment revenues.(2) Eliminates bad debt recovery sales between operating segments.(3) Eliminates investments in subsidiaries and intercompany borrowings.(4) Management Basis Adjustments represent the private label and real estate secured receivables transferred to HBUS.(5) IFRS Adjustments consist of the accounting differences between U.S. GAAP and IFRSs which have been described more fully below.(6) Represents differences in balance sheet and income statement presentation between IFRSs and U.S. GAAP.
See “Basis of Reporting” in Item 7, “Management’s Discussion and Analysis of Financial Condition and Results ofOperations” in our Annual Report on Form 10-K for the year ended December 31, 2007 for a more complete
30

discussion of differences between U.S. GAAP and IFRSs. Further discussion of the differences between IFRSs andU.S. GAAP are presented in Item 2, “Management’s Discussion and Analysis of Financial Condition and Results ofOperations” of this Form 10-Q under the caption “Basis of Reporting.” A summary of the significant differencesbetween U.S. GAAP and IFRSs as they impact our results are presented below:
Net interest income – The calculation of effective interest rates under IFRS 39 requires an estimate of “all fees andpoints paid or recovered between parties to the contract” that are an integral part of the effective interest rate beincluded. U.S. GAAP generally prohibits recognition of interest income to the extent the net interest in the loanwould increase to an amount greater than the amount at which the borrower could settle the obligation. UnderU.S. GAAP, prepayment penalties are generally recognized as received. U.S. GAAP also includes interest incomeon loans held for resale which is included in other revenues for IFRSs.
Loan origination cost deferrals under IFRSs are more stringent and result in lower costs being deferred thanpermitted under U.S. GAAP. In addition, all deferred loan origination fees, costs and loan premiums must berecognized based on the expected life of the receivables under IFRSs as part of the effective interest calculationwhile under U.S. GAAP they may be recognized on either a contractual or expected life basis.
Under IFRSs, net interest income includes the interest element for derivatives which corresponds to debt designatedat fair value. For U.S. GAAP, this is included as in Gain (loss) on debt designated at fair value and relatedderivatives which is a component of other revenues. Additionally, under IFRSs, insurance investment income isincluded in net interest income instead of as a component of other revenues under U.S. GAAP.
Other operating income (total other revenues) – In addition to the items discussed above which are presenteddifferently between U.S. GAAP and IFRSs, other revenues under IFRSs includes policyholder benefits expensewhich is classified as other expense under U.S. GAAP.
IFRSs requires loans designated as held for resale at the time of origination to be treated as trading assets andrecorded at their fair market value. Under U.S. GAAP, loans designated as held for resale are reflected as loans andrecorded at the lower of amortized cost or fair value. Under IFRSs, the income and expenses related to receivablesheld for sale are reported in other operating income. Under U.S. GAAP, the income and expenses related toreceivables held for sale are reported similarly to loans held for investment.
For receivables transferred to held for sale subsequent to origination, there are no accounting requirements underIFRSs for loans that management intends to sell. Accordingly, for IFRSs purposes such loans continue to beaccounted for in accordance with IAS 39 with any gain or loss recorded at the time of sale. U.S. GAAP requiresloans that management intends to sell to be transferred to a held for sale category at the lower of cost or fair value.Under U.S. GAAP, the component of the lower of cost or fair value adjustment related to credit risk is recorded inthe statement of income (loss) as provision for credit losses while the component related to interest rates andliquidity factors is reported in the statement of income (loss) in other revenues.
As a result of the guidance issued by the SEC in October 2008, under U.S. GAAP we are allowed to evaluateperpetual preferred securities for potential impairment similar to a debt security provided there has been noevidence of deterioration in the credit of the issuer and record the unrealized losses as a component of othercomprehensive income. There are no similar provisions under IFRSs.
Loan impairment charges (provision for credit losses) – IFRSs requires a discounted cash flow methodology forestimating impairment on pools of homogeneous customer loans which requires the incorporation of the time valueof money relating to recovery estimates. Also under IFRSs, future recoveries on charged-off loans are accrued foron a discounted basis and a recovery asset is recorded. Subsequent recoveries are recorded to earnings underU.S. GAAP, but are adjusted against the recovery asset under IFRSs. Interest is recorded based on collectibilityunder IFRSs.
As discussed above, under U.S. GAAP the credit risk component of the lower of cost or fair value adjustment relatedto the transfer of receivables to held for sale is recorded in the statement of income (loss) as provision for creditlosses. There is no similar requirement under IFRSs.
Operating expenses (total costs and expenses) – Amortization of intangible assets under IFRSs is lower than thatunder U.S. GAAP as the intangibles associated with our acquisition by HSBC are reflected in goodwill. Operating
31

expenses are also lower under IFRSs as policyholder benefits expenses are reported as an offset to other revenues asdiscussed above. There are other less significant differences between IFRSs and U.S. GAAP relating to pensionexpense and changes in tax estimates.
Customer loans (receivables) – On an IFRSs basis loans designated as held for sale at the time of origination andaccrued interest are classified in other assets. However, the accounting requirements governing when receivablespreviously held for investment are transferred to a held for sale category are more stringent under IFRS than underU.S. GAAP. Unearned insurance premiums are reported as a reduction to receivables on a U.S. GAAP basis but arereported as insurance reserves for IFRSs.
Assets – In addition to the differences in customer loan balances as discussed above, securities under IFRSsincludes HSBC Group shares held for stock plans at fair value. Additionally, there are higher derivative relatedassets under IFRSs compared to U.S. GAAP due to more stringent netting requirements.
14. Fair Value Option
Effective January 1, 2007, we elected fair value option (“FVO”) reporting for certain issuances of our fixed rate debtin order to align our accounting treatment with that of HSBC under IFRSs. To align our U.S. GAAP and IFRSsaccounting treatment, we have adopted SFAS No. 159 only for the fixed rate debt issuances which also qualify forFVO reporting under IFRSs.
Long term debt (with original maturities over one year) at September 30, 2008 of $100.6 billion includes$30.9 billion of fixed rate debt accounted for under FVO. At September 30, 2008, we have not elected FVOfor $27.9 billion of fixed rate debt for the reasons discussed above. Fixed rate debt accounted for under FVO atSeptember 30, 2008 has an aggregate unpaid principal balance of $32.8 billion which includes a foreign currencytranslation adjustment relating to our foreign denominated FVO debt which increased the debt balance by$.4 billion. Long term debt (with original maturities over one year) at December 31, 2007 of $122.8 billionincludes $32.9 billion of fixed rate debt accounted for under FVO. At December 31, 2007, we have not elected FVOfor $34.6 billion of fixed rate debt for the reasons discussed above. Fixed rate debt accounted for under FVO atDecember 31, 2007 has an aggregate unpaid principal balance of $33.2 billion which included a foreign currencytranslation adjustment relating to our foreign denominated FVO debt which increased the debt balance by$.5 billion.
The components of “Gain on debt designated at fair value and related derivatives” are as follows:
2008 2007 2008 2007
Three MonthsEnded September 30,
Nine MonthsEnded September 30,
(in millions)
Mark-to-market on debt designated at fair value:
Interest rate component . . . . . . . . . . . . . . . . . . . . . . . . . . . $ (265) $(723) $ (314) $(350)
Credit risk component . . . . . . . . . . . . . . . . . . . . . . . . . . . . 1,592 608 1,917 846
Total mark-to-market on debt designated at fair value . . . . . . . 1,327 (115) 1,603 496
Mark-to-market on the related derivatives . . . . . . . . . . . . . . . . 278 719 273 280
Net realized gains (losses) on the related derivatives . . . . . . . . 104 (85) 145 (243)
Total . . . . . . . . . . . . . . . . . . . . . . . . . . . . . . . . . . . . . . . . . . . $1,709 $ 519 $2,021 $ 533
The movement in the fair value reflected in “Gain on debt designated at fair value and related derivatives” includesthe effect of credit spread changes and interest rate changes, including any ineffectiveness in the relationshipbetween the related swaps and our debt. With respect to the credit component, as credit spreads narrow accountinglosses are booked and the reverse is true if credit spreads widen. Differences arise between the movement in the fairvalue of our debt and the fair value of the related swap due to the different credit characteristics. The size anddirection of the accounting consequences of such changes can be volatile from period to period but do not alter thecash flows intended as part of the documented interest rate management strategy.
32

The changes in the interest component during the third quarter of 2008 reflect a decrease in long term interest rates.As of September 30, 2008, both short term and long term interest rates have decreased when compared to year-end2007. Our credit spreads widened significantly in the third quarter of 2008, which added to the net widening ofcredit spreads that occurred during the first half of 2008.
15. Fair Value Measurements
Assets and Liabilities Recorded at Fair Value on a Recurring Basis The following table presents information aboutour assets and liabilities measured at fair value on a recurring basis as of September 30, 2008 and December 31,2007, and indicates the fair value hierarchy of the valuation techniques utilized to determine such fair value. Ingeneral, fair values determined by Level 1 inputs use quoted prices (unadjusted) in active markets for identicalassets or liabilities that we have the ability to access. Fair values determined by Level 2 inputs use inputs other thanquoted prices included in Level 1 that are observable for the asset or liability, either directly or indirectly. Level 2inputs include quoted prices for similar assets and liabilities in active markets, quoted prices for identical or similarassets or liabilities in markets where there are few transactions and inputs other than quoted prices that areobservable for the asset or liability, such as interest rates and yield curves that are observable at commonly quotedintervals. Level 3 inputs are unobservable inputs for the asset or liability and include situations where there is little,if any, market activity for the asset or liability.
Assets(Liabilities)Measured atFair Value at
Balance Sheet Date
Quoted Prices inActive Markets for
Identical Assets(Level 1)
Significant OtherObservable Inputs
(Level 2)
SignificantUnobservable Inputs
(Level 3)
(in millions)
September 30, 2008:Risk management related
derivatives, net(1) . . . . . . . . $ 2,663 $ - $ 2,663 $ -
Available for sale securities . . 3,136 354 2,743 39Real estate owned(2) . . . . . . . 1,294 - 1,294 -
Repossessed vehicles(2) . . . . . 50 - 50 -
Long term debt carried at fairvalue . . . . . . . . . . . . . . . . 30,915 - 30,915 -
December 31, 2007:Risk management related
derivatives, net(1) . . . . . . . . $ 3,776 $ - $ 3,776 $ -
Available for sale securities . . 3,152 267 2,885 -
Real estate owned(2) . . . . . . . 1,151 - 1,151 -
Repossessed vehicles(2) . . . . . 83 - 83 -
Long term debt carried at fairvalue . . . . . . . . . . . . . . . . 32,896 - 32,896 -
(1) The fair value disclosed excludes swap collateral that we either receive or deposit with our interest rate swap counterparties. Such swapcollateral is recorded on our balance sheet at an amount which “approximates fair value” as discussed in FASB Staff Position No. FIN 39-1,“Amendment of FASB Interpretation No. 39” and is netted on the balance sheet with the fair value amount recognized for derivativeinstruments.
(2) The fair value disclosed is unadjusted for transaction costs as required by SFAS No. 157, “Fair Value Measurements.” The amounts recordedin the consolidated balance sheet are recorded net of transaction costs as required by FASB Statement No. 144, “Accounting for theImpairment or Disposal of Long-Lived Assets.”
33

The following table reconciles the beginning and ending balances for assets recorded at fair value using significantunobservable inputs (Level 3):
Securities
(in millions)
Beginning balance at March 31, 2008 . . . . . . . . . . . . . . . . . . . . . . . . . . . . . . . . . . . . . . . . . . . . . $ -
Transfers into Level 3(2) . . . . . . . . . . . . . . . . . . . . . . . . . . . . . . . . . . . . . . . . . . . . . . . . . . . . . . 59
Total gains or losses (realized/unrealized):
Included in income from continuing operations . . . . . . . . . . . . . . . . . . . . . . . . . . . . . . . . . . . -
Included in other comprehensive income(1) . . . . . . . . . . . . . . . . . . . . . . . . . . . . . . . . . . . . . . (8)
Ending balance at June 30, 2008 . . . . . . . . . . . . . . . . . . . . . . . . . . . . . . . . . . . . . . . . . . . . . . . . . $ 51
Transfers into Level 3(3) . . . . . . . . . . . . . . . . . . . . . . . . . . . . . . . . . . . . . . . . . . . . . . . . . . . . . . 5
Total gains or losses (realized/unrealized):
Included in income from continuing operations . . . . . . . . . . . . . . . . . . . . . . . . . . . . . . . . . . . -
Included in other comprehensive income(1) . . . . . . . . . . . . . . . . . . . . . . . . . . . . . . . . . . . . . . (17)
Ending balance at September 30, 2008 . . . . . . . . . . . . . . . . . . . . . . . . . . . . . . . . . . . . . . . . . . . . . $ 39
(1) The change in unrealized gains or losses relating to assets still held at September 30, 2008 was $(17) million.(2) Represents a mortgage backed security held by our Canadian subsidiary.
(3) Represents domestic corporate debt and mortgage backed securities.
Assets and Liabilities Recorded at Fair Value on a Non-recurring Basis Receivables held for sale are recorded inour consolidated balance sheet at the lower of cost or fair value on a non-recurring basis. As such, they are notmeasured at fair value on an ongoing basis, but are subject to fair value adjustments in only certain circumstances(e.g. impairment). The following table presents the fair value hierarchy of the valuation techniques utilized todetermine the fair value of the receivables held for sale which are carried at fair value as of September 30, 2008, aswell as the gains (losses) on these receivables recorded during the three and nine months ended September 30, 2008.The fair value of receivables held for sale at June 30, 2008 were considered to be Level 2 in the fair value hierarchyof valuation techniques. We consider the fair value of receivables held for sale as of September 30, 2008 to be Level3 given the current reduction of demand in the secondary market and lack of recent observable transactions.
Level 1 Level 2 Level 3 Total
Total Gains(Losses) for theThree Months
EndedSeptember 30,
2008
Total Gains(Losses) for the
Nine MonthsEnded
September 30,2008
Non-Recurring Fair Value Measurements as ofSeptember 30, 2008
(in millions)
Real estate secured. . . . . . . . . . . . . . . $- $- $ 322 $ 322 $ (7) $ (16)
Auto finance . . . . . . . . . . . . . . . . . . . - - 2,786 2,786 (281) (281)
Credit cards . . . . . . . . . . . . . . . . . . . . - - 1,550 1,550 (30) (278)
Total receivables held for sale at fairvalue(1) . . . . . . . . . . . . . . . . . . . . . $- $- $4,658 $4,658 $(318) $(575)
(1) Excludes $6.3 billion of receivables held for sale for which the fair value exceeds our carrying value.
As discussed in Note 9, “Goodwill,” goodwill allocated to our Canadian operations with a carrying value of$167 million was written down to its implied fair value of $96 million during the three months ended September 30,2008. Goodwill carried at fair value at September 30, 2008 was considered to be Level 3 in the fair value hierarchyof valuation techniques due to the lack of recent observable transactions.
Assets and liabilities which could also be measured at fair value on a non-recurring basis include intangible assets.
34

Fair Value of Financial Instruments In accordance with SFAS No. 107, “Disclosures about Fair Value of FinancialInstruments,” (“SFAS No. 107”) on an annual basis we report the fair value of all financial instruments in ourconsolidated balance sheet, including those financial instruments carried at cost. As a result of the significantdeterioration in the mortgage lending industry trends and economic conditions since December 31, 2007 and, inparticular, during the third quarter of 2008, we are updating our SFAS No. 107 disclosures as of September 30, 2008.The fair value estimates, methods and assumptions used to determine the fair value of our financial instruments forcontinuing operations, as presented in the table below, are consistent with the methods described in our 2007Form 10-K using assumptions that have been updated to reflect the economic conditions as of September 30, 2008.
CarryingValue
EstimatedFair Value
CarryingValue
EstimatedFair Value
September 30, 2008 December 31, 2007
(in millions)
Assets:Cash . . . . . . . . . . . . . . . . . . . . . . . . . . . . . . . . . . . . . . . . . . $ 546 $ 546 $ 663 $ 663
Interest bearing deposits with banks . . . . . . . . . . . . . . . . . . . 173 173 335 335
Securities purchased under agreements to resell . . . . . . . . . . 1,603 1,603 1,506 1,506
Securities . . . . . . . . . . . . . . . . . . . . . . . . . . . . . . . . . . . . . . . 3,136 3,136 3,152 3,152
Consumer receivables:
Mortgage Services:
First lien . . . . . . . . . . . . . . . . . . . . . . . . . . . . . . . . . . . 20,142 12,731 25,641 19,268
Second lien . . . . . . . . . . . . . . . . . . . . . . . . . . . . . . . . . 2,917 1,209 4,649 2,609
Total Mortgage Services . . . . . . . . . . . . . . . . . . . . . . . . 23,059 13,940 30,290 21,877
Consumer Lending:
First lien . . . . . . . . . . . . . . . . . . . . . . . . . . . . . . . . . . 39,664 27,164 42,861 30,881
Second lien . . . . . . . . . . . . . . . . . . . . . . . . . . . . . . . . 5,222 1,786 6,292 3,229
Total real estate secured . . . . . . . . . . . . . . . . . . . . . . . . 44,886 28,950 49,153 34,110
Non-real estate secured . . . . . . . . . . . . . . . . . . . . . . . . . 13,928 6,567 16,277 10,351
Total Consumer Lending . . . . . . . . . . . . . . . . . . . . . . . . 58,814 35,517 65,430 44,461
Credit card . . . . . . . . . . . . . . . . . . . . . . . . . . . . . . . . . . . . 17,277 16,790 27,637 30,081
Auto Finance . . . . . . . . . . . . . . . . . . . . . . . . . . . . . . . . . . 7,930 6,596 11,797 10,998
Canadian receivables . . . . . . . . . . . . . . . . . . . . . . . . . . . . 3,768 3,960 4,983 5,238
Total consumer receivables . . . . . . . . . . . . . . . . . . . . . . . . . . 110,848 76,803 140,137 112,655
Receivables held for sale . . . . . . . . . . . . . . . . . . . . . . . . . . . 10,958 10,958 80 80
Due from affiliates . . . . . . . . . . . . . . . . . . . . . . . . . . . . . . . . 289 289 634 634
Derivative financial assets . . . . . . . . . . . . . . . . . . . . . . . . . . 4 4 46 46
Liabilities:Commercial paper, bank and other borrowings . . . . . . . . . . . 7,879 7,879 8,399 8,399
Due to affiliates . . . . . . . . . . . . . . . . . . . . . . . . . . . . . . . . . . 12,346 10,753 11,359 10,944
Long term debt carried at fair value . . . . . . . . . . . . . . . . . . . 30,915 30,915 32,896 32,896
Long term debt not carried at fair value . . . . . . . . . . . . . . . . 69,732 62,952 90,117 88,159
Insurance policy and claim reserves . . . . . . . . . . . . . . . . . . . 969 882 998 986
Derivative financial liabilities . . . . . . . . . . . . . . . . . . . . . . . . 814 814 14 14
As discussed in our 2007 Form 10-K, receivable values presented in the table above were determined using theframework for measuring fair value as prescribed by SFAS No. 157, which is based on our best estimate of theamount within a range of value we believe would be received in a sale as of the balance sheet date (i.e. exit price). Inrecent months, the unprecedented developments in the mortgage lending industry and the current economicconditions have resulted in a significant reduction in the secondary market demand for subprime loans. The
35
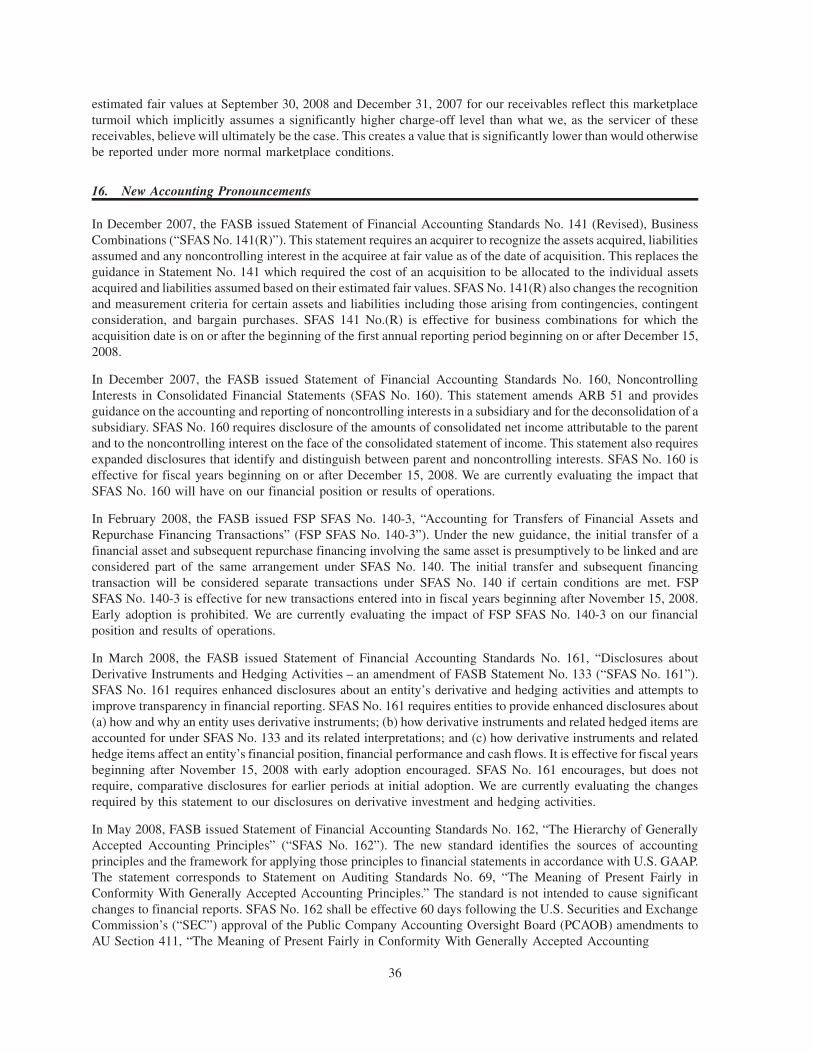
estimated fair values at September 30, 2008 and December 31, 2007 for our receivables reflect this marketplaceturmoil which implicitly assumes a significantly higher charge-off level than what we, as the servicer of thesereceivables, believe will ultimately be the case. This creates a value that is significantly lower than would otherwisebe reported under more normal marketplace conditions.
16. New Accounting Pronouncements
In December 2007, the FASB issued Statement of Financial Accounting Standards No. 141 (Revised), BusinessCombinations (“SFAS No. 141(R)”). This statement requires an acquirer to recognize the assets acquired, liabilitiesassumed and any noncontrolling interest in the acquiree at fair value as of the date of acquisition. This replaces theguidance in Statement No. 141 which required the cost of an acquisition to be allocated to the individual assetsacquired and liabilities assumed based on their estimated fair values. SFAS No. 141(R) also changes the recognitionand measurement criteria for certain assets and liabilities including those arising from contingencies, contingentconsideration, and bargain purchases. SFAS 141 No.(R) is effective for business combinations for which theacquisition date is on or after the beginning of the first annual reporting period beginning on or after December 15,2008.
In December 2007, the FASB issued Statement of Financial Accounting Standards No. 160, NoncontrollingInterests in Consolidated Financial Statements (SFAS No. 160). This statement amends ARB 51 and providesguidance on the accounting and reporting of noncontrolling interests in a subsidiary and for the deconsolidation of asubsidiary. SFAS No. 160 requires disclosure of the amounts of consolidated net income attributable to the parentand to the noncontrolling interest on the face of the consolidated statement of income. This statement also requiresexpanded disclosures that identify and distinguish between parent and noncontrolling interests. SFAS No. 160 iseffective for fiscal years beginning on or after December 15, 2008. We are currently evaluating the impact thatSFAS No. 160 will have on our financial position or results of operations.
In February 2008, the FASB issued FSP SFAS No. 140-3, “Accounting for Transfers of Financial Assets andRepurchase Financing Transactions” (FSP SFAS No. 140-3”). Under the new guidance, the initial transfer of afinancial asset and subsequent repurchase financing involving the same asset is presumptively to be linked and areconsidered part of the same arrangement under SFAS No. 140. The initial transfer and subsequent financingtransaction will be considered separate transactions under SFAS No. 140 if certain conditions are met. FSPSFAS No. 140-3 is effective for new transactions entered into in fiscal years beginning after November 15, 2008.Early adoption is prohibited. We are currently evaluating the impact of FSP SFAS No. 140-3 on our financialposition and results of operations.
In March 2008, the FASB issued Statement of Financial Accounting Standards No. 161, “Disclosures aboutDerivative Instruments and Hedging Activities – an amendment of FASB Statement No. 133 (“SFAS No. 161”).SFAS No. 161 requires enhanced disclosures about an entity’s derivative and hedging activities and attempts toimprove transparency in financial reporting. SFAS No. 161 requires entities to provide enhanced disclosures about(a) how and why an entity uses derivative instruments; (b) how derivative instruments and related hedged items areaccounted for under SFAS No. 133 and its related interpretations; and (c) how derivative instruments and relatedhedge items affect an entity’s financial position, financial performance and cash flows. It is effective for fiscal yearsbeginning after November 15, 2008 with early adoption encouraged. SFAS No. 161 encourages, but does notrequire, comparative disclosures for earlier periods at initial adoption. We are currently evaluating the changesrequired by this statement to our disclosures on derivative investment and hedging activities.
In May 2008, FASB issued Statement of Financial Accounting Standards No. 162, “The Hierarchy of GenerallyAccepted Accounting Principles” (“SFAS No. 162”). The new standard identifies the sources of accountingprinciples and the framework for applying those principles to financial statements in accordance with U.S. GAAP.The statement corresponds to Statement on Auditing Standards No. 69, “The Meaning of Present Fairly inConformity With Generally Accepted Accounting Principles.” The standard is not intended to cause significantchanges to financial reports. SFAS No. 162 shall be effective 60 days following the U.S. Securities and ExchangeCommission’s (“SEC”) approval of the Public Company Accounting Oversight Board (PCAOB) amendments toAU Section 411, “The Meaning of Present Fairly in Conformity With Generally Accepted Accounting
36

Principles.” The adoption of SFAS No. 162 will not have any material impact on our consolidated financialstatements.
In May 2008, the FASB issued Statement of Financial Accounting Standards No. 163, “Accounting for FinancialGuarantee Insurance Contracts – an interpretation of FASB Statement No. 60” (“SFAS No. 163”). SFAS No. 163applies to financial guarantee insurance (and reinsurance) contracts issued by enterprises that are included withinthe scope of paragraph 6 of Statement 60 and that are not accounted for as derivative instruments. It clarifies howStatement 60 applies to financial guarantee insurance contracts, including the recognition and measurement ofpremium revenue and claim liabilities. This statement requires expanded disclosures about financial guaranteeinsurance contracts. SFAS No. 163 is effective for financial statements issued for fiscal years beginning afterDecember 15, 2008, and all interim periods within those fiscal years. We are currently evaluating the impact thatSFAS No. 163 may have on our financial position or results of operations.
In October 2008, the FASB issued FSP FAS 157-3, “Determining the Fair Value of a Financial Asset in a Market thatis Not Active” (“FSP FAS 157-3”). FSP FAS 157-3 clarifies how management’s internal assumptions andobservable market information should be considered when measuring fair value in an inactive market and howmarket quotes (e.g. broker quotes) should be considered when assessing the relevance of observability of availabledata in measuring fair value. The adoption of FSP FAS 157-3 will not have any material impact on our consolidatedfinancial statements.
37

Item 2. Management’s Discussion and Analysis of Financial Condition and Results of Operations
Forward-Looking Statements
Management’s Discussion and Analysis of Financial Condition and Results of Operations (“MD&A”) should beread in conjunction with the consolidated financial statements, notes and tables included elsewhere in this reportand with our Annual Report on Form 10-K for the year ended December 31, 2007 (the “2007 Form 10-K”). MD&Amay contain certain statements that may be forward-looking in nature within the meaning of the Private SecuritiesLitigation Reform Act of 1995. In addition, we may make or approve certain statements in future filings with theSEC, in press releases, or oral or written presentations by representatives of HSBC Finance Corporation that are notstatements of historical fact and may also constitute forward-looking statements. Words such as “may”, “will”,“should”, “would”, “could”, “intend”, “believe”, “expect”, “estimate”, “target”, “plan”, “anticipate”, “goal” andsimilar expressions are intended to identify forward-looking statements but should not be considered as the onlymeans through which these statements may be made. These matters or statements will relate to our future financialcondition, results of operations, plans, objectives, performance or business developments and will involve knownand unknown risks, uncertainties and other factors that may cause our actual results, performance or achievementsto be materially different from that which was expressed or implied by such forward-looking statements. Forward-looking statements are based on our current views and assumptions and speak only as of the date they are made.HSBC Finance Corporation undertakes no obligation to update any forward-looking statement to reflect subsequentcircumstances or events.
Executive Overview
HSBC Finance Corporation is an indirect wholly owned subsidiary of HSBC Holdings plc (“HSBC”). HSBCFinance Corporation may also be referred to in MD&A as “we”, “us”, or “our”.
Business Focus As discussed in prior filings, we have been engaged in a continuing, comprehensive evaluation ofthe strategies and opportunities for our operations. In light of the unprecedented developments in the retail creditmarkets, particularly in the residential mortgage industry, we made the strategic decision to lower the risk profileand reduce the capital and liquidity requirements of our operations by reducing the size of the balance sheet whilemaximizing efficiencies. Since mid-2007 a number of strategic actions have been undertaken. These included:
• Tightened credit criteria and underwriting practices across all product lines which included discontinuation ofcertain loan products, including adjustable rate, stated income and interest-only mortgages as well as personalhomeowner loans;
• Closed our Decision One wholesale mortgage operation;
• Discontinued the dealer and direct-to-consumer auto finance loan origination channels. We will continue to offerauto loans in our Consumer Lending branch offices through the autos-in-branches program until an alliance isestablished with a third party provider;
• Eliminated all Taxpayer Financial Services pre-season and pre-file loan products and exited all relationshipsexcept H&R Block;
• Closed certain servicing facilities and redeployed the servicing activities to other facilities;
• Reduced staffing levels in many areas of operations;
• Reduced the Consumer Lending branch office locations to approximately 900 while we continue our ongoingbranch optimization program;
• Initiated action to enhance our liquidity and reduce funding costs for HSBC’s consolidated operations bytargeting the sale of certain loan portfolios to affiliates while retaining the account relationships;
• Sold United Kingdom operations to an HSBC affiliate;
• Agreed to sell the Canadian operations to an HSBC affiliate, which we currently anticipate will close prior toDecember 31, 2008;
38

• Launched a mortgage loan origination program under Federal Home Loan Mortgage Corporation (“FreddieMac”) and expect to do so through the Federal Housing Administration (“FHA”) in the near term;
• Sold to third parties real estate secured receivables held for sale with a fair value of $1.0 billion and auto financereceivables held for sale from our Canadian operations with a fair value of $319 million. These receivables wereoriginally originated for investment purposes; and
• Expanded and enhanced re-age and modification opportunities for our customers, including a program modifyingadjustable rate mortgage loans in advance of initial interest rate resets to maximize cash flow for us and homepreservation for our customers.
Evaluation of our operations will continue as we seek to optimize our risk profile and liquidity, capital and fundingrequirements and determine the expected opportunities in the subprime lending industry as the credit marketsstabilize. This is likely to result in further strategic actions that may include additional asset sales and furtheralterations or refinement of product offerings.
Performance, Developments and Trends Net loss was $(271) million for the three months ended September 30,2008 compared to $(1,102) million in the prior year quarter. Net loss was $(1,461) million for the nine months endedSeptember 30, 2008 compared to $(498) million in the prior year period. Results for both periods in 2008 benefitedsignificantly from the change in the credit risk component of our fair value optioned debt which reduced our net lossby $1.0 billion in the quarter and $1.2 billion in the year-to-date period as compared to $0.4 billion and $0.5 billionin the corresponding 2007 periods. In addition, the results for both periods include goodwill impairment chargeswhich increased our net loss by $63 million (after-tax) related to our Canadian operations in 2008 and $852 million(after-tax) related to our Mortgage Services business in 2007. Excluding the impact of these items, we reported amarkedly higher net loss in both periods largely due to a significantly higher provision for credit losses as comparedto the year-ago periods, the impact of lower of cost or fair value adjustments recorded for receivables transferred toheld for sale in 2008, lower net interest income due to lower receivable levels and a deterioration in credit qualityand lower other revenues excluding the impact of fair value option as compared to the year-ago periods, partiallyoffset by lower costs and expenses.
In May 2008, we sold all of the common stock of Household International Europe Limited, the holding company forour United Kingdom business (“U.K. Operations”) to HSBC Overseas Holdings (UK) Limited (“HOHU”), anHSBC affiliate. As a result, our U.K. Operations are reported as discontinued operations for all periods presented inaccordance with SFAS No. 144, “Accounting for the Impairment or Disposal of Long-Lived Assets,”(“SFAS No. 144”). See Note 2, “Discontinued Operations,” for a full presentation of the components of the lossfrom discontinued operations. Loss from continuing operations was $(271) million during the three months endedSeptember 30, 2008 and $(1.4) billion during the nine months ended September 30, 2008 compared to a loss fromcontinuing operations of $(1.1) billion during the three months ended September 30, 2007 and $(282) millionduring the nine months ended September 30, 2007 for the reasons discussed above. The following discussion of ourfinancial performance in this MD&A excludes the results of our discontinued operations unless otherwise noted.
The increase in provision for credit losses during the three and nine months ended September 30, 2008 primarilyreflects higher loss estimates in our Mortgage Services and Consumer Lending businesses as well as in our domesticcredit card receivable portfolio largely due to the following:
• Higher overall levels of charge-off and delinquency, including higher roll rates, due to the continued weakeningof the U.S. economy and rising unemployment, with delinquency increasing most significantly in the first-lienportion of our Consumer Lending and Mortgage Services real estate secured portfolios;
• Portfolio seasoning;
• Lower real estate secured receivable run-off;
• Increases in loss severities for real estate secured receivables due to continued deterioration of real estate values incertain markets;
• Lower recovery rates for credit card receivables;
• Increased levels of personal bankruptcy filings in our credit card and personal non-credit card portfolios;
39
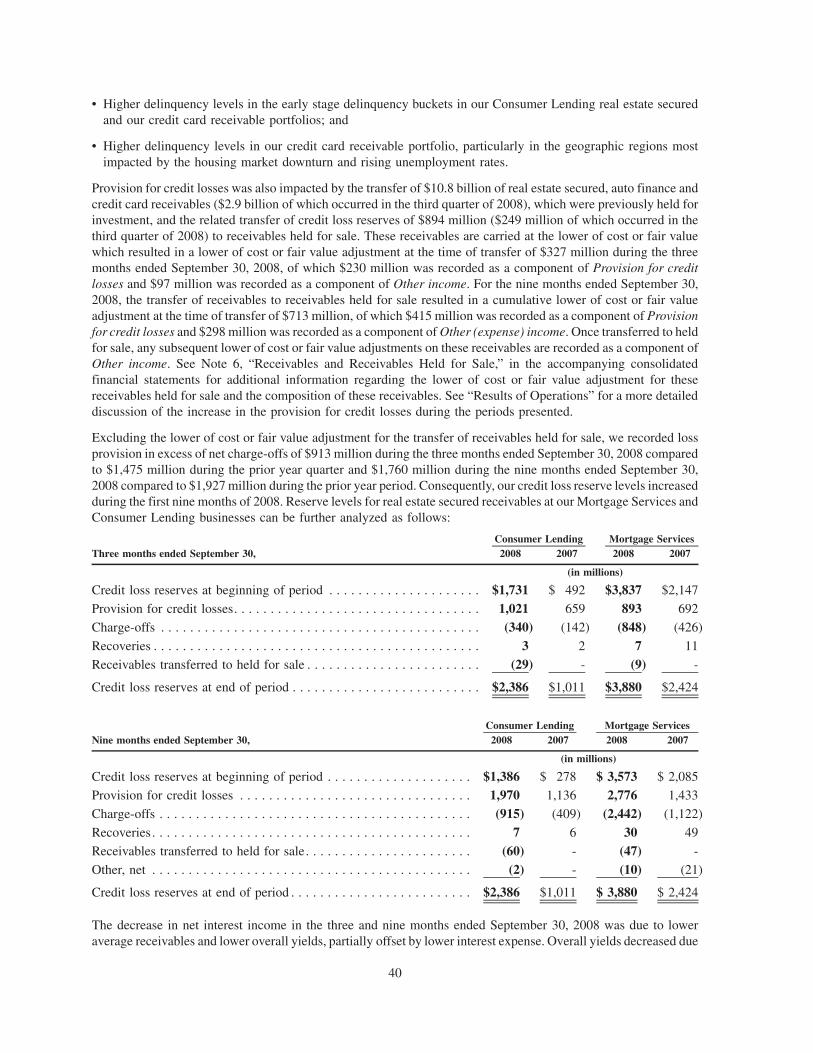
• Higher delinquency levels in the early stage delinquency buckets in our Consumer Lending real estate securedand our credit card receivable portfolios; and
• Higher delinquency levels in our credit card receivable portfolio, particularly in the geographic regions mostimpacted by the housing market downturn and rising unemployment rates.
Provision for credit losses was also impacted by the transfer of $10.8 billion of real estate secured, auto finance andcredit card receivables ($2.9 billion of which occurred in the third quarter of 2008), which were previously held forinvestment, and the related transfer of credit loss reserves of $894 million ($249 million of which occurred in thethird quarter of 2008) to receivables held for sale. These receivables are carried at the lower of cost or fair valuewhich resulted in a lower of cost or fair value adjustment at the time of transfer of $327 million during the threemonths ended September 30, 2008, of which $230 million was recorded as a component of Provision for creditlosses and $97 million was recorded as a component of Other income. For the nine months ended September 30,2008, the transfer of receivables to receivables held for sale resulted in a cumulative lower of cost or fair valueadjustment at the time of transfer of $713 million, of which $415 million was recorded as a component of Provisionfor credit losses and $298 million was recorded as a component of Other (expense) income. Once transferred to heldfor sale, any subsequent lower of cost or fair value adjustments on these receivables are recorded as a component ofOther income. See Note 6, “Receivables and Receivables Held for Sale,” in the accompanying consolidatedfinancial statements for additional information regarding the lower of cost or fair value adjustment for thesereceivables held for sale and the composition of these receivables. See “Results of Operations” for a more detaileddiscussion of the increase in the provision for credit losses during the periods presented.
Excluding the lower of cost or fair value adjustment for the transfer of receivables held for sale, we recorded lossprovision in excess of net charge-offs of $913 million during the three months ended September 30, 2008 comparedto $1,475 million during the prior year quarter and $1,760 million during the nine months ended September 30,2008 compared to $1,927 million during the prior year period. Consequently, our credit loss reserve levels increasedduring the first nine months of 2008. Reserve levels for real estate secured receivables at our Mortgage Services andConsumer Lending businesses can be further analyzed as follows:
Three months ended September 30, 2008 2007 2008 2007Consumer Lending Mortgage Services
(in millions)
Credit loss reserves at beginning of period . . . . . . . . . . . . . . . . . . . . . $1,731 $ 492 $3,837 $2,147
Provision for credit losses. . . . . . . . . . . . . . . . . . . . . . . . . . . . . . . . . . 1,021 659 893 692
Charge-offs . . . . . . . . . . . . . . . . . . . . . . . . . . . . . . . . . . . . . . . . . . . . (340) (142) (848) (426)
Recoveries . . . . . . . . . . . . . . . . . . . . . . . . . . . . . . . . . . . . . . . . . . . . . 3 2 7 11
Receivables transferred to held for sale . . . . . . . . . . . . . . . . . . . . . . . . (29) - (9) -
Credit loss reserves at end of period . . . . . . . . . . . . . . . . . . . . . . . . . . $2,386 $1,011 $3,880 $2,424
Nine months ended September 30, 2008 2007 2008 2007Consumer Lending Mortgage Services
(in millions)
Credit loss reserves at beginning of period . . . . . . . . . . . . . . . . . . . . $1,386 $ 278 $ 3,573 $ 2,085
Provision for credit losses . . . . . . . . . . . . . . . . . . . . . . . . . . . . . . . . 1,970 1,136 2,776 1,433
Charge-offs . . . . . . . . . . . . . . . . . . . . . . . . . . . . . . . . . . . . . . . . . . . (915) (409) (2,442) (1,122)
Recoveries. . . . . . . . . . . . . . . . . . . . . . . . . . . . . . . . . . . . . . . . . . . . 7 6 30 49
Receivables transferred to held for sale. . . . . . . . . . . . . . . . . . . . . . . (60) - (47) -
Other, net . . . . . . . . . . . . . . . . . . . . . . . . . . . . . . . . . . . . . . . . . . . . (2) - (10) (21)
Credit loss reserves at end of period . . . . . . . . . . . . . . . . . . . . . . . . . $2,386 $1,011 $ 3,880 $ 2,424
The decrease in net interest income in the three and nine months ended September 30, 2008 was due to loweraverage receivables and lower overall yields, partially offset by lower interest expense. Overall yields decreased due
40

to increased levels of loan modifications and other hardship repricings, deterioration in credit quality includinggrowth in non-performing assets, lower amortization of net deferred fees due to lower loan prepayments and lowerloan origination volumes, and decreases in rates on variable rate products which reflect market rate movements,partially offset by increased levels of higher yielding products. Gain (loss) on debt designated at fair value andrelated derivatives, which is a component of other revenues, increased during the three and nine months endedSeptember 30, 2008 due to a significant widening of credit spreads as compared to the year-ago periods. Changes inthe credit component of fair value optioned debt increased other revenues by $1,592 million in the third quarter of2008 compared to $608 million in the year-ago quarter. Excluding the gain on fair value optioned debt and relatedderivatives, other revenues decreased in both periods due to lower fee income, the lower of cost or fair valueadjustment on receivables held for sale as discussed above, as well as lower investment income due to higher other-than-temporary impairment charges, partially offset by lower losses on Decision One receivables held for sale dueto the closing of Decision One in the third quarter of 2007. Additionally, the year-ago periods benefited from the$113 million gain recorded on the sale of our portfolio of MasterCard Class B shares. For the year-to-date period,other revenue also decreased due to lower taxpayer financial services revenue due to strategic changes in productofferings. Fee income decreased due to changes in credit card fee practices implemented during the fourth quarter of2007 and the second quarter of 2008 as well as higher charge-offs due to credit quality deterioration, partially offsetby increased late fees due to higher delinquency levels and in the year-to-date period, the impact of higher levels ofaverage credit card receivables. Costs and expenses decreased in both periods due to lower salary expense, lowermarketing expenses, lower sales incentives and the impact of entity-wide initiatives to reduce costs, partially offsetby higher collection costs and REO expenses. The decrease in salary expense was partially offset by a $52 millionadjustment to the accrual for certain employee benefits. Additionally as discussed above, during the three monthsended September 30, 2008 we recorded a goodwill impairment charge of $71 million (pre-tax) related to ourCanadian operations as compared to a goodwill impairment charge of $881 million (pre-tax) relating to ourMortgage Services business in the year-ago period.
Our return on average owned assets (“ROA”) for continuing operations was (.74) percent for the quarter endedSeptember 30, 2008 and (1.26) percent for the nine months ended September 30, 2008 compared to (2.57) percentfor the quarter ended September 30, 2007 and (.22) percent for the nine months ended September 30, 2007. ROAwas significantly impacted by the change in the credit risk component of our fair value optioned debt and thegoodwill impairment charges recorded during these periods. Excluding these items from the periods presented,ROA decreased 190 basis points during the three months ended September 30, 2008 and 175 basis points during thenine months ended September 30, 2008 as compared to the year-ago periods. The decrease in ROA in both periods isprimarily due to the loss from continuing operations during the current period as discussed above, partially offset bythe impact of lower average assets in both periods.
We experienced a significant decrease in loss from continuing operations in the current quarter as compared to theprevious quarter. Loss from continuing operations before income tax benefit was $(361) million for the three monthsended September 30, 2008 compared to $(2,225) million for the three months ended June 30, 2008. However, the lossfrom continuing operations in the current quarter was significantly impacted by a substantially higher gain on debtdesignated at fair value and related derivatives. The primary drivers of this decrease are summarized below:
(pre-tax,in millions)
Loss from continuing operations – quarter ended June 30, 2008 . . . . . . . . . . . . . . . . . . . . . . . . . . . $(2,225)Higher gain on debt designated at fair value and related derivatives . . . . . . . . . . . . . . . . . . . . . . . . 2,578Higher provision for credit losses, excluding the provision component related to receivables held
for sale . . . . . . . . . . . . . . . . . . . . . . . . . . . . . . . . . . . . . . . . . . . . . . . . . . . . . . . . . . . . . . . . . . . (530)Decrease in lower of cost or fair value adjustment on receivables held for sale, including provision
component . . . . . . . . . . . . . . . . . . . . . . . . . . . . . . . . . . . . . . . . . . . . . . . . . . . . . . . . . . . . . . . . 59Lower net interest income . . . . . . . . . . . . . . . . . . . . . . . . . . . . . . . . . . . . . . . . . . . . . . . . . . . . . . (125)Higher other-than-temporary impairment charges. . . . . . . . . . . . . . . . . . . . . . . . . . . . . . . . . . . . . . (31)
41

(pre-tax,in millions)
Lower costs and expenses, excluding goodwill impairment charges . . . . . . . . . . . . . . . . . . . . . . . . 28Goodwill impairment charge related to our Canadian operations . . . . . . . . . . . . . . . . . . . . . . . . . . (71)Other, net . . . . . . . . . . . . . . . . . . . . . . . . . . . . . . . . . . . . . . . . . . . . . . . . . . . . . . . . . . . . . . . . . . . (44)
Loss from continuing operations – quarter ended September 30, 2008 . . . . . . . . . . . . . . . . . . . . . . $ (361)
The higher gain on debt designated at fair value and related derivatives was driven by a significant widening ofcredit spreads during the third quarter of 2008 while the spreads narrowed in the second quarter of 2008. The higherprovision for credit losses in the third quarter of 2008 was largely driven by higher credit loss estimates in ourConsumer Lending real estate secured and credit card receivable portfolios as previously discussed. The lower netinterest income reflects lower receivable levels as well as slightly lower net interest margin. Additionally, as a resultof the current marketplace conditions, we recorded higher other than temporary impairments on certain of ouravailable-for-sale securities.
During the third quarter of 2008, mortgage lending industry trends and economic conditions continued todeteriorate, including:
• Mortgage loan originations from 2005, 2006 and 2007 continue to perform worse than originations from priorperiods;
• Real estate markets in a large portion of the United States continue to be affected by a stagnation in propertyvalues or a decline in some markets although the rate of decline in some markets may be beginning to slow;
• Rising unemployment rates, particularly in the same markets experiencing the greatest home value depreciation;
• Increases in the period of time properties remain unsold in some markets;
• Increased loss severities on homes that are foreclosed and remarketed due to the increasing inventory of homes forsale and the declining property values in many markets;
• Lower secondary market demand for subprime loans resulting in reduced liquidity for subprime mortgages;
• Continued tightening of lending standards by mortgage lenders which impacts a borrowers’ ability to refinanceexisting mortgage loans;
• Increased energy costs; and
• Recessionary pressures in the U.S.
It is generally believed that the slowdown in the housing market will continue to impact housing prices into 2010.The combination of the above factors, including the exit of a number of mortgage lenders, has further reduced theability of many of our customers to make payments on their loans or to refinance the loan as accessing any equity intheir homes is no longer an option. This impacts both credit performance and run-off rates and has resulted in risingdelinquency and charge-off rates in our portfolios and across the industry, particularly for real estate secured loans.
As a result of the marketplace conditions discussed above, the credit performance of our domestic real estate securedreceivable portfolio continues to deteriorate. In third quarter of 2008, the deterioration has been most pronounced in thefirst lien portions of real estate secured loans originated by our Consumer Lending business in 2006 and the first half of2007. As a result, dollars of two-months-and-over contractual delinquency in our Consumer Lending real estate securedreceivable portfolio at September 30, 2008 were $3,866 million, or 39 percent higher than delinquency levels at June 30,2008 and 84 percent higher than delinquency levels at December 31, 2007. The deterioration has been most severe in thefirst lien portions of the portfolio in the geographic regions most impacted by the housing market downturn and risingunemployment rates, particularly in the states of California, Florida, New York, Virginia, Maryland, New Jersey, Illinois,Pennsylvania and Massachusetts which accounted for approximately 59 percent of the increase in dollars of two-monthsand over contractual delinquency since June, 30, 2008 and 60 percent of the increase since December 31, 2007. AtSeptember 30, 2008, approximately 53 percent of Consumer Lending’s real estate secured receivable portfolio waslocated in these ten states. Net charge-offs in our Consumer Lending business were $908 million, or 125 percent higherduring the nine months ended September 30, 2008 as compared to the year-ago period. After initially rising in early 2008,
42

dollars of two-months-and-over contractual delinquency in our Mortgage Services real estate secured receivableportfolio have decreased and are now essentially flat at September 30, 2008 as compared to December 31, 2007, whilenet charge-offs were $2,412 million, or 125 percent higher during the nine months ended September 30, 2008 ascompared to the year-ago period. The possibility exists, however, that dollars of Mortgage Services delinquency may risein the future in response to continued depreciation in home values, rising unemployment rates and the overall conditionof the U.S. economy. Loss severities on foreclosed homes increased during the first nine months of 2008 and are expectedto continue at increased levels into 2009. This continuing trend and increased charge-offs have resulted in an increase inthe provision for credit losses for real estate secured loans at our Consumer Lending and Mortgage Services businesses inthe three and nine months ended September 30, 2008 as compared to the year-ago periods.
We expect our domestic real estate secured receivable portfolios as well as the majority of our remaining domesticreceivable portfolios to remain under significant pressure for the remainder of 2008 and into 2009 as the affectedoriginations season further. We expect the marketplace and broader economic conditions will have a significantimpact on our overall delinquency and charge-off dollars and percentages through the remainder of 2008 and into2009 as compared to 2007, the extent of which will be based on future economic conditions, their impact oncustomer payment patterns and other external factors which are beyond our control.
The financial information set forth below summarizes selected financial highlights of HSBC Finance Corporationfrom continuing operations as of September 30, 2008 and 2007 and for the three and nine month periods endedSeptember 30, 2008 and 2007.
2008 2007 2008 2007
Three Months EndedSeptember 30,
Nine Months EndedSeptember 30,
(dollars are in millions)
Income (loss) from continuing operations . . . . . . . . . . . . . . . . . . . . . $ (271) $(1,077) $(1,446) $ (282)Return on average owned assets . . . . . . . . . . . . . . . . . . . . . . . . . . . . (.74)% (2.57)% (1.26)% (.22)%Return on average common shareholder’s equity (“ROE”) . . . . . . . . . (8.03) (24.34) (14.52) (2.30)Net interest margin . . . . . . . . . . . . . . . . . . . . . . . . . . . . . . . . . . . . . 6.53 6.64 6.50 6.49Consumer net charge-off ratio, annualized . . . . . . . . . . . . . . . . . . . . 7.82 4.34 7.12 3.93Efficiency ratio(1) . . . . . . . . . . . . . . . . . . . . . . . . . . . . . . . . . . . . . . . 27.99 55.30 34.11 44.69
(1) Ratio of total costs and expenses less policyholders’ benefits to net interest income and other revenues less policyholders’ benefits.
As of September 30, 2008 2007
(dollars are in millions)
Receivables(1) . . . . . . . . . . . . . . . . . . . . . . . . . . . . . . . . . . . . . . . . . . . . . . . . . . . . . . . . . . . . . . $122,752 $151,974
Two-month-and-over contractual delinquency ratios – continuing operations . . . . . . . . . . . . . . . . . . . . . . 9.92% 6.22%
(1) Excludes receivables held for sale.
Receivables were $122.8 billion at September 30, 2008, $130.9 billion at June 30, 2008 and $152.0 billion atSeptember 30, 2007. The decrease is a result of our decision to reduce the size of our balance sheet and lower ourrisk profile as previously discussed. Decreases in real estate secured receivable balances at September 30, 2008 havebeen partially offset by a decline in loan prepayments resulting from fewer refinancing opportunities for ourcustomers due to the previously discussed trends impacting the mortgage lending industry. Additionally asdiscussed above, as of September 30 2008, we are reporting $10.8 billion of receivables, which were previouslyheld for investment, as receivables held for sale. Included in this amount are real estate secured and auto financereceivables with a fair value of $2.9 billion which were transferred to held for sale during the third quarter of 2008.See “Receivables Review” for a more detailed discussion of the decreases in receivables for the periods presented.
Our two-months-and-over contractual delinquency ratio increased compared to both the prior year quarter and priorquarter. The overall delinquency ratio was negatively impacted by the lower receivable levels. Our delinquencyratio was also impacted by the continued deterioration in the marketplace and broader economic conditions andportfolio seasoning. Dollars of delinquency increased in the third quarter of 2008, largely in our Consumer Lendingreal estate secured receivable portfolio. We believe increases in overall delinquency levels have been tempered byimprovements in our domestic collection activities due to increased collection capacity as well as increases in the
43
volume of receivable re-ages and modifications. See “Credit Quality-Delinquency” for a more detailed discussionof the increase in delinquency for the periods presented.
Net charge-offs as a percentage of average consumer receivables (“net charge-off ratio”) for the quarter increasedcompared to the prior year quarter due to higher charge-offs in all domestic products and lower average consumerreceivables. The decrease in average consumer receivables reflects lower origination volumes resulting from the riskmitigation efforts previously discussed as well as the impact of the transfer of $9.4 million of receivables to receivablesheld for sale on June 30, 2008. As these receivables were primarily current receivables with little associated charge-offdollars, this has significantly impacted the total net charge-off ratio for the third quarter of 2008, particularly for ourcredit card receivable net charge-off ratio. The higher charge-offs, which are primarily in our real estate secured, creditcard and personal non-credit card portfolios, were driven by the higher delinquency levels we have been experiencingare migrating to charge-off, the impact of the marketplace and broader economic conditions, higher levels ofbankruptcy filings, higher severities for secured receivables and lower recovery rates for our credit card receivableportfolio. We believe the higher charge-offs have been partially offset by improvements in our domestic collectioncapacity as discussed above. As compared to the prior quarter, the net charge-off ratio increased although dollars of netcharge-offs for continuing operations were essentially flat during the quarter. The increase in the net charge-off ratioreflects a significant decrease in average consumer receivables during the quarter for all products as discussed above.See “Credit Quality- Net Charge-offs of Consumer Receivables” for a more detailed discussion of net charge-offs as apercentage of average consumer receivables from continuing operations for the periods presented.
Our efficiency ratio from continuing operations was 27.99 percent for the quarter ended September 30, 2008 compared to55.30 percent in the year-ago quarter. Our efficiency ratio was 34.11 percent for the nine months ended September 30,2008 compared to 44.69 percent for the year-ago period. Our efficiency ratio was significantly impacted by the change inthe credit risk component of our fair value optioned debt and the goodwill impairment charges recorded in both periods.Excluding these items from the periods presented, our efficiency ratio improved 55 basis points during the three monthsended September 30, 2008 and was flat in the year-to-date period. The improvement during the three months endedSeptember 30, 2008 was a result of lower costs and expenses partially offset by lower net interest income and otherrevenues. The reduction in costs and expenses resulting from our on-going entity-wide initiatives to reduce costs waspartially offset by higher REO and third party collection expenses due to the current marketplace conditions.
Our effective tax rate from continuing operations was (24.9) percent and (32.1) percent for the three months and ninemonths ended September 30, 2008, respectively, compared to (13.8) percent and 555.8 percent in the year-ago periods.The effective tax rate for continuing operations for the three months ended September 30, 2008 increased as compared tothe prior year quarter primarily as a result of the effects of foreign operations which include a valuation allowance onforeign tax credit carryforwards. The effective tax rate for continuing operations for the nine months ended September 30,2008 decreased as compared to the year-ago period primarily as a result of the non-deductible goodwill impairment in theprior year period. The significant percentage changes in the effective tax rate reconciliation for the nine months endedSeptember 30, 2007 is due to the tax adjustments applied to an insignificant amount of pretax loss.
In June 2008, we decided to sell our General Motors (“GM”) MasterCard receivable portfolio, with an outstandingreceivable balance of $6.2 billion at September 30, 2008, to HSBC Bank USA in order to maximize the efficient useof capital and liquidity at each entity, subject to obtaining the necessary regulatory approval. We will, however,maintain the customer account relationships. Subsequent to the initial sale of receivables, additional volume will besold to HSBC Bank USA on a daily basis. Following the sale of the GM portfolio, we expect our net interest income,fee income and provision for credit losses will be reduced but our other income will increase due to gains from theinitial and continuing sales of GM MasterCard receivables in the future and receipt of servicing revenue on theportfolio from HSBC Bank USA. While HSBC Bank USA has applied for the required regulatory approval, wecannot predict with any degree of certainty the timing as to when or if, regulatory approval will be received and,therefore, when the related asset sale will be completed. It is not practicable to estimate the ultimate gain or loss onthe initial sale of the GM portfolio to HSBC Bank USA because the carrying value of the GM portfolio will changewith the passage of time as, due to the revolving nature of the receivables, new receivables replace run-off and theportfolio continues to be carried at the lower of cost or fair value.
Funding and Capital Domestic and international financial markets continued to be extremely volatile during the thirdquarter of 2008. New issue term debt markets were essentially open to only the highest quality industrial issuers.
44

Credit spreads for all issuers traded at historically wide levels with the most pressure on financial sector spreads. Thesignificant level of Central Bank and U.S. Treasury intervention has not yet had a significant calming effect on the debtand equity markets. While the commercial paper and short-term deposit markets remained open, investors kept thematurities of new purchases very short with a higher percentage rolling in maturities on an overnight basis.
During the third quarter of 2008, we realized a tightening of available liquidity similar to the tightening experiencedby most domestic and international financial institutions. Our strong credit ratings ensured the availability offunding in the form of commercial paper. While institutional investors increasingly moved their commercial paperinto short-term maturities, we were able to achieve our issuance target in this market and at interest rates well belowLibor rates with similar maturities offered to others.
During the third quarter of 2008, we retired $9.7 billion of term debt maturities. Through planned balance sheetreductions, the issuance of cost effective retail debt and the utilization of alternative sources of funding, we wereable to eliminate the need to issue institutional term debt in this turbulent funding environment. Continued balancesheet reductions and the anticipated liquidation of several receivable portfolios described above should significantlyreduce or eliminate our need to issue secured or unsecured term debt over the remainder of 2008 and well into 2009.
In the nine months of 2008, HINO made three capital contributions to us totaling $3.5 billion, including $1.3 billionin the third quarter, each in exchange for one share of common stock to support ongoing operations and to maintaincapital at levels we believe are prudent in the current market conditions.
Government Initiatives On October 3, 2008, the United States Congress enacted the Emergency Economic StabilizationAct of 2008 (the “EESA”) with the stated purposes of providing stability to and preventing disruption in the economy andfinancial system and protecting taxpayers. Pursuant to or in conjunction with the EESA, the U.S. Department of theTreasury (the “U.S. Treasury”) and the federal banking and thrift regulatory agencies have announced a series ofinitiatives intended to strengthen market stability, improve the strength of financial institutions and enhance marketliquidity. These initiatives can be broadly categorized as capital support initiatives and market support initiatives.
Although conceptually we support government initiatives to provide capital support, we have no plans to participatein any capital support initiatives and, in any event, are not eligible to participate in the capital support initiativesannounced to date.
As an active participant, we also support initiatives put in place to address short and medium term funding needs. OnOctober 7, 2008, the Federal Reserve Board announced the Commercial Paper Funding Facility (the “CPFF”) toprovide a liquidity backstop to U.S. issuers of commercial paper. Under the CPFF, the Federal Reserve Bank of NewYork will finance the purchase of highly-rated, U.S. dollar-denominated, unsecured and asset-backed three-monthcommercial paper from eligible issuers through its primary dealers until April 30, 2009 unless extended by the FederalReserve Board. On October 24, 2008, we received notification that we were approved for participation in the CPFFand became eligible to participate in the program beginning October 28, 2008 in an amount of up to $12.0 billion. Asof the date of this filing, however, we have not participated in the CPFF as we continue to obtain cost-effective fundingthrough our existing commercial paper funding facilities. We will continue to evaluate additional market support andother initiatives as the details of the various programs become available.
Basis of Reporting
Our consolidated financial statements are prepared in accordance with accounting principles generally accepted inthe United States (“U.S. GAAP”). Unless noted, the discussion of our financial condition and results of operationsincluded in MD&A are presented on an owned basis of reporting for continuing operations. Certain reclassificationshave been made to prior year amounts to conform to the current year presentation.
In addition to the U.S. GAAP financial results reported in our consolidated financial statements, MD&A includesreference to the following information which is presented on a non-U.S. GAAP basis:
Equity Ratios Tangible shareholders’ equity plus owned loss reserves to tangible managed assets (“TETMA + OwnedReserves”) and tangible common equity to tangible managed assets excluding HSBC acquisition purchase accountingadjustments are non-U.S. GAAP financial measures that are used by HSBC Finance Corporation management andcertain rating agencies to evaluate capital adequacy. We and certain rating agencies monitor ratios excluding the
45

impact of the HSBC acquisition purchase accounting adjustments as we believe that they represent non-cashtransactions which do not affect our business operations, cash flows or ability to meet our debt obligations. Theseratios also exclude the equity impact of SFAS No. 115, “Accounting for Certain Investments in Debt and EquitySecurities,” the equity impact of SFAS No. 133, “Accounting for Derivative Instruments and Hedging Activities,” andbeginning in 2007, the impact of the adoption of SFAS No. 159 including the subsequent changes in fair valuerecognized in earnings associated with debt for which we elected the fair value option. Preferred securities issued bycertain non-consolidated trusts are also considered equity in the TETMA + Owned Reserves calculations because oftheir long-term subordinated nature and our ability to defer dividends. Managed assets include owned assets plus loanswhich we have sold and service with limited recourse. These ratios may differ from similarly named measurespresented by other companies. The most directly comparable U.S. GAAP financial measure is the common andpreferred equity to owned assets ratio. For a quantitative reconciliation of these non-U.S. GAAP financial measures toour common and preferred equity to owned assets ratio, see “Reconciliations to U.S. GAAP Financial Measures.”
International Financial Reporting Standards Because HSBC reports results in accordance with IFRSs and IFRSsresults are used in measuring and rewarding performance of employees, our management also separately monitorsnet income under IFRSs (a non-U.S. GAAP financial measure). All purchase accounting fair value adjustmentsrelating to our acquisition by HSBC have been “pushed down” to HSBC Finance Corporation for both U.S. GAAPand IFRSs consistent with our IFRS Management Basis presentation. The following table reconciles our net incomeon a U.S. GAAP basis to net income on an IFRSs basis:
2008 2007 2008 2007
Three Months EndedSeptember 30,
Nine Months EndedSeptember 30,
(dollars are in millions)
Net loss – U.S. GAAP basis . . . . . . . . . . . . . . . . . . . . . . . . . . . $(271) $(1,102) $(1,461) $(498)Adjustments, net of tax:
Derivatives and hedge accounting (including fair valueadjustments) . . . . . . . . . . . . . . . . . . . . . . . . . . . . . . . . . . . (6) (2) (1) (1)
Intangible assets . . . . . . . . . . . . . . . . . . . . . . . . . . . . . . . . . . 12 26 45 77Loan origination. . . . . . . . . . . . . . . . . . . . . . . . . . . . . . . . . . 19 10 50 (5)Loan impairment . . . . . . . . . . . . . . . . . . . . . . . . . . . . . . . . . 7 6 41 (21)Interest recognition. . . . . . . . . . . . . . . . . . . . . . . . . . . . . . . . - 13 (11) 39Other-than-temporary impairments on available-for-sale
securities . . . . . . . . . . . . . . . . . . . . . . . . . . . . . . . . . . . . . (6) - (6) -Lower of cost or fair value adjustment for U.K. Insurance
Operations . . . . . . . . . . . . . . . . . . . . . . . . . . . . . . . . . . . . - - - (6)Loans held for resale . . . . . . . . . . . . . . . . . . . . . . . . . . . . . . 46 (3) 293 (25)Writedown on disposal of Canadian operations . . . . . . . . . . . (70) - (70) -Goodwill impairment related to Mortgage Services . . . . . . . . - (468) - (468)Loss on sale of U.K. Operations . . . . . . . . . . . . . . . . . . . . . . - - (362) -Other . . . . . . . . . . . . . . . . . . . . . . . . . . . . . . . . . . . . . . . . . . 17 13 38 87
Net loss – IFRSs basis . . . . . . . . . . . . . . . . . . . . . . . . . . . . . . . $(252) $(1,507) $(1,444) $(821)
A summary of the significant differences between U.S. GAAP and IFRSs as they impact our results are presentedbelow:
Derivatives and hedge accounting (including fair value adjustments) – The historical use of the “shortcut” and“long haul” hedge accounting methods for U.S. GAAP resulted in different cumulative adjustments to the hedgeditem for both fair value and cash flow hedges. These differences are recognized in earnings over the remaining termof the hedged items. All of the hedged relationships which previously qualified under the shortcut methodprovisions of SFAS No. 133 have been redesignated and are now either hedges under the long-haul method of hedgeaccounting or included in the fair value option election.
Intangible assets – Intangible assets under IFRSs are significantly lower than those under U.S. GAAP as the newlycreated intangibles associated with our acquisition by HSBC are reflected in goodwill for IFRSs which results in ahigher goodwill balance under IFRSs. As a result, amortization of intangible assets is lower under IFRSs.
46

Deferred loan origination costs and fees – Under IFRSs, loan origination cost deferrals are more stringent andresult in lower costs being deferred than permitted under U.S. GAAP. In addition, all deferred loan origination fees,costs and loan premiums must be recognized based on the expected life of the receivables under IFRSs as part of theeffective interest calculation while under U.S. GAAP they may be recognized on either a contractual or expectedlife basis.
Credit loss impairment provisioning – IFRSs requires a discounted cash flow methodology for estimatingimpairment on pools of homogeneous customer loans which requires the incorporation of the time value ofmoney relating to recovery estimates. Also under IFRSs, future recoveries on charged-off loans are accrued for on adiscounted basis and a recovery asset is recorded. Subsequent recoveries are recorded to earnings under U.S. GAAP,but are adjusted against the recovery asset under IFRSs. Interest is recorded based on collectibility under IFRSs.
Loans held for resale – IFRSs requires loans designated as held for resale at the time of origination to be treated astrading assets and recorded at their fair market value. Under U.S. GAAP, loans designated as held for resale arereflected as loans and recorded at the lower of amortized cost or fair value. Under U.S. GAAP, the income andexpenses related to receivables held for sale are reported similarly to loans held for investment. Under IFRSs, theincome and expenses related to receivables held for sale are reported in other operating income.
For receivables transferred to held for sale subsequent to origination, there are no accounting requirements underIFRSs for loans that management intends to sell. Accordingly, for IFRSs purposes such loans continue to beaccounted for in accordance with IAS 39 with any gain or loss recorded at the time of sale. U.S. GAAP requiresloans that management intends to sell to be transferred to a held for sale category at the lower of cost or fair value.
Interest recognition – The calculation of effective interest rates under IAS 39 requires an estimate of “all fees andpoints paid or recovered between parties to the contract” that are an integral part of the effective interest rate beincluded. U.S. GAAP generally prohibits recognition of interest income to the extent the net interest in the loanwould increase to an amount greater than the amount at which the borrower could settle the obligation. Also underU.S. GAAP, prepayment penalties are generally recognized as received.
Other-than-temporary impairment on available-for-sale securities – As a result of the guidance issued by the SECin October 2008, under U.S. GAAP we are allowed to evaluate perpetual preferred securities for potentialimpairment similar to a debt security provided there has been no evidence of deterioration in the credit of the issuerand record the unrealized losses as a component of other comprehensive income. There are no similar provisionsunder IFRSs and all impairments are reported in other operating income.
Write-down on disposal of Canadian operations – IFRSs require that operations be transferred to held for sale andcarried at the lower of cost or fair value with adjustments recorded through earnings when the decision has beenmade to dispose of the operations regardless of whether the sale will be to a third party or related party. Under U.S.GAAP, when the transfer of net assets will be between affiliates under common control, it is generally reflected as acapital transaction in the period in which the transaction occurs and carried at historical cost until that time.However, because the transfer price of our Canadian Operations will be lower than book value including goodwill, agoodwill impairment charge is recorded under U.S. GAAP through earnings in the current period. As the CanadianOperations has a higher carrying value under IFRSs, the write-down through earnings is higher under IFRSs.
Goodwill Impairment related to Mortgage Services – Goodwill levels are higher under IFRSs than U.S. GAAP asthe HSBC purchase accounting adjustments reflect higher levels of intangibles under U.S. GAAP. Consequently,the amount of goodwill allocated to our Mortgage Services business and written off in 2007 is greater under IFRSs.
Loss on sale of U.K. Operations – IFRSs do not require transfers of net assets between affiliates under commoncontrol to be recorded at historical cost with any difference between the cash proceeds reflected as a capitaltransaction. As a result, under IFRSs, the loss on sale of the U.K. Operations is reported in profit and loss.
Other – There are other less significant differences between IFRSs and U.S. GAAP including pension expense,changes in tax estimates, securitized receivables and other miscellaneous items.
47

See “Basis of Reporting” in Item 7. Management’s Discussion and Analysis of Financial Condition and Results ofOperations in our Annual Report on Form 10-K for the year ended December 31, 2007 for a more completediscussion of differences between U.S. GAAP and IFRSs.
IFRS Management Basis Reporting As previously discussed, corporate goals and individual goals of executivesare currently calculated in accordance with IFRSs under which HSBC prepares its consolidated financial state-ments. In 2006 we initiated a project to refine the monthly internal management reporting process to place a greateremphasis on IFRS management basis reporting (a non-U.S. GAAP financial measure). As a result, operating resultsare being monitored and reviewed, trends are being evaluated and decisions about allocating resources, such asemployees and capital, are being made almost exclusively on an IFRS Management Basis. IFRS Management Basisresults are IFRSs results which assume that the private label and real estate secured receivables transferred to HSBCBank USA have not been sold and remain on our balance sheet. We currently intend to sell our GM MasterCardreceivable portfolio and a portion of our domestic auto finance receivable portfolio to HSBC Bank USA, subject toregulatory approval. Upon the completion of these sales, IFRS Management Basis results will also assume thatthese portfolios have not been sold and remain on our balance sheet. Additionally, IFRS Management Basisassumes that all purchase accounting fair value adjustments relating to our acquisition by HSBC have been “pusheddown” to HSBC Finance Corporation. Operations are monitored and trends are evaluated on an IFRS ManagementBasis because the receivable sales to HSBC Bank USA were conducted primarily to appropriately fund primecustomer loans within HSBC and such receivables continue to be managed and serviced by us without regard toownership. Accordingly, our segment reporting is on an IFRS Management Basis. However, we continue to monitorcapital adequacy, establish dividend policy and report to regulatory agencies on an U.S. GAAP basis. A summary ofthe significant differences between U.S. GAAP and IFRSs as they impact our results are summarized in Note 13,“Business Segments.”
Quantitative Reconciliations of Non-U.S. GAAP Financial Measures to U.S. GAAP Financial Measures Forquantitative reconciliations of non-U.S. GAAP financial measures presented herein to the equivalent GAAP basisfinancial measures, see “Reconciliations to U.S. GAAP Financial Measures.”
48

Receivables Review
The following table summarizes receivables at September 30, 2008 and increases (decreases) over prior periods:
September 30,2008 $ % $ %
June 30,2008
September 30,2007
Increases (decreases) from
(dollars are in millions)Receivables:
Real estate secured(1) . . . . . . . . . . . . . . . . . . . . . . . . . . . . $ 75,917 $(3,362) (4.2)% $(13,015) (14.6)%Auto finance . . . . . . . . . . . . . . . . . . . . . . . . . . . . . . . . . . 8,706 (3,824) (30.5) (4,422) (33.7)Credit card . . . . . . . . . . . . . . . . . . . . . . . . . . . . . . . . . . . 19,961 (214) (1.1) (9,142) (31.4)Private label . . . . . . . . . . . . . . . . . . . . . . . . . . . . . . . . . . 1,402 (50) (3.4) 30 2.2Personal non-credit card(2) . . . . . . . . . . . . . . . . . . . . . . . . 16,668 (698) (4.0) (2,623) (13.6)Commercial and other . . . . . . . . . . . . . . . . . . . . . . . . . . . 98 (1) (1.0) (50) (33.8)
Total receivables . . . . . . . . . . . . . . . . . . . . . . . . . . . . . . . . . $122,752 $(8,149) (6.2)% $(29,222) (19.2)%
Receivables held for sale:Real estate secured . . . . . . . . . . . . . . . . . . . . . . . . . . . . . . $ 380 $ (851) (69.1)% $ 84 28.4%Auto finance . . . . . . . . . . . . . . . . . . . . . . . . . . . . . . . . . . 2,786 2,467 100.0+ 2,786 100.0Credit card . . . . . . . . . . . . . . . . . . . . . . . . . . . . . . . . . . . 7,792 (94) (1.2) 7,792 100.0Private label . . . . . . . . . . . . . . . . . . . . . . . . . . . . . . . . . . - - - (35) (100.0)
Total receivables held for sale . . . . . . . . . . . . . . . . . . . . . . . . $ 10,958 $ 1,522 16.1% $ 10,627 100+%
Total receivables and receivables held for sale:Real estate secured . . . . . . . . . . . . . . . . . . . . . . . . . . . . . . $ 76,297 $(4,213) (5.2)% $(12,931) (14.5)%Auto finance . . . . . . . . . . . . . . . . . . . . . . . . . . . . . . . . . . 11,492 (1,357) (10.6) (1,636) (12.5)Credit card . . . . . . . . . . . . . . . . . . . . . . . . . . . . . . . . . . . 27,753 (308) (1.1) (1,350) (4.6)Private label . . . . . . . . . . . . . . . . . . . . . . . . . . . . . . . . . . 1,402 (50) (3.4) (5) (.4)Personal non-credit card . . . . . . . . . . . . . . . . . . . . . . . . . . 16,668 (698) (4.0) (2,623) (13.6)Commercial and other . . . . . . . . . . . . . . . . . . . . . . . . . . . 98 (1) (1.0) (50) (33.8)
Total receivables and receivables held for sale . . . . . . . . . . . . $133,710 $(6,627) (4.7)% $(18,595) (12.2)%
(1) Real estate secured receivables are comprised of the following:
September 30,2008 $ % $ %
September 30,2007
June 30,2008
Increases (decreases) from
(dollars are in millions)Mortgage Services . . . . . . . . . . . . . . . . . . . . . . . . . . . . . . . . . . . . . . . $26,916 $(1,964) (6.8)% $ (9,442) (26.0)%Consumer Lending . . . . . . . . . . . . . . . . . . . . . . . . . . . . . . . . . . . . . . . 47,266 (1,164) (2.4) (2,981) (5.9)Canadian and all other . . . . . . . . . . . . . . . . . . . . . . . . . . . . . . . . . . . . 1,735 (234) (11.9) (592) (25.4)
Total real estate secured . . . . . . . . . . . . . . . . . . . . . . . . . . . . . . . . . . . $75,917 $(3,362) (4.2)% $(13,015) (14.6)%
(2) Personal non-credit card receivables are comprised of the following:
September 30,2008 $ % $ %
September 30,2007
June 30,2008
Increases (decreases) from
(dollars are in millions)Domestic personal non-credit card . . . . . . . . . . . . . . . . . . . . . . . . . . . . . . . $12,747 $(460) (3.5)% $(1,636) (11.4)%Personal homeowner loans. . . . . . . . . . . . . . . . . . . . . . . . . . . . . . . . . . . . . 3,308 (186) (5.3) (771) (18.9)Canadian personal non-credit card . . . . . . . . . . . . . . . . . . . . . . . . . . . . . . . . 613 (52) (7.8) (216) (26.1)
Total personal non-credit card . . . . . . . . . . . . . . . . . . . . . . . . . . . . . . . . . . $16,668 $(698) (4.0)% $(2,623) (13.6)%
49

Real estate secured receivables can be further analyzed as follows:
September 30,2008 $ % $ %
June 30,2008
September 30,2007
Increases (decreases) from
(dollars are in millions)
Real estate secured:
Closed-end:
First lien . . . . . . . . . . . . . . . . . . . . . . . . . . . . . . . . $63,822 $(2,341) (3.5)% $ (9,043) (12.4)%
Second lien . . . . . . . . . . . . . . . . . . . . . . . . . . . . . . 9,327 (836) (8.2) (2,951) (24.0)
Revolving:
First lien . . . . . . . . . . . . . . . . . . . . . . . . . . . . . . . . 250 (4) (1.6) (223) (47.1)
Second lien . . . . . . . . . . . . . . . . . . . . . . . . . . . . . . 2,518 (181) (6.7) (798) (24.1)
Total real estate secured(1) . . . . . . . . . . . . . . . . . . . . . . . $75,917 $(3,362) (4.2)% $(13,015) (14.6)%
(1) Excludes receivables held for sale. Real estate secured receivables held for sale included $380 million, $1.2 billion and $296 millionprimarily of closed-end, first lien receivables at September 30, 2008, June 30, 2008 and September 30, 2007, respectively.
The following table summarizes various real estate secured receivables information (excluding receivables held forsale) for our Mortgage Services and Consumer Lending businesses:
MortgageServices
ConsumerLending
MortgageServices
ConsumerLending
MortgageServices
ConsumerLending
September 30, 2008 June 30, 2008 September 30, 2007
(in millions)
Fixed rate . . . . . . . . . . . . . . . . . . . . . . $15,080(1) $44,848(2) $15,945(1) $45,713(2) $19,266(1) $47,070(2)
Adjustable rate . . . . . . . . . . . . . . . . . . . 11,836 2,418 12,935 2,717 17,092 3,177
Total . . . . . . . . . . . . . . . . . . . . . . . . . . $26,916 $47,266 $28,880 $48,430 $36,358 $50,247
First lien . . . . . . . . . . . . . . . . . . . . . . . $22,104 $41,104 $23,533 $41,941 $29,009 $43,337
Second lien . . . . . . . . . . . . . . . . . . . . . 4,812 6,162 5,347 6,489 7,349 6,910
Total . . . . . . . . . . . . . . . . . . . . . . . . . . $26,916 $47,266 $28,880 $48,430 $36,358 $50,247
Adjustable rate . . . . . . . . . . . . . . . . . . . $ 9,654 $ 2,418 $10,342 $ 2,717 $12,861 $ 3,177
Interest only. . . . . . . . . . . . . . . . . . . . . 2,182 - 2,593 - 4,231 -
Total adjustable rate . . . . . . . . . . . . . . . $11,836 $ 2,418 $12,935 $ 2,717 $17,092 $ 3,177
Total stated income . . . . . . . . . . . . . . . $ 5,815 $ - $ 6,516 $ - $ 8,691 $ -
(1) Includes fixed rate interest-only loans of $351 million at September 30, 2008, $376 million at June 30, 2008 and $455 million atSeptember 30, 2007.
(2) Includes fixed rate interest-only loans of $46 million at September 30, 2008, $47 million at June 30, 2008 and $50 million at September 30,2007.
50

The following table summarizes by lien position the Consumer Lending real estate secured loans originated andacquired between January 1, 2006 and December 31, 2007 as a percentage of the total portfolio which wereoutstanding as of the following dates:
As of First Lien Second Lien
Consumer Lending’s Receivables Originated or Acquired Between January 1, 2006 and December 31, 2007 as a Percentage of TotalPortfolio
September 30, 2008 . . . . . . . . . . . . . . . . . . . . . . . . . . . . . . . . . . . . . . . . . . . . . . . . . 48% 67%June 30, 2008 . . . . . . . . . . . . . . . . . . . . . . . . . . . . . . . . . . . . . . . . . . . . . . . . . . . . . . 49 66
September 30, 2007 . . . . . . . . . . . . . . . . . . . . . . . . . . . . . . . . . . . . . . . . . . . . . . . . . 49 64
The following table summarizes by lien position the Mortgage Services real estate secured loans originated andacquired subsequent to December 31, 2004 as a percentage of the total portfolio which were outstanding as of thefollowing dates:
As of First Lien Second LienMortgage Services’ Receivables Originated or Acquired after December 31, 2004 as a Percentage of Total Portfolio
September 30, 2008 . . . . . . . . . . . . . . . . . . . . . . . . . . . . . . . . . . . . . . . . . . . . . . . . . 75% 89%June 30, 2008 . . . . . . . . . . . . . . . . . . . . . . . . . . . . . . . . . . . . . . . . . . . . . . . . . . . . . . 74 89September 30, 2007 . . . . . . . . . . . . . . . . . . . . . . . . . . . . . . . . . . . . . . . . . . . . . . . . . 75 90
Receivable decreases since September 30, 2007 Real estate secured receivables decreased from the year-agoperiod. Lower receivable balances in our Mortgage Services business resulted from our decision in March 2007 todiscontinue new correspondent channel acquisitions. The balance of this portfolio will continue to decline goingforward as the receivable balances liquidate. The decrease also includes portfolio sales of real estate securedreceivables with a fair value of $403 million from our Mortgage Services business. The lower real estate securedreceivable levels in our Consumer Lending business resulted from the actions taken since mid-2007 to reduce riskgoing forward as previously discussed. These growth limiting and risk reducing actions, when coupled with asignificant reduction in secondary market demand for subprime loans across the industry will continue to reduce thebalance of our Consumer Lending real estate secured receivables in the foreseeable future. The decrease in theConsumer Lending real estate secured receivable portfolio also reflects portfolio sales of receivables of $557 millionin the third quarter of 2008. The decreases in real estate secured receivables were partially offset in both ourMortgage Services and Consumer Lending businesses by a decline in loan prepayments due to fewer refinancingopportunities for our customers due to the previously discussed trends impacting the mortgage lending industry.Real estate secured receivable balances also reflect $267 million of receivables which were previously originatedwith the intent to hold that have been transferred to held for sale as of September 30, 2008.
Auto finance receivables decreased as a result of actions taken since mid-2007 to reduce risk in the dealer networkportfolio including the decision in March 2008 to discontinue our dealer relationships in several select states,primarily in the Northeast, and to discontinue certain other product offerings. Auto finance receivable balances atSeptember 30, 2008 also reflect the sale of $319 million of auto finance receivables in our Canadian operations andthe transfer of a portion of our domestic auto finance receivable portfolio with a fair value of $2.8 billion toreceivables held for sale. In July 2008, we decided to discontinue new auto loan originations from the dealer anddirect-to-consumer channels although we will continue to offer auto loans in our Consumer Lending branch officesuntil we establish an alliance with a third party provider. As a result, the balance of the auto finance portfolio willcontinue to decline going forward as the receivable balances liquidate. Credit card receivables decreased over theyear-ago period due to the actions taken beginning in the fourth quarter of 2007 to slow receivable growth asdiscussed above. Credit card receivable balances at September 30, 2008 also reflect the transfer of $7.8 billion toreceivables held for sale. Private label receivables were flat compared with the year-ago period as the impact ofsigning a new agreement with a significant Canadian retail partner in May 2007 was offset by the continued run-offof the Consumer Lending retail installment receivable portfolio. Personal non-credit card receivables decreasedfrom the year-ago period as a result of the actions taken since mid-2007 to reduce risk going forward as previouslydiscussed.
51

Receivable decreases since June 30, 2008 Real estate secured receivables have decreased since June 30, 2008. Asdiscussed above, our Mortgage Services real estate secured portfolio has continued to liquidate during the currentquarter and our Consumer Lending real estate secured portfolio reflects the actions taken since mid-2007 to reducerisk in our receivable portfolios. The decline in loan prepayments has continued during the third quarter of 2008 inboth our Mortgage Services and Consumer Lending businesses. Decreases in our credit card, auto finance andpersonal non-credit card receivables were due to the changes in product offerings beginning in mid-2007 aspreviously discussed above. As it relates to the decrease in auto finance receivables, the further changes in productofferings in the first quarter of 2008, as discussed above, as well as the decision in July 2008 to discontinue new autoloan originations from the dealer and direct-to-consumer channels have significantly lowered origination volumesin the current quarter. Auto finance receivable balances at September 30, 2008 also reflect the transfer of $2.8 billionto receivables held for sale during the third quarter of 2008.
Receivables held for sale increased during the three months ended September 30, 2008 primarily as a result of thetransfer of $2.9 billion of real estate secured and domestic auto finance receivables to receivables held for sale. Thisincrease was partially offset by portfolio sales of $960 million of real estate secured receivables and $319 million ofauto finance receivables during the quarter.
Results of Operations
Unless noted otherwise, the following discusses amounts from continuing operations reported in our consolidatedstatement of income.
Net interest income The following table summarizes net interest income:
Three months ended September 30, 2008 (1) 2007 (1) Amount %
Increase(decrease)
(dollars are in millions)
Finance and other interest income . . . . . . . . . . . . . . . $3,844 10.86% $4,571 11.68% $(727) (15.9)%
Interest expense . . . . . . . . . . . . . . . . . . . . . . . . . . . . 1,534 4.33 1,972 5.04 (438) (22.2)
Net interest income . . . . . . . . . . . . . . . . . . . . . . . . . . $2,310 6.53% $2,599 6.64% $(289) (11.1)%
Nine months ended September 30, 2008 (1) 2007 (1) Amount %
Increase(decrease)
(dollars are in millions)
Finance and other interest income . . . . . . . . . . . . . $12,194 11.00% $13,677 11.48% $(1,483) (10.8)%
Interest expense . . . . . . . . . . . . . . . . . . . . . . . . . . 4,990 4.50 5,955 4.99 (965) (16.2)
Net interest income . . . . . . . . . . . . . . . . . . . . . . . $ 7,204 6.50% $ 7,722 6.49% $ (518) (6.7)%
(1) % Columns: comparison to average owned interest-earning assets.
The decreases in net interest income during the quarter and year-to-date periods were due to lower averagereceivables, lower origination volumes and lower overall yields, partially offset by lower interest expense. With theexception of auto finance and our Canadian private label receivables during the current quarter, yields decreased forall products due to increased levels of loan modifications and other hardship repricings, the impact of deteriorationin credit quality, including growth in non-performing assets, lower amortization of net deferred fees due to lowerloan prepayments as more fully discussed below and decreases in rates on variable rate products which reflectmarket rate movements. These decreases were partially offset by increased levels of higher yielding products suchas credit cards receivables, including receivables held for sale, as well as a shift in mix to higher yielding ConsumerLending real estate secured receivables resulting from the decrease in the lower yielding Mortgage Services realestate secured portfolio. Additionally, these higher yielding Consumer Lending real estate secured receivables areremaining on the balance sheet longer due to lower prepayment rates. The lower interest expense during the quarterand year-to-date periods was due to lower average rates for short-term borrowings on lower average borrowings,
52

partially offset by refinancing activities subsequent to September 30, 2007 which occurred at higher interest rates.The lower average rates for short-term borrowings reflect actions taken by the Federal Reserve which decreasedshort-term interest rates by 325 basis points since September 30, 2007. Amortization of purchase accounting fairvalue adjustments increased net interest income by $26 million during the three months ended September 30, 2008and $90 million during the nine month period ended September 30, 2008. Amortization of purchase accounting fairvalue adjustments increased net interest income by $28 million during the three months ended September 30, 2007and $104 million during the nine month period ended September 30, 2007.
Net interest margin decreased during the three months ended September 30, 2008 primarily due to the lower overallyield on our receivable portfolio, as discussed above, partially offset by lower funding costs. During the year-to-dateperiod net interest margin was flat as the lower overall yields were offset by the lower funding costs. The followingtable shows the impact of these items on net interest margin at September 30, 2008:
Three MonthsEnded
Nine MonthsEnded
Net interest margin – September 30, 2007 . . . . . . . . . . . . . . . . . . . . . . . . . . . . . . 6.64% 6.49%
Impact to net interest margin resulting from:
Receivable yields:
Receivable pricing . . . . . . . . . . . . . . . . . . . . . . . . . . . . . . . . . . . . . . . . . . . . (.46) (.25)
Receivable mix . . . . . . . . . . . . . . . . . . . . . . . . . . . . . . . . . . . . . . . . . . . . . . .10 .23Impact of non-performing assets . . . . . . . . . . . . . . . . . . . . . . . . . . . . . . . . . (.47) (.47)
Cost of funds . . . . . . . . . . . . . . . . . . . . . . . . . . . . . . . . . . . . . . . . . . . . . . . . . .70 .50
Other . . . . . . . . . . . . . . . . . . . . . . . . . . . . . . . . . . . . . . . . . . . . . . . . . . . . . . . .02 -
Net interest margin – September 30, 2008 . . . . . . . . . . . . . . . . . . . . . . . . . . . . . . 6.53% 6.50%
The varying maturities and repricing frequencies of both our assets and liabilities expose us to interest rate risk.When the various risks inherent in both the asset and the debt do not meet our desired risk profile, we use derivativefinancial instruments to manage these risks to acceptable interest rate risk levels. See “Risk Management” foradditional information regarding interest rate risk and derivative financial instruments.
Provision for credit losses The following table summarizes provision for credit losses:
2008 2007 Amount %
Increase(decrease)
(dollars are in millions)
Three months ended September 30, . . . . . . . . . . . . . . . . . . . . . . . . . . . . $3,821 $3,134 $ 687 21.9%
Nine months ended September 30, . . . . . . . . . . . . . . . . . . . . . . . . . . . . . 9,944 6,480 3,464 53.5
Our provision for credit losses increased during the three and nine months ended September 30, 2008 as comparedto the year-ago periods primarily due to higher credit loss estimates in our Mortgage Services and ConsumerLending businesses as well as in our credit card receivable portfolio and, to a lesser extent, in our auto financereceivable portfolio due to the following:
• Credit loss estimates in our Consumer Lending business increased primarily in our real estate securedreceivable portfolio driven by an accelerated deterioration of portions of that portfolio which began in thesecond half of 2007. Charge-off and delinquency continued to increase, including higher roll rates, duringthe first nine months of 2008 due to the marketplace changes as previously discussed. Lower receivable run-off, portfolio seasoning and higher loss severities due to continued deterioration in real estate values incertain markets also resulted in a higher real estate secured credit loss provision, as did rising unemploymentrates in certain markets and continued weakening in the U.S. economy. The magnitude of the higherdelinquency trends increased significantly in the third quarter of 2008, particularly in the first-lien portionsof its 2006 and 2007 real estate secured receivable vintages, and higher delinquency levels in the 30- and60-day delinquency buckets. As a result, dollars of two-months-and-over contractual delinquency in ourConsumer Lending real estate secured receivable portfolio at September 30, 2008 were $1,088 million, or
53

39 percent, higher than delinquency levels at June 30, 2008 and $1,766 million, or 84 percent, higher thandelinquency levels at December 31, 2007. Credit loss estimates for Consumer Lending’s personal non-creditcard portfolio increased during the nine months ended September 30, 2008 due to higher levels of charge-offresulting from a deterioration in the 2006 and 2007 vintages which was more pronounced in certaingeographic regions, increased levels of personal bankruptcy filings and continued weakening in theU.S. economy. During the third quarter, credit loss estimates for Consumer Lending’s personal non-creditcard portfolio decreased due to stabilization in delinquency levels and lower receivable levels.
• Mortgage Services experienced higher levels of charge-offs and delinquency, including higher roll rates, asthe portfolio continued to season and progress as expected into later stages of delinquency and charge-off.Additionally, since the second half of 2007, the credit loss estimates on our Mortgage Services portfolio haveincreased as receivable run-off continued to slow, loss severities increased due to declines in real estatevalues and the adverse mortgage lending industry trends we had been experiencing worsened compared tothe first nine months of 2007. Rising unemployment rates in certain markets and continued weakening in theU.S. economy also contributed to the increase.
• Credit loss estimates in our credit card receivable portfolio increased, primarily reflecting higher net charge-offs and delinquency levels due to portfolio seasoning, increased levels of personal bankruptcy filings,continued weakening in the U.S. economy including rising unemployment rates, higher delinquency levelsin the 30- and 60-day delinquency buckets and lower recovery rates. The increase in delinquency levels ismost pronounced in the geographic regions most impacted by the housing market downturn and risingunemployment rates.
• Credit loss estimates for domestic auto finance receivables increased as a result of increased charge-offs anddelinquency due to rising unemployment rates and the deteriorating U.S. economic environment asdiscussed above. Higher loss severities, particularly for less fuel efficient vehicles, also contributed tothe increase.
The provision for credit losses includes an incremental provision of approximately $55 million recorded in the thirdquarter of 2008 related to the impact of Hurricane Ike which struck Galveston, Texas and the Louisiana coast inSeptember 2008. The provision for credit losses was also higher during the nine month periods ended September 30,2008 as a result of the transfer of real estate secured, auto finance and credit card receivables to receivables held forsale which totaled $10.8 billion at September 30, 2008. These receivables are now carried at the lower of cost or fairvalue which resulted in a cumulative lower of cost or fair value adjustment of $713 million. Of this amount,$230 million was recorded as a component of provision for credit losses during the three months endedSeptember 30, 2008 and $415 million was recorded in the year-to-date period. See Note 6, “Receivables andReceivables Held for Sale,” in the accompanying consolidated financial statements for additional informationregarding the lower of cost or fair value adjustment for these receivables held for sale.
Credit loss provision of $3,821 million during the third quarter of 2008 was $575 million higher than the secondquarter of 2008. The increase was primarily due to a higher provision for credit losses in our Consumer Lending realestate secured portfolio as they have seen a significant increase in delinquency, particularly in the first-lien portionsof its 2006 and 2007 real estate secured receivable vintages, as well as higher delinquency levels in the 30- and60-day delinquency buckets in both the Consumer Lending real estate secured and credit card receivablesportfolios. Additionally, during the third quarter of 2008 we transferred $2.9 billion of real estate secured andauto finance receivables to held for sale which resulted in a cumulative lower of cost or fair value adjustment of$327 million of which $230 million was recorded as a component of provision for credit losses during the quarter.See Note 6, “Receivables and Receivables Held for Sale,” in the accompanying consolidated financial statementsfor additional information regarding the lower of cost or fair value adjustment for these receivables held for sale.
Net charge-off dollars increased $1,019 million during the three months ended September 30, 2008 as compared tothe year-ago quarter and $3,232 million during the nine months ended September 30, 2008 as compared to the year-ago period. This increase was driven by the impact of the marketplace and broader economic conditions describedpreviously in our Mortgage Services and Consumer Lending businesses and increased levels of personal bankruptcyfilings. Also contributing to the increase in charge-offs related to our credit card receivable portfolio is portfolioseasoning and lower recovery rates. Increases in net charge-off dollars during the third quarter of 2008, were
54

partially offset by the transfer of $6.2 billion credit card receivables in the GM MasterCard portfolio previously heldfor investment purposes to receivables held for sale in the second quarter of 2008 which are now carried at the lowerof cost or fair value. Had the GM MasterCard portfolio not been transferred to receivables held for sale at June 30,2008, net charge-off dollars would have been higher.
The provision for credit losses may vary from quarter to quarter depending on the product mix and credit quality ofloans in our portfolio. See “Credit Quality” included in this MD&A for further discussion of factors affecting theprovision for credit losses.
Other revenues The following table summarizes other revenues:
Three months ended September 30, 2008 2007 Amount %
Increase(decrease)
(dollars are in millions)
Insurance revenue . . . . . . . . . . . . . . . . . . . . . . . . . . . . . . . . . . . . . . . . $ 108 $ 127 $ (19) (15.0)%
Investment income (loss) . . . . . . . . . . . . . . . . . . . . . . . . . . . . . . . . . . . (22) 29 (51) (100+)
Derivative income (expense) . . . . . . . . . . . . . . . . . . . . . . . . . . . . . . . . 30 4 26 100+
Gain (loss) on debt designated at fair value and related derivatives . . . . 1,709 519 1,190 100+
Fee income . . . . . . . . . . . . . . . . . . . . . . . . . . . . . . . . . . . . . . . . . . . . . 472 653 (181) (27.7)
Enhancement services revenue . . . . . . . . . . . . . . . . . . . . . . . . . . . . . . . 175 167 8 4.8
Taxpayer financial services revenue (expense) . . . . . . . . . . . . . . . . . . . 10 (27) 37 (100+)
Gain on receivable sales to HSBC affiliates . . . . . . . . . . . . . . . . . . . . . 66 94 (28) (29.8)
Servicing and other fees from HSBC affiliates . . . . . . . . . . . . . . . . . . . 125 126 (1) (0.8)
Other (expense) income . . . . . . . . . . . . . . . . . . . . . . . . . . . . . . . . . . . . (127) (10) (117) 100+
Total other revenues . . . . . . . . . . . . . . . . . . . . . . . . . . . . . . . . . . . . . . $2,546 $1,682 $ 864 51.4%
Nine months ended September 30, 2008 2007 Amount %
Increase(decrease)
(dollars are in millions)
Insurance revenue . . . . . . . . . . . . . . . . . . . . . . . . . . . . . . . . . . . . . . . . $ 321 $ 361 $ (40) (11.1)%
Investment income (loss) . . . . . . . . . . . . . . . . . . . . . . . . . . . . . . . . . . . 23 78 (55) (70.5)
Derivative income (expense) . . . . . . . . . . . . . . . . . . . . . . . . . . . . . . . . 61 (48) 109 (100+)
Gain on debt designated at fair value and related derivatives . . . . . . . . . 2,021 533 1,488 100+
Fee income . . . . . . . . . . . . . . . . . . . . . . . . . . . . . . . . . . . . . . . . . . . . . 1,384 1,840 (456) (24.8)
Enhancement services revenue . . . . . . . . . . . . . . . . . . . . . . . . . . . . . . . 532 465 67 14.4
Taxpayer financial services revenue . . . . . . . . . . . . . . . . . . . . . . . . . . . 165 216 (51) (23.6)
Gain on receivable sales to HSBC affiliates . . . . . . . . . . . . . . . . . . . . . 188 298 (110) (36.9)
Servicing and other fees from HSBC affiliates . . . . . . . . . . . . . . . . . . . 381 374 7 1.9
Other (expense) income . . . . . . . . . . . . . . . . . . . . . . . . . . . . . . . . . . . . (266) (18) (248) 100+
Total other revenues . . . . . . . . . . . . . . . . . . . . . . . . . . . . . . . . . . . . . . $4,810 $4,099 $ 711 17.3%
Insurance revenue decreased in the three and nine months ended September 30, 2008 in our domestic operations asa result of lower credit related premiums due to reduced loan origination volumes and changes in product offeringsas well as a reduction in reinsurance during the quarter and year-to-date periods.
Investment income (loss), which includes income on securities available for sale in our insurance business andrealized gains and losses from the sale of securities, was lower during both periods due to the recording of other-than-temporary impairment charges of $40 million during the three months ended September 30, 2008 and$55 million in the year-to-date period. The lower investment income in the year-to-date period was partially offsetby lower amortization of fair value adjustments.
55

Derivative income (expense) includes realized and unrealized gains and losses on derivatives which do not qualifyas effective hedges under SFAS No. 133 as well as the ineffectiveness on derivatives which are qualifying hedges.Derivative income (expense) is summarized in the table below:
Three months ended September 30, 2008 2007
(in millions)
Net realized gains (losses) . . . . . . . . . . . . . . . . . . . . . . . . . . . . . . . . . . . . . . . . . . . . . . . . . . . . . $ (5) $(7)
Mark-to-market on derivatives which do not qualify as effective hedges . . . . . . . . . . . . . . . . . . . 7 8
Ineffectiveness. . . . . . . . . . . . . . . . . . . . . . . . . . . . . . . . . . . . . . . . . . . . . . . . . . . . . . . . . . . . . . 28 3
Total . . . . . . . . . . . . . . . . . . . . . . . . . . . . . . . . . . . . . . . . . . . . . . . . . . . . . . . . . . . . . . . . . . . . . $30 $ 4
Nine months ended September 30, 2008 2007
(in millions)
Net realized gains (losses). . . . . . . . . . . . . . . . . . . . . . . . . . . . . . . . . . . . . . . . . . . . . . . . . . . . . $ - $(21)
Mark-to-market on derivatives which do not qualify as effective hedges . . . . . . . . . . . . . . . . . . . 20 (4)
Ineffectiveness . . . . . . . . . . . . . . . . . . . . . . . . . . . . . . . . . . . . . . . . . . . . . . . . . . . . . . . . . . . . . 41 (23)
Total . . . . . . . . . . . . . . . . . . . . . . . . . . . . . . . . . . . . . . . . . . . . . . . . . . . . . . . . . . . . . . . . . . . . $61 $(48)
Derivative income increased during the three and nine months ended September 30, 2008 due to overall changes ininterest rates since September 30, 2007. Net realized losses decreased in both periods due to the general reduction ofshort term interest rates in the U.S. and increases in foreign short term interest rates, particularly Euro and Yen rates.The value of mark-to-market derivatives which do not qualify as effective hedges also increased during the ninemonth period from the changes in the U.S. and foreign interest rates. Cash flow and fair value hedge ineffectivenessin both periods were favorable as compared to the year-ago periods due largely to changes in interest ratesassociated with certain swaps approaching their maturity and overall changes in U.S. and foreign interest rates.Designation of swaps as effective hedges reduces the volatility that would otherwise result from mark-to-marketaccounting. All derivatives are economic hedges of the underlying debt instruments regardless of the accountingtreatment.
Net income volatility, whether based on changes in interest rates for swaps which do not qualify for hedgeaccounting or ineffectiveness recorded on our qualifying hedges under the long haul method of accounting, impactsthe comparability of our reported results between periods. Accordingly, derivative income for the three and ninemonths ended September 30, 2008 should not be considered indicative of the results for any future periods.
Gain (loss) on debt designated at fair value and related derivatives reflects fair value changes on our fixed rate debtaccounted for under FVO as well as the fair value changes and realized gains (losses) on the related derivativesassociated with debt designated at fair value. These components are summarized in the table below:
Three months ended September 30, 2008 2007
(in millions)
Mark-to-market on debt designated at fair value:
Interest rate component . . . . . . . . . . . . . . . . . . . . . . . . . . . . . . . . . . . . . . . . . . . . . . . . . . $ (265) $(723)
Credit risk component . . . . . . . . . . . . . . . . . . . . . . . . . . . . . . . . . . . . . . . . . . . . . . . . . . . 1,592 608
Total mark-to-market on debt designated at fair value . . . . . . . . . . . . . . . . . . . . . . . . . . . . . 1,327 (115)Mark-to-market on the related derivatives . . . . . . . . . . . . . . . . . . . . . . . . . . . . . . . . . . . . . . 278 719
Net realized gains (losses) on the related derivatives . . . . . . . . . . . . . . . . . . . . . . . . . . . . . . 104 (85)
Total . . . . . . . . . . . . . . . . . . . . . . . . . . . . . . . . . . . . . . . . . . . . . . . . . . . . . . . . . . . . . . . . . $1,709 $ 519
56
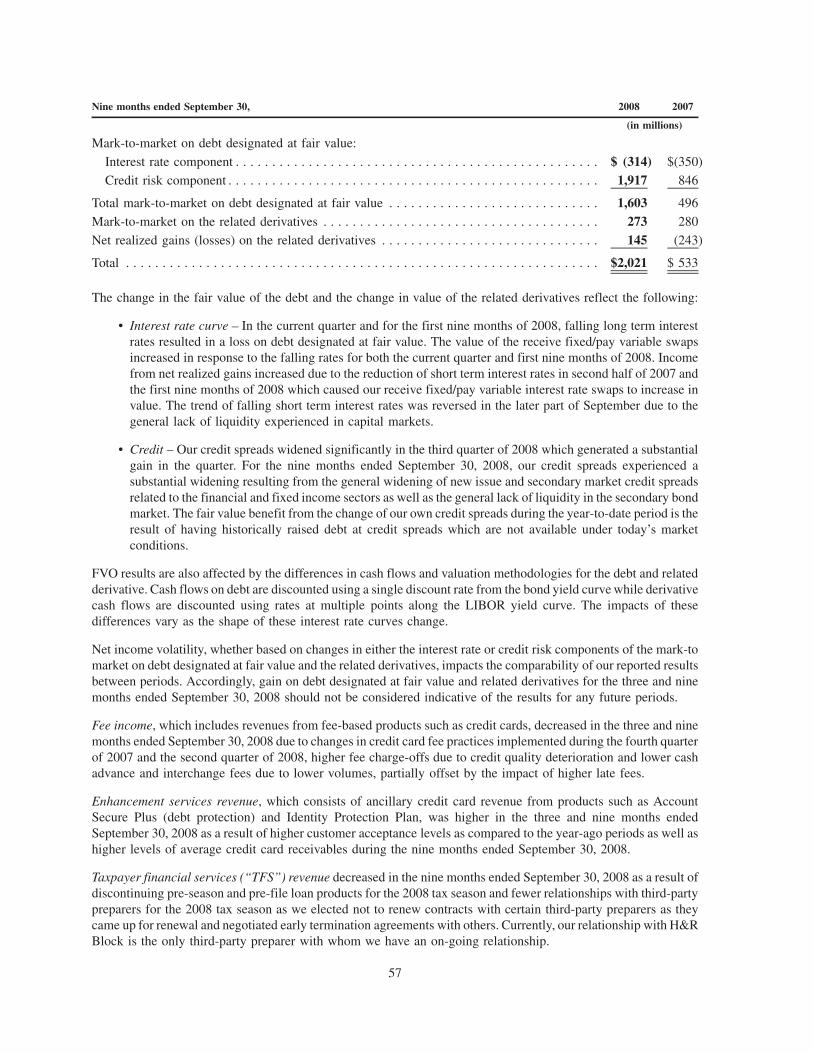
Nine months ended September 30, 2008 2007
(in millions)
Mark-to-market on debt designated at fair value:
Interest rate component . . . . . . . . . . . . . . . . . . . . . . . . . . . . . . . . . . . . . . . . . . . . . . . . . . $ (314) $(350)
Credit risk component . . . . . . . . . . . . . . . . . . . . . . . . . . . . . . . . . . . . . . . . . . . . . . . . . . . 1,917 846
Total mark-to-market on debt designated at fair value . . . . . . . . . . . . . . . . . . . . . . . . . . . . . 1,603 496
Mark-to-market on the related derivatives . . . . . . . . . . . . . . . . . . . . . . . . . . . . . . . . . . . . . . 273 280
Net realized gains (losses) on the related derivatives . . . . . . . . . . . . . . . . . . . . . . . . . . . . . . 145 (243)
Total . . . . . . . . . . . . . . . . . . . . . . . . . . . . . . . . . . . . . . . . . . . . . . . . . . . . . . . . . . . . . . . . . $2,021 $ 533
The change in the fair value of the debt and the change in value of the related derivatives reflect the following:
• Interest rate curve – In the current quarter and for the first nine months of 2008, falling long term interestrates resulted in a loss on debt designated at fair value. The value of the receive fixed/pay variable swapsincreased in response to the falling rates for both the current quarter and first nine months of 2008. Incomefrom net realized gains increased due to the reduction of short term interest rates in second half of 2007 andthe first nine months of 2008 which caused our receive fixed/pay variable interest rate swaps to increase invalue. The trend of falling short term interest rates was reversed in the later part of September due to thegeneral lack of liquidity experienced in capital markets.
• Credit – Our credit spreads widened significantly in the third quarter of 2008 which generated a substantialgain in the quarter. For the nine months ended September 30, 2008, our credit spreads experienced asubstantial widening resulting from the general widening of new issue and secondary market credit spreadsrelated to the financial and fixed income sectors as well as the general lack of liquidity in the secondary bondmarket. The fair value benefit from the change of our own credit spreads during the year-to-date period is theresult of having historically raised debt at credit spreads which are not available under today’s marketconditions.
FVO results are also affected by the differences in cash flows and valuation methodologies for the debt and relatedderivative. Cash flows on debt are discounted using a single discount rate from the bond yield curve while derivativecash flows are discounted using rates at multiple points along the LIBOR yield curve. The impacts of thesedifferences vary as the shape of these interest rate curves change.
Net income volatility, whether based on changes in either the interest rate or credit risk components of the mark-tomarket on debt designated at fair value and the related derivatives, impacts the comparability of our reported resultsbetween periods. Accordingly, gain on debt designated at fair value and related derivatives for the three and ninemonths ended September 30, 2008 should not be considered indicative of the results for any future periods.
Fee income, which includes revenues from fee-based products such as credit cards, decreased in the three and ninemonths ended September 30, 2008 due to changes in credit card fee practices implemented during the fourth quarterof 2007 and the second quarter of 2008, higher fee charge-offs due to credit quality deterioration and lower cashadvance and interchange fees due to lower volumes, partially offset by the impact of higher late fees.
Enhancement services revenue, which consists of ancillary credit card revenue from products such as AccountSecure Plus (debt protection) and Identity Protection Plan, was higher in the three and nine months endedSeptember 30, 2008 as a result of higher customer acceptance levels as compared to the year-ago periods as well ashigher levels of average credit card receivables during the nine months ended September 30, 2008.
Taxpayer financial services (“TFS”) revenue decreased in the nine months ended September 30, 2008 as a result ofdiscontinuing pre-season and pre-file loan products for the 2008 tax season and fewer relationships with third-partypreparers for the 2008 tax season as we elected not to renew contracts with certain third-party preparers as theycame up for renewal and negotiated early termination agreements with others. Currently, our relationship with H&RBlock is the only third-party preparer with whom we have an on-going relationship.
57

Gain on receivable sales to HSBC affiliates consists primarily of daily sales of domestic private label receivableoriginations and certain credit card account originations to HSBC Bank USA. In the three and nine months endedSeptember 30, 2008, gain on receivable sales to HSBC affiliates decreased primarily due to lower premiums on ourdomestic private label receivables reflecting the deteriorating credit environment, partially offset by higheroriginations and premiums on co-brand credit card accounts. As previously discussed, in the second quarter of2008 our Consumer Lending business began originating loans that conform to underwriting criteria set forth by theOffice of Federal Housing Enterprise Oversight (“Conforming Real Estate Secured Loans”) and selling these loansto HSBC Bank USA.
Servicing and other fees from HSBC affiliates, which represents revenue received under service level agreementsunder which we service credit card and domestic private label receivables as well as real estate secured and autofinance receivables for HSBC affiliates, was essentially flat in both periods as the levels of receivables beingserviced on behalf of HSBC Bank USA during the first nine months of 2008 are in line with receivable levels in theyear-ago periods.
Other income decreased in both periods primarily due to a lower of cost or fair value adjustment of $97 million and$298 million during the quarter and year-to-date period, respectively, from the transfer of receivables previouslyheld for investment to receivables held for sale. In the year-to-date period, these decreases were partially offset byhigher gains on miscellaneous asset sales, including real estate investments. In the third quarter of 2007, werecorded a gain on the sale of a portion of our portfolio of MasterCard Class B shares of $115 million which waspartially offset by losses on real estate secured receivables held for sale by our Decision One mortgage operations of$99 million and $189 million in the three and nine months ended September 30, 2007, respectively.
Costs and expenses
The following table summarizes total costs and expenses:
Three months ended September 30, 2008 2007 Amount %
Increase(decrease)
(dollars are in millions)
Salaries and employee benefits . . . . . . . . . . . . . . . . . . . . . . . . . . . . . . $ 508 $ 544 $ (36) (6.6)%
Sales incentives . . . . . . . . . . . . . . . . . . . . . . . . . . . . . . . . . . . . . . . . . . 10 51 (41) (80.4)
Occupancy and equipment expenses . . . . . . . . . . . . . . . . . . . . . . . . . . . 54 66 (12) (18.2)
Other marketing expenses . . . . . . . . . . . . . . . . . . . . . . . . . . . . . . . . . . 75 161 (86) (53.4)
Other servicing and administrative expenses . . . . . . . . . . . . . . . . . . . . . 329 278 51 18.3
Support services from HSBC affiliates . . . . . . . . . . . . . . . . . . . . . . . . . 256 288 (32) (11.1)
Amortization of intangibles . . . . . . . . . . . . . . . . . . . . . . . . . . . . . . . . . 42 63 (21) (33.3)
Policyholders’ benefits. . . . . . . . . . . . . . . . . . . . . . . . . . . . . . . . . . . . . 51 64 (13) (20.3)
Goodwill impairment charge . . . . . . . . . . . . . . . . . . . . . . . . . . . . . . . . 71 881 (810) (91.9)
Total costs and expenses . . . . . . . . . . . . . . . . . . . . . . . . . . . . . . . . . . . $1,396 $2,396 $(1,000) (41.7)%
58
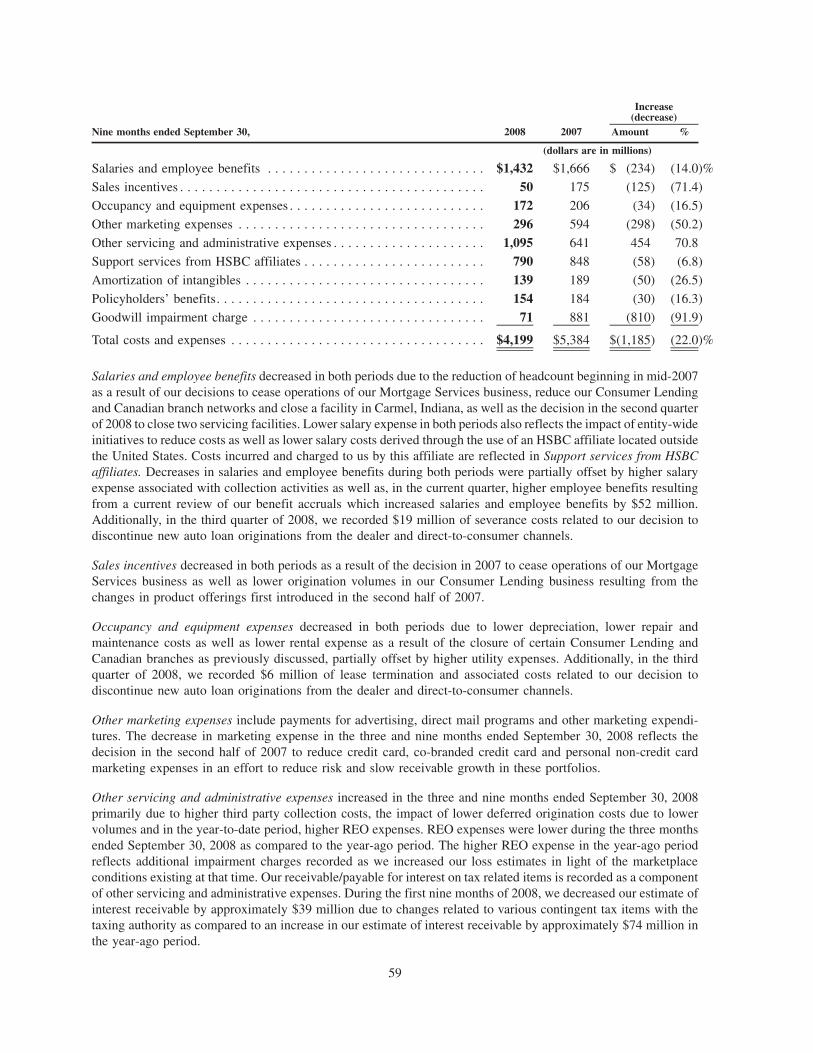
Nine months ended September 30, 2008 2007 Amount %
Increase(decrease)
(dollars are in millions)
Salaries and employee benefits . . . . . . . . . . . . . . . . . . . . . . . . . . . . . . $1,432 $1,666 $ (234) (14.0)%
Sales incentives . . . . . . . . . . . . . . . . . . . . . . . . . . . . . . . . . . . . . . . . . . 50 175 (125) (71.4)
Occupancy and equipment expenses . . . . . . . . . . . . . . . . . . . . . . . . . . . 172 206 (34) (16.5)
Other marketing expenses . . . . . . . . . . . . . . . . . . . . . . . . . . . . . . . . . . 296 594 (298) (50.2)
Other servicing and administrative expenses . . . . . . . . . . . . . . . . . . . . . 1,095 641 454 70.8
Support services from HSBC affiliates . . . . . . . . . . . . . . . . . . . . . . . . . 790 848 (58) (6.8)
Amortization of intangibles . . . . . . . . . . . . . . . . . . . . . . . . . . . . . . . . . 139 189 (50) (26.5)
Policyholders’ benefits. . . . . . . . . . . . . . . . . . . . . . . . . . . . . . . . . . . . . 154 184 (30) (16.3)
Goodwill impairment charge . . . . . . . . . . . . . . . . . . . . . . . . . . . . . . . . 71 881 (810) (91.9)
Total costs and expenses . . . . . . . . . . . . . . . . . . . . . . . . . . . . . . . . . . . $4,199 $5,384 $(1,185) (22.0)%
Salaries and employee benefits decreased in both periods due to the reduction of headcount beginning in mid-2007as a result of our decisions to cease operations of our Mortgage Services business, reduce our Consumer Lendingand Canadian branch networks and close a facility in Carmel, Indiana, as well as the decision in the second quarterof 2008 to close two servicing facilities. Lower salary expense in both periods also reflects the impact of entity-wideinitiatives to reduce costs as well as lower salary costs derived through the use of an HSBC affiliate located outsidethe United States. Costs incurred and charged to us by this affiliate are reflected in Support services from HSBCaffiliates. Decreases in salaries and employee benefits during both periods were partially offset by higher salaryexpense associated with collection activities as well as, in the current quarter, higher employee benefits resultingfrom a current review of our benefit accruals which increased salaries and employee benefits by $52 million.Additionally, in the third quarter of 2008, we recorded $19 million of severance costs related to our decision todiscontinue new auto loan originations from the dealer and direct-to-consumer channels.
Sales incentives decreased in both periods as a result of the decision in 2007 to cease operations of our MortgageServices business as well as lower origination volumes in our Consumer Lending business resulting from thechanges in product offerings first introduced in the second half of 2007.
Occupancy and equipment expenses decreased in both periods due to lower depreciation, lower repair andmaintenance costs as well as lower rental expense as a result of the closure of certain Consumer Lending andCanadian branches as previously discussed, partially offset by higher utility expenses. Additionally, in the thirdquarter of 2008, we recorded $6 million of lease termination and associated costs related to our decision todiscontinue new auto loan originations from the dealer and direct-to-consumer channels.
Other marketing expenses include payments for advertising, direct mail programs and other marketing expendi-tures. The decrease in marketing expense in the three and nine months ended September 30, 2008 reflects thedecision in the second half of 2007 to reduce credit card, co-branded credit card and personal non-credit cardmarketing expenses in an effort to reduce risk and slow receivable growth in these portfolios.
Other servicing and administrative expenses increased in the three and nine months ended September 30, 2008primarily due to higher third party collection costs, the impact of lower deferred origination costs due to lowervolumes and in the year-to-date period, higher REO expenses. REO expenses were lower during the three monthsended September 30, 2008 as compared to the year-ago period. The higher REO expense in the year-ago periodreflects additional impairment charges recorded as we increased our loss estimates in light of the marketplaceconditions existing at that time. Our receivable/payable for interest on tax related items is recorded as a componentof other servicing and administrative expenses. During the first nine months of 2008, we decreased our estimate ofinterest receivable by approximately $39 million due to changes related to various contingent tax items with thetaxing authority as compared to an increase in our estimate of interest receivable by approximately $74 million inthe year-ago period.
59

Support services from HSBC affiliates includes technology and other services charged to us by HTSU as well asservices charged to us by an HSBC affiliate located outside of the United States providing operational support to ourbusinesses, including among other areas, customer service, systems, collection and accounting functions. Supportservices from HSBC affiliates were down during the three and nine months ended September 30, 2008 as a result ofreductions in support services due to lower receivable balances as compared to the year-ago periods, partially offsetby higher costs associated with the increase in the number of employees located outside of the United States.
Amortization of intangibles decreased in both periods due to lower amortization for customer relationships as aresult of the write off in the fourth quarter of 2007 of these relationships related to our acquisition by HSBC.
Policyholders’ benefits decreased in our domestic operations during the three and nine months ended September 30,2008 primarily due to lower life claims on credit insurance policies, partially offset by higher disability andunemployment claims.
Goodwill impairment charges During the third quarter of 2008, after determining the price of our CanadianOperations in conjunction with our planned transfer to an HSBC affiliate, we concluded that the goodwill allocatedto our Canadian Operations was impaired. As a result, we recorded a goodwill impairment charge of $71 million.During the third quarter of 2007, as a result of our annual impairment test of goodwill, we recorded a goodwillimpairment charge of $881 million which represents all of the goodwill allocated to our Mortgage Servicesbusiness.
Efficiency ratio Our efficiency ratio from continuing operations was 27.99 percent for the quarter endedSeptember 30, 2008 compared to 55.30 percent in the year-ago quarter. Our efficiency ratio was 34.11 percentfor the nine months ended September 30, 2008 compared to 44.69 percent for the year-ago period. Our efficiencyratio was significantly impacted by the change in the credit risk component of our fair value optioned debt and thegoodwill impairment charges recorded in both periods. Excluding these items from the periods presented, ourefficiency ratio improved 55 basis points during the three months ended September 30, 2008 and was flat in theyear-to-date period. The improvement during the three months ended September 30, 2008 was a result of lowercosts and expenses partially offset by lower net interest income and other revenues. The reduction in costs andexpenses resulting from our on-going entity-wide initiatives to reduce costs was partially offset by higher REO andthird party collection expenses due to the current marketplace conditions.
Segment Results – IFRS Management Basis
Through December 31, 2007, we reported the results of operations in three business segments: Consumer, CreditCard Services and International. In May 2007, we decided to integrate our Retail Services business, which hadhistorically been included in the Consumer Segment, into our Credit Card Services business. In the first quarter of2008, we completed the integration of management reporting for our Credit Card Services and Retail Servicesbusiness which has resulted in the combination of these previously separate businesses into one reporting unit andbegan reporting results for the Cards and Retail Services as one segment.
Our segment disclosures are reported on a continuing operations basis. As discussed in Note 2, “DiscontinuedOperations,” our U.K. Operations, which were previously reported in the International Segment, are now reported asdiscontinued operations and are no longer included in our segment presentation. Our Canadian operations, whichcomprised the remainder of our International Segment, fall below the quantitative threshold test under SFAS No. 131for determining reportable segments and in our June 30, 2008 Form 10-Q were reported in the “All Other” caption.We currently anticipate our Canadian operations will be sold to an HSBC affiliate during the fourth quarter of 2008.As a result, under IFRSs beginning in the third quarter of 2008 our Canadian operations are reported as discontinuedoperations and are no longer included in our IFRS segment results.
Beginning in the second quarter of 2008 and going forward, we are reporting our financial results under tworeportable segments: Consumer and Card and Retail Services. Our Consumer segment consists of our ConsumerLending, Mortgage Services and Auto Finance businesses. Our Card and Retail Services segment includes ourdomestic MasterCard, Visa, private label and other credit card operations. Beginning in the third quarter of 2008, the“All Other” caption includes our Insurance, Taxpayer Financial Services and Commercial businesses, each of whichfalls below the quantitative threshold test under SFAS No. 131 for determining reportable segments, as well as our
60

corporate and treasury activities. Segment financial information has been restated for all periods presented to reflectthis new segmentation. There have been no other changes in the basis of our segmentation or measurement ofsegment profit as compared with the presentation in our 2007 Form 10-K.
We report results to our parent, HSBC, in accordance with its reporting basis, IFRSs. Our segment results arepresented on an IFRS Management Basis (a non-U.S. GAAP financial measure) as operating results are monitoredand reviewed, trends are evaluated and decisions about allocating resources such as employees and capital are madealmost exclusively on an IFRS Management Basis. IFRS Management Basis results are IFRSs results adjusted toassume that the private label and real estate secured receivables transferred to HSBC Bank USA have not been soldand remain on our balance sheet. We currently intend to sell our GM MasterCard receivable portfolio and a portionof our domestic auto finance receivable portfolio to HSBC Bank USA. Upon the completion of these sales, IFRSManagement Basis results will also assume that these portfolios have not been sold and remain on our balance sheet.Additionally, IFRS Management Basis assumes that the purchase accounting fair value adjustments relating to ouracquisition by HSBC have been “pushed down” to HSBC Finance Corporation. These fair value adjustmentsincluding goodwill have been allocated to Corporate which is included in the “All Other” caption within oursegment disclosure and thus not reflected in the reportable segment discussions that follow. Operations aremonitored and trends are evaluated on an IFRS Management Basis because the receivable sales to HSBC Bank USAwere conducted primarily to appropriately fund prime customer loans within HSBC and such receivables continueto be managed and serviced by us without regard to ownership. However, we continue to monitor capital adequacy,establish dividend policy and report to regulatory agencies on a U.S. GAAP basis. A summary of the significantdifferences between U.S. GAAP and IFRSs as they impact our results are summarized in Note 13, “BusinessSegments.”
Consumer Segment The following table summarizes the IFRS Management Basis results for our Consumersegment:
Three months ended September 30, 2008 2007 Amount %Increase (decrease)
(dollars are in millions)
Net income(loss)(1) . . . . . . . . . . . . . . . . . . . . . . . . . . . . . . . . $ (1,167) $ (794) $ (373) (47.0)%Net interest income . . . . . . . . . . . . . . . . . . . . . . . . . . . . . . . . 1,356 1,750 (394) (22.5)Other operating income . . . . . . . . . . . . . . . . . . . . . . . . . . . . . (13) (130) 117 90.0Loan impairment charges . . . . . . . . . . . . . . . . . . . . . . . . . . . . 2,678 2,292 386 16.8Operating expenses . . . . . . . . . . . . . . . . . . . . . . . . . . . . . . . . 491 587 (96) (16.4)Intersegment revenues . . . . . . . . . . . . . . . . . . . . . . . . . . . . . . 59 58 1 1.7Customer loans . . . . . . . . . . . . . . . . . . . . . . . . . . . . . . . . . . . 104,210 120,226 (16,016) (13.3)Assets . . . . . . . . . . . . . . . . . . . . . . . . . . . . . . . . . . . . . . . . . . 99,168 118,367 (19,199) (16.2)Net interest margin, annualized . . . . . . . . . . . . . . . . . . . . . . . 5.08% 5.78% - -Return on average assets . . . . . . . . . . . . . . . . . . . . . . . . . . . . (4.57) (2.64) - -
Nine months ended September 30, 2008 2007 Amount %Increase (decrease)
(dollars are in millions)
Net income (loss)(1) . . . . . . . . . . . . . . . . . . . . . . . . . . . . . . . . $(2,560) $ (614) $(1,946) (100+)%Net interest income . . . . . . . . . . . . . . . . . . . . . . . . . . . . . . . . 4,401 5,439 (1,038) (19.1)Other operating income . . . . . . . . . . . . . . . . . . . . . . . . . . . . . (15) (86) 71 82.6Loan impairment charges . . . . . . . . . . . . . . . . . . . . . . . . . . . . 6,987 4,521 2,466 54.6Operating expenses . . . . . . . . . . . . . . . . . . . . . . . . . . . . . . . . 1,403 1,805 (402) (22.3)Intersegment revenues . . . . . . . . . . . . . . . . . . . . . . . . . . . . . . 150 158 (8) (5.1)Net interest margin, annualized . . . . . . . . . . . . . . . . . . . . . . . 5.26% 5.85% - -Return on average assets . . . . . . . . . . . . . . . . . . . . . . . . . . . . (3.18) (.66) - -
(1) The Consumer Segment net income (loss) reported above includes a net loss of $(596) million for the three months ended September 30, 2008and $(1,736) million during the year-to-date period for our Mortgage Services business which is no longer generating new loan originationvolume as a result of the decisions to discontinue correspondent channel acquisitions and cease Decision One operations. Our Mortgage
61
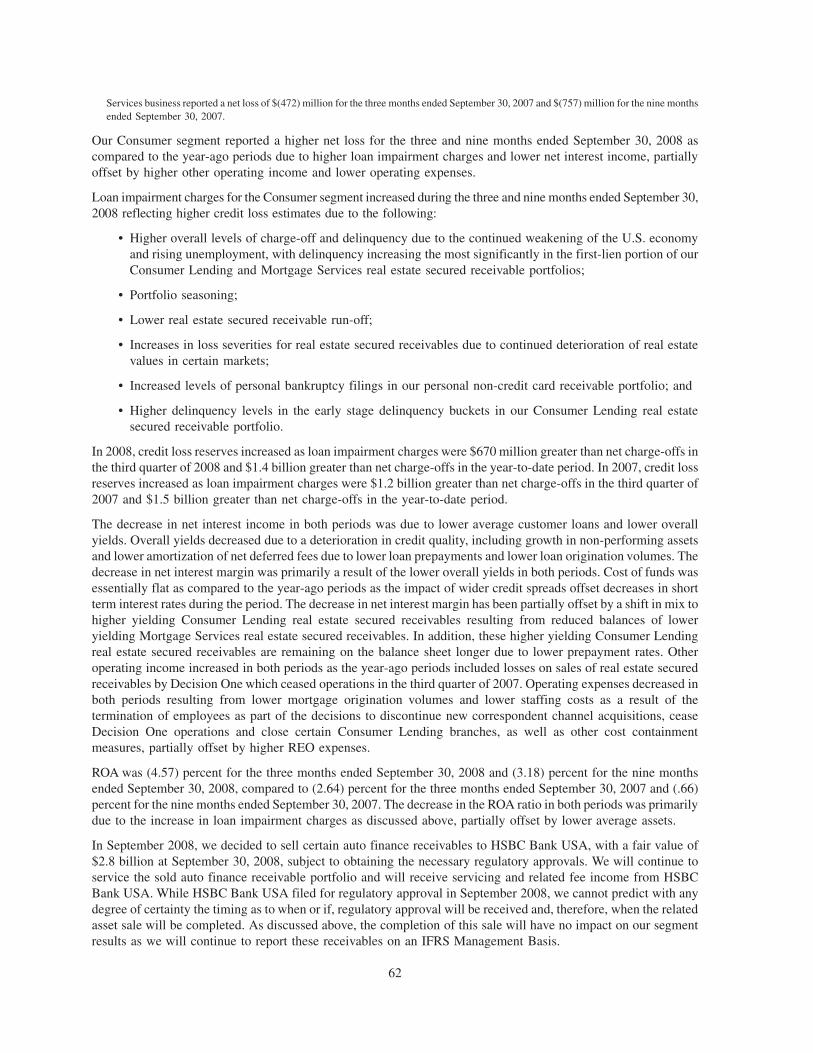
Services business reported a net loss of $(472) million for the three months ended September 30, 2007 and $(757) million for the nine monthsended September 30, 2007.
Our Consumer segment reported a higher net loss for the three and nine months ended September 30, 2008 ascompared to the year-ago periods due to higher loan impairment charges and lower net interest income, partiallyoffset by higher other operating income and lower operating expenses.
Loan impairment charges for the Consumer segment increased during the three and nine months ended September 30,2008 reflecting higher credit loss estimates due to the following:
• Higher overall levels of charge-off and delinquency due to the continued weakening of the U.S. economyand rising unemployment, with delinquency increasing the most significantly in the first-lien portion of ourConsumer Lending and Mortgage Services real estate secured receivable portfolios;
• Portfolio seasoning;
• Lower real estate secured receivable run-off;
• Increases in loss severities for real estate secured receivables due to continued deterioration of real estatevalues in certain markets;
• Increased levels of personal bankruptcy filings in our personal non-credit card receivable portfolio; and
• Higher delinquency levels in the early stage delinquency buckets in our Consumer Lending real estatesecured receivable portfolio.
In 2008, credit loss reserves increased as loan impairment charges were $670 million greater than net charge-offs inthe third quarter of 2008 and $1.4 billion greater than net charge-offs in the year-to-date period. In 2007, credit lossreserves increased as loan impairment charges were $1.2 billion greater than net charge-offs in the third quarter of2007 and $1.5 billion greater than net charge-offs in the year-to-date period.
The decrease in net interest income in both periods was due to lower average customer loans and lower overallyields. Overall yields decreased due to a deterioration in credit quality, including growth in non-performing assetsand lower amortization of net deferred fees due to lower loan prepayments and lower loan origination volumes. Thedecrease in net interest margin was primarily a result of the lower overall yields in both periods. Cost of funds wasessentially flat as compared to the year-ago periods as the impact of wider credit spreads offset decreases in shortterm interest rates during the period. The decrease in net interest margin has been partially offset by a shift in mix tohigher yielding Consumer Lending real estate secured receivables resulting from reduced balances of loweryielding Mortgage Services real estate secured receivables. In addition, these higher yielding Consumer Lendingreal estate secured receivables are remaining on the balance sheet longer due to lower prepayment rates. Otheroperating income increased in both periods as the year-ago periods included losses on sales of real estate securedreceivables by Decision One which ceased operations in the third quarter of 2007. Operating expenses decreased inboth periods resulting from lower mortgage origination volumes and lower staffing costs as a result of thetermination of employees as part of the decisions to discontinue new correspondent channel acquisitions, ceaseDecision One operations and close certain Consumer Lending branches, as well as other cost containmentmeasures, partially offset by higher REO expenses.
ROA was (4.57) percent for the three months ended September 30, 2008 and (3.18) percent for the nine monthsended September 30, 2008, compared to (2.64) percent for the three months ended September 30, 2007 and (.66)percent for the nine months ended September 30, 2007. The decrease in the ROA ratio in both periods was primarilydue to the increase in loan impairment charges as discussed above, partially offset by lower average assets.
In September 2008, we decided to sell certain auto finance receivables to HSBC Bank USA, with a fair value of$2.8 billion at September 30, 2008, subject to obtaining the necessary regulatory approvals. We will continue toservice the sold auto finance receivable portfolio and will receive servicing and related fee income from HSBCBank USA. While HSBC Bank USA filed for regulatory approval in September 2008, we cannot predict with anydegree of certainty the timing as to when or if, regulatory approval will be received and, therefore, when the relatedasset sale will be completed. As discussed above, the completion of this sale will have no impact on our segmentresults as we will continue to report these receivables on an IFRS Management Basis.
62

Customer loans for our Consumer segment can be further analyzed as follows:
September 30,2008 $ % $ %
June 30,2008
September 30,2007
Increases (Decreases) From
(dollars are in millions)
Real estate secured(1) . . . . . . . . . . . . . . . . . . . . . . . . . . $ 76,286 $(4,188) (5.2)% $(12,528) (14.1)%
Auto finance . . . . . . . . . . . . . . . . . . . . . . . . . . . . . . . . 11,786 (749) (6.0) (1,074) (8.4)
Private label, including co-branded cards . . . . . . . . . . . 65 (18) (21.7) (105) (61.8)
Personal non-credit card . . . . . . . . . . . . . . . . . . . . . . . 16,073 (618) (3.7) (2,309) (12.6)
Total customer loans . . . . . . . . . . . . . . . . . . . . . . . . . . $104,210 $(5,573) (5.1)% $(16,016) (13.3)%
(1) Real estate secured receivables are comprised of the following:
September 30,2008 $ % $ %
June 30,2008
September 30,2007
Increases (Decreases) From
(dollars are in millions)
Mortgage Services . . . . . . . . . . . . . . . . . . . . . . . . . . . . . . . . . . . . . . . . $29,014 $(2,432) (7.7)% $ (9,857) (25.4)%
Consumer Lending. . . . . . . . . . . . . . . . . . . . . . . . . . . . . . . . . . . . . . . . 47,272 (1,756) (3.6) (2,671) (5.3)
Total real estate secured . . . . . . . . . . . . . . . . . . . . . . . . . . . . . . . . . . . . $76,286 $(4,188) (5.2)% $(12,528) (14.1)%
Customer loans decreased 13 percent at September 30, 2008 as compared to $120.2 billion at September 30, 2007.Real estate secured receivables decreased from the year-ago period due to the following;
• Lower receivable balances in our Mortgage Services business as new correspondent channel acquisitionswere discontinued in March 2007 and the balances will continue to decline going forward as loan balancesliquidate;
• Tightened credit criteria and underwriting practices in our Consumer Lending business since mid-2007which included discontinuation of certain loan products, including adjustable rate, stated income, andinterest-only mortgages in order to reduce risk and limit growth. These growth limiting and risk reducingactions will continue to reduce the balance of our Consumer Lending real estate secured loans in theforeseeable future; and
• Portfolio sales of $615 million from our Mortgage Services business and $600 million from our ConsumerLending real estate secured portfolio since September 30, 2007.
The decrease in real estate secured receivables was partially offset by a decline in loan prepayments due to fewerrefinancing opportunities for our customers due to the previously discussed trends impacting the mortgage lendingindustry. Our auto finance portfolio decreased due to lower originations in the dealer network portfolios as a resultof actions taken since mid-2007 to reduce risk in the portfolio as well as the decision in July 2008 to discontinue newauto loan originations from the dealer and direct-to-consumer channels. Personal non-credit card receivablesdecreased from the year-ago period as a result of the actions taken since mid-2007 by our Consumer Lendingbusiness to reduce risk and limit growth going forward, including the elimination of guaranteed direct mail loans tonew customers, the discontinuance of personal homeowner loans and tightening underwriting criteria.
Customer loans decreased 5 percent compared to June 30, 2008 primarily due to lower real estate secured loans. OurMortgage Services real estate secured portfolio continued to liquidate during the quarter and lower real estatesecured loans in our Consumer Lending business reflected the changes in our product offering implemented sincemid-2007. Real estate secured receivable balances also reflect portfolio sales of $615 million from our MortgageServices business and $600 million from our Consumer Lending real estate secured portfolio during the currentquarter. These decreases were partially offset by the decline in loan prepayments discussed above. Lower run-offrates partially offset the decreases in our real estate secured portfolio originations. Our auto finance and personal
63
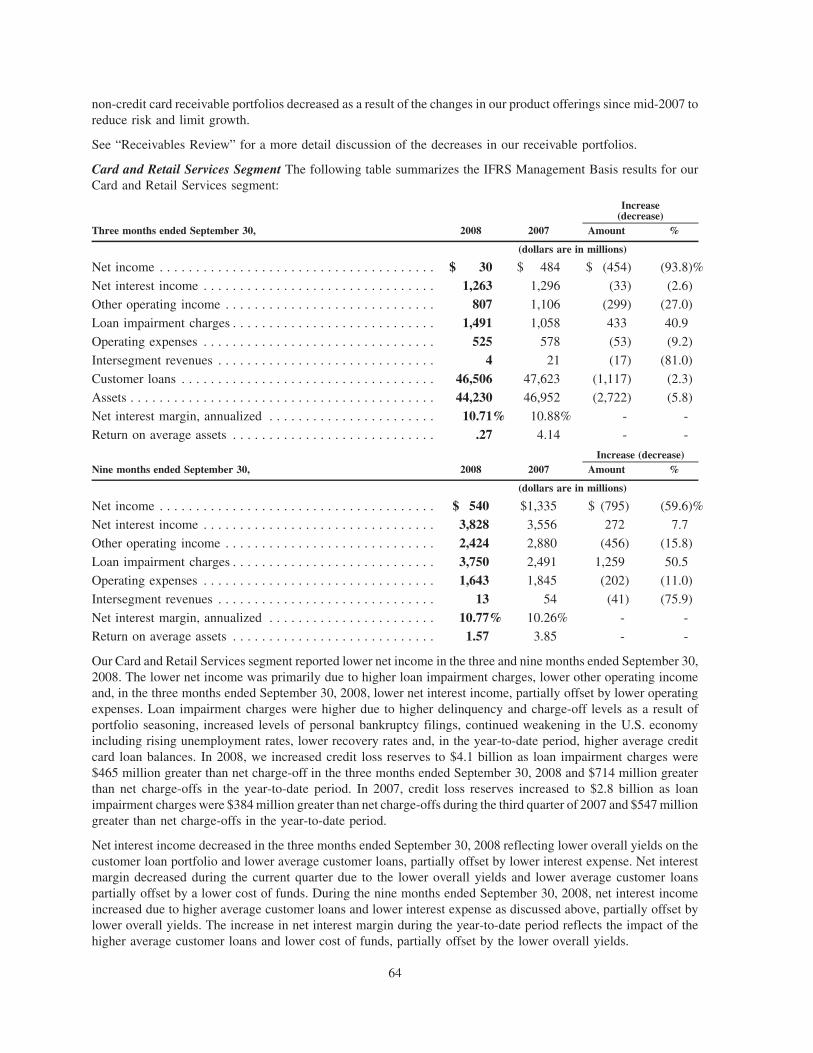
non-credit card receivable portfolios decreased as a result of the changes in our product offerings since mid-2007 toreduce risk and limit growth.
See “Receivables Review” for a more detail discussion of the decreases in our receivable portfolios.
Card and Retail Services Segment The following table summarizes the IFRS Management Basis results for ourCard and Retail Services segment:
Three months ended September 30, 2008 2007 Amount %
Increase(decrease)
(dollars are in millions)
Net income . . . . . . . . . . . . . . . . . . . . . . . . . . . . . . . . . . . . . . $ 30 $ 484 $ (454) (93.8)%
Net interest income . . . . . . . . . . . . . . . . . . . . . . . . . . . . . . . . 1,263 1,296 (33) (2.6)
Other operating income . . . . . . . . . . . . . . . . . . . . . . . . . . . . . 807 1,106 (299) (27.0)
Loan impairment charges . . . . . . . . . . . . . . . . . . . . . . . . . . . . 1,491 1,058 433 40.9
Operating expenses . . . . . . . . . . . . . . . . . . . . . . . . . . . . . . . . 525 578 (53) (9.2)
Intersegment revenues . . . . . . . . . . . . . . . . . . . . . . . . . . . . . . 4 21 (17) (81.0)
Customer loans . . . . . . . . . . . . . . . . . . . . . . . . . . . . . . . . . . . 46,506 47,623 (1,117) (2.3)
Assets . . . . . . . . . . . . . . . . . . . . . . . . . . . . . . . . . . . . . . . . . . 44,230 46,952 (2,722) (5.8)
Net interest margin, annualized . . . . . . . . . . . . . . . . . . . . . . . 10.71% 10.88% - -
Return on average assets . . . . . . . . . . . . . . . . . . . . . . . . . . . . .27 4.14 - -
Nine months ended September 30, 2008 2007 Amount %Increase (decrease)
(dollars are in millions)
Net income . . . . . . . . . . . . . . . . . . . . . . . . . . . . . . . . . . . . . . $ 540 $1,335 $ (795) (59.6)%
Net interest income . . . . . . . . . . . . . . . . . . . . . . . . . . . . . . . . 3,828 3,556 272 7.7
Other operating income . . . . . . . . . . . . . . . . . . . . . . . . . . . . . 2,424 2,880 (456) (15.8)
Loan impairment charges . . . . . . . . . . . . . . . . . . . . . . . . . . . . 3,750 2,491 1,259 50.5
Operating expenses . . . . . . . . . . . . . . . . . . . . . . . . . . . . . . . . 1,643 1,845 (202) (11.0)
Intersegment revenues . . . . . . . . . . . . . . . . . . . . . . . . . . . . . . 13 54 (41) (75.9)
Net interest margin, annualized . . . . . . . . . . . . . . . . . . . . . . . 10.77% 10.26% - -Return on average assets . . . . . . . . . . . . . . . . . . . . . . . . . . . . 1.57 3.85 - -
Our Card and Retail Services segment reported lower net income in the three and nine months ended September 30,2008. The lower net income was primarily due to higher loan impairment charges, lower other operating incomeand, in the three months ended September 30, 2008, lower net interest income, partially offset by lower operatingexpenses. Loan impairment charges were higher due to higher delinquency and charge-off levels as a result ofportfolio seasoning, increased levels of personal bankruptcy filings, continued weakening in the U.S. economyincluding rising unemployment rates, lower recovery rates and, in the year-to-date period, higher average creditcard loan balances. In 2008, we increased credit loss reserves to $4.1 billion as loan impairment charges were$465 million greater than net charge-off in the three months ended September 30, 2008 and $714 million greaterthan net charge-offs in the year-to-date period. In 2007, credit loss reserves increased to $2.8 billion as loanimpairment charges were $384 million greater than net charge-offs during the third quarter of 2007 and $547 milliongreater than net charge-offs in the year-to-date period.
Net interest income decreased in the three months ended September 30, 2008 reflecting lower overall yields on thecustomer loan portfolio and lower average customer loans, partially offset by lower interest expense. Net interestmargin decreased during the current quarter due to the lower overall yields and lower average customer loanspartially offset by a lower cost of funds. During the nine months ended September 30, 2008, net interest incomeincreased due to higher average customer loans and lower interest expense as discussed above, partially offset bylower overall yields. The increase in net interest margin during the year-to-date period reflects the impact of thehigher average customer loans and lower cost of funds, partially offset by the lower overall yields.
64

Decreases in other operating income in both periods were primarily due to changes in fee billings implementedduring the fourth quarter of 2007 and the second quarter of 2008, higher fee charge-offs due to credit deterioration,and lower cash advance and interchange fees due to lower volumes, partially offset by higher late fees. Thesedecreases were partially offset by higher enhancement services revenue from products such as Account Secure Plus(debt protection) and Identity Protection Plan. Additionally, the year-ago periods benefited from the $113 milliongain recorded on the sale of our portfolio of MasterCard Class B shares. Lower operating expenses were incurred inboth periods as we decreased marketing expenses in our effort to slow receivable growth in our credit card portfolio.
The decreases in ROA in the three and nine months ended September 30, 2008 are due to lower net income asdiscussed above, partially offset by lower average assets.
As a result of our decision in the fourth quarter of 2007 to slow credit card receivable growth and in an effort tooptimize our facility and staffing capacity, in June 2008 we decided to close our servicing facilities located inJacksonville, Florida and White Marsh, Maryland during the third quarter of 2008. The servicing activitiesperformed in the Servicing Facilities have been redeployed to other facilities in our Card and Retail Servicesbusinesses. Additionally, we eliminated positions in a number of different functions across our Card and RetailServices businesses. During the three months ended June 30, 2008 we recorded $6 million of one-time terminationand other employee benefits and $6 million of lease termination and associated costs. No additional restructuringcharges were recorded in the third quarter of 2008.
In June 2008, we decided to sell our General Motors (“GM”) MasterCard receivable portfolio to HSBC Bank USAin order to maximize the efficient use of capital and liquidity at each entity, subject to obtaining the necessaryregulatory approval. The outstanding receivable balance of the GM portfolio at September 30, 2008 was $6.4 billion.We will, however, maintain the customer account relationships and continue to service the GM portfolio for a fee.Subsequent to the initial sale of receivables, additional volume will be sold to HSBC Bank USA on a daily basis. Wecannot predict with any degree of certainty the timing as to when or if, regulatory approval will be received and,therefore, when the related asset sale will be completed. As discussed above, the completion of this sale will have noimpact on our segment results as we will continue to report these receivables on an IFRS Management Basis.
We also have been considering the sale of our AFL-CIO Union Plus (“UP”) MasterCard/Visa portfolio, with anoutstanding receivable balance of $6.2 billion at September 30, 2008, to HSBC Bank USA in the future in order tomaximize the efficient use of capital and liquidity at each entity. Any such sale will be subject to obtaining thenecessary regulatory and other approvals. We would, however, maintain the customer account relationships andcontinue to service the UP MasterCard/Visa portfolio for a fee. Subsequent to the initial sale of receivables,additional volume would be sold to HSBC Bank USA on a daily basis. However, if the sale was completed, it wouldhave no impact on our segment results as we would continue to report these receivables on an IFRS ManagementBasis. In early November 2008, we decided to proceed with the sale, and HSBC Bank USA filed an application withthe Federal Reserve Bank seeking regulatory approval.
Customer loans decreased .6 percent to $46.5 billion at September 30, 2008 compared to $46.8 billion at June 30,2008. The decrease is a result of the previously mentioned actions taken since mid-2007 to limit credit cardreceivable loan growth, partially offset by organic growth in our domestic private label receivable portfolio.Compared to September 30, 2007, customer loans decreased 2 percent reflecting the aforementioned actions takenin the fourth quarter of 2007 to limit growth, partially offset by organic growth in our domestic private labelreceivable portfolio.
The Federal Reserve Board, the Office of Thrift Supervision and the National Credit Union Administration haveproposed rules that would, among other things, place restrictions on applying interest rate increases on existingbalances, payment allocation and default pricing. Similarly, several bills pending before Congress could impactcredit card pricing and other terms. The Federal Reserve Board has indicated it hopes to publish final rules by yearend. We cannot determine whether such legislative or regulatory initiatives will be instituted or predict the negativeimpact such initiatives would have on our results.
65

Credit Quality
Credit Loss Reserves
We maintain credit loss reserves to cover probable losses of principal, interest and fees, including late, overlimit andannual fees. Credit loss reserves are based on a range of estimates and are intended to be adequate but not excessive.We estimate probable losses for consumer receivables using a roll rate migration analysis that estimates thelikelihood that a loan will progress through the various stages of delinquency, or buckets, and ultimately charge-offbased upon recent historical performance experience of other loans in our portfolio. This analysis considersdelinquency status, loss experience and severity and takes into account whether loans are in bankruptcy, have beenre-aged or rewritten, or are subject to forbearance, an external debt management plan, hardship, modification,extension or deferment. Our credit loss reserves also take into consideration the loss severity expected based on theunderlying collateral, if any, for the loan in the event of default. Delinquency status may be affected by customeraccount management policies and practices, such as the re-age of accounts, forbearance agreements, extendedpayment plans, modification arrangements, external debt management programs, loan rewrites and deferments.When customer account management policies or changes thereto, shift loans from a “higher” delinquency bucket toa “lower” delinquency bucket, this will be reflected in our roll rate statistics. To the extent that re-aged or modifiedaccounts have a greater propensity to roll to higher delinquency buckets, this will be captured in the roll rates. Sincethe loss reserve is computed based on the composite of all of these calculations, this increase in roll rate will beapplied to receivables in all respective delinquency buckets, which will increase the overall reserve level. Inaddition, loss reserves on consumer receivables are maintained to reflect our judgment of portfolio risk factors thatmay not be fully reflected in the statistical roll rate calculation or when historical trends are not reflective of currentinherent losses in the portfolio. Risk factors considered in establishing loss reserves on consumer receivablesinclude recent growth, product mix, unemployment rates, bankruptcy trends, geographic concentrations, loanproduct features such as adjustable rate loans, economic conditions, such as national and local trends in housingmarkets and interest rates, portfolio seasoning, account management policies and practices, current levels ofcharge-offs and delinquencies, changes in laws and regulations and other items which can affect consumer paymentpatterns on outstanding receivables, such as natural disasters and global pandemics.
While our credit loss reserves are available to absorb losses in the entire portfolio, we specifically consider the creditquality and other risk factors for each of our products. We recognize the different inherent loss characteristics ineach of our products as well as customer account management policies and practices and risk management/collection practices. Charge-off policies are also considered when establishing loss reserve requirements to ensurethe appropriate reserves exist for products with longer charge-off periods. We also consider key ratios such asreserves to nonperforming loans, reserves as a percentage of net charge-offs and months coverage ratios indeveloping our loss reserve estimate. Loss reserve estimates are reviewed periodically and adjustments are reportedin earnings when they become known. As these estimates are influenced by factors outside of our control such asconsumer payment patterns and economic conditions, there is uncertainty inherent in these estimates, making itreasonably possible that they could change.
The following table summarizes credit loss reserves for our continuing operations for the periods indicated:
September 30,2008
June 30,2008
September 30,2007
(dollars are in millions)
Credit loss reserves . . . . . . . . . . . . . . . . . . . . . . . . . . . . . . . . . . . . . $11,819 $10,934 $8,294Reserves as a percent of:
Receivables . . . . . . . . . . . . . . . . . . . . . . . . . . . . . . . . . . . . . . . . . 9.63% 8.35% 5.46%Net charge-offs(1)(2) . . . . . . . . . . . . . . . . . . . . . . . . . . . . . . . . . . . 110.3 104.8 125.0Nonperforming loans(2). . . . . . . . . . . . . . . . . . . . . . . . . . . . . . . . . 117.4 118.7 114.3
(1) Quarter-to-date, annualized.
(2) Ratio excludes nonperforming loans and charge-offs associated with loan portfolios which are considered held for sale as these receivablesare carried at the lower of cost or fair value with no corresponding credit loss reserve.
66

Credit loss reserve levels at September 30, 2008 increased as compared to June 30, 2008 as we recorded lossprovision in excess of net charge-offs of $1,143 million during the three months ended September 30, 2008. Theincrease was primarily a result of the higher delinquency and credit loss estimates in our Consumer Lending realestate secured and credit card receivable portfolios, particularly in the first-lien portions of Consumer Lending’s2006 and 2007 real estate secured receivable vintages, higher levels of personal bankruptcy filings as well as higherdelinquency levels in the 30- and 60-day delinquency buckets in both the Consumer Lending real estate secured andcredit card receivable portfolios. These increases were partially offset by the transfer of receivables, which werepreviously held for investment, to receivables held for sale and the related credit loss reserves of $249 million duringthe three months ended September 30, 2008.
Credit loss reserves at September 30, 2008 increased significantly as compared to September 30, 2007 primarily asa result of higher delinquency and credit loss estimates in our domestic real estate secured receivable portfolio, ourConsumer Lending personal non-credit card portfolio and our credit card receivable portfolio, as previouslydiscussed. In addition, the higher credit loss reserve levels reflect higher dollars of delinquency driven by portfolioseasoning, increased levels of personal bankruptcy filings and continued weakening of the U.S. economy includingrising unemployment rates, partially offset by lower overall receivables. These increases were partially offset by thetransfer of receivables, which were previously held for investment, to receivables held for sale and the related creditloss reserves of $894 million during the nine months ended September 30, 2008.
In establishing reserve levels, given the current housing market trends in the U.S., we anticipate that losses in ourreal estate secured receivable portfolios will be incurred with greater frequency and severity than historicallyexperienced. There is currently little secondary market liquidity for subprime mortgages. As a result, lenders havesignificantly tightened underwriting standards, substantially limiting the availability of alternative and subprimemortgages. As fewer financing options currently exist in the marketplace for home buyers, properties in certainmarkets are remaining on the market for longer periods of time which contributes to home price depreciation. Therate of home price deterioration in certain markets increased significantly during the first nine months of 2008. It isgenerally believed that the slowdown in the housing market will continue to impact housing prices into 2010. Forsome of our customers, the ability to refinance and access equity in their homes is no longer an option as home priceappreciation remains stagnant in many markets and depreciates in others. As a result, the impact of these industrytrends on our portfolio has worsened, resulting in higher charge-off and credit loss estimates in our MortgageServices and Consumer Lending real estate secured receivable portfolios. We have considered these factors inestablishing our credit loss reserve levels.
We also considered the ability of borrowers to repay their first lien adjustable rate mortgage loans at potentiallyhigher contractual reset rates as well as their ability to repay any underlying second lien mortgages outstanding thatwe hold. Because first lien adjustable rate mortgage loans are generally well secured, ultimate losses associatedwith such loans are dependent to a large extent on the status of the housing market and interest rate environment.Therefore, although it is probable that incremental losses will occur as a result of rate resets on first lien adjustablerate mortgage loans, in situations where the payment has either already reset or will reset in the near term and theloan is not paid, the value of the collateral can be estimated and as a result, losses are included in our credit lossreserves.
Reserves as a percentage of receivables at September 30, 2008 were higher than at September 30, 2007 and June 30,2008 due to the impact of additional reserve requirements as discussed above and lower receivable levels.
Reserves as a percentage of net charge-offs were higher than at June 30, 2008 as the increase in reserve levelsoutpaced the increase in charge-offs during the quarter primarily as a result of the higher delinquency levels in ourConsumer Lending real estate secured and credit card receivable portfolios. Reserves as a percentage of net charge-offs were lower than at September 30, 2007 as the increase in charge-offs outpaced the increase in reserve levels.This is primarily due to a significant increase in reserves during the third quarter of 2007 due to growingdelinquency in our Consumer Lending and Mortgage Services real estate secured portfolios which are nowmigrating to charge-off. Also contributing to the increase in reserves as a percentage of net charge-offs as comparedto the year-ago period was the transfer of $894 million of credit loss reserves to receivables held for sale aspreviously discussed.
67
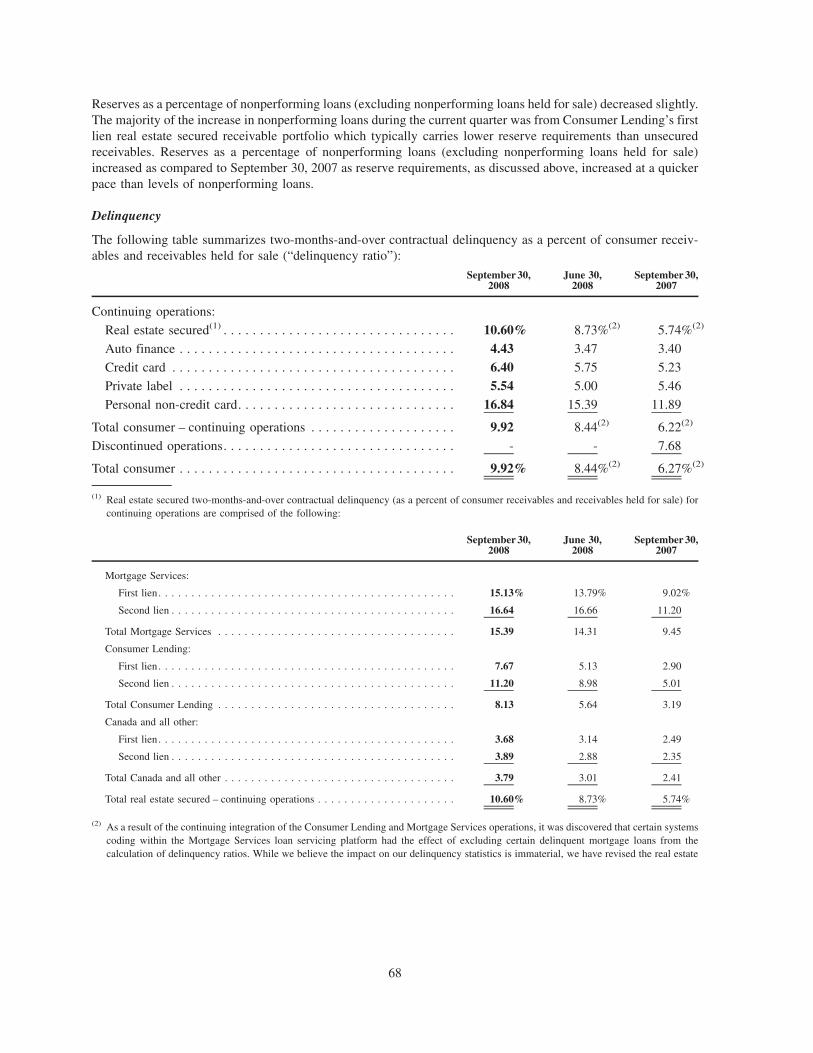
Reserves as a percentage of nonperforming loans (excluding nonperforming loans held for sale) decreased slightly.The majority of the increase in nonperforming loans during the current quarter was from Consumer Lending’s firstlien real estate secured receivable portfolio which typically carries lower reserve requirements than unsecuredreceivables. Reserves as a percentage of nonperforming loans (excluding nonperforming loans held for sale)increased as compared to September 30, 2007 as reserve requirements, as discussed above, increased at a quickerpace than levels of nonperforming loans.
Delinquency
The following table summarizes two-months-and-over contractual delinquency as a percent of consumer receiv-ables and receivables held for sale (“delinquency ratio”):
September 30,2008
June 30,2008
September 30,2007
Continuing operations:
Real estate secured(1) . . . . . . . . . . . . . . . . . . . . . . . . . . . . . . . . 10.60% 8.73%(2) 5.74%(2)
Auto finance . . . . . . . . . . . . . . . . . . . . . . . . . . . . . . . . . . . . . . 4.43 3.47 3.40
Credit card . . . . . . . . . . . . . . . . . . . . . . . . . . . . . . . . . . . . . . . 6.40 5.75 5.23
Private label . . . . . . . . . . . . . . . . . . . . . . . . . . . . . . . . . . . . . . 5.54 5.00 5.46
Personal non-credit card. . . . . . . . . . . . . . . . . . . . . . . . . . . . . . 16.84 15.39 11.89
Total consumer – continuing operations . . . . . . . . . . . . . . . . . . . . 9.92 8.44(2) 6.22(2)
Discontinued operations. . . . . . . . . . . . . . . . . . . . . . . . . . . . . . . . - - 7.68
Total consumer . . . . . . . . . . . . . . . . . . . . . . . . . . . . . . . . . . . . . . 9.92% 8.44%(2) 6.27%(2)
(1) Real estate secured two-months-and-over contractual delinquency (as a percent of consumer receivables and receivables held for sale) forcontinuing operations are comprised of the following:
September 30,2008
June 30,2008
September 30,2007
Mortgage Services:
First lien. . . . . . . . . . . . . . . . . . . . . . . . . . . . . . . . . . . . . . . . . . . . . 15.13% 13.79% 9.02%
Second lien . . . . . . . . . . . . . . . . . . . . . . . . . . . . . . . . . . . . . . . . . . . 16.64 16.66 11.20
Total Mortgage Services . . . . . . . . . . . . . . . . . . . . . . . . . . . . . . . . . . . . 15.39 14.31 9.45
Consumer Lending:
First lien. . . . . . . . . . . . . . . . . . . . . . . . . . . . . . . . . . . . . . . . . . . . . 7.67 5.13 2.90
Second lien . . . . . . . . . . . . . . . . . . . . . . . . . . . . . . . . . . . . . . . . . . . 11.20 8.98 5.01
Total Consumer Lending . . . . . . . . . . . . . . . . . . . . . . . . . . . . . . . . . . . . 8.13 5.64 3.19
Canada and all other:
First lien. . . . . . . . . . . . . . . . . . . . . . . . . . . . . . . . . . . . . . . . . . . . . 3.68 3.14 2.49
Second lien . . . . . . . . . . . . . . . . . . . . . . . . . . . . . . . . . . . . . . . . . . . 3.89 2.88 2.35
Total Canada and all other . . . . . . . . . . . . . . . . . . . . . . . . . . . . . . . . . . . 3.79 3.01 2.41
Total real estate secured – continuing operations . . . . . . . . . . . . . . . . . . . . . 10.60% 8.73% 5.74%
(2) As a result of the continuing integration of the Consumer Lending and Mortgage Services operations, it was discovered that certain systemscoding within the Mortgage Services loan servicing platform had the effect of excluding certain delinquent mortgage loans from thecalculation of delinquency ratios. While we believe the impact on our delinquency statistics is immaterial, we have revised the real estate
68
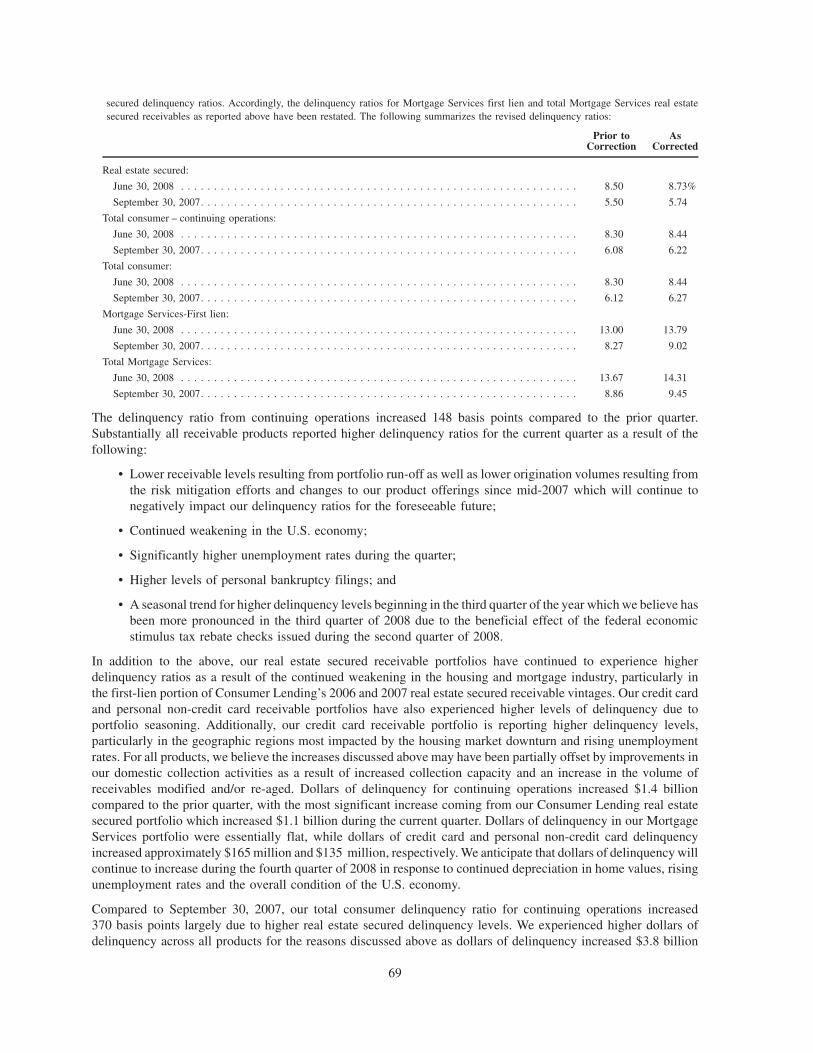
secured delinquency ratios. Accordingly, the delinquency ratios for Mortgage Services first lien and total Mortgage Services real estatesecured receivables as reported above have been restated. The following summarizes the revised delinquency ratios:
Prior toCorrection
AsCorrected
Real estate secured:
June 30, 2008 . . . . . . . . . . . . . . . . . . . . . . . . . . . . . . . . . . . . . . . . . . . . . . . . . . . . . . . . . . . . 8.50 8.73%
September 30, 2007. . . . . . . . . . . . . . . . . . . . . . . . . . . . . . . . . . . . . . . . . . . . . . . . . . . . . . . . . 5.50 5.74
Total consumer – continuing operations:
June 30, 2008 . . . . . . . . . . . . . . . . . . . . . . . . . . . . . . . . . . . . . . . . . . . . . . . . . . . . . . . . . . . . 8.30 8.44
September 30, 2007. . . . . . . . . . . . . . . . . . . . . . . . . . . . . . . . . . . . . . . . . . . . . . . . . . . . . . . . . 6.08 6.22
Total consumer:
June 30, 2008 . . . . . . . . . . . . . . . . . . . . . . . . . . . . . . . . . . . . . . . . . . . . . . . . . . . . . . . . . . . . 8.30 8.44
September 30, 2007. . . . . . . . . . . . . . . . . . . . . . . . . . . . . . . . . . . . . . . . . . . . . . . . . . . . . . . . . 6.12 6.27
Mortgage Services-First lien:
June 30, 2008 . . . . . . . . . . . . . . . . . . . . . . . . . . . . . . . . . . . . . . . . . . . . . . . . . . . . . . . . . . . . 13.00 13.79
September 30, 2007. . . . . . . . . . . . . . . . . . . . . . . . . . . . . . . . . . . . . . . . . . . . . . . . . . . . . . . . . 8.27 9.02
Total Mortgage Services:
June 30, 2008 . . . . . . . . . . . . . . . . . . . . . . . . . . . . . . . . . . . . . . . . . . . . . . . . . . . . . . . . . . . . 13.67 14.31
September 30, 2007. . . . . . . . . . . . . . . . . . . . . . . . . . . . . . . . . . . . . . . . . . . . . . . . . . . . . . . . . 8.86 9.45
The delinquency ratio from continuing operations increased 148 basis points compared to the prior quarter.Substantially all receivable products reported higher delinquency ratios for the current quarter as a result of thefollowing:
• Lower receivable levels resulting from portfolio run-off as well as lower origination volumes resulting fromthe risk mitigation efforts and changes to our product offerings since mid-2007 which will continue tonegatively impact our delinquency ratios for the foreseeable future;
• Continued weakening in the U.S. economy;
• Significantly higher unemployment rates during the quarter;
• Higher levels of personal bankruptcy filings; and
• A seasonal trend for higher delinquency levels beginning in the third quarter of the year which we believe hasbeen more pronounced in the third quarter of 2008 due to the beneficial effect of the federal economicstimulus tax rebate checks issued during the second quarter of 2008.
In addition to the above, our real estate secured receivable portfolios have continued to experience higherdelinquency ratios as a result of the continued weakening in the housing and mortgage industry, particularly inthe first-lien portion of Consumer Lending’s 2006 and 2007 real estate secured receivable vintages. Our credit cardand personal non-credit card receivable portfolios have also experienced higher levels of delinquency due toportfolio seasoning. Additionally, our credit card receivable portfolio is reporting higher delinquency levels,particularly in the geographic regions most impacted by the housing market downturn and rising unemploymentrates. For all products, we believe the increases discussed above may have been partially offset by improvements inour domestic collection activities as a result of increased collection capacity and an increase in the volume ofreceivables modified and/or re-aged. Dollars of delinquency for continuing operations increased $1.4 billioncompared to the prior quarter, with the most significant increase coming from our Consumer Lending real estatesecured portfolio which increased $1.1 billion during the current quarter. Dollars of delinquency in our MortgageServices portfolio were essentially flat, while dollars of credit card and personal non-credit card delinquencyincreased approximately $165 million and $135 million, respectively. We anticipate that dollars of delinquency willcontinue to increase during the fourth quarter of 2008 in response to continued depreciation in home values, risingunemployment rates and the overall condition of the U.S. economy.
Compared to September 30, 2007, our total consumer delinquency ratio for continuing operations increased370 basis points largely due to higher real estate secured delinquency levels. We experienced higher dollars ofdelinquency across all products for the reasons discussed above as dollars of delinquency increased $3.8 billion
69
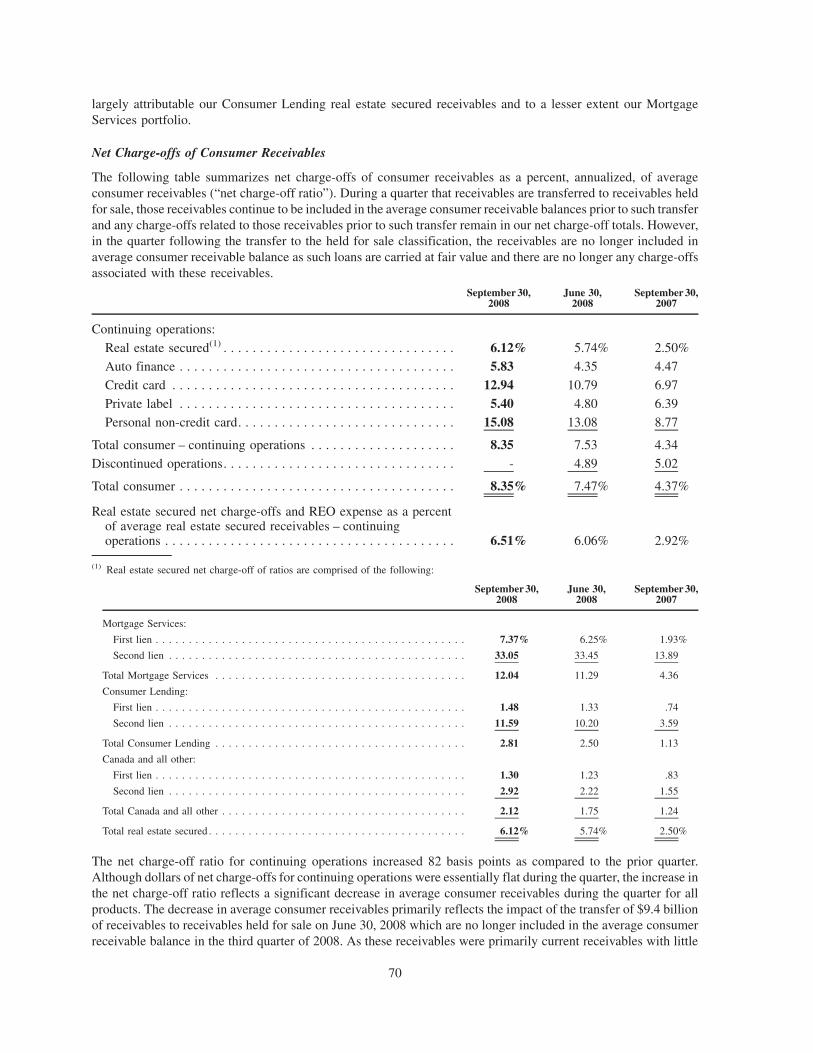
largely attributable our Consumer Lending real estate secured receivables and to a lesser extent our MortgageServices portfolio.
Net Charge-offs of Consumer Receivables
The following table summarizes net charge-offs of consumer receivables as a percent, annualized, of averageconsumer receivables (“net charge-off ratio”). During a quarter that receivables are transferred to receivables heldfor sale, those receivables continue to be included in the average consumer receivable balances prior to such transferand any charge-offs related to those receivables prior to such transfer remain in our net charge-off totals. However,in the quarter following the transfer to the held for sale classification, the receivables are no longer included inaverage consumer receivable balance as such loans are carried at fair value and there are no longer any charge-offsassociated with these receivables.
September 30,2008
June 30,2008
September 30,2007
Continuing operations:
Real estate secured(1) . . . . . . . . . . . . . . . . . . . . . . . . . . . . . . . . 6.12% 5.74% 2.50%
Auto finance . . . . . . . . . . . . . . . . . . . . . . . . . . . . . . . . . . . . . . 5.83 4.35 4.47
Credit card . . . . . . . . . . . . . . . . . . . . . . . . . . . . . . . . . . . . . . . 12.94 10.79 6.97
Private label . . . . . . . . . . . . . . . . . . . . . . . . . . . . . . . . . . . . . . 5.40 4.80 6.39
Personal non-credit card. . . . . . . . . . . . . . . . . . . . . . . . . . . . . . 15.08 13.08 8.77
Total consumer – continuing operations . . . . . . . . . . . . . . . . . . . . 8.35 7.53 4.34
Discontinued operations. . . . . . . . . . . . . . . . . . . . . . . . . . . . . . . . - 4.89 5.02
Total consumer . . . . . . . . . . . . . . . . . . . . . . . . . . . . . . . . . . . . . . 8.35% 7.47% 4.37%
Real estate secured net charge-offs and REO expense as a percentof average real estate secured receivables – continuingoperations . . . . . . . . . . . . . . . . . . . . . . . . . . . . . . . . . . . . . . . . 6.51% 6.06% 2.92%
(1) Real estate secured net charge-off of ratios are comprised of the following:
September 30,2008
June 30,2008
September 30,2007
Mortgage Services:
First lien . . . . . . . . . . . . . . . . . . . . . . . . . . . . . . . . . . . . . . . . . . . . . . . 7.37% 6.25% 1.93%
Second lien . . . . . . . . . . . . . . . . . . . . . . . . . . . . . . . . . . . . . . . . . . . . . 33.05 33.45 13.89
Total Mortgage Services . . . . . . . . . . . . . . . . . . . . . . . . . . . . . . . . . . . . . . 12.04 11.29 4.36
Consumer Lending:
First lien . . . . . . . . . . . . . . . . . . . . . . . . . . . . . . . . . . . . . . . . . . . . . . . 1.48 1.33 .74
Second lien . . . . . . . . . . . . . . . . . . . . . . . . . . . . . . . . . . . . . . . . . . . . . 11.59 10.20 3.59
Total Consumer Lending . . . . . . . . . . . . . . . . . . . . . . . . . . . . . . . . . . . . . . 2.81 2.50 1.13
Canada and all other:
First lien . . . . . . . . . . . . . . . . . . . . . . . . . . . . . . . . . . . . . . . . . . . . . . . 1.30 1.23 .83
Second lien . . . . . . . . . . . . . . . . . . . . . . . . . . . . . . . . . . . . . . . . . . . . . 2.92 2.22 1.55
Total Canada and all other . . . . . . . . . . . . . . . . . . . . . . . . . . . . . . . . . . . . . 2.12 1.75 1.24
Total real estate secured . . . . . . . . . . . . . . . . . . . . . . . . . . . . . . . . . . . . . . . 6.12% 5.74% 2.50%
The net charge-off ratio for continuing operations increased 82 basis points as compared to the prior quarter.Although dollars of net charge-offs for continuing operations were essentially flat during the quarter, the increase inthe net charge-off ratio reflects a significant decrease in average consumer receivables during the quarter for allproducts. The decrease in average consumer receivables primarily reflects the impact of the transfer of $9.4 billionof receivables to receivables held for sale on June 30, 2008 which are no longer included in the average consumerreceivable balance in the third quarter of 2008. As these receivables were primarily current receivables with little
70

associated charge-off dollars, this has significantly impacted the total net charge-off ratio for the third quarter of2008, particularly for our credit card receivable net charge-off ratio. Had these receivables not been transferred toheld for sale, our total net charge-off ratio would have been 26 basis points lower and the credit card receivable netcharge-off ratio would have been 232 basis points lower. The decrease in average consumer receivables during thethird quarter of 2008 also reflects lower origination volumes resulting from continuing risk mitigation efforts andchanges in product offerings which began in mid-2007 and include the sale of $1.3 billion of real estate secured andCanadian auto finance receivables during the quarter. The increase in the net charge-off ratio was partially offset bythe impact of a shift in mix in our Mortgage Services real estate secured receivable portfolio to first lien loans whichgenerally have lower loss severities as compared to second lien loans. Dollars of net charge-offs were essentially flatin the quarter primarily which we believe was due to the extended seasonal benefit on delinquency levels in thesecond quarter of 2008 resulting from the federal economic stimulus tax rebate checks as well as the impact of thetransfer of the GM credit card portfolio to loans held for sale which had the impact of reducing charge-offs$91 million.
As compared to the prior year quarter, the net charge-off ratio increased 401 basis points primarily due to higherdollars of charge-offs in all domestic products and lower average consumer receivables as discussed above. Thehigher charge-offs are primarily in our real estate secured, credit card and personal non-credit card portfolios as thehigher delinquency levels we have been experiencing are migrating to charge-off as well as the impact of aweakening U.S. economy, rising unemployment rates and higher levels of bankruptcy filings on our domesticportfolio. Charge-offs increased significantly in our real estate secured receivable portfolio reflecting continuedweakening in the housing and mortgage industry, including marked decreases in home values in certain markets andseasoning in our Consumer Lending real estate secured receivable portfolio. The increase in charge-offs by lienposition in our Mortgage Services real estate secured portfolio was partially offset by a shift in mix to first lien loanswhich generally have lower loss severities as compared to second lien loans. The higher net charge-off ratio in ourcredit card receivable portfolio also reflects the impact of the transfer of $7.8 billion of credit card receivables toheld for sale as discussed above, portfolio seasoning and lower recovery rates. The increase in charge-offs in ourauto finance portfolio also reflects increased loss severities particularly for less fuel efficient vehicles. Additionally,charge-offs in our personal non-credit card receivable portfolio reflect a deterioration in the 2006 and 2007 vintageswhich was more pronounced in certain geographic regions.
Nonperforming AssetsSeptember 30,
2008June 30,
2008September 30,
2007
(dollars are in millions)
Continuing operations:
Nonaccrual receivables(1) . . . . . . . . . . . . . . . . . . . . . . . . . . . . . . . $ 8,896 $ 8,137(3) $6,168(3)
Accruing consumer receivables 90 or more days delinquent . . . . . . 1,170 1,076 1,091
Total nonperforming receivables . . . . . . . . . . . . . . . . . . . . . . . . . . 10,066 9,213 7,259
Real estate owned . . . . . . . . . . . . . . . . . . . . . . . . . . . . . . . . . . . . 1,127 1,141 977
Nonperforming receivables held for sale . . . . . . . . . . . . . . . . . . . . 129 148 -
Total nonperforming assets – continuing operations . . . . . . . . . . . . . . 11,322 10,502 8,236Discontinued operations . . . . . . . . . . . . . . . . . . . . . . . . . . . . . . . . . . - - 342
Total nonperforming assets . . . . . . . . . . . . . . . . . . . . . . . . . . . . . . . . $11,322 $10,502 $8,578
Credit loss reserves as a percent of nonperforming receivables –continuing operations(2) . . . . . . . . . . . . . . . . . . . . . . . . . . . . . . . . 117.4% 118.7% 114.3%
71

(1) Nonaccrual receivables are comprised of the following:
September 30,2008
June 30,2008
September 30,2007
(in millions)
Real estate secured:
Closed-end:
First lien . . . . . . . . . . . . . . . . . . . . . . . . . . . . . . . . . . . . . . . . . . . . . . . . . . $4,930 $4,321 $2,971
Second lien . . . . . . . . . . . . . . . . . . . . . . . . . . . . . . . . . . . . . . . . . . . . . . . . 873 874 592
Revolving:
First lien . . . . . . . . . . . . . . . . . . . . . . . . . . . . . . . . . . . . . . . . . . . . . . . . . . 5 5 19
Second lien . . . . . . . . . . . . . . . . . . . . . . . . . . . . . . . . . . . . . . . . . . . . . . . . 293 301 298
Total real estate secured . . . . . . . . . . . . . . . . . . . . . . . . . . . . . . . . . . . . . . . . . . 6,101 5,501 3,880
Auto finance . . . . . . . . . . . . . . . . . . . . . . . . . . . . . . . . . . . . . . . . . . . . . . . . . 509 442 443
Private label . . . . . . . . . . . . . . . . . . . . . . . . . . . . . . . . . . . . . . . . . . . . . . . . . 13 15 24
Personal non-credit card . . . . . . . . . . . . . . . . . . . . . . . . . . . . . . . . . . . . . . . . . . 2,273 2,179 1,821
Total nonaccrual receivables . . . . . . . . . . . . . . . . . . . . . . . . . . . . . . . . . . . . . . . $8,896 $8,137 $6,168
(2) Ratio excludes nonperforming loans associated with loan portfolios which are considered held for sale as these receivables are carried at thelower of cost or market.
(3) As a result of the continuing integration of the Consumer Lending and Mortgage Services operations, it was discovered that certain systemscoding within the Mortgage Services loan servicing platform had the effect of excluding certain nonaccrual real estate secured receivablesfrom the nonaccrual receivable totals. While we believe the impact is immaterial, we have revised the real estate secured nonaccrualreceivables, total nonperforming receivables, and total nonperforming asset amounts. The following summarizes the revised totals:
Prior toCorrection
AsCorrected
Nonaccrual receivables:
June 30, 2008 . . . . . . . . . . . . . . . . . . . . . . . . . . . . . . . . . . . . . . . . . . . . . . . . . . . . . . . . . . . . 7,950 8,137
September 30, 2007. . . . . . . . . . . . . . . . . . . . . . . . . . . . . . . . . . . . . . . . . . . . . . . . . . . . . . . . . 5,950 6,168
Total nonperforming receivables:
June 30, 2008 . . . . . . . . . . . . . . . . . . . . . . . . . . . . . . . . . . . . . . . . . . . . . . . . . . . . . . . . . . . . 9,026 9,213
September 30, 2007. . . . . . . . . . . . . . . . . . . . . . . . . . . . . . . . . . . . . . . . . . . . . . . . . . . . . . . . . 7,041 7,259
Total nonperforming assets – continuing operations:
June 30, 2008 . . . . . . . . . . . . . . . . . . . . . . . . . . . . . . . . . . . . . . . . . . . . . . . . . . . . . . . . . . . . 10,315 10,502
September 30, 2007. . . . . . . . . . . . . . . . . . . . . . . . . . . . . . . . . . . . . . . . . . . . . . . . . . . . . . . . . 8,018 8,236
Total nonperforming assets:
June 30, 2008 . . . . . . . . . . . . . . . . . . . . . . . . . . . . . . . . . . . . . . . . . . . . . . . . . . . . . . . . . . . . 10,315 10,502
September 30, 2007. . . . . . . . . . . . . . . . . . . . . . . . . . . . . . . . . . . . . . . . . . . . . . . . . . . . . . . . . 8,360 8,578
Compared to June 30, 2008, the increase in total nonperforming receivables from continuing operations excludingnonperforming receivables held for sale, is due to higher levels of real estate secured nonaccrual receivables at ourConsumer Lending business and higher levels of accruing consumer receivables 90 or more days delinquent due tothe higher overall delinquency levels as previously discussed. We believe these increases have been partially offsetby improvements in collection capacity. Additionally, during the third quarter of 2008, we have seen a shift in theproduct mix in our nonperforming loan balances as the majority of the increase in nonperforming loans in thecurrent quarter was from Consumer Lending’s first-lien real estate secured receivable portfolio which typicallycarries lower reserve requirements than unsecured receivables. Real estate secured nonaccrual loans included statedincome loans at our Mortgage Services business of $1.2 billion at September 30, 2008, $1.3 billion at June 30, 2008and $894 million at September 30, 2007. Consistent with industry practice, accruing consumer receivables 90 ormore days delinquent includes domestic credit card receivables.
72

Account Management Policies and Practices
Our policies and practices for the collection of consumer receivables, including our customer account managementpolicies and practices, permit us to modify the terms of loans, either temporarily or permanently (a “modification”),and/or to reset the contractual delinquency status of an account to current (a “re-age”), based on indicia or criteriawhich, in our judgment, evidence continued payment probability. Such policies and practices vary by product andare designed to manage customer relationships, maximize collection opportunities and avoid foreclosure orrepossession if reasonably possible. If a re-aged account subsequently experiences payment defaults, it will againbecome contractually delinquent. In previous filings, we referred to re-aged accounts as restructured accounts. Wehave changed our terminology in an effort to clarify our practices as we believe the industry generally uses the term“re-age” rather than “restructure.”
As a result of the marketplace conditions previously described, in the fourth quarter of 2006 we began performingextensive reviews of our account management policies and practices and, in the first quarter of 2008, conducted afurther strategic review of our receivable collection efforts. As more fully discussed below, these reviews haveresulted in changes in our strategies for contacting customers as well as expanding existing modification programsto enable us to assist more customers in accordance with their needs.
Beginning late in the first quarter of 2008, we expanded our customer contact strategies in an effort to reach morecustomers. We have increased collection staffing particularly during the morning and evening hours when ourcustomers are more likely to be available. We continue to work with advocacy groups in select markets to assist inencouraging our customers with financial needs to contact us. Additionally, we have placed loss mitigation teams inselect Consumer Lending branches in select markets to work with customers on a face-to-face basis to assist themduring difficult times. We have also implemented new training programs to ensure that our customer servicerepresentatives are knowledgeable about the re-aging and modification programs available and are able to adviseeach customer of the best solutions for their individual circumstance. In the past, the majority of our customers werebest served by re-aging their loan either with or without a modification of the loan terms. In the current marketplace,we have determined that our customers may be better served by a modification of the loan terms, which may or maynot also include a re-aging of the account. As a result, during the first nine months of 2008, we have assisted morecustomers through the use of account modification than in prior years.
The following describes the primary programs we currently utilize to provide assistance to our customers with thegoal to keep more customers in their homes, while maximizing future cash flows.
• Proactive ARM Reset Modification Program: As part of our risk mitigation efforts relating to the affectedcomponents of the Mortgage Services portfolio, in October 2006 we established a new program specificallydesigned to meet the needs of select customers with ARMs nearing their first interest rate and payment reset thatwe expect will be the most impacted by a rate adjustment. We are proactively contacting these customers and,through a variety of means, we assess their ability to make the adjusted payment with a focus on the customer’sdebt service capability. As appropriate and in accordance with defined policies, we modify the loans, allowingtime for the customer to seek alternative financing or improve their individual situation. Through the first quarterof 2008, these loan modifications primarily involved a twelve-month temporary interest rate relief by eithermaintaining the current interest rate for the entire twelve-month period or resetting the interest rate for the twelve-month period to a rate lower than originally required at the first reset date. At the end of the modification period,the interest rate on the loan will reset in accordance with the original loan terms unless the borrower qualifies forand is granted a new modification. We anticipate approximately $276 million and $376 million, respectively, ofARM loans modified under this program since October 2006 will reach a reset date during the remainder of 2008and 2009, respectively. Prior to a loan reaching that reset date, we will re-evaluate the loan to determine if anextension of the modification term is warranted. If the loan is less than 30-days delinquent and has not receivedassistance under any other risk mitigation program, the modification may be extended for an additional twelve-month period provided the customer demonstrates an ongoing need for assistance. Loans modified as part of thisspecific risk mitigation effort are not considered to have been re-aged as these loans were not contractuallydelinquent at the time of the modification. However, if the loan had been re-aged in the past for other reasons orqualified for a re-age subsequent to the modification, it is included in the re-aging statistics table on page 77 (“Re-age Table).
73

During the nine months ended September 30, 2008, we have modified 2,274 loans under the Proactive ARMReset Modification Program with an outstanding receivable balance of $413 million at the time of themodification. Since the inception of the Proactive ARM Reset Modification program in October 2006, wehave modified approximately 12,600 loans with an aggregate outstanding principal balance of $2,045 million atthe time of the modification. The following provides information about the post-modification performance ofloans granted modifications under this program since October 2006:
Numberof Loans
Outstanding ReceivableBalance at Time of
Modification
Current or less than 30-days delinquent . . . . . . . . . . . . . . . . . . . . . . . . . . . 63.5% 63.3%
30- to 59-days delinquent . . . . . . . . . . . . . . . . . . . . . . . . . . . . . . . . . . . 7.1 7.2
60-days or more delinquent . . . . . . . . . . . . . . . . . . . . . . . . . . . . . . . . . . 6.4 7.1
Paid-in-full . . . . . . . . . . . . . . . . . . . . . . . . . . . . . . . . . . . . . . . . . . . . . . 12.1 10.6
Charged-off, transferred to real estate owned or sold . . . . . . . . . . . . . . . 10.9 11.8
100.0% 100.0%
Of the loans modified under this program since October 2006, approximately 2,900 loans have subsequentlyqualified for assistance under other risk mitigation programs. Approximately 3,100 loans have reached the end ofthe modification period but did not qualify for other risk modification programs. Approximately 2,100 of thoseloans have had the interest rate reset in accordance with the original contractual terms.
• Foreclosure Avoidance/Account Modification Programs: Since the fourth quarter of 2006, we have significantlyincreased our use of modifications in response to what we expect will be a longer term need of assistance by ourcustomers due to the weak housing market and U.S. economy. In these instances, at our Mortgage Servicesbusiness we are actively using account modifications to modify the rate and/or payment on a number of qualifyingdelinquent loans and re-age certain of these accounts upon receipt of two or more modified payments and othercriteria being met. This account management practice is designed to assist borrowers who may have purchased ahome with an expectation of continued real estate appreciation or of income that has proven unfounded. We alsoexpanded the use of a Foreclosure Avoidance Program for delinquent Consumer Lending customers designed toprovide relief to qualifying homeowners through loan modification and/or re-aging.
Based on the economic environment and expected slow recovery of housing values, during 2008 we havedeveloped additional analytical review tools leveraging off best practices in our Mortgage Services business toassist us in identifying customers who are willing to pay, but are expected to have longer term disruptions in theirability to pay. Using these analytical review tools, we have expanded our foreclosure avoidance/accountmodification programs to assist customers who did not qualify for assistance under the existing programrequirements or who required greater assistance than available under the programs. The expanded programincludes certain documentation requirements as well as receipt of two qualifying payments before the accountmay be re-aged. For Consumer Lending customers, prior to July 2008, receipt of one qualifying payment wasrequired for a modified account before the account would be re-aged. During the first quarter of 2008, we beganto offer this expanded program to customers who had contacted us and requested payment relief as well as forcustomers who had not qualified for assistance under one of the existing programs. In the second quarter of 2008,we established a pre-approved payment relief program for customers who may not yet have requested paymentrelief. For selected customer segments, this expanded program lowers the interest rate on fixed rate loans and forARM loans the expanded program modifies the loan to a lower interest rate than scheduled at the first interest ratereset date. The eligibility requirements for this expanded program allow more customers to qualify for paymentrelief and in certain cases can result in a lower interest rate than allowed under other existing programs. Under thisexpanded program, we have also implemented longer term modifications, providing assistance for generallyeither two years or five years for such customers across the Consumer Lending and Mortgage Servicesbusinesses. As a result of the current marketplace conditions and our outlook for a slow return to more normalmarketplace conditions, during 2008 we have significantly increased the use of longer term modifications as webelieve they will provide the most benefit to our customers and stakeholders as the economy recovers. A loanmodified under these programs is only included in the Re-age Table on page 77 if the delinquency status of the
74

loan was reset as a part of the modification or was re-aged in the past for other reasons. Not all loans modifiedunder these programs have the delinquency status reset and, therefore, are not considered to have been re-aged.
The following table summarizes loans modified under the Foreclosure Avoidance/Account Modificationprograms during the nine months ended September 30, 2008 which may have also been re-aged:
ConsumerLending
MortgageServices
ConsumerLending
MortgageServices
Number of AccountsModified During the Nine
Months EndedSeptember 30, 2008
Outstanding ReceivableBalance at Time of
Modification
(dollars are in millions)
Foreclosure Avoidance/Account ModificationPrograms(1) . . . . . . . . . . . . . . . . . . . . . . . . . . . . . . . . . 30,846 27,931 $4,062 $4,152
(1) Includes all loans modified under these programs during the nine months ended September 30, 2008 regardless of whether the loan wasalso re-aged.
We also support a variety of national and local efforts in homeownership preservation and foreclosure avoidance.
As a result of the expansion of our modification and re-age programs in response to the marketplace conditionspreviously described, modification and re-age volumes since January 2007 for real estate secured receivables havesignificantly increased and we anticipate this trend of higher modification and re-age volumes will continue in theforeseeable future. Since January 2007, we have cumulatively modified and/or re-aged approximately 238,000 realestate secured loans with an aggregate outstanding principal balance of $28.8 billion at the time of the modificationand/or re-age under the programs described above. The following provides information about the post-modificationperformance of all real estate secured loans granted a modification and/or re-age since January 2007:
Numberof Loans
Outstanding ReceivableBalance at Time of
Modification
Current or less than 30-days delinquent . . . . . . . . . . . . . . . . . . . . . . . . . . . . . 61.7% 58.4%
30- to 59-days delinquent . . . . . . . . . . . . . . . . . . . . . . . . . . . . . . . . . . . . . . . 6.5 6.4
60-days or more delinquent . . . . . . . . . . . . . . . . . . . . . . . . . . . . . . . . . . . . . 10.7 11.4
Paid-in-full. . . . . . . . . . . . . . . . . . . . . . . . . . . . . . . . . . . . . . . . . . . . . . . . . . 8.1 8.5Charged-off, transferred to real estate owned or sold . . . . . . . . . . . . . . . . . . . 13.0 15.3
100.0% 100.0%
75

The following table shows the number of real estate secured accounts as well as the outstanding receivable balanceof these accounts as of the period indicated for loans that were either re-aged only, modified only or modified and re-aged:
ConsumerLending
MortgageServices
ConsumerLending
MortgageServices
Outstanding ReceivableBalance(4)Number of Accounts
Real Estate Modifications and/or Re-ages(1)
(dollars are in millions)
September 30, 2008:Loans re-aged only . . . . . . . . . . . . . . . . . . . . . . . . . . . . . . . . . 115,121 48,977 $11,401 $ 5,053
Loans modified only(2) . . . . . . . . . . . . . . . . . . . . . . . . . . . . . . . 26,725 12,933 3,536 1,939
Loans modified and re-aged . . . . . . . . . . . . . . . . . . . . . . . . . . . 10,578 25,537 1,243 3,781
Total loans modified and/or re-aged(3) . . . . . . . . . . . . . . . . . . . . 152,424 87,447 $16,180 $10,773
June 30, 2008:Loans re-aged only . . . . . . . . . . . . . . . . . . . . . . . . . . . . . . . . . 110,181 50,260 $10,671 $ 5,248
Loans modified only(2) . . . . . . . . . . . . . . . . . . . . . . . . . . . . . . . 19,352 11,584 2,397 1,823
Loans modified and re-aged . . . . . . . . . . . . . . . . . . . . . . . . . . . 9,196 20,290 1,028 3,038
Total loans modified and/or re-aged . . . . . . . . . . . . . . . . . . . . . 138,729 82,134 $14,096 $10,109
ConsumerLending
MortgageServices
ConsumerLending
MortgageServices
Number of AccountsOutstanding Receivable
Balance
September 30, 2007:Loans re-aged only . . . . . . . . . . . . . . . . . . . . . . . . . . . . . . . . . 94,556 49,145 $ 8,129 $5,124
Loans modified only(2) . . . . . . . . . . . . . . . . . . . . . . . . . . . . . . . 13,371 5,498 1,374 843
Loans modified and re-aged . . . . . . . . . . . . . . . . . . . . . . . . . . . 8,488 9,012 884 1,269
Total loans modified and/or re-aged . . . . . . . . . . . . . . . . . . . . . 116,415 63,655 $10,387 $7,236
(1) Loans which have been granted a permanent modification, a twelve-month or longer modification, or two or more consecutive six-monthmodifications are considered troubled debt restructurings for purposes of determining loss reserve estimates under SFAS No. 114,“Accounting by Creditors for Impairment of a Loan.” For additional information related to our troubled debt restructurings, see Note 6,“Receivables,” to our accompanying consolidated financial statements.
(2) Includes loans that have been modified under the Proactive ARM Modification program described above.
(3) The following table provides information at September 30, 2008 regarding the delinquency status of loans granted modifications of loanterms and/or re-ages of the account:
ConsumerLending
MortgageServices
ConsumerLending
MortgageServices
Number of AccountsOutstanding Receivable
Balance
Current or less than 30-days delinquent . . . . . . . . . . . . . . . . . . . . . . . . . . . 76.7% 67.2% 74.5% 65.9%
30- to 59-days delinquent . . . . . . . . . . . . . . . . . . . . . . . . . . . . . . . . . . . . 11.1 10.6 12.1 10.5
60-days or more delinquent . . . . . . . . . . . . . . . . . . . . . . . . . . . . . . . . . . 12.2 22.2 13.4 23.6
100.0% 100.0% 100.0% 100.0%
(4) The outstanding receivable balance included in this table reflects the principal amount outstanding on the loan excluding any basisadjustments to the loan such as unearned income, unamortized deferred fees and costs on originated loans, purchase accounting fair valueadjustments and premiums or discounts on purchased loans.
76

Although we have shifted our customer assistance programs to include more loan modifications, we continue tomonitor and track information related to accounts that have been re-aged. The tables below summarize approximatere-aging statistics (statistics on accounts where a delinquent loan has been reset to a current status) in our managedbasis domestic portfolio. Managed basis assumes that securitized receivables have not been sold and remain on ourbalance sheet. We report our re-aging statistics on a managed basis only because the receivables that we securitizeare subject to underwriting standards comparable to our owned portfolio, are generally serviced and collectedwithout regard to ownership and result in a similar credit loss exposure for us. As we retired the last of oursecuritization transactions, managed basis and owned basis results have now converged beginning with theMarch 31, 2008 reporting period.
As previously reported, in prior periods we used certain assumptions and estimates to compile our re-agingstatistics. The systemic counters used to compile the information presented below exclude from the reportedstatistics loans that have been reported as contractually delinquent but have been reset to a current status because wehave determined that the loans should not have been considered delinquent (e.g., payment application processingerrors). When comparing re-aging statistics from different periods, the fact that our re-aging policies and practiceswill change over time, that exceptions are made to those policies and practices, and that our data capturemethodologies have been enhanced, should be taken into account.
Re-age Table – Domestic Portfolio (1),(3)
(Managed Basis)
September 30,2008
June 30,2008
September 30,2007
(dollars are in millions)
Never re-aged . . . . . . . . . . . . . . . . . . . . . . . . . . . . . . . . . . . . . . . . . 77.8% 79.9% 85.3%Re-aged:
Re-aged in the last 6 months . . . . . . . . . . . . . . . . . . . . . . . . . . . . 9.1 8.7 6.3Re-aged in the last 7-12 months . . . . . . . . . . . . . . . . . . . . . . . . . . 6.7 6.0 4.5Previously re-aged beyond 12 months . . . . . . . . . . . . . . . . . . . . . . 6.4 5.4 3.9
Total ever re-aged(2) . . . . . . . . . . . . . . . . . . . . . . . . . . . . . . . . . . . 22.2 20.1 14.7
Total . . . . . . . . . . . . . . . . . . . . . . . . . . . . . . . . . . . . . . . . . . . . . . . . 100.0% 100.0% 100.0%
Total Re-aged by Product – Domestic Portfolio(1)(4)
Real estate secured(3) . . . . . . . . . . . . . . . . . . . . . . . . . . . . . . . . . . . . $21,305 $20,031 $14,944Auto finance . . . . . . . . . . . . . . . . . . . . . . . . . . . . . . . . . . . . . . . . . . 2,318 2,219 2,019Credit card . . . . . . . . . . . . . . . . . . . . . . . . . . . . . . . . . . . . . . . . . . . 804 804 785Private label . . . . . . . . . . . . . . . . . . . . . . . . . . . . . . . . . . . . . . . . . . 20 22 28Personal non-credit card . . . . . . . . . . . . . . . . . . . . . . . . . . . . . . . . . . 4,288 4,203 3,949
Total . . . . . . . . . . . . . . . . . . . . . . . . . . . . . . . . . . . . . . . . . . . . . . . . $28,735 $27,279 $21,725
(As a percent of managed receivables)Real estate secured . . . . . . . . . . . . . . . . . . . . . . . . . . . . . . . . . . . . . 28.6% 25.5% 17.2%Auto finance . . . . . . . . . . . . . . . . . . . . . . . . . . . . . . . . . . . . . . . . . . 20.2 17.7 15.7Credit card . . . . . . . . . . . . . . . . . . . . . . . . . . . . . . . . . . . . . . . . . . . 2.9 2.9 2.7Private label . . . . . . . . . . . . . . . . . . . . . . . . . . . . . . . . . . . . . . . . . . 25.0 22.2 16.6Personal non-credit card . . . . . . . . . . . . . . . . . . . . . . . . . . . . . . . . . . 26.7 25.2 21.4
Total(2) . . . . . . . . . . . . . . . . . . . . . . . . . . . . . . . . . . . . . . . . . . . . . . 22.2% 20.1% 14.7%
(1) Excludes our Canadian and commercial businesses, discontinued U.K. Operations and other.
(2) Total including our Canadian business was 21.8 percent at September 30, 2008, 19.7 percent at June 30, 2008 and 14.0 percent atSeptember 30, 2007.
77

(3) The Mortgage Services and Consumer Lending businesses real estate secured re-ages are shown in the following table:
September 30,2008
June 30,2008
September 30,2007
(in millions)
Mortgage Services . . . . . . . . . . . . . . . . . . . . . . . . . . . . . . . . . . . . . . . . . . . . . $ 9,322 $ 8,870 $ 6,965
Consumer Lending . . . . . . . . . . . . . . . . . . . . . . . . . . . . . . . . . . . . . . . . . . . . . 11,983 11,161 7,979
Total real estate secured . . . . . . . . . . . . . . . . . . . . . . . . . . . . . . . . . . . . . . . . . . $21,305 $20,031 $14,944
(4) The outstanding receivable balance included in this table reflects the principal amount outstanding on the loan net of unearned income,unamortized deferred fees and costs on originated loans, purchase accounting fair value adjustments and premiums or discounts on purchasedloans.
The increase in re-aged loans in the third quarter of 2008 was primarily attributable to higher contractualdelinquency due to deteriorating credit quality in our Mortgage Services and Consumer Lending businesses aswe continue to work with our customers who, in our judgment, evidence continued payment probability as well aschanges to our collection strategies as described above. As such, we anticipate re-aged loans will continue toincrease. At September 30, 2008, June 30, 2008, and September 30, 2007, $6.2 billion (21 percent of total re-agedloans in the Re-age Table), $4.9 billion (18 percent of total re-aged loans in the Re-age Table), and $3.6 billion (17percent of total re-age loans in the Re-age Table), respectively, of re-aged accounts have subsequently experiencedpayment defaults and are included in our two-months-and-over contractual delinquency at the period indicated.
In addition to our modification and re-aging policies and practices, we employ other customer account managementtechniques in respect of delinquent accounts that are similarly designed to manage customer relationships,maximize collection opportunities and avoid foreclosure or repossession if commercially sensible and reasonablypossible. These additional customer account management techniques include, at our discretion, actions such asextended payment arrangements, approved external debt management plans, forbearance, loan rewrites and/ordeferment pending a change in circumstances. We typically use these customer account management techniqueswith individual borrowers in transitional situations, usually involving borrower hardship circumstances or tem-porary setbacks that are expected to affect the borrower’s ability to pay the contractually specified amount for someperiod of time. For example, under a forbearance agreement, we may agree not to take certain collection or creditagency reporting actions with respect to missed payments, often in return for the borrower’s agreement to pay us anadditional amount with future required payments. In some cases, these additional customer account managementtechniques may involve us agreeing to lower the contractual payment amount and/or reduce the periodic interestrate. In most cases, the delinquency status of an account is considered to be current if the borrower immediatelybegins payment under the new account terms.
When we use a customer account management technique, we may treat the account as being contractually currentand will not reflect it as a delinquent account in our delinquency statistics. However, if the account subsequentlyexperiences payment defaults, it will again become contractually delinquent. Reserves are maintained specificallyfor re-aged accounts. We generally consider loan rewrites to involve an extension of a new loan, and such new loansare not reflected in our delinquency or re-aging statistics. Our account management actions vary by product and areunder continual review and assessment to determine that they meet the goals outlined above.
The amount of domestic and Canadian receivables in forbearance, modification, rewrites or other customer accountmanagement techniques for which we have reset delinquency and that is not included in the re-aged or delinquencystatistics was approximately $.1 billion or .1 percent at September 30, 2008 and December 31, 2007.
78

Geographic Concentrations The following table reflects the percentage of domestic consumer receivables andreceivables held for sale by state which individually account for 5 percent or greater of our domestic portfolio as ofboth September 30, 2008 and December 31, 2007.
State
Percent of TotalDomestic
Receivables
California. . . . . . . . . . . . . . . . . . . . . . . . . . . . . . . . . . . . . . . . . . . . . . . . . . . . . . . . . . . . . . . . 11%Florida . . . . . . . . . . . . . . . . . . . . . . . . . . . . . . . . . . . . . . . . . . . . . . . . . . . . . . . . . . . . . . . . . . 7New York . . . . . . . . . . . . . . . . . . . . . . . . . . . . . . . . . . . . . . . . . . . . . . . . . . . . . . . . . . . . . . . 6Ohio . . . . . . . . . . . . . . . . . . . . . . . . . . . . . . . . . . . . . . . . . . . . . . . . . . . . . . . . . . . . . . . . . . . 5Pennsylvania . . . . . . . . . . . . . . . . . . . . . . . . . . . . . . . . . . . . . . . . . . . . . . . . . . . . . . . . . . . . . 5Texas . . . . . . . . . . . . . . . . . . . . . . . . . . . . . . . . . . . . . . . . . . . . . . . . . . . . . . . . . . . . . . . . . . . 5
Liquidity and Capital Resources
Debt due to affiliates and other HSBC related funding are summarized in the following table:
September 30,2008
December 31,2007
(in billions)
Debt issued to HSBC subsidiaries:Term debt . . . . . . . . . . . . . . . . . . . . . . . . . . . . . . . . . . . . . . . . . . . . . . . . . . . $12.0 $11.1
Preferred securities issued by Household Capital Trust VIII to HSBC . . . . . . . .3 .3
Total debt outstanding to HSBC subsidiaries . . . . . . . . . . . . . . . . . . . . . . . . . . 12.3 11.4(2)
Debt outstanding to HSBC clients:
Euro commercial paper. . . . . . . . . . . . . . . . . . . . . . . . . . . . . . . . . . . . . . . . . . .6 2.0
Term debt . . . . . . . . . . . . . . . . . . . . . . . . . . . . . . . . . . . . . . . . . . . . . . . . . . . .6 .8
Total debt outstanding to HSBC clients . . . . . . . . . . . . . . . . . . . . . . . . . . . . . . 1.2 2.8
Cash received on bulk and subsequent sales of domestic private label credit cardreceivables to HSBC Bank USA, net (cumulative) . . . . . . . . . . . . . . . . . . . . . . 18.3 19.2
Real estate secured receivable activity with HSBC Bank USA:
Cash received on sales (cumulative) . . . . . . . . . . . . . . . . . . . . . . . . . . . . . . . . 3.7 3.7
Direct purchases from correspondents (cumulative) . . . . . . . . . . . . . . . . . . . . . 4.2 4.2
Reductions in real estate secured receivables sold to HSBC Bank USA . . . . . . (5.7) (5.4)
Total real estate secured receivable activity with HSBC Bank USA . . . . . . . . . . . 2.2 2.5
Cash received from sale of U.K. Operations to HOHU . . . . . . . . . . . . . . . . . . . . .4 -
Cash received from sale of European Operations to HBEU affiliate . . . . . . . . . . . -(1) -(1)
Cash received from sale of U.K. credit card business to HBEU . . . . . . . . . . . . . . 2.7 2.7
Capital contribution by HSBC Investments (North America) Inc. (cumulative) . . . 5.9 2.4
Total HSBC related funding . . . . . . . . . . . . . . . . . . . . . . . . . . . . . . . . . . . . . . . . $43.0 $41.0
(1) Less than $100 million.(2) Excludes $3.5 billion of drawings on bank lines of our U.K. Operations that are now reported as Liabilities of discontinued operations.
Funding from HSBC, including debt issuances to HSBC subsidiaries and clients, represented 10 percent of our totaldebt and preferred stock funding at September 30, 2008 and 8 percent of our total debt and preferred stock fundingat December 31, 2007.
Cash proceeds received from the sale of our U.K. Operations to HOHU, the sale of our European Operations to anHBEU affiliate and the sale of our U.K. credit card business to HBEU were used to pay down short-term domestic
79

borrowings, including outstanding commercial paper balances, and draws on bank lines from HBEU. Proceedsreceived from the bulk sale and subsequent daily sales of domestic private label credit card receivables to HSBCBank USA of $18.3 billion were used to pay down short-term domestic borrowings, including outstandingcommercial paper balances. Proceeds from each of these transactions were also used to fund ongoing operations.
At September 30, 2008 and December 31, 2007 we had a commercial paper back stop credit facility of $2.5 billionfrom HSBC supporting domestic issuances. No balances were outstanding under these domestic lines at eitherSeptember 30, 2008 or December 31, 2007. We also had a revolving credit facility from HBEU to fund ouroperations in the U.K. of $5.7 billion at December 31, 2007. As a result of the sale of our U.K. Operations, this creditfacility has been assumed by HOHU. At December 31, 2007, $3.5 billion was outstanding under the HBEU lines forthe U.K. We had derivative contracts with a notional value of $83.7 billion, or approximately 98 percent of totalderivative contracts, outstanding with HSBC affiliates at September 30, 2008 and $91.8 billion, or approximately97 percent at December 31, 2007.
Interest bearing deposits with banks and other short-term investments Interest bearing deposits with banks totaled$173 million at September 30, 2008 and $335 million at December 31, 2007. Securities purchased underagreements to resell totaled $1.6 billion at September 30, 2008 and $1.5 billion at December 31, 2007.
Commercial paper, bank and other borrowings totaled $7.9 billion at September 30, 2008 and $8.4 billion atDecember 31, 2007. Included in this total was outstanding Euro commercial paper sold to customers of HSBC of$.6 billion at September 30, 2008 and $2.0 billion at December 31, 2007. Commercial paper balances were lower atSeptember 30, 2008 as a result of lower short term funding requirements due to a reduction in the overall size of thebalance sheet. Euro commercial paper balances were lower at September 30, 2008 because domestic commercialpaper rates provided a significant pricing advantage when compared to European pricing levels. Generally, ourfunding strategies are structured such that committed bank credit facilities exceed 100 percent of outstandingcommercial paper. Should this ratio fall below 100 percent, the combination of committed bank credit facilities andundrawn committed conduit facilities will, at all times, exceed 115 percent of outstanding commercial paper. At notime will the ratio of committed bank credit facilities to outstanding commercial paper fall below 80 percent.
We had committed back-up lines of credit totaling $9.8 billion at September 30, 2008 to support our domesticissuance of commercial paper. A portion of this total will mature each year for the next three years. Based on currentmarket conditions, we do not anticipate renewing all of these back-up lines as they mature. However, we do notexpect these reductions will have a significant impact on our overall funding strategy.
At September 30, 2008, we had conduit credit facilities with commercial and investment banks under which ourdomestic operations may issue securities backed with up to $9.6 billion of receivables, including auto finance, creditcard and personal non-credit card receivables. The facilities are renewable at the providers’ option. Our totalconduit capacity decreased by $.9 billion in the three months ended September 30, 2008 and $7.8 billion in the year-to-date period as certain facilities were not renewed. Conduit capacity for real estate secured receivables did notchange in the three months ended September 30, 2008 and decreased $3.2 billion in the year-to-date period andcapacity for other products decreased $4.6 billion in the first nine months of 2008. These reductions are primarilythe result of the combination of an extremely difficult domestic and international funding environment anddecisions by the providing institutions to reduce their overall exposure to subprime receivables. At September 30,2008, $8.6 billion of auto finance, credit card and personal non-credit card receivables were used in collateralizedfunding transactions structured as secured financings under these funding programs. The amount available underthe facilities varies based on the timing and volume of public securitization transactions. We also anticipate areduction in the available conduit credit facilities as they mature over the next twelve months due to continuingconcerns about subprime credit quality. For the conduit credit facilities that do renew, credit performancerequirements have been more restrictive and pricing has increased to reflect the perceived quality of the underlyingassets. Our 2008 and 2009 funding plans incorporates the anticipated reductions in these facilities as the balancesheet reductions previously described have reduced our liquidity requirements.
Long term debt (with original maturities over one year) decreased to $100.6 billion at September 30, 2008 from$123.0 billion at December 31, 2007 as our funding needs have decreased since December 31, 2007 as we havereduced the size of our balance sheet as previously discussed. The decrease in long term debt during the first
80
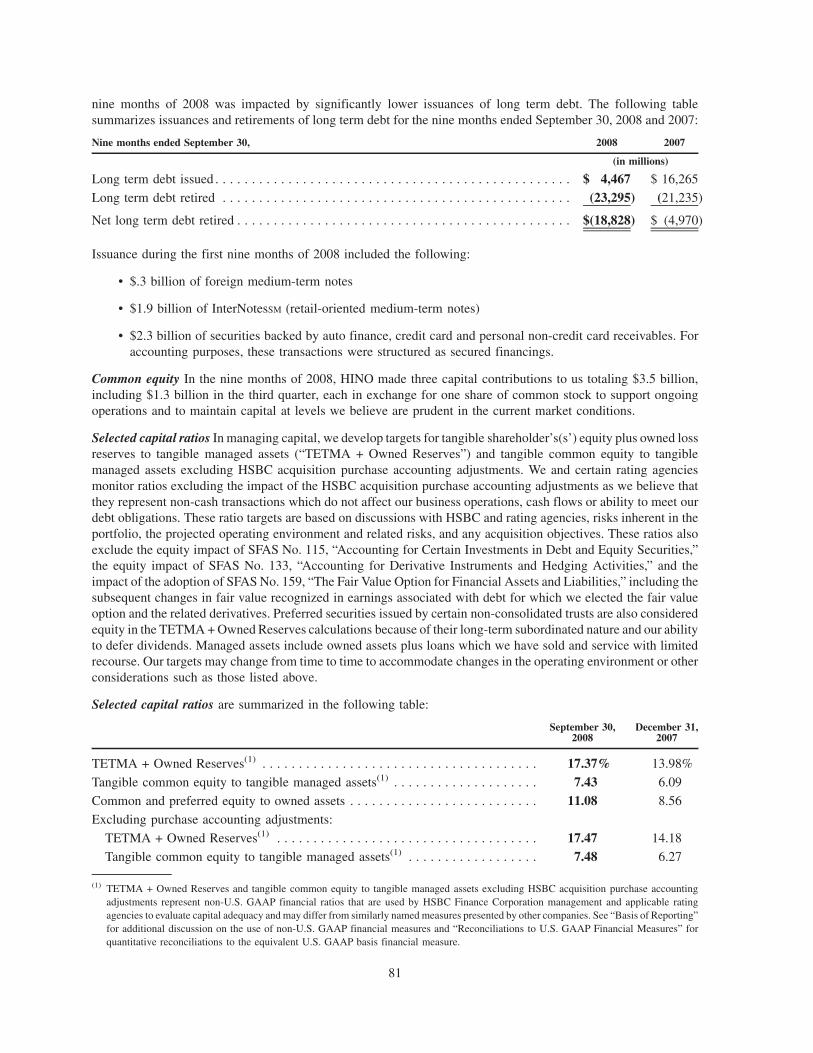
nine months of 2008 was impacted by significantly lower issuances of long term debt. The following tablesummarizes issuances and retirements of long term debt for the nine months ended September 30, 2008 and 2007:
Nine months ended September 30, 2008 2007
(in millions)
Long term debt issued . . . . . . . . . . . . . . . . . . . . . . . . . . . . . . . . . . . . . . . . . . . . . . . . . $ 4,467 $ 16,265
Long term debt retired . . . . . . . . . . . . . . . . . . . . . . . . . . . . . . . . . . . . . . . . . . . . . . . . (23,295) (21,235)
Net long term debt retired . . . . . . . . . . . . . . . . . . . . . . . . . . . . . . . . . . . . . . . . . . . . . . $(18,828) $ (4,970)
Issuance during the first nine months of 2008 included the following:
• $.3 billion of foreign medium-term notes
• $1.9 billion of InterNotesSM (retail-oriented medium-term notes)
• $2.3 billion of securities backed by auto finance, credit card and personal non-credit card receivables. Foraccounting purposes, these transactions were structured as secured financings.
Common equity In the nine months of 2008, HINO made three capital contributions to us totaling $3.5 billion,including $1.3 billion in the third quarter, each in exchange for one share of common stock to support ongoingoperations and to maintain capital at levels we believe are prudent in the current market conditions.
Selected capital ratios In managing capital, we develop targets for tangible shareholder’s(s’) equity plus owned lossreserves to tangible managed assets (“TETMA + Owned Reserves”) and tangible common equity to tangiblemanaged assets excluding HSBC acquisition purchase accounting adjustments. We and certain rating agenciesmonitor ratios excluding the impact of the HSBC acquisition purchase accounting adjustments as we believe thatthey represent non-cash transactions which do not affect our business operations, cash flows or ability to meet ourdebt obligations. These ratio targets are based on discussions with HSBC and rating agencies, risks inherent in theportfolio, the projected operating environment and related risks, and any acquisition objectives. These ratios alsoexclude the equity impact of SFAS No. 115, “Accounting for Certain Investments in Debt and Equity Securities,”the equity impact of SFAS No. 133, “Accounting for Derivative Instruments and Hedging Activities,” and theimpact of the adoption of SFAS No. 159, “The Fair Value Option for Financial Assets and Liabilities,” including thesubsequent changes in fair value recognized in earnings associated with debt for which we elected the fair valueoption and the related derivatives. Preferred securities issued by certain non-consolidated trusts are also consideredequity in the TETMA + Owned Reserves calculations because of their long-term subordinated nature and our abilityto defer dividends. Managed assets include owned assets plus loans which we have sold and service with limitedrecourse. Our targets may change from time to time to accommodate changes in the operating environment or otherconsiderations such as those listed above.
Selected capital ratios are summarized in the following table:
September 30,2008
December 31,2007
TETMA + Owned Reserves(1) . . . . . . . . . . . . . . . . . . . . . . . . . . . . . . . . . . . . . . 17.37% 13.98%
Tangible common equity to tangible managed assets(1) . . . . . . . . . . . . . . . . . . . . 7.43 6.09
Common and preferred equity to owned assets . . . . . . . . . . . . . . . . . . . . . . . . . . 11.08 8.56
Excluding purchase accounting adjustments:
TETMA + Owned Reserves(1) . . . . . . . . . . . . . . . . . . . . . . . . . . . . . . . . . . . . 17.47 14.18
Tangible common equity to tangible managed assets(1) . . . . . . . . . . . . . . . . . . 7.48 6.27
(1) TETMA + Owned Reserves and tangible common equity to tangible managed assets excluding HSBC acquisition purchase accountingadjustments represent non-U.S. GAAP financial ratios that are used by HSBC Finance Corporation management and applicable ratingagencies to evaluate capital adequacy and may differ from similarly named measures presented by other companies. See “Basis of Reporting”for additional discussion on the use of non-U.S. GAAP financial measures and “Reconciliations to U.S. GAAP Financial Measures” forquantitative reconciliations to the equivalent U.S. GAAP basis financial measure.
81

Securitizations and secured financings Securitizations (collateralized funding transactions structured to receivesale treatment under Statement of Financial Accounting Standards No. 140, “Accounting for Transfers andServicing of Financial Assets and Extinguishments of Liabilities, a Replacement of FASB Statement No. 125,”(“SFAS No. 140”)) and secured financings (collateralized funding transactions which do not receive sale treatmentunder SFAS No. 140) of consumer receivables have been a source of funding and liquidity for us. Collateralizedfunding transactions have been used to limit our reliance on the unsecured debt markets and can be a more cost-effective source of alternative funds. Beginning in the third quarter of 2004, we structured all new collateralizedfunding transactions as secured financings. In February 2008, we repaid the remaining securitized receivable creditcard trust and, as a result, we no longer have any outstanding securitizations.
Secured financings are summarized in the following table:
Three months ended September 30, 2008 2007
(in millions)
Real estate secured . . . . . . . . . . . . . . . . . . . . . . . . . . . . . . . . . . . . . . . . . . . . . . . . . . . . . . $ - $ 950
Credit card . . . . . . . . . . . . . . . . . . . . . . . . . . . . . . . . . . . . . . . . . . . . . . . . . . . . . . . . . . . . 375 678
Auto finance . . . . . . . . . . . . . . . . . . . . . . . . . . . . . . . . . . . . . . . . . . . . . . . . . . . . . . . . . . . 400 -
Personal non-credit card . . . . . . . . . . . . . . . . . . . . . . . . . . . . . . . . . . . . . . . . . . . . . . . . . . 775 1,200
Total . . . . . . . . . . . . . . . . . . . . . . . . . . . . . . . . . . . . . . . . . . . . . . . . . . . . . . . . . . . . . . . . . $1,550 $2,828
Nine months ended September 30, 2008 2007
(in millions)
Real estate secured . . . . . . . . . . . . . . . . . . . . . . . . . . . . . . . . . . . . . . . . . . . . . . . . . . . . . . $ - $2,545
Credit card . . . . . . . . . . . . . . . . . . . . . . . . . . . . . . . . . . . . . . . . . . . . . . . . . . . . . . . . . . . . 875 3,568
Auto finance . . . . . . . . . . . . . . . . . . . . . . . . . . . . . . . . . . . . . . . . . . . . . . . . . . . . . . . . . . . 600 1,069
Personal non-credit card . . . . . . . . . . . . . . . . . . . . . . . . . . . . . . . . . . . . . . . . . . . . . . . . . . 775 1,310
Total . . . . . . . . . . . . . . . . . . . . . . . . . . . . . . . . . . . . . . . . . . . . . . . . . . . . . . . . . . . . . . . . . $2,250 $8,492
As of September 30, 2008, outstanding secured financings of $18.2 billion, including conduit credit facilities, weresecured by $26.6 billion of real estate secured, auto finance, credit card and personal non-credit card receivables.Secured financings, including conduit credit facilities, of $23.2 billion at December 31, 2007 were secured by $30.9billion of real estate secured, auto finance, credit card and personal non-credit card receivables. Secured financings,including conduit credit facilities, represented 15 percent of the funding associated with our managed fundingportfolio at September 30, 2008 and 16 percent at December 31, 2007.
Commitments We also enter into commitments to meet the financing needs of our customers. In most cases, wehave the ability to reduce or eliminate these open lines of credit. As a result, the amounts below do not necessarilyrepresent future cash requirements.
September 30,2008
December 31,2007
(in billions)
Private label, and credit cards . . . . . . . . . . . . . . . . . . . . . . . . . . . . . . . . . . . . . . . $150 $162
Other consumer lines of credit . . . . . . . . . . . . . . . . . . . . . . . . . . . . . . . . . . . . . . 7 8
Open lines of credit(1) . . . . . . . . . . . . . . . . . . . . . . . . . . . . . . . . . . . . . . . . . . . . $157 $170
(1) Includes an estimate for acceptance of credit offers mailed to potential customers prior to September 30, 2008 and December 31, 2007,respectively.
In January 2008, we extended a line of credit to H&R Block for up to $3.0 billion to fund the purchase of aparticipation interest in refund anticipation loans. In April 2008, the balance was paid in full.
82

2008 Funding Strategy The acquisition by HSBC markedly improved our access to the capital markets as well asexpanded our access to a worldwide pool of potential investors. Our current estimated domestic funding needs andsources for 2008 are summarized in the table that follows.
ActualJanuary 1through
September 30,2008
EstimatedOctober 1through
December 31,2008
EstimatedFull Year
2008
(in billions)
Funding needs:Net asset growth/(attrition) . . . . . . . . . . . . . . . . . . . . . . . . . $(15) $ (8) - (5) $ (23) - (20)
Commercial paper and term debt maturities . . . . . . . . . . . . 22 3 - 5 25 - 27
Secured financings including conduit facility maturities . . . . 13 6 - 10 19 - 23
Other . . . . . . . . . . . . . . . . . . . . . . . . . . . . . . . . . . . . . . . . . 2 4 - 5 6 - 7
Total funding needs . . . . . . . . . . . . . . . . . . . . . . . . . . . . . . $ 22 $ 5 - 15 $ 27 - 37
Funding sources:Commercial paper and term debt issuances . . . . . . . . . . . . . $ 8 $ (1) - 1 $ 7 - 9
Asset transfers and loan sales . . . . . . . . . . . . . . . . . . . . . . . 1 5 - 8 6 - 9
Secured financings including conduit facility renewals. . . . . 8 2 - 5 10 - 13
HSBC and HSBC subsidiaries (including capitalinfusions) . . . . . . . . . . . . . . . . . . . . . . . . . . . . . . . . . . . . 5 (1) - 1 4 - 6
Total funding sources . . . . . . . . . . . . . . . . . . . . . . . . . . . . . $ 22 $ 5 - 15 $ 27 - 37
As previously discussed, we have experienced deterioration in the performance of mortgage loan originations in ourMortgage Services and Consumer Lending businesses. As a result in 2007, we discontinued new correspondentchannel acquisitions and ceased operations of Decision One. Additionally, we eliminated certain product offeringsand tightened underwriting criteria in our Consumer Lending business. These actions, combined with normalportfolio attrition and risk mitigation efforts, have resulted and will continue to result in a continued reduction in ouraggregate portfolio in 2008. As opportunities arise, we may also consider the possibility of selling selectedportfolios. Constrained risk appetite as well as any decisions to sell selected portfolios will result in attrition in thebalance sheet during 2008.
Risk Management
Credit Risk There have been no significant changes in our approach to credit risk management since December 31,2007.
At September 30, 2008, we had derivative contracts with a notional value of approximately $85.8 billion, including$83.7 billion outstanding with HSBC affiliates. Most swap agreements, both with unaffiliated and affiliated thirdparties, require that payments be made to, or received from, the counterparty when the fair value of the agreementreaches a certain level. Generally, third-party swap counterparties provide collateral in the form of cash which isrecorded in our balance sheet as other assets or derivative related liabilities. At September 30, 2008, we providedthird party swap counterparties with $41 million collateral. At December 31, 2007, we provided third party swapcounterparties with $51 million collateral. When the fair value of our agreements with affiliate counterpartiesrequires the posting of collateral, it is provided in either the form of cash and recorded on the balance sheet,consistent with third party arrangements, or in the form of securities which are not recorded on our balance sheet. AtSeptember 30, 2008, the fair value of our agreements with affiliate counterparties required the affiliate to providecollateral of $3.5 billion which was provided in cash and offset against the fair value amount recognized forderivative instruments that have been offset under the same master netting arrangement in accordance with FASBStaff Position No. FIN 39-1, “Amendment of FASB Interpretation No. 39,” (“FSP 39-1”) and recorded in ourbalance sheet as a component of derivative related assets. At December 31, 2007, the fair value of our agreementswith affiliate counterparties required the affiliate to provide collateral of $3.8 billion which was provided in cash
83

and offset against the fair value amount recognized for derivative instruments that have been offset under the samemaster netting arrangement in accordance with FSP 39-1 and recorded in our balance sheet as a component ofderivative related assets. No collateral was provided in the form of securities at September 30, 2008 or December 31,2007.
Liquidity Risk Our liquidity is critical to our ability to operate our businesses, fund new loans and be profitable. Acompromise to our liquidity could therefore have a negative effect on our financial results. During 2007 andcontinuing into 2008, the capital markets have been severely disrupted and became highly risk averse andreactionary. Institutional fixed income investors remain reluctant to commit significant levels of liquidity to thefinancial sector of the market. Traditional providers of credit to the subprime market are either reducing theirexposure to this asset class or markedly tightening the credit standards necessary to receive financing for subprimeassets. This has raised our cost of funds.
We continue to evaluate the optimal size of our balance sheet taking into consideration our desired risk profile, ourliquidity and funding needs as well as our expected views of the subprime lending industry after the market returnsto more normalized levels. We expect to continue to tighten underwriting standards and adjust product offeringsresulting in lower future originations. We have classified $10.8 billion of receivables previously held for investmentto receivables held for sale as of September 30, 2008 and anticipate liquidating these assets in the near term. Of thisamount, $6.2 billion represents the GM MasterCard portfolio that we intend to sell to HSBC Bank USA pendingregulatory approval. This amount also includes certain real estate secured and auto finance receivables with a fairvalue of $2.9 billion we identified and transferred to receivables held for sale during the third quarter of 2008, ofwhich we also intend to sell approximately $2.8 billion to HSBC Bank USA pending regulatory approval. Theexecution of these transactions will significantly reduce our need to issue secured or unsecured term debt over theremainder of 2008 and 2009.
Potential conditions that could negatively affect our liquidity include diminished access to capital markets,unforeseen cash or capital requirements, a continued strengthening of the U.S. dollar, an inability to sell assets orexecute secured financing transactions due to reduced investor appetite for non-prime assets and an inability toobtain expected funding from HSBC subsidiaries and clients.
Our credit ratings are an important part of maintaining our liquidity. A credit ratings downgrade could potentiallyincrease borrowing costs, and depending on its severity, limit access to capital markets, require cash payments orcollateral posting.
Market Risk HSBC has certain limits and benchmarks that serve as guidelines in determining the appropriate levelsof interest rate risk. One such limit is expressed in terms of the Present Value of a Basis Point (“PVBP”), whichreflects the change in value of the balance sheet for a one basis point movement in all interest rates. Our PVBP limitwas $2.35 million at September 30, 2008 and $2 million at December 31, 2007, which includes the risk associatedwith hedging instruments. At September 30, 2008 we had a PVBP position of $(1.4) million reflecting the impact ofa one basis point increase in interest rates. As of December 31, 2007, our PVBP position was $(1.7) million.
The following table shows the components of PVBP at September 30, 2008 and December 31, 2007:
September 30,2008
December 31,2007
(in millions)
Risk related to our portfolio of balance sheet items marked-to-market . . . . . . . . . $ 1.5 $ (.2)
Risk for all other remaining assets and liabilities. . . . . . . . . . . . . . . . . . . . . . . . . (2.9) (1.5)
Total PVBP risk. . . . . . . . . . . . . . . . . . . . . . . . . . . . . . . . . . . . . . . . . . . . . . . . . $(1.4) $(1.7)
We also monitor the impact that an immediate hypothetical increase or decrease in interest rates of 25 basis pointsapplied at the beginning of each quarter over a 12 month period would have on our net interest income assuming for
84

2008 a declining balance sheet and the current interest rate risk profile. The following table summarizes suchestimated impact:
September 30,2008
December 31,2007
(in millions)
Decrease in net interest income following a hypothetical 25 basis points rise ininterest rates applied at the beginning of each quarter over thenext 12 months . . . . . . . . . . . . . . . . . . . . . . . . . . . . . . . . . . . . . . . . . . . . . . . $122 $153
Increase in net interest income following a hypothetical 25 basis points fall ininterest rates applied at the beginning of each quarter over thenext 12 months . . . . . . . . . . . . . . . . . . . . . . . . . . . . . . . . . . . . . . . . . . . . . . . 121 132
In the September 2008 and December 2007 calculations, looking forward through 2008, and where applicable into2009, a greater number of real estate secured receivables are expected to remain on the books due to fewerrefinancing options available to subprime customers. As a result, the total benefit to net interest income hasincreased in the declining rate scenario. However, we anticipate higher levels of delinquency and loan impairmentcharges as these remain on the books longer.
These estimates include the impact of debt and the corresponding derivative instruments accounted for using the fairvalue option under SFAS No. 159. These estimates also assume we would not take any corrective actions in responseto interest rate movements and, therefore, exceed what most likely would occur if rates were to change by theamount indicated. A principal consideration supporting this analysis is the projected prepayment of loan balancesfor a given economic scenario. Individual loan underwriting standards in combination with housing valuations andmacroeconomic factors related to available mortgage credit are the key assumptions driving these prepaymentprojections. While we have utilized a number of sources to refine these projections, we cannot currently projectprepayment rates with a high degree of certainty in all economic environments given recent, significant changes inboth subprime mortgage underwriting standards and property valuations across the country.
Operational Risk There has been no significant change in our approach to operational risk management sinceDecember 31, 2007.
Compliance Risk There has been no significant change in our approach to compliance risk management sinceDecember 31, 2007.
Reputational Risk There has been no significant change in our approach to reputational risk management sinceDecember 31, 2007.
85

HSBC FINANCE CORPORATION
RECONCILIATIONS TO U.S. GAAP FINANCIAL MEASURES
September 30,2008
December 31,2007
(dollars are in millions)
Tangible common equity:Common shareholder’s equity . . . . . . . . . . . . . . . . . . . . . . . . . . . . . . . . . . . . . . . . . . . $ 15,070 $ 13,584Exclude:
Fair value option adjustment . . . . . . . . . . . . . . . . . . . . . . . . . . . . . . . . . . . . . . . . . . (1,810) (545)Unrealized (gains) losses on cash flow hedging instruments . . . . . . . . . . . . . . . . . . . . . 523 718Minimum pension liability . . . . . . . . . . . . . . . . . . . . . . . . . . . . . . . . . . . . . . . . . . . . 12 3Unrealized gains on investments and interest-only strip receivables . . . . . . . . . . . . . . . . 115 13Intangible assets . . . . . . . . . . . . . . . . . . . . . . . . . . . . . . . . . . . . . . . . . . . . . . . . . . . (964) (1,107)Goodwill . . . . . . . . . . . . . . . . . . . . . . . . . . . . . . . . . . . . . . . . . . . . . . . . . . . . . . . . (2,724) (2,827)
Tangible common equity . . . . . . . . . . . . . . . . . . . . . . . . . . . . . . . . . . . . . . . . . . . . . . . 10,222 9,839HSBC acquisition purchase accounting adjustments . . . . . . . . . . . . . . . . . . . . . . . . . . . . 23 267
Tangible common equity, excluding HSBC acquisition purchase accounting adjustments . . $ 10,245 $ 10,106
Tangible shareholder’s(s’) equity:Tangible common equity . . . . . . . . . . . . . . . . . . . . . . . . . . . . . . . . . . . . . . . . . . . . . . . $ 10,222 $ 9,839Preferred stock. . . . . . . . . . . . . . . . . . . . . . . . . . . . . . . . . . . . . . . . . . . . . . . . . . . . . . 575 575Mandatorily redeemable preferred securities of Household Capital Trusts . . . . . . . . . . . . . 1,275 1,275
Tangible shareholder’s(s’) equity . . . . . . . . . . . . . . . . . . . . . . . . . . . . . . . . . . . . . . . . . 12,072 11,689HSBC acquisition purchase accounting adjustments . . . . . . . . . . . . . . . . . . . . . . . . . . . . 23 267
Tangible shareholder’s(s’) equity, excluding HSBC acquisition purchase accountingadjustments . . . . . . . . . . . . . . . . . . . . . . . . . . . . . . . . . . . . . . . . . . . . . . . . . . . . . . $ 12,095 $ 11,956
Tangible shareholder’s(s’) equity plus owned loss reserves:Tangible shareholder’s(s’) equity . . . . . . . . . . . . . . . . . . . . . . . . . . . . . . . . . . . . . . . . . $ 12,072 $ 11,689Owned loss reserves . . . . . . . . . . . . . . . . . . . . . . . . . . . . . . . . . . . . . . . . . . . . . . . . . . 11,819 10,905
Tangible shareholder’s(s’) equity plus owned loss reserves . . . . . . . . . . . . . . . . . . . . . . . 23,891 22,594HSBC acquisition purchase accounting adjustments . . . . . . . . . . . . . . . . . . . . . . . . . . . . 23 267
Tangible shareholder’s(s’) equity plus owned loss reserves, excluding HSBC acquisitionpurchase accounting adjustments . . . . . . . . . . . . . . . . . . . . . . . . . . . . . . . . . . . . . . . $ 23,914 $ 22,861
Tangible managed assets:Owned assets . . . . . . . . . . . . . . . . . . . . . . . . . . . . . . . . . . . . . . . . . . . . . . . . . . . . . . . $141,210 $165,504Receivables serviced with limited recourse . . . . . . . . . . . . . . . . . . . . . . . . . . . . . . . . . . - 124
Managed assets . . . . . . . . . . . . . . . . . . . . . . . . . . . . . . . . . . . . . . . . . . . . . . . . . . . . . 141,210 165,628Exclude:
Intangible assets . . . . . . . . . . . . . . . . . . . . . . . . . . . . . . . . . . . . . . . . . . . . . . . . . . . (964) (1,107)Goodwill . . . . . . . . . . . . . . . . . . . . . . . . . . . . . . . . . . . . . . . . . . . . . . . . . . . . . . . . (2,724) (2,827)Derivative financial assets . . . . . . . . . . . . . . . . . . . . . . . . . . . . . . . . . . . . . . . . . . . . (4) (48)
Tangible managed assets . . . . . . . . . . . . . . . . . . . . . . . . . . . . . . . . . . . . . . . . . . . . . . . 137,518 161,646HSBC acquisition purchase accounting adjustments . . . . . . . . . . . . . . . . . . . . . . . . . . . . (634) (387)
Tangible managed assets, excluding HSBC acquisition purchase accounting adjustments . . $136,884 $161,259
Equity ratios:Common and preferred equity to owned assets . . . . . . . . . . . . . . . . . . . . . . . . . . . . . . . 11.08% 8.56%Tangible common equity to tangible managed assets . . . . . . . . . . . . . . . . . . . . . . . . . . . 7.43 6.09Tangible shareholder’s(s’) equity to tangible managed assets . . . . . . . . . . . . . . . . . . . . . . 8.78 7.23Tangible shareholder’s(s’) equity plus owned loss reserves to tangible managed assets . . . . 17.37 13.98Excluding HSBC acquisition purchase accounting adjustments:
Tangible common equity to tangible managed assets . . . . . . . . . . . . . . . . . . . . . . . . . . 7.48 6.27Tangible shareholder’s(s’) equity to tangible managed assets . . . . . . . . . . . . . . . . . . . . 8.84 7.41Tangible shareholder’s(s’) equity plus owned loss reserves to tangible managed assets . . 17.47 14.18
86

Item 4. Controls and Procedures
We maintain a system of internal and disclosure controls and procedures designed to ensure that informationrequired to be disclosed by HSBC Finance Corporation in the reports we file or submit under the SecuritiesExchange Act of 1934, as amended, (the “Exchange Act”), is recorded, processed, summarized and reported on atimely basis. Our Board of Directors, operating through its audit committee, which is composed entirely ofindependent outside directors, provides oversight to our financial reporting process.
We conducted an evaluation, with the participation of the Chief Executive Officer and Chief Financial Officer, ofthe effectiveness of our disclosure controls and procedures as of the end of the period covered by this report. Basedupon that evaluation, the Chief Executive Officer and Chief Financial Officer concluded that our disclosure controlsand procedures were effective as of the end of the period covered by this report so as to alert them in a timely fashionto material information required to be disclosed in reports we file under the Exchange Act.
There has been no significant change in our internal control over financial reporting that occurred during the threemonths ended September 30, 2008 that has materially affected, or is reasonably likely to materially affect, ourinternal control over financial reporting.
Part II. OTHER INFORMATION
Item 1. Legal Proceedings
GENERAL
We are parties to various legal proceedings resulting from ordinary business activities relating to our current and/orformer operations. Certain of these actions are or purport to be class actions seeking damages in very large amounts.These actions assert violations of laws and/or unfair treatment of consumers. Due to the uncertainties in litigationand other factors, we cannot be certain that we will ultimately prevail in each instance. We believe that our defensesto these actions have merit and any adverse decision should not materially affect our consolidated financialcondition. However, losses may be material to our results of operations for any particular future period dependingon our income level for that period.
CONSUMER LITIGATION
During the past several years, the press has widely reported certain industry related concerns, including risingdelinquencies, the tightening of credit and more recently, increasing litigation. Some of the litigation institutedagainst lenders is being brought in the form of purported class actions by individuals or by state or federal regulatorsor state attorneys general. Like other companies in this industry, we are involved in litigation regarding ourpractices. The cases generally allege inadequate disclosure or misrepresentation during the loan origination process.In some suits, other parties are also named as defendants. Unspecified compensatory and punitive damages aresought. The judicial climate in many states is such that the outcome of these cases is unpredictable. Although webelieve we have substantive legal defenses to these claims and are prepared to defend each case vigorously, anumber of such cases have been settled or otherwise resolved for amounts that in the aggregate are not material toour operations. Insurance carriers have been notified as appropriate.
LOAN DISCRIMINATION LITIGATION
Since July of 2007, HSBC Finance Corporation and/or one or more of its subsidiaries has been named as a defendantin five class actions filed in the federal courts in the Northern District of Illinois, the Central District of Californiaand the District of Massachusetts: Zamudio v. HSBC North America Holdings and HSBC Finance Corporation d/b/a Beneficial, (N.D. Ill. 07CV5413), National Association for the Advancement of Colored People (“NAACP”) v.Ameriquest Mortgage Company, et al. including HSBC Finance Corporation (C.D. Ca., No. SACV07-0794AG),Toruno v. HSBC Finance Corporation and Decision One Mortgage Company, LLC (C.D. Ca.,No. CV07-05998JSL), Suyapa Allen v. Decision One Mortgage Company, LLC, HSBC Finance Corporation,et al. (D. Mass., C.A. 07-11669) and Doiron, et al. v. HSBC Mortgage Services Inc., et al., (E.D. Ca., 2:08-CV-00605-FCD). Each suit alleges that the named entities racially discriminated against their customers by using loan
87

pricing policies and procedures that have resulted in a disparate impact against minority customers. Violations ofvarious federal statutes, including the Fair Housing Act and the Equal Credit Opportunity Act, are claimed. TheZamudio case was voluntarily dismissed by the plaintiff on July 7, 2008 and may not be reinitiated. At this time, weare unable to quantify the potential impact from the remaining actions, if any.
CITY OF CLEVELAND LITIGATION
On January 10, 2008, a suit captioned, City of Cleveland v. Deutsche Bank Trust Company, et al. (No. 1:08-CV-00139), was filed in the Cuyahoga County Common Pleas Court against twenty-one financial services entities.HSBC Finance Corporation is a defendant. The City of Cleveland (“City”) seeks damages it allegedly incurredrelating to property foreclosures. The alleged damages are claimed to be the result of defendants’ creation of apublic nuisance in the City through their respective involvement as lenders and/or securitizers of sub-primemortgages on properties located in Cleveland. On January 16, 2008, the case was removed to the United StatesDistrict Court for the Northern District of Ohio. On January 17, 2008, the City filed a motion seeking a Court orderremanding the case back to state Common Pleas Court, which was denied in August 2008. Thereafter, on August 22,2008, the City filed a new complaint, City of Cleveland vs JP Morgan Chase Bank, NA et al, in the Court ofCommon Pleas, Cuyahoga County Ohio (No. CV 08 668608), which makes virtually identical allegations as it madein the Federal Court complaint. It further alleges violations of the Ohio Corrupt Practices Act and named additionaldefendants. The two courts have now approved the parties’ agreements regarding the defendants in these twoactions. HSBC Finance Corporation has been dismissed with prejudice from the Federal Court action. Subsidiariesof HSBC Finance Corporation, Household Realty Corporation and HSBC Mortgage Services Inc. are defendants inthe State Court action.
CARD SERVICES LITIGATION
Since June 2005, HSBC Finance Corporation, HSBC North America, and HSBC, as well as other banks and VisaInc. and Master Card Incorporated, were named as defendants in four class actions filed in Connecticut and theEastern District of New York; Photos Etc. Corp. et al. v. Visa U.S.A., Inc., et al. (D. Conn. No. 3:05-CV-01007(WWE)): National Association of Convenience Stores, et al. v. Visa U.S.A., Inc., et al. (E.D.N.Y. No. 05-CV 4520(JG)); Jethro Holdings, Inc., et al. v. Visa U.S.A., Inc. et al. (E.D.N.Y. No. 05-CV-4521 (JG)); and AmericanBooksellers Ass’n v. Visa U.S.A., Inc. et al. (E.D.N.Y. No. 05-CV-5391 (JG)). Numerous other complaintscontaining similar allegations (in which no HSBC entity is named) were filed across the country against VisaInc., MasterCard Incorporated and other banks. These actions principally allege that the imposition of a no-surcharge rule by the associations and/or the establishment of the interchange fee charged for credit cardtransactions causes the merchant discount fee paid by retailers to be set at supracompetitive levels in violationof the Federal antitrust laws. In response to motions of the plaintiffs on October 19, 2005, the Judicial Panel onMultidistrict Litigation (the “MDL Panel”) issued an order consolidating these suits and transferred all of the casesto the Eastern District of New York. The consolidated case is: In re Payment Card Interchange Fee and MerchantDiscount Antitrust Litigation, MDL 1720, E.D.N.Y. A consolidated, amended complaint was filed by the plaintiffson April 24, 2006. The parties are engaged in discovery and motion practice.
In October 2007, Visa Inc. announced that it had completed restructuring transactions in preparation for its initialpublic offering in March 2008. As a result of the indemnification agreement established as part of the restructuring,entities with a membership interest prior to the initial public offering have obligations to share in certain lossesunder various agreements with Visa Inc. in connection with this and other litigation.
In October 2008, Visa Inc. announced that it had agreed to settle the federal antitrust lawsuit captioned DiscoverFinancial Services, Inc. v. Visa USA Inc., MasterCard Inc. et al. for $1,888 million. The settlement is subject toapproval by Visa Inc.’s former U.S. member financial institutions. If approved, the settlement will be paid primarilyfrom the escrow account established and funded with a portion of the net proceeds of Visa Inc.’s initial publicoffering in March 2008. Our portion of the settlement amount is not material.
88

SECURITIES LITIGATION
In August 2002, we restated previously reported consolidated financial statements. The restatement related to certainMasterCard and Visa co-branding and affinity credit card relationships and a third party marketing agreement, whichwere entered into between 1992 and 1999. All were part of our Card Services segment. In consultation with our priorauditors, Arthur Andersen LLP, we treated payments made in connection with these agreements as prepaid assets andamortized them in accordance with the underlying economics of the agreements. Our current auditor, KPMG LLP,advised us that, in its view, these payments should have either been charged against earnings at the time they weremade or amortized over a shorter period of time. The restatement resulted in a $155.8 million, after-tax, retroactivereduction to retained earnings at December 31, 1998. As a result of the restatement, and other corporate events,including, e.g., the 2002 settlement with 50 states and the District of Columbia relating to real estate lending practices,HSBC Finance Corporation, and its directors, certain officers and former auditors, have been involved in various legalproceedings, some of which purport to be class actions. A number of these actions allege violations of Federalsecurities laws, were filed between August and October 2002, and seek to recover damages in respect of allegedly falseand misleading statements about our common stock. These legal actions have been consolidated into a singlepurported class action, Jaffe v. Household International, Inc., et al., No. 02 C 5893 (N.D. Ill., filed August 19, 2002),and a consolidated and amended complaint was filed on March 7, 2003. On December 3, 2004, the court signed theparties’ stipulation to certify a class with respect to the claims brought under § 10 and § 20 of the Securities ExchangeAct of 1934. The parties stipulated that plaintiffs will not seek to certify a class with respect to the claims broughtunder § 11 and § 15 of the Securities Act of 1933 in this action or otherwise.
The amended complaint purports to assert claims under the Federal securities laws, on behalf of all persons whopurchased or otherwise acquired our securities between October 23, 1997 and October 11, 2002, arising out ofalleged false and misleading statements in connection with our collection, sales and lending practices, the 2002 statesettlement agreement referred to above, the restatement and the HSBC merger. The amended complaint, which alsonames as defendants Arthur Andersen LLP, Goldman, Sachs & Co., and Merrill Lynch, Pierce, Fenner & Smith,Inc., fails to specify the amount of damages sought. In May 2003, we, and other defendants, filed a motion todismiss the complaint. On March 19, 2004, the Court granted in part, and denied in part the defendants’ motion todismiss the complaint. The Court dismissed all claims against Merrill Lynch, Pierce, Fenner & Smith, Inc. andGoldman Sachs & Co. The Court also dismissed certain claims alleging strict liability for alleged misrepresentationof material facts based on statute of limitations grounds. The claims that remain against some or all of thedefendants essentially allege the defendants knowingly made a false statement of a material fact in conjunction withthe purchase or sale of securities, that the plaintiffs justifiably relied on such statement, the false statement(s) causedthe plaintiffs’ damages, and that some or all of the defendants should be liable for those alleged statements. OnFebruary 28, 2006, the Court also dismissed all alleged § 10 claims that arose prior to July 30, 1999, shortening theclass period by 22 months. Discovery has concluded. Separately, one of the defendants, Arthur Andersen LLP,entered into a settlement of the claims against Arthur Andersen. This settlement received Court approval in April,2006. Remaining defendants’ summary judgment motion is pending. The Court has set a trial date of March 30,2009. At this time we are unable to quantify the potential impact from this action, if any.
With respect to this securities litigation, we believe that we have not, and our officers and directors have not,committed any wrongdoing and there will be no finding of improper activities that may result in a material liabilityto us or any of our officers or directors.
Item 6. Exhibits
Exhibits included in this Report:
12 Statement of Computation of Ratio of Earnings to Fixed Charges and to Combined Fixed Charges andPreferred Stock Dividends
31 Certification of Chief Executive Officer and Chief Financial Officer pursuant to Section 302 of theSarbanes-Oxley Act of 2002
32 Certification of Chief Executive Officer and Chief Financial Officer pursuant to Section 906 of theSarbanes-Oxley Act of 2002
99.1 Debt and Preferred Stock Securities Ratings
89
Signature
Pursuant to the requirements of the Securities Exchange Act of 1934, the registrant has duly caused this report to besigned on its behalf by the undersigned thereunto duly authorized.
Date: November 10, 2008
HSBC FINANCE CORPORATION
(Registrant)
/s/ Iain J. Mackay
Iain J. MackaySenior Executive Vice President andChief Financial Officer
90

Exhibit Index
12 Statement of Computation of Ratio of Earnings to Fixed Charges and to Combined Fixed Charges andPreferred Stock Dividends
31 Certification of Chief Executive Officer and Chief Financial Officer pursuant to Section 302 of the Sarbanes-Oxley Act of 2002
32 Certification of Chief Executive Officer and Chief Financial Officer pursuant to Section 906 of the Sarbanes-Oxley Act of 2002
99.1 Debt and Preferred Stock Securities Ratings
91
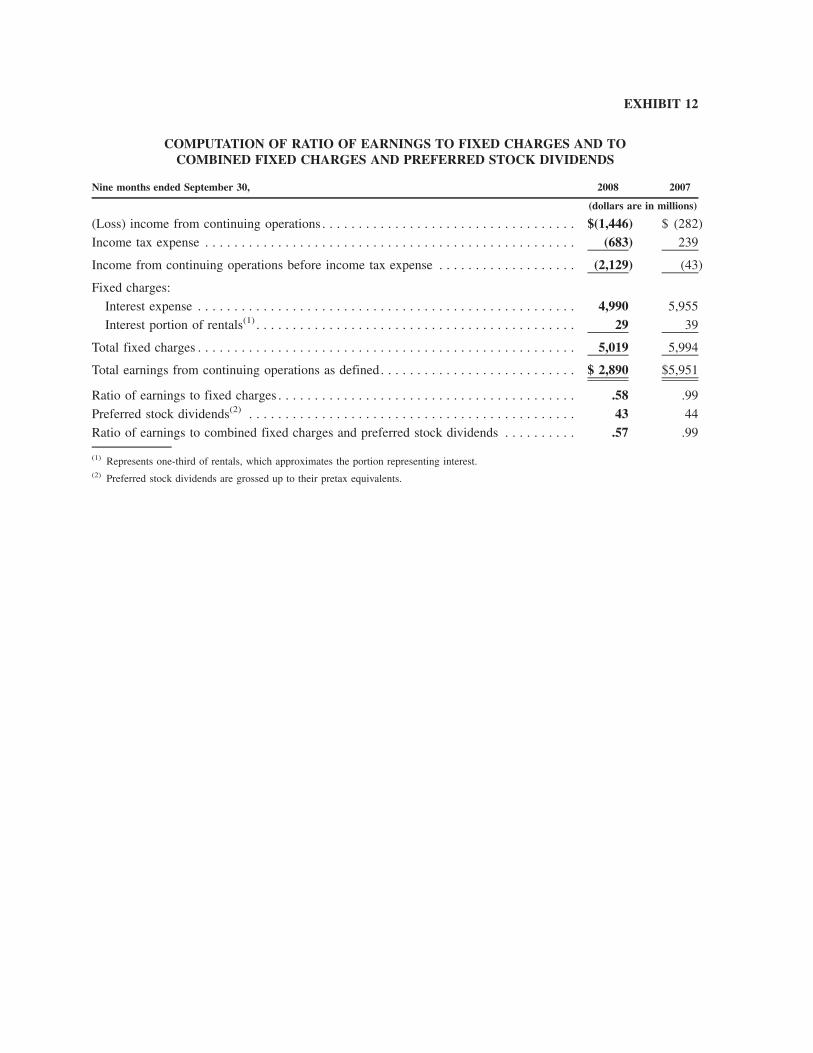
EXHIBIT 12
COMPUTATION OF RATIO OF EARNINGS TO FIXED CHARGES AND TOCOMBINED FIXED CHARGES AND PREFERRED STOCK DIVIDENDS
Nine months ended September 30, 2008 2007
(dollars are in millions)
(Loss) income from continuing operations . . . . . . . . . . . . . . . . . . . . . . . . . . . . . . . . . . . $(1,446) $ (282)
Income tax expense . . . . . . . . . . . . . . . . . . . . . . . . . . . . . . . . . . . . . . . . . . . . . . . . . . . (683) 239
Income from continuing operations before income tax expense . . . . . . . . . . . . . . . . . . . (2,129) (43)
Fixed charges:
Interest expense . . . . . . . . . . . . . . . . . . . . . . . . . . . . . . . . . . . . . . . . . . . . . . . . . . . . 4,990 5,955
Interest portion of rentals(1) . . . . . . . . . . . . . . . . . . . . . . . . . . . . . . . . . . . . . . . . . . . . 29 39
Total fixed charges . . . . . . . . . . . . . . . . . . . . . . . . . . . . . . . . . . . . . . . . . . . . . . . . . . . . 5,019 5,994
Total earnings from continuing operations as defined. . . . . . . . . . . . . . . . . . . . . . . . . . . $ 2,890 $5,951
Ratio of earnings to fixed charges . . . . . . . . . . . . . . . . . . . . . . . . . . . . . . . . . . . . . . . . . .58 .99
Preferred stock dividends(2) . . . . . . . . . . . . . . . . . . . . . . . . . . . . . . . . . . . . . . . . . . . . . 43 44
Ratio of earnings to combined fixed charges and preferred stock dividends . . . . . . . . . . .57 .99
(1) Represents one-third of rentals, which approximates the portion representing interest.(2) Preferred stock dividends are grossed up to their pretax equivalents.

EXHIBIT 31
CERTIFICATION OF CHIEF EXECUTIVE OFFICER AND CHIEF FINANCIAL OFFICERPURSUANT TO SECTION 302 OF THE SARBANES-OXLEY ACT OF 2002
Certification of Chief Executive Officer
I, Niall S.K. Booker, Chief Executive Officer of HSBC Finance Corporation, certify that:
1. I have reviewed this report on Form 10-Q of HSBC Finance Corporation;
2. Based on my knowledge, this report does not contain any untrue statement of a material fact or omit to statea material fact necessary to make the statements made, in light of the circumstances under which such statementswere made, not misleading with respect to the period covered by this annual report;
3. Based on my knowledge, the financial statements, and other financial information included in this report,fairly present in all material respects the financial condition, results of operations and cash flows of the registrant asof, and for, the periods presented in this report;
4. The registrant’s other certifying officer and I are responsible for establishing and maintaining disclosurecontrols and procedures (as defined in Exchange Act Rules 13a-15(e) and 15d-15(e)) and internal control overfinancial reporting (as defined in Exchange Act Rules 13a – 15(f) and 15d – 15(f)) for the registrant and we have:
a) designed such disclosure controls and procedures, or caused such disclosure controls and proceduresto be designed under our supervision, to ensure that material information relating to the registrant, including itsconsolidated subsidiaries, is made known to us by others within those entities, particularly during the period inwhich this report is being prepared;
b) designed such internal control over financial reporting, or caused such internal control over financialreporting to be designed under our supervision, to provide reasonable assurance regarding the reliability offinancial reporting and the preparation of financial statements for external purposes in accordance withgenerally accepted accounting principles;
c) evaluated the effectiveness of the registrant’s disclosure controls and procedures and presented in thisreport our conclusions about the effectiveness of the disclosure controls and procedures, as of the end of theperiod covered by this report based on such evaluation; and
d) disclosed in this report any change in the registrant’s internal control over financial reporting thatoccurred during the registrant’s most recent fiscal quarter that has materially affected, or is reasonably likely tomaterially affect, the registrant’s internal control over financial reporting; and
5. The registrant’s other certifying officer and I have disclosed, based on our most recent evaluation, to theregistrant’s auditors and the audit committee of the registrant’s board of directors (or persons performing theequivalent functions):
a) all significant deficiencies and material weaknesses in the design or operation of internal controls overfinancial reporting which are reasonably likely to adversely affect the registrant’s ability to record, process,summarize and report financial information; and
b) any fraud, whether or not material, that involves management or other employees who have asignificant role in the registrant’s internal control over financial reporting.
Date: November 10, 2008
/s/ NIALL S.K. BOOKER
Niall S.K. BookerChief Executive Officer

Certification of Chief Financial Officer
I, Iain J. Mackay, Senior Executive Vice President and Chief Financial Officer of HSBC Finance Corporation,certify that:
1. I have reviewed this report on Form 10-Q of HSBC Finance Corporation;
2. Based on my knowledge, this report does not contain any untrue statement of a material fact or omit to statea material fact necessary to make the statements made, in light of the circumstances under which such statementswere made, not misleading with respect to the period covered by this annual report;
3. Based on my knowledge, the financial statements, and other financial information included in this report,fairly present in all material respects the financial condition, results of operations and cash flows of the registrant asof, and for, the periods presented in this report;
4. The registrant’s other certifying officer and I are responsible for establishing and maintaining disclosurecontrols and procedures (as defined in Exchange Act Rules 13a-15(e) and 15d-15(e)) and internal control overfinancial reporting (as defined in Exchange Act Rules 13a – 15(f) and 15d – 15(f)) for the registrant and we have:
a) designed such disclosure controls and procedures, or caused such disclosure controls and proceduresto be designed under our supervision, to ensure that material information relating to the registrant, including itsconsolidated subsidiaries, is made known to us by others within those entities, particularly during the period inwhich this report is being prepared;
b) designed such internal control over financial reporting, or caused such internal control over financialreporting to be designed under our supervision, to provide reasonable assurance regarding the reliability offinancial reporting and the preparation of financial statements for external purposes in accordance withgenerally accepted accounting principles;
c) evaluated the effectiveness of the registrant’s disclosure controls and procedures and presented in thisreport our conclusions about the effectiveness of the disclosure controls and procedures, as of the end of theperiod covered by this report based on such evaluation; and
d) disclosed in this report any change in the registrant’s internal control over financial reporting thatoccurred during the registrant’s most recent fiscal quarter that has materially affected, or is reasonably likely tomaterially affect, the registrant’s internal control over financial reporting; and
5. The registrant’s other certifying officer and I have disclosed, based on our most recent evaluation, to theregistrant’s auditors and the audit committee of the registrant’s board of directors (or persons performing theequivalent functions):
a) all significant deficiencies and material weaknesses in the design or operation of internal controls overfinancial reporting which are reasonably likely to adversely affect the registrant’s ability to record, process,summarize and report financial information; and
b) any fraud, whether or not material, that involves management or other employees who have asignificant role in the registrant’s internal control over financial reporting.
Date: November 10, 2008
/s/ IAIN J. MACKAY
Iain J. MackaySenior Executive Vice Presidentand Chief Financial Officer

EXHIBIT 32
CERTIFICATION OF CHIEF EXECUTIVE OFFICER AND CHIEF FINANCIAL OFFICERPURSUANT TO SECTION 906 OF THE SARBANES-OXLEY ACT OF 2002
Certification Pursuant to 18 U.S.C. Section 1350, as Adopted Pursuant toSection 906 of the Sarbanes-Oxley Act of 2002
The certification set forth below is being submitted in connection with the HSBC Finance Corporation (the“Company”) Quarterly Report on Form 10-Q for the period ending September 30, 2008 as filed with the Securitiesand Exchange Commission on the date hereof (the “Report”) for the purpose of complying with Rule 13a-14(b) orRule 15d-14(b) of the Securities Exchange Act of 1934 (the “Exchange Act”) and Section 1350 of Chapter 63 ofTitle 18 of the United States Code.
I, Niall S.K. Booker, Chief Executive Officer of the Company, certify that:
1. the Report fully complies with the requirements of Section 13(a) or 15(d) of the Exchange Act; and
2. the information contained in the Report fairly presents, in all material respects, the financial conditionand results of operations of HSBC Finance Corporation.
Date: November 10, 2008
/s/ NIALL S.K. BOOKER
Niall S.K. BookerChief Executive Officer

Certification Pursuant to 18 U.S.C. Section 1350,As Adopted Pursuant to Section 906 of the Sarbanes-Oxley Act of 2002
The certification set forth below is being submitted in connection with the HSBC Finance Corporation (the“Company”) Quarterly Report on Form 10-Q for the period ending September 30, 2008 as filed with the Securitiesand Exchange Commission on the date hereof (the “Report”) for the purpose of complying with Rule 13a-14(b) orRule 15d-14(b) of the Securities Exchange Act of 1934 (the “Exchange Act”) and Section 1350 of Chapter 63 ofTitle 18 of the United States Code.
I, Iain J. Mackay, Senior Executive Vice President and Chief Financial Officer of the Company, certify that:
1. the Report fully complies with the requirements of Section 13(a) or 15(d) of the Exchange Act; and
2. the information contained in the Report fairly presents, in all material respects, the financial conditionand results of operations of HSBC Finance Corporation.
Date: November 10, 2008
/s/ IAIN J. MACKAY
Iain J. MackaySenior Executive Vice Presidentand Chief Financial Officer
This certification accompanies each Report pursuant to Section 906 of the Sarbanes-Oxley Act of 2002 and shallnot, except to the extent required by the Sarbanes-Oxley Act of 2002, be deemed filed by HSBC FinanceCorporation for purposes of Section 18 of the Securities Exchange Act of 1934, as amended.
Signed originals of these written statements required by Section 906 of the Sarbanes-Oxley Act of 2002 have beenprovided to HSBC Finance Corporation and will be retained by HSBC Finance Corporation and furnished to theSecurities and Exchange Commission or its staff upon request.

EXHIBIT 99.1
DEBT AND PREFERRED STOCK SECURITIES RATINGSStandard &
Poor’sCorporation
Moody’sInvestorsService Fitch, Inc. DBRS, Inc.
As of September 30, 2008HSBC Finance Corporation
Senior debt . . . . . . . . . . . . . . . . . . . . . . . . . . . . . . . . . . AA- Aa3 AA- AA (low)
Senior subordinated debt . . . . . . . . . . . . . . . . . . . . . . . . A+ A2 A+ *
Commercial paper . . . . . . . . . . . . . . . . . . . . . . . . . . . . A-1+ P-1 F-1+ R-1 (middle)
Series B preferred stock . . . . . . . . . . . . . . . . . . . . . . . . A-2 A2 A+ *
HSBC Financial Corporation Limited
Senior notes and term loans . . . . . . . . . . . . . . . . . . . . . * * * AA (low)
Commercial paper . . . . . . . . . . . . . . . . . . . . . . . . . . . . * * * R-1 (middle)
* Not rated by this agency.