HSBC BANK MALAYSIA BERHAD (Company No.127776 · PDF fileHSBC BANK MALAYSIA BERHAD (Company No...
21
CHIEF EXECUTIVE OFFICER'S ATTESTATION ……………………………………….. MUKHTAR MALIK HUSSAIN CHIEF EXECUTIVE OFFICER 23 July 2014 at 30 June 2014 HSBC BANK MALAYSIA BERHAD (Company No.127776-V) (Incorporated in Malaysia) Risk Weighted Capital Adequacy Framework (Basel II) Pillar 3 Interim Disclosures I, Mukhtar Malik Hussain, being the Chief Executive Officer of HSBC Bank Malaysia Berhad, do hereby state that, in my opinion, the Pillar 3 Disclosures set out on pages 2-21 have been prepared according to the Risk Weighted Capital Adequacy Framework (Basel II), and are accurate and complete. 1
-
Upload
nguyentruc -
Category
Documents
-
view
223 -
download
4
Transcript of HSBC BANK MALAYSIA BERHAD (Company No.127776 · PDF fileHSBC BANK MALAYSIA BERHAD (Company No...

CHIEF EXECUTIVE OFFICER'S ATTESTATION
………………………………………..
MUKHTAR MALIK HUSSAIN
CHIEF EXECUTIVE OFFICER
23 July 2014
at 30 June 2014
HSBC BANK MALAYSIA BERHAD
(Company No.127776-V)
(Incorporated in Malaysia)
Risk Weighted Capital Adequacy Framework (Basel II) Pillar 3 Interim Disclosures
I, Mukhtar Malik Hussain, being the Chief Executive Officer of HSBC Bank Malaysia Berhad, do hereby state that, in my opinion,
the Pillar 3 Disclosures set out on pages 2-21 have been prepared according to the Risk Weighted Capital Adequacy Framework
(Basel II), and are accurate and complete.
1

HSBC Bank Malaysia Berhad
127776-V
Risk Weighted Capital Adequacy Framework (Basel II) Pillar 3 Interim Disclosures
The Risk Weighted Capital Adequacy Framework (Basel II) Pillar 3 Interim Disclosures at 30 June 2014 do not include all of the
information required for full (Basel II) Pillar 3 Disclosures, and should be read in conjunction with the audited financial
statements of the Group for the financial year ended 31 December 2013 and the Risk Weighted Capital Adequacy Framework
(Basel II) Pillar 3 Disclosures at 31 December 2013.
The tables attached in the Risk Weighted Capital Adequacy Framework (Basel II) Pillar 3 Interim Disclosures provide an
understanding of the quantitative changes relating to Pillar 3 Disclosures of HSBC Bank Malaysia Berhad and its subsidiaries (the
Group) since the financial year ended 31 December 2013. There are no material changes relating to qualitative disclosures during
the interim reporting period.
Stress Testing
Stress testing and scenario analysis form an integral part of Internal Capital Adequacy Assessment Process (ICAAP) to
demonstrate that the Group can maintain risk capital sufficient enough to sustain operations during an economic downturn.
Essentially, stress testing is to make risks more transparent by estimating potential losses on exposures under abnormal market or
economic conditions. It will also assess specifically the extent by which risk-weighted assets and capital requirements will
increase, and how profit and loss as well as liquidity levels will change. The results of the analyses will facilitate informed
financial and capital management whilst supporting business lines to manage their business through various measures such as
establishing triggers and devising mitigation actions which can be readily implemented should the adverse scenarios materialise.
In line with BNM’s Guideline on Stress Testing and the Group's Policy Paper for Stress Testing, a Stress Test Steering Committee
('STSC') is established. STSC conducts stress testing on a half-yearly basis based on the guidelines and methodology endorsed by
the Board. Stress tests are performed for different risk types including credit, liquidity, market and operational risk. The analysis
makes use of the actual general ledger, profit and loss and risk positions (the base case) to estimate the impact on profits and risk-
weighted assets. It also incorporates the impact of management actions to determine whether or not the Group is able to withstand
such an event.
Credit Risk Mitigation
Financial assets and financial liabilities are offset and the net amount reported in the balance sheet when there is a legally
enforceable right to offset the recognised amounts and there is an intention to settle on a net basis, or realise the asset and settle
the liability simultaneously.
The Group’s policy when granting credit facilities is on the basis of the customer’s capacity to repay, rather than placing primary
reliance on credit risk mitigants. Depending on the customer’s standing and the type of product, facilities may be provided
unsecured. Mitigation of credit risk is nevertheless a key aspect of effective risk management in the Group and takes many forms.
The Group’s general policy is to promote the use of credit risk mitigation, justified by commercial prudence and good practice as
well as capital efficiency. Specific, detailed policies cover acceptability, structuring and terms of various types of business with
regard to the availability of credit risk mitigants, for example in the form of collateral security, and these policies, together with
the determination of suitable valuation parameters, are subject to regular review to ensure that they are supported by empirical
evidence and continue to fulfil their intended purpose.
The most common method of mitigating credit risk is to take collateral. The principal collateral types employed by the Group are
as follows:
• under the residential and real estate business; mortgages over residential and financed properties;
• under certain Islamic specialised financing and leasing transactions (such as machinery financing) where physical assets
form the principal source of facility repayment, physical collateral is typically taken;
• in the commercial and industrial sectors, charges over business assets such as premises, stock and debtors;
• facilities provided to small and medium enterprises are commonly granted against guarantees by their owners/directors;
• guarantees from third parties can arise where facilities are extended without the benefit of any alternative form of security,
• under the institutional sector, certain trading facilities are supported by charges over financial instruments such as cash,
debt securities and equities;
• financial collateral in the form cash and of marketable securities are used in much of the over-the-counter ('OTC')
derivatives activities and in the Group’s securities financing business (securities lending and borrowing or repos and
reverse repos); and
• netting is used where appropriate, and supported by market standard documentation.
2

HSBC Bank Malaysia Berhad
127776-V
Risk Weighted Capital Adequacy Framework (Basel II) Pillar 3 Interim Disclosures (Cont’d)
Credit Risk Mitigation (Cont'd)
1) Credit Risk
Table 1: Geographical distribution of loans/financing breakdown by type
Group (RM'000) Northern Southern Central Eastern Total
Overdrafts 188,150 141,476 597,829 264,572 1,192,027
Term loans/financing
Housing loans/financing 3,287,175 2,748,909 9,930,223 1,064,808 17,031,115
Syndicated term loan/financing - - - - -
Factoring receivables 21,104 15,285 88,027 38,517 162,933
Hire purchase receivables 49,861 37,731 110,360 42,617 240,569
Lease receivables - - 2,948 - 2,948
Other term loans/financing 1,842,927 1,885,583 6,814,473 1,757,776 12,300,759
Bills receivable 173,222 67,763 1,630,752 52,852 1,924,589
Trust receipts 155,765 507,387 715,445 122,947 1,501,544
Claims on customers under acceptance credits 766,349 486,224 1,233,062 292,429 2,778,064
Staff loans/financing 38,901 23,753 232,629 22,594 317,877
Credit/charge cards 527,240 367,998 1,497,563 279,677 2,672,478
Revolving credit 244,853 295,649 3,360,763 124,622 4,025,887
Other loans/financing 2,988 1,964 4,334 407 9,693
7,298,535 6,579,722 26,218,408 4,063,818 44,160,483
Group (RM'000) Northern Southern Central Eastern Total
Overdrafts 192,236 320,851 546,603 309,770 1,369,460
Term loans/financing
Housing loans/financing 3,324,901 2,612,973 9,061,045 1,043,791 16,042,710
Syndicated term loan/financing - - 45,077 - 45,077
Factoring receivables 20,392 14,830 101,474 23,510 160,206
Hire purchase receivables 51,243 42,272 108,328 50,900 252,743
Lease receivables 27 - 2,415 - 2,442
Other term loans/financing 1,872,690 1,645,038 7,386,362 2,110,816 13,014,906
Bills receivable 105,505 100,793 3,168,450 124,810 3,499,558
Trust receipts 175,463 486,829 883,138 159,111 1,704,541
Claims on customers under acceptance credits 710,766 446,494 1,043,532 439,779 2,640,571
Staff loans/financing 39,638 23,596 223,981 24,003 311,218
Credit/charge cards 569,580 395,419 1,583,938 300,101 2,849,038
Revolving credit 226,775 285,147 2,871,567 75,580 3,459,069
Other loans/financing 2,531 1,961 4,053 248 8,793
7,291,747 6,376,203 27,029,963 4,662,419 45,360,332
30 June 2014
31 December 2013
Settlement risk arises in any situation where a payment in cash or securities is made in the expectation of a corresponding receipt of
cash or securities. Daily settlement limits are established for counterparties to cover the aggregate of all settlement risk arising from
Treasury transactions on a single day. Settlement risk on many transactions, particularly those involving securities, is substantially
mitigated by settling through assured payment systems or on a delivery-versus-payment basis.
Policies and procedures govern the protection of the Group’s position from the outset of a customer relationship, for instance in
requiring standard terms and conditions or specifically agreed documentation permitting the offset of credit balances against debt
obligations and through controls over the integrity, current valuation and, if necessary, realisation of collateral security.
The valuation of credit risk mitigants seeks to monitor and ensure that they will continue to provide the secured-repayment source
anticipated at the time they were taken. The Group’s policy prescribes valuation at intervals of up to two years, or more frequently
as the need may arise. For property taken as collateral for new or additional facilities, a valuation report is required from a panel
valuer. For credit exposures with a credit risk rating (CRR) of 6.1 or worse, a full valuation is to be obtained annually. For auction
purposes, full valuations are compulsory. This is to avoid the risk of the settlement sum being challenged by the borrower / charger
on the grounds that the correct valuation was not applied.
The Group’s panel of approved valuation companies is subject to an annual review. This takes into consideration the company’s
financial standing, accreditations, experience, professional liability insurance, major clients and size of its branch network.
Refer to Note 32 to the unaudited condensed interim financial statements at 30 June 2014 for the total risk weighted capital ratio,
Common Equity Tier 1 (CET 1) and Tier 1 capital ratio, and risk weighted assets and capital requirements for credit risk, market
risk and operational risk.
3

HSBC Bank Malaysia Berhad
127776-V
Risk Weighted Capital Adequacy Framework (Basel II) Pillar 3 Interim Disclosures (Cont’d)
1) Credit Risk (Cont'd)
Table 2: Geographical distribution of impaired loans/financing breakdown by type
Group (RM'000) Northern Southern Central Eastern Total
Overdrafts 7,807 2,827 22,328 8,784 41,746
Term loans/financing
Housing loans/financing 63,728 56,652 155,657 12,580 288,617
Factoring receivables 983 28 2,352 - 3,363
Hire purchase receivables 9,190 533 270 619 10,612
Other term loans/financing 46,013 29,622 178,013 98,037 351,685
Bills receivable 299 6,990 - - 7,289
Trust receipts 135 - 12,712 2,647 15,494
Claims on customers under acceptance credits 5,908 12,761 18,267 2,802 39,738
Staff loans/financing 44 93 3,223 198 3,558
Credit/charge cards 12,887 7,621 28,681 3,867 53,056
Revolving credit - - 4,235 - 4,235
Other loans/financing 2,980 1,711 4,325 405 9,421
149,974 118,838 430,063 129,939 828,814
Group (RM'000) Northern Southern Central Eastern Total
Overdrafts 7,861 7,002 10,195 1,786 26,844
Term loans/financing
Housing loans/financing 74,104 73,781 164,790 11,327 324,002
Factoring receivables - 27 10,356 - 10,383
Hire purchase receivables 4,171 2,953 312 417 7,853
Other term loans/financing 54,447 37,067 146,666 32,860 271,040
Bills receivable 490 8,028 14,144 - 22,662
Trust receipts 157 4,040 4,979 2,548 11,724
Claims on customers under acceptance credits 10,785 22,131 4,360 6,443 43,719
Staff loans/financing 181 - 3,324 211 3,716
Credit/charge cards 13,440 9,038 31,225 3,890 57,593
Revolving credit - - 4,101 - 4,101
Other loans/financing 2,528 1,959 4,033 208 8,728
168,164 166,026 398,485 59,690 792,365
The Northern region consists of the states of Perlis, Kedah, Penang, Perak, Pahang, Kelantan and Terengganu.
The Southern region consists of the states of Johor, Malacca and Negeri Sembilan.
The Central region consists of the state of Selangor and the Federal Territory of Kuala Lumpur .
The Eastern region consists of the states of Sabah, Sarawak and the Federal Territory of Labuan.
Concentration by location for loans, advances and financing is based on the location of the borrower.
31 December 2013
30 June 2014
4
HSBC Bank Malaysia Berhad
127776-V
Risk Weighted Capital Adequacy Framework (Basel II) Pillar 3 Interim Disclosures (Cont’d)
1) Credit Risk (Cont'd)
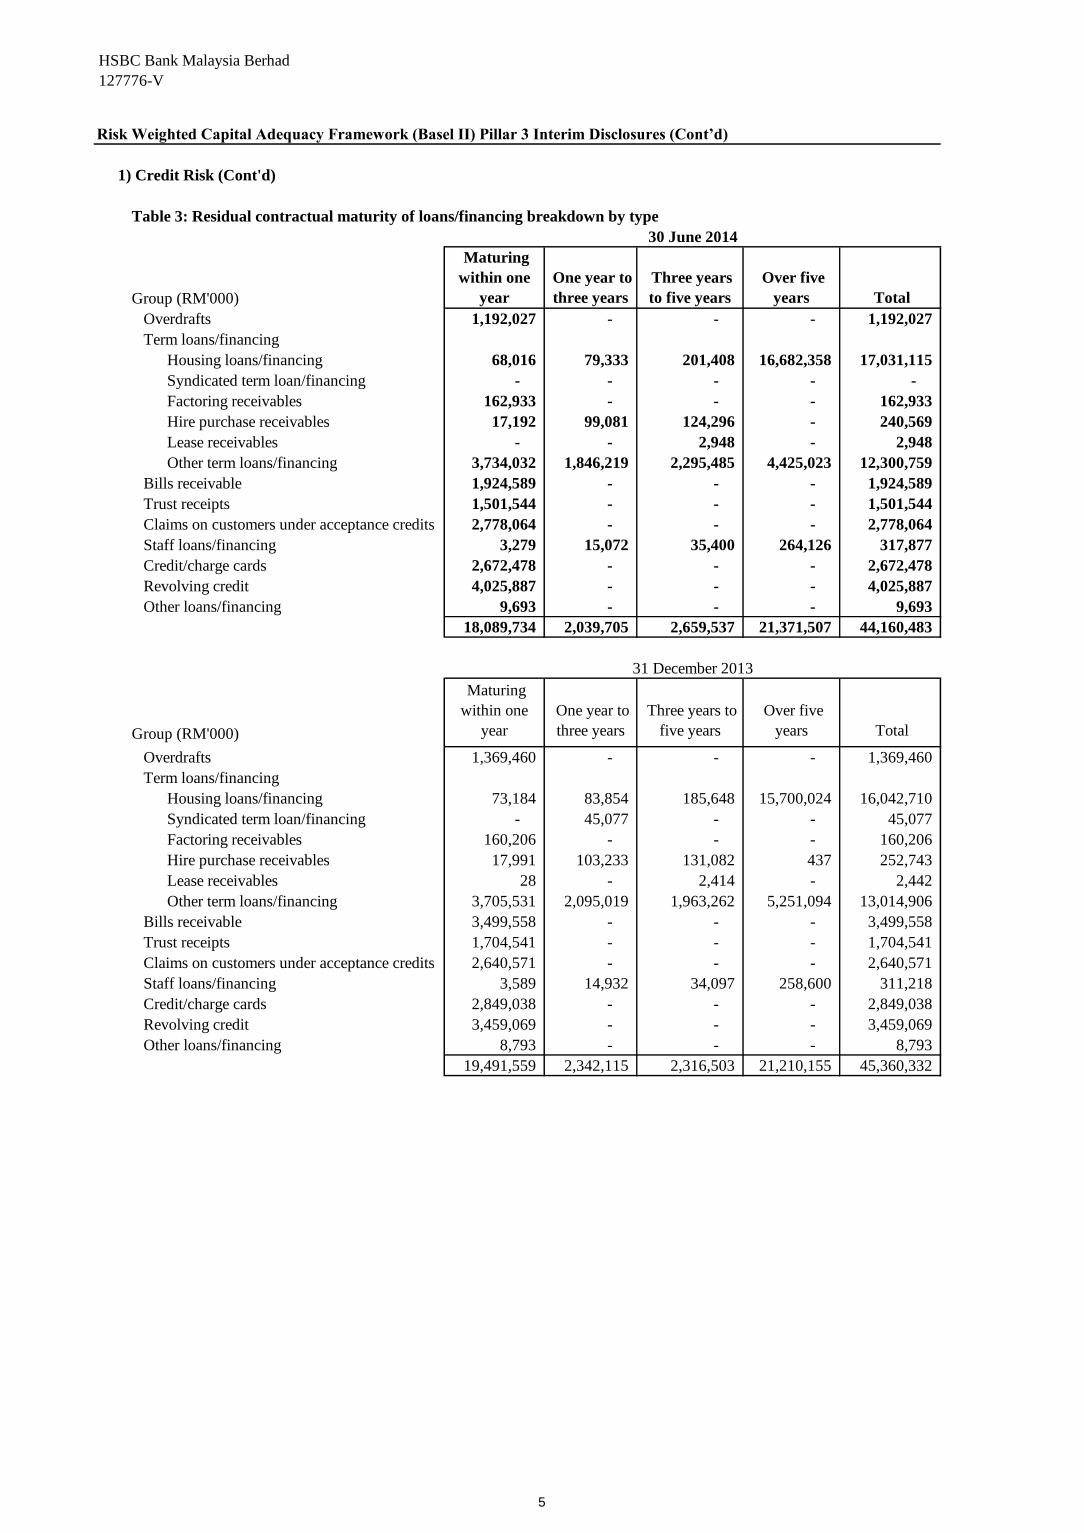
Table 3: Residual contractual maturity of loans/financing breakdown by type
Group (RM'000)
Maturing
within one
year
One year to
three years
Three years
to five years
Over five
years Total
Overdrafts 1,192,027 - - - 1,192,027
Term loans/financing
Housing loans/financing 68,016 79,333 201,408 16,682,358 17,031,115
Syndicated term loan/financing - - - - -
Factoring receivables 162,933 - - - 162,933
Hire purchase receivables 17,192 99,081 124,296 - 240,569
Lease receivables - - 2,948 - 2,948
Other term loans/financing 3,734,032 1,846,219 2,295,485 4,425,023 12,300,759
Bills receivable 1,924,589 - - - 1,924,589
Trust receipts 1,501,544 - - - 1,501,544
Claims on customers under acceptance credits 2,778,064 - - - 2,778,064
Staff loans/financing 3,279 15,072 35,400 264,126 317,877
Credit/charge cards 2,672,478 - - - 2,672,478
Revolving credit 4,025,887 - - - 4,025,887
Other loans/financing 9,693 - - - 9,693
18,089,734 2,039,705 2,659,537 21,371,507 44,160,483
Group (RM'000)
Maturing
within one
year
One year to
three years
Three years to
five years
Over five
years Total
Overdrafts 1,369,460 - - - 1,369,460
Term loans/financing
Housing loans/financing 73,184 83,854 185,648 15,700,024 16,042,710
Syndicated term loan/financing - 45,077 - - 45,077
Factoring receivables 160,206 - - - 160,206
Hire purchase receivables 17,991 103,233 131,082 437 252,743
Lease receivables 28 - 2,414 - 2,442
Other term loans/financing 3,705,531 2,095,019 1,963,262 5,251,094 13,014,906
Bills receivable 3,499,558 - - - 3,499,558
Trust receipts 1,704,541 - - - 1,704,541
Claims on customers under acceptance credits 2,640,571 - - - 2,640,571
Staff loans/financing 3,589 14,932 34,097 258,600 311,218
Credit/charge cards 2,849,038 - - - 2,849,038
Revolving credit 3,459,069 - - - 3,459,069
Other loans/financing 8,793 - - - 8,793
19,491,559 2,342,115 2,316,503 21,210,155 45,360,332
31 December 2013
30 June 2014
5

HSBC Bank Malaysia Berhad
127776-V
Risk Weighted Capital Adequacy Framework (Basel II) Pillar 3 Interim Disclosures (Cont’d)
1) Credit risk (Cont'd)
Table 4: Distribution of loans/financing by sector, breakdown by type
Overdraft Housing
loans/
financing
Syndicated
term
loans/financing
Factoring
receivables
Hire
purchase
receivables
Lease
receivables
Other term
loans/financing
Bills
receivable
Trust
receipts
Claims on
customers
under
acceptances
credits
Staff loans/
financing
Credit/
charge
cards
Revolving
credit
Other loans/
financing
Total
Agricultural, hunting, forestry and fishing 58,842 - - - 5,165 - 795,057 147,492 7,374 57,862 - - 203,407 151 1,275,350
Mining and quarrying 6,096 - - 398 11,469 - 136,692 - 35,916 1,057 - - 286,172 1 477,801
Manufacturing 354,220 - - 82,694 110,210 - 2,256,659 427,712 1,027,723 1,505,475 - - 1,013,807 2,736 6,781,236
Electricity, gas and water 3,997 - - - - - 80,571 874 2,098 16,651 - - 2,000 - 106,191
Construction 66,768 - - 1,536 18,229 - 1,864,981 87,484 11,885 79,787 - - 313,886 112 2,444,668
Real estate 18,663 - - - - - 960,865 - - - - - 595,237 1 1,574,766
Wholesale & retail trade and restaurants & hotels 214,672 - - 54,287 26,106 - 656,443 235,240 293,198 986,111 - - 345,029 471 2,811,557
Transport, storage and communication 27,400 - - 8,396 18,785 - 238,477 7,520 2,755 8,261 - - 45,191 6 356,791
Finance, insurance/takaful and business services 167,749 - - 14,658 18,904 2,948 1,478,579 4,948 120,387 76,590 - - 1,024,159 80 2,909,002
Household-retail 222,140 17,031,115 - - 486 - 3,513,022 - - - 317,877 2,672,478 - - 23,757,118
Others 51,480 - - 964 31,215 - 319,413 1,013,319 208 46,270 - - 196,999 6,135 1,666,003
1,192,027 17,031,115 - 162,933 240,569 2,948 12,300,759 1,924,589 1,501,544 2,778,064 317,877 2,672,478 4,025,887 9,693 44,160,483
Overdraft Housing
loans/
financing
Syndicated term
loans/financing
Factoring
receivables
Hire
purchase
receivables
Lease
receivables
Other term
loans/financing
Bills
receivable
Trust
receipts
Claims on
customers
under
acceptances
credits
Staff loans/
financing
Credit/
charge cards
Revolving
credit
Other loans/
financing
Total
Agricultural, hunting, forestry and fishing 69,741 - - - 5,887 - 1,033,522 176,014 14,105 129,748 - - 204,283 95 1,633,395
Mining and quarrying 5,395 - - 559 13,891 - 210,068 2,844 93,549 777 - - 125,220 - 452,303
Manufacturing 336,901 - - 88,520 115,013 - 1,813,513 613,777 1,007,064 1,514,223 - - 874,347 2,065 6,365,423
Electricity, gas and water 8,093 - - - - - 90,963 1,038 2,030 20,003 - - 2,000 - 124,127
Construction 70,944 - - 502 20,843 - 1,974,303 43,444 12,520 74,912 - - 311,673 75 2,509,216
Real estate 17,563 - - - - - 1,162,408 - - 281 - - 596,058 - 1,776,310
Wholesale & retail trade and restaurants & hotels 223,410 - - 41,900 30,290 - 807,208 285,221 415,724 770,893 - - 198,108 323 2,773,077
Transport, storage and communication 29,958 - - 12,808 22,267 - 251,506 6,796 1,578 11,400 - - 52,556 4 388,873
Finance, insurance/takaful and business services 171,171 - 45,077 14,094 19,532 2,442 1,338,728 6,875 157,070 72,712 - - 954,588 33 2,782,322
Household-retail 413,356 16,042,710 - - 575 - 3,913,217 - - - 311,218 2,849,038 - - 23,530,114
Others 22,928 - - 1,823 24,445 - 419,470 2,363,549 901 45,622 - - 140,236 6,198 3,025,172
1,369,460 16,042,710 45,077 160,206 252,743 2,442 13,014,906 3,499,558 1,704,541 2,640,571 311,218 2,849,038 3,459,069 8,793 45,360,332
31 December 2013
Group (RM'000)
30 June 2014
Group (RM'000)
6

HSBC Bank Malaysia Berhad
127776-V
Risk Weighted Capital Adequacy Framework (Basel II) Pillar 3 Interim Disclosures (Cont’d)
1) Credit risk (Cont'd)
Table 5: Distribution of impaired loans/financing by sector, breakdown by type
Overdraft Housing
loans/
financing
Factoring
receivables
Hire
purchase
receivables
Other term
loans/financing
Bills
receivable
Trust
receipts
Claims on
customers
under
acceptances
credits
Staff loans/
financing
Credit/
charge cards
Revolving
credit
Other loans/
financing
Total
Agricultural, hunting, forestry and fishing 2,610 - - - 70,258 - - - - - - 151 73,019
Mining and quarrying 178 - - - - - - - - - - - 178
Manufacturing 6 - 2,198 7,757 46,678 - 6,601 11,229 - - - 7,334 81,803
Electricity, gas and water 756 - - - 6,371 - 2,098 - - - - - 9,225
Construction 5,242 - - - 44,073 - 2,647 - - - 68 112 52,142
Real estate - - - - 4,894 - - - - - - 1 4,895
Wholesale & retail trade and restaurants & hotels 26,453 - 1,165 1,356 9,265 7,289 4,148 27,719 - - 4,167 471 82,033
Transport, storage and communication 436 - - - 813 - - 305 - - - 6 1,560
Finance, insurance/takaful and business services 343 - - 622 893 - - - - - - 75 1,933
Household-retail 5,722 288,437 - 686 167,933 - - - 3,558 53,056 - - 519,392
Others - 180 - 191 507 - - 485 - - - 1,271 2,634
41,746 288,617 3,363 10,612 351,685 7,289 15,494 39,738 3,558 53,056 4,235 9,421 828,814
Overdraft Housing
loans/
financing
Factoring
receivables
Hire
purchase
receivables
Other term
loans/financing
Bills
receivable
Trust
receipts
Claims on
customers
under
acceptances
credits
Staff loans/
financing
Credit/
charge cards
Revolving
credit
Other loans/
financing
Total
Agricultural, hunting, forestry and fishing - - - - 366 10 - - - - - 95 471
Mining and quarrying 163 - - - - - - - - - - - 163
Manufacturing 5,221 - 8,230 6,291 41,578 999 5,661 32,268 - - - 6,812 107,060
Electricity, gas and water - - - - - - - - - - - - -
Construction 4,969 - - - 47,659 - 2,548 - - - 67 75 55,318
Real estate - - - - - - - - - - - - -
Wholesale & retail trade and restaurants & hotels 9,187 - 2,153 354 8,567 21,653 3,515 11,451 - - 4,034 324 61,238
Transport, storage and communication 741 - - - 1,023 - - - - - - 3 1,767
Finance, insurance/takaful and business services 425 - - 346 1,068 - - - - - - 32 1,871
Household-retail 6,138 323,824 - 694 170,746 - - - 3,716 57,593 - - 562,711
Others - 178 - 168 33 - - - - - - 1,387 1,766
26,844 324,002 10,383 7,853 271,040 22,662 11,724 43,719 3,716 57,593 4,101 8,728 792,365
30 June 2014
Group (RM'000)
Group (RM'000)
31 December 2013
7

HSBC Bank Malaysia Berhad
127776-V
Risk Weighted Capital Adequacy Framework (Basel II) Pillar 3 Interim Disclosures (Cont’d)
1) Credit Risk (Cont'd)
Table 6: All past due loans/financing breakdown by sector * 30 June 2014 31 December 2013
Group (RM'000) Group (RM'000)
Agricultural, hunting, forestry and fishing 327,989 2,127
Mining and quarrying 800 736
Manufacturing 380,282 483,157
Electricity, gas and water 41,437 1
Construction 236,158 249,682
Real estate 21,988 -
Wholesale & retail trade and restaurants & hotels 372,041 276,429
Transport, storage and communication 7,241 7,939
Finance, insurance/takaful and business services 9,422 8,434
Household-retail 2,504,668 2,534,434
Others 12,652 7,966
3,914,678 3,570,905
Table 7: All past due loans/financing breakdown by geographical location* 30 June 2014 31 December 2013
Group (RM'000) Group (RM'000)
Northern region 718,528 757,722
Southern region 554,583 748,585
Central region 2,051,405 1,795,293
Eastern region 590,162 269,305
3,914,678 3,570,905
Table 8: Individual and collective impairment allowance breakdown by sector
Individual
impairment
allowance
Collective
impairment
allowance
Individual
impairment
allowance
Collective
impairment
allowance
Agricultural, hunting, forestry and fishing 2,944 3,494 121 4,715
Mining and quarrying - 2,246 - 1,331
Manufacturing 68,422 47,956 67,959 54,209
Electricity, gas and water 1,620 5,804 - 7,821
Construction 20,306 11,624 40,194 12,172
Real estate 863 28,057 773 35,400
Wholesale & retail trade and restaurants & hotels 53,704 10,747 39,012 10,273
Transport, storage and communication 374 3,416 526 4,221
Finance, insurance/takaful and business services 1,386 8,932 171 7,392
Household-retail 158,180 217,694 168,769 221,468
Others 368 22,854 587 23,314
308,167 362,824 318,112 382,316
Table 9: Individual and collective impairment allowance breakdown by geographical location
Individual
impairment
allowance
Collective
impairment
allowance
Individual
impairment
allowance
Collective
impairment
allowance
Northern region 24,658 62,217 25,101 64,352
Southern region 27,162 54,254 42,187 54,988
Central region 230,713 216,455 229,761 228,873
Eastern region 25,634 29,898 21,063 34,103
308,167 362,824 318,112 382,316
30 June 2014
Group (RM'000)
31 December 2013
Group (RM'000)
30 June 2014
Group (RM'000)
31 December 2013
Group (RM'000)
* Of which the portion of impaired loans breakdown by sector and geographical location is disclosed in Note 16 (iii) and 16 (v) of
the unaudited condensed interim financial statements at 30 June 2014 respectively.
8
HSBC Bank Malaysia Berhad
127776-V
Risk Weighted Capital Adequacy Framework (Basel II) Pillar 3 Interim Disclosures (Cont’d)
1) Credit Risk (Cont'd)
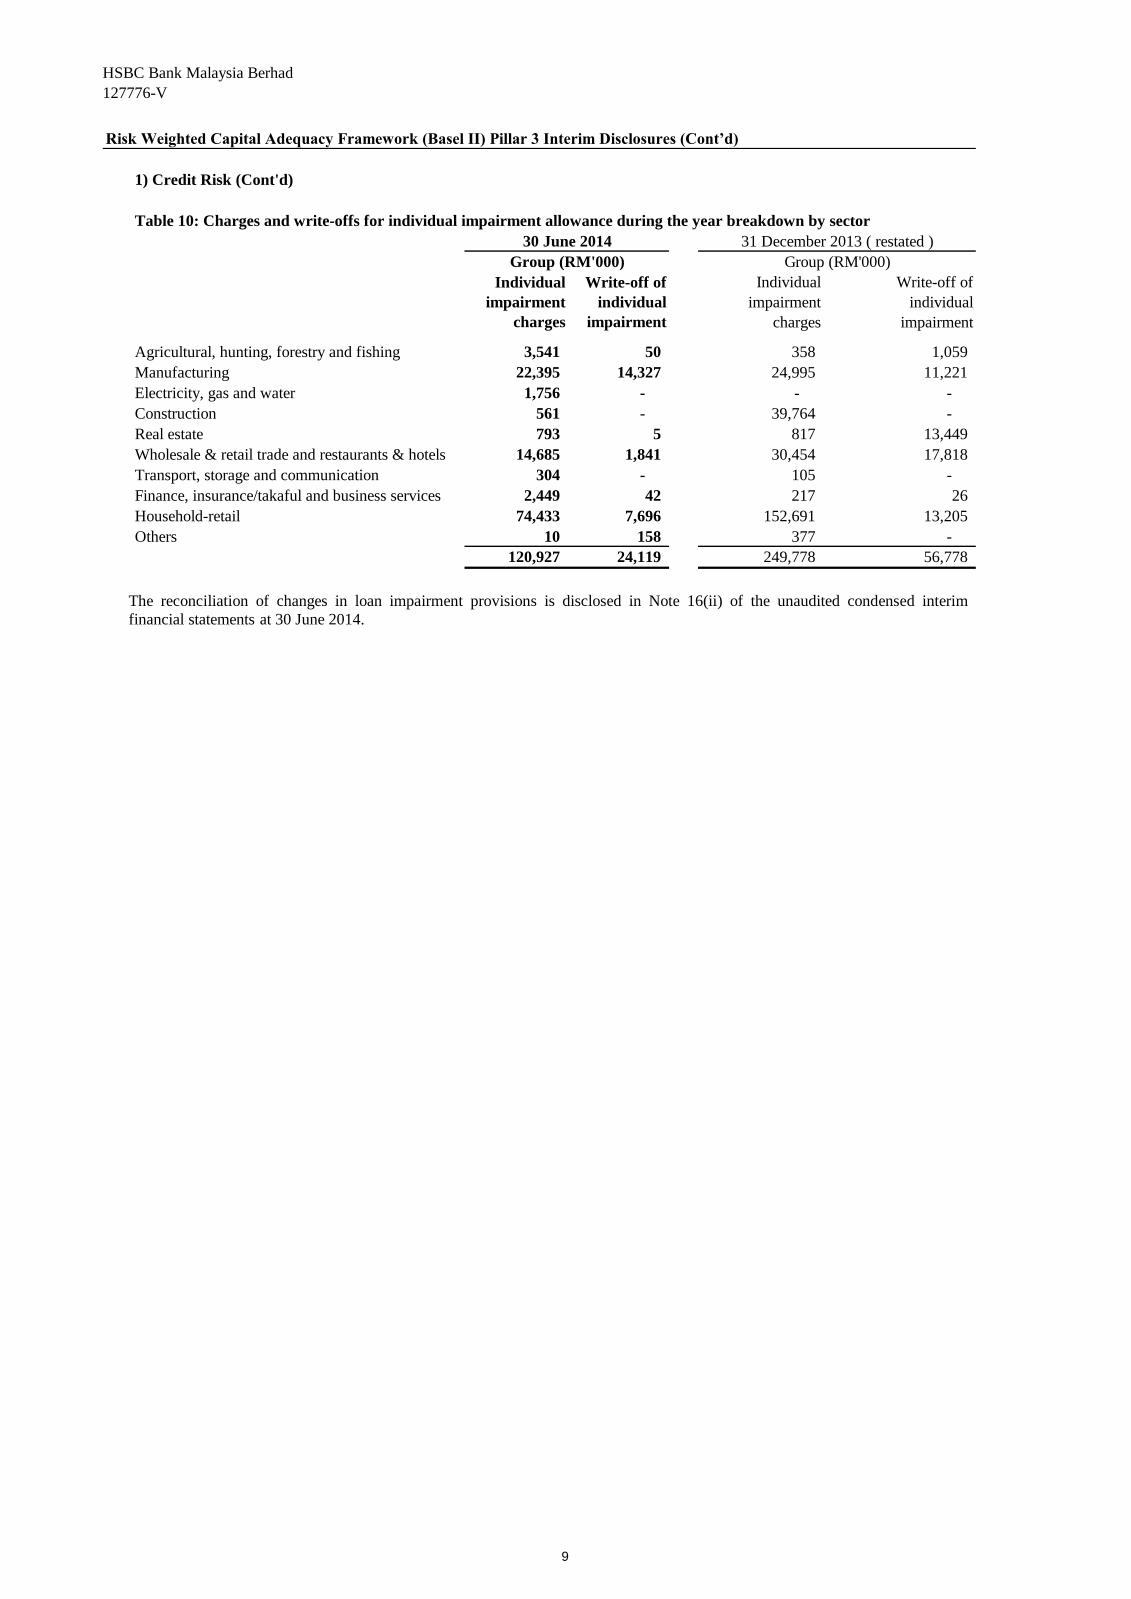
Table 10: Charges and write-offs for individual impairment allowance during the year breakdown by sector
Individual
impairment
charges
Write-off of
individual
impairment
Individual
impairment
charges
Write-off of
individual
impairment
Agricultural, hunting, forestry and fishing 3,541 50 358 1,059
Manufacturing 22,395 14,327 24,995 11,221
Electricity, gas and water 1,756 - - -
Construction 561 - 39,764 -
Real estate 793 5 817 13,449
Wholesale & retail trade and restaurants & hotels 14,685 1,841 30,454 17,818
Transport, storage and communication 304 - 105 -
Finance, insurance/takaful and business services 2,449 42 217 26
Household-retail 74,433 7,696 152,691 13,205
Others 10 158 377 -
120,927 24,119 249,778 56,778
Group (RM'000)
30 June 2014
Group (RM'000)
31 December 2013 ( restated )
The reconciliation of changes in loan impairment provisions is disclosed in Note 16(ii) of the unaudited condensed interim
financial statements at 30 June 2014.
9

HSBC Bank Malaysia Berhad
127776-V
Risk Weighted Capital Adequacy Framework (Basel II) Pillar 3 Interim Disclosures (Cont’d)
1) Credit Risk (Cont'd)
i) External Credit Assessment Institutions (ECAIs)
30 June 2014
Group (RM '000)
S&P AAA to AA- A+ to A- BBB+ to BBB- BB+ to B- CCC+ to D Unrated
Moodys Aaa to Aa3 A1 to A3 Baa1 to Baa3 Ba1 to B3 Caa1 to C Unrated
Fitch AAA to AA- A+ to A- BBB+ to BBB- BB+ to B- CCC+ to D Unrated
On and Off Balance-Sheet Exposures
Sovereigns &
Central Banks - 11,678,772 - - - -
Total - 11,678,772 - - - -
31 December 2013
Group (RM '000)
S&P AAA to AA- A+ to A- BBB+ to BBB- BB+ to B- CCC+ to D Unrated
Moodys Aaa to Aa3 A1 to A3 Baa1 to Baa3 Ba1 to B3 Caa1 to C Unrated
Fitch AAA to AA- A+ to A- BBB+ to BBB- BB+ to B- CCC+ to D Unrated
On and Off Balance-Sheet Exposures
Sovereigns &
Central Banks - 7,778,218 - - - 37,635
Total - 7,778,218 - - - 37,635
Risk weights under the standardised approach at the reporting date are reflected in page 17. Rated and unrated exposures
according to ratings by ECAIs at reporting date are as follows:-
Exposure Class
Ratings of Sovereigns and Central Banks by Approved ECAIs
Exposure Class
Ratings of Sovereigns and Central Banks by Approved ECAIs
10
HSBC Bank Malaysia Berhad
127776-V
Risk Weighted Capital Adequacy Framework (Basel II) Pillar 3 Interim Disclosures (Cont’d)
1) Credit Risk (Cont'd)
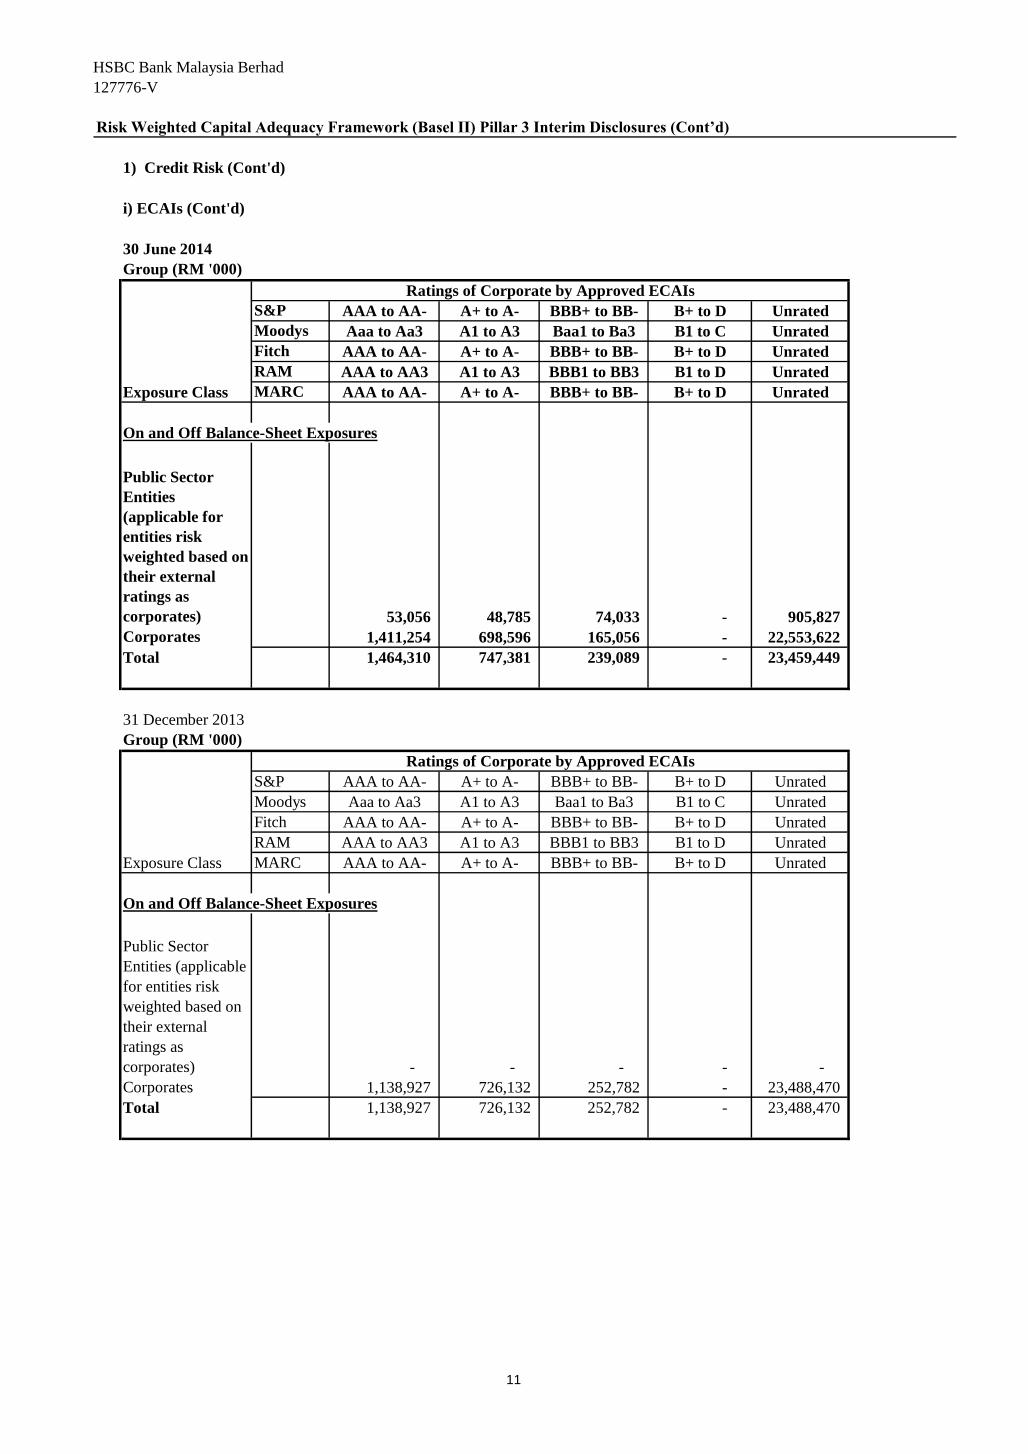
i) ECAIs (Cont'd)
30 June 2014
Group (RM '000)
S&P AAA to AA- A+ to A- BBB+ to BB- B+ to D Unrated
Moodys Aaa to Aa3 A1 to A3 Baa1 to Ba3 B1 to C Unrated
Fitch AAA to AA- A+ to A- BBB+ to BB- B+ to D Unrated
RAM AAA to AA3 A1 to A3 BBB1 to BB3 B1 to D Unrated
MARC AAA to AA- A+ to A- BBB+ to BB- B+ to D Unrated
On and Off Balance-Sheet Exposures
Public Sector
Entities
(applicable for
entities risk
weighted based on
their external
ratings as
corporates) 53,056 48,785 74,033 - 905,827
Corporates 1,411,254 698,596 165,056 - 22,553,622
Total 1,464,310 747,381 239,089 - 23,459,449
31 December 2013
Group (RM '000)
S&P AAA to AA- A+ to A- BBB+ to BB- B+ to D Unrated
Moodys Aaa to Aa3 A1 to A3 Baa1 to Ba3 B1 to C Unrated
Fitch AAA to AA- A+ to A- BBB+ to BB- B+ to D Unrated
RAM AAA to AA3 A1 to A3 BBB1 to BB3 B1 to D Unrated
MARC AAA to AA- A+ to A- BBB+ to BB- B+ to D Unrated
On and Off Balance-Sheet Exposures
Public Sector
Entities (applicable
for entities risk
weighted based on
their external
ratings as
corporates) - - - - -
Corporates 1,138,927 726,132 252,782 - 23,488,470
Total 1,138,927 726,132 252,782 - 23,488,470
Exposure Class
Ratings of Corporate by Approved ECAIs
Ratings of Corporate by Approved ECAIs
Exposure Class
11
HSBC Bank Malaysia Berhad
127776-V
Risk Weighted Capital Adequacy Framework (Basel II) Pillar 3 Interim Disclosures (Cont’d)
1) Credit Risk (Cont'd)
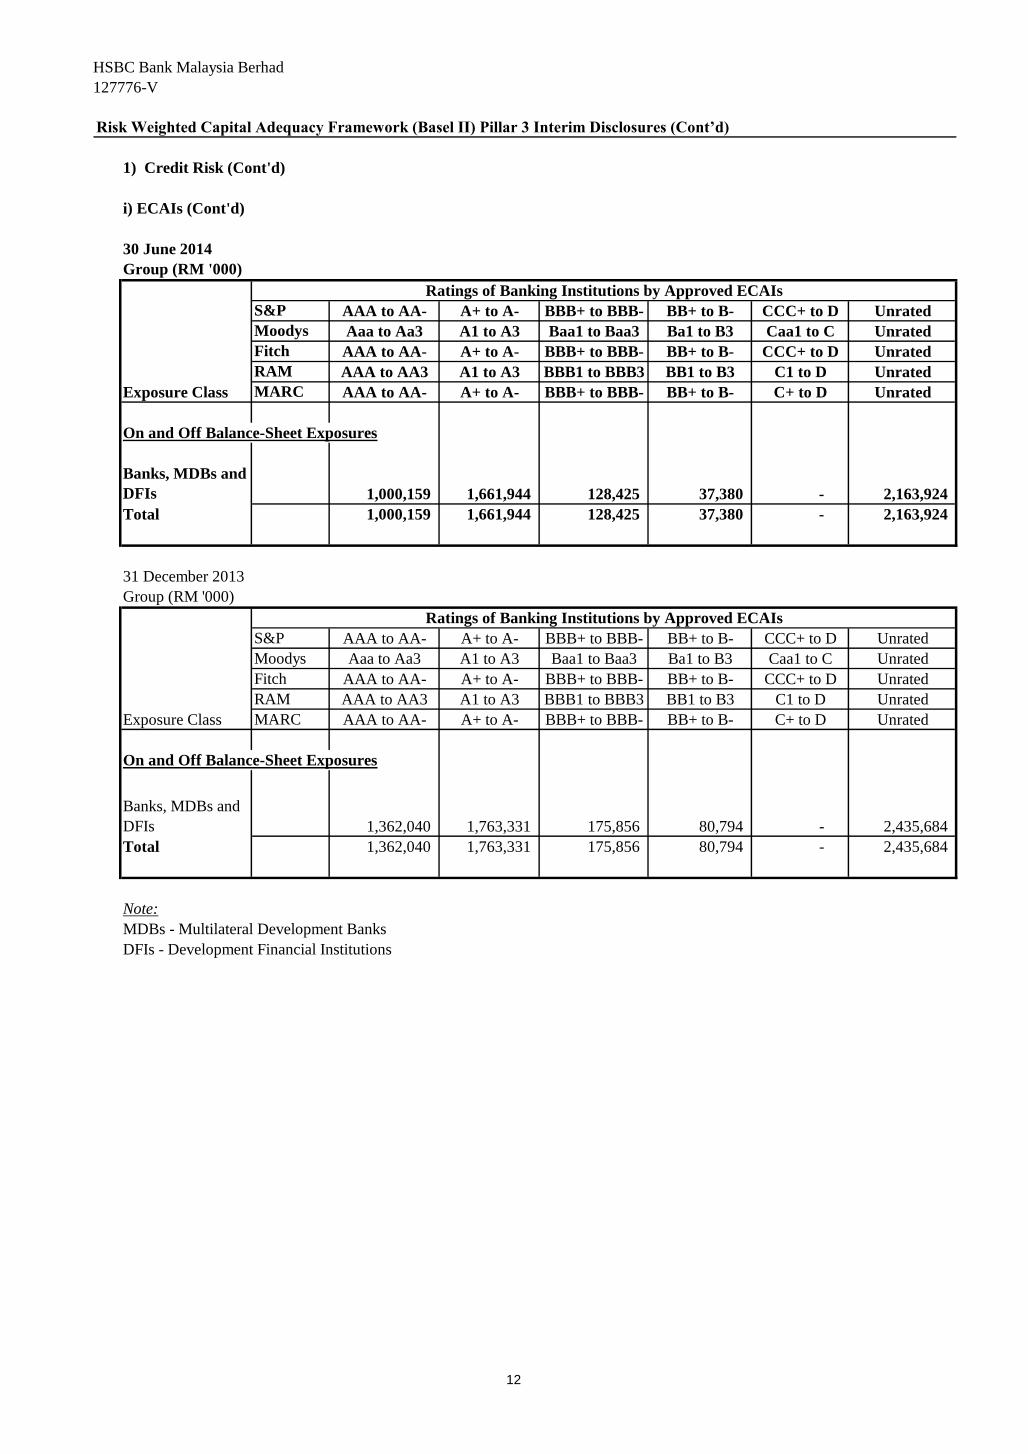
i) ECAIs (Cont'd)
30 June 2014
Group (RM '000)
S&P AAA to AA- A+ to A- BBB+ to BBB- BB+ to B- CCC+ to D Unrated
Moodys Aaa to Aa3 A1 to A3 Baa1 to Baa3 Ba1 to B3 Caa1 to C Unrated
Fitch AAA to AA- A+ to A- BBB+ to BBB- BB+ to B- CCC+ to D Unrated
RAM AAA to AA3 A1 to A3 BBB1 to BBB3 BB1 to B3 C1 to D Unrated
MARC AAA to AA- A+ to A- BBB+ to BBB- BB+ to B- C+ to D Unrated
On and Off Balance-Sheet Exposures
Banks, MDBs and
DFIs 1,000,159 1,661,944 128,425 37,380 - 2,163,924
Total 1,000,159 1,661,944 128,425 37,380 - 2,163,924
31 December 2013
Group (RM '000)
S&P AAA to AA- A+ to A- BBB+ to BBB- BB+ to B- CCC+ to D Unrated
Moodys Aaa to Aa3 A1 to A3 Baa1 to Baa3 Ba1 to B3 Caa1 to C Unrated
Fitch AAA to AA- A+ to A- BBB+ to BBB- BB+ to B- CCC+ to D Unrated
RAM AAA to AA3 A1 to A3 BBB1 to BBB3 BB1 to B3 C1 to D Unrated
MARC AAA to AA- A+ to A- BBB+ to BBB- BB+ to B- C+ to D Unrated
On and Off Balance-Sheet Exposures
Banks, MDBs and
DFIs 1,362,040 1,763,331 175,856 80,794 - 2,435,684
Total 1,362,040 1,763,331 175,856 80,794 - 2,435,684
Note:
MDBs - Multilateral Development Banks
DFIs - Development Financial Institutions
Exposure Class
Ratings of Banking Institutions by Approved ECAIs
Exposure Class
Ratings of Banking Institutions by Approved ECAIs
12

HSBC Bank Malaysia Berhad
127776-V
Risk Weighted Capital Adequacy Framework (Basel II) Pillar 3 Interim Disclosures (Cont’d)
1) Credit Risk (Cont'd)
ii) Credit risk mitigation
The table below shows the on and off balance sheet exposures before and after credit risk mitigation.
30 June 2014
Group (RM'000)
Exposure Class
Exposures
Before Credit
Risk Mitigation
Exposures
Covered by
Guarantees /
Credit
Derivatives
Exposures Covered
by Eligible
Collateral
Credit Risk
On-Balance Sheet Exposures
Sovereigns/Central Banks 31,450,845 - -
Public Sector Entities 724,509 - -
Banks, Development Financial Institutions & MDBs 5,022,496 - -
Corporates 16,655,918 171,236 770,707
Regulatory Retail 6,356,968 31,269 164,172
Residential Mortgages 18,280,268 - 24,597
Higher Risk Assets 40 - -
Other Assets 737,864 - -
Equity Exposure 16,908 - -
Defaulted Exposures 653,431 6,994 17,850
Total for On-Balance Sheet Exposures 79,899,247 209,499 977,326
Off-Balance Sheet Exposures
OTC Derivatives 3,588,143 - -
Off balance sheet exposures other than OTC derivatives or
credit derivatives
13,257,204 146,847 265,950
Defaulted Exposures 233,000 827 14,381
Total for Off-Balance Sheet Exposures 17,078,347 147,674 280,331
Total On and Off-Balance Sheet Exposures 96,977,594 357,173 1,257,657
13

HSBC Bank Malaysia Berhad
127776-V
Risk Weighted Capital Adequacy Framework (Basel II) Pillar 3 Interim Disclosures (Cont’d)
1) Credit Risk (Cont'd)
ii) Credit risk mitigation (Cont'd)
The table below shows on and off balance sheet exposures before and after credit risk mitigation.
31 December 2013
Group (RM'000)
Exposure Class
Exposures
Before Credit
Risk Mitigation
Exposures
Covered by
Guarantees /
Credit
Derivatives
Exposures Covered
by Eligible
Collateral
Credit Risk
On-Balance Sheet Exposures
Sovereigns/Central Banks 25,541,207 - -
Public Sector Entities 88,283 - -
Banks, Development Financial Institutions & MDBs 7,461,858 - -
Corporates 17,243,190 173,231 705,312
Regulatory Retail 6,763,053 43,085 170,105
Residential Mortgages 17,492,155 - 24,875
Higher Risk Assets 48 - -
Other Assets 1,141,014 - -
Equity Exposure 16,908 - -
Defaulted Exposures 565,927 4,004 11,851
Total for On-Balance Sheet Exposures 76,313,643 220,320 912,143
Off-Balance Sheet Exposures
OTC Derivatives 4,157,766 - -
Off balance sheet exposures other than OTC derivatives or
credit derivatives
12,917,612 180,639 293,044
Defaulted Exposures 192,713 1,495 18,323
Total for Off-Balance Sheet Exposures 17,268,091 182,134 311,367
Total On and Off-Balance Sheet Exposures 93,581,734 402,454 1,223,510
Refer to Note 33 of the unaudited condensed interim financial statements at 30 June 2014 for disclosure of off-
balance sheet and Note 31 for disclosure of counterparty credit risk.
14

HSBC Bank Malaysia Berhad
127776-V
Risk Weighted Capital Adequacy Framework (Basel II) Pillar 3 Interim Disclosures (Cont’d)
1) Credit Risk (Cont'd)
iii) Counterparty Credit Risk
30 June 2014
Group (RM'000)
Exposure Class
Gross
Exposures
Net
Exposures
Risk Weighted
Assets (RWA)
RWA
Absorbed by
PSIA
Total RWA
after PSIA
Capital
Requirement
Credit Risk
On-Balance Sheet Exposures
Sovereigns/Central Banks 31,450,845 31,450,845 5,711 - 5,711 457
Public Sector Entities 724,509 724,509 701,233 - 701,233 56,099
Banks, Development Financial
Institutions & MDBs
5,022,496 5,022,496 1,290,497 - 1,290,497 103,240
Corporates 16,655,918 15,885,211 14,996,282 - 14,996,283 1,199,703
Regulatory Retail 6,356,968 6,192,796 4,671,639 - 4,671,639 373,731
Residential Mortgages 18,280,268 18,255,671 7,281,937 - 7,281,937 582,555
Higher Risk Assets 40 40 60 - 60 5
Other Assets 737,864 737,864 462,557 - 462,557 37,005
Equity Exposure 16,908 16,908 16,908 - 16,908 1,353
Defaulted Exposures 653,431 635,581 706,841 - 706,841 56,547
Total for On-Balance Sheet Exposures
79,899,247 78,921,921 30,133,665 - 30,133,666 2,410,695
Off-Balance Sheet Exposures
OTC Derivatives 3,588,143 3,588,143 1,466,504 - 1,466,504 117,320
Off balance sheet exposures other than
OTC derivatives or credit derivatives13,257,204 12,991,254 11,058,343 - 11,058,343 884,667
Defaulted Exposures 233,000 218,619 326,953 - 326,953 26,156
Total for Off-Balance Sheet Exposures 17,078,347 16,798,016 12,851,800 - 12,851,800 1,028,143
Total On and Off-Balance Sheet
Exposures 96,977,594 95,719,937 42,985,465 - 42,985,466 3,438,838
Market Risk Long Position Short Position
Interest/Profit Rate Risk 68,016,738 67,675,825 340,913 1,314,392 - 1,314,392 105,151
Foreign Currency Risk 34,503 44,006 55,663 55,663 - 55,663 4,453
Option Risk - - - 27,052 - 27,052 2,164
68,051,241 67,719,831 396,576 1,397,107 - 1,397,107 111,768
Operational Risk - - - 5,684,531 - 5,684,531 454,762
Total RWA and Capital Requirement - - -
50,067,103 50,067,104 4,005,368
Group
The tables below disclose the gross and net exposures, risk weighted assets ('RWAs') and capital requirements for credit risk, market risk
and operational risk of the Group at the balance sheet date.
At 30 June 2014, the RWA risk absorbent profit sharing investment account in the Bank amounted to RM344,650,000. Both the
principal amount and risk weighted asset are the same. This amount is reported as asset under management in the books of the Bank's
Islamic Subsidiary. At the group level, the effect of the RWA risk absorbent profit sharing investment is eliminated.
15
HSBC Bank Malaysia Berhad
127776-V
Risk Weighted Capital Adequacy Framework (Basel II) Pillar 3 Interim Disclosures (Cont’d)
1) Credit Risk (Cont'd)
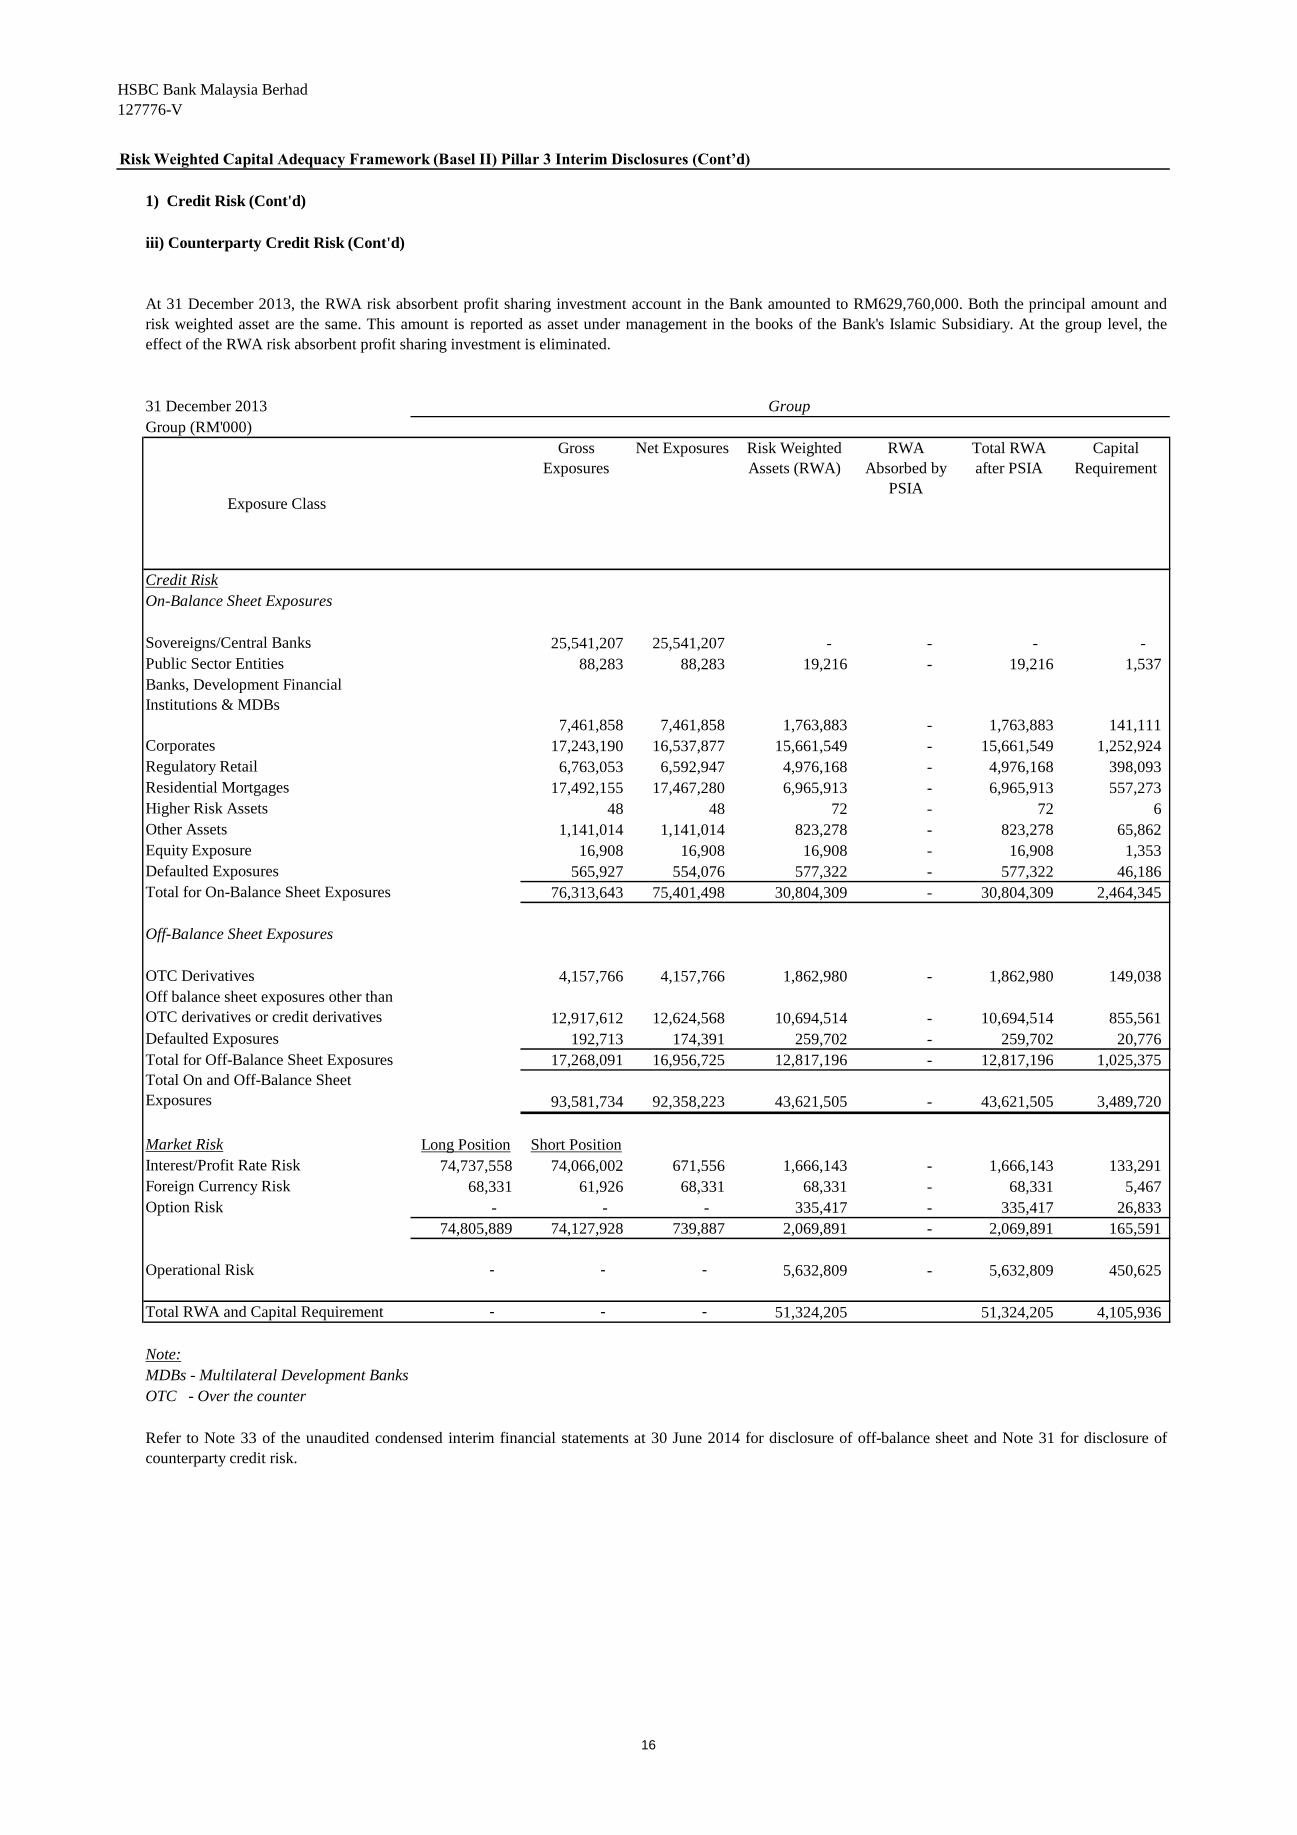
iii) Counterparty Credit Risk (Cont'd)
31 December 2013
Group (RM'000)
Exposure Class
Gross
Exposures
Net Exposures Risk Weighted
Assets (RWA)
RWA
Absorbed by
PSIA
Total RWA
after PSIA
Capital
Requirement
Credit Risk
On-Balance Sheet Exposures
Sovereigns/Central Banks 25,541,207 25,541,207 - - - -
Public Sector Entities 88,283 88,283 19,216 - 19,216 1,537
Banks, Development Financial
Institutions & MDBs
7,461,858 7,461,858 1,763,883 - 1,763,883 141,111
Corporates 17,243,190 16,537,877 15,661,549 - 15,661,549 1,252,924
Regulatory Retail 6,763,053 6,592,947 4,976,168 - 4,976,168 398,093
Residential Mortgages 17,492,155 17,467,280 6,965,913 - 6,965,913 557,273
Higher Risk Assets 48 48 72 - 72 6
Other Assets 1,141,014 1,141,014 823,278 - 823,278 65,862
Equity Exposure 16,908 16,908 16,908 - 16,908 1,353
Defaulted Exposures 565,927 554,076 577,322 - 577,322 46,186
Total for On-Balance Sheet Exposures 76,313,643 75,401,498 30,804,309 - 30,804,309 2,464,345
Off-Balance Sheet Exposures
OTC Derivatives 4,157,766 4,157,766 1,862,980 - 1,862,980 149,038
Off balance sheet exposures other than
OTC derivatives or credit derivatives 12,917,612 12,624,568 10,694,514 - 10,694,514 855,561
Defaulted Exposures 192,713 174,391 259,702 - 259,702 20,776
Total for Off-Balance Sheet Exposures 17,268,091 16,956,725 12,817,196 - 12,817,196 1,025,375
Total On and Off-Balance Sheet
Exposures 93,581,734 92,358,223 43,621,505 - 43,621,505 3,489,720
Market Risk Long Position Short Position
Interest/Profit Rate Risk 74,737,558 74,066,002 671,556 1,666,143 - 1,666,143 133,291
Foreign Currency Risk 68,331 61,926 68,331 68,331 - 68,331 5,467
Option Risk - - - 335,417 - 335,417 26,833
74,805,889 74,127,928 739,887 2,069,891 - 2,069,891 165,591
Operational Risk - - - 5,632,809 - 5,632,809 450,625
Total RWA and Capital Requirement - - - 51,324,205 51,324,205 4,105,936
Note:
MDBs - Multilateral Development Banks
OTC - Over the counter
Group
Refer to Note 33 of the unaudited condensed interim financial statements at 30 June 2014 for disclosure of off-balance sheet and Note 31 for disclosure of
counterparty credit risk.
At 31 December 2013, the RWA risk absorbent profit sharing investment account in the Bank amounted to RM629,760,000. Both the principal amount and
risk weighted asset are the same. This amount is reported as asset under management in the books of the Bank's Islamic Subsidiary. At the group level, the
effect of the RWA risk absorbent profit sharing investment is eliminated.
16

HSBC Bank Malaysia Berhad
127776-V
Risk Weighted Capital Adequacy Framework (Basel II) Pillar 3 Interim Disclosures (Cont’d)
1) Credit Risk (Cont'd)
iii) Counterparty Credit Risk (Cont'd)
30 June 2014
Group (RM'000)
Sovereigns &
Central BanksPSEs
Banks, MDBs and
DFIsCorporates
Regulatory
Retail
Residental
Mortgages
Higher
Risk
Assets
Other Assets Equity
0% 31,422,292 - - 8,289 17,724 - - 275,356 - 31,723,661 -
20% 28,553 144,437 6,458,830 1,502,246 20,839 - - - - 8,154,905 1,630,981
35% - - - - - 15,451,501 - - - 15,451,501 5,408,026
50% - 25,799 1,978,599 468,165 8,407 1,269,764 - - - 3,750,734 1,875,365
75% - - - 1,200 7,944,785 3,100,721 - - - 11,046,706 8,285,030
100% - 967,837 245,604 21,903,328 370,511 1,238,565 - 462,504 16,908 25,205,257 25,205,257
150% - 11,853 127,907 181,874 58,322 7,091 122 - - 387,169 580,753
1250.0% - - - - - - - 4 - 4 53
Total Risk Weight 95,719,937 42,985,465
Average Risk Weight 0% 89% 31% 94% 76% 46% 150% 63% 100% 45%
31 December 2013
Group (RM'000)
Sovereigns &
Central BanksPSEs
Banks, MDBs and
DFIsCorporates Regulatory Retail
Residental
Mortgages
Higher
Risk
Assets
Other Assets Equity
0% 25,551,118 - - 8,299 17,747 - - 317,735 - 25,894,899 -
20% - 92,104 9,281,178 1,302,431 49,600 - - - - 10,725,313 2,145,063
35% - - - - - 14,881,558 - - - 14,881,558 5,208,545
50% - - 2,015,630 585,844 11,938 1,133,367 - - - 3,746,779 1,873,390
75% - - - 1,528 8,287,389 3,072,845 - - - 11,361,762 8,521,321
100% - 3,034 197,515 22,896,138 419,666 1,140,824 - 823,278 16,908 25,497,363 25,497,363
150% - - 34,041 194,744 12,769 8,855 140 - - 250,549 375,823
Total Risk Weight 92,358,223 43,621,505
Average Risk Weight 0% 23% 27% 95% 76% 46% 150% 72% 100% 47%
Note:
MDBs - Multilateral Development Banks
DFIs - Development Financial Institutions
Group
Risk
Weights
Exposures after Netting and Credit Risk Mitigation
Total Exposures after
Netting & Credit Risk
Mitigation
Total Risk
Weighted Assets
Total Risk
Weighted Assets
The tables below are disclosures on credit risk by risk weights of the Group at balance sheet date.
Group
Risk
Weights
Exposures after Netting and Credit Risk Mitigation
Total Exposures after
Netting & Credit Risk
Mitigation
17

HSBC Bank Malaysia Berhad
127776-V
Risk Weighted Capital Adequacy Framework (Basel II) Pillar 3 Interim Disclosures (Cont’d)
2) Interest rate risk / profit rate risk
Bank (RM'000) At 30 Jun 2014 Average Maximum Minimum
Foreign currency risk 339 659 3,708 204
Interest rate risk 6,632 5,052 12,984 3,144
Credit spread risk 442 523 860 378
Overall 6,462 5,087 13,057 2,884
HSBC Amanah Malaysia Berhad (RM'000) At 30 Jun 2014 Average Maximum Minimum
Foreign currency risk 80 52 157 6
Profit rate risk 29 46 100 27
Credit spread risk - 2 134 -
Overall 73 71 186 30
Bank (RM'000) At 31 Dec 2013 Average Maximum Minimum
Foreign currency risk 501 852 2,272 280
Interest rate risk 4,654 5,496 8,247 2,933
Credit spread risk 770 1,015 1,615 284
Overall 4,300 5,534 8,503 2,813
HSBC Amanah Malaysia Berhad (RM'000) At 31 Dec 2013 Average Maximum Minimum
Foreign currency risk 130 65 279 7
Profit rate risk 84 141 336 83
Credit spread risk
Overall 176 147 328 89
A summary of the Value at Risk (VAR) position of the Bank and its fully owned subsidiary, HSBC Amanah Malaysia
Berhad's trading portfolios at the reporting date is as follows:-
18

HSBC Bank Malaysia Berhad
127776-V
Risk Weighted Capital Adequacy Framework (Basel II) Pillar 3 Interim Disclosures (Cont’d)
2) Interest rate risk / profit rate risk (Cont'd)
Sensitivity of projected Net Interest/Finance Income
from a shift in interest/profit rates of: 30-Jun-14 31-Dec-13
RM’000 RM’000
+100 basis points parallel shift in yield curves 263,612 269,486
-100 basis points parallel shift in yield curves (311,348) (255,496)
+25 basis points at the beginning of each quarter 189,995 175,741
-25 basis points at the beginning of each quarter (201,243) (173,386)
Sensitivity of reported reserves in "other comprehensive income" to interest/profit rate movements
30-Jun-14 31-Dec-13
RM’000 RM’000
+100 basis points parallel shift in yield curves (102,672) (74,472)
-100 basis points parallel shift in yield curves 102,672 74,472
Change in projected economic value of equity
arising
from a shift in interest/profit rates of:
RM’000 RM’000
+200 basis points parallel shift in yield curves 589,641 680,057
-200 basis points parallel shift in yield curves (502,219) (632,513)
Change in projected net interest/finance income in next 12 months arising Group
Group
30-Jun-14 31-Dec-13
The increase or decline in economic value for upward and downward rate shocks for measuring interest rate risk/rate of
return risk in the banking book are as follows:
The interest/profit rate sensitivities set out in the table below are illustrative only and are based on simplified scenarios.
The sensitivity of reported reserves in “other comprehensive income” to interest/profit rate movements is monitored on a
monthly basis by assessing the expected reduction in valuation of available-for-sale portfolios to parallel movements of
plus or minus 100 basis points in all yield curves.
19

HSBC Bank Malaysia Berhad
127776-V
Risk Weighted Capital Adequacy Framework (Basel II) Pillar 3 Interim Disclosures (Cont’d)
3) Shariah Governance (for HSBC Amanah Malaysia Berhad only)
e. Shariah Department
i) Shariah Review
To regularly review the operations and business activities of HBMS in compliance with the Shariah requirements.
To maintain oversight on the operations and business activities of HBMS and to be accountable for its decisions,
views and opinions on Shariah matters.
Overview
Shariah compliance is a cornerstone of Islamic banking and finance industry. An effective Shariah governance policy
enhances the diligent oversight of the Board of Directors, the Shariah Committee and the Management to ensure that
the operations and business activities of HSBC Amanah Malaysia Berhad ("HBMS"), a fully owned Islamic
subsidiary of the Bank, remain consistent with Shariah principles and its requirements.
To ensure Shariah compliance in all aspects of day-to-day Islamic finance activities, the Malaysian regulatory bodies
such as Bank Negara Malaysia ('BNM') and Securities Commission have spelled out several provisions in relation to
the establishment of a Shariah Committee and an internal Shariah Department in an Islamic Financial Institution
('IFI'). The Shariah Committee is an independent Shariah advisory body which plays a vital role in providing Shariah
views and rulings pertaining to Islamic finance. The Shariah Committee also acts as a monitoring body to maintain
Shariah compliance in the operations and business activities of the IFI. At the institutional level, the Shariah
Department acts as an intermediary between the Shariah Committee and the Management team of the IFI. The
Shariah Department together with the Shariah Committee has the role to assist the Management in ensuring that all
activities of the IFI are in compliance with the Shariah rules and principles, in accordance with the guidelines laid
down by Shariah Governance Framework ('SGF') of BNM. However, the accountability to ensure Shariah compliance
remains with the IFI's Board of Directors.
Qualitative Disclosures - Key Components and Core Shariah Functions in Implementing and Monitoring the
Shariah Governance Practices as per SGF
The governance structure of HBMS and the primary responsibilities of each function are set out below:
a. Board of Directors
To be ultimately accountable for the overall Shariah governance and compliance in HBMS.
b. Shariah Committee
c. CEO and Management
To be responsible for day-to-day compliance with Shariah in all aspects of its business activities by observing and
implementing the Shariah rulings and decisions made by the Shariah Advisory Council of BNM (SAC) and the
Shariah Committee and to identify and refer any Shariah issues to the Shariah Committee for its decisions, views and
opinions.
d. Shariah Audit
To conduct periodical assessment to provide an independent assessment and objective assurance of the effectiveness
on the internal control system for Shariah compliance.
To ensure that all procedural guidelines, rules and regulations issued by BNM and other regulatory bodies relating
to Shariah as well as internal guidelines, policies and procedures, manuals and all Shariah rules and principles
issued by the Shariah Committee and Shariah Department are adhered to, with due regard to the business needs
and Shariah requirements.
20
HSBC Bank Malaysia Berhad
127776-V
Risk Weighted Capital Adequacy Framework (Basel II) Pillar 3 Interim Disclosures (Cont’d)
3) Shariah Governance (Cont'd)
e. Shariah Department (Cont'd)
ii) Shariah Advisory
iii) Shariah Research
iv) Shariah Secretariat
v) Knowledge and Skills Management
To monitor the level of Shariah related knowledge and skills by the staff involved in the cycle of HBMS's products.
Quantitative Disclosure
(i) The amount of MYR14,564 in the Account was carried forward from 2013 pending distribution in 2014.
(ii) Income from inadvertent Shariah non-compliant activities identified by HBMS's management amounting to
MYR48,702 in 2014 (as at 30 June 2014) has been reversed to the Account.
Other than the above, there were no other Shariah non-compliance income or other transactions which occurred
during the half year ended 30 June 2014.
During the half financial year ended 30 June 2014, the following transactions are recorded in the Shariah Penalty &
Impure Income Account (the Account):
To provide day-to-day Shariah advice and consultancy to relevant parties, including those involved in the product
development process as well as the supporting functions.
Qualitative Disclosures - Key Components and Core Shariah Functions in Implementing and Monitoring the
Shariah Governance Practices as per SGF (Cont'd)
To conduct in-depth research and studies on Shariah issues.
To coordinate meetings, compile proposal papers, prepare and keep accurate record of minutes of the decisions
and resolutions made by the Shariah Committee, disseminate Shariah decisions to relevant stakeholders and
engage with relevant parties who wish to seek further deliberations from the Shariah Committee.
21