
HRUG - Text Mining to Construct Causal Models
30
Using Literature to Construct Causal Models from Observational Data for Pharmacovigilance Scott Alexander Malec, MLIS, MSIT Scientific Programmer II and PhD Student UTHealth, School of Biomedical Informatics August 11th, 2016 O o o o o o o o o o o o o o o o o o o o o o o o o o o o o o
-
Upload
egoodwintx -
Category
Data & Analytics
-
view
130 -
download
0
Transcript of HRUG - Text Mining to Construct Causal Models

Using Literature to Construct Causal Models from Observational
Data for Pharmacovigilance
Scott Alexander Malec, MLIS, MSIT
Scientific Programmer II and PhD Student
UTHealth, School of Biomedical Informatics
August 11th, 2016
O o o o o o o o o o o o o o o o o o o o o o o o o o o o o o

Overview● Introduction
● Background
○ Confounding
○ Causality and causal inference
○ Background knowledge in statistical and causal models
● Overview of Proposed Research
● Specific Aims and Preliminary Work
● Unifying Discussion
● Alternative Data Sources and Mitigating Methods
● Contributions
● Timeline
● Dissertation Committee: Trevor Cohen, PhD, Peng Wei, PhD, Elmer Bernstam, PhD
2
o O o o o o o o o o o o o o o o o o o o o o o o o o o o o o

Motivation● Adverse drug events (ADEs): 807K events and 124K deaths in 2014 (FAERS)
● Pharmacovigilance (PV): the post-marketing surveillance of pharmaceutics and
other therapies (FDA approval is not the end)
● Active reporting: Spontaneous Reporting Systems (SRSs) (e.g., FAERS,
EudraVigilance, VigiBase)
○ issues: underreporting, lack of context, inaccuracy, inconsistency, Botsis, 2015; Hersh, 2013
● Passive reporting: Why not use clinical data that is embedded in Electronic Health
Records?
○ Clinical data represent a rich but imperfect record of routine clinical practice
○ Confounding variables (hidden latent variables)
3
o o O o o o o o o o o o o o o o o o o o o o o o o o o o o o

Confounding in Observational Data● Confounding factors introduce bias in the association between a predictor
variable and an outcome that one is attempting to quantify
● Common clinical examples: confounding by co-medication, co-morbidity,
co-indication, food allergies, chronic diseases, other risk factors
● Simpson’s paradox: note the disparity between recovery rates of the sub-groups in
comparison with the overall rate
4
Treatment (“CASE”)
Total Ratio Placebo (“CONTROL”)
Total Ratio
Male 81 87 93% 234 270 87%
Female 192 263 73% 55 80 69%
Combined Total 273 350 78% 289 350 83%
o o o O o o o o o o o o o o o o o o o o o o o o o o o o o o
Results of a study into a new drug, with gender taken into account, adapted from Pearl et al., 2014
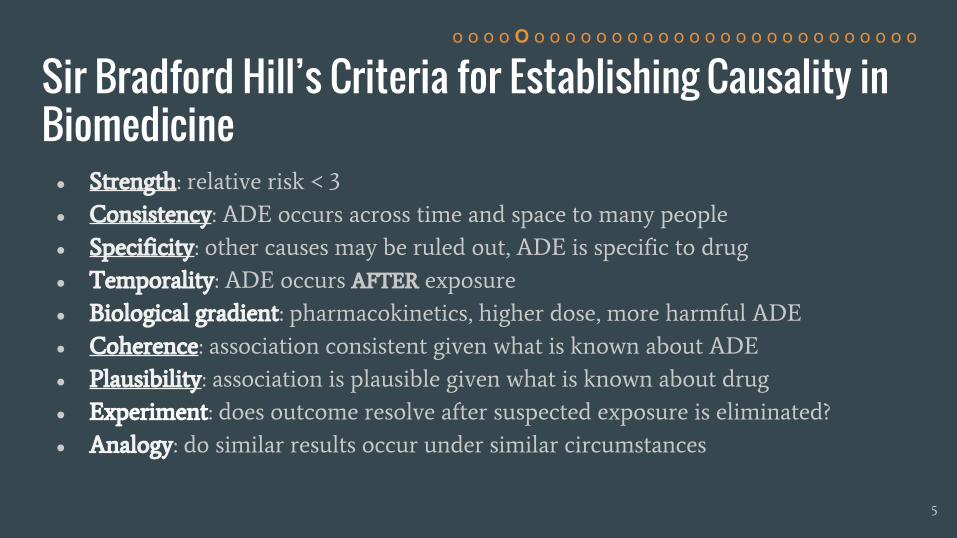
Sir Bradford Hill’s Criteria for Establishing Causality in Biomedicine● Strength: relative risk < 3
● Consistency: ADE occurs across time and space to many people
● Specificity: other causes may be ruled out, ADE is specific to drug
● Temporality: ADE occurs AFTER exposure
● Biological gradient: pharmacokinetics, higher dose, more harmful ADE
● Coherence: association consistent given what is known about ADE
● Plausibility: association is plausible given what is known about drug
● Experiment: does outcome resolve after suspected exposure is eliminated?
● Analogy: do similar results occur under similar circumstances
5
o o o o O o o o o o o o o o o o o o o o o o o o o o o o o o

Pearl’s Formalization of Causality● Pearl’s Motivating question: how can a robot learn from its environment just as children do,
rather than by following rigidly encoded instructions?
● Causal relationships a la Pearl incorporate assumptions from background knowledge
● Precise semantics of Pearl’s causality derive from Bayes theorem, graph theory, the potential
outcomes framework of Neyman-Rubin, and structural equation modeling (SEM), Neyman,
1923, Wright, 1921, Pearl, 2009, 2014
● Alternative causes may be difficult to model statistically, since alternative causes may be
collinear with either the predictor variable or the response variable of interest
● Confounding can be controlled only to the extent that confounders can be identified
● While statistics offers correlation, its language may be yet further enriched with causality,
which is extra-statistical
● Simpson’s Paradox, for which confounding is integral, requires extra statistical means to
resolve
● “Confounding is a causal concept.” - Pearl, 20096
o o o o o O o o o o o o o o o o o o o o o o o o o o o o o o

Background Knowledge ● Traditionally, literature-based discovery (LBD) has been used for identifying novel
hypotheses that are implicit in recorded knowledge (Swanson’s Raynaud’s
Syndrome and fish oil, Swanson, 1986)
● Key is to identify “bridging” or intervening terms to identify relationships
● LBD may be adapted to identify intervening concepts that may be suggestive of
variables that produce confounding effects
● Hypothesis: causal models that are informed with literature-derived assumptions from
background knowledge will be better able to accurately identify causal relationships in
observational data.
● This hypothesis will be evaluated in the domain of pharmacovigilance, where the
problem concerns the identification of causal relationships between drugs and ADEs
using clinical observational data
7
o o o o o o O o o o o o o o o o o o o o o o o o o o o o o o
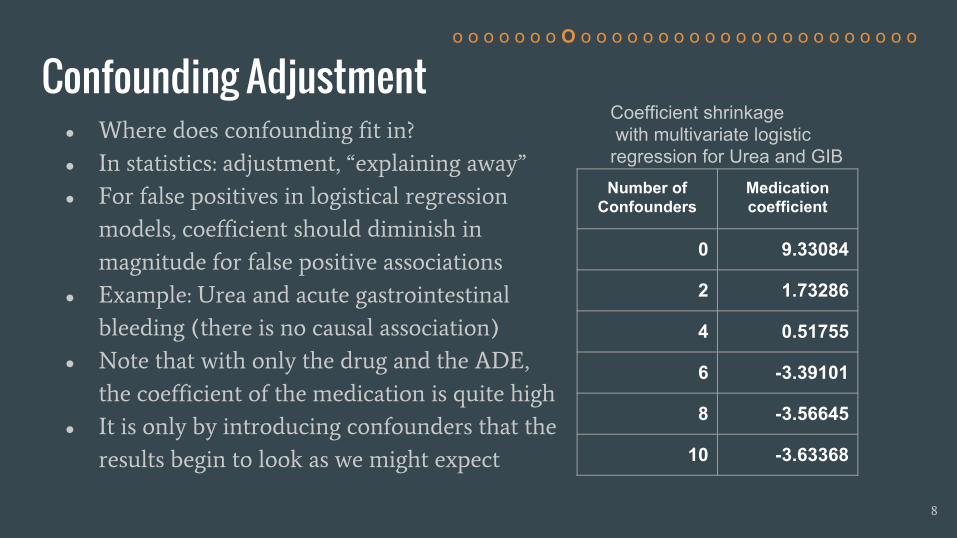
Confounding Adjustment● Where does confounding fit in?
● In statistics: adjustment, “explaining away”
● For false positives in logistical regression
models, coefficient should diminish in
magnitude for false positive associations
● Example: Urea and acute gastrointestinal
bleeding (there is no causal association)
● Note that with only the drug and the ADE,
the coefficient of the medication is quite high
● It is only by introducing confounders that the
results begin to look as we might expect
8
o o o o o o o O o o o o o o o o o o o o o o o o o o o o o o
Number of Confounders
Medication coefficient
0 9.33084
2 1.73286
4 0.51755
6 -3.39101
8 -3.56645
10 -3.63368
Coefficient shrinkage with multivariate logistic regression for Urea and GIB

Summary● ADEs are a serious public health problem
● Confounding variables bias the quantified effects of drug-ADE associations and
can be adjusted for in statistical models to the extent that they can be identified
● Literature-based discovery can be used to identify confounding variables
● Statistical models leave off at correlation/association
● The problem is that of deriving insight into causal mechanisms from large-scale
clinical observational data where confounding and hidden latent variables are
present and the data is incomplete
● Pearl’s causality framework may be brought to bear at the task of identifying
drug-ADE association in clinical observational data by incorporating background
knowledge and imputing hidden latent variables (“unknown unknowns”)
9
o o o o o o o o O o o o o o o o o o o o o o o o o o o o o o

Literature-Based Discovery● Swanson et al., 1986 (Raynaud’s syndrome and fish oil)
● Hristovski et al., 2006 (discovery patterns and their application for PV)
● Discovery pattern: a relational constraint for discovering implicit relationships
● Cohen et al., 2010, Predication-based Semantic Indexing (PSI)/EpiphaNet: a
computationally convenient way to search along discovery patterns
● Shang et al., 2014 - discovery patterns for plausibility via PSI for PV
● Malec et al., 2016 - discovery patterns for discovering confounding variables to
use for adjusting logistical regression models for PV
○ Discovery patterns: CAUSES-INV, PREDISPOSES-INV, TREATS+COEXISTS_WITH-INV
10
o o o o o o o o o O o o o o o o o o o o o o o o o o o o o o

Inference using Pearl Causality● What distinguishes causal Bayesian networks from plain old Bayesian networks?
Causal Bayesian network has causal assumptions plus some extra mathematical
machinery
● Structural Equation Models (SEM), Wright, 1921, Neyman, 1923
● Potential Outcomes Framework, Holland, 1986, Rubin, 1974
● Graphs: variables are nodes, relationship are edges that are determined by
functions (structural equations), causal nodes are parents (or “ancestral”) to
outcome nodes, which are children. X Y denotes that X causes Y.
● Interventionistic Approach: You cannot determine the causal structure of a
phenomenon without incorporating confounding into the analysis
● Paul Holland: “no causation without manipulation”, Holland, 1986
● If a node X determines the value of node Y in a structural equation, then X is thus
said to be causal of Y:
f
y
(x) = βx + ε, where ε is the “error term”
11
o o o o o o o o o o O o o o o o o o o o o o o o o o o o o o
Symmetry:
X ⊥ Y = Y ⊥ X
Conditional Independence:
X ⊥ Y | Z
Confounding:
Z
X Y

Resolving Simpson’s Paradox with Pearl’s do-Calculus
X = 1 = patient took drug, Y = 1 = patient has recovered, Z = 1 = patient is male
Average Causal Effect (ACE) = difference between fraction of recovered population who took drug and those who took placebo from
pre-intervention probabilities = what is the verdict on the treatment given the confounder of sex?
P(Y = 1 | do(X = 1)) = P(Y = 1 | X=1, Z = 1) P(Z = 1) + P(Y = 1 | X = 1, Z = 0) P(Z = 0)
P(Y = 1 | do(X = 1)) = 0.93 (87+270) / 700 + 0.73 ( 263 + 80 ) / 700 = 0.832
P(Y = 1 | do(X=0)) = 0.87 (87+270) / 700 + 0.69 (263 + 80) / 700 = 0.7818
ACE = P(Y = 1 | do( X = 1 )) - P(Y = 1 | do(X = 0)) = 0.832 - 0.7818 = 0.0502 <- this indicates that there is a benefit to taking the drug
12
Treatment Total Ratio Placebo Total Ratio
Male 81 87 93% 234 270 87%
Female 192 263 73% 55 80 69%
Combined Total
273 350 78% 289 350 83%
Adapted from Pearl et al., 2014
o o o o o o o o o o o O o o o o o o o o o o o o o o o o o o
Z
X Y

Related Work in EHR-Based Pharmacovigilance● Diaz-Garelli, 2014:
○ to paraphrase: in EHR-based PV, mileage will vary depending on ASSUMPTIONS of model
● Hersch et al., 2013
○ Caveats of EHR-based PV: incomplete, inaccurate, GIGO
○ Justification for EHR-based PV: the impetus to use it stems from its abundance
● Li et al., 2014
○ Lasso of all variables above threshold odds ratio score with both drug and ADE of interest
○ Report concrete findings HERE
● Hristovski et al., 2016
○ Used LBD to determine pharmacological and/or pharmacogenomic (given knowledge of
gene/proteins/enzymes on metabolic pathways) explanations for drug-ADE associations in EHR
13
o o o o o o o o o o o o O o o o o o o o o o o o o o o o o o
Related Work, Continued● Other approaches to improving the performance of EHR-based PV avoid the issue
of confounding altogether by combining signal from multiple sources:
○ Harpaz et al., 2013
■ Combined data from multiple sources (FAERS, EHR systems)
○ Girardeau et al., 2016
■ Combined data from multiple sources, including biobank data, so they could do some full
spectrum science with their observational data
○ Li et al., 2015 (report findings)
■ Combined data from confounding adjusted EHR and FAERS (using lasso)
○ Avillach labs: http://avillach-lab.hms.harvard.edu/
■ Avillach Labs at Harvard University Medical School is implementing a “causality in the
cloud” system
14
o o o o o o o o o o o o o O o o o o o o o o o o o o o o o o

Overview of Proposed Research● Terminological services: drug names expanded using RxNorm, ontology mapping for ADEs
● Data:
○ Reference data set: Ryan et al., 2013
○ Clinical data from UTHealth BIG clinical data warehouse (~2.2M free text outpatient
notes), UTHealth BIG, 2016
○ Clinical data from the Mayo Clinic (features for ~3.6M clinical notes), Mayo Clinic,
Rochester, MN, 2016
● Methods:
○ Medication coefficient from logistic regression, odds ratio calculation, Χ2
○ PSI for LBD to identify confounding variables
○ Causal discovery methods
■ Fast Greedy Search (Ramsey, 2015)
■ FCI and GFCI (Zhang, 2006)
15
o o o o o o o o o o o o o o O o o o o o o o o o o o o o o o

Specific Aims
Specific Aim 2
● Lorem ipsum dolor sit amet
● Sed do eiusmod tempor incididunt ut labore
Specific Aim 3
● Lorem ipsum dolor sit amet
● Sed do eiusmod tempor incididunt ut labore
16
Specific Aim 3● Construct causal models using confounding variables that
were derived from SA2 and evaluate accuracy.
o o o o o o o o o o o o o o o O o o o o o o o o o o o o o o
Specific Aim 1
Specific Aim 2
● Use LBD methods to identify confounding variables,
incorporate these into logistic regression models, and
evaluate results for accuracy.
● Establish baseline (unadjusted) scores at the task of
identifying drug-ADE associations from clinical
observational data.

Specific Aim 1
17
o o o o o o o o o o o o o o o o O o o o o o o o o o o o o o
Specific Aim 1
● Establish baseline (unadjusted) scores at the task of
identifying drug-ADE associations from clinical
observational data.
● I will perform necessary pre-processing that will include term expansion and mapping between ontologies for concepts in the Ryan reference set, Ryan et al., 2012, that consists of 4 ADEs and 399 drug-ADE pairs with both positive and negative control groups
● I will extract observational clinical data or request to have data extracted from EHR databases● I will process the observational clinical data (in free text form) with NLP tools that facilitate
concept identification and normalization (e.g., MedLEE, CLAMP)● I will calculate AUC baseline statistics using odds ratios, X2, and medication coefficients from
unadjusted logistic regression models for each drug-ADE pair

Specific Aim 2
18
o o o o o o o o o o o o o o o o o O o o o o o o o o o o o o
Specific Aim 2
● Use LBD methods to identify confounding variables,
incorporate these into logistic regression models, and
evaluate results for accuracy.
● I will use manually-constructed discovery patterns to identify confounding variable candidates in the literature
● These confounders will be incorporated into logistic regression models for each drug-ADE pair in the reference set
● I will calculate the performance based on AUC for each condition and pathway to evaluate performance

Specific Aim 3
19
o o o o o o o o o o o o o o o o o o O o o o o o o o o o o o
Specific Aim 3● Construct causal models using confounding variables that
were derived from SA2 and evaluate accuracy.
● I will use Tetrad and other causal discovery packages to construct causal models using available observational clinical data for each drug-ADE pair in the reference data set while incorporating literature-derived variables
● I will evaluate the resulting models by the directional accuracy of the inferred edges

Preliminary Work
20
o o o o o o o o o o o o o o o o o o o O o o o o o o o o o o
● Specific Aim 1 and 2:
○ Malec, S.A., Wei, P., Xu, H., Bernstam, E.V., Sahiti, S., & Cohen, T. (2016). Literature-based
Discovery of Confounding Variables in Observational Clinical Data. Proceedings of the
AMIA Symposium 2016. (accepted)
● Specific Aim 3:
○ 2016 Summer Short Course on Causal Discovery from Biomedical Data & Causal
Discovery Datathon, Carnegie Mellon University, Pittsburgh, PA, June 13-18
■ I have converted all the the UTHealth data from contingency table format to raw
cast list format
■ Verdict is still out with respect to who won the Datathon

Preliminary Work, Specific Aim 1
21
o o o o o o o o o o o o o o o o o o o o O o o o o o o o o o
UTHealth OR X2 coefficient
AKI 0.5443 0.5482 0.584
ALI 0.54 0.5437 0.5167
GIB 0.5572 0.6735 0.653
AMI 0.5511 0.5417 0.5112
Mayo OR X2 coefficient
AKI 0.5 0.5583 0.5078
ALI 0.678 0.66 0.6813
GIB 0.5743 0.5797 0.579
AMI 0.539 0.577 0.5397
● I performed terminological tasks (e.g., expand drug synonyms using RxNorm)
● I collected data from UTHealth and requested and received data from the Mayo Clinic
● I calculated baseline scores (medication coefficient, odds ratio) from drug-ADE pairs in the
clinical data from UTHealth and the Mayo Clinic
● These results are the foundation of the proposed research
● Limitations: aggregate scores are low in three of the four cases in the UTHealth data and two
of four cases in the Mayo data

Preliminary Results, Specific Aim 2
22
Complete Results Constrained Results
ADE FDP Counts (+/-) Baseline Adjusted Counts (+/-) Baseline Adjusted
AKI Caus 24 / 64 .584 .5853 11 / 13 .6573 .6643
Pred .584 NA NA NA
Tcoe .6126 18 / 40 .6972 .6125
ALI Caus 81 / 37 .5167 .515 44 / 14 .5536 .5568
Pred .5297 50 / 24 .4992 .4825
Tcoe .492 58 / 25 .509 .5303
GIB Caus 24 / 67 .653 .6418 20 / 48 .6073 .5792
Pred .699 20 / 49 .5949 .6571
Tcoe .7189 20 / 50 .5964 .69
AMI Caus 36 / 66 .5112 .5158 24 / 41 .6026 .6148
Pred .5196 30 / 47 .5319 .5574
Tcoe .5032 27 / 45 .5687 .5835
o o o o o o o o o o o o o o o o o o o o o O o o o o o o o o
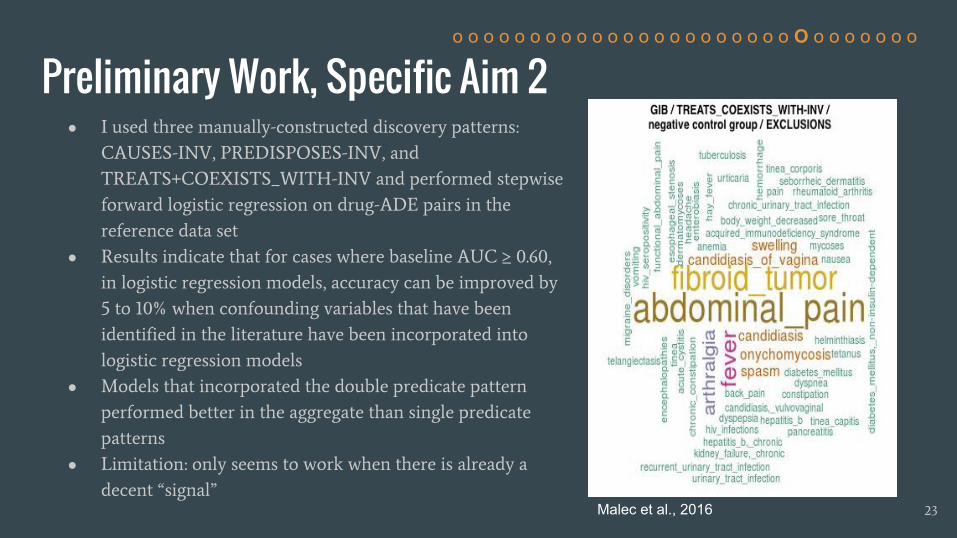
Preliminary Work, Specific Aim 2 ● I used three manually-constructed discovery patterns:
CAUSES-INV, PREDISPOSES-INV, and
TREATS+COEXISTS_WITH-INV and performed stepwise
forward logistic regression on drug-ADE pairs in the
reference data set
● Results indicate that for cases where baseline AUC ≥ 0.60,
in logistic regression models, accuracy can be improved by
5 to 10% when confounding variables that have been
identified in the literature have been incorporated into
logistic regression models
● Models that incorporated the double predicate pattern
performed better in the aggregate than single predicate
patterns
● Limitation: only seems to work when there is already a
decent “signal”
23
o o o o o o o o o o o o o o o o o o o o o o O o o o o o o o
Malec et al., 2016
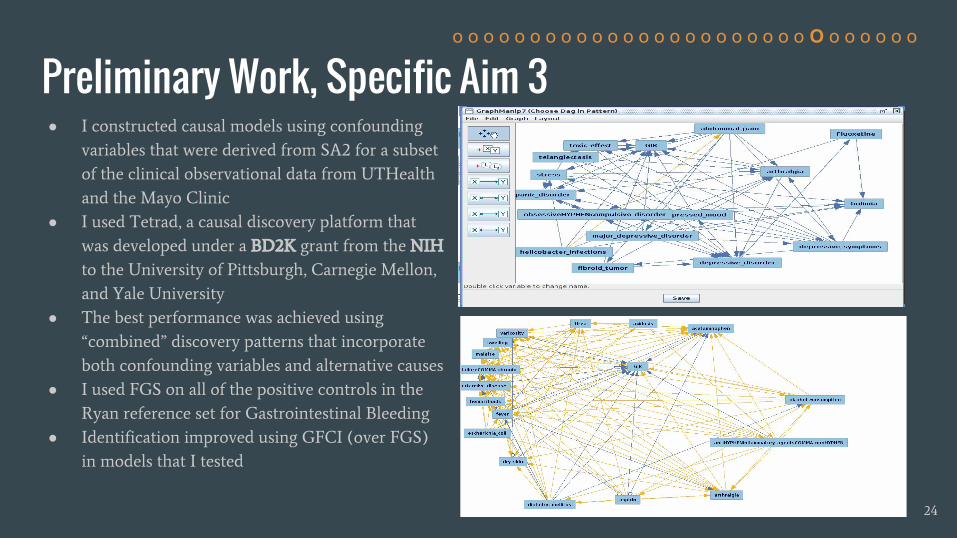
Preliminary Work, Specific Aim 3● I constructed causal models using confounding
variables that were derived from SA2 for a subset
of the clinical observational data from UTHealth
and the Mayo Clinic
● I used Tetrad, a causal discovery platform that
was developed under a BD2K grant from the NIH
to the University of Pittsburgh, Carnegie Mellon,
and Yale University
● The best performance was achieved using
“combined” discovery patterns that incorporate
both confounding variables and alternative causes
● I used FGS on all of the positive controls in the
Ryan reference set for Gastrointestinal Bleeding
● Identification improved using GFCI (over FGS)
in models that I tested
24
o o o o o o o o o o o o o o o o o o o o o o o O o o o o o o
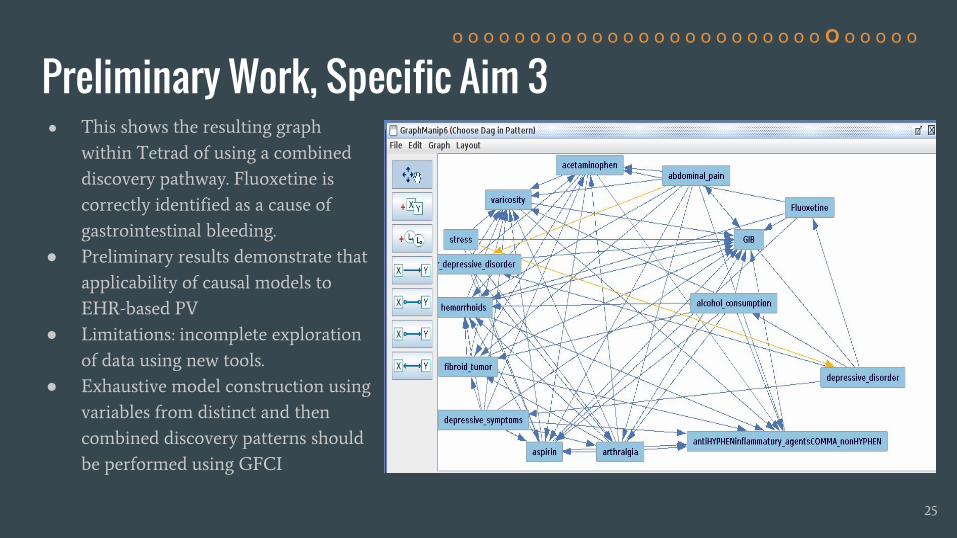
Preliminary Work, Specific Aim 3● This shows the resulting graph
within Tetrad of using a combined
discovery pathway. Fluoxetine is
correctly identified as a cause of
gastrointestinal bleeding.
● Preliminary results demonstrate that
applicability of causal models to
EHR-based PV
● Limitations: incomplete exploration
of data using new tools.
● Exhaustive model construction using
variables from distinct and then
combined discovery patterns should
be performed using GFCI
25
o o o o o o o o o o o o o o o o o o o o o o o o O o o o o o
Unifying Discussion● Obtaining actionable insight from observational data (whether “Big” or small) is notoriously
difficult
● Confounding can be a blessing in disguise, since it allows us to discriminate between mere
correlation and causation
● Confounding may be adjusted for to the extent that it can be identified in statistical models
● Models of observational data are sensitive to the initial assumptions that were held in
creating the model (choose wisely!)
● LBD offers computationally convenient way to identify relevant variables for either
performing statistical adjustments or constructing causal models
● Causal models offer attractive additional component (causal inference from observational
data) to LBD in the quest to create artificial systems that can mimic the very human activity
of abductive reasoning
26
o o o o o o o o o o o o o o o o o o o o o o o o o O o o o o

Alternative Data Sources and Mitigating Methods
27
Problem Solution
Poor PV signal quality Temporal constraints on clinical notes
Poor PV signal quality Cerner Health Fact, structured data
Poor PV signal quality Patient level modeling
Poor PV signal quality Incorporate other data sources with hierarchical Bayesian meta-analysis
Poor PV signal quality Restrict scores to Tisdale drug-ADE subset
More confounding effects are indicated (from GFCI results or general results)
Incorporate variables from inferred discovery patterns into logistic regression (SA1) and causal models (SA2)
To improve results from causal methods Incorporate structure from EpiphaNet (abductive vs inductive reasoning)
More exploration of Bayesian methods indicated
Probabilistic languages: Anglican, Church, Mansinghka et al., 2012, Wood et al., 2015
More computational power is indicated UT Wrangler/Pittsburgh Supercomputing Center: exhaustive lasso and exhaustive highly penalized brute force causal discovery over all variables
o o o o o o o o o o o o o o o o o o o o o o o o o o O o o o

Contributions● Practical Contributions
○ Scalable incorporation of background knowledge into models of observational data
○ Extensible and complementary to other methods
○ Step toward supporting critical clinical review process
○ Improved public health and public finances due to reduced emergency room visitations from
ADEs
● Informatics Contributions
○ The core problem that I propose to address is how to extract insight from large volumes of
observational data using background knowledge
○ Since the scalability and provenance of reasoning/inference is accessible and the target is
web-scale observational data, the proposed method addresses many of the concerns raised
vis-a-vis working with large data sets by M.I. Jordan in the Sackler Colloquium, 2015
● Theoretical Contributions
○ Cognitive plausibility with respect to the manner with which the method simulates the
abductive reasoning process of diagnosticians, Gabbay & Wood, 2006, Thagard, 1999
28
o o o o o o o o o o o o o o o o o o o o o o o o o o o O o o

Aug‘16
Oct‘16
Dec‘16
Feb‘17
Apr‘17
June‘17
Aug‘17
Oct‘17
Specific Aim 1
Specific Aim 1
Timeline
29
Specific Aim 2Use LBD to identify confounders in logistic regression models, then evaluate performance
Specific Aim 3Use variables from SA1 to construct causal models, then evaluate performance
o o o o o o o o o o o o o o o o o o o o o o o o o o o o O o
Specific Aim 1Establish baseline at task of identifying drug-ADE associations in clinical data

The End
Thank [email protected]
30
o o o o o o o o o o o o o o o o o o o o o o o o o o o o o O
This research was supported by US National Library of Medicine grant R01LM011563 and NIH/BD2K supplement R01LM011563-02S1.
Thanks to Hongfang Lu and Majid Rastegar of the Mayo Clinic for contributing data. Additional thanks to Jeremy Espino, MD (University of Pittsburgh) and Elizabeth Silver (Carnegie Mellon University) for their providing insight through discussion and instruction in causal discovery methods at the Center for Causal Discovery workshop and Datathon earlier this year.


![Bayesian Causal Inference - uni-muenchen.de...from causal inference have been attracting much interest recently. [HHH18] propose that causal [HHH18] propose that causal inference stands](https://static.fdocuments.in/doc/165x107/5ec457b21b32702dbe2c9d4c/bayesian-causal-inference-uni-from-causal-inference-have-been-attracting.jpg)