
High%Reliability%Organisa1on%(HRO)% Mindfulness:%Ensuring ...

HRO DashboardNew Dashboard for Quality and Patient Safety Committee
Tara Ruhlen, MPHDirector, Planning and Analysis

CMS Star Rating• CMS Star Rating was developed to help consumers make more informed
decisions about health care by giving them a way to compare hospitals based on quality ratings• Cook County Health is dedicated to making improvements to the patients we serve and
are on the journey of becoming a High Reliability Organization (HRO)• HRO Quality Workgroups have been developed (July 2019) that align with the CMS Star
metrics and performance improvement processes have been developed
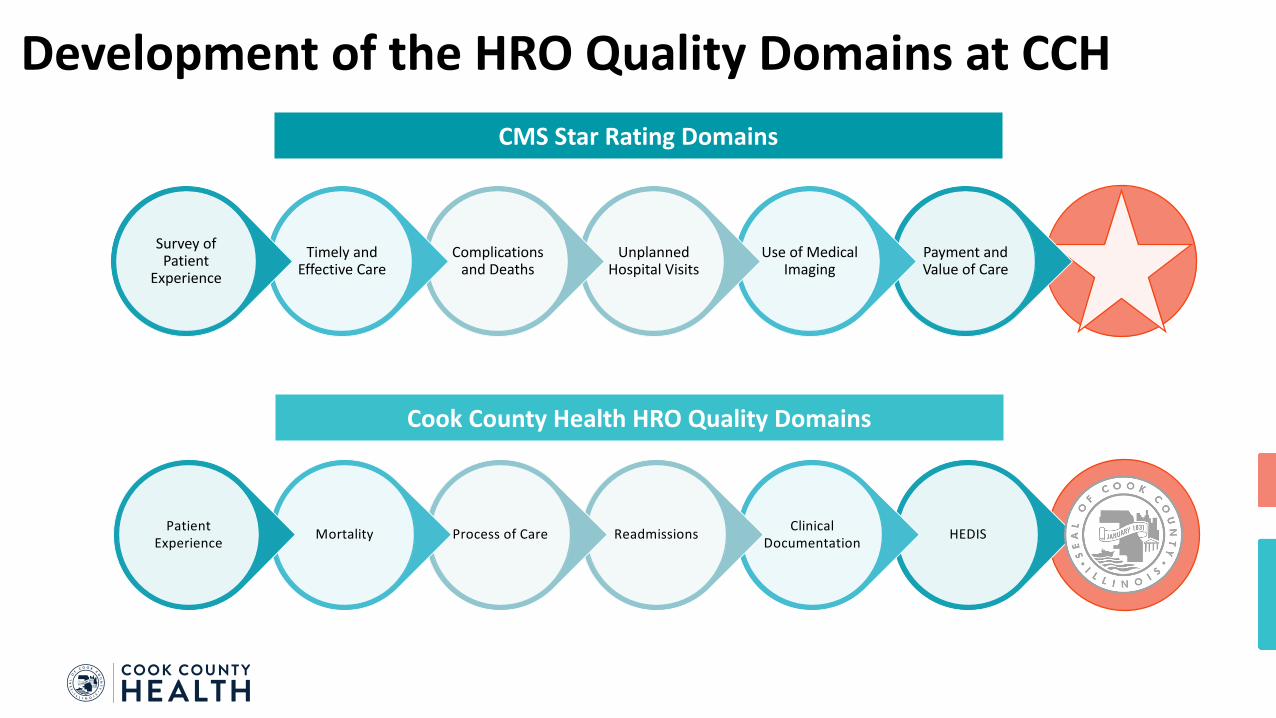
Development of the HRO Quality Domains at CCH
Payment and Value of Care
Use of Medical Imaging
Unplanned Hospital Visits
Complications and Deaths
Timely and Effective Care
Survey of Patient
Experience
HEDISClinical DocumentationReadmissionsProcess of CareMortalityPatient
Experience
CMS Star Rating Domains
Cook County Health HRO Quality Domains

HRO Domain Metric Development• Identified metrics for improvement in the CMS Star Rating reports• What was driving the overall performance score in each CMS domain?• Assigned the main indicators to the HRO Quality Domains
• Internal performance monitoring• Tracked monthly in “real-time” using Vizient Clinical Data Base, Press Ganey (patient
experience), or Business Intelligence (HEDIS)• To help drive change, the monthly data is measured against internal goals and an external
comparison benchmark• 2-year target and stretch goals were set using the SMART principles (specific, measureable, achievable,
realistic, time based)• The external benchmarking helps to provide realistic targets, define areas of best practice, and identify
areas of opportunity
4

Reporting Period for CMS vs HRO WorkgroupsJuly 2020 CMS Star Report
Formation of the HRO workgroups
Metric Group Timeframe 2016 Q3
2016 Q4
2017 Q1
2017 Q2
2017 Q3
2017 Q4
2018 Q1
2018 Q2
2018 Q3
2018 Q4
2019 Q1
2019 Q2
2019 Q3
2019 Q4
Readmissions July 1, 2016 – June 30, 2019
Excess Days of Acute Care July 1, 2016 – June 30, 2019
Mortality July 1, 2016 – June 30, 2019
PSI-90 July 1, 2017 – June 30, 2019
Patient Experience October 1, 2018 – September 30, 2019
Sepsis October 1, 2018 – September 30, 2019
ED Throughput October 1, 2018 – September 30, 2019
Hospital Acquired Infections October 1, 2018 – September 30, 2019

HRO Quality Domain Metrics
Mortality
• Mortality Index
Readmissions
• 30-Day Unplanned Readmission Rate
Process of Care
• Rate of Excess Days in Acute Care
• Hospital Acquired Conditions Preventable Harm Index
• PSI-90
• ED Left without Being Seen
Patient Experience
• HCAHPS Willingness to Recommend
• HCAHPS Nurse Communication
Clinical Documentation
• Case Mix Index
• CC/MCC Capture Rate
HEDIS
• Diabetes Management (HgbA1c <8%)
• Childhood Immunization Status (Combo 3)
6*identified drivers of, and the supporting metrics to, the CMS Star Rating for Stroger Hospital
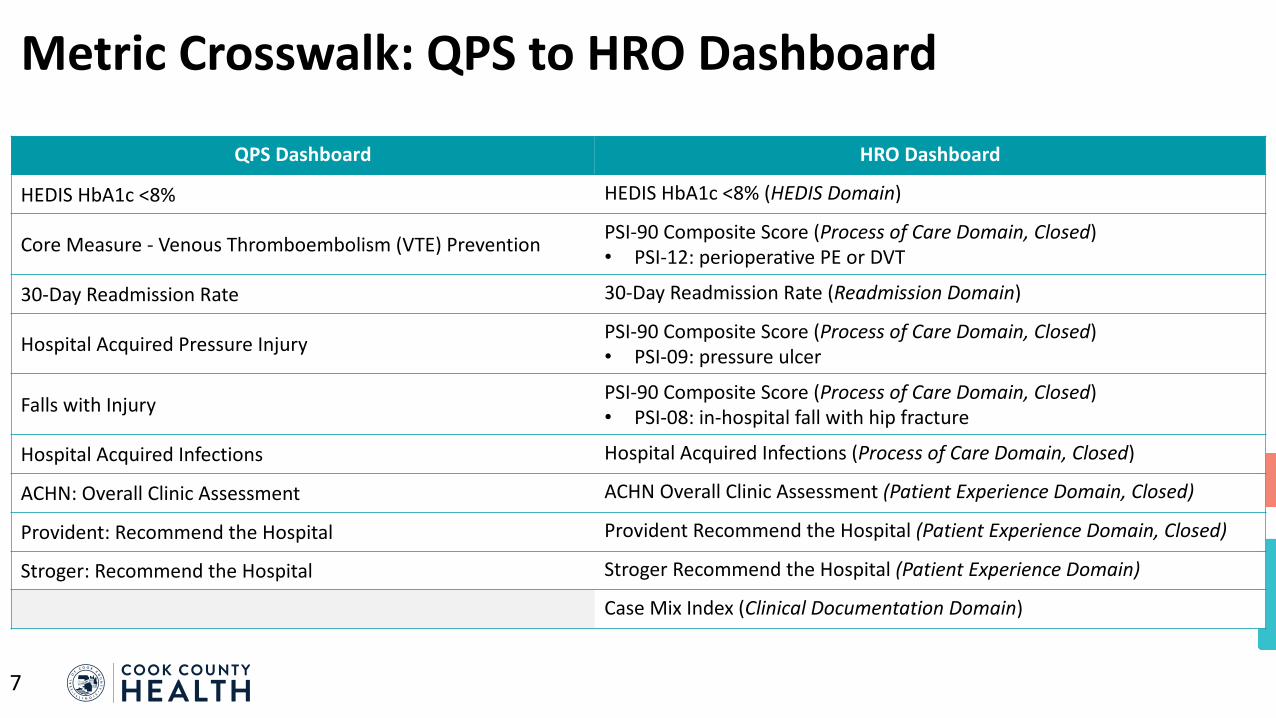
Metric Crosswalk: QPS to HRO Dashboard
QPS Dashboard HRO Dashboard
HEDIS HbA1c <8% HEDIS HbA1c <8% (HEDIS Domain)
Core Measure - Venous Thromboembolism (VTE) Prevention PSI-90 Composite Score (Process of Care Domain, Closed)• PSI-12: perioperative PE or DVT
30-Day Readmission Rate 30-Day Readmission Rate (Readmission Domain)
Hospital Acquired Pressure Injury PSI-90 Composite Score (Process of Care Domain, Closed)• PSI-09: pressure ulcer
Falls with Injury PSI-90 Composite Score (Process of Care Domain, Closed)• PSI-08: in-hospital fall with hip fracture
Hospital Acquired Infections Hospital Acquired Infections (Process of Care Domain, Closed)
ACHN: Overall Clinic Assessment ACHN Overall Clinic Assessment (Patient Experience Domain, Closed)
Provident: Recommend the Hospital Provident Recommend the Hospital (Patient Experience Domain, Closed)
Stroger: Recommend the Hospital Stroger Recommend the Hospital (Patient Experience Domain)
Case Mix Index (Clinical Documentation Domain)
7

Readmission Domain
8
• Patient unplanned admission to Stroger within 30 days after being discharged from an earlier hospital stay at Stroger• All-cause, same-hospital readmissions• Excludes patients with planned readmissions; psychiatric
patients, admitted for rehabilitation, medical treatment for cancer, dialysis, or delivery/birth
• Data Source: Vizient Clinical Data Base
Stroger 30-Day Readmission Rate
Baseline Target Stretch
9.73% 8.56% (-12%) 8.27% (-15%)Baseline Period: July 2017 to June 2018

Clinical Documentation Domain
9
• Average relative DRG weight of a Stroger’s inpatient discharges, calculated by summing the Medicare Severity-Diagnosis Related Group (MS-DRG) weight for each discharge and dividing by the total number of discharges• All inpatient discharges from Stroger• Medical MS-DRG: no OR procedure is performed;
Surgical MS-DRG: an OR procedure is performed• Data Source: Vizient Clinical Data Base
Stroger Case Mix Index (Medical MS-DRG, Surgical MS-DRG)
Baseline Target Stretch
Medical MS-DRG 1.2147 1.2460 (2.6%) 1.2750 (5.0%)
Surgical MS-DRG 2.6949 3.0600 (13.5%) 3.1300 (16.1%)Baseline Period: January 2019 to December 2019

Patient Experience Domain
10
• Percent of patient responses with “Definitely Yes” (top box response) for “Recommend the Hospital” item in HCAHPS survey for Stroger• Utilizes CAHPS methodology for population inclusion• Data Source: Press Ganey
Stroger Recommend the Hospital (HCAHPS)
Baseline Target Stretch
69.90 71.30 (2%) 73.30 (5.4%)Baseline Period: July 2017 to June 2018

HEDIS Domain
11
• Percent of adults (ages 18-75) with diabetes Type 1 or Type 2 where HbA1c is in control (<8.0%)• Population included: (Age 18-75 years as of December
31 of current year AND two diabetic Outpatient/ED visits in the current year or previous year) OR (One diabetic Inpatient visit in the current year or previous year) OR(Prescribed insulin or hypoglycemic or anti-hyperglycemics in the current year or previous year)
• Data Source: NCQA, HEDIS, Business Intelligence
HbA1c <8%
Baseline Target
48.1% 57.6% (75th Percentile)Baseline Period: January 2018 to December 2018

12