
HPS - High Efficiency Transformers (Confidential) · energy efficiency standards outlined by NEMA...
49
HPS High Efficiency Transformers October 2012
-
Upload
phungthien -
Category
Documents
-
view
215 -
download
0
Transcript of HPS - High Efficiency Transformers (Confidential) · energy efficiency standards outlined by NEMA...
HPS High Efficiency Transformers
October 2012
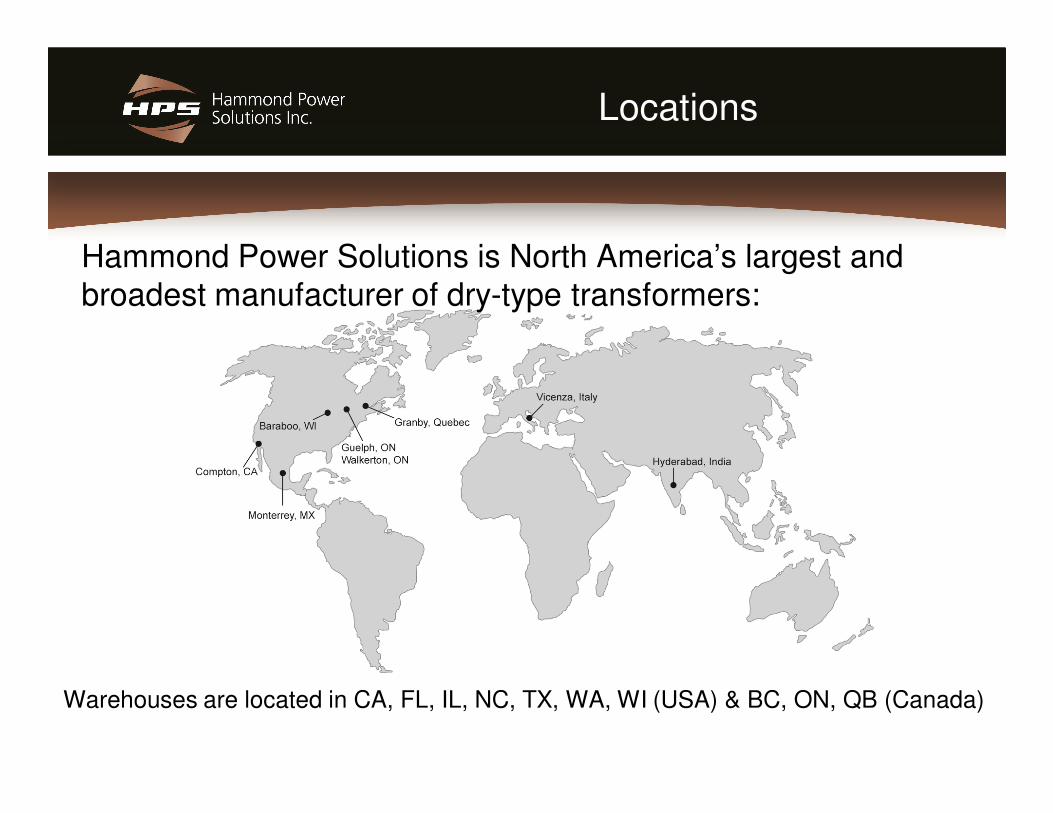
Locations
Hammond Power Solutions is North America’s largest and broadest manufacturer of dry-type transformers:
Warehouses are located in CA, FL, IL, NC, TX, WA, WI (USA) & BC, ON, QB (Canada)

Contact & Technical Information
Canada:
Tel: 519-822-2441 / Fax: 519-822-9701
United States:
Tel: 608-356-3921 / Fax: 608-355-7623)
Efficiency: Why A Transformer is Different
Judging the savings of an efficient transformer is different than other products for three major reasons.
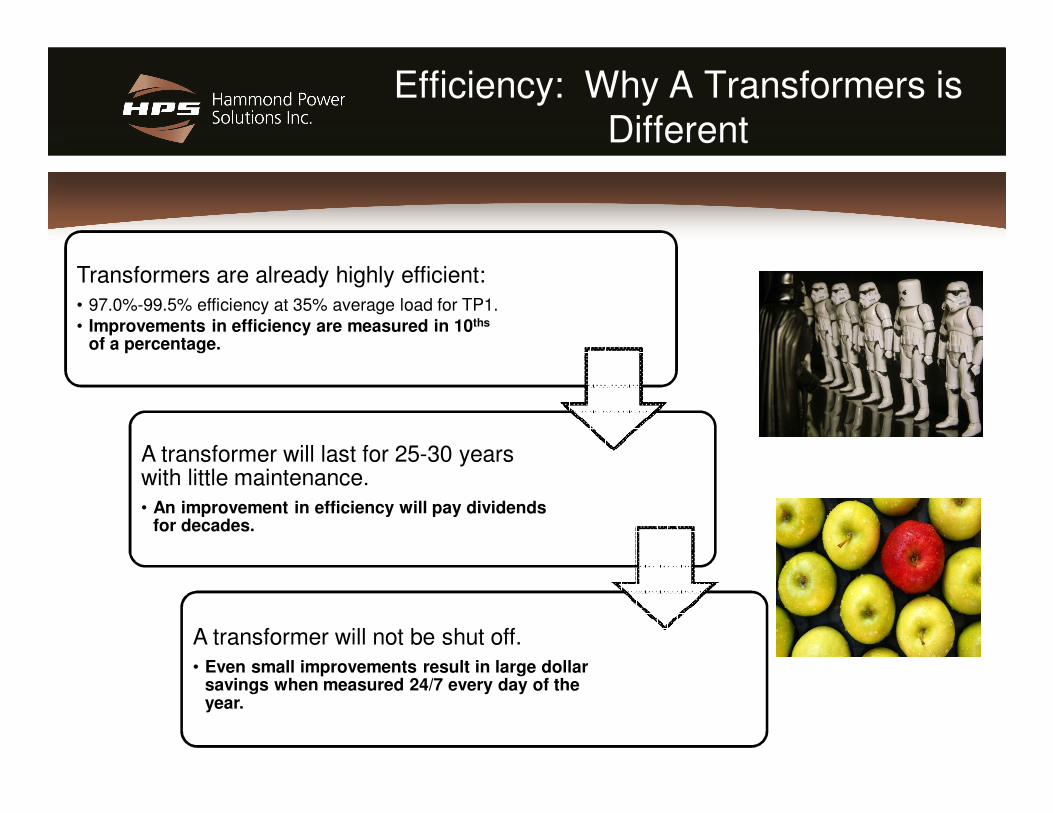
Efficiency: Why A Transformers is Different
Transformers are already highly efficient:
• 97.0%-99.5% efficiency at 35% average load for TP1. • Improvements in efficiency are measured in 10ths
of a percentage.
A transformer will last for 25-30 years with little maintenance.
• An improvement in efficiency will pay dividends for decades.
A transformer will not be shut off.
• Even small improvements result in large dollar savings when measured 24/7 every day of the year.

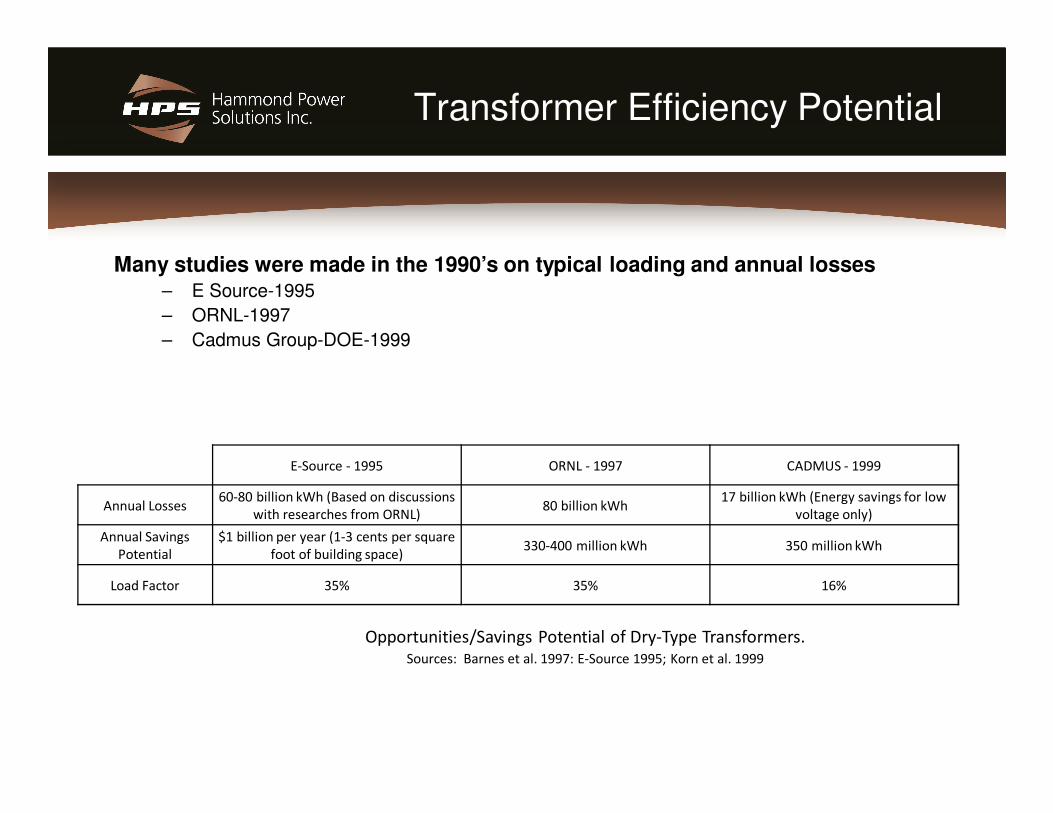
Transformer Efficiency Potential
Many studies were made in the 1990’s on typical loading and annual losses– E Source-1995
– ORNL-1997
– Cadmus Group-DOE-1999
E-Source - 1995 ORNL - 1997 CADMUS - 1999
Annual Losses60-80 billion kWh (Based on discussions
with researches from ORNL)80 billion kWh
17 billion kWh (Energy savings for low
voltage only)
Annual Savings
Potential
$1 billion per year (1-3 cents per square
foot of building space)330-400 million kWh 350 million kWh
Load Factor 35% 35% 16%
Opportunities/Savings Potential of Dry-Type Transformers.Sources: Barnes et al. 1997: E-Source 1995; Korn et al. 1999
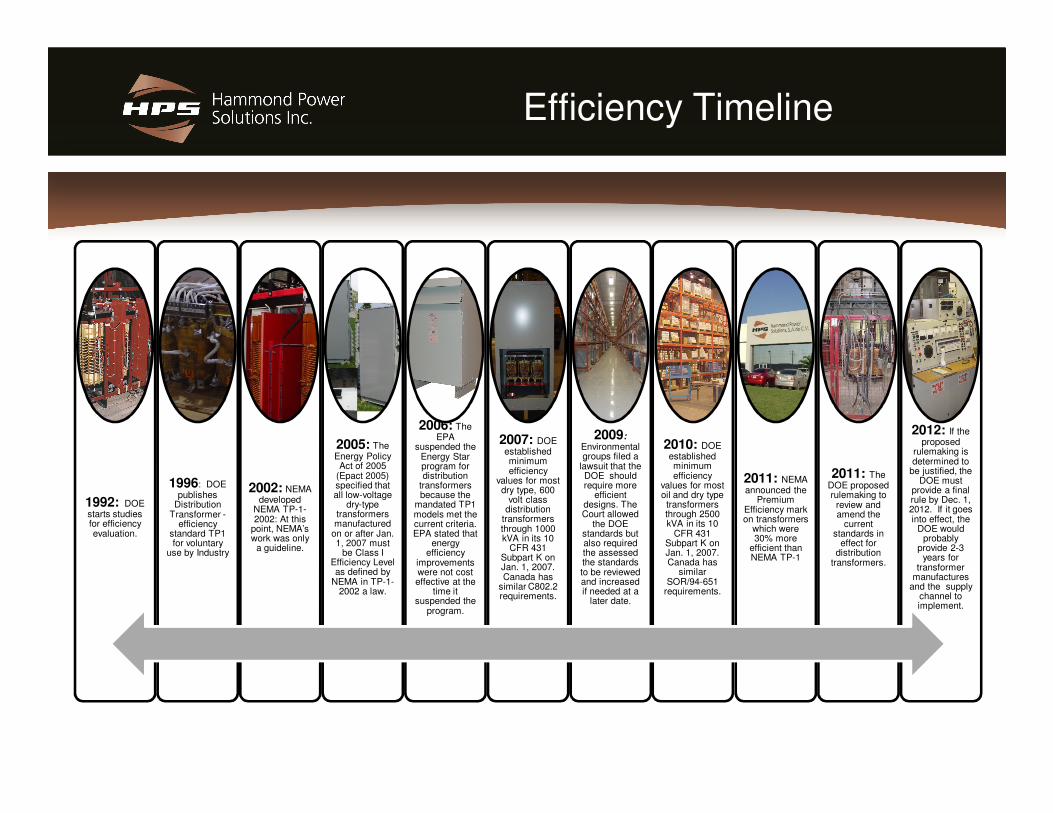
Efficiency Timeline
1992: DOE starts studies for efficiency evaluation.
1996: DOE publishes
Distribution Transformer -
efficiency standard TP1 for voluntary
use by Industry
2002: NEMA developed
NEMA TP-1-2002: At this
point, NEMA’s work was only
a guideline.
2005: The Energy Policy Act of 2005
(Epact 2005) specified that all low-voltage
dry-type transformers manufactured
on or after Jan. 1, 2007 must
be Class I Efficiency Level as defined by
NEMA in TP-1-2002 a law.
2006: The EPA
suspended the Energy Star program for distribution
transformers because the
mandated TP1 models met the current criteria. EPA stated that
energy efficiency
improvements were not cost effective at the
time it suspended the
program.
2007: DOE established minimum efficiency
values for most dry type, 600
volt class distribution
transformers through 1000 kVA in its 10
CFR 431 Subpart K on Jan. 1, 2007. Canada has
similar C802.2 requirements.
2009: Environmental groups filed a
lawsuit that the DOE should require more
efficient designs. The Court allowed
the DOE standards but also required the assessed the standards to be reviewed and increased if needed at a
later date.
2010: DOE established minimum efficiency
values for most oil and dry type transformers through 2500 kVA in its 10
CFR 431 Subpart K on Jan. 1, 2007. Canada has
similar SOR/94-651
requirements.
2011: NEMA announced the
Premium Efficiency mark on transformers
which were 30% more
efficient than NEMA TP-1
2011: The DOE proposed rulemaking to
review and amend the
current standards in
effect for distribution
transformers.
2012: If the proposed
rulemaking is determined to
be justified, the DOE must
provide a final rule by Dec. 1, 2012. If it goes into effect, the
DOE would probably
provide 2-3 years for
transformer manufactures
and the supply channel to implement.
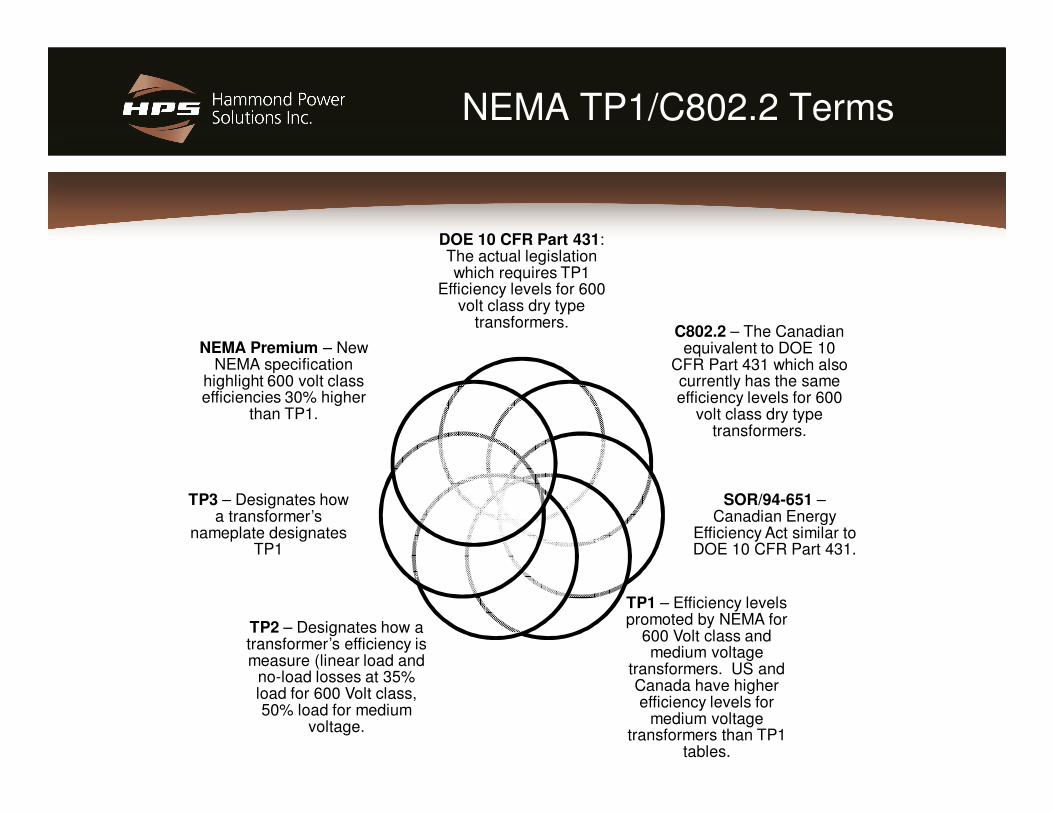
NEMA TP1/C802.2 Terms
DOE 10 CFR Part 431: The actual legislation which requires TP1
Efficiency levels for 600 volt class dry type
transformers.C802.2 – The Canadian
equivalent to DOE 10 CFR Part 431 which also currently has the same efficiency levels for 600
volt class dry type transformers.
SOR/94-651 –Canadian Energy
Efficiency Act similar to DOE 10 CFR Part 431.
TP1 – Efficiency levels promoted by NEMA for
600 Volt class and medium voltage
transformers. US and Canada have higher efficiency levels for
medium voltage transformers than TP1
tables.
TP2 – Designates how a transformer’s efficiency is measure (linear load and
no-load losses at 35% load for 600 Volt class, 50% load for medium
voltage.
TP3 – Designates how a transformer’s
nameplate designates TP1
NEMA Premium – New NEMA specification
highlight 600 volt class efficiencies 30% higher
than TP1.
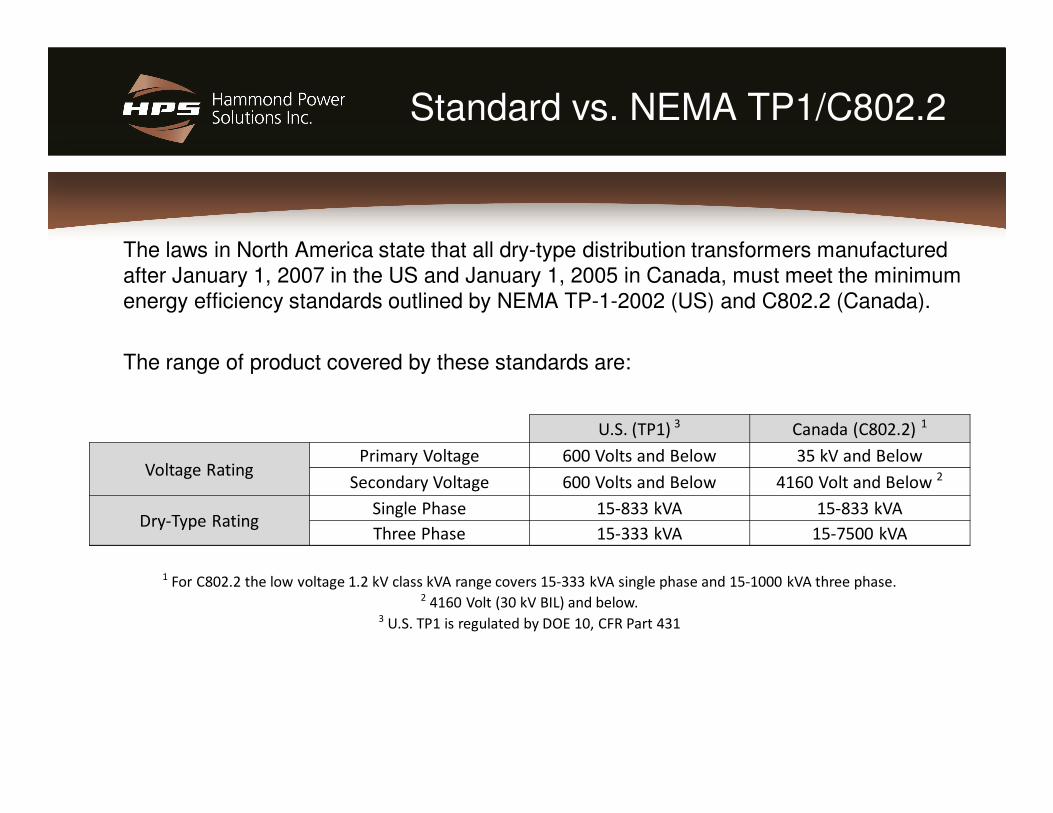
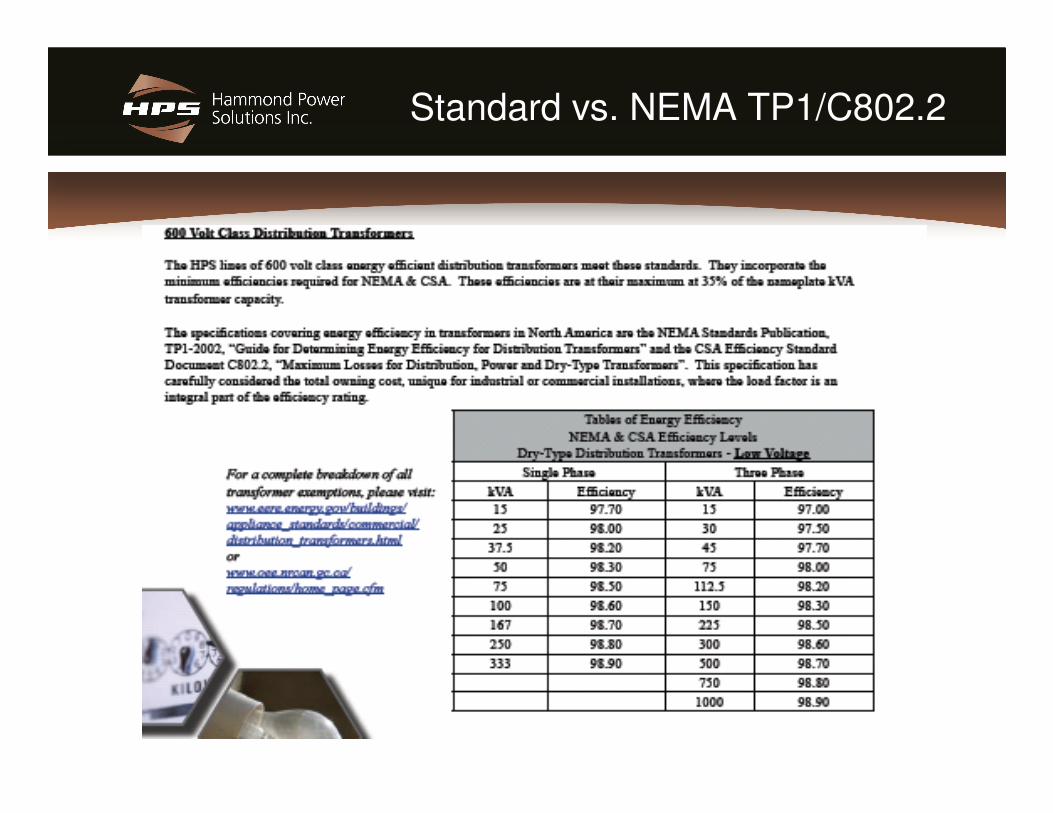
Standard vs. NEMA TP1/C802.2
The laws in North America state that all dry-type distribution transformers manufactured after January 1, 2007 in the US and January 1, 2005 in Canada, must meet the minimum energy efficiency standards outlined by NEMA TP-1-2002 (US) and C802.2 (Canada).
The range of product covered by these standards are:
U.S. (TP1) 3 Canada (C802.2) 1
Voltage RatingPrimary Voltage 600 Volts and Below 35 kV and Below
Secondary Voltage 600 Volts and Below 4160 Volt and Below 2
Dry-Type RatingSingle Phase 15-833 kVA 15-833 kVA
Three Phase 15-333 kVA 15-7500 kVA
1 For C802.2 the low voltage 1.2 kV class kVA range covers 15-333 kVA single phase and 15-1000 kVA three phase.2 4160 Volt (30 kV BIL) and below.
3 U.S. TP1 is regulated by DOE 10, CFR Part 431
Standard vs. NEMA TP1/C802.2
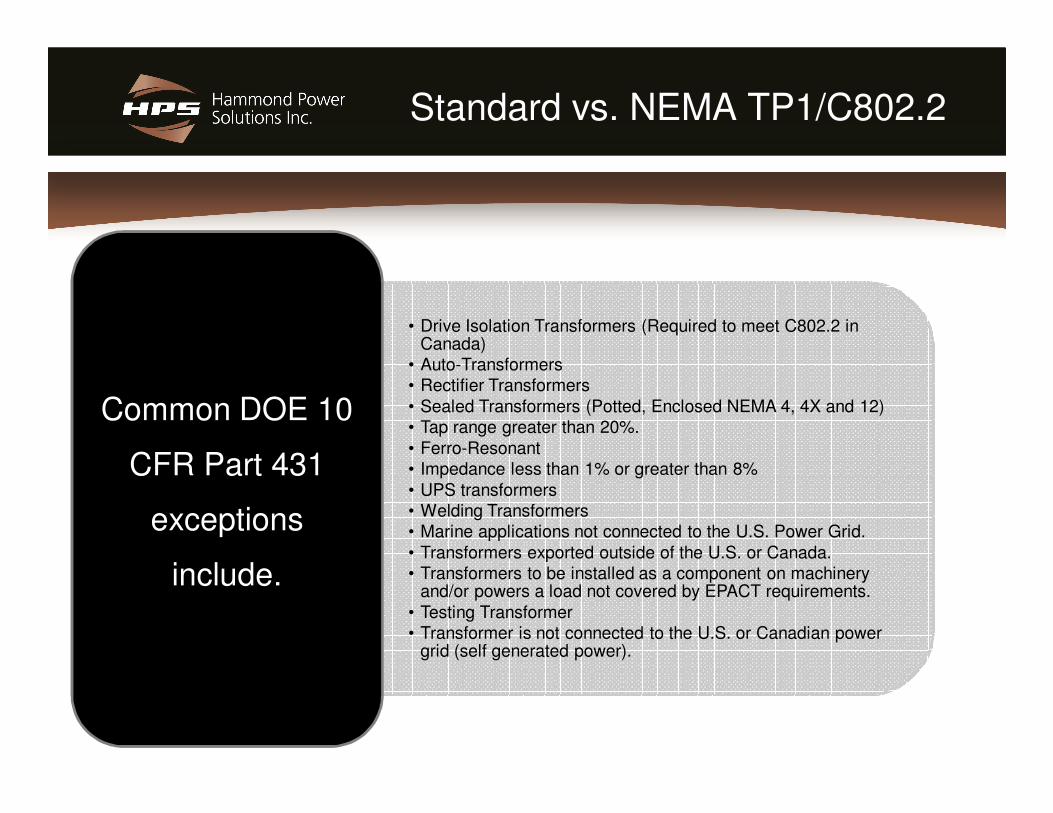
Standard vs. NEMA TP1/C802.2
• Drive Isolation Transformers (Required to meet C802.2 in Canada)
• Auto-Transformers• Rectifier Transformers• Sealed Transformers (Potted, Enclosed NEMA 4, 4X and 12)• Tap range greater than 20%.• Ferro-Resonant• Impedance less than 1% or greater than 8%• UPS transformers• Welding Transformers• Marine applications not connected to the U.S. Power Grid.• Transformers exported outside of the U.S. or Canada.• Transformers to be installed as a component on machinery
and/or powers a load not covered by EPACT requirements.• Testing Transformer• Transformer is not connected to the U.S. or Canadian power
grid (self generated power).
Common DOE 10
CFR Part 431
exceptions
include.
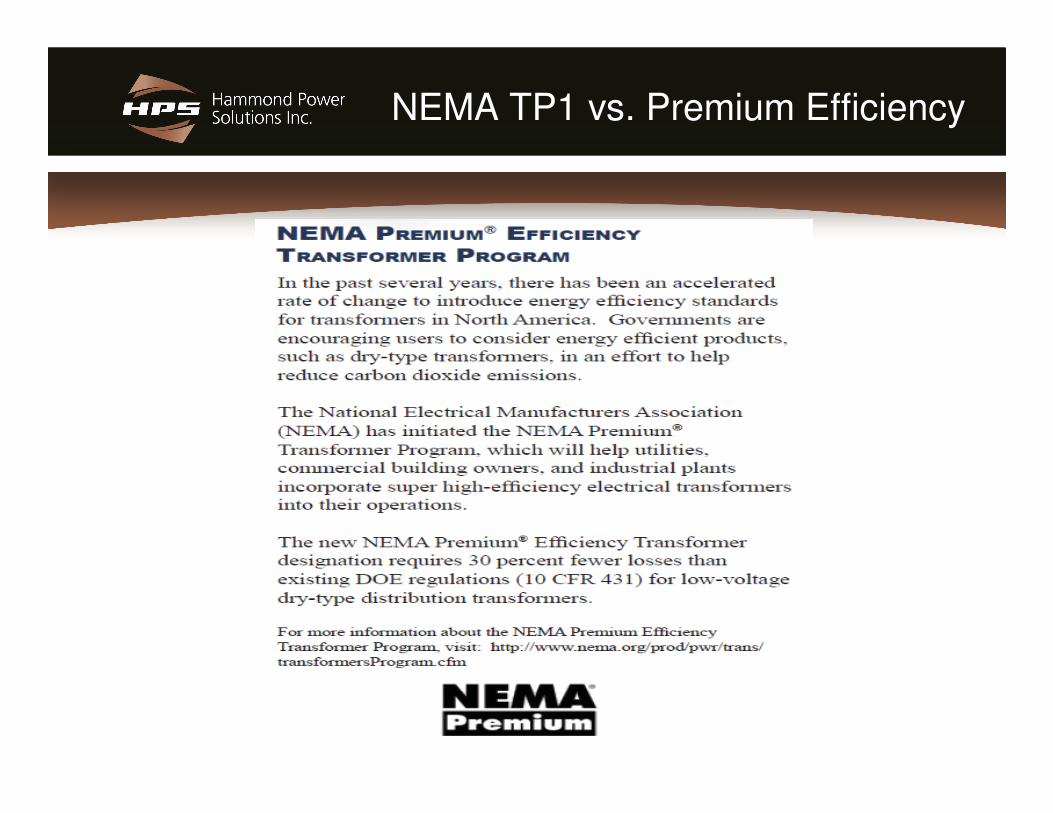
NEMA TP1 vs. Premium Efficiency
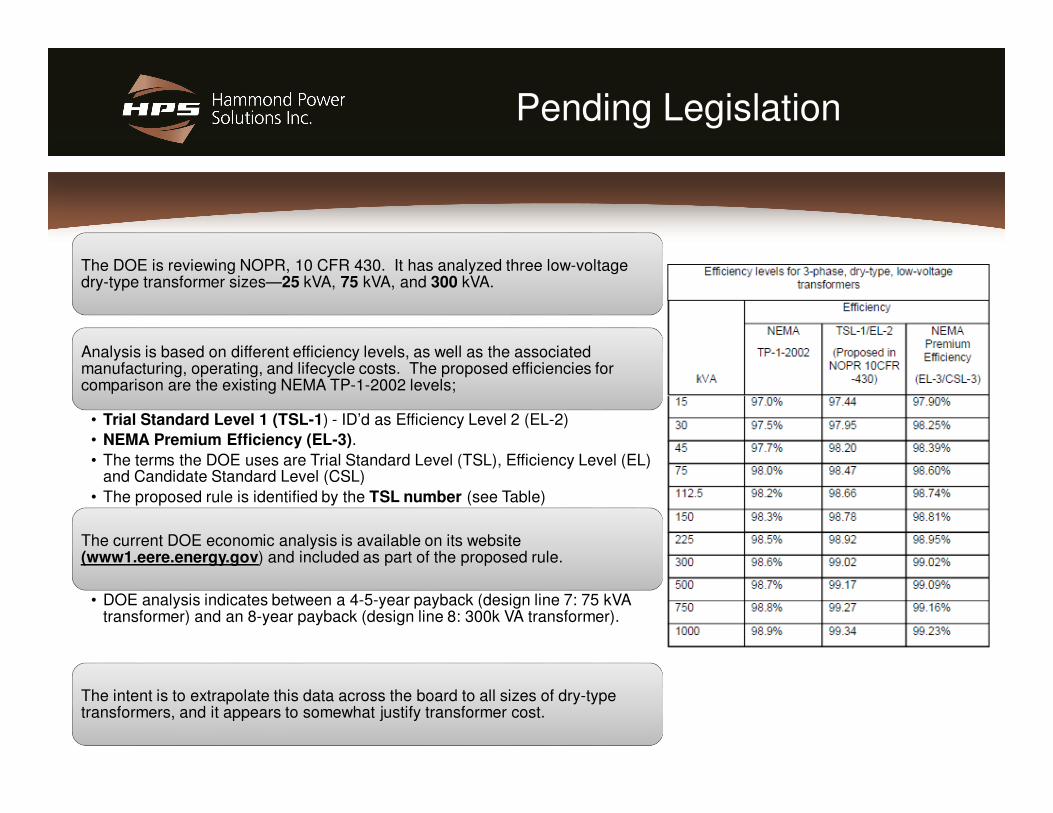
Pending Legislation
The DOE is reviewing NOPR, 10 CFR 430. It has analyzed three low-voltage dry-type transformer sizes—25 kVA, 75 kVA, and 300 kVA.
Analysis is based on different efficiency levels, as well as the associated manufacturing, operating, and lifecycle costs. The proposed efficiencies for comparison are the existing NEMA TP-1-2002 levels;
• Trial Standard Level 1 (TSL-1) - ID’d as Efficiency Level 2 (EL-2)
• NEMA Premium Efficiency (EL-3).
• The terms the DOE uses are Trial Standard Level (TSL), Efficiency Level (EL) and Candidate Standard Level (CSL)
• The proposed rule is identified by the TSL number (see Table)
The current DOE economic analysis is available on its website (www1.eere.energy.gov) and included as part of the proposed rule.
• DOE analysis indicates between a 4-5-year payback (design line 7: 75 kVA transformer) and an 8-year payback (design line 8: 300k VA transformer).
The intent is to extrapolate this data across the board to all sizes of dry-type transformers, and it appears to somewhat justify transformer cost.
NEMA Premium vs. CSL-3 Efficiency
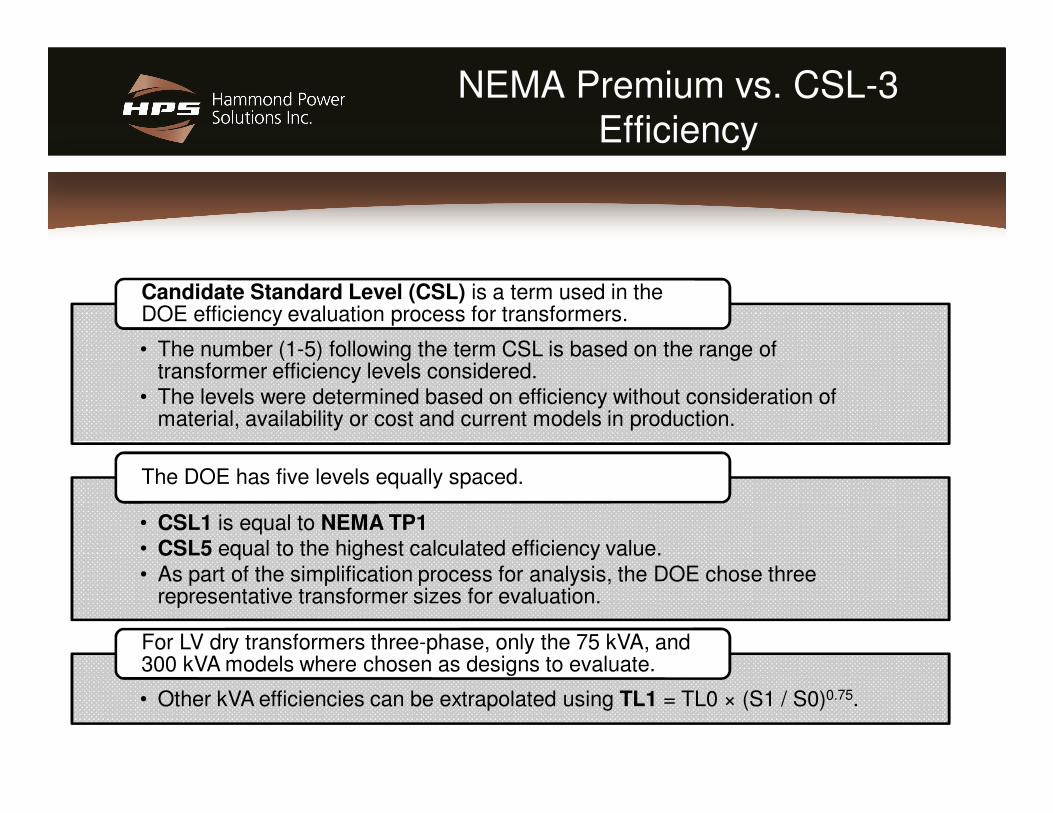
• The number (1-5) following the term CSL is based on the range of transformer efficiency levels considered.
• The levels were determined based on efficiency without consideration of material, availability or cost and current models in production.
Candidate Standard Level (CSL) is a term used in the DOE efficiency evaluation process for transformers.
• CSL1 is equal to NEMA TP1• CSL5 equal to the highest calculated efficiency value. • As part of the simplification process for analysis, the DOE chose three
representative transformer sizes for evaluation.
The DOE has five levels equally spaced.
• Other kVA efficiencies can be extrapolated using TL1 = TL0 × (S1 / S0)0.75.
For LV dry transformers three-phase, only the 75 kVA, and 300 kVA models where chosen as designs to evaluate.
NEMA Premium vs. CSL-3 Efficiency
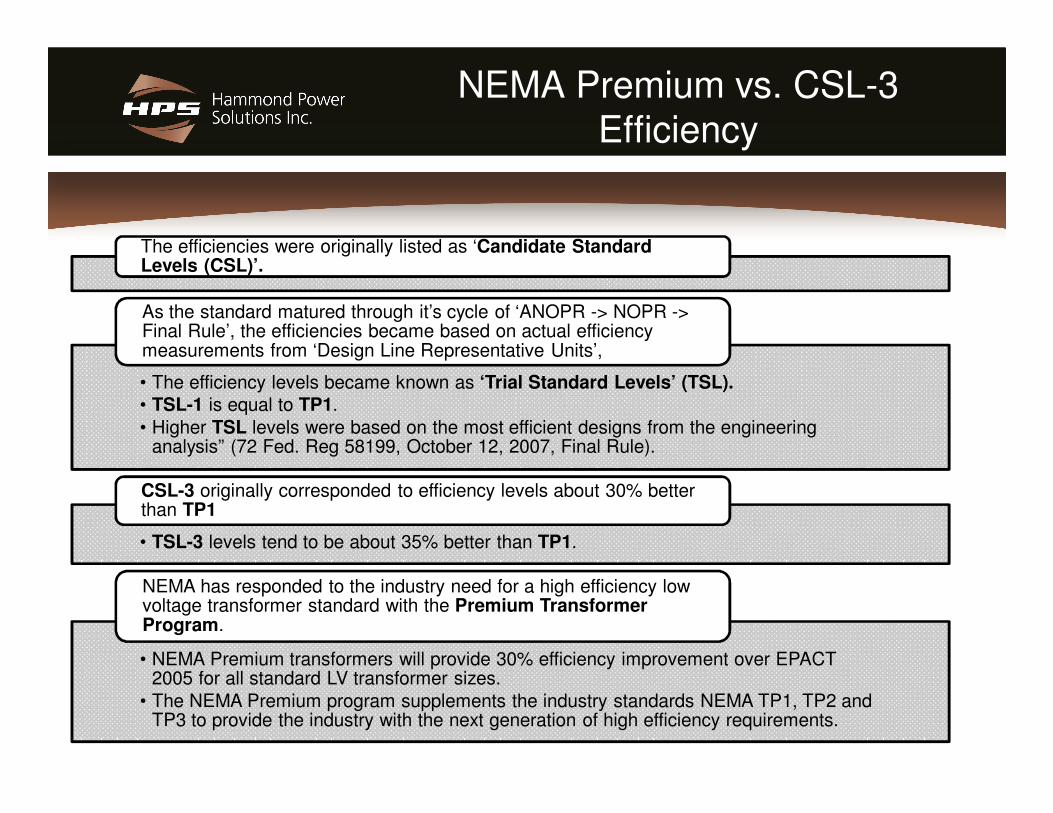
The efficiencies were originally listed as ‘Candidate Standard Levels (CSL)’.
• The efficiency levels became known as ‘Trial Standard Levels’ (TSL).• TSL-1 is equal to TP1. • Higher TSL levels were based on the most efficient designs from the engineering
analysis” (72 Fed. Reg 58199, October 12, 2007, Final Rule).
As the standard matured through it’s cycle of ‘ANOPR -> NOPR -> Final Rule’, the efficiencies became based on actual efficiency measurements from ‘Design Line Representative Units’,
• TSL-3 levels tend to be about 35% better than TP1.
CSL-3 originally corresponded to efficiency levels about 30% better than TP1
• NEMA Premium transformers will provide 30% efficiency improvement over EPACT 2005 for all standard LV transformer sizes.
• The NEMA Premium program supplements the industry standards NEMA TP1, TP2 and TP3 to provide the industry with the next generation of high efficiency requirements.
NEMA has responded to the industry need for a high efficiency low voltage transformer standard with the Premium Transformer Program.

Types of Losses
Load is important to determine efficiency and calculating losses. 600 Volt Class units are tested using a resistive 35% load with a sinusoidal input per TP2. Medium voltage is tested at a 50% load.
No-load losses (Core) occur in the core, are
mainly caused by hysteresis and eddy
currents and are independent of the load. No-Load Test: With the
secondary winding open circuited, rated voltage at rated frequency is applied
to the primary winding, and the power input is
equal to the no-load loss.
Load losses (I2R) vary by the loading and occur in
the coils. Load Loss Test: With the secondary short-circuited, reduced voltage is applied to the primary sufficient to drive rated
current through the windings, and the power input is equal to the load
loss.
Types of Losses
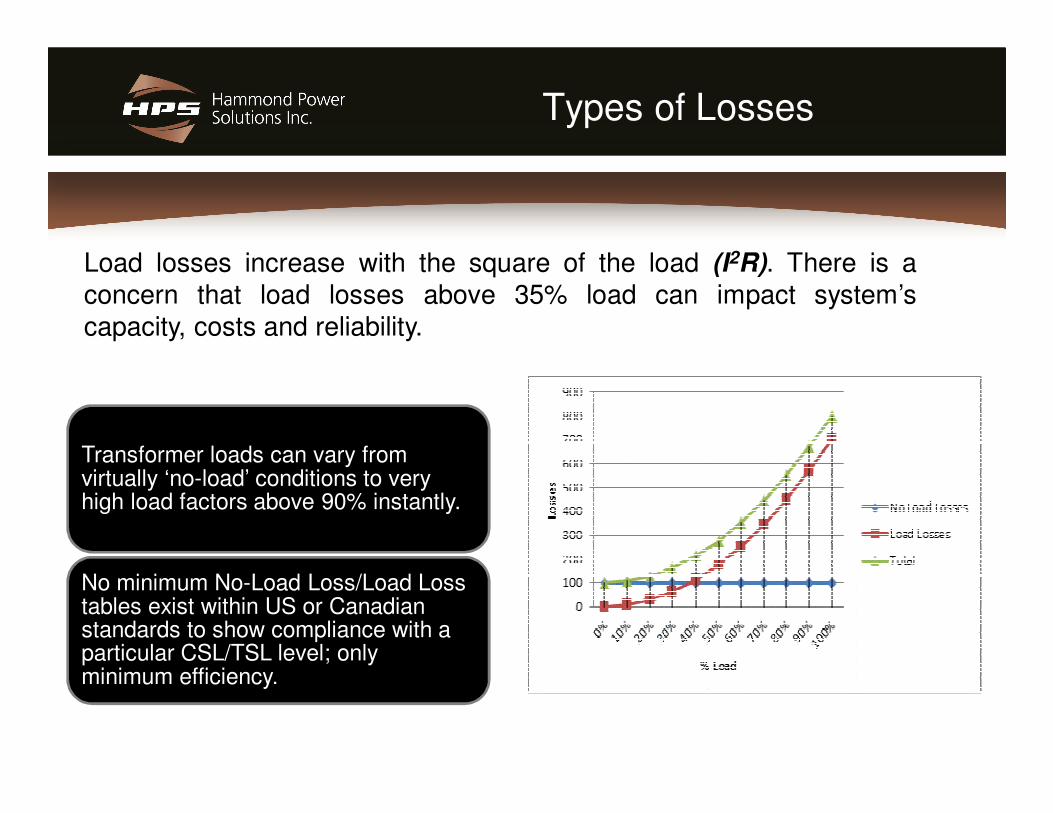
Load losses increase with the square of the load (I2R). There is aconcern that load losses above 35% load can impact system’scapacity, costs and reliability.
Transformer loads can vary from virtually ‘no-load’ conditions to very high load factors above 90% instantly.
No minimum No-Load Loss/Load Loss tables exist within US or Canadian standards to show compliance with a particular CSL/TSL level; only minimum efficiency.
Types of Losses
• This is more economical than trying to reduce conductor losses. • AL and CU coils have similar efficiency.
Manufacturers typically reduce the no-load core losses when transformer efficiency is measured at 35% load.
• Use thinner and/or grain oriented core steel• Gapped cores, mitered cores and step-lap core construction.• Low Temperature Rise transformers may be less efficient at lower loads
where transformers often operate because of their larger cores.
Manufactures use a variety of techniques for no-load losses:
Specifications should specify an efficiency level, let the manufacturer determine the best design method to achieve it.
Outside Affects on Efficiency
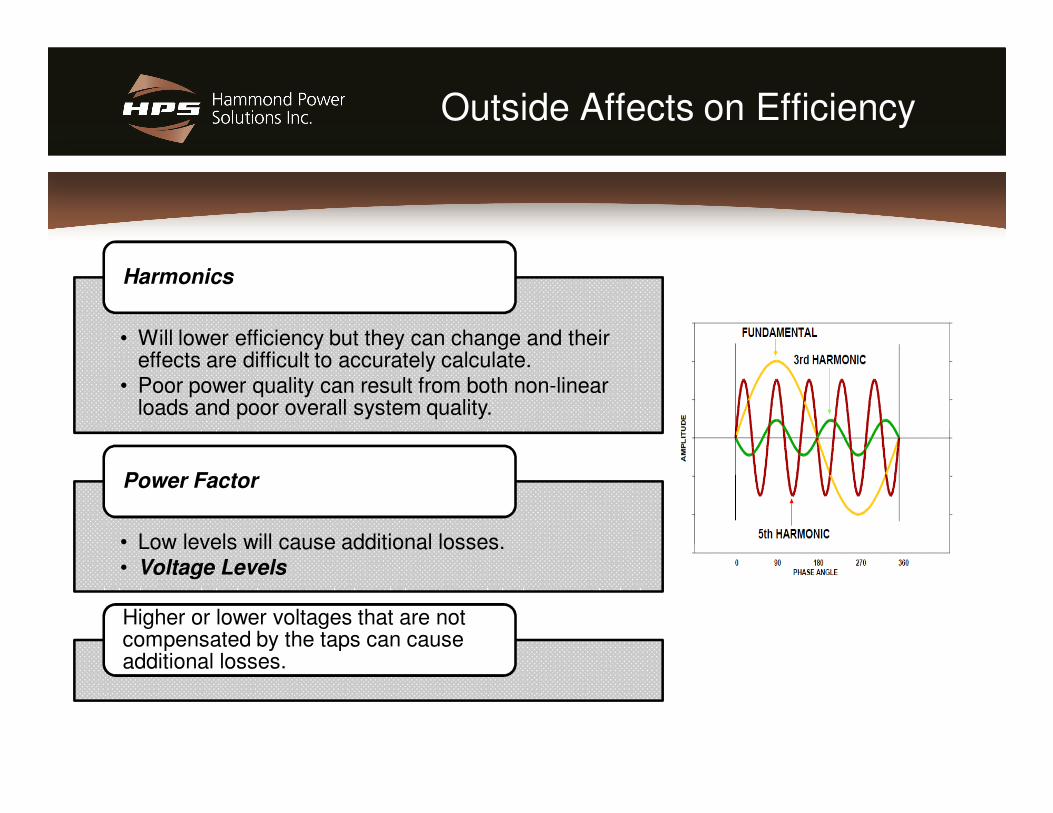
• Will lower efficiency but they can change and their effects are difficult to accurately calculate.
• Poor power quality can result from both non-linear loads and poor overall system quality.
Harmonics
• Low levels will cause additional losses.• Voltage Levels
Power Factor
Higher or lower voltages that are not compensated by the taps can cause additional losses.
Outside Affects on Efficiency
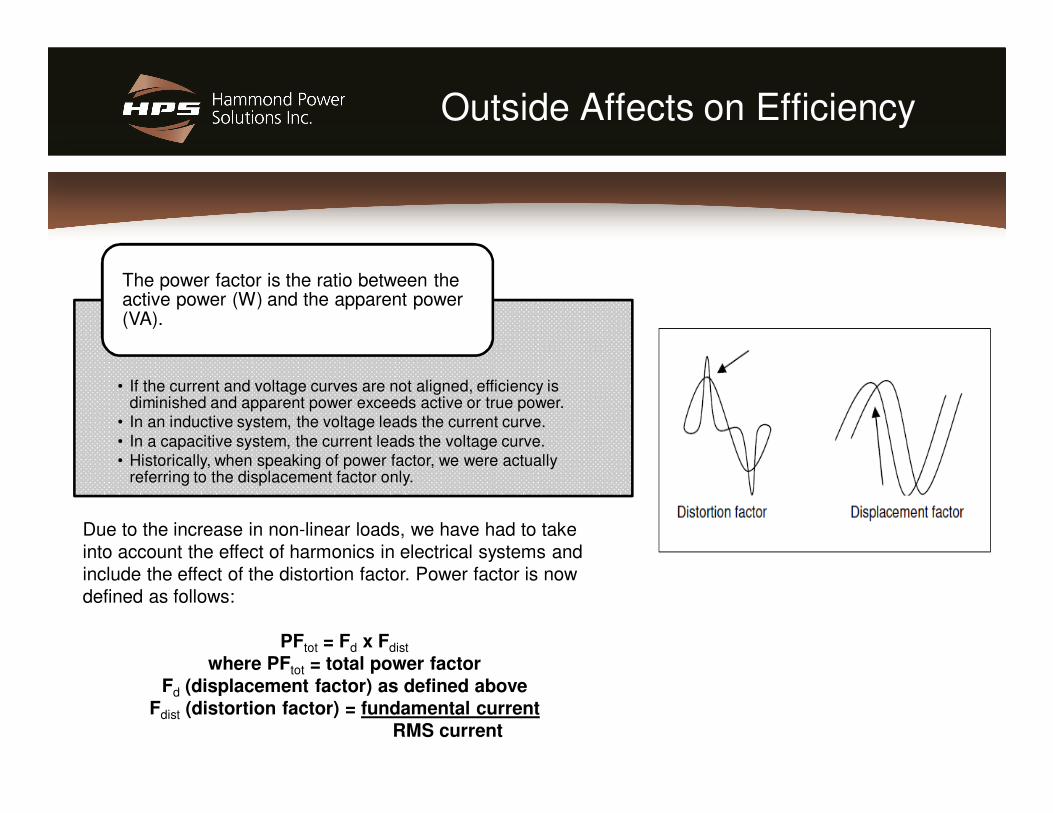
• If the current and voltage curves are not aligned, efficiency is diminished and apparent power exceeds active or true power.
• In an inductive system, the voltage leads the current curve. • In a capacitive system, the current leads the voltage curve. • Historically, when speaking of power factor, we were actually
referring to the displacement factor only.
The power factor is the ratio between the active power (W) and the apparent power (VA).
Due to the increase in non-linear loads, we have had to take into account the effect of harmonics in electrical systems and include the effect of the distortion factor. Power factor is now defined as follows:
PFtot = Fd x Fdist
where PFtot = total power factorFd (displacement factor) as defined above
Fdist (distortion factor) = fundamental currentRMS current
Outside Affects on Efficiency
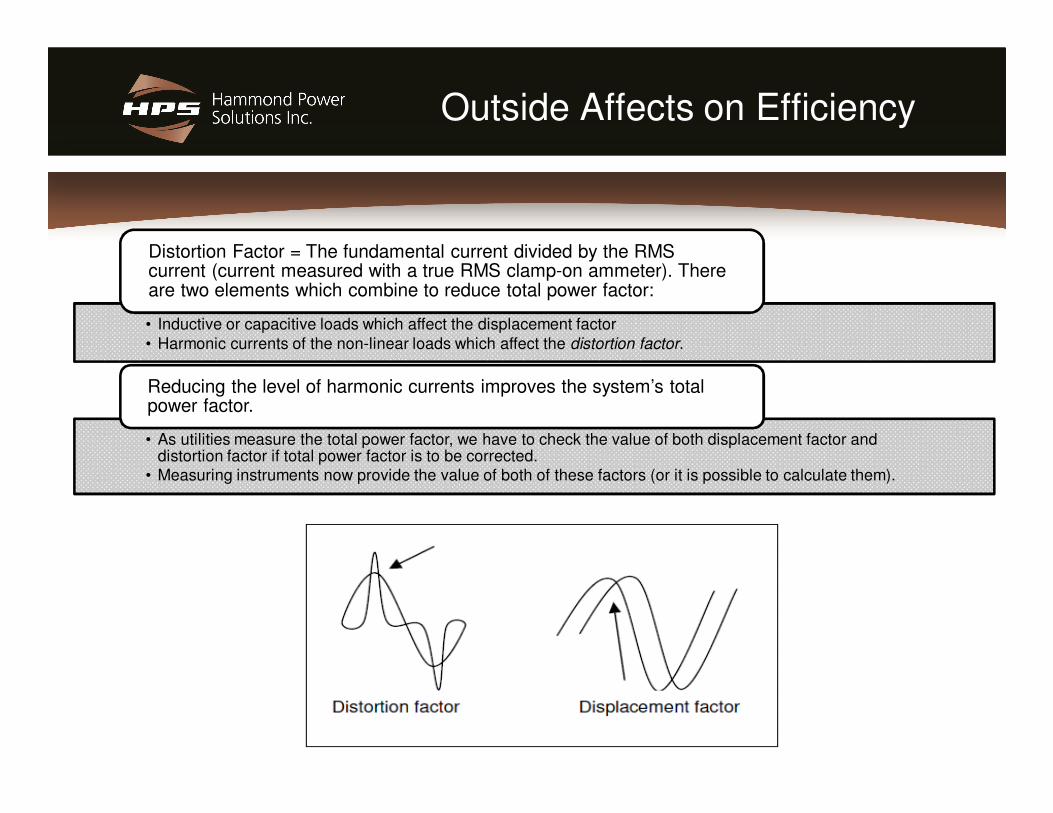
• Inductive or capacitive loads which affect the displacement factor• Harmonic currents of the non-linear loads which affect the distortion factor.
Distortion Factor = The fundamental current divided by the RMS current (current measured with a true RMS clamp-on ammeter). There are two elements which combine to reduce total power factor:
• As utilities measure the total power factor, we have to check the value of both displacement factor and distortion factor if total power factor is to be corrected.
• Measuring instruments now provide the value of both of these factors (or it is possible to calculate them).
Reducing the level of harmonic currents improves the system’s total power factor.
Outside Affects on Efficiency
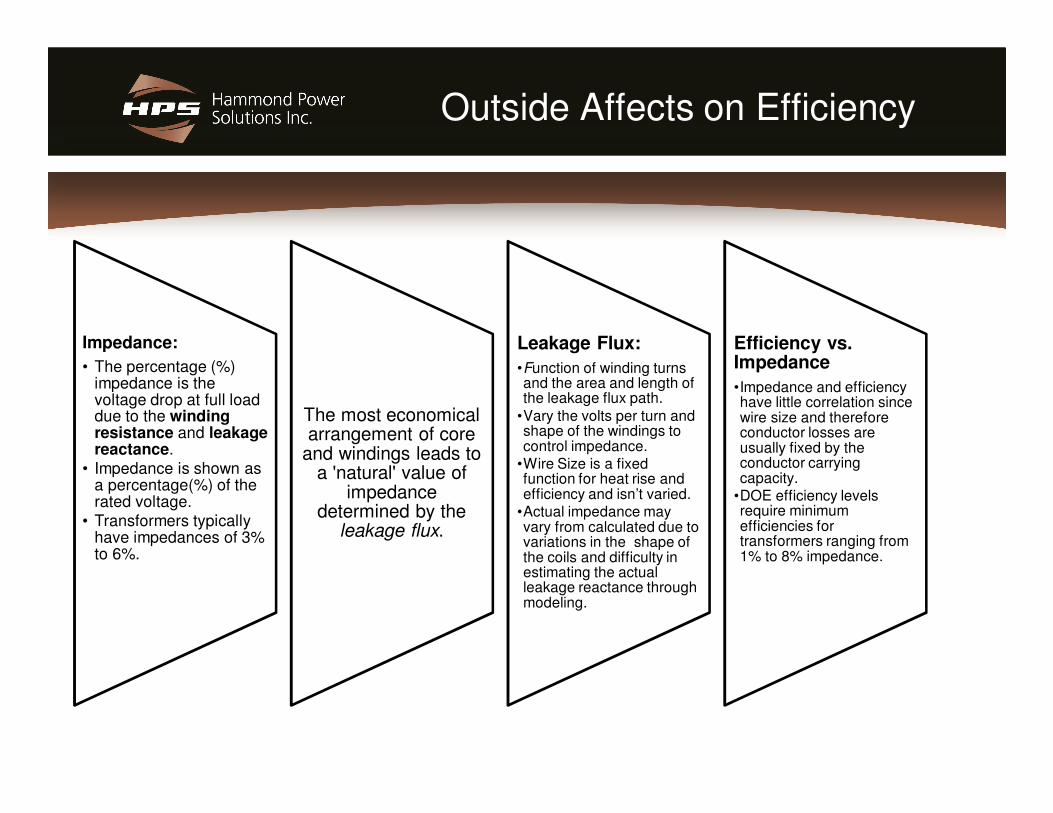
Impedance:
• The percentage (%) impedance is the voltage drop at full load due to the winding resistance and leakage reactance.
• Impedance is shown as a percentage(%) of the rated voltage.
• Transformers typically have impedances of 3% to 6%.
The most economical arrangement of core
and windings leads to a 'natural' value of
impedance determined by the
leakage flux.
Leakage Flux:
•Function of winding turns and the area and length of the leakage flux path.
•Vary the volts per turn and shape of the windings to control impedance.
•Wire Size is a fixed function for heat rise and efficiency and isn’t varied.
•Actual impedance may vary from calculated due to variations in the shape of the coils and difficulty in estimating the actual leakage reactance through modeling.
Efficiency vs. Impedance
•Impedance and efficiency have little correlation since wire size and therefore conductor losses are usually fixed by the conductor carrying capacity.
•DOE efficiency levels require minimum efficiencies for transformers ranging from 1% to 8% impedance.

Measuring Efficiency
• The open circuit method measures the No-load core losses. • The short circuit tests measures the I2R load conductor losses.
Measuring transformer efficiency is challenging. Generally transformer efficiency levels are measured using the open and short circuit tests.
• Loads will have varying power factors, non-linear components.• Calculations require highly accurate and calibrated power meters and measuring
equipment.
When transformers are in operation, measuring transformer efficiency is difficult:
• Measured under a linear load at 35% for 600 volt class units• Measured under a linear load at 50% load for medium voltage units. • This load curve on a highly variable commercial or industrial load is difficult to simulate and
measure accurately.
Modern DOE mandated efficiency levels are:
Efficiency Testing Requirements
• Load (conductor) and No-Load (core) lossesshould are stable.
• HPS uses industry standard testing methodsand calibrated testing equipment at factory.
• Efficiency levels can be recorded for lessmoney at the factory.
• Beware - PT’s and CT’s are not recommendedto be permanently installed on 600 volt classtransformers for the sole purpose of verifyingtransformer efficiency. These devices provideadditional losses, costs and failure modes.
There is little or no benefit to measure transformer efficiency in the field for
modern units other than to add cost to a
project.

Calculating Savings
• Know what you are comparing. Existing transformer efficiency is not recorded on the nameplate. • Efficiency varies by load, power quality,
manufacturer and when the unit was manufactured.
• There is no national database for efficiency data. • HPS uses the base efficiency levels of our
standard efficiency units in 2007 when calculating payback.
• Beware, a manufacturer using lower standard efficiency levels will show a larger savings even though each manufacturer’s base efficiency curve for the new units is the same.
When Calculating
Energy Savings:

Information to Calculate Efficiency
• TP1 600V class has efficiency at 35% load, other loads vary by manufacturer.
Pre-TP1 transformers don’t have nameplate efficiency levels.
• HPS uses efficiency levels from our current and past units to estimate payback for other manufacturers.
As a result, existing transformer efficiency levels are typically estimated.
• Transformer kVA• Primary and secondary voltage and if above 600V class, BIL level.• Typical load profiles (percent of load at hours per day or year). Load profiles don’t have
to be exact, HPS Tool Box for instance uses 0%, 15%, 25%, 35%, 50%, 65%, 75% and 100%.
• Estimated load profiles are often used based on the building, i.e. a hospital is used 24/7/365 while a school might used 10/5/200.
• While harmonics can play a big part in transformer efficiency, they can vary extensively minute by minute. Typically savings is estimated without their inclusion with the assumption that they have an equivalent effect on both the existing and new transformers so the same amount of energy is saved.
To do an efficiency analysis, the following information will be required:

Payback vs. Savings
• With a large number of choices for energy saving devices, most customers will focus on comparing paybacks which typically factors in what the overall installed cost of the device is minus rebates and then divided by the yearly savings.
Many manufacturers focus on savings, a high efficiency transformer will save x-dollars over a year of use.
• Transformer Efficiency• Transformer Costs• Installation Costs
• New construction - installation costs typically aren’t considered.• Installation costs may not be considered for end-of-life replacements.
End-of-life replacements might actually give credit for savings from up-time.
• Electricity costs and demand charges• Site Loading• Rebates
Typical high efficiency transformer installations will have paybacks of 3-10 years. Major factors are

ASHRAE Guidelines
ANSI/ASHRAE/IESNA Addenda d, o, x, aa, ab, ae, at, au, and ba to
ANSI/ASHRAE/IESNA Standard 90.1-2007
8.4.2 Low Voltage Dry-Type Distribution Transformers. Low voltage dry-type transformers shall comply with the provisions of the Energy Policy Act of 2005 where applicable,as shown in Table 8.1.

Leadership in Energy and Environmental Design - LEED’s
Premium energy efficient transformer can help client achieve a LEED’s credit if they reach an energy savings associated with their overall predicted use of energy relative to a benchmark.
LEED requires monitoring of the entire system to achieve efficiency this credit. Specific monitoring on a transformer is probably redundant and may actually compromise the long term integrity of the transformer if the monitoring sensors fail.
Packaging used in the transformer doe not need to be 50% recyclable. The referenced credit specifically exempts electrical components which can not be included in the recycling calculations.
ISO 14001 certification in the transformer manufacturing facility is not need. ISO 14001 is an environmental standard that has nothing to do with transformers and is not a credit item for LEED.
Some manufactures have implied there is an assigned LEED’s credit for Premium Efficiency Transformers, there is not. There are several areas of LEED credits that the transformer can play a role in achieving.

End of Life / MTBF
• Repair time exceeds many temporary power devices such as UPS.• Long term backup power often runs through the transformer. • Transformers are big and heavy, emergency replacement is typically more expensive and time
consuming than other electrical components.
An opportunity for retro-fits is to replace existing units before they fail. Transformers failures are very expensive because of lost commercial time.
• DOE measures 600 volt class transformers at 35% load. • Typically a transformer will last 25-30 years. • Combinations of extended high load factors, high ambient temperatures and harmonics can
reduce the life of a transformer’s insulation components and cause failures much earlier.
Electrical code typically requires that transformers are oversized as are other electrical components.
• Discoloration (clear to yellow, yellow to brown) and/or cracking of the insulation. • Lower megger values could indicate insulation damage. • Excessive heat, harmonics, high voltage spikes (including megger tests), conductive dust and
moisture can significantly reduce the expected lifetime of a transformer.
Signs of failure would include:

In-Rush Concerns
• Ideally, it’s the primary breaker, but either or both breakers could be for the protection of the transformer.
• The primary is ideal because it would protect from any fault that occurs between the secondary conductors and the primary breaker.
• Although it is ideal, accommodating the inrush and protecting the transformer with just the primary breaker can create a challenge.
Now, consider both fault and overload damage protection: Which breaker should protect the transformer?
• This occurs because the secondary coil’s closer proximity to the core results in higher inrush when it is energized first.
Back-feeding a transformer can significantly increase its inrush profile.
• The quicker the fault and the higher the deviation in phase angle at de- and re-energization the higher the current inrush.
Inrush is highly dependent on how long a transformer is de-energized and what was the voltage phase-angle was at de-energization and re-energization for short duration faults.

HPS Toolbox – Calculating Payback

HPS Toolbox – Calculating Payback

HPS Toolbox – Calculating Payback

HPS Toolbox – Calculating Payback
• Calculate for 10 hours @ 50% load per day.
• Calculate for 14 hours @ 25% load per day.
• Sampling of 75, 112.5 and 300 kVA units.
• $0.12/kwHr
In this case we will enter a custom
application for a
hospital type
building that operates at 365 days.

HPS Toolbox – Calculating Payback
The efficiency, losses and savings are calculated from actual HPS products including older non-TP1 units.
Losses will vary slightly between general purpose, K-rated and harmonic mitigating units because of slight differences in design resulting in different efficiencies outside of 35%.
Premium efficiency units compare their savings to both older non-TP1 units and TP1 units.

HPS Toolbox – Calculating Payback
Energy consumption is strictly from the transformers and does not take into account additional savings that could occur from lower demand charges, less cooling, etc.
This program is designed to provide quick, general estimates to transformer payback while providing the raw kWh data for use with ESCO’s overall programing.
Information can also be used for things such as LEED’s studies.

Calculate Payback
Case Study:
Commercial Office Building operates 10 Hours per day, 5 days a week @ 65% load. It operates the remaining time at 15% load. $0.12/kW Hour.
Savings per Year Substitute
$0.12/ kwHr TP1 vs. Standard Premium vs. Standard Premium vs. TP1 Premium vs. TP1
75 kVA $477.38 $629.08 $151.70 $151.70
150 kVA $724.35 $974.12 $249.77 $249.77
300 kVA $1,098.48 $1,557.39 $459.10 $459.10
75 kVA Base Cost 1600 3400 3400 3400
Installation Cost 1400 1400 1400 0
150 kVA Base Cost 2700 5200 5200 5200
Installation Cost 1800 1800 1800 0
300 kVA Base Cost 5400 11000 11000 11000
Installation Cost 2000 2000 2000 0
75 kVA Payback(yr) 6.3 7.6 21.1 11.9
150 kVA Payback(yr) 6.2 7.2 17.2 10.0
300 kVA Payback(yr) 6.7 8.3 16.6 12.2

Calculate Payback
Case Study:
Hospital Building operates 10 Hours per day, 7 days a week @ 65% load. It operates the remaining time at 35% load. $0.12/kW Hour.
Savings per Year Substitute
$0.12/ kwHr TP1 vs. Standard Premium vs. Standard Premium vs. TP1 Premium vs. TP1
75 kVA $583.98 $790.90 $206.93 $206.93
150 kVA $908.20 $1,276.13 $367.94 $367.94
300 kVA $1,403.68 $1,988.94 $585.27 $585.77
75 kVA Base Cost 1600 3400 3400 3400
Installation Cost 1400 1400 1400 0
150 kVA Base Cost 2700 5200 5200 5200
Installation Cost 1800 1800 1800 0
300 kVA Base Cost 5400 11000 11000 11000
Installation Cost 2000 2000 2000 0
75 kVA Payback(yr) 5.1 6.1 15.5 8.7
150 kVA Payback(yr) 5.0 5.5 11.7 6.8
300 kVA Payback(yr) 5.3 6.5 13.0 9.6

Downsizing Transformer kVA
Operation Cost per Year Downsizing 300 kVA to 225 kVA or 150 kVA
$0.12/ kwHr Standard TP1 Premium
150 kVA $2,105.52 $1,197.36 $829.44
150 kVA kWHr's/year 17,546 9,978 6,912
225 kVA $2,803.20 $1,554.96 $1,156.32
225 kVA kWHr's/year 23,360 12,958 9,636
300 kVA $3,372.84 $1,969.08 $1,383.84
300 kVA kWHr's/year 28,107 16,409 11,532
150 kVA Base Cost 2700 5200 5200
Installation Cost 1800 1800 1800
225 kVA Base Cost 3900 7600 7600
Installation Cost 1900 1900 1900
300 kVA Base Cost 5400 11000 11000
Installation Cost 2000 2000 2000
TP1 vs. Stud Premium vs. Std. Premium vs. TP1
150 kVA Payback(yr) 2.1 2.8 0.0
225 kVA Payback(yr) 3.1 4.3 2.5
300 kVA Payback(yr) 5.3 6.5 13.0
In many retrofit situations, the load has been reduced from what it was originally designed for. Anexample is an old lighting system originally designed for incandescent or fluorescent lights that is nowrunning LED’s. It may be possible to substitute a smaller transformer for the original unit. Please notethat overcurrent protection will probably have to be resized for the smaller transformer and national andlocal codes may require to the transformer to be a minimum size.

Upgrade to HMT or K-Rated
• It has changed the way we design, install and calculate losses for energy conservation• New approach in design for TP1 transformers under Non-Linear Load Loss (NLL) and
Phase Shifting installation techniques reclaims more energy under those types of loads.
Non-linear loads are the fastest growing phenomenon in the electrical industry
• Harmonics cause the transformer’s equivalent full load capacity to be reduced.
Many projects specify general purpose transformers not designed to operate non-linear loads which produce harmonics.
• Single-phase sources (120V DC power supplies) produce the most current at the 3rd
harmonic. • Three-phase loads (VFD’s, large DC Power supplies) produce the most current at the 5th
harmonic and don’t produce 3rd harmonics. • Higher order harmonics produce more heat per amp than lower order harmonics, roughly
equivalent to the square of the harmonic
Harmonics are typically odd (3rd, 5th, 7th, etc.).

Upgrade to K-Rated
• Handles additional heat generated by the harmonics with no de-rating.• K-rated has 200% rated neutral because of the potential for high neutral
currents (up to 173%), exceeds a general purpose’s 125% design.• K-rated has an electrostatic shield between the primary and secondary.
K-Rated transformers have three main differences over general purpose transformers:
• Efficiency measured without harmonics at sinusoid.
K-rated transformers must meet the same TP1 efficiency levels at 35% linear load that general purpose units have to meet.
• If less than half of a transformer’s load is Non-Linear, use K=4.• Otherwise use K=13. • Size critical loads at K=20.
K-Rating Rule of thumb:

Upgrade Further to an HMT
• The Zig-Zag winding allows some cancellation of triplen (3rd) harmonics within the transformer’s windings increasing the system’s overall power quality and efficiency.
• Since a Zig-Zag transformer may eliminate the need for a filter, it would conceivably eliminate the additional energy lost in the components of a traditional LC filter network while offering a longer lasting device.
Harmonic mitigating transformer are K-rated transformers designed with a Zig-Zag secondary
winding.

Upgrade Further to an HMT
• K-Rated units don’t provide additional power quality over a similar shielded general purpose unit.
The main benefits to K-rated transformers is increased up-time because the unit is designed to handle the harmonics up to the K-rating and not overheat.
• HMT’s may provide additional payback by reducing the need, costs and losses for LC filters on critical loads.
Harmonic Mitigating Transformers (HMT’s) provide the additional benefit of harmonics cancellation and improved power quality.

Upgrade Further to an HMT
Cancellation minimizes the voltage distortion for better Power Quality
The point of common coupling is typically where a larger transformer feeds two or more smaller units.
Mixing the phase shifts allows for additional cancellation of higher order harmonics including the 5th at the point of common coupling.
In addition to canceling the 3rd harmonics in an HMT’s windings, HMT can be bought with either a 30o or 0o
phase shift.

Typical DIT Phase Shift Application
Δ-YDIT’s/
HMT's
30o Phase
Shift
50 Hp
VSD
0o Phase
Shift
100 Hp
VSD
30o Phase
Shift
75 Hp
VSD
30o Phase
Shift
25 Hp
VSD
0o Phase
Shift
50 Hp
VSD
Δ-ϒ
Service Entrance transformerwhere 5th and 7th Harmonicsexperience mitigation through30o and 0o phase shift ofindividual DIT’s and HMT’s.
Alternate DIT’s/HMT’s between 30o and 0o phase shift trying to balance total HP.

Market Size
Total North American size for Premium Efficiency dry-type 600 Volt Class transformers is estimated to be about $20,000,000/year.
Approximately 1.2 million distribution transformers sold in the U.S. every year
Channel very focused on ESCO’s and LEED buildings, especially for public buildings.
Tough to get realistic paybacks when energy costs fall below $.10 per kWh.
Some manufacturers offer energy audits and even project financing. Some of the energy audits may use questionable base efficiency levels for existing standard efficiency transformers.
No states or agencies currently require Premium Efficiency transformers.
Few utilities offer rebates for Premium Efficiency transformers.
• COM ED – Illinois
• Seattle City Light
• Austin Energy

Conclusion
Questions?