Hplc
49
Handling of HPLC Unit Operation
-
Upload
ceutics1315 -
Category
Documents
-
view
129 -
download
0
Transcript of Hplc

Handling of HPLC
Unit Operation

Schematic of an HPLC
High-performance liquid chromatography (HPLC) is a form of liquid chromatography to separate compounds
that are dissolved in solution. HPLC instruments consist of a reservoir of mobile phase, a pump, an injector, a separation column, and a detector

Difference between TLC and HPLC
TLC HPLC
Type of Analysis qualitative only qualitative &
quantitative
Stationary Phase 2-dimensional
thin layer plate
3-dimensional
column
Instrumentation minimal! much! with many
adjustable parameters
Sample Application spotting
(capillary)
injection
(Rheodyne injector)
Mobile Phase Movement capillary action
(during development)
high pressure
(solvent delivery)
Visualization of Results UV lightbox “on-line” detection
(variable UV/Vis)
Form of Results spots, Rf’s
(retention factors)
peaks, Rt’s
(retention times)

Theory
Liquid chromatography (LC) is a separation technique in which the Mobile Phase is a Liquid
Stationary Phase is Solid
In the HPLC technique, the sample is forced through a column that is packed with irregularly or spherically
shaped particles or a porous monolithic layer (stationary phase) by a liquid (mobile phase) at high pressure
HPLC is historically divided into two different sub-classes based on the polarity of the mobile and stationary
phases.
They are 1.Normal Phase 2.Reverse Phase
Normal Phase: Technique in which the stationary phase is more polar than the mobile phase (e.g. toluene as the
mobile phase, silica as the stationary phase) is called normal phase liquid chromatography (NPLC)
Reverse Phase: Technique in which the Mobile Phase is more polar than the Stationary phase (e.g. water-
methanol mixture as the mobile phase and C18 = octadecylsilyl as the stationary phase) is called reversed phase
liquid chromatography (RPLC).
Ironically the "normal phase" has fewer applications and RPLC is therefore used considerably more

Proposed Reverse phase Mechanisms
Hydrophobic Theory
Partition Theory
Adsorption Theory
Hydrophobic Theory
Chromatography of “cavities” in solvent created by hydrophobic portion of analyte molecule
Surface Tension
Interaction of polar functions with solvent
Stationary phase is passive

Proposed Reverse phase Mechanisms
Partition Theory
Analyte distributes between aqueous mobile phase and organic stationary phase
Correlation between log P and retention
“organic” phase is attached on one end
Does not explain shape selectivity effects
Adsorption Theory
Analytes “land” on surface - do not penetrateNon-polar interactions between analyte hydrophobic portion and bonded phaseWeak interactions
dipole-dipoledipole-induced dipoleinduced dipole-induced dipole

How The Separation of Analyte in Columns
Separation of compounds is based on the competition of the solute and the mobile phase for binding places on
the stationary phase. For instance, if normal phase silica gel is used as the stationary phase it can be considered
polar. Given two compounds which differ in polarity, the most polar compound has a stronger interaction with
the silica and is therefore more capable to dispel the mobile phase from the binding places. Consequently, the
less polar compound eluted first and follows the Next compound.

Column Selection guide

Buffers in the mobile phase preparation
Commonly Used Buffers for Reversed Phase HPLC
Buffer pKa Buffer Range UV Cutoff (nm)Phosphate pKa1 2.1 1.1-3.1 200
7.2 6.2-8.212.3 11.3-13.3
Formic acid* 3.8 2.8-4.8 210Acetic acid* 4.8 3.8-5.8 210Citrate 3.1 2.1-4.1 230
4.7 3.7-5.7 5.4 4.4-6.4
carbonate, pKa1 6,1 5.1-7.1 < 200carbonate, pKa2 10,3 9.3-11.3 < 200Tris 8.3 7.3-9.3 205Triethylamine* 11 10.0-12.0 200ammonia 9,3 8.3-10.3 200 (10 mM)borate 9,2 8.2-10.2 n/aPyrrolidine 11.3 10.3-12.3 200* Volatile buffers

Ion Pair Reagents in the mobile phase


Common RP Packings and Its properties
Hydrophobic Surface
Particle Size and Shape
Particle Size Distribution
Porosity, Pore Size and Surface Area
Carbon Loading, End capping

Spherical particles offer reduced back pressures and longer column life when using
viscous mobile phases like 50:50 MeOH:H2O.
Particle Shape-Effect on Chromatography

Smaller particles offer higher efficiency, but also cause higher backpressure. Choose
3µm particles for resolving complex, multi-component samples. Otherwise, choose 5
or 10µm pickings.
Particle Size-Effect on Chromatography

High surface area generally provides greater retention, capacity and resolution for
separating complex, multi-component samples. Low surface area packings generally
equilibrate quickly, especially important in gradient analyses.
Surface Area-Effect on Chromatography

Larger pores allow larger solute molecules to be retained longer through maximum
exposure to the surface area of the particles. Choose a pore size of 150Å or less for
sample MW 2000. Choose a pore size of 300Å or greater for sample MW > 2000.
Pore Size-Effect on Chromatography

Monomeric bonding offers increased mass transfer rates, higher column efficiency, and
faster column equilibration.
Polymeric bonding offers increased column stability, particularly when highly aqueous
mobile phases are used. Polymeric bonding also enables the column to accept higher
sample loading
Bonding Type-Effect on Chromatography
Si
R
R
(CH2)17CH3Si
CH3
CH3
(CH2)17CH3XOH +monomeric
bonding
Si
CH3
X
(CH2)17CH3X+polymeric
bonding
OH
OH O
O
Si
CH3
(CH2)17CH3

Higher carbon loads generally offer greater resolution and longer run times. Low
carbon loads shorten run times and many show a different selectivity.
Carbon loading-Effect on Chromatography

Endcapping reduces peak-tailing of polar solutes that interact excessively with the
otherwise exposed, mostly acidic silanols. Non-endcapped packings provide a different
selectivity than do endcapped packings, especially for such polar samples.
End Capping-Effect on Chromatography

HPLC-Detectors

HPLC-Detectors

Handling
Switch ON Main Power supply to the Pump, auto Sampler, Degasser, Column Compartment and Printer
Preparation of Mobile Phase
1. Prepare buffer solution as per STP & mix with the solvents as mentioned in STP .While preparing the
mobile phase, add solvents in a same sequence as mentioned in STP & mix thoroughly in mobile phase
bottle.
2. Filter mobile phase through 0.45 micron Nylon membrane filter or as suggested in STP.
3. Degas the mobile phase for 10 minutes for volumes 1000,2000,3000 mL in a sonicator applying vacuum &
degas for 20 minutes for volume 5000 mL in a sonicator applying vacuum. Ensure that proper water level &
temperature is maintained during sonication. Avoid over Sonication to avoid polymerization of some of the
salts.
4. Limit for pH adjustment for mobile phase & buffers meant for its preparation is + 0.02.

Selection of Column
Select the Column as Mentioned in the STP or Method
Ensure that there is no air Bubble in 4 Channels
Flush the Column, prior to use, for at least 30 minutes using HPLC Grade Methanol at a flow rate of about
1 mL/minnute
Saturate the Column with Mobile Phase For at least 30 Minutes
Put Appropriate Needle Wash, Seal wash solutions ,Wash Vials as applicable
Preparation of Sample and Standard Solutions
Prepare Standard, Sample and system suitability Solutions as per STP
Use filter as mentioned in STP. First rinse the syringe with diluents, discard initial volume of diluents solution
through a filter holder, collect the required volume & after filtration discard the membrane filter.
Check the System suitability Parameters then only Proceed for Next Step

Preparation of Sample and Standard Solutions
Prepare Standard, Sample and system suitability Solutions as per STP or method
Use filter as mentioned in STP. First rinse the syringe with diluents, discard initial volume of diluents solution
through a filter holder, collect the required volume & after filtration discard the membrane filter
Check the System suitability parameters then only Proceed for Next Step

Filling of the Vials and Labeling Of the Vials
Discard the First 5 mL of Solution from the Standard and Sample Solution.
Use Fresh Vials for each Preparation
Rinse the HPLC Vials with Respective solution
Fill the Each Vial with Enough Sample solution for all injection
Crimp the vial properly
Label all the test and standard solutions for all tests with at least details such as A.R.No ,Solution Name and
appropriate replicate preparation number when ever applicable
Label the HPLC,GC Vials with legible marker pen for as follows
XYY, Where X=Unique Quick set YY-Is position at that is to be placed

HPLC Chromatograms
0 1 2 3 4 5 6 7
Time (minutes)
Ab
so
rba
nc
e
Area =base x height
2
base
height
Peak A Peak B
Approximation
of peak area by
triangulation
Rt = 3.0 min.
faster moving
less retained
Rt = 6.0 min.
slower moving
more retained

USP <1225>
System suitability tests are based on the concept that the equipment, electronics, analytical operations, and samples to be analyzed constitute an integral system that can be evaluated as such. System suitability test parameters to be established for a particular procedure depend on the type of procedure being evaluated. They are especially important in the case of chromatographic procedures...
Provides assurances that the system is working properly at the time of analysis
Ensures that both methodology and instrumentation are performing within expectations prior to the analysis of
the test samples
Should be monitored during run time to verify that the criteria remain realistic and achievable
Determined from the analyte peak
Assessed with any significant change in equipment or in a critical reagent
System suitability solutionAt least the major analyte of interest and, ideally, a closely eluted component or components that could be found in actual samples at known levelsStandard solution can be used
System suitability

System suitability
Acceptance criteria
balance between theoretical and practical performance
sufficiently tight - data quality is assured
not so restrictive that acceptable systems fail
reflective of minimum acceptable performance to generate reliable result
Parameters for a chromatographic
method
Resolution - specificity
Column efficiency - specificity
Relative Standard Deviation –
precision
Tailing Factor - accuracy and
precision
QL - sensitivity
Capacity factor - specificity
Reference Standard Check - analyst

Resolution (R)–function of column efficiency (N)–measure of the resolving power of the system–generally, not less than 2.0–most closely eluting pair
System suitability

System suitability
• Resolution (R)
R = 1.0 R = 1.5 R = 2.0

Column Efficiency (N)–only one peak of interest–measure of peak sharpness–detection of trace components–generally not less than 2000 (HPLC)–isocratic/isothermal system
Column efficiencynumber of theoretical plates in a chromatogram
System suitability

Relative Standard Deviation (SR or RSD)
replicate injections of a Standard preparation
assessment of repeatability of the system
five replicate injections of the analyte if the requirement is 2.0% or less
System suitability

Tailing Factor (T)
measure of peak symmetry
equals one for perfectly symmetrical peaks
peak asymmetry increases, accuracy
and precision becomes less reliable
generally not more than 2
System suitability
• Tailing factor

System suitability
• Capacity Factor (k’ or k)– measure of where the peak of interest is located with respect to
the void volume, i.e., elution time of the non-retained components
– generally, not less than 2
t - retention time of the analyte
ta - retention time of an unretained peak

System suitability
• Quantitation Limit (QL)
– a dilution of the analytes are injected at the QL concentration
– S/N > 10 for single injection
OR
– RSD <15% for multiple injections

System suitability
• Reference Standard Check
– duplicate injection of a separately weighed reference solution
– check accuracy of solutions preparation
– the expected result for the second standard should be:
98.0% reference standard 102.0%

Adjustments in System Suitability
pH of the Mobile Phase(HPLC):± 0.2 units of the value or range specified for aqueous buffer.
Concn. Of Salts in Buffer (HPLC): Within ± 10% provided the permitted pH variationis met.
Wavelength of UV-Vis detector (HPLC): Deviations from the wave lengths specified in the method are not permitted.
Column length(GC,HPLC):± 70%
Column Inner Diameter(GC,HPLC):± 25% for HPLC and ± 50% for GC.
Film Thickness (Capillary GC): -50% to 100%
Particle Size (HPLC): can be reduced by as much as 50%.
Particle Size (GC): If it is same ‘Range Ratio’ of the GC mesh support and chromatography meets the requirements of the system suitability.
Flow Rate (GC,HPLC):± 50%
Injection Volume (GC,HPLC): Can be reduced as much as is
consistent
with accepted precision and detection limits.
Column Temperature (HPLC): ± 10deg
Oven Temperature (GC): ± 10%

Adjustments in System Suitability
Ratio of the Components in Mobile Phase (HPLC): Apply to Minor
components of 50% or less.
± 30% relative. Change in any component cannot exceed ± 10%
absolute (
i.e. in relation to the mobile phase).
Binary Mixtures: eg. For 50:50 : Thirty percent of 50 is 15% absolute
but ± 10% is only permitted.
That means either 40:60 or 60:40 can be made.
Ternary Mixtures: for eg.60:35:5:
30% of 35 is 10.5% absolute but only ± 10% is permitted. That means
change can be made between 25% and 45%.
In all cases , a sufficient quantity of the first component is used to
give a total of 100%.There fore, Mixture ranges of 50:45:5 to 70:25:5
or 58.5:35:6.5 to 61.5:35:3.5.

Flow Variation
Temperature Variation
Injector Reproducibility
Injector Linearity
Detector Linearity
Carryover
Gradient performance test
Drift and Noise
Performance verification of HPLC
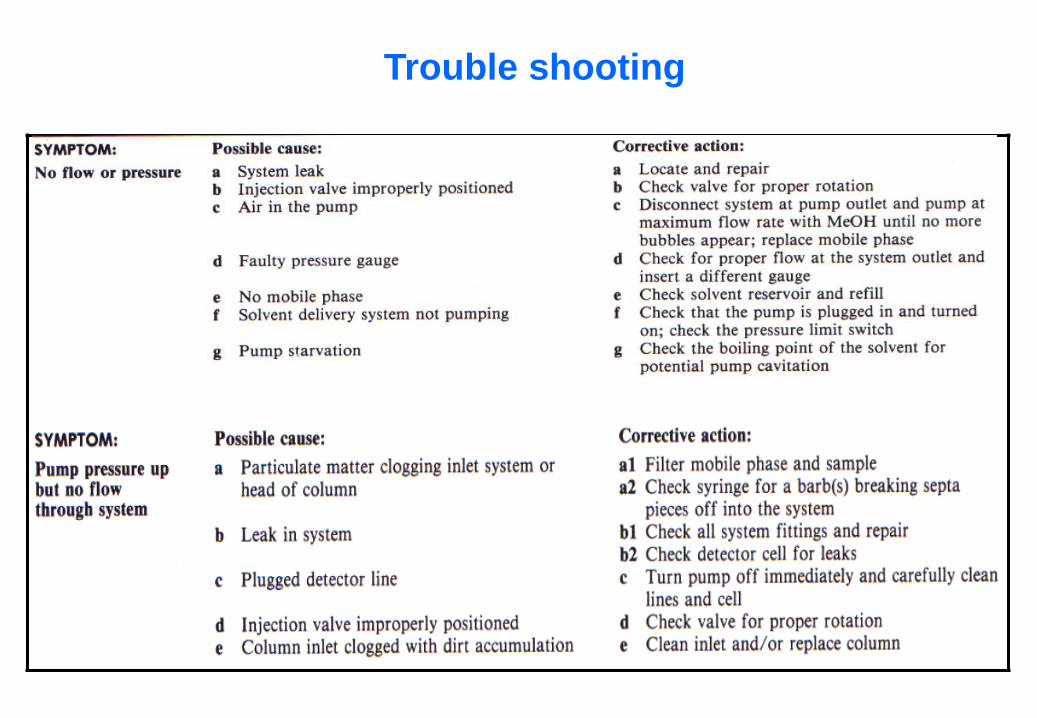
Trouble shooting

Trouble shooting
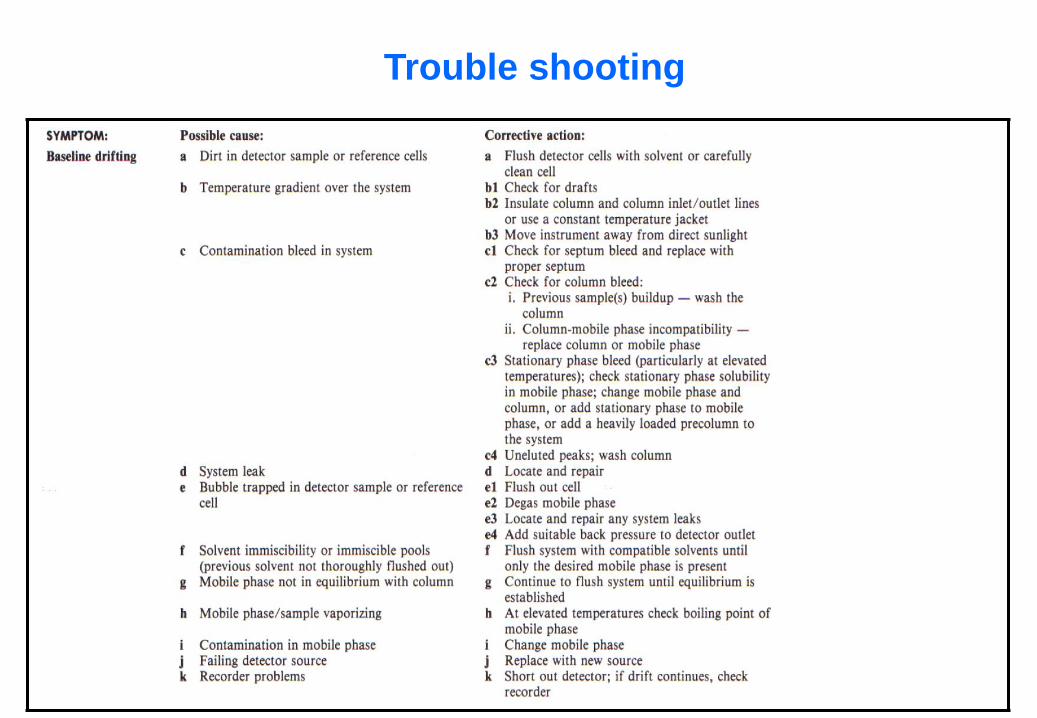
Trouble shooting

Trouble shooting

Trouble shooting

Trouble shooting

Trouble shooting

Trouble shooting

Trouble shooting