HPE Reference Architecture for Oracle 12c performance · PDF fileorganizations to determine...
27
HPE Reference Architecture for Oracle 12c performance with Intel-based HPE NVMe Workload Accelerators on HPE ProLiant DL380 Gen9 Technical white paper
Transcript of HPE Reference Architecture for Oracle 12c performance · PDF fileorganizations to determine...
HPE Reference Architecture for Oracle 12c performance with Intel-based HPE NVMe Workload Accelerators on HPE ProLiant DL380 Gen9
Technical white paper

Technical white paper
Contents Executive summary ................................................................................................................................................................................................................................................................................................................................ 3 Introduction ................................................................................................................................................................................................................................................................................................................................................... 3 Solution overview ..................................................................................................................................................................................................................................................................................................................................... 4 Solution components ............................................................................................................................................................................................................................................................................................................................ 6
HPE ProLiant DL380 Gen9 server ................................................................................................................................................................................................................................................................................... 6 HPE PCI-e Workload Accelerators ..................................................................................................................................................................................................................................................................................... 7 Oracle Database ................................................................................................................................................................................................................................................................................................................................. 7
Best practices and configuration guidance for the Oracle Intel-based HPE NVMe solution ............................................................................................................................................. 8 Workload description ..................................................................................................................................................................................................................................................................................................................... 8 SLOB workload results .................................................................................................................................................................................................................................................................................................................. 9 HammerDB workload results .............................................................................................................................................................................................................................................................................................. 13
Capacity and sizing ............................................................................................................................................................................................................................................................................................................................ 15 Analysis and recommendations ....................................................................................................................................................................................................................................................................................... 23
Summary ...................................................................................................................................................................................................................................................................................................................................................... 24 Implementing a proof-of-concept .................................................................................................................................................................................................................................................................................. 24
Appendix A: Bill of materials ...................................................................................................................................................................................................................................................................................................... 25 Appendix B: Oracle configuration parameters .......................................................................................................................................................................................................................................................... 26 Appendix C: Linux kernel parameters ............................................................................................................................................................................................................................................................................... 26 Appendix D: 99-oracleasm.rules ............................................................................................................................................................................................................................................................................................ 26 Resources and additional links ................................................................................................................................................................................................................................................................................................ 27

Technical white paper Page 3
Executive summary Information Technology departments are under pressure to add value to the business, improve existing infrastructure, address exponential data growth and reduce cost without compromising on performance. The demands of database implementations continue to escalate; faster transaction processing speeds, scalable capacity, and increased flexibility are required to meet the needs of today’s business.
This Reference Architecture is intended to provide customers with the expected performance implications associated with deploying Oracle 12c on the HPE ProLiant DL380 Gen9 server, comparing a spinning media solution with that of a database implemented totally using Intel-based HPE NVMe Workload Accelerators for ProLiant servers.
It also provides proof points that demonstrate a reduction in the number of cores required to provide Oracle database services, thereby reducing the number of Oracle licenses required to deploy a given level of performance, using Intel-based HPE NVMe Workload Accelerators. Based on our testing, we were able to reduce the number of cores required to deliver a certain level of performance by up to 50%. This leads to a reduction in Oracle database licensing costs that continues throughout the lifecycle of the DB platform without compromising on performance.
Results from testing 32 cores using spinning media versus the same number of cores using PCIe-based NVMe Workload Accelerators demonstrates the superior performance available, up to 150%, when using Intel-based HPE NVMe Workload Accelerators.
Testing performed as a basis for this Reference Architecture starts with a baseline, which is established using an all spinning media solution. That testing is then extended to use Intel-based HPE PCIe NVMe Workload Accelerators in place of the spinning media, exposing the benefits of an all SSD solution.
Target audience: This Hewlett Packard Enterprise Reference Architecture (RA) is designed for IT professionals who use, program, manage, or administer Oracle databases that require high performance. Specifically, this information is intended for those who evaluate, recommend, or design new and existing IT high performance architectures. Additionally, CIOs may be interested in this document as an aid to guide their organizations to determine when to implement Oracle databases in an SSD environment.
This RA describes testing completed in November 2016.
Document purpose: The purpose of this document is to describe a Reference Architecture that organizations can utilize to plan their deployment of Oracle databases in an all non-spinning environment.
Introduction It is fair to say, that in today’s market place, Oracle database license costs comprise the largest portion of the expenditure when deploying a new application, or even when rehosting an existing application.
Because Oracle licenses their 12c database on a per-core basis, organizations need to ensure they deploy the fewest number of cores required to satisfy the business need and also to fully utilize the cores they do license.
This Reference Architecture’s objective is to provide a series of proof points supporting the notion that an internal all-flash server deployment model will allow a higher level of utilization of CPU resources and/or a reduction in the number of cores to provide a commensurate level of performance and throughput as a server configured with traditional spinning hard drives.
This RA compares the performance and throughput of an HPE ProLiant DL380 Gen9 server with 24 x 300GB 15K RPM drives with that of the very same server using 4 x Intel-based HPE PCIe NVMe Workload Accelerators on which the database was hosted. HPE also offers an alternative to PCIe-based NVMe Workload Accelerators. As an option to the HPE DL380 Gen9 24SFF chassis, a customer can opt to convert one of the drive bays to an NVMe bay, freeing up the PCIe slots consumed with NVMe Workload Accelerators. Conversion of the drive bay to an NVMe bay provides 6 NVMe slots without consuming a PCIe slot. The same Intel-based HPE NVMe drives can be placed into that converted drive bay.
The comparison scenarios tested are as follows:
1. Maximum I/O throughput – For this set of tests, we use the Silly Little Oracle Benchmark (SLOB) test tool. The SLOB tool is an Oracle database SGA-intensive workload which eliminates application contention and stresses the I/O subsystem.
2. Storage comparison testing – This testing simulated a real-world Oracle DB deployment and compares the performance of a DB server using spinning media with that of the same server utilizing Intel-based HPE NVMe Workload Accelerators.
Technical white paper Page 4
3. Core count reduction testing – For this testing, server cores were disabled in the DB server to determine the number of cores needed to sustain equivalent throughput performance between the two configurations.
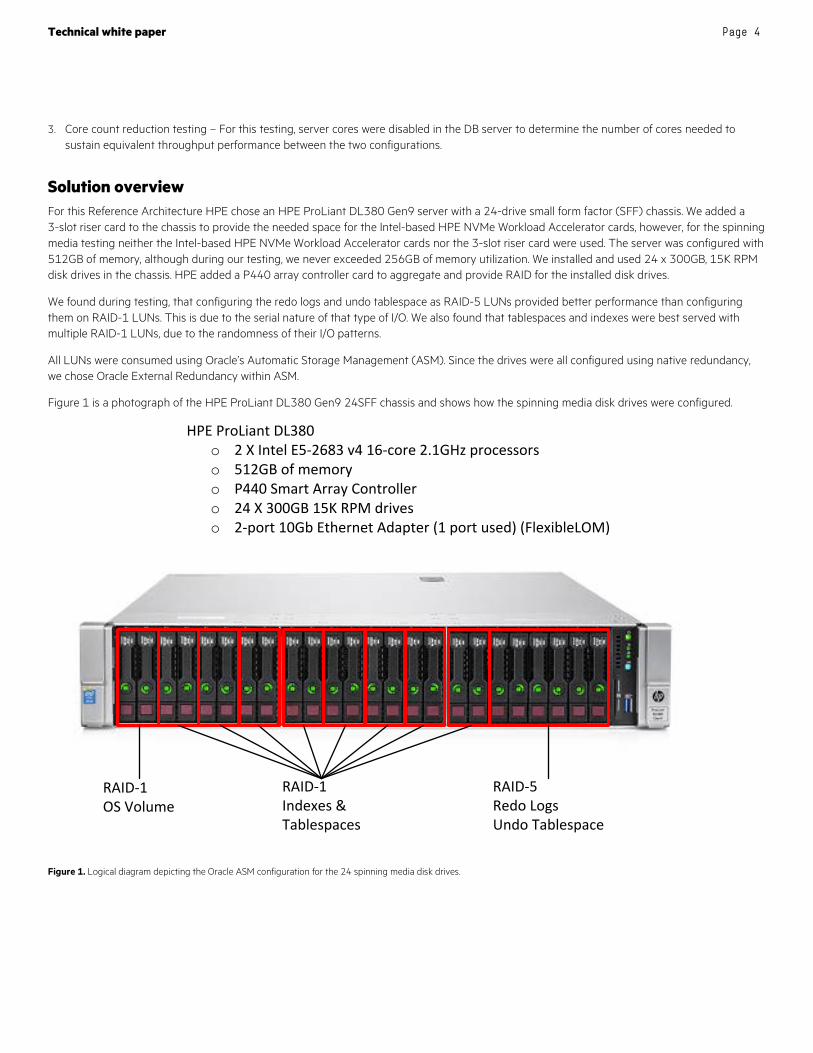
Solution overview For this Reference Architecture HPE chose an HPE ProLiant DL380 Gen9 server with a 24-drive small form factor (SFF) chassis. We added a 3-slot riser card to the chassis to provide the needed space for the Intel-based HPE NVMe Workload Accelerator cards, however, for the spinning media testing neither the Intel-based HPE NVMe Workload Accelerator cards nor the 3-slot riser card were used. The server was configured with 512GB of memory, although during our testing, we never exceeded 256GB of memory utilization. We installed and used 24 x 300GB, 15K RPM disk drives in the chassis. HPE added a P440 array controller card to aggregate and provide RAID for the installed disk drives.
We found during testing, that configuring the redo logs and undo tablespace as RAID-5 LUNs provided better performance than configuring them on RAID-1 LUNs. This is due to the serial nature of that type of I/O. We also found that tablespaces and indexes were best served with multiple RAID-1 LUNs, due to the randomness of their I/O patterns.
All LUNs were consumed using Oracle’s Automatic Storage Management (ASM). Since the drives were all configured using native redundancy, we chose Oracle External Redundancy within ASM.
Figure 1 is a photograph of the HPE ProLiant DL380 Gen9 24SFF chassis and shows how the spinning media disk drives were configured.
RAID-1OS Volume
RAID-1Indexes &Tablespaces
RAID-5 Redo LogsUndo Tablespace
HPE ProLiant DL380o 2 X Intel E5-2683 v4 16-core 2.1GHz processorso 512GB of memoryo P440 Smart Array Controllero 24 X 300GB 15K RPM driveso 2-port 10Gb Ethernet Adapter (1 port used) (FlexibleLOM)
Figure 1. Logical diagram depicting the Oracle ASM configuration for the 24 spinning media disk drives.
Technical white paper Page 5
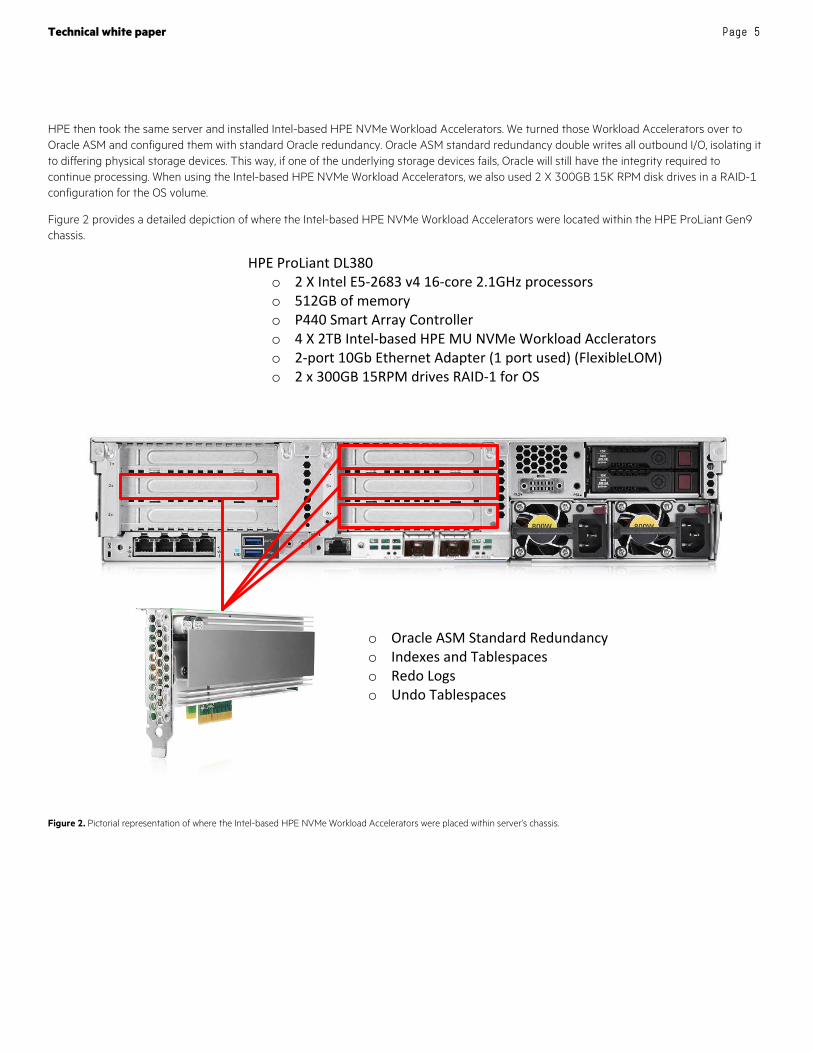
HPE then took the same server and installed Intel-based HPE NVMe Workload Accelerators. We turned those Workload Accelerators over to Oracle ASM and configured them with standard Oracle redundancy. Oracle ASM standard redundancy double writes all outbound I/O, isolating it to differing physical storage devices. This way, if one of the underlying storage devices fails, Oracle will still have the integrity required to continue processing. When using the Intel-based HPE NVMe Workload Accelerators, we also used 2 X 300GB 15K RPM disk drives in a RAID-1 configuration for the OS volume.
Figure 2 provides a detailed depiction of where the Intel-based HPE NVMe Workload Accelerators were located within the HPE ProLiant Gen9 chassis.
HPE ProLiant DL380o 2 X Intel E5-2683 v4 16-core 2.1GHz processorso 512GB of memoryo P440 Smart Array Controllero 4 X 2TB Intel-based HPE MU NVMe Workload Accleratorso 2-port 10Gb Ethernet Adapter (1 port used) (FlexibleLOM)o 2 x 300GB 15RPM drives RAID-1 for OS
o Oracle ASM Standard Redundancyo Indexes and Tablespaceso Redo Logso Undo Tablespaces
Figure 2. Pictorial representation of where the Intel-based HPE NVMe Workload Accelerators were placed within server’s chassis.
Technical white paper Page 6
Solution components This solution is made up of a single HPE ProLiant DL380 Gen9 24SFF server. The server had 24 x 300GB 15K RPM disk drives for the spinning media solution. It also had 4 X Intel-based HPE NVMe Workload Accelerators inserted into 4 PCI-e slots.
The HPE ProLiant DL380 Gen9 server had the following configuration:
• 2 x Intel® Xeon® E5-2683 v4 16-core processors with a clock speed of 2.1GHz
• 512GB of memory
• 24 x HPE 300GB 12G SAS 15K RPM disk drives for OS, Tablespaces, Indexes, redo logs and undo tablespace
• 4 x Intel-based HPE NVMe 2TB Workload Accelerators for Tablespaces, Indexes, redo logs and undo tablespace
• 1 x dual port 10GbE network cards
Software
• Oracle 12c – Version 12.1.0.2.0
• Red Hat® Enterprise Linux® (RHEL) – Version 7.2
• SLOB v2.3.0.3-1 – Used as a workload driver
• HammerDB v2.17 – Used as a workload driver
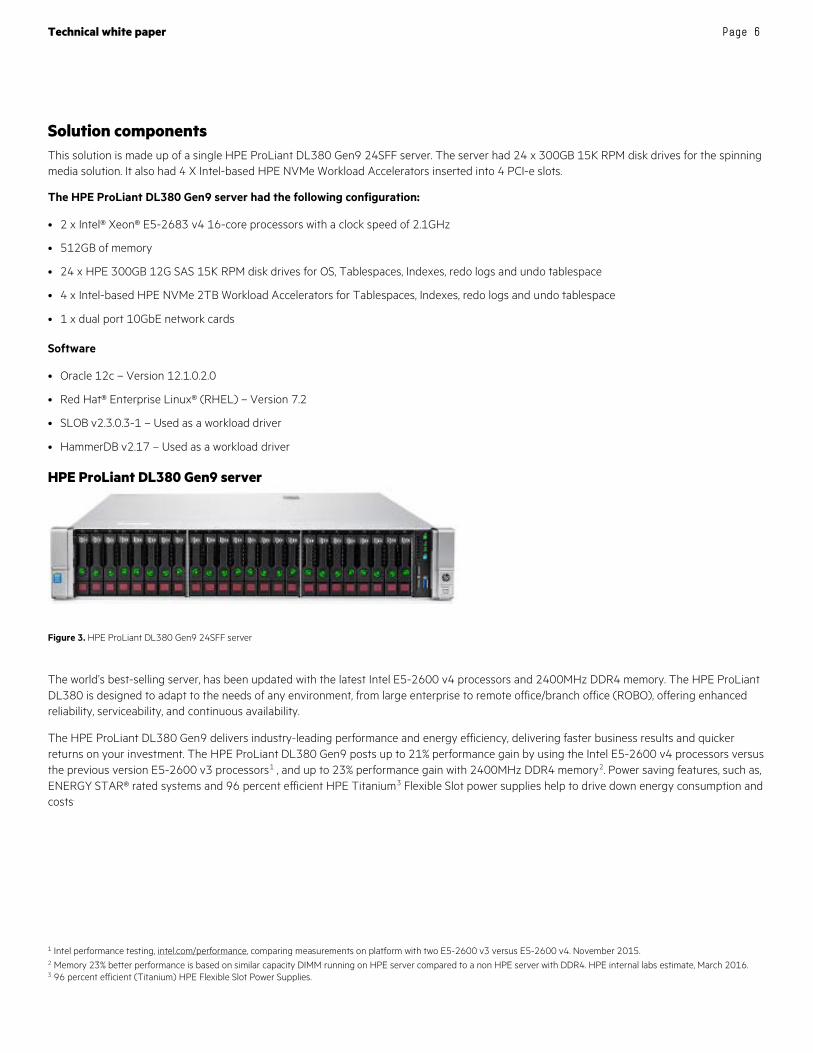
HPE ProLiant DL380 Gen9 server
Figure 3. HPE ProLiant DL380 Gen9 24SFF server
The world’s best-selling server, has been updated with the latest Intel E5-2600 v4 processors and 2400MHz DDR4 memory. The HPE ProLiant DL380 is designed to adapt to the needs of any environment, from large enterprise to remote office/branch office (ROBO), offering enhanced reliability, serviceability, and continuous availability.
The HPE ProLiant DL380 Gen9 delivers industry-leading performance and energy efficiency, delivering faster business results and quicker returns on your investment. The HPE ProLiant DL380 Gen9 posts up to 21% performance gain by using the Intel E5-2600 v4 processors versus the previous version E5-2600 v3 processors1 , and up to 23% performance gain with 2400MHz DDR4 memory2. Power saving features, such as, ENERGY STAR® rated systems and 96 percent efficient HPE Titanium3 Flexible Slot power supplies help to drive down energy consumption and costs.
1 Intel performance testing, intel.com/performance, comparing measurements on platform with two E5-2600 v3 versus E5-2600 v4. November 2015. 2 Memory 23% better performance is based on similar capacity DIMM running on HPE server compared to a non HPE server with DDR4. HPE internal labs estimate, March 2016. 3 96 percent efficient (Titanium) HPE Flexible Slot Power Supplies.
Technical white paper Page 7
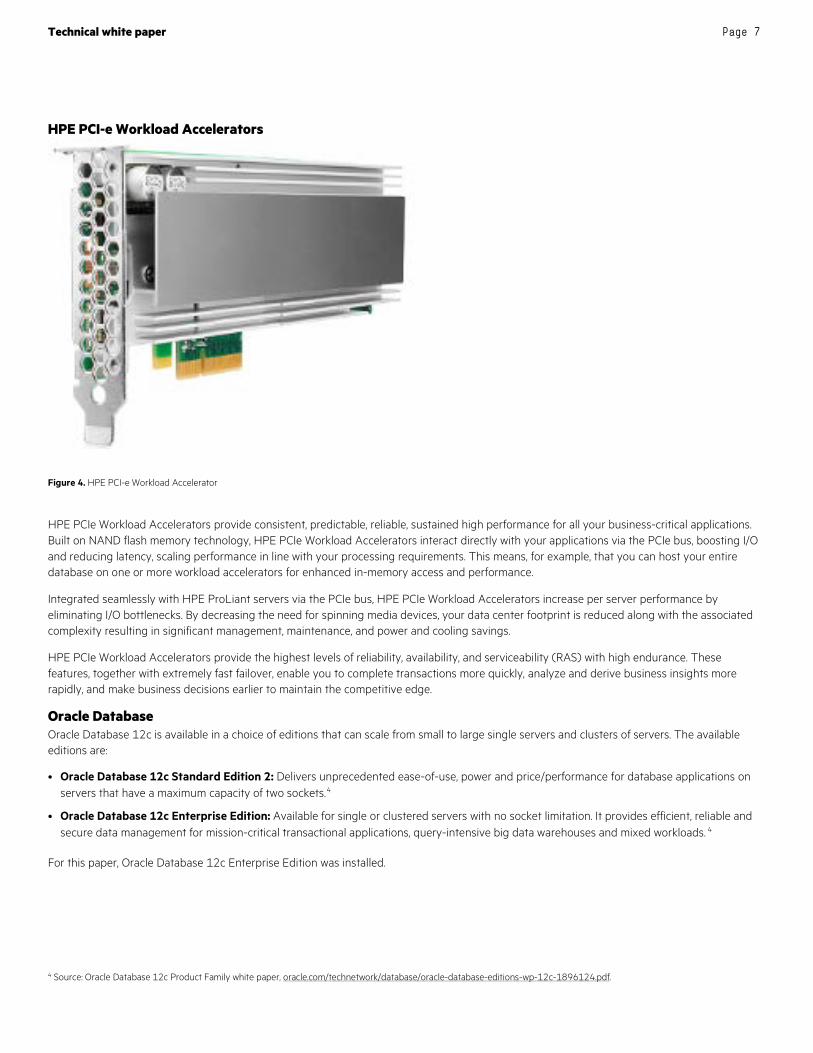
HPE PCI-e Workload Accelerators
Figure 4. HPE PCI-e Workload Accelerator
HPE PCIe Workload Accelerators provide consistent, predictable, reliable, sustained high performance for all your business-critical applications. Built on NAND flash memory technology, HPE PCIe Workload Accelerators interact directly with your applications via the PCIe bus, boosting I/O and reducing latency, scaling performance in line with your processing requirements. This means, for example, that you can host your entire database on one or more workload accelerators for enhanced in-memory access and performance.
Integrated seamlessly with HPE ProLiant servers via the PCIe bus, HPE PCIe Workload Accelerators increase per server performance by eliminating I/O bottlenecks. By decreasing the need for spinning media devices, your data center footprint is reduced along with the associated complexity resulting in significant management, maintenance, and power and cooling savings.
HPE PCIe Workload Accelerators provide the highest levels of reliability, availability, and serviceability (RAS) with high endurance. These features, together with extremely fast failover, enable you to complete transactions more quickly, analyze and derive business insights more rapidly, and make business decisions earlier to maintain the competitive edge.
Oracle Database Oracle Database 12c is available in a choice of editions that can scale from small to large single servers and clusters of servers. The available editions are:
• Oracle Database 12c Standard Edition 2: Delivers unprecedented ease-of-use, power and price/performance for database applications on servers that have a maximum capacity of two sockets.4
• Oracle Database 12c Enterprise Edition: Available for single or clustered servers with no socket limitation. It provides efficient, reliable and secure data management for mission-critical transactional applications, query-intensive big data warehouses and mixed workloads. 4
For this paper, Oracle Database 12c Enterprise Edition was installed.
4 Source: Oracle Database 12c Product Family white paper, oracle.com/technetwork/database/oracle-database-editions-wp-12c-1896124.pdf.

Technical white paper Page 8
Best practices and configuration guidance for the Oracle Intel-based HPE NVMe solution To optimize the configuration for Oracle, the following changes were made to the hardware, firmware, and software. For all tests, with the exception of the reduced core count tests, the server configuration remained exactly the same. For the reduced core count tests, we disabled cores within each of the E5-2683 v4 processors, but other than that one modification, the configuration remained unchanged.
HPE ProLiant BIOS settings • Hyper-Threading – Enabled
• Intel Turbo Boost – Enabled
• HPE Power Profile – Maximum Performance
RHEL configuration • Create udev rules to set permissions for the Oracle volumes (per values in Appendix D). During this test, we used the file /etc/udev/rules.d/99-
oracleasm.rules
• Set throughput-performance via tuned-adm
Oracle configuration best practices For Oracle configuration, on a per instance basis, the following is recommended:
• Set buffer cache memory size large enough, per your implementation, to avoid physical reads. For this testing, the buffer cache size was set to 128GB.
• Create two large redo log file spaces of 350GB to minimize log file switching and reduce log file waits. On spinning media, both redo log files were placed in the ASM disk group named REDO. Disk group REDO was comprised of a single, RAID-5, 6-disk LUN.
• Create an undo tablespace of 400GB. This tablespace was also placed in the disk group named REDO.
• Set the number of processes to a level that will allow all intended users to connect and process data. During our testing we used 3000 for this parameter setting.
• Set the number of open cursors to a level that will not constrict Oracle processes. This was set to 3000.
Workload description HPE tested Oracle using both SLOB and HammerDB as workload drivers. HammerDB provides a real-world type scenario that consumes both CPU for the application logic and I/O. SLOB, on the other hand, removes all of the application logic and instead tests I/O via the Oracle SGA.
When testing with SLOB, all tests were run from the local server. When testing with HammerDB, all tests were driven from a load driver server.
When a SLOB test is configured, we specify how many schemas are to be loaded, along with the size of each schema. For these tests, we loaded 300 schemas and each schema was 1GB in size. The total database size was 1.4TB.
Then, when we run a SLOB test, we specify the number of schemas to run against and we set the number of threads per schema. The number of schemas chosen was 1, 5, 10, 15, 20 and the number of threads was 1, 8, and 16. It should be noted that the Intel-based HPE NVMe Workload Accelerators also allowed us to test with 25 and 30 schemas, but the spinning media was not able to scale that far, so those results are not included in the graphs.
HammerDB is an open-source tool. The HammerDB tool implements an OLTP-type workload (60 percent read and 40 percent write) with small I/O sizes of a random nature. The transaction results were normalized and used to compare test configurations. Other metrics measured during the workload come from the operating system and/or standard Oracle Automatic Workload Repository (AWR) statistics reports.
The OLTP test, performed on a database 1.8TB in size, was both highly CPU and moderately I/O intensive. The environment was tuned for maximum user transactions. After the database was tuned, the transactions were recorded at different connection levels. Because customer workloads vary in characteristics, the measurement was made with a focus on maximum transactions.
Oracle Enterprise Database version 12.1.0.2.0 was used in these test configurations.
We used several different Oracle connection counts for our tests. The results of various user count tests can be seen in the following graphs.
Technical white paper Page 9
When testing with HammerDB, we tested both for maximum performance and CPU consumed, comparing Intel-based HPE NVMe Workload Accelerators directly head-to-head against 15K spinning media. HPE also tested by reducing the cores on the system under test using Intel-based HPE NVMe Workload Accelerators until we were at a performance level that was equal to or slightly above that delivered when using the 15K spinning media on the same system utilizing all cores available.
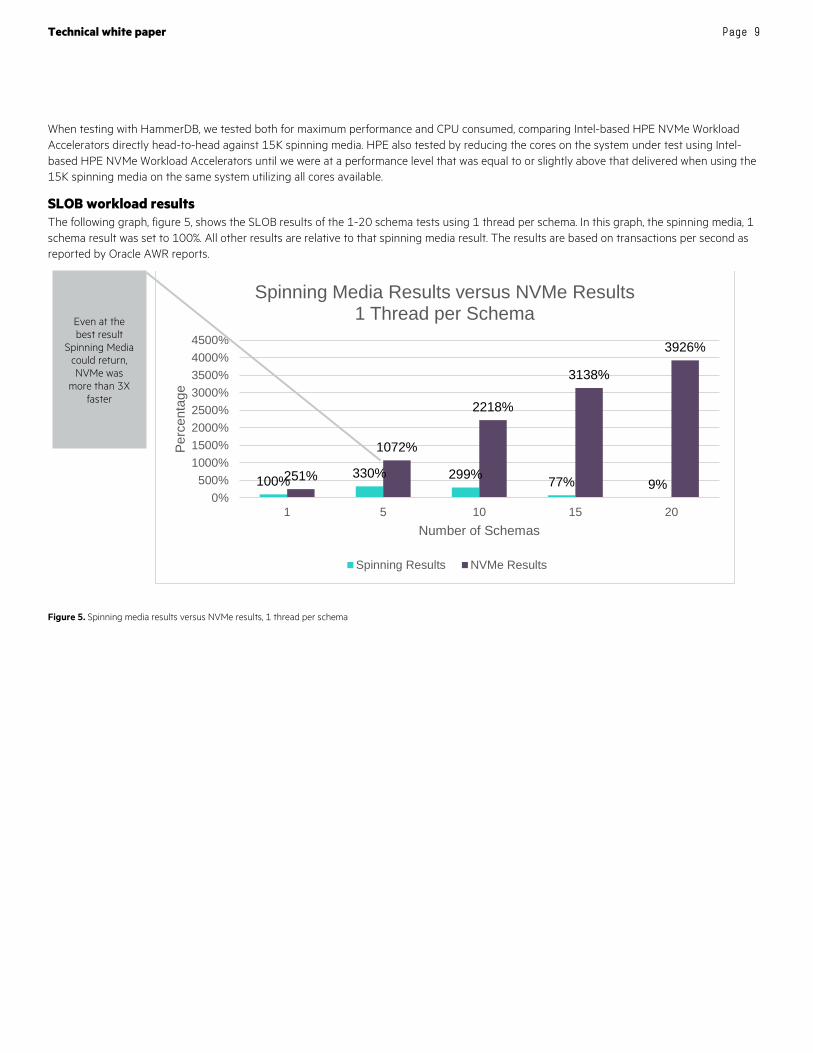
SLOB workload results The following graph, figure 5, shows the SLOB results of the 1-20 schema tests using 1 thread per schema. In this graph, the spinning media, 1 schema result was set to 100%. All other results are relative to that spinning media result. The results are based on transactions per second as reported by Oracle AWR reports.
Figure 5. Spinning media results versus NVMe results, 1 thread per schema
100% 330% 299% 77% 9%251%
1072%
2218%
3138%
3926%
0%500%
1000%1500%2000%2500%3000%3500%4000%4500%
1 5 10 15 20
Perc
enta
ge
Number of Schemas
Spinning Media Results versus NVMe Results1 Thread per Schema
Spinning Results NVMe Results
Even at the best result
Spinning Media could return, NVMe was
more than 3X faster
Technical white paper Page 10
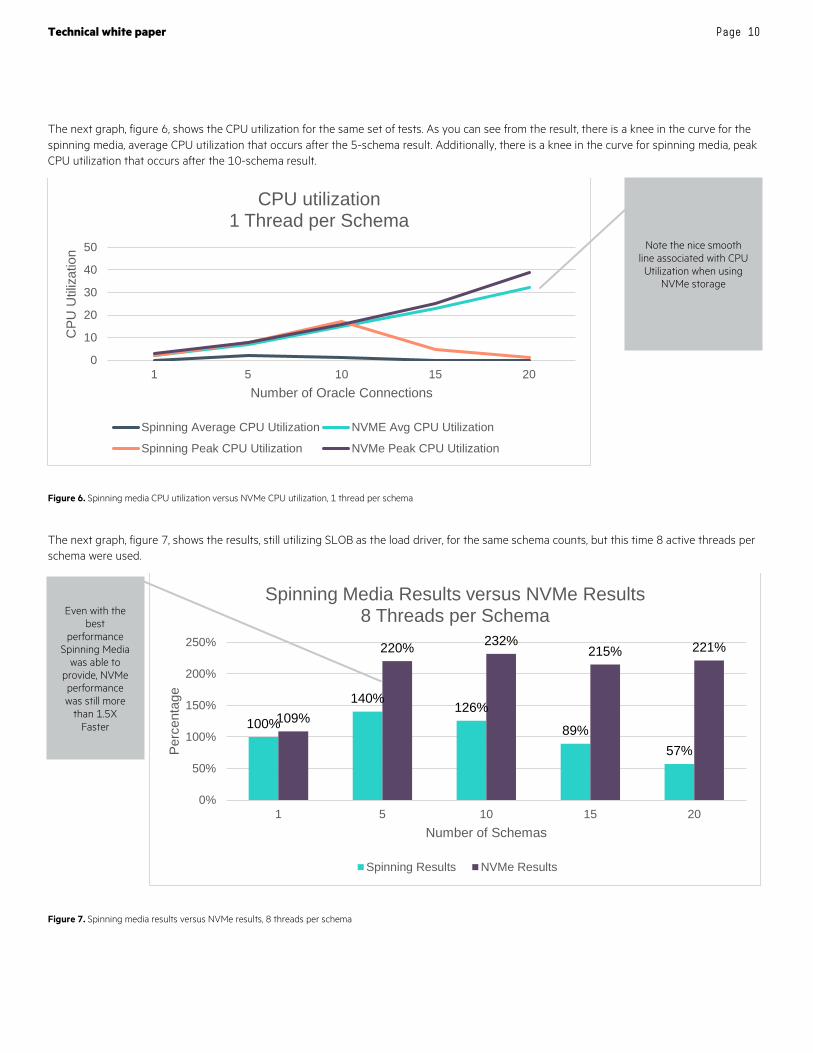
The next graph, figure 6, shows the CPU utilization for the same set of tests. As you can see from the result, there is a knee in the curve for the spinning media, average CPU utilization that occurs after the 5-schema result. Additionally, there is a knee in the curve for spinning media, peak CPU utilization that occurs after the 10-schema result.
Figure 6. Spinning media CPU utilization versus NVMe CPU utilization, 1 thread per schema
The next graph, figure 7, shows the results, still utilizing SLOB as the load driver, for the same schema counts, but this time 8 active threads per schema were used.
Figure 7. Spinning media results versus NVMe results, 8 threads per schema
0
10
20
30
40
50
1 5 10 15 20
CPU
Util
izat
ion
Number of Oracle Connections
CPU utilization1 Thread per Schema
Spinning Average CPU Utilization NVME Avg CPU Utilization
Spinning Peak CPU Utilization NVMe Peak CPU Utilization
100%
140%126%
89%57%
109%
220% 232%215% 221%
0%
50%
100%
150%
200%
250%
1 5 10 15 20
Perc
enta
ge
Number of Schemas
Spinning Media Results versus NVMe Results8 Threads per Schema
Spinning Results NVMe Results
Note the nice smooth line associated with CPU
Utilization when using NVMe storage
Even with the best
performance Spinning Media
was able to provide, NVMe performance was still more
than 1.5X Faster

Technical white paper Page 11
When going with more threads per schema, more CPU resources are consumed providing a higher level of throughput. The following graph, figure 8, depicts the CPU utilization levels required to deliver the results contained in figure 7. As you can see, both the peak and the average CPU utilization levels are higher when using Intel-based HPE NVMe Workload Accelerators as opposed to when using spinning media devices. Again, you can see a definite knee in the performance curve occurring at 10-schemas for both the peak as well as the average CPU utilization levels for spinning media. Conversely, when using Intel-based HPE NVMe Workload Accelerators, the throughput kept rising.
Figure 8. Spinning media CPU utilization versus NVMe CPU utilization, 8 thread per schema
010203040506070
1 5 10 15 20
CPU
Util
izat
ion
Number of Oracle Connections
CPU utilization8 Threads per Schema
Spinning Average CPU Utilization NVME Avg CPU Utilization
Spinning Peak CPU Utilization NVMe Peak CPU Utilization
Note that the average CPU consumed for the NVMe
based results is approximately the same as
the peak CPU consumed for the spinning media results and in all cases provides a
better utilization than spinning media’s average
CPU consumed.

Technical white paper Page 12
The last set of graphs, figures 9 and 10, depict the throughput and CPU utilization levels derived when testing the same number of schemas, only this time we use 16 threads per schema.
Figure 9. Spinning media results versus NVMe results, 16 threads per schema
Figure 10. Spinning media CPU utilization versus NVMe CPU utilization, 16 thread per schema
Oracle licenses are priced by the core. Ideally you want to keep the cores as busy as possible in order to maximize the investment in Oracle licenses.
In all cases, CPU utilization was higher when NVMe was deployed than it was when spinning media was being used. That’s because NVMe were able to better react to the I/O stresses placed on the storage by the SLOB test.
100% 95%75%
50%
16%
115%136% 142% 150%
135%
0%20%40%60%80%
100%120%140%160%
1 5 10 15 20
Perc
enta
ge
Number of Schemas
Spinning Media Results versus NVMe Results16 Threads per Schema
Spinning Results NVMe Results
0
20
40
60
80
1 5 10 15 20
CPU
Util
izat
ion
Number of Oracle Connections
CPU utilization16 Threads per Schema
Spinning Average CPU Utilization NVME Avg CPU Utilization
Spinning Peak CPU Utilization NVMe Peak CPU Utilization
Here we see a 15% performance improvement for
NVMe versus spinning media
The average CPU consumed by
NVMe is almost lockstep with the
peak CPU consumed using spinning media.

Technical white paper Page 13
As the graphs above show the NVMe was able to more fully utilize the available CPU resources.
HammerDB workload results The following graph, figure 11, shows the results with all data normalized to the spinning media results with 20 Oracle connections. That result is set to 100%. As you can see in this graph, there is a knee in curve for the spinning media throughput results that occurs at the 140 connection count level. This also happens with the CPU utilization at the 180 connection count level. Also note that no such knee occurs with either the throughput or CPU utilization for the NVMe results.
Figure 11. HammerDB results anchored to 20 connection count spinning media results
0%
10%
20%
30%
40%
50%
60%
70%
80%
90%
50%
100%
150%
200%
250%
300%
350%
400%
450%
20 40 60 80 100 120 140 160 180 200 220 240
CPU
Util
izat
ion
Perc
enta
ge
Number of Oracle Connections
Spinning Media Results versus NVMe Results
Spinning Results NVMe Results
Spinning Media CPU Utilization NVMe CPU Utilization
Both the throughput results
and the CPU utilization levels for
NVMe are represented in a nice smooth line across the entire
number of connections.
Technical white paper Page 14
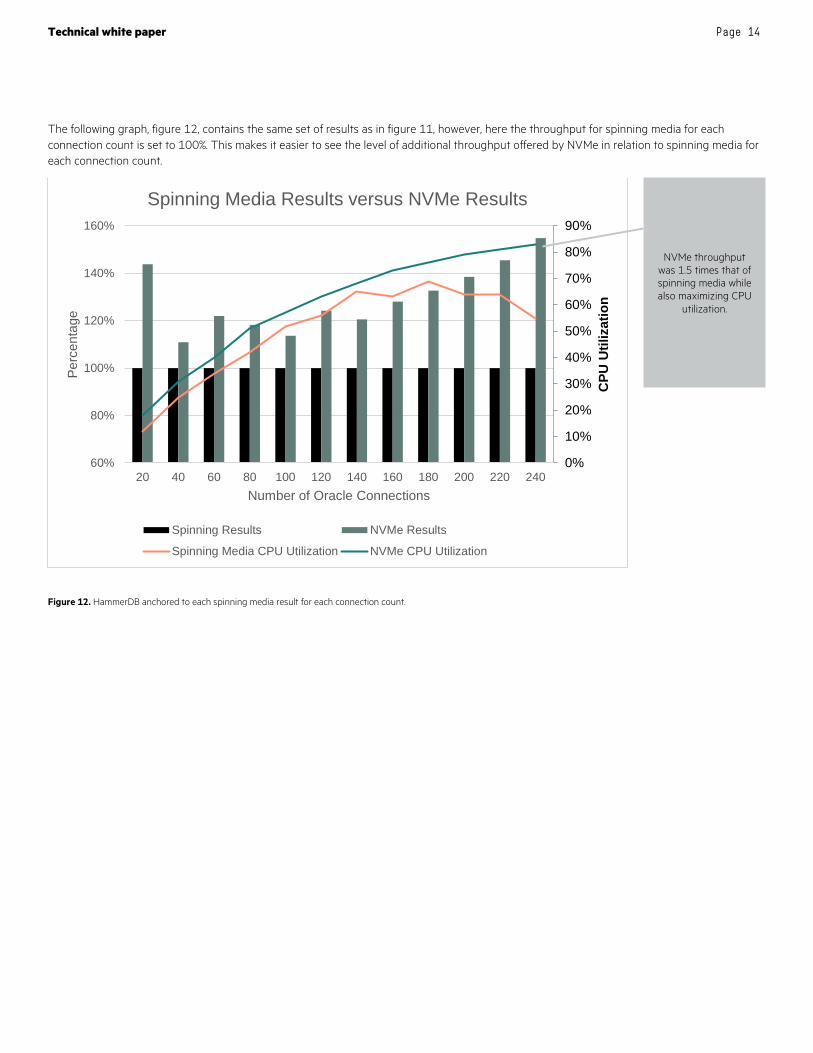
The following graph, figure 12, contains the same set of results as in figure 11, however, here the throughput for spinning media for each connection count is set to 100%. This makes it easier to see the level of additional throughput offered by NVMe in relation to spinning media for each connection count.
Figure 12. HammerDB anchored to each spinning media result for each connection count.
0%
10%
20%
30%
40%
50%
60%
70%
80%
90%
60%
80%
100%
120%
140%
160%
20 40 60 80 100 120 140 160 180 200 220 240
CPU
Util
izat
ion
Perc
enta
ge
Number of Oracle Connections
Spinning Media Results versus NVMe Results
Spinning Results NVMe Results
Spinning Media CPU Utilization NVMe CPU Utilization
NVMe throughput was 1.5 times that of spinning media while also maximizing CPU
utilization.
Technical white paper Page 15
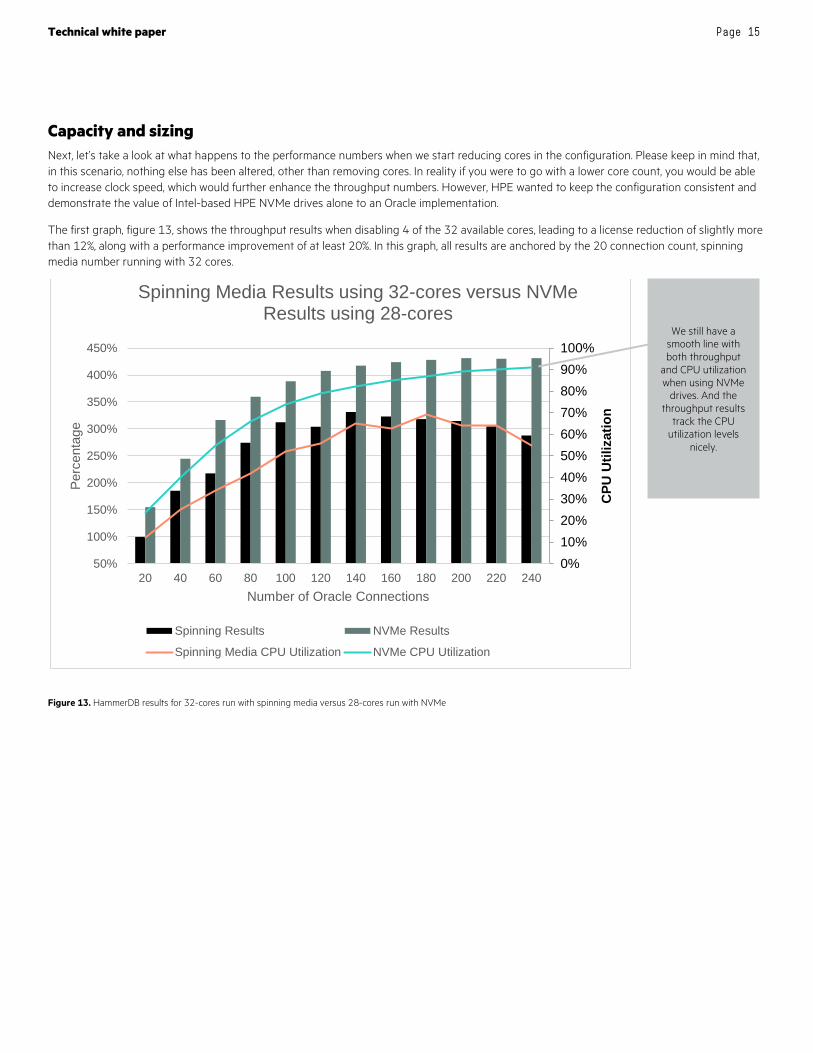
Capacity and sizing Next, let’s take a look at what happens to the performance numbers when we start reducing cores in the configuration. Please keep in mind that, in this scenario, nothing else has been altered, other than removing cores. In reality if you were to go with a lower core count, you would be able to increase clock speed, which would further enhance the throughput numbers. However, HPE wanted to keep the configuration consistent and demonstrate the value of Intel-based HPE NVMe drives alone to an Oracle implementation.
The first graph, figure 13, shows the throughput results when disabling 4 of the 32 available cores, leading to a license reduction of slightly more than 12%, along with a performance improvement of at least 20%. In this graph, all results are anchored by the 20 connection count, spinning media number running with 32 cores.
Figure 13. HammerDB results for 32-cores run with spinning media versus 28-cores run with NVMe
0%10%20%30%40%50%60%70%80%90%100%
50%
100%
150%
200%
250%
300%
350%
400%
450%
20 40 60 80 100 120 140 160 180 200 220 240
CPU
Util
izat
ion
Perc
enta
ge
Number of Oracle Connections
Spinning Media Results using 32-cores versus NVMe Results using 28-cores
Spinning Results NVMe Results
Spinning Media CPU Utilization NVMe CPU Utilization
We still have a smooth line with both throughput
and CPU utilization when using NVMe
drives. And the throughput results
track the CPU utilization levels
nicely.

Technical white paper Page 16
The next graph, figure 14, is for the same test, only this time we set the throughput for each spinning media connection count at 100% to show the available improvement for each of those connection counts.
Figure 14. HammerDB results for spinning media versus NVMe anchored to each connection count.
The difference in performance at the low end is explained by the fact that we have surplus CPU resources available. The number of connections couldn’t fully utilize those available resources, therefore the reduced latency associated with Intel-based HPE NVMe Workload Accelerators more than made up for the reduction in available cores. At the high end, spinning media weren’t fast enough to keep the available cores busy.
0%10%20%30%40%50%60%70%80%90%100%
50%
70%
90%
110%
130%
150%
170%
20 40 60 80 100 120 140 160 180 200 220 240
CPU
Util
izat
ion
Perc
enta
ge
Number of Oracle Connections
Spinning Media Results using 32-cores versus NVMe Results using 28-cores
Spinning Results NVMe Results
Spinning Media CPU Utilization NVMe CPU Utilization
In all cases, more than a 20% throughput
improvement using NVMe. And at the
low end of the connection count and the high end, there was at least 50% improvement
in throughput
Technical white paper Page 17
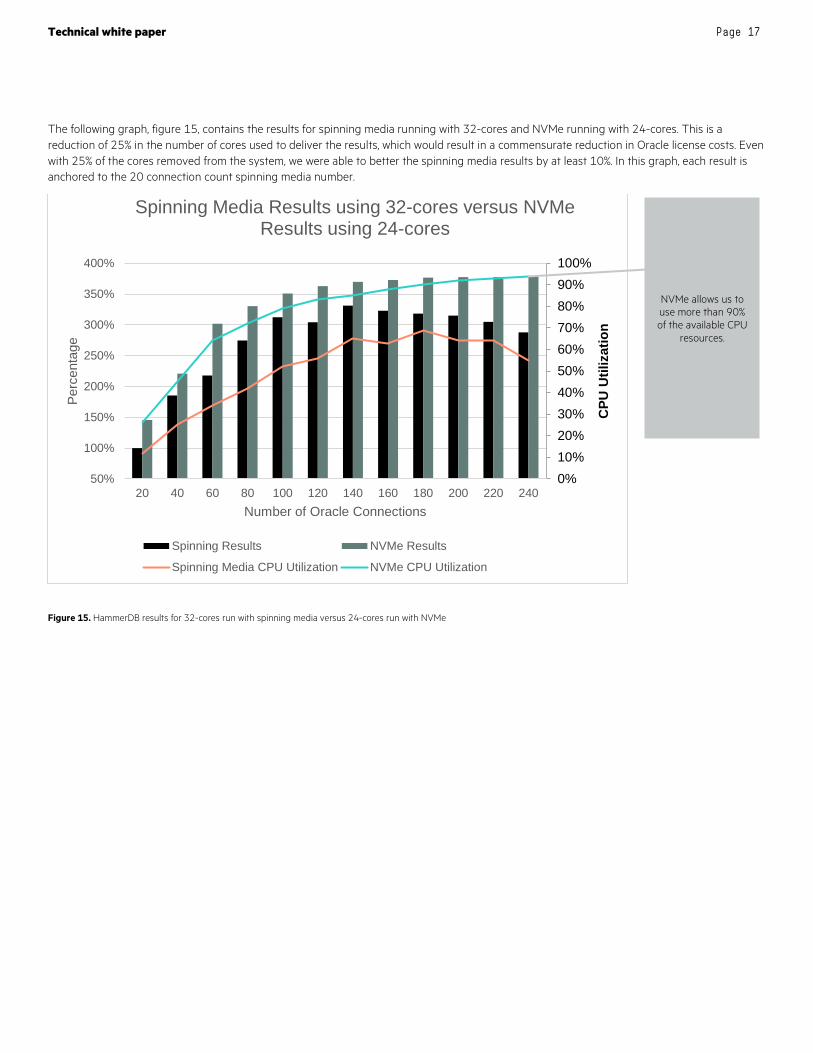
The following graph, figure 15, contains the results for spinning media running with 32-cores and NVMe running with 24-cores. This is a reduction of 25% in the number of cores used to deliver the results, which would result in a commensurate reduction in Oracle license costs. Even with 25% of the cores removed from the system, we were able to better the spinning media results by at least 10%. In this graph, each result is anchored to the 20 connection count spinning media number.
Figure 15. HammerDB results for 32-cores run with spinning media versus 24-cores run with NVMe
0%10%20%30%40%50%60%70%80%90%100%
50%
100%
150%
200%
250%
300%
350%
400%
20 40 60 80 100 120 140 160 180 200 220 240
CPU
Util
izat
ion
Perc
enta
ge
Number of Oracle Connections
Spinning Media Results using 32-cores versus NVMe Results using 24-cores
Spinning Results NVMe Results
Spinning Media CPU Utilization NVMe CPU Utilization
NVMe allows us to use more than 90% of the available CPU
resources.
Technical white paper Page 18
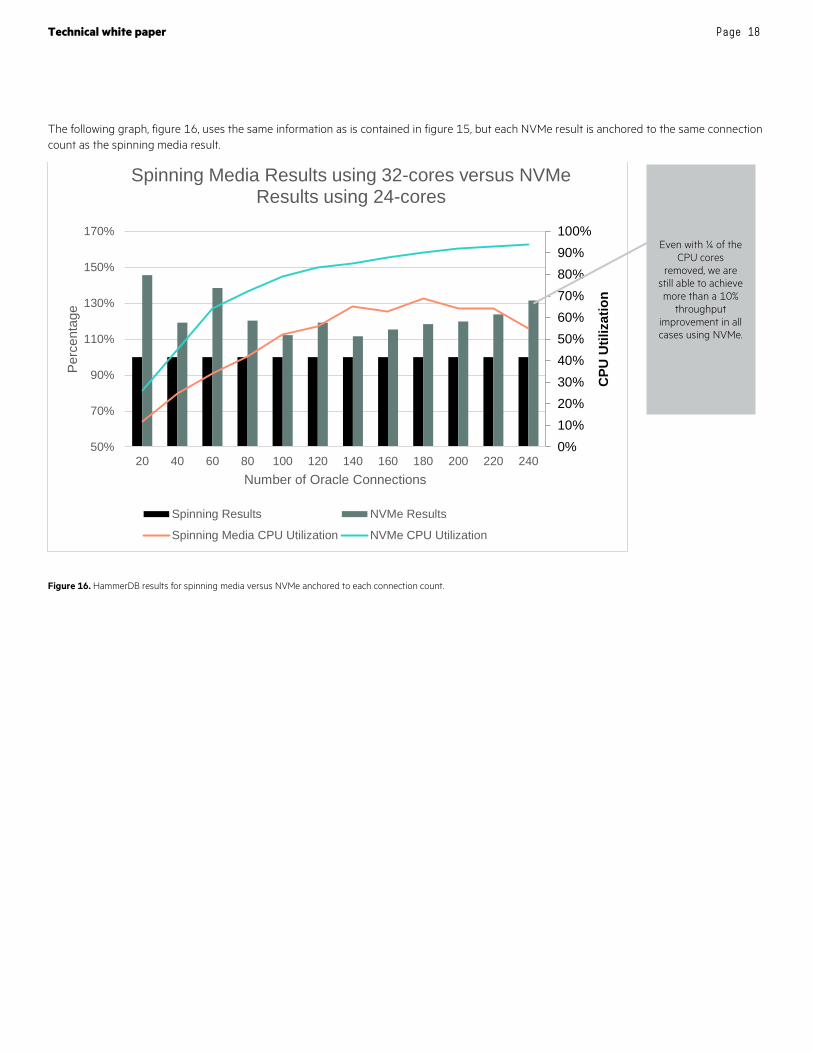
The following graph, figure 16, uses the same information as is contained in figure 15, but each NVMe result is anchored to the same connection count as the spinning media result.
Figure 16. HammerDB results for spinning media versus NVMe anchored to each connection count.
0%10%20%30%40%50%60%70%80%90%100%
50%
70%
90%
110%
130%
150%
170%
20 40 60 80 100 120 140 160 180 200 220 240
CPU
Util
izat
ion
Perc
enta
ge
Number of Oracle Connections
Spinning Media Results using 32-cores versus NVMe Results using 24-cores
Spinning Results NVMe Results
Spinning Media CPU Utilization NVMe CPU Utilization
Even with ¼ of the CPU cores
removed, we are still able to achieve more than a 10%
throughput improvement in all cases using NVMe.

Technical white paper Page 19
The next graph, figure 17, is for NVMe running with 20-cores, while spinning media is running with 32-cores. This is a reduction of more than 37%. While there are a few of connection counts where the NVMe results didn’t exceed the spinning media results, it did surpass them for the majority of the tests.
Figure 17. HammerDB results for 32-cores run with spinning media versus 20-cores run with NVMe
0%10%20%30%40%50%60%70%80%90%100%
50%
100%
150%
200%
250%
300%
350%
20 40 60 80 100 120 140 160 180 200 220 240
CPU
Util
izat
ion
Perc
enta
ge
Number of Oracle Connections
Spinning Media Results using 32-cores versus NVMe Results using 20-cores
Spinning Results NVMe Results
Spinning Media CPU Utilization NVMe CPU Utilization
For all connection counts with the
exception of 100, 140 and 160, NVMe was still able to beat
spinning media.
Technical white paper Page 20
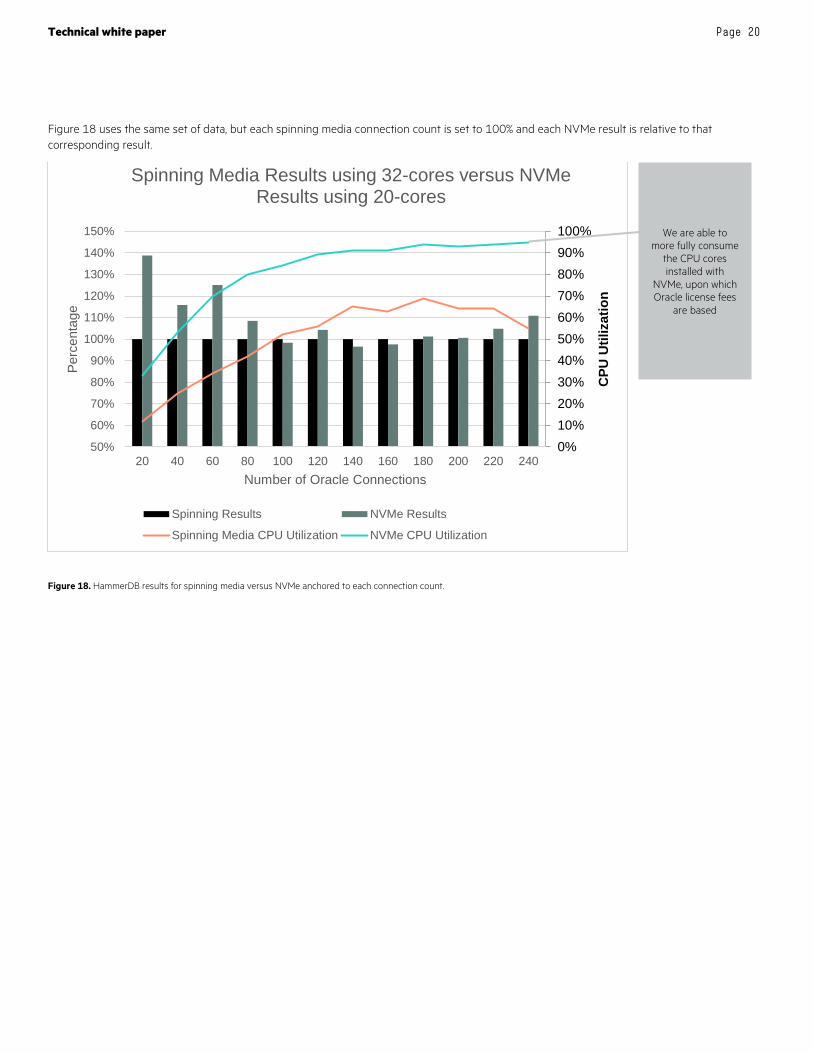
Figure 18 uses the same set of data, but each spinning media connection count is set to 100% and each NVMe result is relative to that corresponding result.
Figure 18. HammerDB results for spinning media versus NVMe anchored to each connection count.
0%10%20%30%40%50%60%70%80%90%100%
50%
60%
70%
80%
90%
100%
110%
120%
130%
140%
150%
20 40 60 80 100 120 140 160 180 200 220 240
CPU
Util
izat
ion
Perc
enta
ge
Number of Oracle Connections
Spinning Media Results using 32-cores versus NVMe Results using 20-cores
Spinning Results NVMe Results
Spinning Media CPU Utilization NVMe CPU Utilization
We are able to more fully consume
the CPU cores installed with
NVMe, upon which Oracle license fees
are based

Technical white paper Page 21
For the 16-core results, we were able to provide better performance for up to 60 connections. Here we were able to match and exceed the 32-core results when there was adequate CPU to process the transactional load. In this set of tests, we eliminated fully 50% of the cores from the configuration. Figure 19 shows the numbers when anchored to the 20-connection count, 32-core spinning media result.
Figure 19. HammerDB results for 32-cores run with spinning media versus 16-cores run with NVMe
0%
10%
20%
30%
40%
50%
60%
70%
80%
90%
50%
70%
90%
110%
130%
150%
170%
190%
210%
230%
250%
20 40 60
CPU
Util
izat
ion
Perc
enta
ge
Number of Oracle Connections
Spinning Media Results using 32-cores versus NVMe Results using 16-cores
Spinning Results NVMe Results
Spinning Media CPU Utilization NVMe CPU Utilization
For customers with lower CPU utilization
levels, using Intel-based HPE NVMe drives allow
for the elimination of 50% of the cores.
Technical white paper Page 22
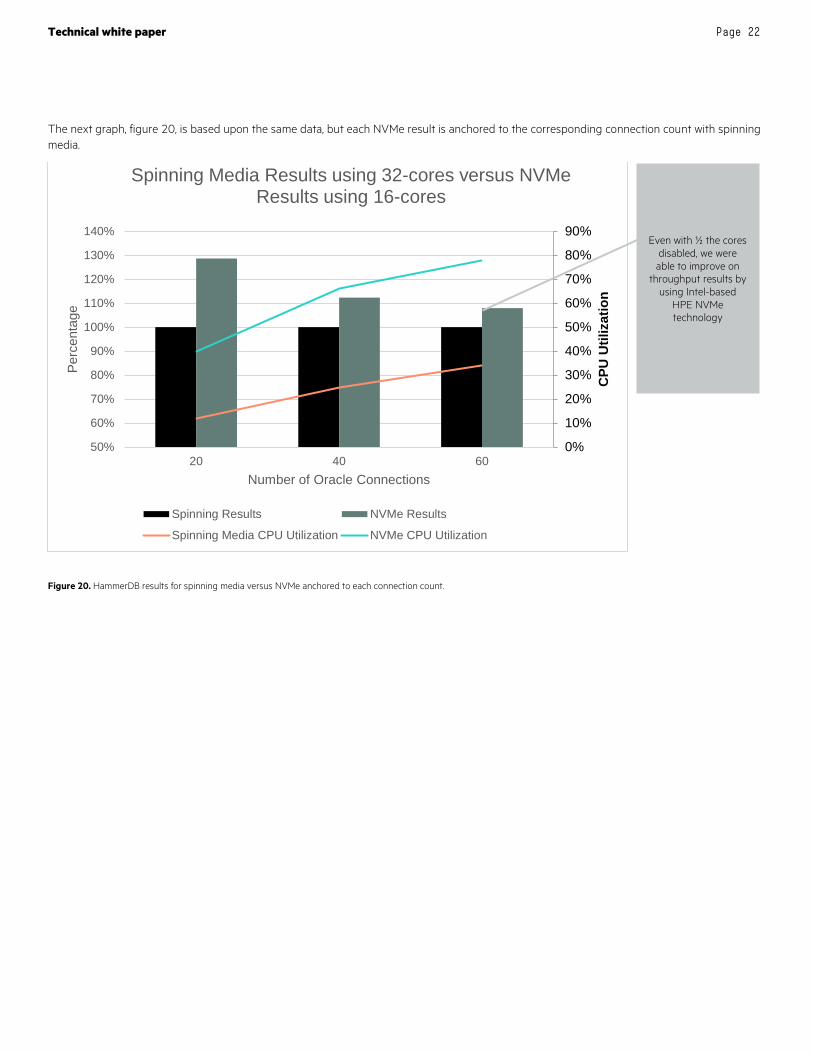
The next graph, figure 20, is based upon the same data, but each NVMe result is anchored to the corresponding connection count with spinning media.
Figure 20. HammerDB results for spinning media versus NVMe anchored to each connection count.
0%
10%
20%
30%
40%
50%
60%
70%
80%
90%
50%
60%
70%
80%
90%
100%
110%
120%
130%
140%
20 40 60
CPU
Util
izat
ion
Perc
enta
ge
Number of Oracle Connections
Spinning Media Results using 32-cores versus NVMe Results using 16-cores
Spinning Results NVMe Results
Spinning Media CPU Utilization NVMe CPU Utilization
Even with ½ the cores disabled, we were able to improve on
throughput results by using Intel-based
HPE NVMe technology
Technical white paper Page 23
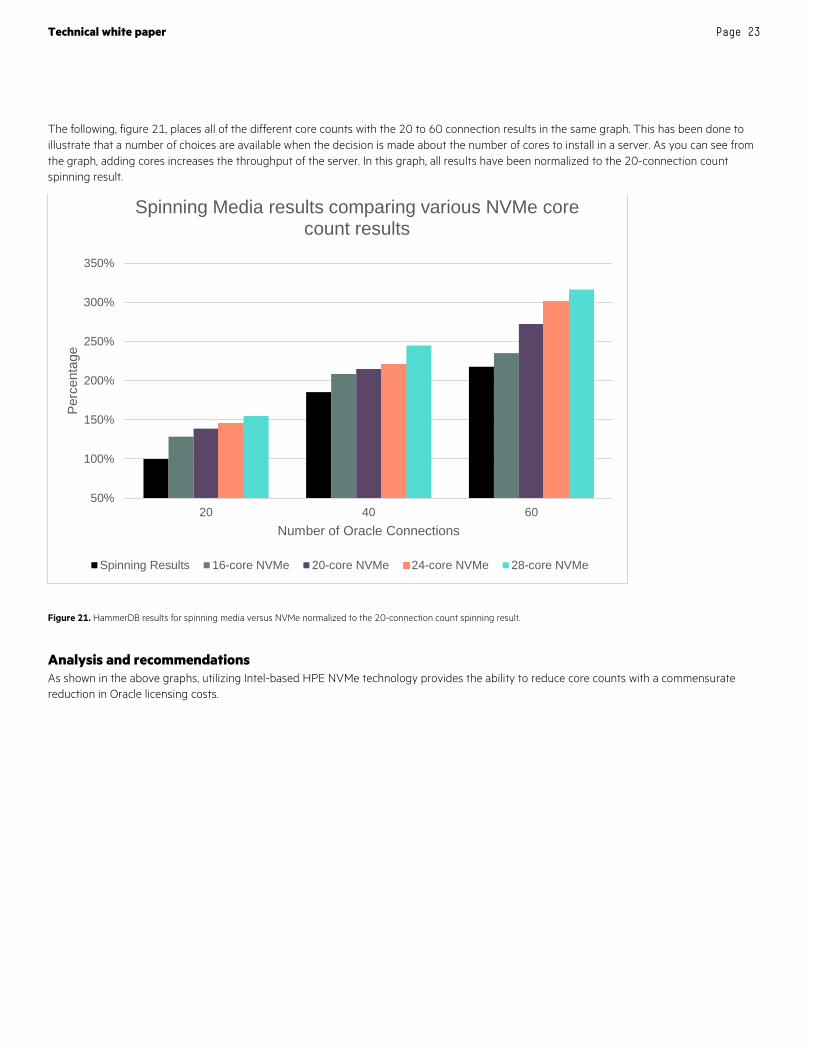
The following, figure 21, places all of the different core counts with the 20 to 60 connection results in the same graph. This has been done to illustrate that a number of choices are available when the decision is made about the number of cores to install in a server. As you can see from the graph, adding cores increases the throughput of the server. In this graph, all results have been normalized to the 20-connection count spinning result.
Figure 21. HammerDB results for spinning media versus NVMe normalized to the 20-connection count spinning result.
Analysis and recommendations As shown in the above graphs, utilizing Intel-based HPE NVMe technology provides the ability to reduce core counts with a commensurate reduction in Oracle licensing costs.
50%
100%
150%
200%
250%
300%
350%
20 40 60
Perc
enta
ge
Number of Oracle Connections
Spinning Media results comparing various NVMe core count results
Spinning Results 16-core NVMe 20-core NVMe 24-core NVMe 28-core NVMe
Technical white paper Page 24
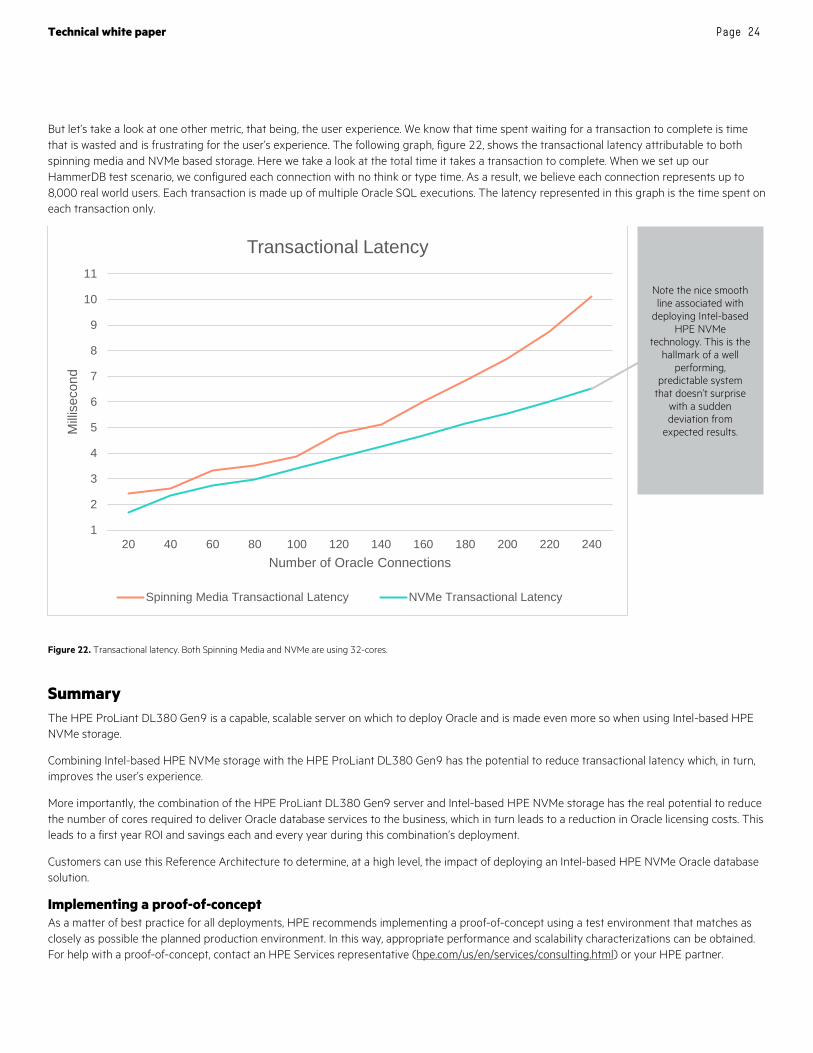
But let’s take a look at one other metric, that being, the user experience. We know that time spent waiting for a transaction to complete is time that is wasted and is frustrating for the user’s experience. The following graph, figure 22, shows the transactional latency attributable to both spinning media and NVMe based storage. Here we take a look at the total time it takes a transaction to complete. When we set up our HammerDB test scenario, we configured each connection with no think or type time. As a result, we believe each connection represents up to 8,000 real world users. Each transaction is made up of multiple Oracle SQL executions. The latency represented in this graph is the time spent on each transaction only.
Figure 22. Transactional latency. Both Spinning Media and NVMe are using 32-cores.
Summary The HPE ProLiant DL380 Gen9 is a capable, scalable server on which to deploy Oracle and is made even more so when using Intel-based HPE NVMe storage.
Combining Intel-based HPE NVMe storage with the HPE ProLiant DL380 Gen9 has the potential to reduce transactional latency which, in turn, improves the user’s experience.
More importantly, the combination of the HPE ProLiant DL380 Gen9 server and Intel-based HPE NVMe storage has the real potential to reduce the number of cores required to deliver Oracle database services to the business, which in turn leads to a reduction in Oracle licensing costs. This leads to a first year ROI and savings each and every year during this combination’s deployment.
Customers can use this Reference Architecture to determine, at a high level, the impact of deploying an Intel-based HPE NVMe Oracle database solution.
Implementing a proof-of-concept As a matter of best practice for all deployments, HPE recommends implementing a proof-of-concept using a test environment that matches as closely as possible the planned production environment. In this way, appropriate performance and scalability characterizations can be obtained. For help with a proof-of-concept, contact an HPE Services representative (hpe.com/us/en/services/consulting.html) or your HPE partner.
1
2
3
4
5
6
7
8
9
10
11
20 40 60 80 100 120 140 160 180 200 220 240
Milli
seco
nd
Number of Oracle Connections
Transactional Latency
Spinning Media Transactional Latency NVMe Transactional Latency
Note the nice smooth line associated with
deploying Intel-based HPE NVMe
technology. This is the hallmark of a well
performing, predictable system
that doesn’t surprise with a sudden deviation from
expected results.

Technical white paper Page 25
Appendix A: Bill of materials
Note Part numbers are at time of testing and subject to change. The bill of materials does not include complete support options or other rack and power requirements. If you have questions regarding ordering, please consult with your HPE Reseller or HPE Sales Representative for more details, hpe.com/us/en/services/consulting.html.
Table 1a. Bill of materials for the Spinning Media HPE ProLiant solution
Qty Part number Description
HPE DL380 Gen9 24SFF CTO Server [#1]
1 767032-B21 HPE DL380 Gen9 24SFF CTO Server
1 817953-L21 HPE DL380 Gen9 E5-2683v4 FIO Kit
1 817953-B21 HPE DL380 Gen9 E5-2683v4 Kit
16 805351-B21 HPE 32GB 2Rx4 PC4-2400T-R Kit
24 759208-B21 HPE 300GB 12G SAS 15K 2.5in SC ENT HDD
1 719073-B21 HPE DL380 Gen9 Secondary Riser
1 761872-B21 HPE Smart Array P440/4G FIO Controller
1 727250-B21 HPE 12Gb DL380 Gen9 SAS Expander Card
1 779799-B21 HPE Ethernet 10Gb 2P 546FLR-SFP+ Adptr
1 733660-B21 HPE 2U SFF Easy Install Rail Kit
2 720478-B21 HPE 500W FS Plat Ht Plg Pwr Supply Kit
Table 1b. Bill of materials for the NVMe HPE ProLiant solution
Qty Part number Description
HPE DL380 Gen9 24SFF CTO Server [#1]
1 767032-B21 HPE DL380 Gen9 24SFF CTO Server
1 817953-L21 HPE DL380 Gen9 E5-2683v4 FIO Kit
1 817953-B21 HPE DL380 Gen9 E5-2683v4 Kit
16 805351-B21 HPE 32GB 2Rx4 PC4-2400T-R Kit
2 759208-B21 HPE 300GB 12G SAS 15K 2.5in SC ENT HDD
1 719073-B21 HPE DL380 Gen9 Secondary Riser
1 761872-B21 HPE Smart Array P440/4G FIO Controller
1 727250-B21 HPE 12Gb DL380 Gen9 SAS Expander Card
1 779799-B21 HPE Ethernet 10Gb 2P 546FLR-SFP+ Adptr
1 733660-B21 HPE 2U SFF Easy Install Rail Kit
4 803204-B21 HPE 2.0TB NVMe MU HH PCIe Accelerator
2 720478-B21 HPE 500W FS Plat Ht Plg Pwr Supply Kit
Technical white paper Page 26
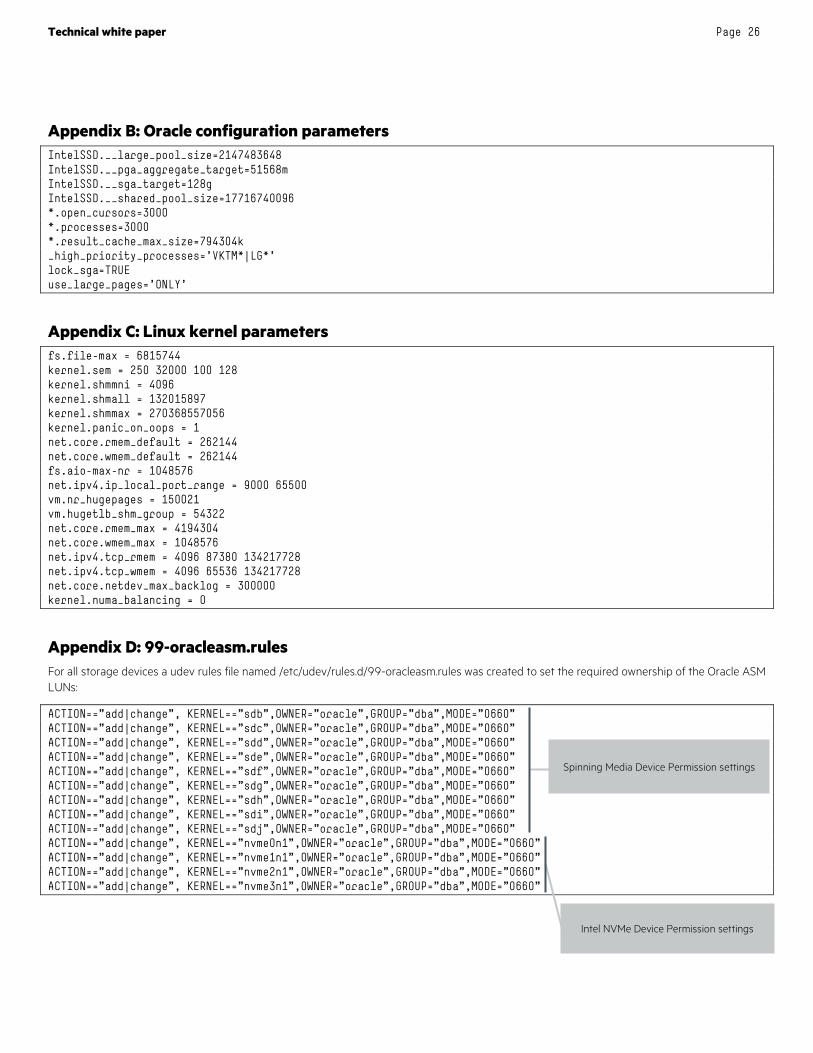
Appendix B: Oracle configuration parameters IntelSSD.__large_pool_size=2147483648 IntelSSD.__pga_aggregate_target=51568m IntelSSD.__sga_target=128g IntelSSD.__shared_pool_size=17716740096 *.open_cursors=3000 *.processes=3000 *.result_cache_max_size=794304k _high_priority_processes='VKTM*|LG*' lock_sga=TRUE use_large_pages='ONLY'
Appendix C: Linux kernel parameters fs.file-max = 6815744 kernel.sem = 250 32000 100 128 kernel.shmmni = 4096 kernel.shmall = 132015897 kernel.shmmax = 270368557056 kernel.panic_on_oops = 1 net.core.rmem_default = 262144 net.core.wmem_default = 262144 fs.aio-max-nr = 1048576 net.ipv4.ip_local_port_range = 9000 65500 vm.nr_hugepages = 150021 vm.hugetlb_shm_group = 54322 net.core.rmem_max = 4194304 net.core.wmem_max = 1048576 net.ipv4.tcp_rmem = 4096 87380 134217728 net.ipv4.tcp_wmem = 4096 65536 134217728 net.core.netdev_max_backlog = 300000 kernel.numa_balancing = 0
Appendix D: 99-oracleasm.rules For all storage devices a udev rules file named /etc/udev/rules.d/99-oracleasm.rules was created to set the required ownership of the Oracle ASM LUNs:
ACTION=="add|change", KERNEL=="sdb",OWNER="oracle",GROUP="dba",MODE="0660" ACTION=="add|change", KERNEL=="sdc",OWNER="oracle",GROUP="dba",MODE="0660" ACTION=="add|change", KERNEL=="sdd",OWNER="oracle",GROUP="dba",MODE="0660" ACTION=="add|change", KERNEL=="sde",OWNER="oracle",GROUP="dba",MODE="0660" ACTION=="add|change", KERNEL=="sdf",OWNER="oracle",GROUP="dba",MODE="0660" ACTION=="add|change", KERNEL=="sdg",OWNER="oracle",GROUP="dba",MODE="0660" ACTION=="add|change", KERNEL=="sdh",OWNER="oracle",GROUP="dba",MODE="0660" ACTION=="add|change", KERNEL=="sdi",OWNER="oracle",GROUP="dba",MODE="0660" ACTION=="add|change", KERNEL=="sdj",OWNER="oracle",GROUP="dba",MODE="0660" ACTION=="add|change", KERNEL=="nvme0n1",OWNER="oracle",GROUP="dba",MODE="0660" ACTION=="add|change", KERNEL=="nvme1n1",OWNER="oracle",GROUP="dba",MODE="0660" ACTION=="add|change", KERNEL=="nvme2n1",OWNER="oracle",GROUP="dba",MODE="0660" ACTION=="add|change", KERNEL=="nvme3n1",OWNER="oracle",GROUP="dba",MODE="0660"
Spinning Media Device Permission settings
Intel NVMe Device Permission settings

Technical white paper Page 27
Sign up for updates
© Copyright 2016 Hewlett Packard Enterprise Development LP. The information contained herein is subject to change without notice. The only warranties for Hewlett Packard Enterprise products and services are set forth in the express warranty statements accompanying such products and services. Nothing herein should be construed as constituting an additional warranty. Hewlett Packard Enterprise shall not be liable for technical or editorial errors or omissions contained herein.
Oracle is a registered trademark of Oracle and/or its affiliates. Intel and Xeon are trademarks of Intel Corporation in the U.S. and other countries. Red Hat is a registered trademark of Red Hat, Inc. in the United States and other countries. Linux is the registered trademark of Linus Torvalds in the U.S. and other countries. ENERGY STAR is a registered mark owned by the U.S. government.
4AA6-8985ENW, December 2016
Resources and additional links HPE Reference Architectures, hpe.com/info/dm-ra
HPE Servers, hpe.com/servers
HPE Storage, hpe.com/storage
HPE ProLiant DL380 Gen9 server, hpe.com/us/en/product-catalog/servers/proliant-servers/pip.hpe-proliant-dl380-gen9-server.7271241.html
To help us improve our documents, please provide feedback at hpe.com/contact/feedback.