HOW'S THE PREACHING? YOUNG LISTENERS ...S THE PREACHING? YOUNG LISTENERS' RESPONSE TO THE HOMILY...
39
Bellinger/Are You Talking to Me?/Chapter 4/page 1 © 2012 Karla Bellinger HOW'S THE PREACHING? YOUNG LISTENERS' RESPONSE TO THE HOMILY LAST HEARD Let no one despise you for your youth... —I Timothy 4:12 We were halfway through the discussion in the focus group when a blond sixteen year old shifted his chair around the table to face me. He leaned forward and earnestly told the group that he planned to become a priest. This discussion on preaching interested him greatly. He declared: You need to get this information to the younger priests. This input could help the ones who are learning how to preach. Go to a seminary. Tell them what we have said. 1 A seventeen year old girl across the table added, If we are going to be open to listening to their homilies every week, or more than once a week, they should be open to listening to our advice about it. If they’re standing in for God at Mass because they’re presiding, also seeing us as all being equal, hopefully, they will be open to listening to what we have to say. This is a generation which is accustomed to interaction. As I write this, Super Bowl XLVI advertisers are preparing to invite viewers to interact with the commercials that they will see on the screen. No longer satisfied to let us lounge in a recliner and stare at the big screen, Audi will be prompting consumers to tweet about their commercials; Go-Daddy is enhancing ads with quick-response codes (QR) which will take people to a website to see more ad content and download coupons. We inhabit a two-way world. Young people ask questions and register their opinions. They grow up expecting to be heard. 1 The average age at which the ordained class of 2011 decided to enter the priesthood was also 16. Center for Applied Research in the Apostolate (CARA), “The Class of 2011: Survey of Ordinands to the Priesthood,” CARA, http://www.usccb.org/beliefs-and-teachings/vocations/ordination-class/upload/ ordination-class-2011- report.pdf [accessed July 12, 2011].
Transcript of HOW'S THE PREACHING? YOUNG LISTENERS ...S THE PREACHING? YOUNG LISTENERS' RESPONSE TO THE HOMILY...

Bellinger/Are You Talking to Me?/Chapter 4/page 1
© 2012 Karla Bellinger
HOW'S THE PREACHING?
YOUNG LISTENERS' RESPONSE TO THE HOMILY LAST HEARD
Let no one despise you for your youth...
—I Timothy 4:12
We were halfway through the discussion in the focus group when a blond sixteen year
old shifted his chair around the table to face me. He leaned forward and earnestly told the group
that he planned to become a priest. This discussion on preaching interested him greatly. He
declared:
You need to get this information to the younger priests. This input could help the ones
who are learning how to preach. Go to a seminary. Tell them what we have said.1
A seventeen year old girl across the table added,
If we are going to be open to listening to their homilies every week, or more than once a
week, they should be open to listening to our advice about it. If they’re standing in for
God at Mass because they’re presiding, also seeing us as all being equal, hopefully, they
will be open to listening to what we have to say.
This is a generation which is accustomed to interaction. As I write this, Super Bowl
XLVI advertisers are preparing to invite viewers to interact with the commercials that they will
see on the screen. No longer satisfied to let us lounge in a recliner and stare at the big screen,
Audi will be prompting consumers to tweet about their commercials; Go-Daddy is enhancing ads
with quick-response codes (QR) which will take people to a website to see more ad content and
download coupons. We inhabit a two-way world. Young people ask questions and register their
opinions. They grow up expecting to be heard.
1The average age at which the ordained class of 2011 decided to enter the priesthood was also 16. Center
for Applied Research in the Apostolate (CARA), “The Class of 2011: Survey of Ordinands to the Priesthood,”
CARA, http://www.usccb.org/beliefs-and-teachings/vocations/ordination-class/upload/ ordination-class-2011-
report.pdf [accessed July 12, 2011].
Bellinger/Are You Talking to Me?/Chapter 4/page 2
© 2012 Karla Bellinger
The opening query of this thesis was the question: God, if you are here, are you talking to
me? Is there a word from the Lord for us this day? If preaching is the bread and butter of
discipleship as postulated in chapter 1, the stories and illustrations from chapter 3 paint pictures
of individual experiences of connection and growth in faith. It seems as though the Holy Spirit,
the “Connector,” is at work in their lives. How many of them experience Sunday preaching as a
locus of encounter and faith growth? As a group, how common is this—does it happen often?
This chapter will look at their collective quantitative responses to ask: what do these
young disciples have to say to the Church about preaching? The first section will describe the
demographics of both listeners and preachers. Statistics of response to the person of the preacher
constitute the second part. The evaluation of the homily in the third subdivision of this chapter
will be presented as short-term responses, long-term take-away, and relationships. The final
segment will discuss key findings of the study. To begin, who are these young disciples who
have so much to say about preaching?
Demographics of the Study
Self-Described Characteristics of Listeners
In May and September of 2011, seven Catholic high schools: two from New York and
one each from California, Maine, Ohio, Louisiana, and Indiana, participated in the paper survey
Are You Talking to Me? A Study of Young Listeners’ Connection with Catholic Sunday
Preaching. 2
Of these schools, three were inner city schools, three were suburban, and one was
rural. The focus groups from Ohio completed their discussions of preaching by also filling out
the paper survey. The average age of the 561 respondents was 16.2 years old.
As a random cluster sample, in five of these schools, all of the students in a particular
2A sample of the paper survey Are You Talking to Me? is found at http://www.thecenterforpep.com/our-
work/research-initiatives/are-you-talking-to-me-a-study-of-young-listeners-connection-with-sunday-preaching/

Bellinger/Are You Talking to Me?/Chapter 4/page 3
© 2012 Karla Bellinger
teacher’s theology classes responded to the questions of the survey. Two schools required
permission slips of the students’ parents, therefore only those with the proper paperwork
answered the questions. Of these, 470 were baptized Catholics representing 203 Catholic
parishes. Of that Catholic population, 294 (63%) attended Mass at least once a month (Group I),3
which was the baseline for inclusion in the evaluation of the preacher that they last heard (table
4.1).
The other baptized Catholics (37%), those who did not attend once a month (Group II),
answered a second bank of questions including “Why not?” Ninety-one of the respondents were
non-Catholics who described themselves as atheist, agnostic, Orthodox, various kinds of
Protestants, Hindu, Muslim, Jewish, Sikh, Taoist, Rastafarian, animist, Deist, Wiccan, and
nothing (Group III). The population was sought for its diversity of parishes and geography,
clarity of articulation, and ease of administration.
In ethnicity, the make-up of the Group I sample population was broadly similar to the
United States population of Catholic high school students. The African-American
3Coincidentally, 63% is the same percentage of Catholic adults who attended Mass at least once per month
in 2005 as determined from the chart on page three of: Center for Applied Research in the Apostolate (CARA),
“Self-reported Mass Attendance of U.S. Catholics Unchanged during Last Five Years,” CARA,
http://cara.georgetown.edu/ AttendPR.pdf [accessed 7-15-11].
Table 4.1. All Respondents Grouped by Faith Tradition and Attendance Response
Grouping Number % of Total
% of
Catholics
Surveyed
Number of
Males
% of
Group
that is
Male
Number of
Females
% of
Group
that is
Female
Group I – Baptized Catholic,
attends Mass at least once per month 294 52 63 184 63 110 37
Group II – Baptized Catholic,
does not attend Mass at least once per month 176 31 37 89 51 87 49
Group III – Non-Catholic 91 16 --- 51 56 40 44
Total 561 99 100 324 58 237 42
Source: Are You Talking to Me? questions 8 and 9

Bellinger/Are You Talking to Me?/Chapter 4/page 4
© 2012 Karla Bellinger
Table 4.2. Group I – Self-described student race
Race
Number Percentage
National Average
for Catholic
Secondary
Schools4
White or European 223 75.8 68.6
Hispanic or South American 24 8.2 12.3
Asian or Asian-American 14 4.7 4.4
Black or African-American 8 2.8 8.2
Filipino/a 7 2.4 1
Creole 1 0.3 N/A
No Response 17 5.8
Total 294 100.0
Source: Are You Talking to Me? Question 5
population was considerably lower than the national average and the Hispanic population
somewhat lower, perhaps due to regional differences (table 4.2). The Filipino population of the
current study was higher than the national average. Catholic high school students come from
more affluent and educated families than the broader U.S. teen population.5 Economic data was
not collected in this survey, but the characteristics of the particular schools as described by their
respective websites would indicate that this may also hold true for the population sampled.
As discussed in chapter 1, in his nationally representative sample of U.S. teens, Smith
found Catholic teenagers to be religiously lax in all of his measures of religiosity when compared
to their counterparts in Protestant faiths.6 As I designed this study, I wondered how (and/or if)
the respondents’ faith life would impact how he or she evaluated and responded to Sunday
preaching. Therefore, questions 41-49 and 64-68 in the survey, “Your Way of Seeing the
4National Catholic Education Association (NCEA), “Catholic School Data, United States Catholic
Elementary and Secondary Schools 2010-2011, The Annual Statistical Report on Schools, Enrollment and Staffing,”
NCEA, http://www.ncea.org/news/annualdatareport.asp#ethnicity [accessed 1-17-12]. 5Smith, 212.
6Smith, 209.

Bellinger/Are You Talking to Me?/Chapter 4/page 5
© 2012 Karla Bellinger
World,” inquire about personal faith life.
Their strongest reply about faith was belief in God (question 47): 87.4 % of students in
these Catholic schools agreed in some way (combining “strongly agree” with “somewhat agree”)
that they believed in God. Those who disagreed (combining strongly disagree and disagree) were
6.2 % and those who neither agreed nor disagreed that they believed in God were also 6.3 %.
Most considered themselves to be spiritual and/or religious. They were generally pretty happy
with their lives (see Figure 4.1). For the baptized Catholics who did not attend church (Group II),
they disagreed that going to church matters to them. For the group who did go to Mass at least
once a month (Group I), the agreement tended somewhat lackadaisically toward its importance.
Group III was a combination of church-going Protestants and non-church-goers, so that mean is
mixed by responses from both sides.
Figure 4.1. Mean values from questions 41-49 and 64-69; 5=strongly agree, 4=somewhat agree, 3=neither agree nor
disagree, 2= somewhat disagree, 1=strongly disagree.7
7The average of Likert scale values does not represent a true mean since the distance between the intervals
may not be perceived by the respondent as equidistant. These figures are an indication of central tendency; for the
average response to hover around the value 3 demonstrates that about as many disagree as agree.
1
1.5
2
2.5
3
3.5
4
4.5
5
41/64. I Believe in God
47. Following Jesus is
important to my family
42/65. I consider myself
religious and/or
spiritual
45/66. I am happy with the way my life is going
48/69. My parish helps
me grow spiritually
43/67. Going to church
matters a lot to me
44. I'm involved in my
faith more than Mass
49. I talk to others about
my faith
46/68. My friends are
strong in their faith
Describe Your Own Religious Life
Group I Group II Group III

Bellinger/Are You Talking to Me?/Chapter 4/page 6
© 2012 Karla Bellinger
For parents who both pay Catholic school tuition and get their teenagers to Mass
regularly, they can be reassured that their offspring know that following Jesus is important to
their families. Support structures that undergird the faith of these young people (other than
family) ranked lower.8 Smith found that 11% of all Catholic youth in his 2002-2003 study
participated in religious activities outside of Mass.9 The responses to this study reflected
similarly: there was a moderately low influence of parish, extra-liturgical involvement, and
friendships in faith. In general, as an average, peer faith support seemed weak for these Catholic
high school students even though they were surrounded daily by the accouterments of faith in a
Catholic institution.
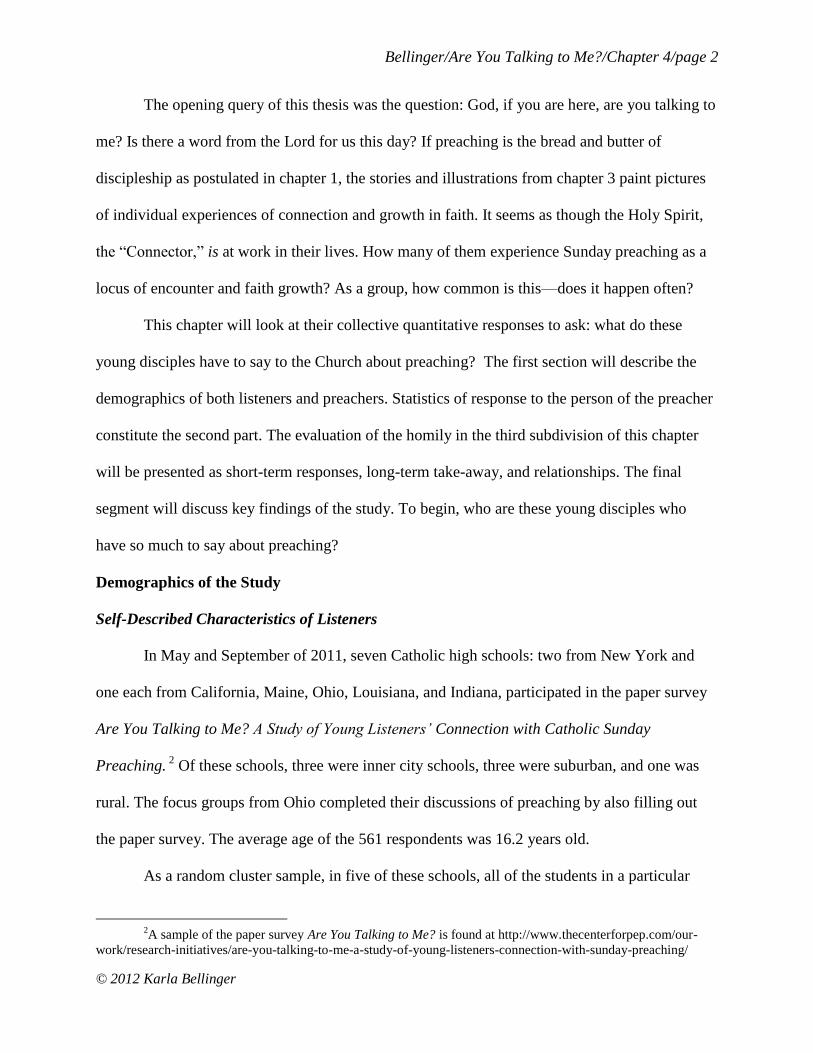
Initially, the set of questions 50-58 and 70-78, “The Person of the Listener,” was created
to correlate response to the homily with values which the listener deemed important. Yet one
discovery became immediately clear: the highest average value in all three groups was
overwhelmingly “trying to be a good person.” The lowest two were “making God first in my
life” followed by the rock bottom value: “praying.” Though the students merely rated each of
these values as to their importance, when ranked, the order across each of the three populations
was identical—the numerical values varied between attending and non-attending, but the
sequence of values did not change (figure 4.2).
8Lisa D. Pearce and Melinda Lundquist Denton, A Faith of their Own: Stability and Change in the
Religiosity of America’s Adolescents, New York: Oxford University Press, 2011, 143-170. Pearce and Denton
describe interviews with adolescents about the sources of social scaffolding which impact their refinement of
religious identity. 9Smith, 209.
Bellinger/Are You Talking to Me?/Chapter 4/page 7
© 2012 Karla Bellinger
Figure 4.2. Mean values from questions 50-58 and 70-78: 5=really important, 4=important, 3=somewhat important,
2= not important, 1=not at all important.
Trying to be a good person mattered. Being God’s person was not as important—it
ranked lower than good grades, an active social life, excelling in extracurriculars, and getting
along with parents. This was a consistent finding between Catholic and non-Catholic youth.
Smith described similar beliefs in his study of American youth—religion is only one element
among the many other things that young people in our country value and are involved in.
According to Smith, teenagers believe that there is a God; God is useful when life has problems,
God wants people to get along amiably, be happy and feel good; and good people go to heaven.10
The stated values of the studied population broadly fit with this mainstream cultural belief.
The baseline for inclusion into the evaluation of the Sunday homily was attending Mass
at least once per month. Therefore, the student data henceforth described in this chapter will be
10
Smith, 163.
1
1.5
2
2.5
3
3.5
4
4.5
5
Values Important to my Life
Group I
Group II
Group III
Bellinger/Are You Talking to Me?/Chapter 4/page 8
© 2012 Karla Bellinger
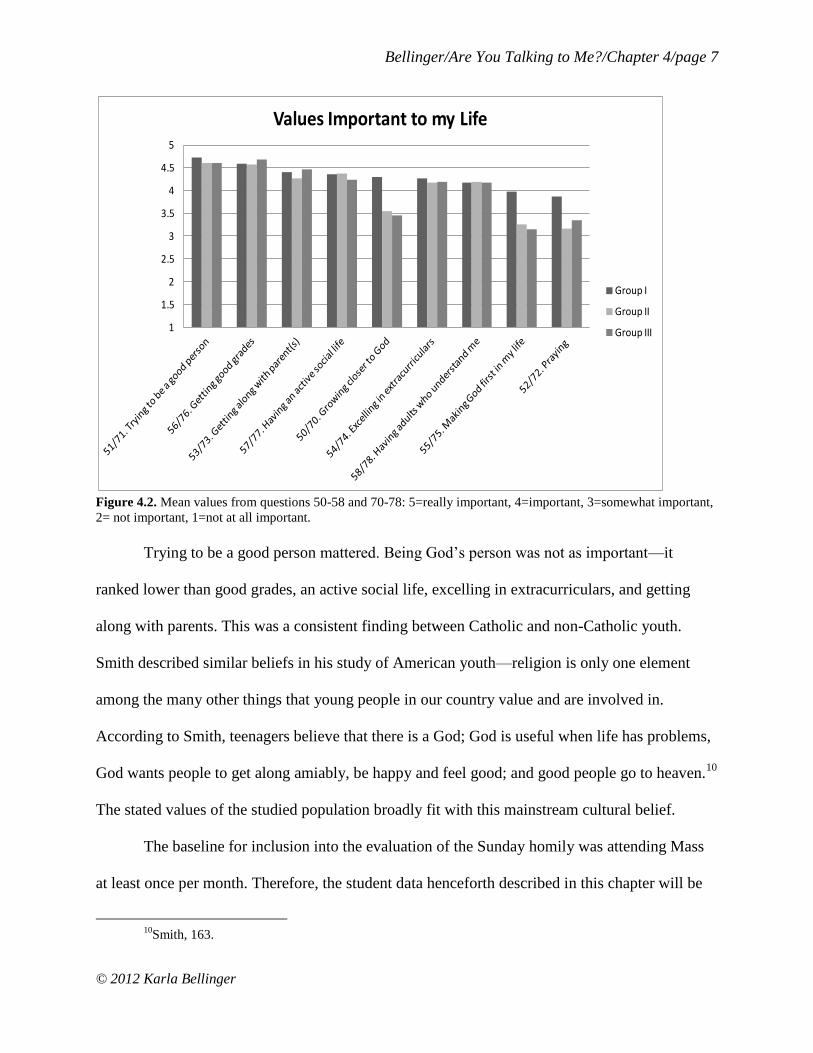
Table 4.3. Why did you go to Mass this particular Sunday?
Response
Number Percentage
To worship God 134 41.3
I was required to 104 32.0
To be with friends and/or family 58 17.9
Other 15 4.7
To be entertained 2 0.6
No Response 11 3.4
Total 324 99.9
Source: Are You Talking to Me? question 37. More than 294 data points
are recorded because respondents could pick more than one response.
taken from Group I, those who self-described as regular Mass attendees.11
Mass attendance in this group ranged from one to eight times per month with an average of 3.32
times (figure 4.3). They were asked, “What was the chief reason that you went to Mass this
particular day?” As shown in table 4.3., the greatest number (41%) responded that they came to
worship God. About a third (32%) admitted that they were there because they were required to
be:12
11
The data from non-attending Catholics and non-Catholics who attend Catholic schools are also interesting
and will be used in a future publication. 12
Only two ninth grade boys said that they came to Mass to be entertained, dispelling the shibboleth that
“kids only come to be entertained.” They rated their preacher (the same one) highly.
Figure 4.3 Group I Mass attendances by number of
weeks in the last month, question 9a.

Bellinger/Are You Talking to Me?/Chapter 4/page 9
© 2012 Karla Bellinger
To summarize, the average respondent in Group I is a 1 6 year old boy or girl who goes
to Mass just under four times per month. He or she believes in God, tries to be a good person,
and wants to get good grades. Praying and putting God first are not that important. As a Catholic
school student, his or her parents can or choose to afford to pay tuition or he/she is there on a
scholarship. He or she comes to Mass to worship God and/or because mom or dad says so.
Following Jesus matters to their families. In short, these young respondents are the present and
the future of the Catholic Church. What do they have to say about their preachers?
Demographics of the Preachers
On the day that the students took the paper survey in their theology classes, they were
asked to evaluate the homily and the homilist that they had last heard. In this way, they did not
get to select the preacher about which they wrote. Two hundred and two preachers were
evaluated, determined by the first letter of the preacher’s name, the age of the preacher and the
name of the parish per geographical region. Ninety-one percent of those were priests (table 4.4).
Four percent were deacons. One was a bishop:
Table 4.4. Category of preacher evaluated
Category Number Percentage
Priest 184 91.1
Deacon 8 4.0
Bishop 1 0.5
No
Designation 9 4.4
Total 202 100
Source: Are You Talking to Me? questions 3, 10 and 10a

Bellinger/Are You Talking to Me?/Chapter 4/page 10
© 2012 Karla Bellinger
Based on the student’s evaluation of the age of the preacher, the median category was 46-60
years old (table 4.5). This closely reflects national statistics of the age of Roman Catholic clergy
in the U.S.13
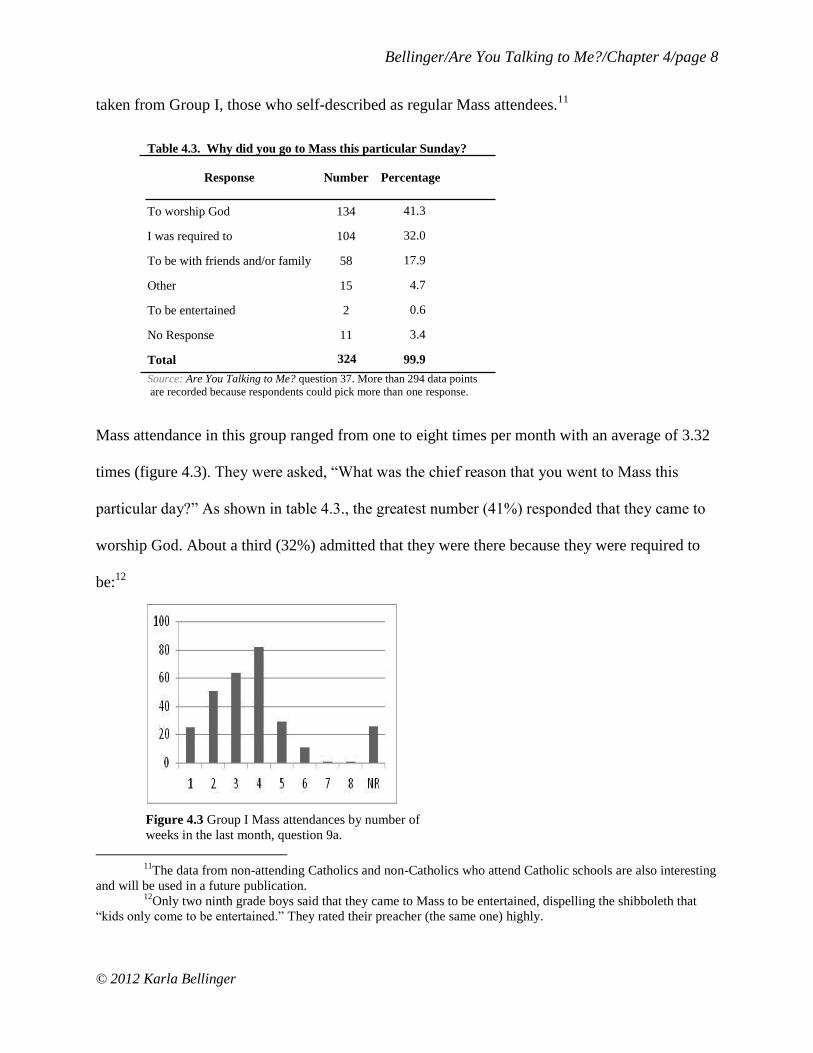
The number of clergy assigned to a parish is a rough approximation of the size of a
Catholic parish. The average number of priests in a U.S. parish was 1.8 in 2005.14
To give a
rough estimation of parish size, students were asked to record the total number of priests and
deacons in their parish. The number of preachers (priests and deacons) ranged from 1 – 10 with
an average for the sample population of 2.9 preachers per parish.
13
United States Conference of Catholic Bishops (USCCB), “The Catholic Information Project,” USCCB,
http://old.usccb.org/comm/cip. shtml#toc5 [accessed 1-31-12]. The average clergy age in 2006 was 60 with a
median age of 56. In 2009, a third of all active diocesan priests was 65 or older. A 2008 survey of Catholic diocesan
priests revealed that half of currently active diocesan priests plan to retire in the next 10 years. 14
The National Institute for the Renewal of the Priesthood (NIRM), “The National Catholic Parish Survey,”
NIRM, http://www.jknirp.com/castell.htm [accessed 1-31-12].
Table 4.5. Age of preachers evaluated
Age Grouping
Student
Response Percentage
25-35 years old 27 9.2
36-45 years old 58 19.7
46-60 years old 125 42.5
61 – 79 years old 73 24.8
80 + years old 7 2.4
No Response 4 1.3
Total 294 99.9
Source: Are You Talking to Me? question 12
Bellinger/Are You Talking to Me?/Chapter 4/page 11
© 2012 Karla Bellinger
Figure 4.4. Number of preachers in the parish, question 11.
The demographics from this study generally mirror national statistics of Catholic high
school student life. The four hundred and seventy baptized Catholic high school students
surveyed hold values not unlike the overall beliefs of U.S. Catholic teens. The 202 preachers
evaluated come from parishes of average sizes and mirror the age range of U.S. Catholic priests.
Therefore, the data of this study should be fairly indicative of the responses of the U.S. church-
going teen population.
What, then, did these young people have to say about the preacher and the Catholic
preaching that they last heard? Chapter 1 described Gorham’s study in which factors of
immediacy in connecting with a teacher correlated to better learning by students. Would this be
true also in preaching? The next section looks at the person of the preacher in order to
subsequently determine if the character of the homilist is a key to how Catholic youth relate to
the homily.
The Person of the Preacher
On page three of the survey, one sixteen year old sophomore boy, whom we will
arbitrarily name Tony, circled that he strongly agreed that his preacher was friendly to him,
treated him with respect and called him by name. He was ambivalent as to whether the preacher
1 2 3 4 5 6 7 8 9 10 NR
Re
spo
nd
en
ts
Number of Preachers
Number of Preachers in Parish
Bellinger/Are You Talking to Me?/Chapter 4/page 12
© 2012 Karla Bellinger
was approachable, interacted with young people regularly or was real and in touch with the
world. When he got to “exudes a love for Jesus,” he circled “strongly agree.” There he penned in
a comment: “Yeah, he’s a priest?” It was a remark written to the author of the survey as though
to say, “Duh... ” His clergyman was expected to exude a love for Jesus. How could it be
otherwise? For his own life, he wrote, “Uplifting to me does not entail more Christian-like acts,
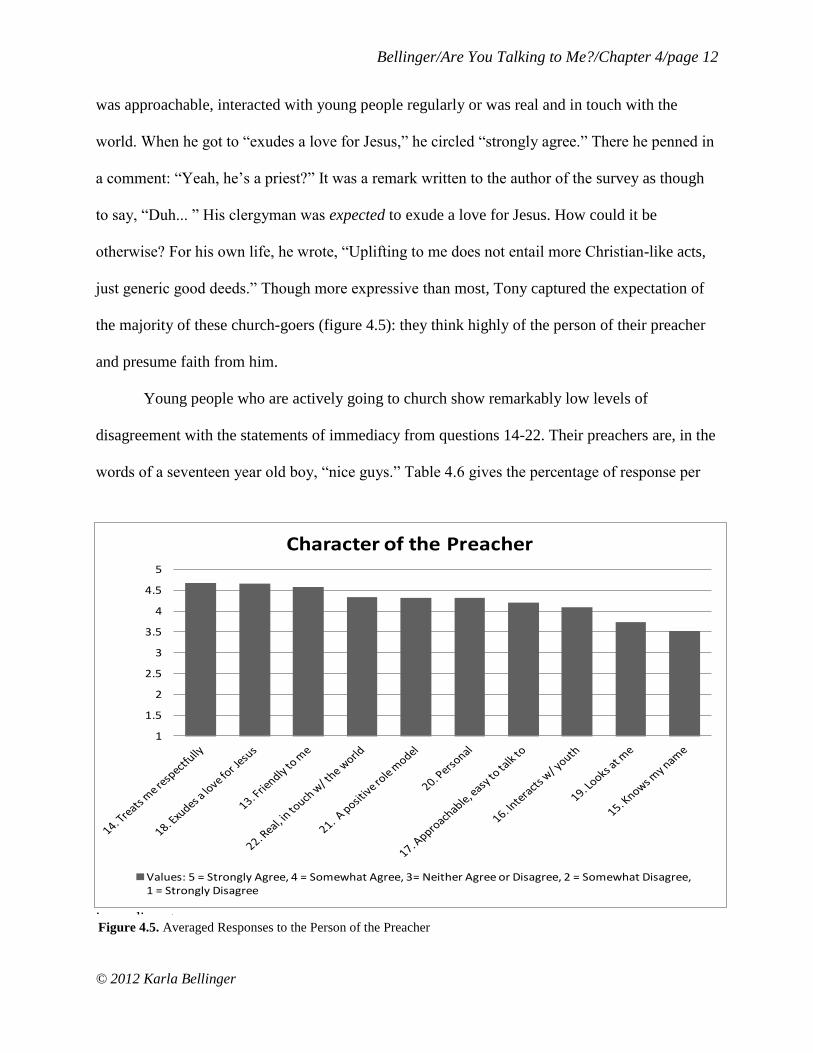
just generic good deeds.” Though more expressive than most, Tony captured the expectation of
the majority of these church-goers (figure 4.5): they think highly of the person of their preacher
and presume faith from him.
Young people who are actively going to church show remarkably low levels of
disagreement with the statements of immediacy from questions 14-22. Their preachers are, in the
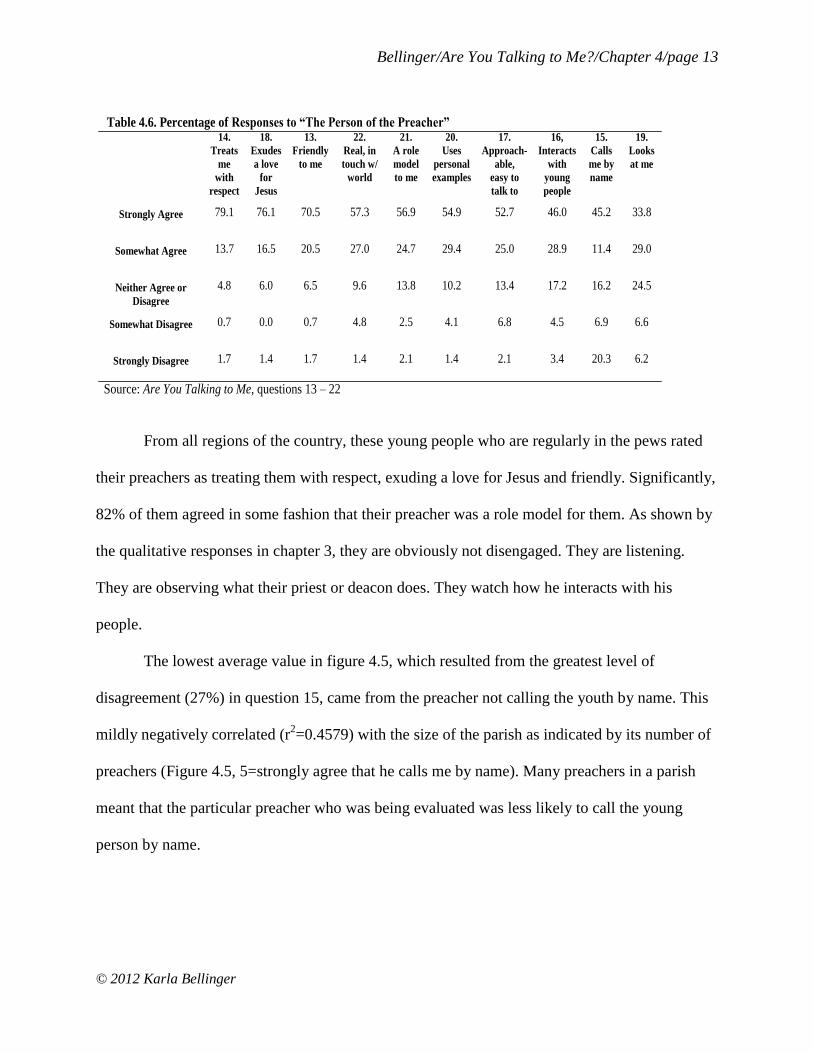
words of a seventeen year old boy, “nice guys.” Table 4.6 gives the percentage of response per
immediacy type.
1
1.5
2
2.5
3
3.5
4
4.5
5
Character of the Preacher
Values: 5 = Strongly Agree, 4 = Somewhat Agree, 3= Neither Agree or Disagree, 2 = Somewhat Disagree, 1 = Strongly Disagree
Figure 4.5. Averaged Responses to the Person of the Preacher
Bellinger/Are You Talking to Me?/Chapter 4/page 13
© 2012 Karla Bellinger
From all regions of the country, these young people who are regularly in the pews rated
their preachers as treating them with respect, exuding a love for Jesus and friendly. Significantly,
82% of them agreed in some fashion that their preacher was a role model for them. As shown by
the qualitative responses in chapter 3, they are obviously not disengaged. They are listening.
They are observing what their priest or deacon does. They watch how he interacts with his
people.
The lowest average value in figure 4.5, which resulted from the greatest level of
disagreement (27%) in question 15, came from the preacher not calling the youth by name. This
mildly negatively correlated (r2=0.4579) with the size of the parish as indicated by its number of
preachers (Figure 4.5, 5=strongly agree that he calls me by name). Many preachers in a parish
meant that the particular preacher who was being evaluated was less likely to call the young
person by name.
Table 4.6. Percentage of Responses to “The Person of the Preacher” 14.
Treats
me
with
respect
18.
Exudes
a love
for
Jesus
13.
Friendly
to me
22.
Real, in
touch w/
world
21.
A role
model
to me
20.
Uses
personal
examples
17.
Approach-
able,
easy to
talk to
16,
Interacts
with
young
people
15.
Calls
me by
name
19.
Looks
at me
Strongly Agree 79.1 76.1 70.5 57.3 56.9 54.9 52.7 46.0 45.2 33.8
Somewhat Agree 13.7 16.5 20.5 27.0 24.7 29.4 25.0 28.9 11.4 29.0
Neither Agree or
Disagree
4.8 6.0 6.5 9.6 13.8 10.2 13.4 17.2 16.2 24.5
Somewhat Disagree 0.7 0.0 0.7 4.8 2.5 4.1 6.8 4.5 6.9 6.6
Strongly Disagree 1.7 1.4 1.7 1.4 2.1 1.4 2.1 3.4 20.3 6.2
Source: Are You Talking to Me, questions 13 – 22

Bellinger/Are You Talking to Me?/Chapter 4/page 14
© 2012 Karla Bellinger
Figure 4.6. Correlation between questions 11–“How many preachers are in the parish?” and
15– “Does this particular preacher call you by name?”
Central to this study is the concept of connection. Question 24 was an open-ended query
of what it means for a preacher to “connect.” The responses to that question were categorized
and described in the previous chapter. Question 25 then asked those surveyed to put a number
value on that connection: “From your point of view, how well does this particular preacher
connect with you?” On a gradient scale of one to ten, Tony the sophomore drew a broad circle
around the numbers three through seven and scrawled in, “somewhere in here.” He again
captured the heart of the responses (figure 4.7). Of the 283 young people who answered this
question (11 left it blank), the mean was 5.6, slightly above “somewhat connected” with a
standard deviation of 19.95 responses. The “nice guys” are “sort of” connected with the young
people who sit in their pews.
y = -0.1238x + 3.9563 R² = 0.4579
1
1.5
2
2.5
3
3.5
4
4.5
5
1 3 5 7 9
Cal
ls m
e b
y N
ame
Number of Preachers in the Parish

Bellinger/Are You Talking to Me?/Chapter 4/page 15
© 2012 Karla Bellinger
Figure 4.7. Question 25: How well does this preacher connect with you? (on a gradient scale of
1=completely disconnected, 5=somewhat connected, 10=very connected)
Secondly, the ten data points of “The Person of the Preacher” (questions 14-22) were
averaged per respondent to form an overall “person of the preacher response value” (PPRV). A
linear regression was run to correlate that statistic with that same respondent’s connection value
in question 25. The two variables showed no correlation (r2=0.173).
How well the preacher personally connected with the young person did not affect the youth’s
perception of that preacher. His friendliness, approachability, and love for Jesus were
consistently perceived to be higher than the personal connection between them.
It might seem intuitive that younger clergy would be seen more positively by younger
people. Statistically this did not correlate (age of preacher/PPRV: r2=0.0255). Older and younger
clergy were almost equally well-respected. When asked to demarcate the age of her preacher, an
eighteen year old girl from African immigrant parents, crossed off the survey’s words “really
old” (for the 80+ category) and delightfully re-wrote the age designation as “wise and elderly.”
These young people think well of their preachers. Does this benevolence transfer to the Sunday
homily?
The Sunday Homily
Sunday preaching is a source for jokes, laments, and conversations. A seventeen year old
0 10 20 30 40 50 60 70
0 -
1.0
1.1
- 2
.0
2.1
- 3
.0
3.1
- 4
.0
4.1
- 5
.0
5.1
- 6
.0
6.1
- 7
.0
7.1
- 8
.0
8.1
- 9
.0
9.1
- 1
0.

Bellinger/Are You Talking to Me?/Chapter 4/page 16
© 2012 Karla Bellinger
retreat leader narrated the tale of her family dinner table discussion about her upcoming
participation in one of the study’s focus groups:
I told my family about this, because they’re like, “What’s up? What’s up with you, what
are you doing tomorrow?” (I’ve got a huge family.) And I was telling them, “Oh yeah,
before (retreat meeting), I have this huge survey on, like, Catholic preaching,” and then
all my little brothers, they were just like, “Oh, my gosh, homilies… ” (her voice dropped,
deprecatingly in imitation) and my older brother was, like, “Yeah, homilies are awful”
and we just started talking…
Anecdotes abound. Studies do not. Yet creating a homily is hard work and most homilists
work hard at their preaching.15
In their individual responses, young people describe times of faith
growth through preaching. Can it be that bad? As seen in the chapter 2, anecdotal evidence arises
from memory. Memory of negative experience lingers longer and forms stronger emotions than
positive recall:16
how many well-crafted homilies does it take to balance out one unforgettably
bad one?
Short-term Response
What do young people collectively have to say about the Sunday preaching that they
hear? Questions 26-35 asked them to evaluate the Sunday homily that they last heard. Because
the survey was given in high school theology classes, their evaluation, too, was based on
memory as the take-away from the homily—perceptions that lasted and remained with them days
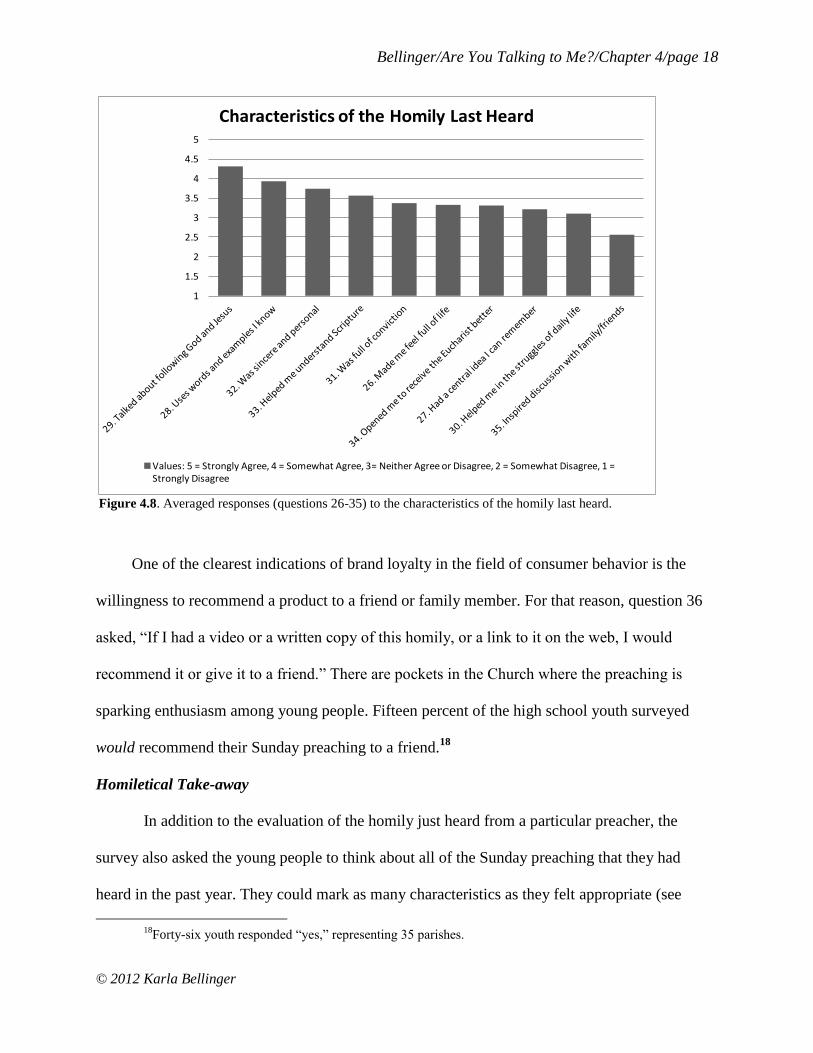
after hearing the preaching. Figure 4.8 reflects the average of those students’ responses. Yet the
percentages in each category paint a more accurate picture, since agreement, ambivalence and
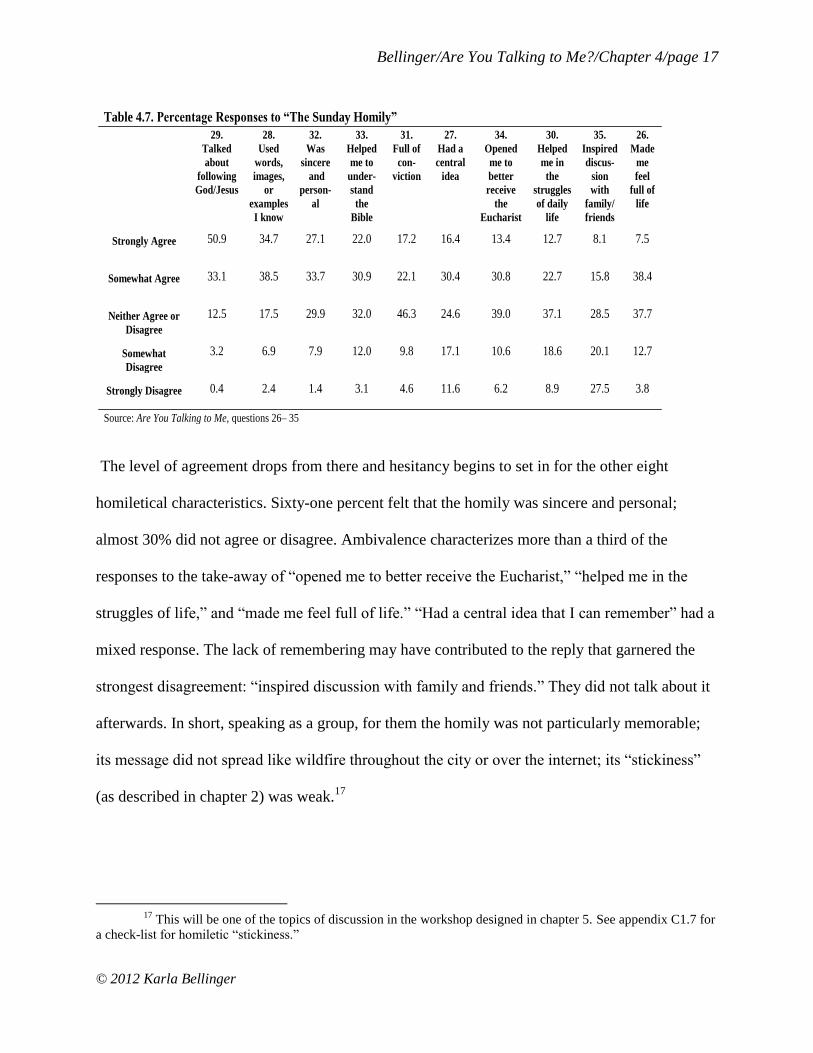
disagreement varied by characteristic. Eighty-four percent of the respondents agreed that the
homily talked about God and/or Jesus (Table 4.7). The baseline for appropriation of a message is
to put it in words and images that the audience knows: 73% agreed that the homily they heard
was in language that they could “get.”
15
Untener, 5. 16
See footnote 57 in chapter 2.
Bellinger/Are You Talking to Me?/Chapter 4/page 17
© 2012 Karla Bellinger
The level of agreement drops from there and hesitancy begins to set in for the other eight
homiletical characteristics. Sixty-one percent felt that the homily was sincere and personal;
almost 30% did not agree or disagree. Ambivalence characterizes more than a third of the
responses to the take-away of “opened me to better receive the Eucharist,” “helped me in the
struggles of life,” and “made me feel full of life.” “Had a central idea that I can remember” had a
mixed response. The lack of remembering may have contributed to the reply that garnered the
strongest disagreement: “inspired discussion with family and friends.” They did not talk about it
afterwards. In short, speaking as a group, for them the homily was not particularly memorable;
its message did not spread like wildfire throughout the city or over the internet; its “stickiness”
(as described in chapter 2) was weak.17
17
This will be one of the topics of discussion in the workshop designed in chapter 5. See appendix C1.7 for
a check-list for homiletic “stickiness.”
Table 4.7. Percentage Responses to “The Sunday Homily”
29.
Talked
about
following
God/Jesus
28.
Used
words,
images,
or
examples
I know
32.
Was
sincere
and
person-
al
33.
Helped
me to
under-
stand
the
Bible
31.
Full of
con-
viction
27.
Had a
central
idea
34.
Opened
me to
better
receive
the
Eucharist
30.
Helped
me in
the
struggles
of daily
life
35.
Inspired
discus-
sion
with
family/
friends
26.
Made
me
feel
full of
life
Strongly Agree 50.9 34.7 27.1 22.0 17.2 16.4 13.4 12.7 8.1 7.5
Somewhat Agree 33.1 38.5 33.7 30.9 22.1 30.4 30.8 22.7 15.8 38.4
Neither Agree or
Disagree
12.5 17.5 29.9 32.0 46.3 24.6 39.0 37.1 28.5 37.7
Somewhat
Disagree
3.2 6.9 7.9 12.0 9.8 17.1 10.6 18.6 20.1 12.7
Strongly Disagree 0.4 2.4 1.4 3.1 4.6 11.6 6.2 8.9 27.5 3.8
Source: Are You Talking to Me, questions 26– 35
Bellinger/Are You Talking to Me?/Chapter 4/page 18
© 2012 Karla Bellinger
Figure 4.8. Averaged responses (questions 26-35) to the characteristics of the homily last heard.
One of the clearest indications of brand loyalty in the field of consumer behavior is the
willingness to recommend a product to a friend or family member. For that reason, question 36
asked, “If I had a video or a written copy of this homily, or a link to it on the web, I would
recommend it or give it to a friend.” There are pockets in the Church where the preaching is
sparking enthusiasm among young people. Fifteen percent of the high school youth surveyed
would recommend their Sunday preaching to a friend.18
Homiletical Take-away
In addition to the evaluation of the homily just heard from a particular preacher, the
survey also asked the young people to think about all of the Sunday preaching that they had
heard in the past year. They could mark as many characteristics as they felt appropriate (see
18
Forty-six youth responded “yes,” representing 35 parishes.
1
1.5
2
2.5
3
3.5
4
4.5
5
Characteristics of the Homily Last Heard
Values: 5 = Strongly Agree, 4 = Somewhat Agree, 3= Neither Agree or Disagree, 2 = Somewhat Disagree, 1 = Strongly Disagree

Bellinger/Are You Talking to Me?/Chapter 4/page 19
© 2012 Karla Bellinger
figure 4.10), characterizing their overall impression of their take-away from the Catholic
preaching that they had heard.
Figure 4.9. Overall attributes of homilies by percentage response from question 59
This bank of sixteen attributes was also repeated in the second half of the survey for those
who attended Mass sporadically or at school; the chart illustrates all three group responses: For
those attending Mass, the homily traits selected by more than 50% of Group I respondents were:
comforting, interesting, and flat, boring delivery. The lowest responses were: frustrating, talked
down to me, and harsh and judgmental. The variations between the three groups, though not the
subject of this current study, were most striking in the positive take-away from the homilies.
Further investigation among those who no longer attend Mass might uncover factors of
preaching in the reasons why they are not there.
0%
10%
20%
30%
40%
50%
60%
Group I Group II GroupIII

Bellinger/Are You Talking to Me?/Chapter 4/page 20
© 2012 Karla Bellinger
In accord with the qualitative responses which spoke of preaching as focused on the older
folks, almost 30% of youth who regularly attend Mass asserted that it did not seem to matter that
they were there. The literature review in chapter 2 pointed out similarly that preaching as a
source of faith growth in young people is a blind spot for the Church. Though perhaps unseen,
around 50% checked preaching both as “helpful to my life” and “helped me grow in faith” and
almost 40% found it “uplifting.”
Four out of ten marked “rambling, pointless” as a characteristic of the homilies that they
had heard in the last year. This was similar to those who would not agree that the homily “had a
central idea,” in question 27 of table 4.7. The qualitative remarks also commented about
preaching that wandered off on tangents. These three disparate sources confirm that digression
from (or a lack of) a central point is a consistently found attribute.
Most young people marked both positive and negative attributes of preaching in the
above question. Since they both hovered just above the fiftieth percentile, intuitively it would
seem that those who marked “interesting” and those who marked “flat, boring” would represent
two different populations—the interested and the bored. Yet 98% of those who checked
“interesting” also marked “flat, boring” as characteristics of the preaching they had heard in the
last year. Their written comments, some of which are recorded in chapter 3, also described the
encounter of preaching as a mixed bag.
For those who regularly attend Mass, there are preachers who connect with them. They
responded to this query:
As we look at preachers who connect well with young people, we would like to observe
those whom you feel have really helped you to grow in faith. Would you be willing to
recommend someone as a really fine example of what preaching to young people should
be like?
Sixty-six percent of the young people who regularly attend Mass were willing to suggest a

Bellinger/Are You Talking to Me?/Chapter 4/page 21
© 2012 Karla Bellinger
preacher who connects well with young people, representing 8 deacons and 143 priests. No
bishops were recommended.19
Several names came up repeatedly, especially those who were
affiliated with that particular high school. But many also contributed names of parish priests who
they consider to be examples of fine preaching with young people. One offered Fr. Corapi,
formerly of EWTN, as a preacher who connected well. This identification of best praxis offers a
resource for future observational study.
Relationships between Listener, Preacher and Preaching
Chapter 3 looked at the interaction of the preaching event as a relational encounter, a
dance of the Holy Spirit. How does one measure a dance? In this chapter, numerical values only
uncover a small piece of the complexities of preaching, yet they can offer clues to what is
happening through the correlation of various elements of response. How do all of these factors
of listener, preacher, and preaching interrelate? To begin to find out, the ten responses to the
characteristics of the homily (questions 26-35) were averaged to create a linear “homiletical
response value” (HRV) per respondent.
The first use of this value was to ask the question of the data: does the evaluation of the
homily vary by the reason that the young person was attending that Mass (question 37)?
Common wisdom might suggest that those who were “required to be there” would rate the
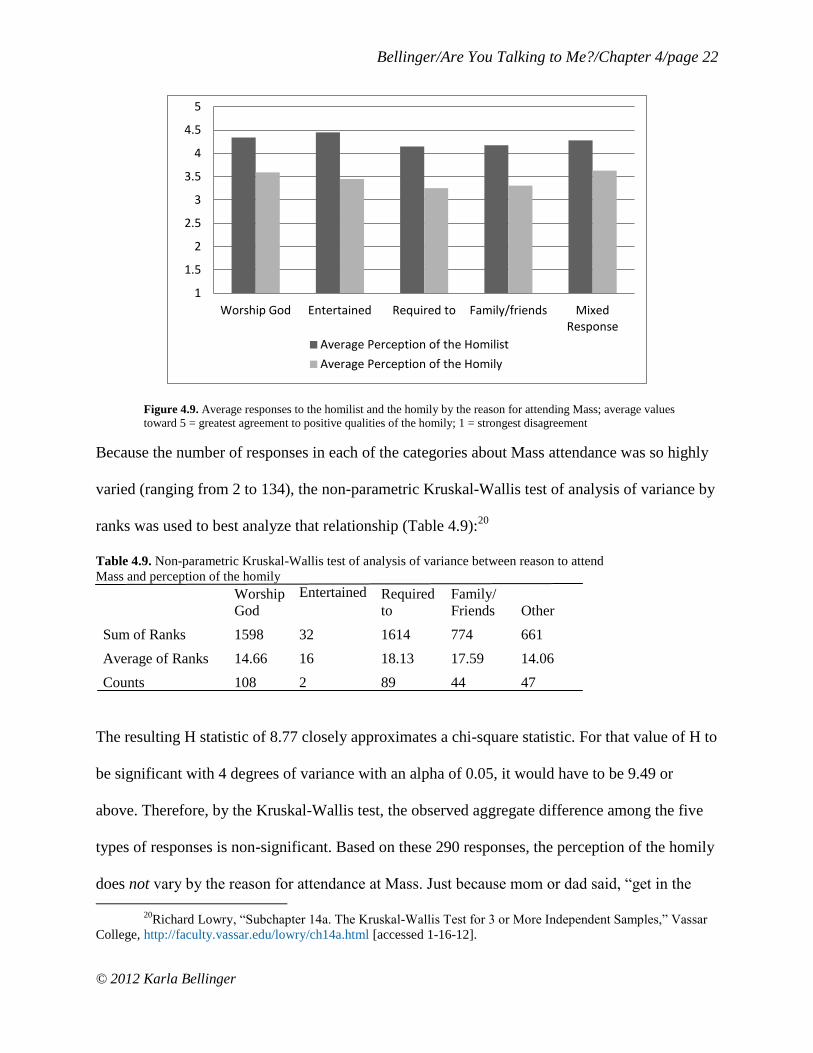
homily more poorly. Figure 4.9 shows in bar graph form a small variation in response to both the
homilist and the homily compared to the reason for attendance. Was this a random variation or
was it statistically significant?
19
Exposure to a bishop’s preaching may be limited to a few times per year. In this study, since only one
bishop was evaluated as the preacher who was last heard (at a confirmation Mass), the fact that none were
recommended is not statistically significant.
Bellinger/Are You Talking to Me?/Chapter 4/page 22
© 2012 Karla Bellinger
Figure 4.9. Average responses to the homilist and the homily by the reason for attending Mass; average values
toward 5 = greatest agreement to positive qualities of the homily; 1 = strongest disagreement
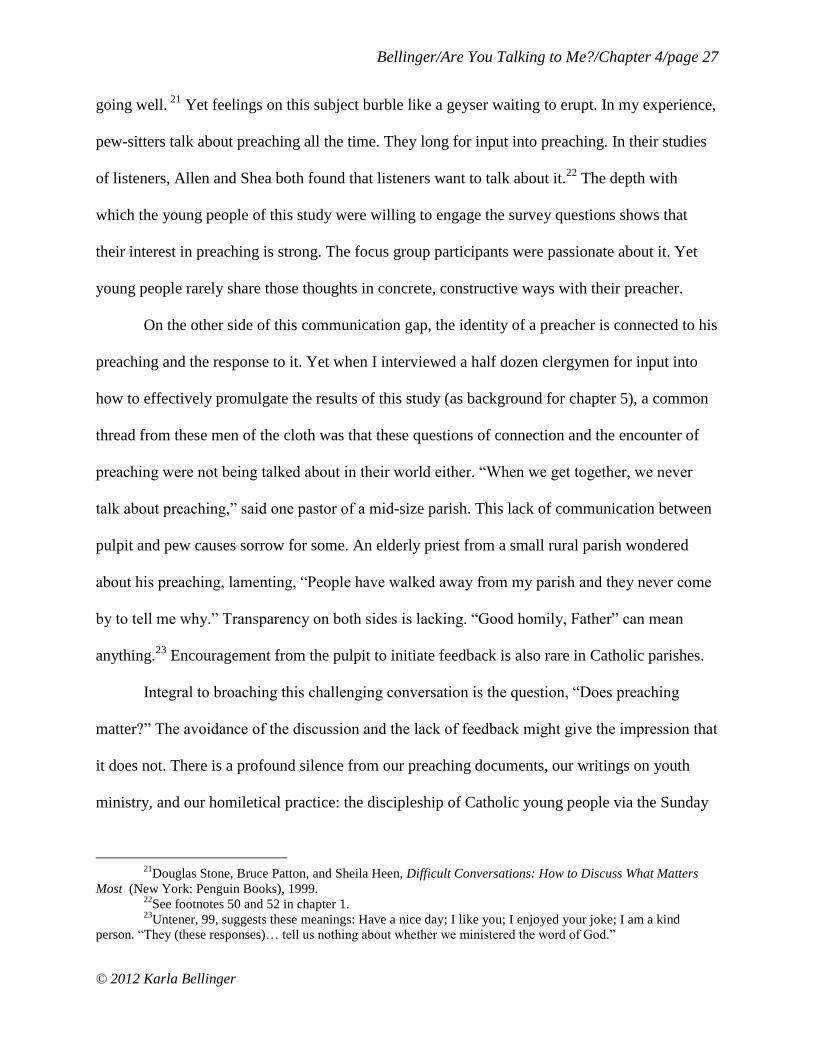
Because the number of responses in each of the categories about Mass attendance was so highly
varied (ranging from 2 to 134), the non-parametric Kruskal-Wallis test of analysis of variance by
ranks was used to best analyze that relationship (Table 4.9):20
Table 4.9. Non-parametric Kruskal-Wallis test of analysis of variance between reason to attend
Mass and perception of the homily
Worship
God
Entertained
Required
to Family/ Friends Other
Sum of Ranks 1598 32 1614 774 661
Average of Ranks 14.66 16 18.13 17.59 14.06
Counts 108 2 89 44 47
The resulting H statistic of 8.77 closely approximates a chi-square statistic. For that value of H to
be significant with 4 degrees of variance with an alpha of 0.05, it would have to be 9.49 or
above. Therefore, by the Kruskal-Wallis test, the observed aggregate difference among the five
types of responses is non-significant. Based on these 290 responses, the perception of the homily
does not vary by the reason for attendance at Mass. Just because mom or dad said, “get in the
20
Richard Lowry, “Subchapter 14a. The Kruskal-Wallis Test for 3 or More Independent Samples,” Vassar
College, http://faculty.vassar.edu/lowry/ch14a.html [accessed 1-16-12].
1
1.5
2
2.5
3
3.5
4
4.5
5
Worship God Entertained Required to Family/friends Mixed Response
Average Perception of the Homilist
Average Perception of the Homily

Bellinger/Are You Talking to Me?/Chapter 4/page 23
© 2012 Karla Bellinger
car” did not mean that their offspring responded differently to the homily (either negatively or
positively) than those who were willing to go.
When they do get there, did the young person’s perception of the homilist impact his or
her evaluation of the homily? Qualitative studies have discussed the ethos of the preacher and its
impact on the efficacy of preaching. From the quantitative data from this survey, how much of an
impact does that have? Running a linear regression between the PPRV and the HRV shows some
variation, but not enough to be mildly correlated (r2=0.1893):
Figure 4.10. Regression analysis between PPRV and HRV
A seventeen year old young man described this lack of correlation:
I don’t really follow the older priest’s homilies as much as this younger priest at my
parish. The younger one can relate to teens, but he doesn’t have life changing homilies
(italics mine).
Though the younger clergyman “relates” to teens, his preaching is not as esteemed as his person.
This lag is most easily seen when the two averaged values of homilist (PPRV) and homily
(HRV) are drawn together in figure 4.11:
y = 0.4541x + 1.7505 R² = 0.1893
0
1
2
3
4
5
1 2 3 4 5
Pe
rce
pti
on
of
the
Ho
mily
Perception of the Homilist
Correlation between Perception of the Homilist and Perception of the Homily

Bellinger/Are You Talking to Me?/Chapter 4/page 24
© 2012 Karla Bellinger
Figure 4.11. Graph of response to the preacher (PPRV) and response to the homily (HRV). In
question 40, when asked to “grade” the homily, the resulting average GPA was a 2.46/4.00, in
the range of a C+. The left line (HRV) clearly tells the same story.
Are those who express a stronger connection with the preacher more responsive to the homily?
When correlating question 25 (the number value given to connection with the preacher) with
HRV (the perception of the homily), there was slight variation but it was not statistically
significant (r2=.1731).
In the above quote, the young man described a difference in his response to the older and
younger preachers in his parish. Does age play a factor in how young people respond to the
homily? Are the homilies of younger preachers perceived to be better than those of the “wise and
experienced” ones? That was tested in two ways: a linear regression run between age and HRV
yielded an r2
= 0.0255, a non-significant correlation. Then, because the categories of age were so
highly variable in numbers, I wondered if the middle age groupings might not be weighing too
heavily in that analysis. Therefore I ran the Kruskal-Wallis test which takes those uneven
category variations into account. The H statistic was strikingly low (.06). That number evaluated
with a chi-square df of 4 and an alpha of 0.05 indicates that the age of homilist is totally not a
source of the variation in the perception of the homily for this group of young people. One of the
best rated homilists was one of the oldest.
0
20
40
60
80
100
120
140
160
180
200
Poor Not Good Okay Good Excellent
Nu
mb
er
of
Gro
up
I R
esp
on
ses
Average Perception of the Homilist Average Perception of Homily

Bellinger/Are You Talking to Me?/Chapter 4/page 25
© 2012 Karla Bellinger
If the faith life of a young person is strong, will he or she perceive the homily better?
Even without running a regression line, it is apparent from the data scattered all over the graph
below that just because a listener is a believer did not mean that the homily was perceived to be
more effective. The reverse was also true—there were many young people without strong faith
who rated the homily well.
Figure 4.12. Correlation between the respondent’s faith life and his or her perception of the
homily
There are innumerable questions that can be asked of this superabundance of data. With
86 questions and 561 respondents, there is much more that could be said and many potential
relationships that could be tested. Some of that will have to wait for post-DMin analysis. From
the relationships that were tested though, it seems that perceived connection did not impact how
the homily was heard. A higher opinion of the clergyman did not give young people a positive
slant toward rating his homily, nor were younger preachers considered to be better preachers.
The faith life of the young person did not vary with how he or she rated the preaching. It would
seem that the homily rises and falls on its own merits when evaluated by these youth. They
believe their preachers to be good people whose homilies could improve.
y = 0.4158x + 1.6854 R² = 0.1322
1
1.5
2
2.5
3
3.5
4
4.5
5
1.00 1.50 2.00 2.50 3.00 3.50 4.00 4.50 5.00
Fait
h L
ife
Correlation between Faith Life and Perception of the Homily

Bellinger/Are You Talking to Me?/Chapter 4/page 26
© 2012 Karla Bellinger
How often do they tell their preachers these things? Almost never: question 62 asked, “In
the last year, out of a possible 52 weeks, how many times have you given a preacher constructive
feedback or input about his homily (other than…”Nice homily, Father…or Deacon…?).”
Figure 4.13. The number of weeks per year that they have given
their preacher constructive feedback (by number of responses)
The median, mean and mode of feedback response all fall within the “0-7 weeks” category in
figure 4.13. Of those who gave their preacher feedback for more than 0-7 weeks of the year,
93.1% of them gave that feedback to a preacher whom they had rated as very good or excellent.
If young people do give constructive feedback on the Sunday preaching, this is an indicator that
they have been engaged and the preacher is connecting well with them. The reverse was not true.
Several preachers who were rated excellently got zero feedback from their young listeners. The
vast majority said nothing either way.
Key Findings of this Study
The Loud Silence
The conversation about preaching is difficult. From the data on feedback, avoidance of
the discussion reveals that it is hard to talk about, most especially when the preaching is not
210
28 6
23 4 5 4 2 12
0 t
o 7
8 t
o 1
3
14
to
20
21
to
26
27
to
33
34
to
39
40
to
46
47
to
52
NR
Bellinger/Are You Talking to Me?/Chapter 4/page 27
© 2012 Karla Bellinger
going well. 21
Yet feelings on this subject burble like a geyser waiting to erupt. In my experience,
pew-sitters talk about preaching all the time. They long for input into preaching. In their studies
of listeners, Allen and Shea both found that listeners want to talk about it.22
The depth with
which the young people of this study were willing to engage the survey questions shows that
their interest in preaching is strong. The focus group participants were passionate about it. Yet
young people rarely share those thoughts in concrete, constructive ways with their preacher.
On the other side of this communication gap, the identity of a preacher is connected to his
preaching and the response to it. Yet when I interviewed a half dozen clergymen for input into
how to effectively promulgate the results of this study (as background for chapter 5), a common
thread from these men of the cloth was that these questions of connection and the encounter of
preaching were not being talked about in their world either. “When we get together, we never
talk about preaching,” said one pastor of a mid-size parish. This lack of communication between
pulpit and pew causes sorrow for some. An elderly priest from a small rural parish wondered
about his preaching, lamenting, “People have walked away from my parish and they never come
by to tell me why.” Transparency on both sides is lacking. “Good homily, Father” can mean
anything.23
Encouragement from the pulpit to initiate feedback is also rare in Catholic parishes.
Integral to broaching this challenging conversation is the question, “Does preaching
matter?” The avoidance of the discussion and the lack of feedback might give the impression that
it does not. There is a profound silence from our preaching documents, our writings on youth
ministry, and our homiletical practice: the discipleship of Catholic young people via the Sunday
21
Douglas Stone, Bruce Patton, and Sheila Heen, Difficult Conversations: How to Discuss What Matters
Most (New York: Penguin Books), 1999. 22
See footnotes 50 and 52 in chapter 1. 23
Untener, 99, suggests these meanings: Have a nice day; I like you; I enjoyed your joke; I am a kind
person. “They (these responses)… tell us nothing about whether we ministered the word of God.”

Bellinger/Are You Talking to Me?/Chapter 4/page 28
© 2012 Karla Bellinger
homily has been acutely overlooked. Yet the voices of 561 young people in this study shout out
“Yes! Preaching does matter to us!”
A subset of this silence is that young people also do not talk about faith among
themselves. The lowest values of teenage religiosity from questions 46 and 49 (figure 4.1) were
“I talk to others about my faith” and “My friends are strong in their faith.” For these regular
church-goers, faith may bubble, but it bubbles within. If one goal of preaching is to empower
young disciples to be preachers who share their faith with their own generation, then we have
much growing to do.
At this juncture in the Christian world, the stakes are high. Ho-hum preaching is good
enough when there are cultural supports for faith. That is no longer the case: with cultural
support dropping, we can continue to avoid this conversation about strengthening our preaching,
but at what cost? This study has been an effort to step back from the feelings and the anecdotes
about preaching to determine what is happening on the ground. It is only a beginning. There is
still much to learn.
Strengths Observed in the Findings of this Study
I had asked the focus group this question: “Give me one word that describes the preacher
in your parish.” The sun streamed in from behind one boy’s head. His eyes began to sparkle. The
light gave him a glow. A smile spread across his face. “Inspiring,” the seventeen year old youth
said, “inspiring.”
One of the strengths uncovered in the findings of this study was the consistently high
status that church-going teenagers gave to their parish preacher. Friendliness, exuding a love for
Jesus, respect and role modeling were unfailingly high across age groupings and geographical
regions (figure 4.5 and table 4.6). One of the primary goals of a seminary education is to form

Bellinger/Are You Talking to Me?/Chapter 4/page 29
© 2012 Karla Bellinger
good men. On the average, these young people would say that the Church is succeeding in that
formation.
Has preaching improved since the Second Vatican Council, the publication of the 1982
document Fulfilled in Your Hearing (FIYH), and the increase in the number of preaching classes
that a seminarian takes? Stories suggest that is the case. But we have no data. This study cannot
statistically say that our seminary training is turning out better preachers. There was no
correlation found between the age of the preacher and the overall rating of the quality of the
homily. This study describes the situation of preaching in 2011. It is not a longitudinal study.
Yet perhaps we have one potential clue: Since the Council in the 1960’s, the Catholic Church has
turned its focus toward Scripture. FIYH defined the purpose of the homily as a Scriptural
interpretation of life. In 1995, a study from Chicago Theological Union focused on preaching
and Scripture. That study found that 73% of the homilies studied did not show evidence of sound
biblical exegetical preparation.24
Has that changed? Question 33 asked about agreement on the
statement, “This homily helped me to understand the Scriptures better.” More than 50% of the
respondents were able to agree with that statement (table 4.7). When the average response to
question 33 was correlated with the age of the preacher, the relationship (r2=0.7172) was
significant (figure 4.15). Though question 33 does not ask specifically about exegetical
preparation, the take-away of Scriptural understanding may give an indication of two
possibilities: 1) our younger preachers may be doing their theological reflection and exegetical
“homework” in preparation for preaching; and/or 2) their training may have better prepared them
to move effectively from biblical text to homily. As the correlation in the chart below
demonstrates, a second strength was that the youngest of the preachers were more effective in
24
Barbara E. Reid, O.P. and Leslie J. Hope, O.F.M., Preaching from Scriptures: New Directions for
Preparing Preachers (Chicago: Catholic Theological Union, 1998), 21.

Bellinger/Are You Talking to Me?/Chapter 4/page 30
© 2012 Karla Bellinger
helping their listeners understand the Scriptural text. This is good news for seminaries. For those
who teach Scriptural exegesis and for those who form preachers, they can be assured that their
efforts to flow the two disciplines together seem to be bearing fruit.
Figure 4.14. Averaged response to question 33 about the ability to unpack Scripture,
when correlated with the age grouping of preacher (1=youngest, 5 = oldest)
In short, two strengths found in this study were the quality of clerical formation and the
improved integration of Scripture into preaching. It may be surprising to hear these results from
the collective pens of high school students. But they would come as no surprise to those who
work in our seminaries: formation and Scripture have been two of the focal points for the last
twenty years. If we can shine as bright a spotlight on the discipline of preaching for the next
twenty years, who knows where that will take us? Where should we concentrate our energies in
order to do that effectively?
Unpacking Listener Satisfaction
The discipline of consumer behavior has informed this study. An integral element to that
sub-section of the field of marketing is the customer satisfaction survey. The analysis of data
which expresses satisfaction and dissatisfaction can reveal strengths and weaknesses, thus
suggesting strategies for “product” improvement. To analyze this study as though it were a
customer satisfaction survey, two sets of data are most useful: First, question 36, summarized as
y = -0.206x + 4.196 R² = 0.7172
1
2
3
4
5
1 1.5 2 2.5 3 3.5 4 4.5 5
Leve
of
Agr
ee
me
nt
Age Grouping of Preacher

Bellinger/Are You Talking to Me?/Chapter 4/page 31
© 2012 Karla Bellinger
“Would you recommend this (product) to a friend?” gives a key indicator of loyalty.25
Figure
4.17 is a visual representation of the response to that question. Second, the agreement levels from
table 4.7 (“The Sunday Homily”) have been averaged for all of the homiletic factors of questions
26-35 in table 4.10 and visually displayed in figure 4.16. What can these two visuals tell us
about the response of our population to Catholic Sunday preaching?
Table 4.10. Averaged Values of “The Sunday Homily”
Strongly Agree 21.0%
Somewhat Agree 29.6%
Neither Agree or Disagree 30.5%
Somewhat Disagree 11.9%
Strongly Disagree 7.0%
Source: Are You Talking to Me? questions 26-35
Figure 4.16. Averaged percentage response to “The
Sunday Homily,” questions 26-35
Figure 4.17. Would you recommend?
To understand our listeners, we delineate the characteristics of each of the population
segments separately. Starting from the top, “Promoters” are those who are enthusiastic and loyal,
25
William Baker suggested this question and its subsequent analysis, spring of 2011.

Bellinger/Are You Talking to Me?/Chapter 4/page 32
© 2012 Karla Bellinger
who talk about the preaching that they hear and want to refer it to others (Figure 4.17: strongly
agree-21%; Figure 4.9: Yes-15.6%). Commitment is strong among this group. Loyalty is solid.
Preaching resonates for them. If the ordination class of 2011 made the decision to enter the
priesthood at the average age of 16, then at that age, those men probably came from this
“Promoter” pool.26
At the bottom end are the “Detractors”: those who would not recommend the preaching
to anyone (Figure 4.17: strongly disagree + disagree-18.9%; Figure 4.9: No-38.1%) Detractors
can create negative word-of-mouth. When a person complains, it means that the dissatisfied
individual is still invested in the organization. Complainers can become supporters. Negative
word-of-mouth, on the other hand, influences others—it tells stories and they are not good
stories. Negative word-of-mouth is vivid; it is easily remembered and much more damaging than
complaining. Those who do not complain are more likely to walk away (see the feedback data
cited earlier, especially in relation to poor homilies).27
“Passives” are those who are somewhat satisfied but they are unenthusiastic. They have a
low level of allegiance, so they are easily lost to the competition (Figure 4.17: neither disagree or
agree-30.5%; Figure 4.9: I don’t know-42.5%).28
“Satisfieds” (Figure 4.17, somewhat agree-
29.6%) are somewhat content but not highly committed. Unlike the “Promoters,” they are not
evangelistic or passionate about what they hear. Loyalty is not solid.
Strategies for Increasing Satisfaction
Why does this classification of satisfaction matter? These groups are categorized in order
26
An intriguing topic for a DMin thesis project would be to evaluate how much that positive decision
toward ordination came through the impact of effective preaching. Such data, if positively correlated, might
persuade toward preaching improvement. 27
Hoyer and MacInnis, 291. 28
Marketing Profs, “Net Promoter Scores,” Marketing Profs, http://www.marketingprofs.com/
charts/2011/5150/privacy-concerns-erode-social-media-user-satisfaction#ixzz1O8jF0B5K [accessed 11-12-2011].

Bellinger/Are You Talking to Me?/Chapter 4/page 33
© 2012 Karla Bellinger
to develop strategies to move them “up” on the bar chart toward greater loyalty and commitment.
In the experience of industry communicators, to move “Satisfieds” to become “Promoters” takes
the soft skills of friendliness, using their name, empathy (“know what I am going through” was
said over and over again), and letting them know that they matter. About 30% of the studied
population falls in this “Satisfied” category in relation to preaching. The content of the homily
can be strengthened by speaking to issues and topics that relate to them. The pastor and the
parish community can collaborate to invite this sizeable group to deeper commitment. That call
may be all that is needed to move them from a nebulous contentment to an enduring loyalty. An
essential strategy for renewal of the church is to move this “vaguely favorable” group to become
young “Promoters.” 29
Rubrics of excellence in preaching can be developed, taught and then
routinely assessed to facilitate this. Empowering the congregation is integral to this process of
excellence in the encounter of preaching. They can learn to: 1) support the preacher; 2) improve
listening skills; and 3) learn to give constructive feedback. A “B” preacher is not far from an “A”
preacher, but the impact on faith growth of that slight step “upward” is significant and can be
long-lasting. How to make that happen will be expanded upon in the next chapter.
Another 30% of respondents from figure 4.16 fell into middling “Passive” category (40%
by figure 4.17 “would you recommend?”). “Feeling the love” will not bring this group to
dedication and loyalty. They seek competency. Improving the quality of the homiletic encounter
will strengthen their commitment. This requires growth in the “hard” skills of preaching as the
young people themselves described in chapter 3: put together a clear message that speaks to their
world; use stories and images that they can relate to; have a compelling delivery; speak in
concrete language that is memorable; strengthen content; and craft a homily that motivates by its
29
Pope John Paul II was especially effective in reaching this group through his World Youth Day messages
that exalted heroism and sacrifice.

Bellinger/Are You Talking to Me?/Chapter 4/page 34
© 2012 Karla Bellinger
riskiness, to name a few. So many actively church-going young people express a “whatever-ism”
about their experience of preaching. Three sets of statistics converge: The data in figure 4.13 (the
high levels of ambivalence), figure 4.12 (the lack of correlation between the evaluation of
homilist and homily), and the high number of responses that fall into the “Passives” category
(figures 4.16 and 4.17). They all point to the same conclusion: to engage this group, homilies
need to deliver a compelling message that not only connects, but also motivates. A high
percentage of response in the ambivalence category is a robust indicator that what is
fundamentally needed is training in the basics, the hard skills of how to preach. This suggests an
agenda for training both within seminaries and in the continuing education of clergy.
What to do about the “Detractors?” Typically, customer dissatisfaction numbers are
acceptable in the 5-10% range.30
Those who are experienced in dealing with customers have
found that when dissatisfaction levels creep up to 10-20%, this is a clear symptom that there are
system and/or performance issues that need scrutiny.31
From the data from this study, the
dissatisfaction levels of regular church-going high-school listeners are higher than optimal (18.9
and 38.1%). From figure 4.10, the rating of “didn’t matter that I was there” at almost 30% of
respondents should be of serious concern. The dearth of feedback for poorly rated homilies is an
early symptom that church-going young people may simply walk away when they become
independent and are no longer required to be at Mass. What can we do? Consultants in consumer
satisfaction would strategize for bottom performers that: 1) individual preaching coaching and
retraining may be needed and 2) homiletical preparation processes should be scrutinized. That
which creates hindrance must be attended to.32
The content of the preaching has to be solid.
30
Michael Clarkin, “5 Myths of Customer Satisfaction: Setting your Sights on the Right Targets,” Vovici
Webinar, http://marketingprofs.chtah.com/a/hBN75NYAJaJZfB8bk1QNg1pwIPu/alrt27 [accessed June 16, 2011]. 31
Ibid. 32
Michael Clarkin, email correspondence, 6-20-2011.

Bellinger/Are You Talking to Me?/Chapter 4/page 35
© 2012 Karla Bellinger
Preparation has to become a priority. To observe and imitate the skill sets of those rated as
excellent preachers would set a higher bar for those whose performance is marginal. If the
emphasis on biblical preaching has made an impact in the training of preachers in the last fifteen
years, then fundamental skills can similarly be taught. From the students’ written comments from
this “Detractor” group, what is missing are the oral communications skills that are taught in a
beginning speech class (make one clear point, do not ramble, speak clearly). That would be a
good place to start. If listener dissatisfaction levels drop under 10%, destructive negative word-
of-mouth about preaching will abate. Retention will increase. The retention of young people has
been and continues to be a concern for the Church.33
It appears from this data, that preaching
plays some part in that defection. There are hungers that we not feeding. The window into the
face of God is a bit smudged. What are young people looking for?
More, not Less
In a summer 2011 focus group, a just-graduated senior offered a metaphor for the homily
at the last Mass that she had been to:
A self-help book: He’s up there going, “and your life is going to be like this and you’re
going to do this” and I’m like, “how do you know that?” It was like the going-off-to-
college chapter (of the self-help book) and I have read a lot of self-help books, so I felt a
lot like I had heard it before. He said what everyone knew he was going to say and
everyone was “okay, he said what I knew that he was going to say, so we can carry on…”
It was patronizing. He was making all these assumptions and then telling us how to
handle what he thought that we needed to know. He had four main points… only… (The
whole group laughs at her tone and facial expression.)… I don’t remember what they
were.
To recap from chapter 2, motivation is enhanced when the listener hears something that is “1)
personally relevant; 2) consistent with their values, goals, and needs; 3) risky; and /or 4)
33
This high percentage of “detractors” about preaching comes from Group I, the high school students who
think highly of their clergy and are still regularly attending Mass. From their response to the preaching, they may be
on the verge of joining Group II, the baptized Catholics who are no longer attending Mass.
Bellinger/Are You Talking to Me?/Chapter 4/page 36
© 2012 Karla Bellinger
moderately inconsistent with their prior attitudes.”34
“He said what everyone knew he was going
to say” did not stretch this listener. This was a common theme from the focus groups and in the
qualitative responses to the paper survey. From page 36 of the results of his study, Shea’s
listeners also consistently expressed the theme of “simply being too boring or repetitious.”35
When asked “If you could tell the preachers in your parish anything about their preaching and
how to make it more effective in connecting with you and other young people of your age, what
would you tell them,” a fifteen year old boy said, “To stop giving stereotypical and clichéd
homilies that a lot of other people who don’t really know anything about the gospel could give.”
A ninth grade boy suggested: “Use inspirational quotes, or say something that most people
haven’t heard before.” These “same-old-same-old” comments are representative of many others.
Young people want preaching to stretch them. Some adults might state that teenagers just
want to be entertained. Those who responded to this survey did not ask for the homily to
entertain: to engage, to maintain interest, to get my attention, and to motivate, were the words
that they used. They were not looking for less. They were looking for more. They wanted more
depth. They wanted more creativity. They wanted more passion.
Ironically, in table 4.7 of “The Sunday Homily,” the highest level of ambivalence toward
the homily came from the response to question 31: “This homily was full of conviction.” Almost
half (46.3%) circled “neither agree nor disagree.” Ironically, there was no conviction that the
homily was full of conviction. Coming at it from a different direction tells the same story: a 2.46
grade point, averaged from the responses to question 40, tells a teacher that the student is
working hard enough to pass but not really striving hard enough to excel at the subject.
Question 39 asked about motivation: “On a scale of 1 to 10, ten being the best, how
34
Hoyer and MacInnis, 55. 35
See footnote 50 in chapter 1.
Bellinger/Are You Talking to Me?/Chapter 4/page 37
© 2012 Karla Bellinger
would you rate how well this particular homily motivated you to deepen your commitment to
God?” (One = de-motivating, five = somewhat motivating, and ten = highly motivating.) The
mean was 5.7—a somewhat “somewhat.” Looking at overall homily characteristics in table
4.10, the highest response was the amorphous “comforting.” The lowest two responses to the
bank of positive attributes about homilies were the concretely Christian characteristics of “helped
me to forgive” and “helped me to commit myself to following Jesus.”36
The National Study of Youth and Religion found that most U.S. teenagers tend to follow
their parents when it comes to religion: religion is a nice thing to have but it does not claim them
or concern them greatly.37
Commitment is soft. The responses to “The Person of the Listener”
(figures 4.1 and 4.2) in this study showed a similar shapelessness to their Christian belief.
Catholic kids are at the bottom of all Christian denominations for knowing and committing to
their faith.38
Smith’s work identifies the parent’s faith life as a clear indicator of the faith life of a
teen. Therefore initiatives to bolster the faith of parents and adolescents are being created in
many Christian denominations. Is there something that we are not seeing in this picture? Where
is the myopia?
The data from this study suggests that we take the progression one step further:
teenagers’ faith is soft because their parents’ faith is soft, yes. Yet, as discussed in chapter 1, for
the majority of high school and adult Catholics, Sunday liturgical preaching is their only source
of input. Could it be that the faith of those in the pew is anemic because our preaching is also
weak? Preaching is, of course, not the only factor in the system of faith growth, but its impact
appears to be a substantial one, more important than most Catholic preachers realize. The current
36
Surprisingly, those baptized Catholics who do not regularly attend Mass had a higher response to “helped
me to commit myself to following Jesus” than those who attended regularly. 37
Dean, 202. 38
Smith, 37.
Bellinger/Are You Talking to Me?/Chapter 4/page 38
© 2012 Karla Bellinger
state of Catholic Sunday preaching contributes to the vague “whatever” faith shown by U.S.
Catholic teenagers (and their parents by extension). The young people who were surveyed asked
for more from the pulpit. As his final comment, a twelfth-grade boy pleaded, “More life, more
passion. Monotony kills interest.”
The homily is a key ingredient in the faith growth of a young disciple. We have pockets
of preaching where it is being done wonderfully. Those listeners can respond to the question,
“Are you talking to me?” with a vibrant “yes!” Like the disciples on the road to Emmaus, that
encounter with the face of God resonates within them. What do we need to do as a Church to
help that to more commonly happen?
Moving Forward
To recap the road which we have walked thus far: 1) The introduction laid out a vision of
the homily as revelation, a locus of encounter with God; 2) Chapter 1 pointed out the Church’s
blind spot about the significance of the homily in growing the faith life of young disciples; 2)
Chapter 2 enriched the field of homiletics with the characteristics of listening as discovered by
the field of consumer behavior; 3) In chapter 3, the words of young disciples spoke of their
experience of connection and faith growth through preaching. They also spoke of what it is like
to listen to preaching that obscured the face of God for them; 4) This current chapter has pointed
out strengths and weaknesses in the current state of preaching through quantitative analysis. Now
what? Where do we go from here? How can we take what we have learned and fit it all together
into a product which will build up the Church? How can this study concretely improve Catholic
Sunday preaching?
“Connection” has been the foundational concept in this study. In that spirit, therefore,
chapter 5 begins by recasting the conversation, moving from the analysis of the needs of listeners

Bellinger/Are You Talking to Me?/Chapter 4/page 39
© 2012 Karla Bellinger
to comprehend the needs of preachers: what would help them to preach more connectively?
Literature review and clergy interviews inform the design of the end product of this study. We
ask Cleopas and his unnamed friend on that road to Emmaus to link arms with us on this final
journey, traveling from connection to encounter to resonance in preaching.