How’s Life in Chile? - oecd.org Life Initiative country note Chile.pdf · How’s Life. in Chile?...
8
How’s Life in Chile? October 2015 Additional information, including the data used in this country note, can be found here: www.oecd.org/statistics/Hows-Life-2015-country-notes-data.xlsx
Transcript of How’s Life in Chile? - oecd.org Life Initiative country note Chile.pdf · How’s Life. in Chile?...
How’s Life in Chile?
October 2015
Additional information, including the data used in this country note, can be found here: www.oecd.org/statistics/Hows-Life-2015-country-notes-data.xlsx
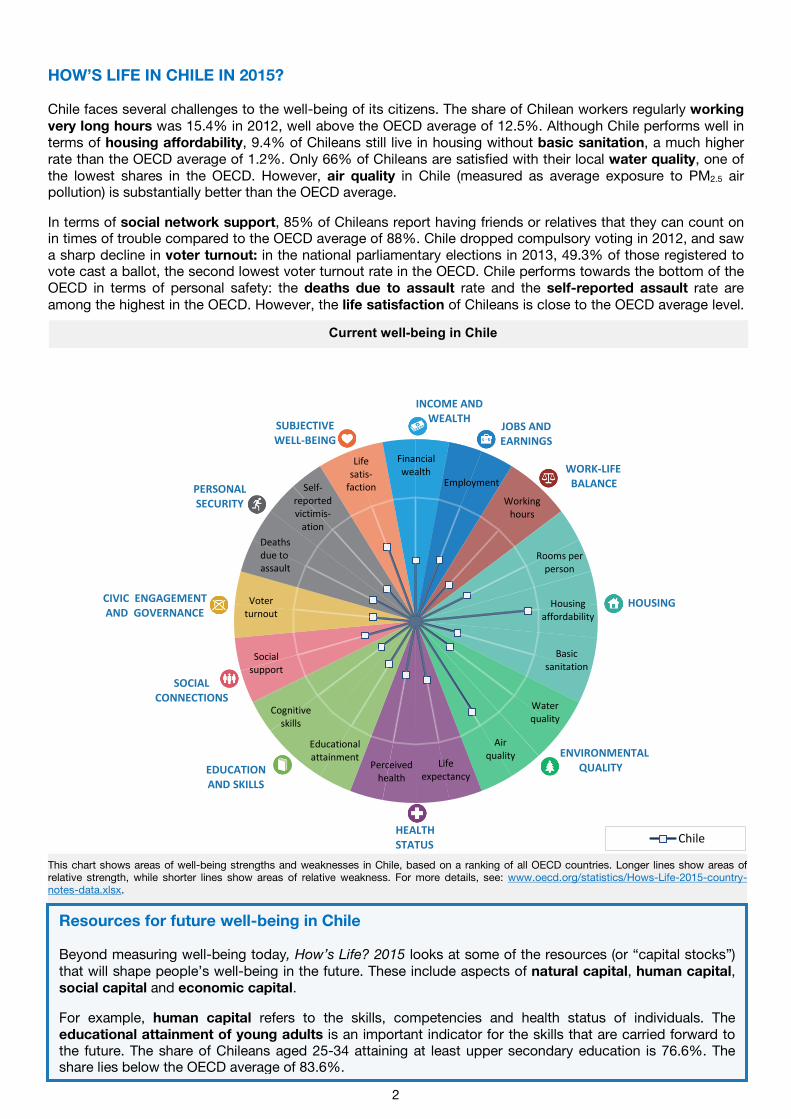
HOW’S LIFE IN CHILE IN 2015?
Chile faces several challenges to the well-being of its citizens. The share of Chilean workers regularly working very long hours was 15.4% in 2012, well above the OECD average of 12.5%. Although Chile performs well in terms of housing affordability, 9.4% of Chileans still live in housing without basic sanitation, a much higher rate than the OECD average of 1.2%. Only 66% of Chileans are satisfied with their local water quality, one of the lowest shares in the OECD. However, air quality in Chile (measured as average exposure to PM2.5 air pollution) is substantially better than the OECD average.
In terms of social network support, 85% of Chileans report having friends or relatives that they can count on in times of trouble compared to the OECD average of 88%. Chile dropped compulsory voting in 2012, and saw a sharp decline in voter turnout: in the national parliamentary elections in 2013, 49.3% of those registered to vote cast a ballot, the second lowest voter turnout rate in the OECD. Chile performs towards the bottom of the OECD in terms of personal safety: the deaths due to assault rate and the self-reported assault rate are among the highest in the OECD. However, the life satisfaction of Chileans is close to the OECD average level.
Current well-being in Chile
This chart shows areas of well-being strengths and weaknesses in Chile, based on a ranking of all OECD countries. Longer lines show areas of relative strength, while shorter lines show areas of relative weakness. For more details, see: www.oecd.org/statistics/Hows-Life-2015-country-notes-data.xlsx.
Resources for future well-being in Chile Beyond measuring well-being today, How’s Life? 2015 looks at some of the resources (or “capital stocks”) that will shape people’s well-being in the future. These include aspects of natural capital, human capital, social capital and economic capital.
For example, human capital refers to the skills, competencies and health status of individuals. The educational attainment of young adults is an important indicator for the skills that are carried forward to the future. The share of Chileans aged 25-34 attaining at least upper secondary education is 76.6%. The share lies below the OECD average of 83.6%.
2
Chile
JOBS AND EARNINGS
HOUSING
WORK-LIFE BALANCE
ENVIRONMENTAL QUALITY
HEALTH STATUS
EDUCATION AND SKILLS
SOCIAL CONNECTIONS
CIVIC ENGAGEMENT AND GOVERNANCE
PERSONAL SECURITY
SUBJECTIVE WELL-BEING
INCOME AND WEALTH
Deaths due to assault
Employment
Life satis-
faction
Financialwealth
Self-reported victimis-
ation
Working hours
Rooms per person
Housing affordability
Basic sanitation
Water quality
Air quality
Social support
Cognitive skills
Educational attainment
Voter turnout
Perceived health
Life expectancy
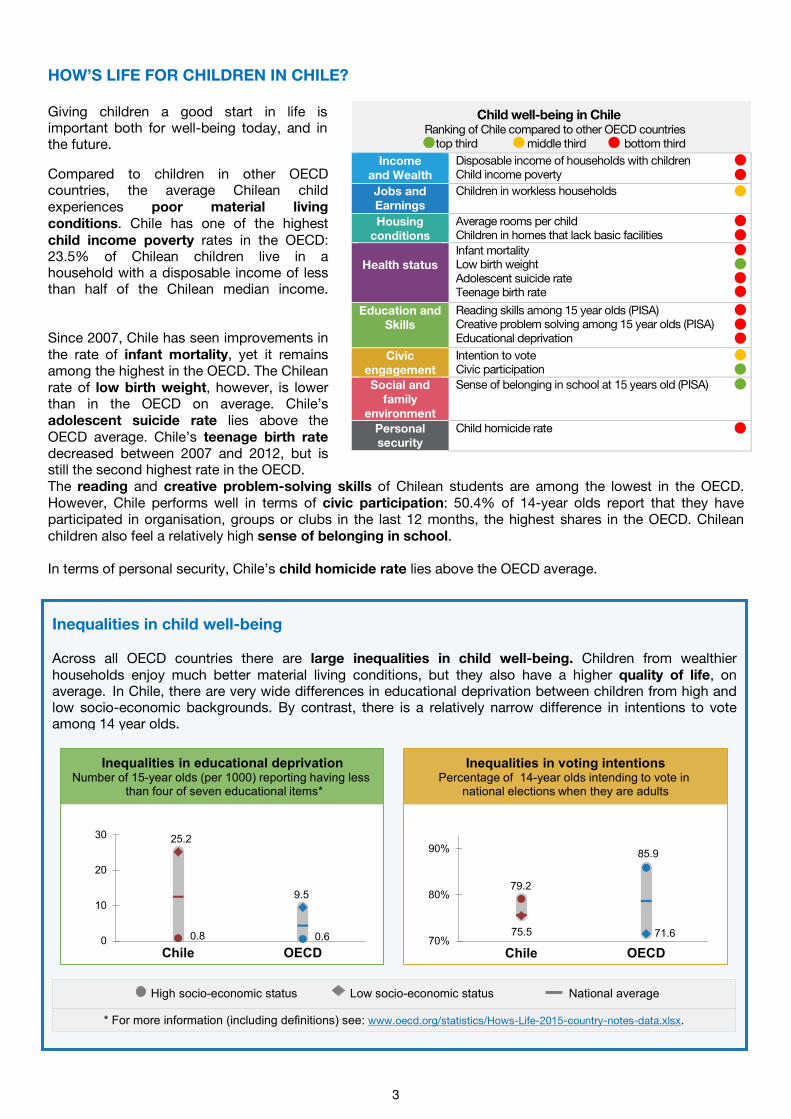
Child well-being in Chile Ranking of Chile compared to other OECD countries top third middle third bottom third
79.2
85.9
75.5 71.6 70%
80%
90%
Chile OECD
Inequalities in voting intentions Percentage of 14-year olds intending to vote in
national elections when they are adults
0.8 0.6
25.2
9.5
0
10
20
30
Chile OECD
Inequalities in educational deprivation Number of 15-year olds (per 1000) reporting having less
than four of seven educational items*
HOW’S LIFE FOR CHILDREN IN CHILE? Giving children a good start in life is important both for well-being today, and in the future.
Compared to children in other OECD countries, the average Chilean child experiences poor material living conditions. Chile has one of the highest child income poverty rates in the OECD: 23.5% of Chilean children live in a household with a disposable income of less than half of the Chilean median income. Since 2007, Chile has seen improvements in the rate of infant mortality, yet it remains among the highest in the OECD. The Chilean rate of low birth weight, however, is lower than in the OECD on average. Chile’s adolescent suicide rate lies above the OECD average. Chile’s teenage birth rate decreased between 2007 and 2012, but is still the second highest rate in the OECD. The reading and creative problem-solving skills of Chilean students are among the lowest in the OECD. However, Chile performs well in terms of civic participation: 50.4% of 14-year olds report that they have participated in organisation, groups or clubs in the last 12 months, the highest shares in the OECD. Chilean children also feel a relatively high sense of belonging in school. In terms of personal security, Chile’s child homicide rate lies above the OECD average.
Income and Wealth
Disposable income of households with children Child income poverty
Jobs and Earnings
Children in workless households
Housing conditions
Average rooms per child Children in homes that lack basic facilities
Health status
Infant mortality Low birth weight Adolescent suicide rate Teenage birth rate
Education and Skills
Reading skills among 15 year olds (PISA) Creative problem solving among 15 year olds (PISA) Educational deprivation
Civic engagement
Intention to vote Civic participation
Social and family
environment
Sense of belonging in school at 15 years old (PISA)
Personal security
Child homicide rate
Inequalities in child well-being Across all OECD countries there are large inequalities in child well-being. Children from wealthier households enjoy much better material living conditions, but they also have a higher quality of life, on average. In Chile, there are very wide differences in educational deprivation between children from high and low socio-economic backgrounds. By contrast, there is a relatively narrow difference in intentions to vote among 14 year olds.
* For more information (including definitions) see: www.oecd.org/statistics/Hows-Life-2015-country-notes-data.xlsx.
High socio-economic status Low socio-economic status National average
3
THE VALUE OF GIVING: VOLUNTEERING AND WELL-BEING Volunteering makes an important “hidden contribution” to well-being, producing goods and services that are not captured by conventional economic statistics. When you add up the value of the time people spend on volunteering in OECD countries, it amounts to roughly 2% of GDP per year. Volunteering in Chile and the OECD
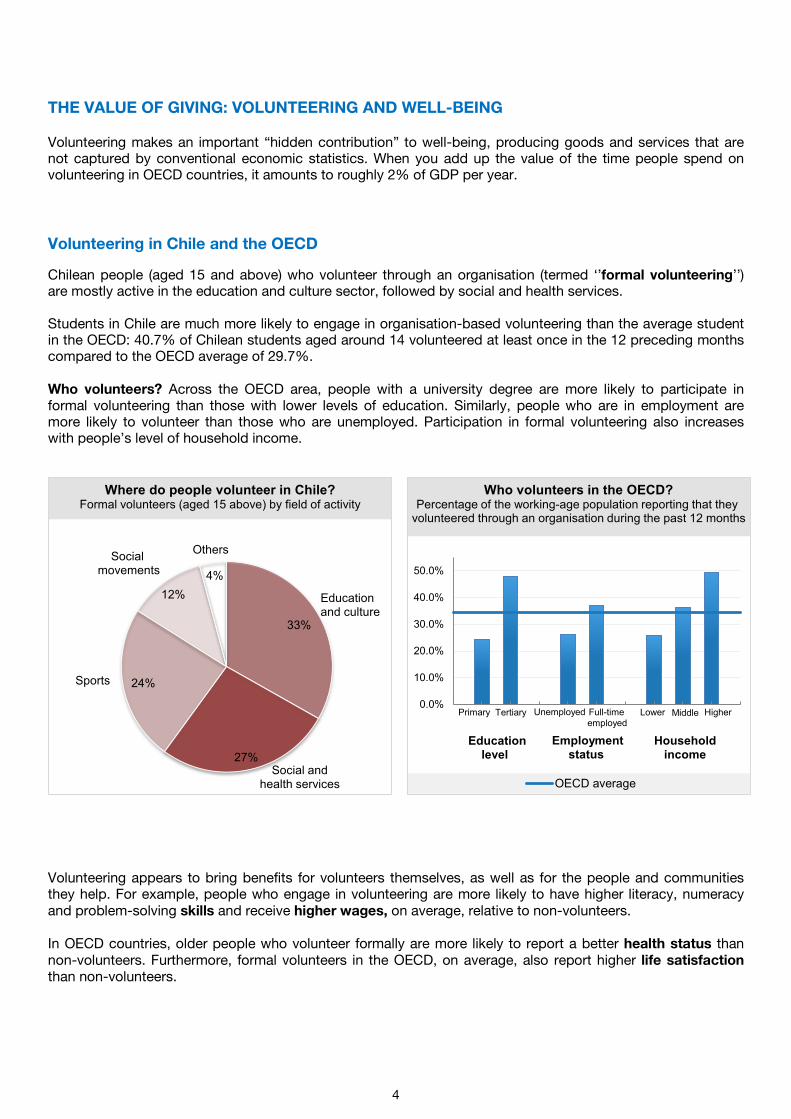
Chilean people (aged 15 and above) who volunteer through an organisation (termed ‘’formal volunteering’’) are mostly active in the education and culture sector, followed by social and health services. Students in Chile are much more likely to engage in organisation-based volunteering than the average student in the OECD: 40.7% of Chilean students aged around 14 volunteered at least once in the 12 preceding months compared to the OECD average of 29.7%. Who volunteers? Across the OECD area, people with a university degree are more likely to participate in formal volunteering than those with lower levels of education. Similarly, people who are in employment are more likely to volunteer than those who are unemployed. Participation in formal volunteering also increases with people’s level of household income.
Volunteering appears to bring benefits for volunteers themselves, as well as for the people and communities they help. For example, people who engage in volunteering are more likely to have higher literacy, numeracy and problem-solving skills and receive higher wages, on average, relative to non-volunteers. In OECD countries, older people who volunteer formally are more likely to report a better health status than non-volunteers. Furthermore, formal volunteers in the OECD, on average, also report higher life satisfaction than non-volunteers.
4
33%
27%
24%
12% 4%
Where do people volunteer in Chile? Formal volunteers (aged 15 above) by field of activity
Education and culture
Social movements
Social and health services
Sports
Others
0.0%
10.0%
20.0%
30.0%
40.0%
50.0%
OECD average
Who volunteers in the OECD? Percentage of the working-age population reporting that they
volunteered through an organisation during the past 12 months
Primary Tertiary Education
level
Unemployed
Full-time employed
Lower
Higher
Middle
Employment status
Household income
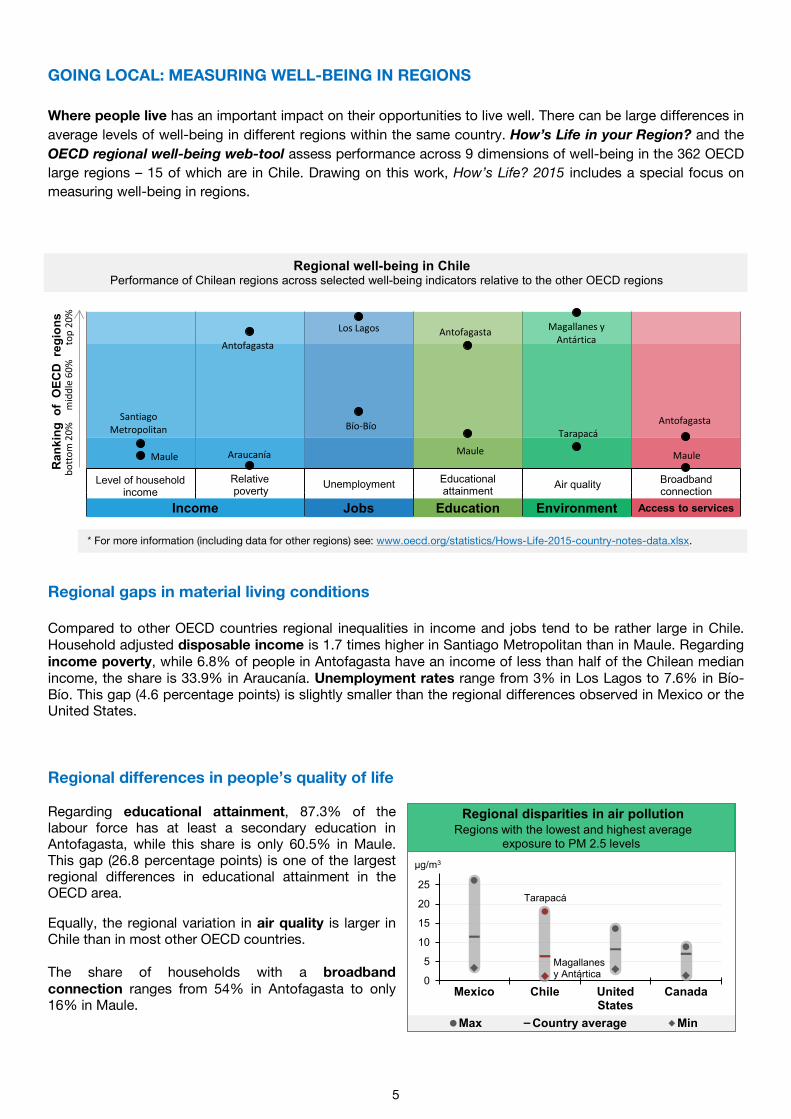
GOING LOCAL: MEASURING WELL-BEING IN REGIONS Where people live has an important impact on their opportunities to live well. There can be large differences in average levels of well-being in different regions within the same country. How’s Life in your Region? and the OECD regional well-being web-tool assess performance across 9 dimensions of well-being in the 362 OECD large regions – 15 of which are in Chile. Drawing on this work, How’s Life? 2015 includes a special focus on measuring well-being in regions.
Regional gaps in material living conditions Compared to other OECD countries regional inequalities in income and jobs tend to be rather large in Chile. Household adjusted disposable income is 1.7 times higher in Santiago Metropolitan than in Maule. Regarding income poverty, while 6.8% of people in Antofagasta have an income of less than half of the Chilean median income, the share is 33.9% in Araucanía. Unemployment rates range from 3% in Los Lagos to 7.6% in Bío-Bío. This gap (4.6 percentage points) is slightly smaller than the regional differences observed in Mexico or the United States. Regional differences in people’s quality of life Regarding educational attainment, 87.3% of the labour force has at least a secondary education in Antofagasta, while this share is only 60.5% in Maule. This gap (26.8 percentage points) is one of the largest regional differences in educational attainment in the OECD area.
Equally, the regional variation in air quality is larger in Chile than in most other OECD countries. The share of households with a broadband connection ranges from 54% in Antofagasta to only 16% in Maule.
Regional well-being in Chile Performance of Chilean regions across selected well-being indicators relative to the other OECD regions
* For more information (including data for other regions) see: www.oecd.org/statistics/Hows-Life-2015-country-notes-data.xlsx.
5
Santiago Metropolitan
Antofagasta
Los Lagos Antofagasta Magallanes y Antártica
Antofagasta
Maule Araucanía
Bío-Bío
Maule
Tarapacá
Maule
00.10.20.30.40.50.60.70.80.9
1Broadband
Income Income Jobs Education Environment Access to
Relative poverty
Level of household income
Income
Unemployment Educational attainment Air quality Broadband
connection Jobs Education Environment Access to services
Ran
king
of
OEC
D r
egio
ns
b
otto
m 2
0%
mid
dle
60%
top
20%
0
5
10
15
20
25
Mexico Chile UnitedStates
Canada
Max Country average Min
μg/m3
Regional disparities in air pollution Regions with the lowest and highest average
exposure to PM 2.5 levels
Magallanes y Antártica
Tarapacá
BETTER LIFE INDEX
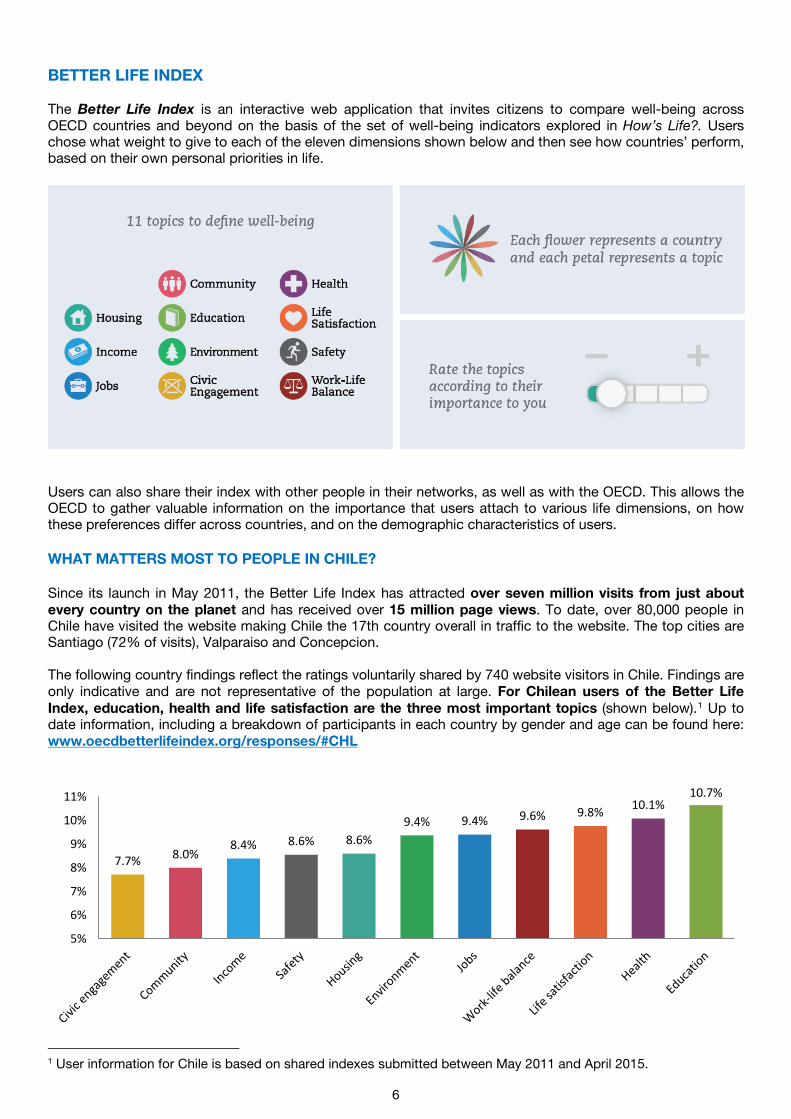
The Better Life Index is an interactive web application that invites citizens to compare well-being across OECD countries and beyond on the basis of the set of well-being indicators explored in How’s Life?. Users chose what weight to give to each of the eleven dimensions shown below and then see how countries’ perform, based on their own personal priorities in life.
Users can also share their index with other people in their networks, as well as with the OECD. This allows the OECD to gather valuable information on the importance that users attach to various life dimensions, on how these preferences differ across countries, and on the demographic characteristics of users. WHAT MATTERS MOST TO PEOPLE IN CHILE? Since its launch in May 2011, the Better Life Index has attracted over seven million visits from just about every country on the planet and has received over 15 million page views. To date, over 80,000 people in Chile have visited the website making Chile the 17th country overall in traffic to the website. The top cities are Santiago (72% of visits), Valparaiso and Concepcion. The following country findings reflect the ratings voluntarily shared by 740 website visitors in Chile. Findings are only indicative and are not representative of the population at large. For Chilean users of the Better Life Index, education, health and life satisfaction are the three most important topics (shown below).1 Up to date information, including a breakdown of participants in each country by gender and age can be found here: www.oecdbetterlifeindex.org/responses/#CHL
1 User information for Chile is based on shared indexes submitted between May 2011 and April 2015.
7.7% 8.0% 8.4% 8.6% 8.6%
9.4% 9.4% 9.6% 9.8% 10.1% 10.7%
5%
6%
7%
8%
9%
10%
11%
6
The OECD Better Life Initiative, launched in 2011, focuses on the aspects of life that matter to people and that shape their quality of life. The Initiative comprises a set of regularly updated well-being indicators and an analysis, published in the How’s Life? report as well as an interactive web application, the Better Life Index. It also includes a number of methodological and research projects to improve the information base towards a better understanding of well-being trends and their drivers. The OECD Better Life Initiative:
• Helps to inform policy making to improve quality of life. • Connects policies to people’s lives. • Generates support for needed policy measures. • Improves civic engagement by encouraging the public to create their own Better Life Index and share
their preferences about what matters most for well-being • Empowers the public by improving their understanding of policy-making.
This brochure presents selected findings for Chile from the How’s Life? report (pages 2-5) and shows what Chilean users of the Better Life Index are telling us about their well-being priorities (page 6). A supporting Excel file with the data underlying the graphs shown in this note and further information is available here: www.oecd.org/statistics/Hows-Life-2015-country-notes-data.xlsx. HOW’S LIFE?
How’s Life?, published every two years, provides a comprehensive picture of well-being in OECD countries and other major economies by bringing together an internationally comparable set of well-being indicators that the OECD considers as essential to a good life. It looks at people’s material conditions and quality of life across the population in eleven dimensions including: income and wealth; jobs and earnings; housing; health status; work-life balance; education and skills; social connections; civic engagement and governance; environmental quality; personal security; and subjective well-being. The How’s Life? 2015 report includes for the first time a set of indicators to measure the stocks of resources that help to support well-being over time. The report also contains three special chapters focusing on child well-being, volunteering and regional well-being.
7
For media requests contact: [email protected] or +33 1 45 24 97 00
For more information contact:
[email protected] or +33 1 45 24 88 28 [email protected] or +33 1 45 24 92 91
2