Howard Rye Institute_November 21 2015-2-2
52
Federal Reserve Bank of Boston Union of Minority Neighborhoods Howard Rye Institute Anthony Poore Ana Patricia Muñoz Kaili Mauricio Robert Clifford November 21, 2015 “The views expressed here do not necessarily represent those of the Federal Reserve Bank of Boston or the Federal Reserve System”
-
Upload
horace-small -
Category
Documents
-
view
60 -
download
0
Transcript of Howard Rye Institute_November 21 2015-2-2

Federal Reserve Bank of Boston
Union of M
inority Neighborhoods
How
ard Rye Institute A
nthony Poore A
na Patricia Muñoz
Kaili Mauricio
Robert Clifford
Novem
ber 21, 2015
“The views expressed here do not necessarily represent those of the Federal Reserve Bank of Boston or the Federal Reserve System
”

Federal Reserve Bank of Boston REG
ION
AL &
CO
MM
UN
ITY OU
TREACH
2
�M
ission �
The Federal Reserve Bank of Boston promotes econom
ic grow
th in lower-incom
e comm
unities by convening stakeholders, conducting research, and identifying approaches that w
ork.
�Focal A
reas �
Smaller Industrial C
ities – Working C
ities Challenge
�H
ousehold Financial Stability – Children’s Savings
Accounts
�W
orkforce Developm
ent - Fintech Internship Program

Ana Patricia M
uñoz Regional and C
omm
unity Outreach D
epartment, Federal Reserve Bank of Boston
The views expressed here do not necessarily represent those of the Federal Reserve Bank of Boston or the Federal Reserve System
.
3
THE C
OLO
R O
F WEA
LTH IN
BOSTO
N
ww
w.bostonfed.org/color-of-w
ealth
4
Kenneth Galbraith
“Societies never really become
effectively concerned with social
problems until they learn to m
easure them
”

Importance of w
ealth
�W
ealth allows fam
ilies to make investm
ents in education, and business creation, and to cover expenses in case of m
edical emergencies or job loss.
�A
sset poverty is shown to be m
ore persistent than income poverty.
�N
et worth is the econom
ic indicator in which w
hites and comm
unities of color are m
ost disparate
�A
true poverty-reduction policy should provide incentives for the poor to accum
ulate assets. (Wolf and C
aner 2004).
�Sem
inal work by Sherraden (1991) and O
liver and Shapiro (1995) underscored the im
portance of implem
enting policies that help reduce the w
ealth gap
5

Importance of w
ealth
Inflow: incom
e
Stock: wealth
Outflow
: expenditure
Measuring w
ealth (net worth)
ASSETS LIA
BILITIES (DEBTS)
Savings accounts C
hecking accounts Retirem
ent accounts Bonds Stocks H
ome
Vehicle Business equity
Mortgages
Auto loans
Credit card debt
Medical debt
Student loans
Wealth (net w
orth) = assets - liabilities

Measuring w
ealth: widening racial
wealth gap at the national level
8
79,650
110,500
7,546 6,314
9,925 7,683
0
20,000
40,000
60,000
80,000
100,000
20002011
Med
ian N
et Wo
rth o
f U.S. H
ou
seho
lds, 2
00
0 an
d 2
01
1
White, not Hispanic
BlackHispanic
X11 X8
X18 X14
Source: U.S. C
ensus Bureau, Survey of Income and Program
Participation. Note: Blacks include H
ispanics.
U.S. dollars
Measuring w
ealth
�Tw
o shortcomings of these surveys:
�They don’t provide enough inform
ation by race and ethnicity.
�M
ost surveys provide data only at the national level.
�To address these lim
itations, we partnered w
ith the Ford Foundation and D
uke University's C
onsortium on Social
Equity to bring the National A
sset Scorecard for C
omm
unities of Color (N
ASC
C) to the Boston M
etropolitan A
rea
9
The NA
SCC
project is funded by the Ford Foundation and the Federal Reserve Bank of Boston (for the Boston data). W
illiam D
arity, Jr. (Duke U
niversity) and Darrick H
amilton (The N
ew School) serve as prim
ary investigators. NA
SCC
-Boston project m
anager is Ana Patricia M
uñoz.
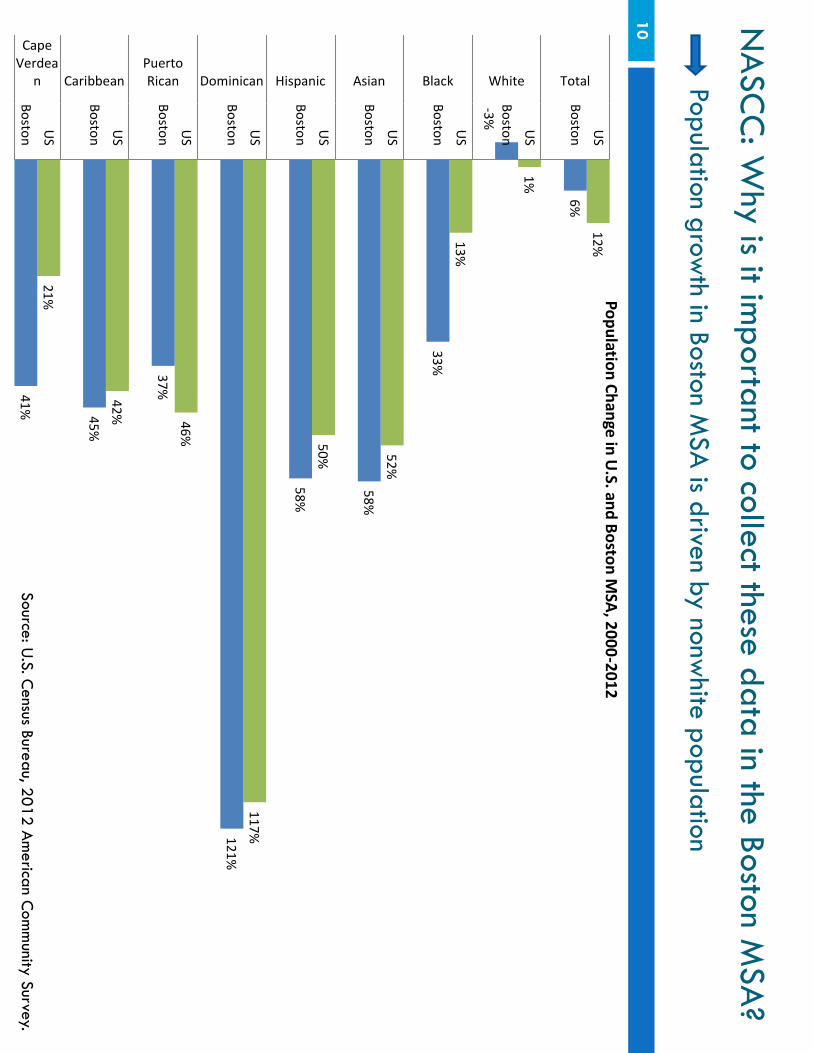
NA
SCC
: Why is it im
portant to collect these data in the Boston MSA
? Population grow
th in Boston MSA
is driven by nonwhite population
10
12%
6%
1%
-3%
13%
33%
52%
58%
50%
58%
117% 121%
46%
37% 42%
45%
21%
41%
US
BostonUS
BostonUS
BostonUS
BostonUS
BostonUS
BostonUS
BostonUS
BostonUS
Boston
TotalWhiteBlackAsianHispanicDominicanPuertoRicanCaribbean
CapeVerdea
n
Po
pu
lation
Ch
ange in
U.S. an
d B
osto
n M
SA, 2
00
0-2
01
2
Source: U.S. Census Bureau, 2012 A
merican C
omm
unity Survey.

11 The Color of W
ealth in Boston: Summ
ary of findings
Source: Muñoz, A
na Patricia, Marlene Kim
, Mariko C
hang, Regine Jackson, Darrick H
amilton, and W
illiam D
arity. (2015). The color of wealth in Boston.
Com
munity D
evelopment D
iscussion Paper, Federal Reserve Bank of Boston, Duke U
niversity, The New
School. ww
w.bostonfed.org/color-of-w
ealth
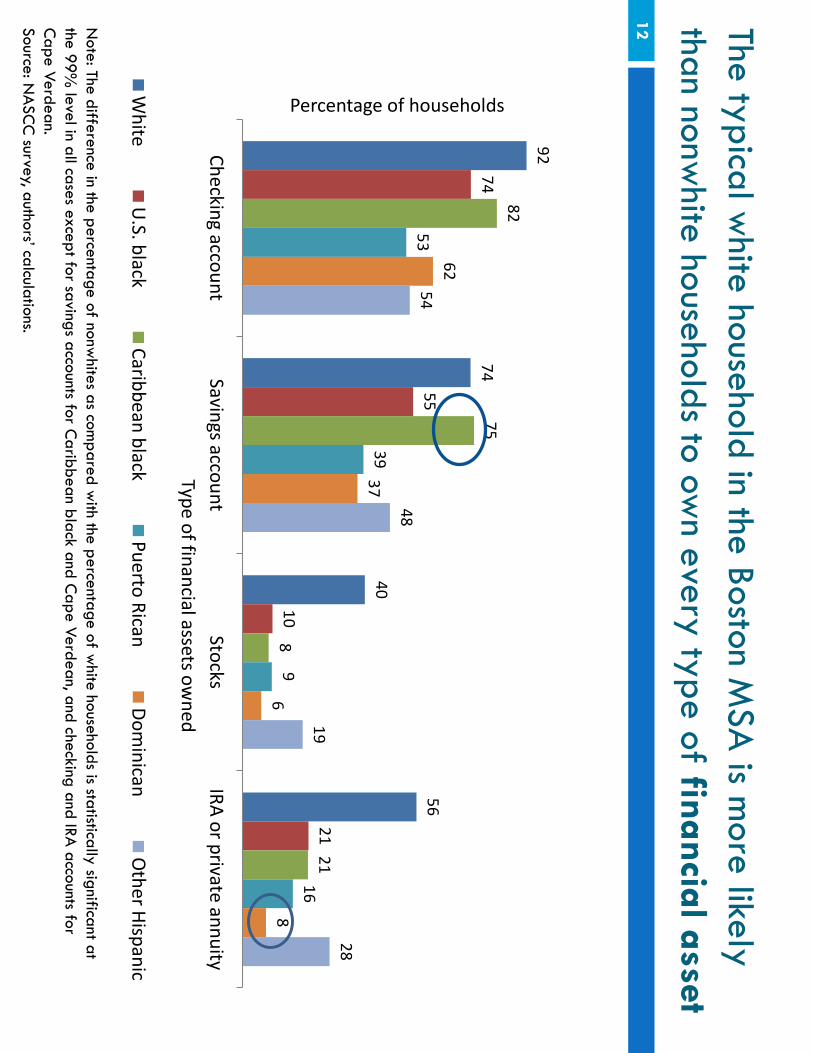
The typical white household in the Boston M
SA is m
ore likely than nonw
hite households to own every type of financial asset
12
92
74
40
56
74
55
10
21
82 75
8
21
53
39
9 16
62
37
6 8
54 48
19 28
Checking accountSavings account
StocksIRA or private annuity
Percentage of households
Type of financial assets owned
White
U.S. black
Caribbean blackPuerto Rican
Dominican
Other Hispanic
Note: The difference in the percentage of nonw
hites as compared w
ith the percentage of white households is statistically significant at
the 99% level in all cases except for savings accounts for C
aribbean black and Cape Verdean, and checking and IRA
accounts for C
ape Verdean. Source: N
ASC
C survey, authors’ calculations.
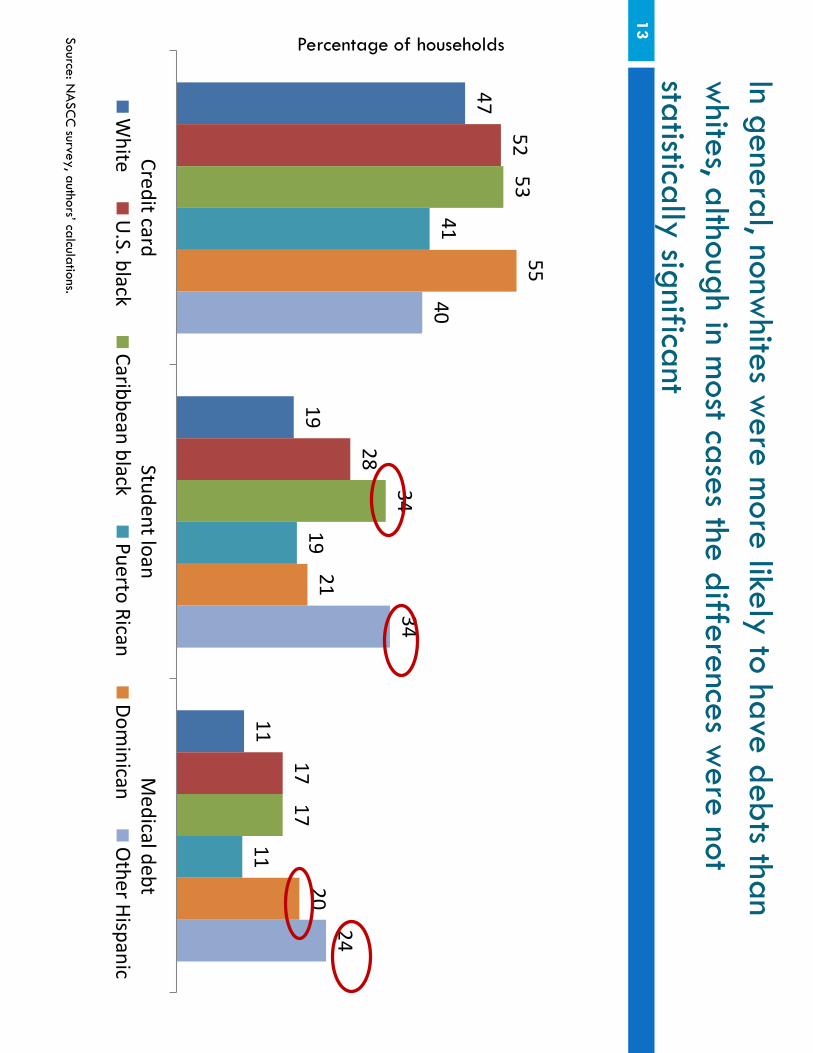
In general, nonwhites w
ere more likely to have debts than
whites, although in m
ost cases the differences were not
statistically significant 13
47
19
11
52
28
17
53
34
17
41
19
11
55
21 20
40 34
24
Credit cardStudent loan
Medical debt
White
U.S. black
Caribbean blackPuerto Rican
Dominican
Other Hispanic
Percentage of households
Source: NA
SCC
survey, authors’ calculations.

The white households in the Boston M
SA are m
ore likely than nonw
hite households to own every type of tangible asset
14
79 84
34
51 49
84
21
61
17
69
34
77
HouseVehicle
Percentage of households
Type
of tan
gible
asset
White
U.S. black
Caribbean blackPuerto Rican
Dominican
Other Hispanic
Note: The difference in the percentage of nonw
hites as compared w
ith the percentage of white households is statistically significant at
the 99% level in all the cases for hom
eownership. A
s for vehicle ownership the difference is statistically significant for U.S. blacks,
Puerto Ricans, and Dom
inicans. Source: N
ASC
C survey, authors’ calculations.
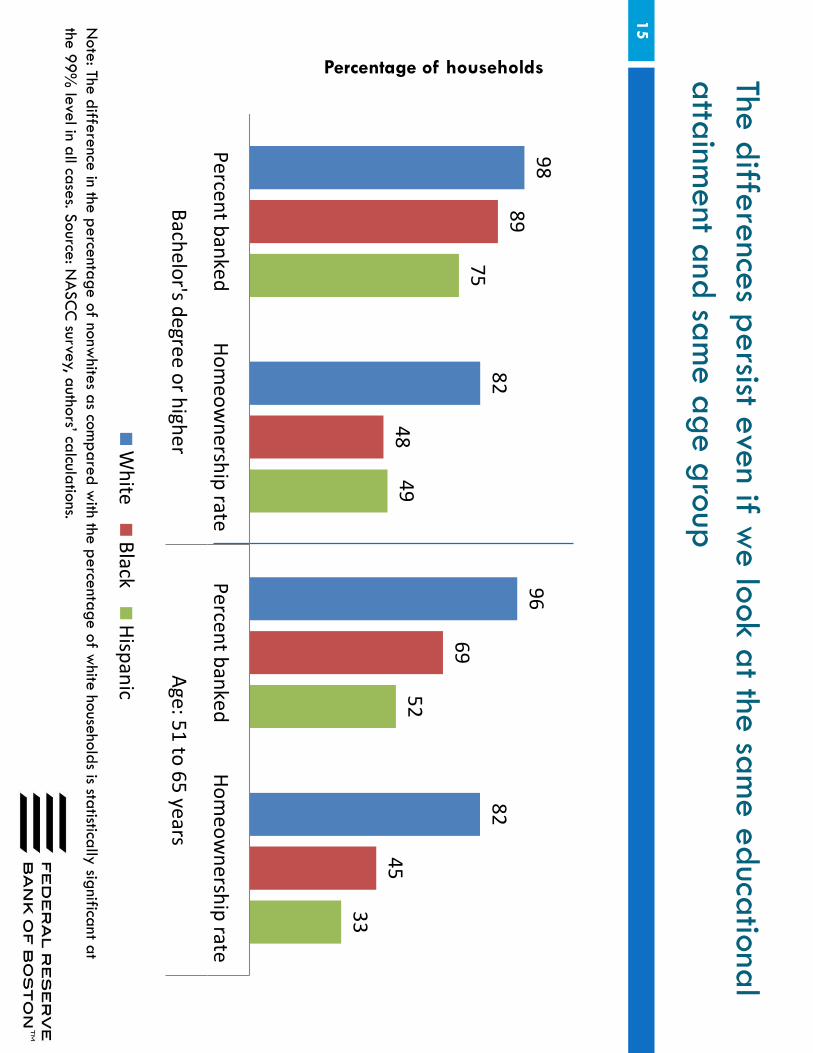
The differences persist even if we look at the sam
e educational attainm
ent and same age group
15
Percentage of households
Note: The difference in the percentage of nonw
hites as compared w
ith the percentage of white households is statistically significant at
the 99% level in all cases. Source: N
ASC
C survey, authors’ calculations.
98
82
96
82 89
48
69
45
75
49 52
33
Percent bankedHom
eownership rate
Percent bankedHom
eownership rate
Bachelor's degree or higherAge: 51 to 65 years
White
BlackHispanic
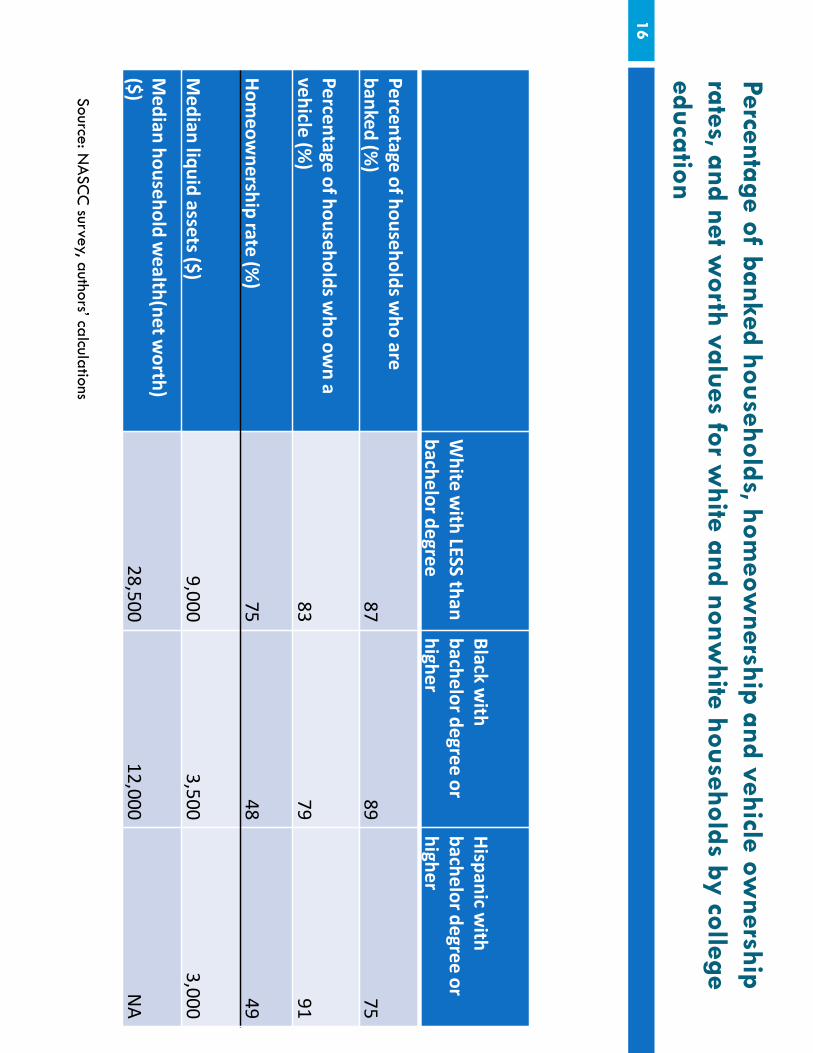
Percentage of banked households, homeow
nership and vehicle ownership
rates, and net worth values for w
hite and nonwhite households by college
education 16
W
hite
with
LESS than
b
ache
lor d
egre
e
Black w
ith
bach
elo
r de
gree
or
high
er
Hisp
anic w
ith
bach
elo
r de
gree
or
high
er
Pe
rcen
tage o
f ho
use
ho
lds w
ho
are
ban
ked
(%)
87 89
75
Pe
rcen
tage o
f ho
use
ho
lds w
ho
ow
n a
veh
icle (%
) 83
79 91
Ho
me
ow
nersh
ip rate
(%)
75 48
49
Me
dian
liqu
id assets ($
) 9,000
3,500 3,000
Me
dian
ho
use
ho
ld w
ealth
(net w
orth
) ($
) 28,500
12,000 N
A
Source: NA
SCC
survey, authors’ calculations

Median value of liquid assets (in dollars)
17
25,000
670
3,500
150
20
150
700
White
U.S. black
Caribbean black
Cape V
erdean
Puerto Rican
Dom
inican
Other H
ispanic
Note: Liquid assets, w
hich can quickly be converted into cash, include money in savings and checking accounts, stocks, m
oney m
arket funds, and government bonds. The category excludes cash on hand.
Source: NA
SCC
survey, authors’ calculations
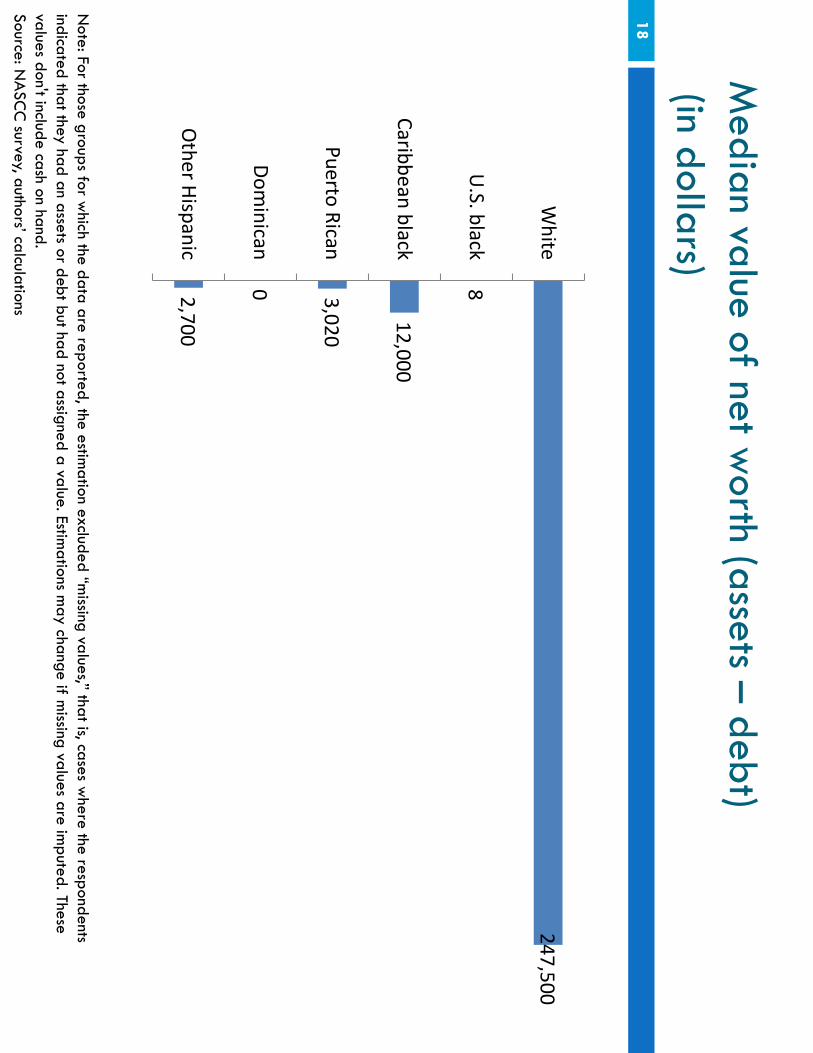
Median value of net w
orth (assets – debt) (in dollars)
18
Note: For those groups for w
hich the data are reported, the estimation excluded “m
issing values,” that is, cases where the respondents
indicated that they had an assets or debt but had not assigned a value. Estimations m
ay change if missing values are im
puted. These values don't include cash on hand. Source: N
ASC
C survey, authors’ calculations
247,500
8
12,000
3,020
0 2,700
White
U.S. black
Caribbean black
Puerto Rican
Dominican
Other Hispanic

Other variables of interest
U
se o
f payd
ay le
nd
ing
Re
spo
nd
en
t or fam
ily h
as be
en
in jail
Sen
ds re
mittan
ces
regu
larly
White
1.2 8.7
2.6 U.S. black
4.0 21.2**
8
Caribbean black 1.4
3.1 26.6***
Cape Verdean 1.0
7.8 16.6**
Puerto Rican 2.5
12.9 6
Dominican
8.7** 7.4
32.3*** O
ther Latino 6.4*
8.7 17**
NEC
5.5 16.6
17.3
Source: NA
SCC
-Boston. Notes: Black, w
hite and Asian are non-H
ispanic.

Financial Resources in Kinship and Social
Netw
orks 20
Source: Tatjana Meschede et. al. (2015), “Financial Resources in Kinship and Social N
etworks: Flow
and Relationship to Household W
ealth by Race and Ethnicity am
ong Boston Residents”, Boston Fed Com
munity developm
ent discussion paper
Percentage of Respondents Receiving Large Financial Gift/Inheritance and Sending
Money in Support of Fam
ily Mem
bers by Race/Ethnicity

Some takeaw
ays 21
�Racial w
ealth gap much w
ider that income w
ealth gap
�Im
portance of looking at both sides of the balance sheet: assets and debts
�W
ealth is transmitted intergenerationally
�N
onwhite groups in the study have very little to rely on in case of an em
ergency
�The staggering disparities should urge us to find policies that can help narrow
the w
ealth gap
�Policy solutions are com
plex and need to use a multifaceted approach.
�Such policies should consider the w
ide diversity among nonw
hite populations and be targeted or adapted accordingly
�Som
e solutions will have to be driven at the national level. W
hat can be done locally?
�Education alone w
on’t close the racial wealth gap
�Im
portance of collecting data on assets and debts at the local level, including disaggregated inform
ation for nonwhite groups.

The views expressed here do not necessarily represent those of the
Federal Reserve Bank of Boston or the Federal Reserve System
The Cost of Post-Secondary Education and Student D
ebt in New
England
Kaili Mauricio - Regional and C
omm
unity Outreach D
epartment, Federal Reserve Bank of Boston
Robert C
lifford -Research Departm
ent, Federal Reserve Bank of Boston

23
Less than 9th
Grade
Incomplete
High
School
High
School or Equivalent
Some
College
Associate's C
ollege G
raduate
United States
4.0%
8.1%
24.1%
23.3%
8.5%
22.5%
9.5%
New
England 2.4%
5.6%
22.8%
19.5%
7.3%
28.0%
14.5%
Massachusetts
2.5%
5.1%
19.9%
17.7%
6.5%
30.9%
17.4%
Connecticut
2.8%
6.2%
24.0%
20.3%
6.9%
25.3%
14.6%
Vermont
1.0%
5.6%
28.6%
19.2%
8.4%
27.4%
9.8%
New
H
ampshire
1.4%
5.6%
25.7%
21.4%
9.4%
26.8%
9.7%
Rhode Island 3.6%
7.1%
22.9%
22.2%
8.5%
24.9%
10.8%
Maine
1.0%
5.0%
30.1%
24.4%
9.5%
22.8%
7.1%
Educational attainment by state
and region, ages 25-34
Source: U
.S. C
ensus Bureau. (2009-2013). 2013 A
merican C
omm
unity Survey 5-Y
ear E
stimates. R
etrieved fromhttp://factfinder2.census.gov
24

25

26

Story Time!
27
�Tw
o siblings �
Story of averages and medians
�O
ne does well goes to a m
ore selective school �
The other takes a different path but still goes to school after graduating high school.
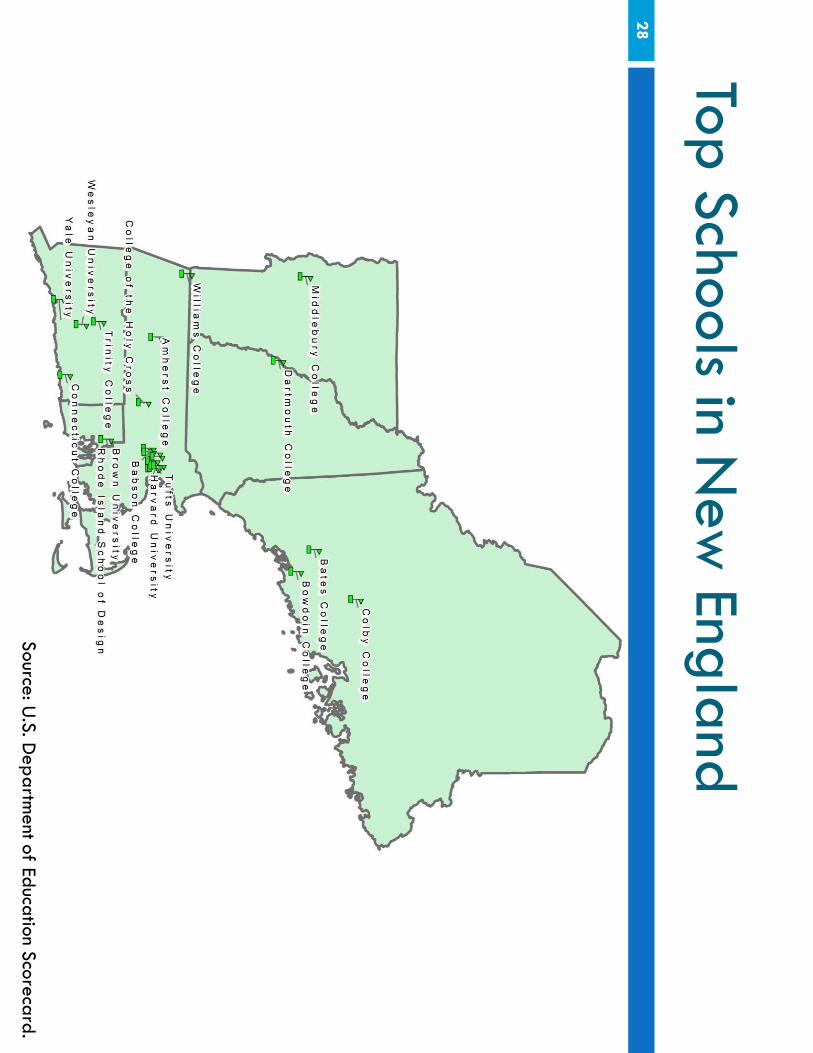
Top Schools in New
England 28
Source: U.S. D
epartment of Education Scorecard.

First Sibling Expectations 29
Source: Authors calculation from
U.S. Departm
ent of Education Scorecard. *2013 Cost
Sarah (Se
lective
Scho
ol)
Cost
$43,062*
Graduating D
ebt $19,038
Withdraw
Debt
$18,507 2
-year / 3
-year d
efault
rates
1.5% / 1.7%
Not w
orking 2 years out 7.4%
Earnings 2 years out $58,001
Earnings 6 years out $71,249

Two-year For Profit Schools in N
ew
England 30
Source: U.S. D
epartment of Education Scorecard.

Expectations? 31
Source: Authors calculation from
U.S. Departm
ent of Education Scorecard.*2013 costs
Sarah (Se
lective
Scho
ol)
Julie
t (2
-Year Fo
r-pro
fit)
Cost
$43,062* $27,920*
Graduating D
ebt $19,038
$13,162
Withdraw
Debt
$18,507 $7,249
2-ye
ar / 3-ye
ar defau
lt rate
s 1.5%
/ 1.7%
11.4% / 17.1%
N
ot working 2 years
out 7.4%
19.1%
Earnings 2 years out $58,001
$33,015
Earnings 6 years out $71,249
$36,048
Student loans are an investment in hum
an capital 32
�Loans enable a large portion of the population enrolled in college to attend higher education institutions.
�Student loans are an investm
ent in the acquisition of skills and credentials in exchange for future earnings.
�W
hile the return to obtaining a post-secondary education is persistent, borrow
ers need to make
complicated assum
ptions about costs and benefits w
hen deciding whether, w
hen, and where to attend.

The wage prem
ium for post-secondary
education is persistent and increases over-time
33
$0
$20,000
$40,000
$60,000
$80,000
$100,000
$120,000
25-2930-34
35-3940-44
45-4950-54
55-5960-64
65+
Master's D
egree or above
Bachelor's Degree
Associate's D
egree
Some C
ollege, no degree
High School
Less than High School
Source: Authors calculation using the U
.S. Census Bureau, 2013 A
merican C
omm
unity Survey. N
ote: Sample is restricted to those 25+
and employed.
Average W
age and Salary Income in N
ew England by A
ge and Education, 2013
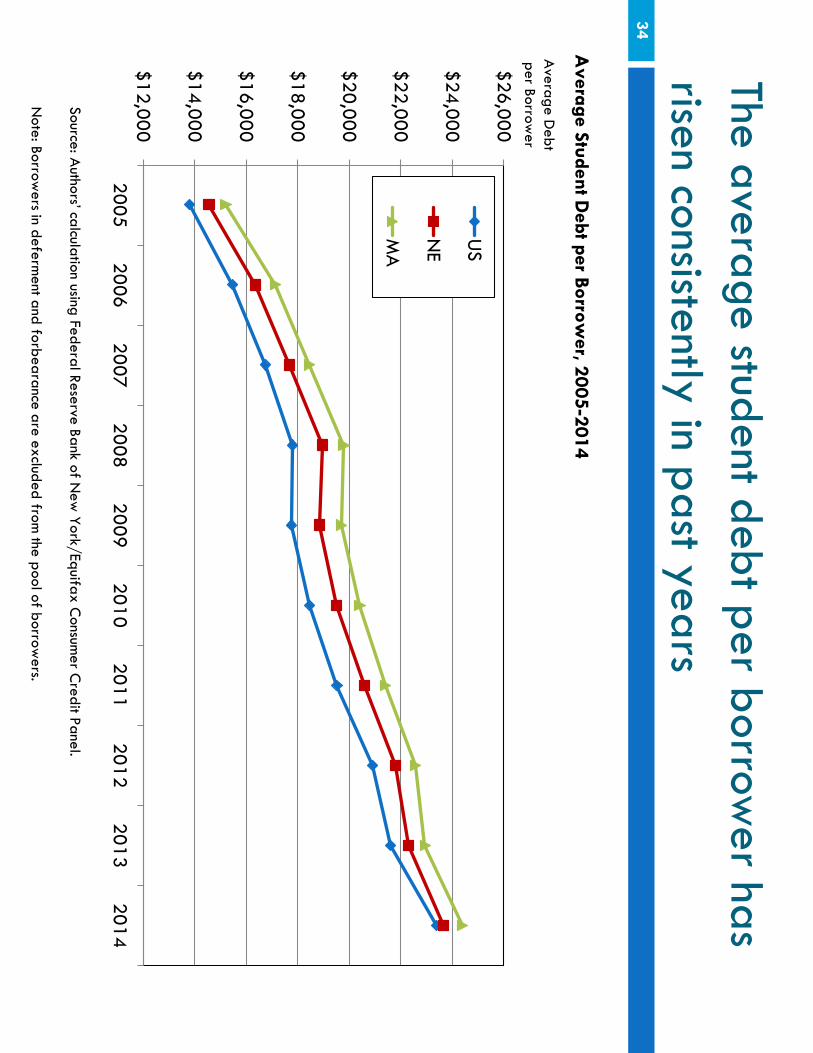
The average student debt per borrower has
risen consistently in past years 34
$12,000
$14,000
$16,000
$18,000
$20,000
$22,000
$24,000
$26,000
20052006
20072008
20092010
20112012
20132014
US
NE
MA
Source: Authors’ calculation using Federal Reserve Bank of N
ew York/Equifax C
onsumer C
redit Panel. N
ote: Borrowers in deferm
ent and forbearance are excluded from the pool of borrow
ers.
Average Student D
ebt per Borrower, 2005-2014
Average D
ebt per Borrow
er
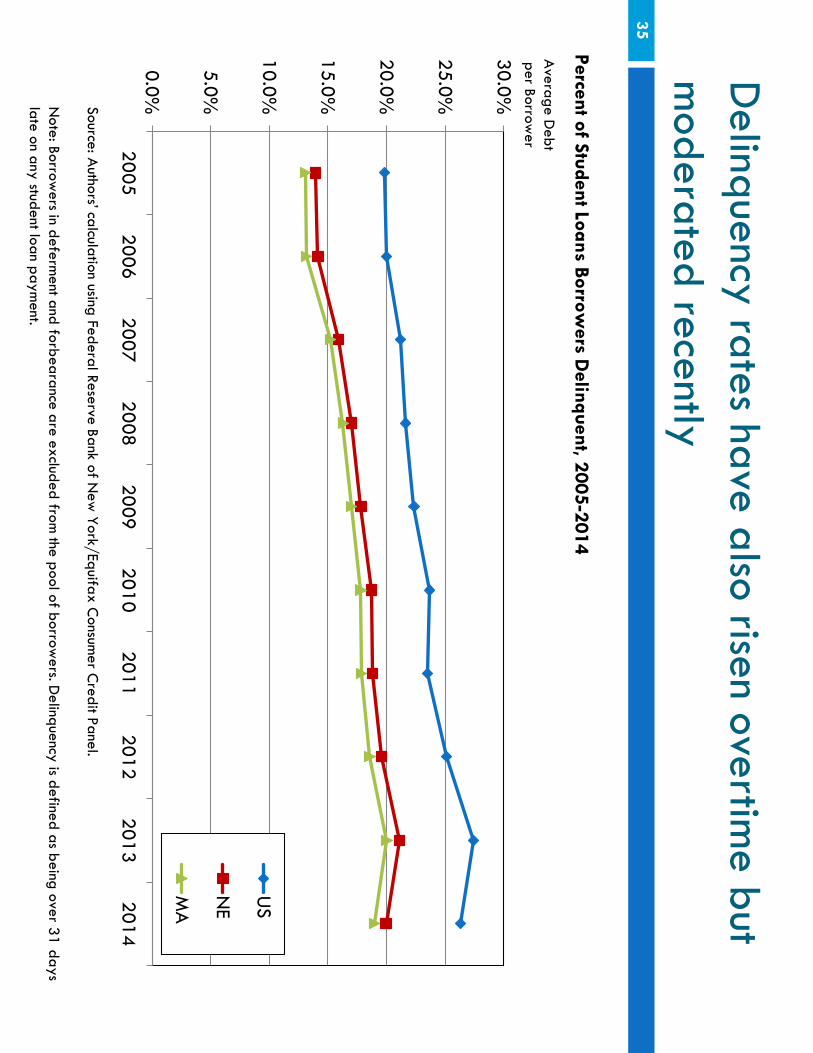
Delinquency rates have also risen overtim
e but m
oderated recently 35
0.0%
5.0%
10.0%
15.0%
20.0%
25.0%
30.0%
20052006
20072008
20092010
20112012
20132014
US
NE
MA
Source: Authors’ calculation using Federal Reserve Bank of N
ew York/Equifax C
onsumer C
redit Panel. N
ote: Borrowers in deferm
ent and forbearance are excluded from the pool of borrow
ers. Delinquency is defined as being over 31 days
late on any student loan payment.
Percent of Student Loans Borrowers D
elinquent, 2005-2014
Average D
ebt per Borrow
er
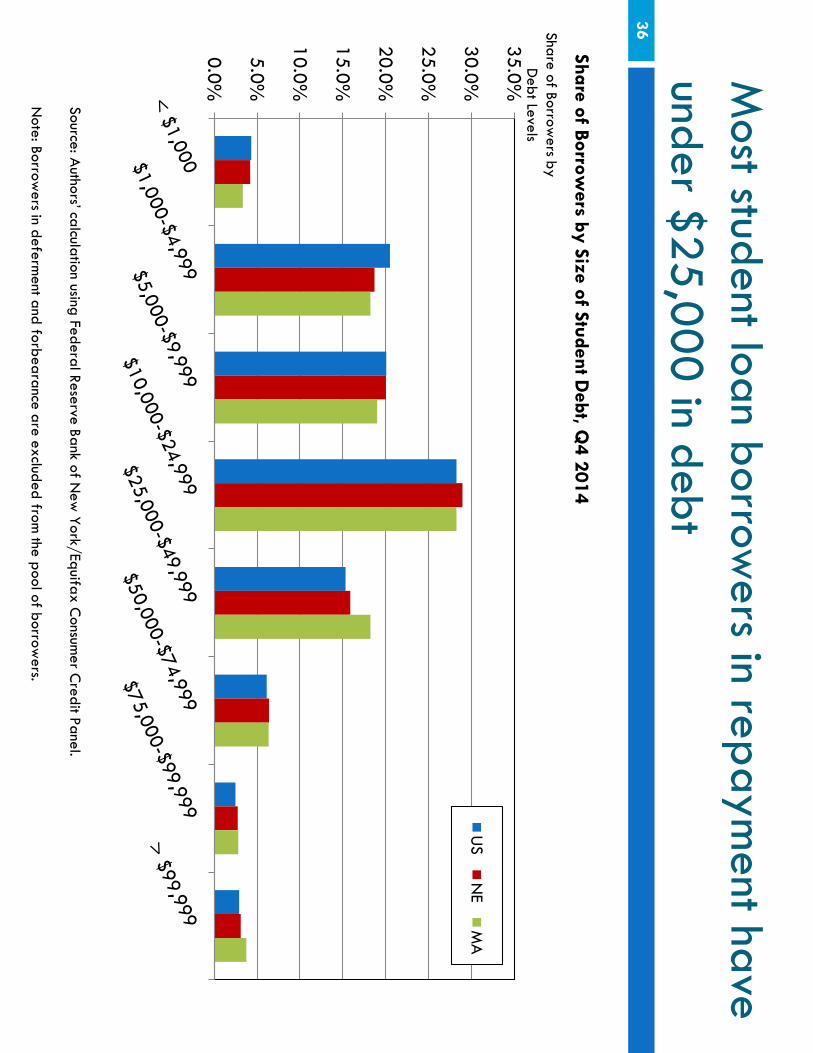
Most student loan borrow
ers in repayment have
under $25,000 in debt 36
0.0%
5.0%
10.0%
15.0%
20.0%
25.0%
30.0%
35.0%
US
NE
MA
Source: Authors’ calculation using Federal Reserve Bank of N
ew York/Equifax C
onsumer C
redit Panel. N
ote: Borrowers in deferm
ent and forbearance are excluded from the pool of borrow
ers.
Share of Borrowers by Size of Student D
ebt, Q4 2014
Share of Borrowers by
Debt Levels
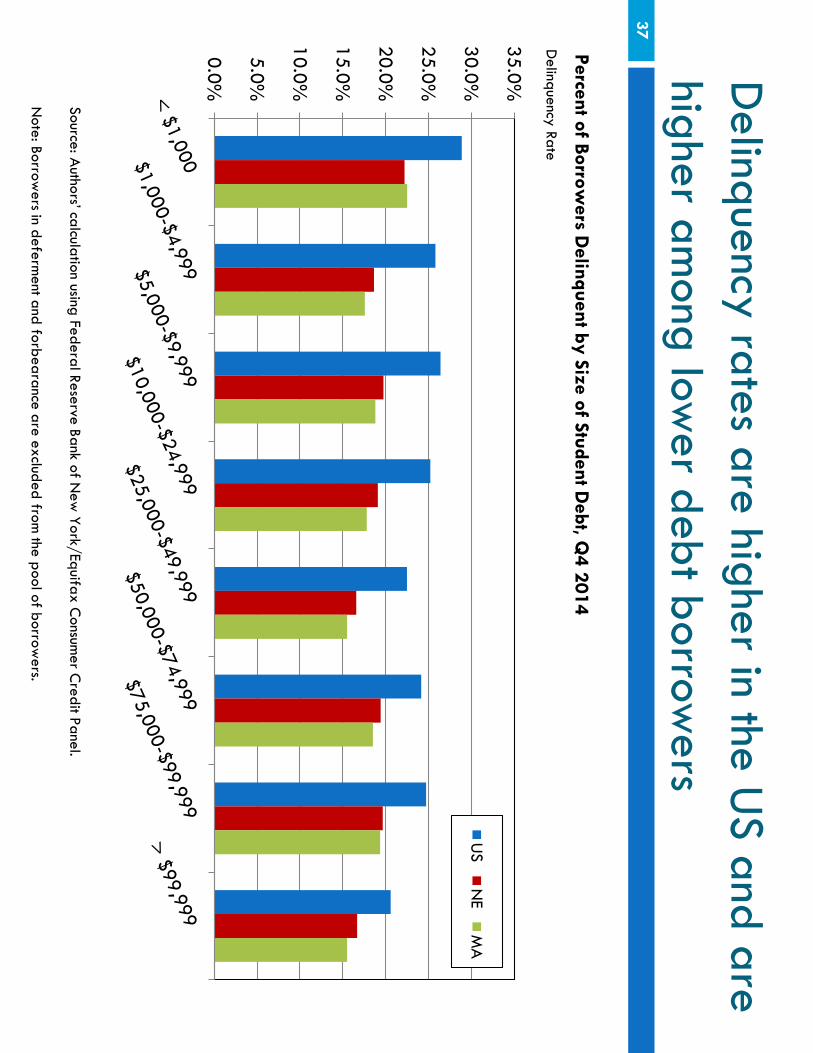
Delinquency rates are higher in the U
S and are higher am
ong lower debt borrow
ers 37
0.0%
5.0%
10.0%
15.0%
20.0%
25.0%
30.0%
35.0%
US
NE
MA
Source: Authors’ calculation using Federal Reserve Bank of N
ew York/Equifax C
onsumer C
redit Panel. N
ote: Borrowers in deferm
ent and forbearance are excluded from the pool of borrow
ers.
Percent of Borrowers D
elinquent by Size of Student Debt, Q
4 2014 D
elinquency Rate

Federal Reserve Bank of Boston
Com
plementary Solutions
to Student Debt &
Their Im
plications for M
assachusetts

What are C
hildren’s Savings Accounts (C
SAs)
�Long-term
asset-building accounts established for children, as early as birth, and allow
ed to grow over their lifetim
e.
�Tw
o Product Models
�A
deposit-only savings account offered by traditional lender. (K2C M
odel, San Francisco)
�A
529 savings plan (named for the relevant section of the federal tax code) is a state-
sponsored, tax-preferred savings plan for qualified post-secondary education expenses. (H
arold Alfond, M
aine)
�Either m
odel can provide savings matches or other incentives to encourage positive
savings behaviors – particularly those of lower incom
e – to save.
39

Major D
evelopments in the C
SA Field
40
Source: Center for Enterprise D
evelopment (C
FED)
Why D
o We C
are?
9C
SAs have the potential to expand econom
ic and educational opportunities for low
- and moderate incom
e families &
children.
9C
SAs support the interest of States in increasing the percentage of
its population with college degrees, certificates and credentials
(Lumina Foundation G
oal 2025). 9
Massachusetts G
oal: 60% by 2020
College A
ttainment am
ong Adults A
ges 25-64 : 51.5%
9C
SAs represent a long term
investment in our citizenry w
hile helping address and alleviate N
ew England’s/M
assachusetts middle skills
gap by addressing secondary education affordability. 9
CSA’s encourage and leverage, fam
ily, public and private capital resources.
41
Principles of Effective CSA
Design
42
�
Allow
universal, automatic child enrollm
ent. �
Carry a national footprint and equitable am
ong different jurisdictions.
�A
llow identification and engagem
ent with accounts, including
parent and child deposits, in-person and via electronic interface. �
Restrict accounts to asset-building purposes, but not strictly to higher education.
�Be adm
inistratively efficient in all essential operations, including disbursem
ent, and sustainable at scale, with tolerably low
adm
inistrative costs and integration into existing policy systems.
�A
dequately protect consumers, w
ith publicly provided accounts or private accounts w
ith substantial regulatory oversight
Moving Tow
ard a Policy Agenda for Im
proving Children's Savings A
ccount Delivery System
s W
illiam Elliott III, M
elinda K. Lewis, A
nthony Poore, and Brian Clarke, C
omm
unity Developm
ent Issue Brief, No. 1, 2015
New
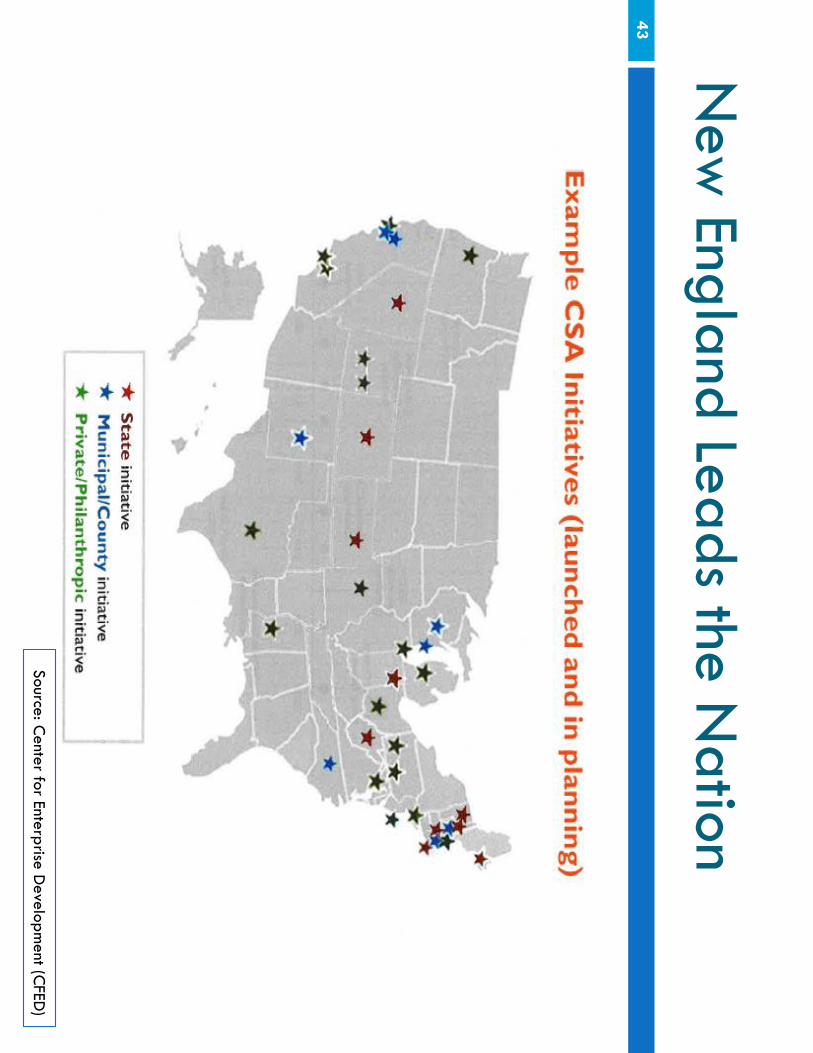
England Leads the Nation
43
Source: Center for Enterprise D
evelopment (C
FED)

New
England Leads the Nation

New
England Leads the Nation
45
New
England Leads the Nation
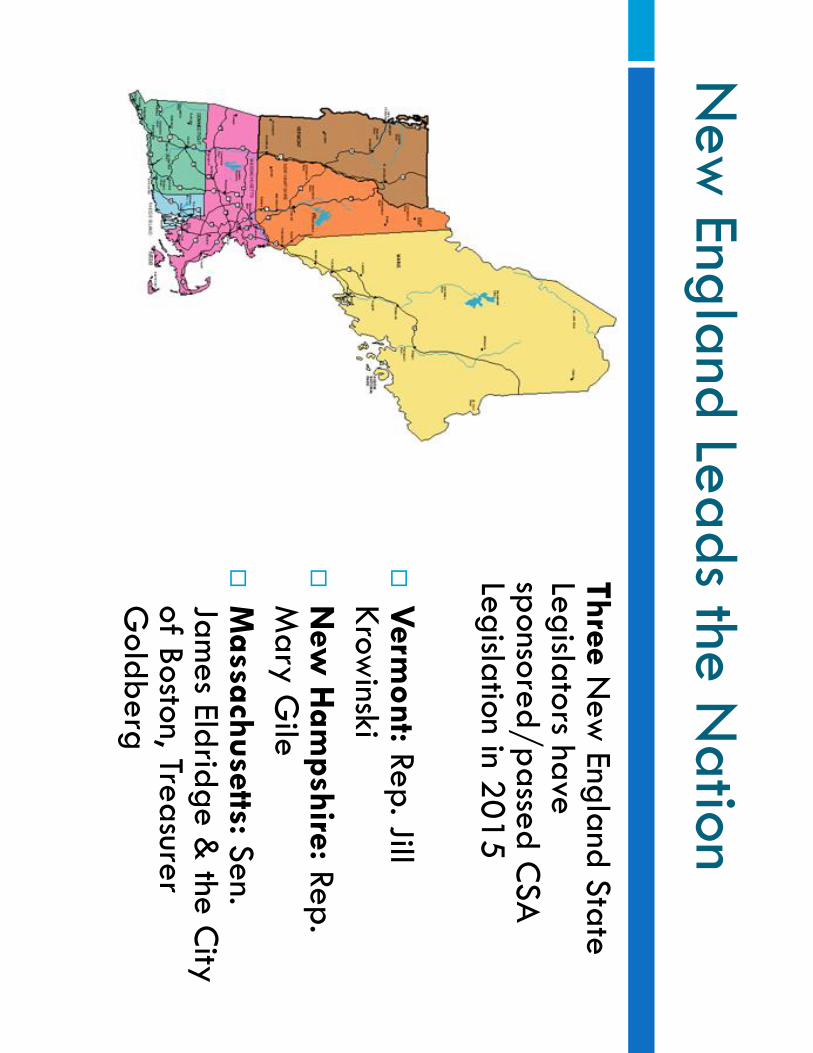
Three New
England State Legislators have sponsored/passed C
SA
Legislation in 2015 �
Verm
ont: Rep. Jill Krow
inski �
New
Ham
pshire: Rep. M
ary Gile
�M
assachusetts: Sen. Jam
es Eldridge & the C
ity of Boston, Treasurer G
oldberg 46
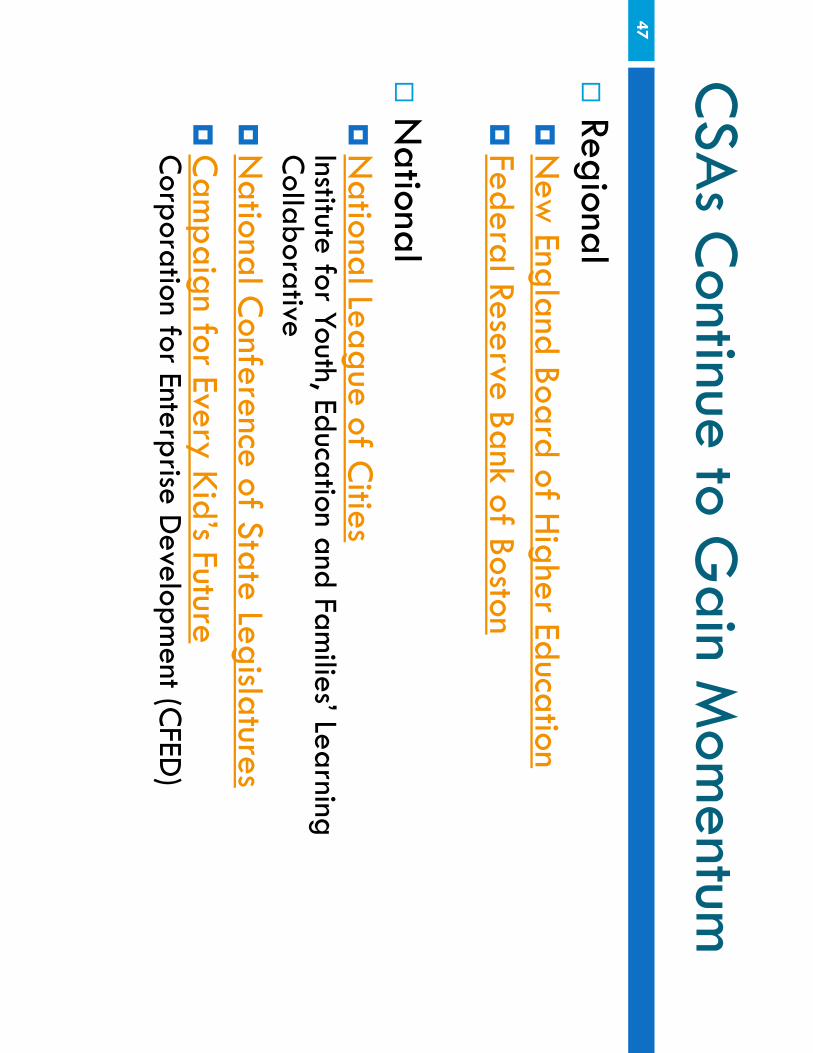
CSA
s Continue to G
ain Mom
entum
47
�Regional �
New
England Board of Higher Education
�Federal Reserve Bank of Boston
�
National �
National League of C
ities Institute for Youth, Education and Fam
ilies’ Learning C
ollaborative �
National C
onference of State Legislatures �
Cam
paign for Every Kid’s Future C
orporation for Enterprise Developm
ent (CFED
)
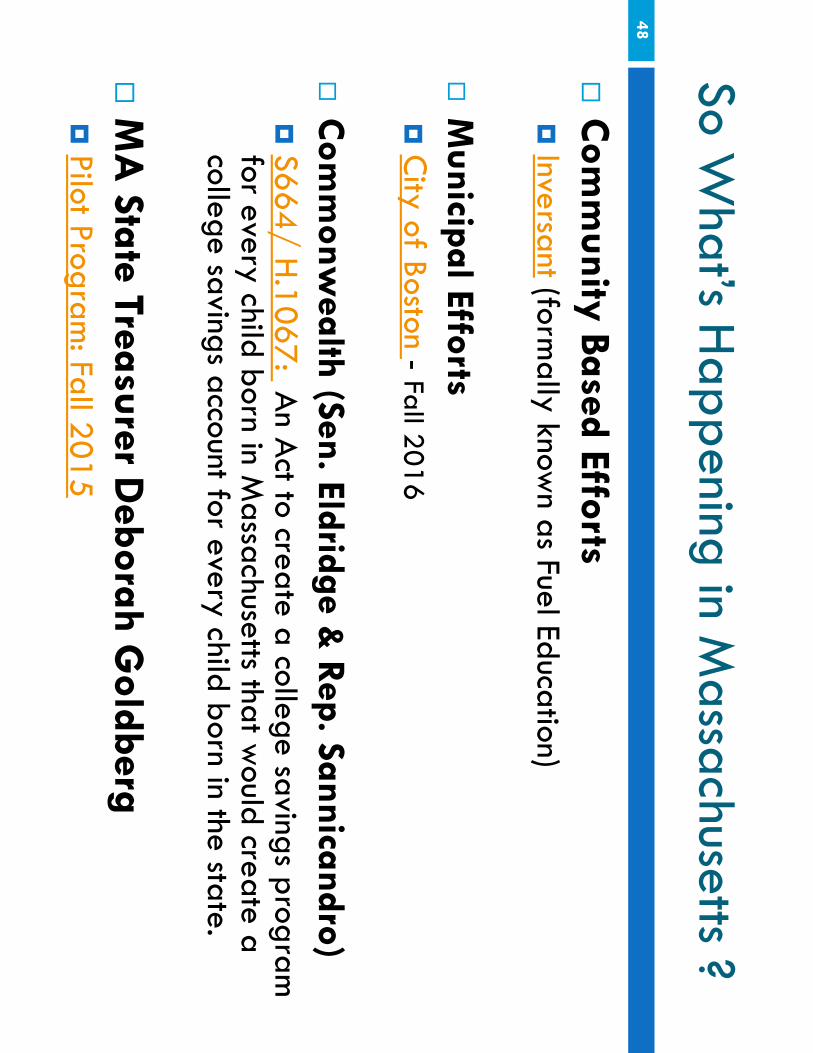
So What’s H
appening in Massachusetts ?
48
�C
omm
unity Based Efforts �
Inversant (formally know
n as Fuel Education)
�M
unicipal Efforts �
City of Boston - Fall 2016
�C
omm
onwealth (Sen. Eldridge &
Rep. Sannicandro) �
S664/ H.1067: A
n Act to create a college savings program
for every child born in M
assachusetts that would create a
college savings account for every child born in the state.
�M
A State Treasurer D
eborah Goldberg
�Pilot Program
: Fall 2015

What D
oes Early Research Suggest: A
ssets, Empow
erment &
Opportunity
College Readiness
�H
igher student and parental college expectations.
�W
eak but positive effects on reading & m
ath.
�H
igher high school GPA
�C
ollege Bound Identity
College A
ccess
�Even college savings of less than $500 increase college entry for low
and moderate incom
e students.
�3X
s more likely to enroll in college than w
ith no savings account.
�C
ollege Savers Identity
49
Elliot, W. and Lew
is (2013). Are student loans w
idening the wealth gap in A
merica? It’s a question of equity. Law
rence, KS: A
ssets & Education Initiative (A
EDI).

What D
oes Early Research Suggest: A
ssets, Empow
erment &
Opportunity
College C
ompletion
�Even college savings of less than $500 increase college com
pletion for low and m
oderate income students.
�4X
s more likely to graduate college than w
ith no savings account.
Young adult graduates who had savings as adolescents:
�2X
s more likely to ow
n savings accounts (banked/unbanked)
�2xs m
ore likely to own credit cards
�4xs m
ore likely to own stocks
50
Elliot, W. and Lew
is (2013). Are student loans w
idening the wealth gap in A
merica? It’s a question of equity. Law
rence, KS: A
ssets & Education Initiative (A
EDI).

What A
re Some O
ther Com
plementary Solutions
to Student Debt?
51
�Scholarship &
Mentoring A
pproaches �
Tennessee Promise
�O
regon Promise
�Loan Repaym
ent Assistance
�A
drian College: A
drian Plus Program
�Yale Law
School: Career O
ptions Assistance Program
�A
sset Based Approaches
�M
atched Savings Programs/IDA
s �
Children’s Savings A
ccounts

52
Anthony Poore
Deputy D
irector, R&C
O
ww
w.bostonfed.org/com
mdev/childrens-savings-accounts