
How Your Online Reputation Impacts Your Revenue · 2015-07-22 · Global Review IndexTM Sentiment...
36
How Your Online Reputation Impacts Your Revenue 20 th July 2015
Transcript of How Your Online Reputation Impacts Your Revenue · 2015-07-22 · Global Review IndexTM Sentiment...

How Your Online Reputation Impacts Your Revenue
20th July 2015

Does Online Reputation Impact Travelers?
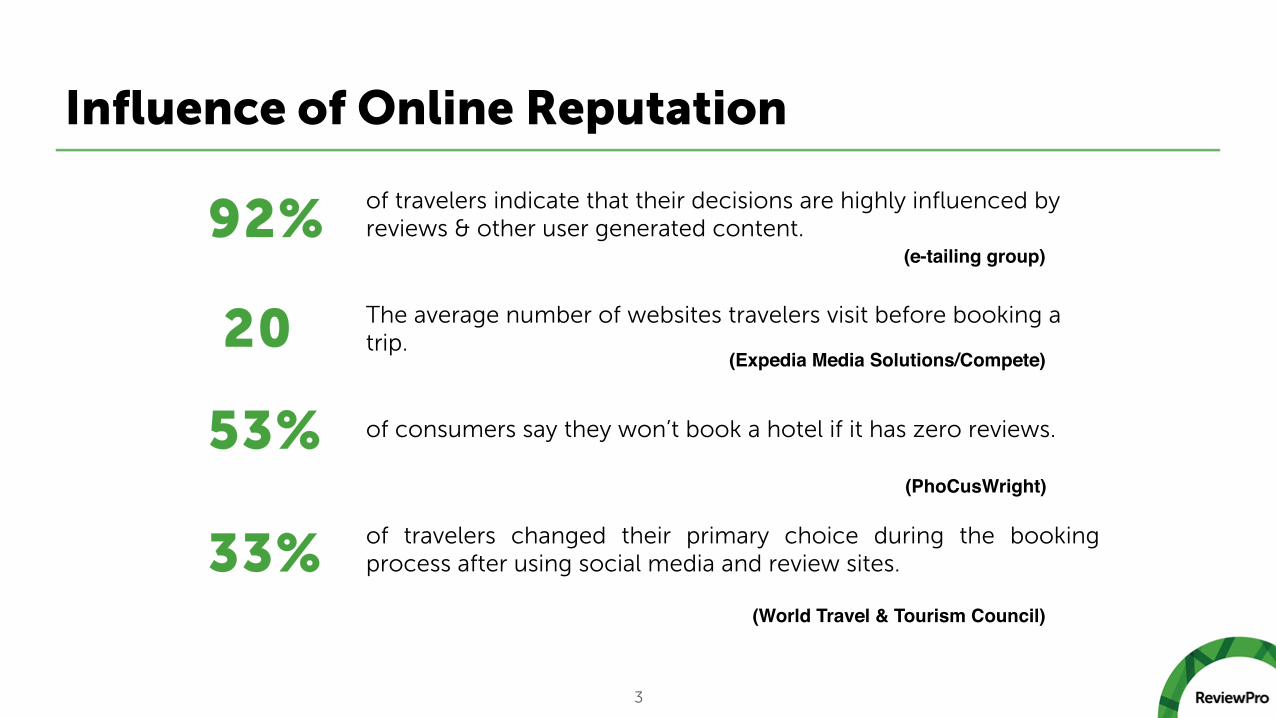
Influence of Online Reputation
of travelers indicate that their decisions are highly influenced by reviews & other user generated content. The average number of websites travelers visit before booking a trip. of consumers say they won’t book a hotel if it has zero reviews.
of travelers changed their primary choice during the booking process after using social media and review sites.
(e-tailing group)!
(Expedia Media Solutions/Compete)!
(PhoCusWright)!
(World Travel & Tourism Council) !
3
92%
20
53%
33%
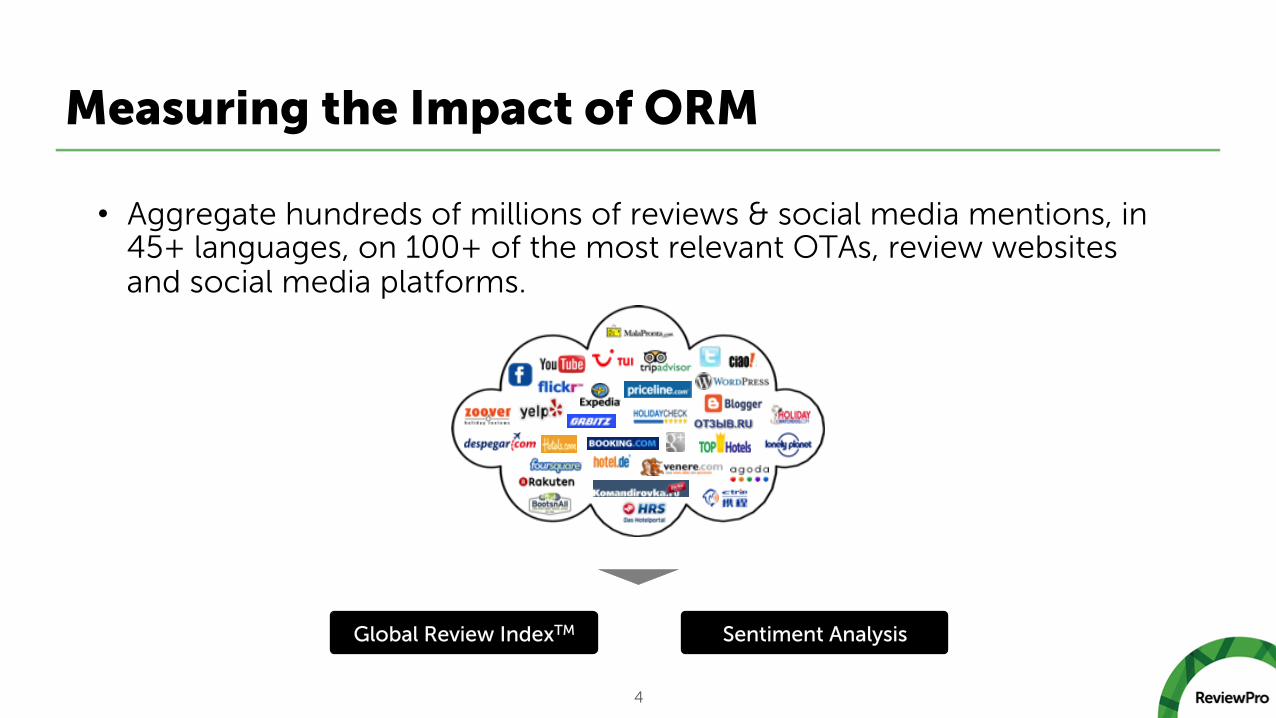
Measuring the Impact of ORM
• Aggregate hundreds of millions of reviews & social media mentions, in 45+ languages, on 100+ of the most relevant OTAs, review websites and social media platforms.
4
Global Review IndexTM Sentiment Analysis

Leveraging Guest Intelligence
Data/API Revenue
Optimizer Guest
Surveys Reputation
Management
Guest Intelligence
Restaurants
Management Companies
Hotels
Investment &
Consulting
Associations & Representation
Companies
Destinations & Star Ratings
5
Clients & Partners
6

Leading Destinations Rely on ReviewPro
7

What Business Are You Really In?

Hotel Business…?

Experience & Expectation
Management Business
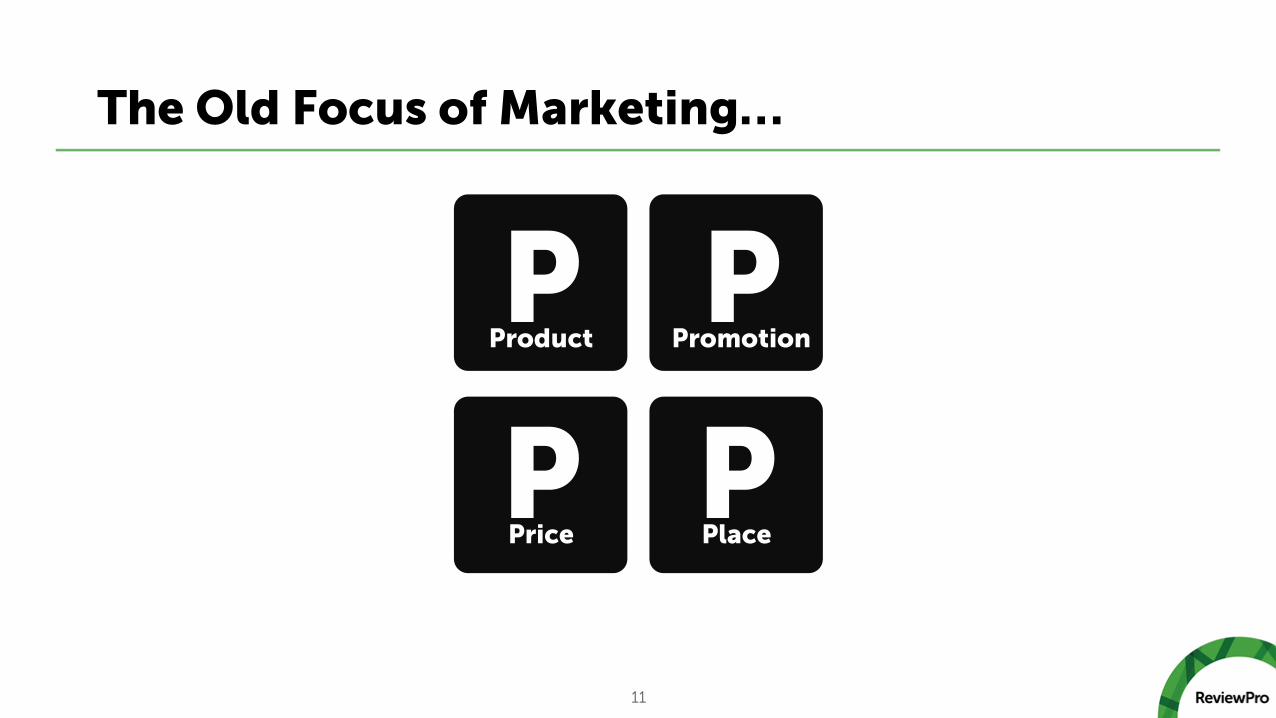
P Product
P Promotion
P Price
P Place
The Old Focus of Marketing…
11

…Has Changed Forever
12
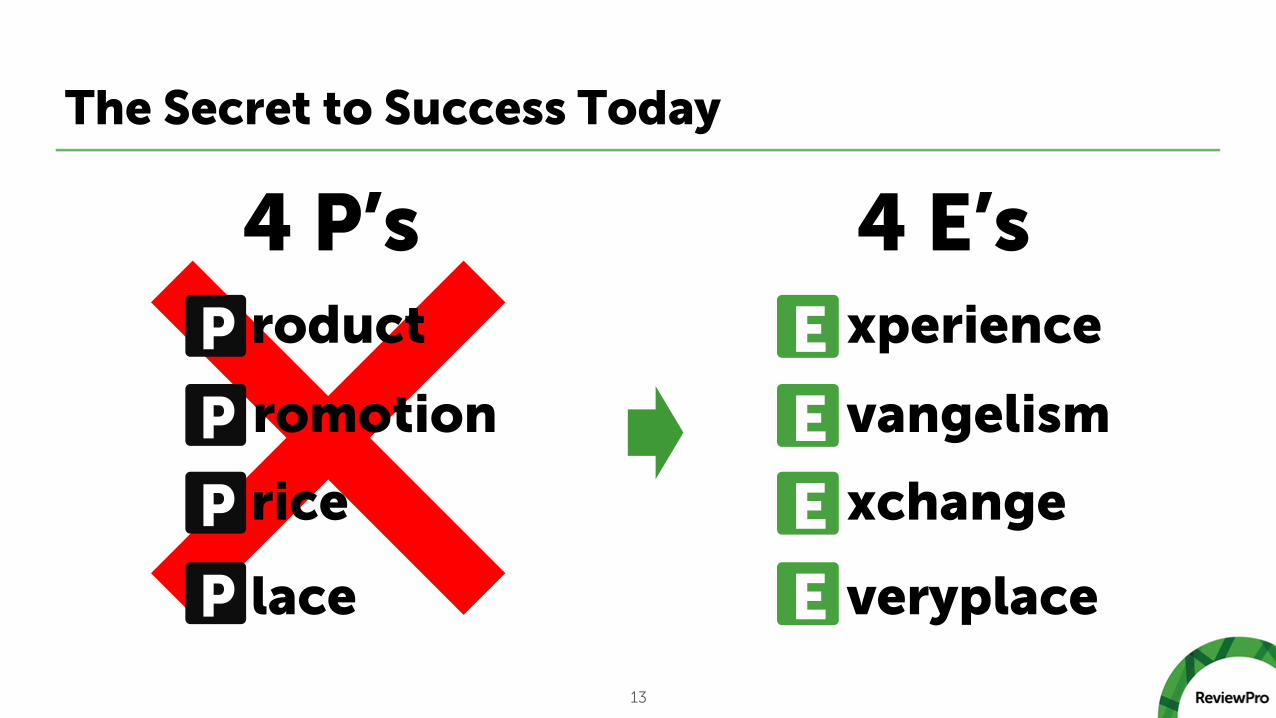
The Secret to Success Today
P roduct
P romotion
P rice
P lace
4 P’s E xperience
E vangelism
E xchange
E veryplace
4 E’s
13
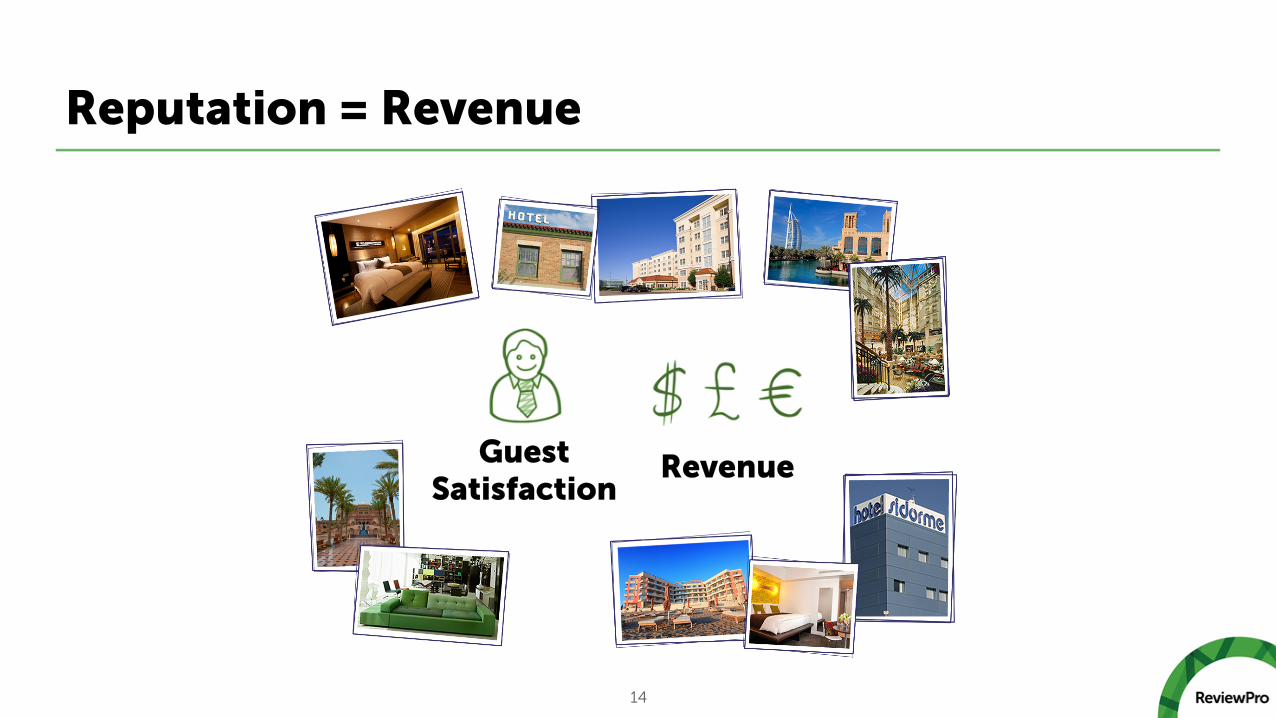
Reputation = Revenue
Guest Satisfaction
Revenue
14
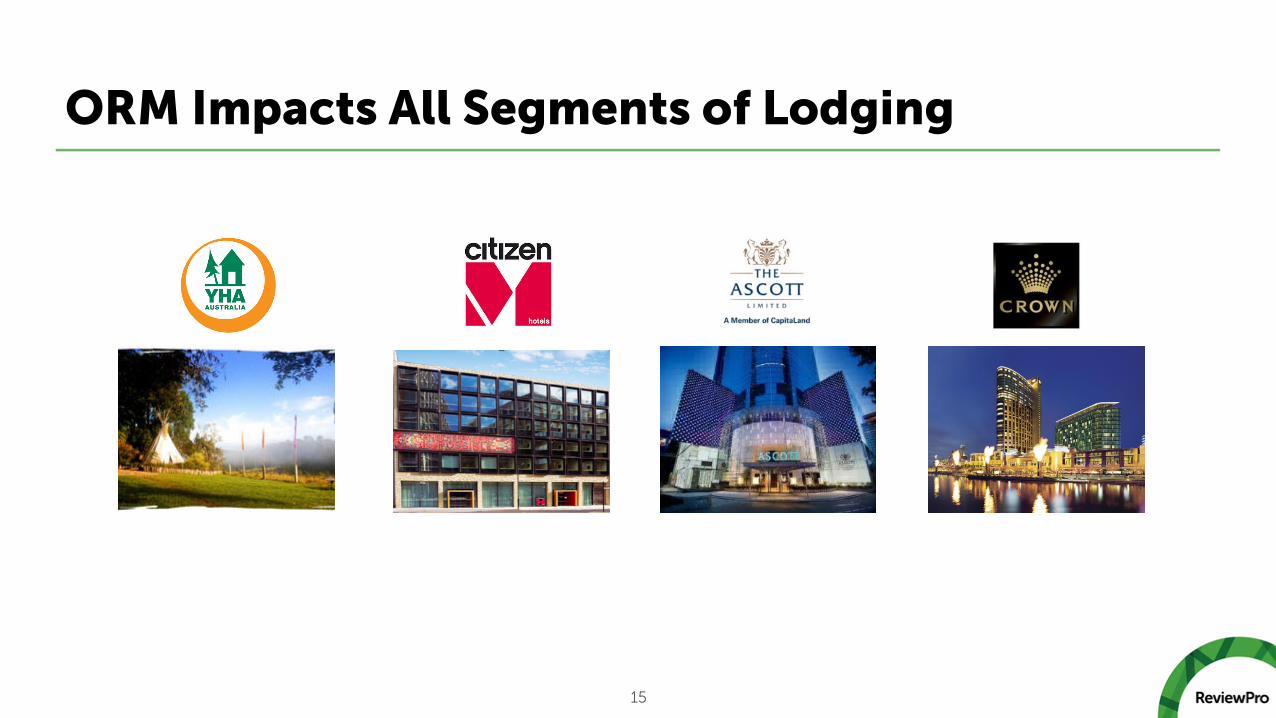
ORM Impacts All Segments of Lodging
15

Impact of Guest Intelligence
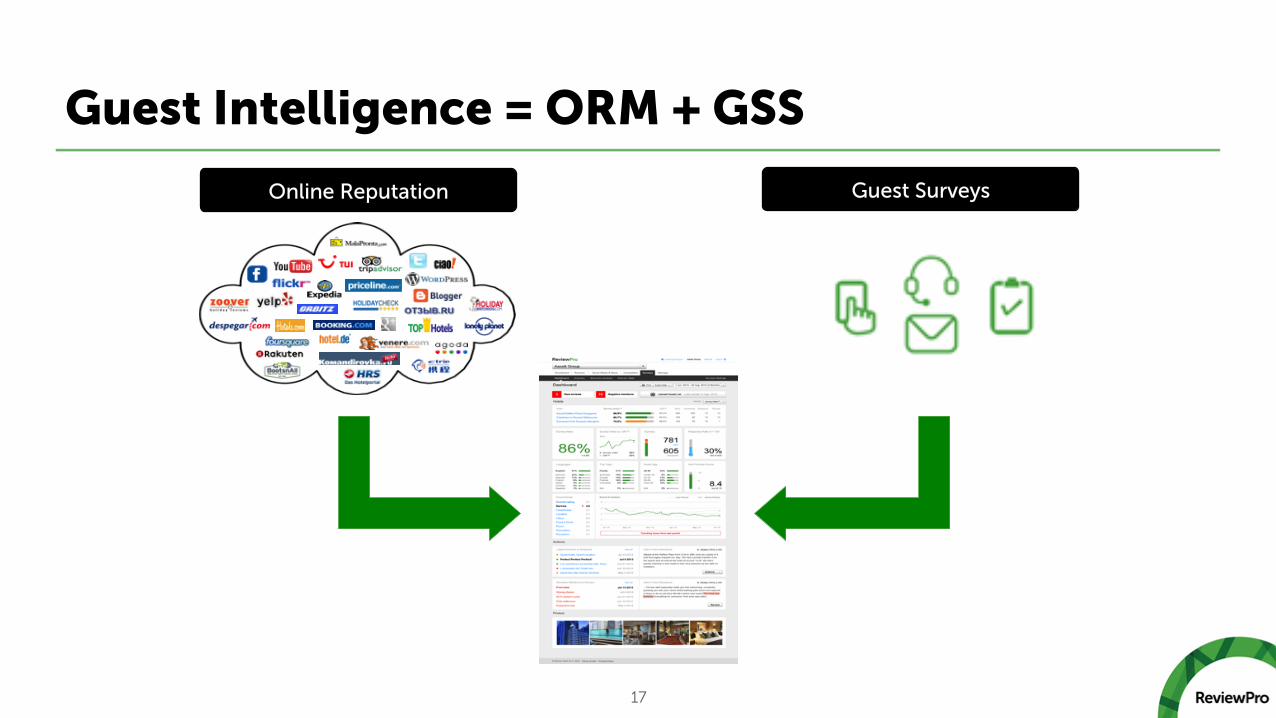
Guest Intelligence = ORM + GSS
17
Online Reputation Guest Surveys
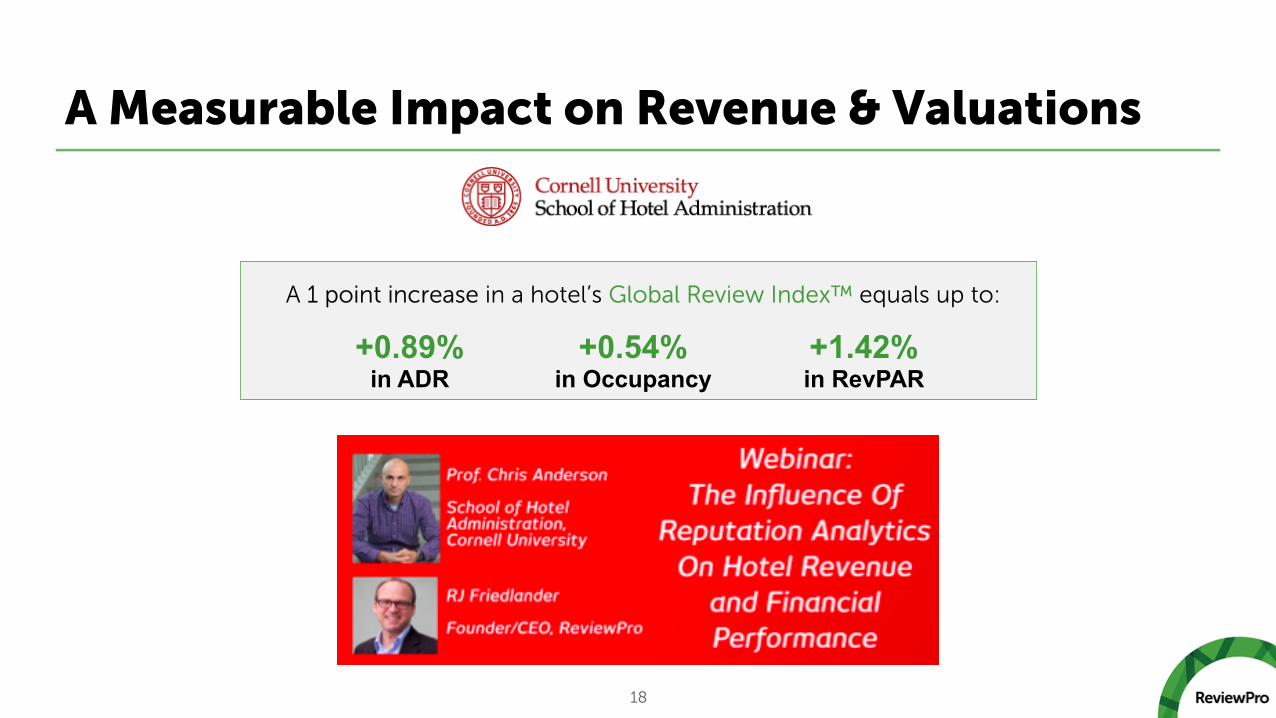
A Measurable Impact on Revenue & Valuations
18
A 1 point increase in a hotel’s Global Review Index™ equals up to:
+0.89% in ADR
+0.54% in Occupancy
+1.42% in RevPAR
Client Success Story
• Jurys Inn, located in the UK & Ireland, have 31 hotels and have implemented our Guest Intelligence pla=orm (ORM & GSS) across their enDre estate.
• Since acDvaDng the TripAdvisor Review CollecDon Program through ReviewPro, they have significantly increased review volume for the group on TripAdvisor.
• The group improved their average TripAdvisor ranking and 27 hotels have increased from a 3.5-‐star raDng to a 4-‐star raDng or above.
19
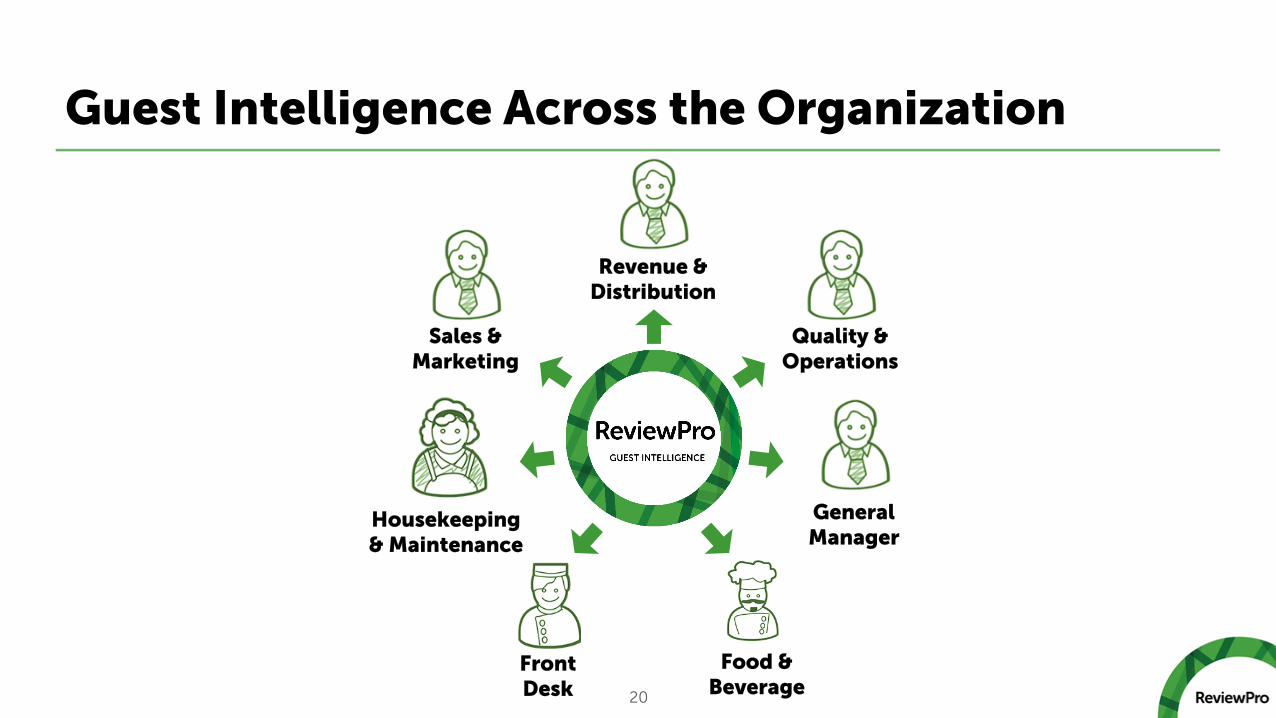
Guest Intelligence Across the Organization
20
Revenue & Distribution
Quality & Operations
General Manager
Food & Beverage
Sales & Marketing
Front Desk
Housekeeping & Maintenance
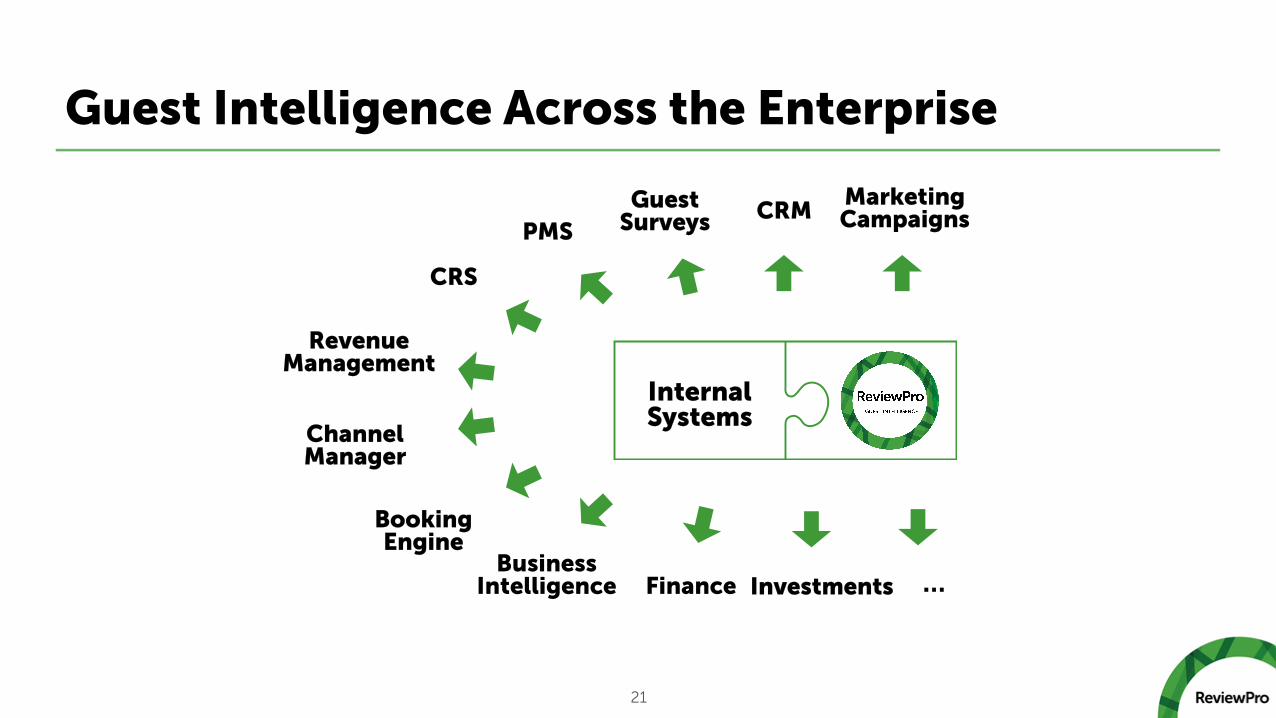
Guest Intelligence Across the Enterprise
21
Finance …
PMS
CRS
Revenue Management
Channel Manager
Booking Engine
CRM Guest Surveys
Marketing Campaigns
Investments
Internal Systems
Business Intelligence

Open API & Flexibility
22
Pre-Stay
PMS
Guest Intelligence
During Stay Post-Stay
CRM
REVENUE MANAGEMENT
…

How Clients Leverage Guest Intelligence
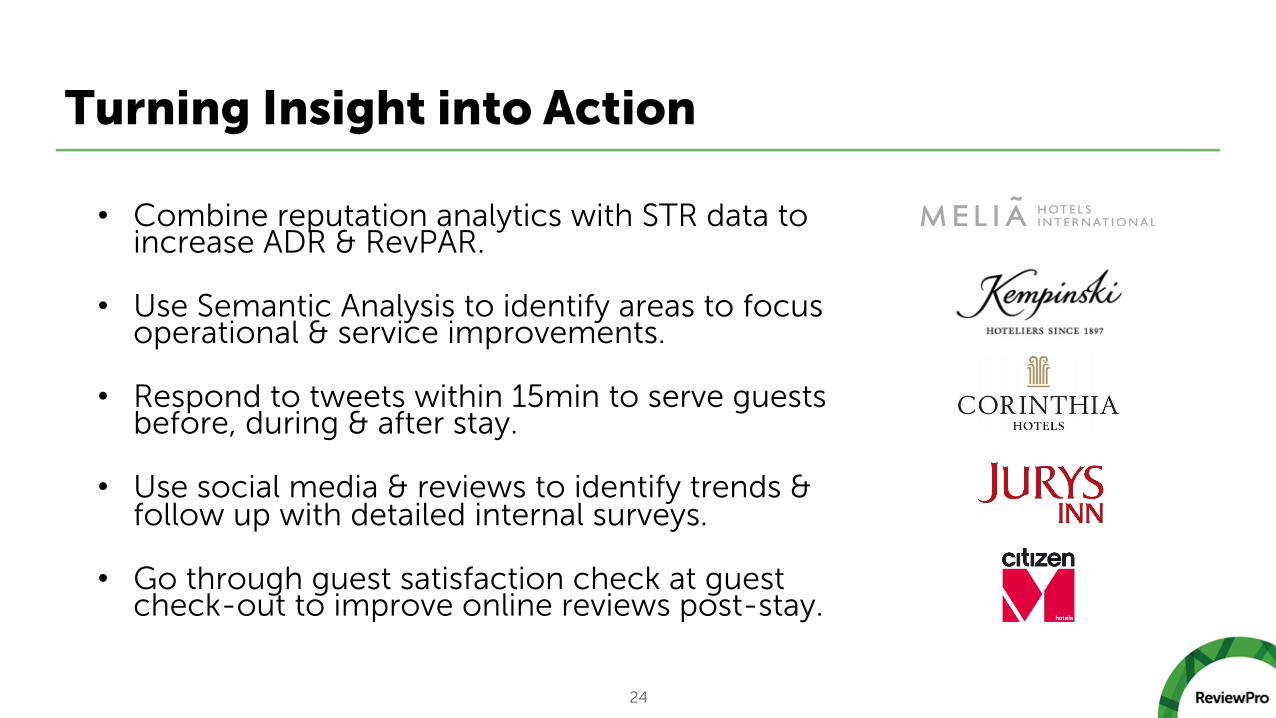
Turning Insight into Action
• Combine reputation analytics with STR data to increase ADR & RevPAR.
• Use Semantic Analysis to identify areas to focus operational & service improvements.
• Respond to tweets within 15min to serve guests before, during & after stay.
• Use social media & reviews to identify trends & follow up with detailed internal surveys.
• Go through guest satisfaction check at guest check-out to improve online reviews post-stay.
24
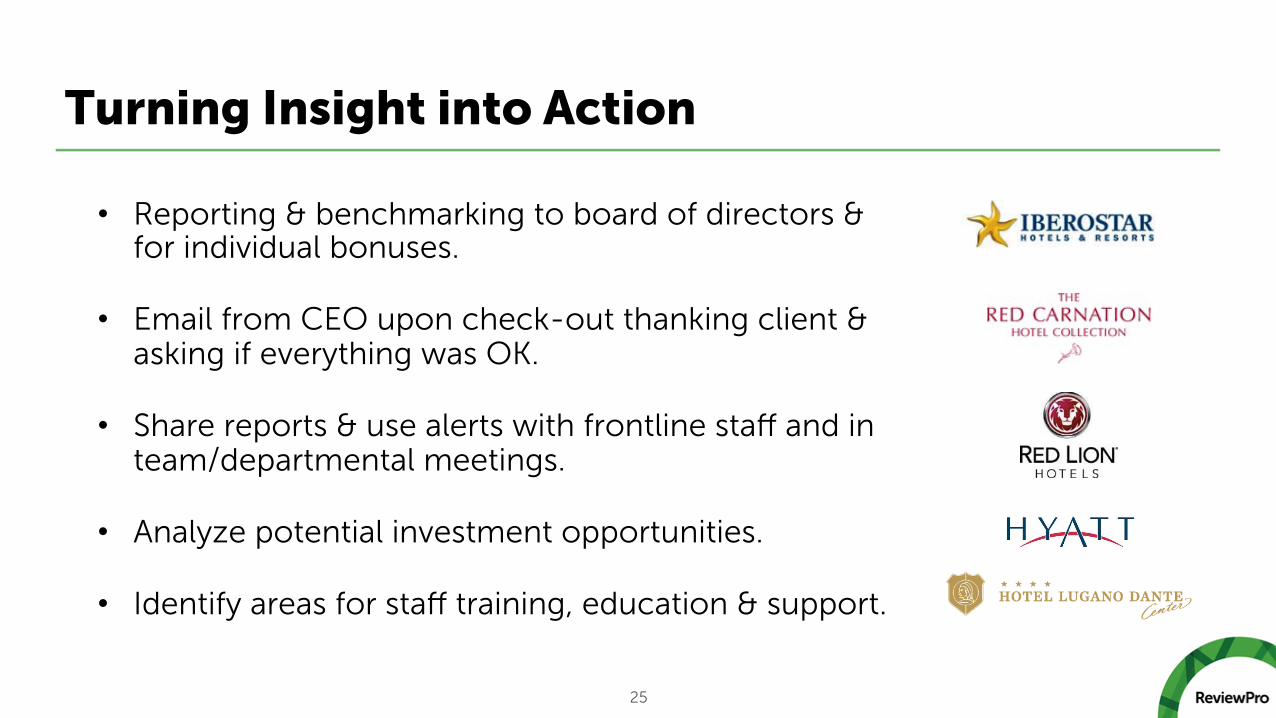
Turning Insight into Action
25
• Reporting & benchmarking to board of directors & for individual bonuses.
• Email from CEO upon check-out thanking client & asking if everything was OK.
• Share reports & use alerts with frontline staff and in team/departmental meetings.
• Analyze potential investment opportunities.
• Identify areas for staff training, education & support.

2015 PwC Online Reputation Report

2015 PwC Online Reputation Report
27
EMEA & India
48 Cities 11,000 hotels
3, 4 & 5 star

28
GRITM Performance by Region/Star Rating
• Hotels in Eastern Europe topped the GRITM score in all categories.
• Large differences between top & lowest performing hotels.
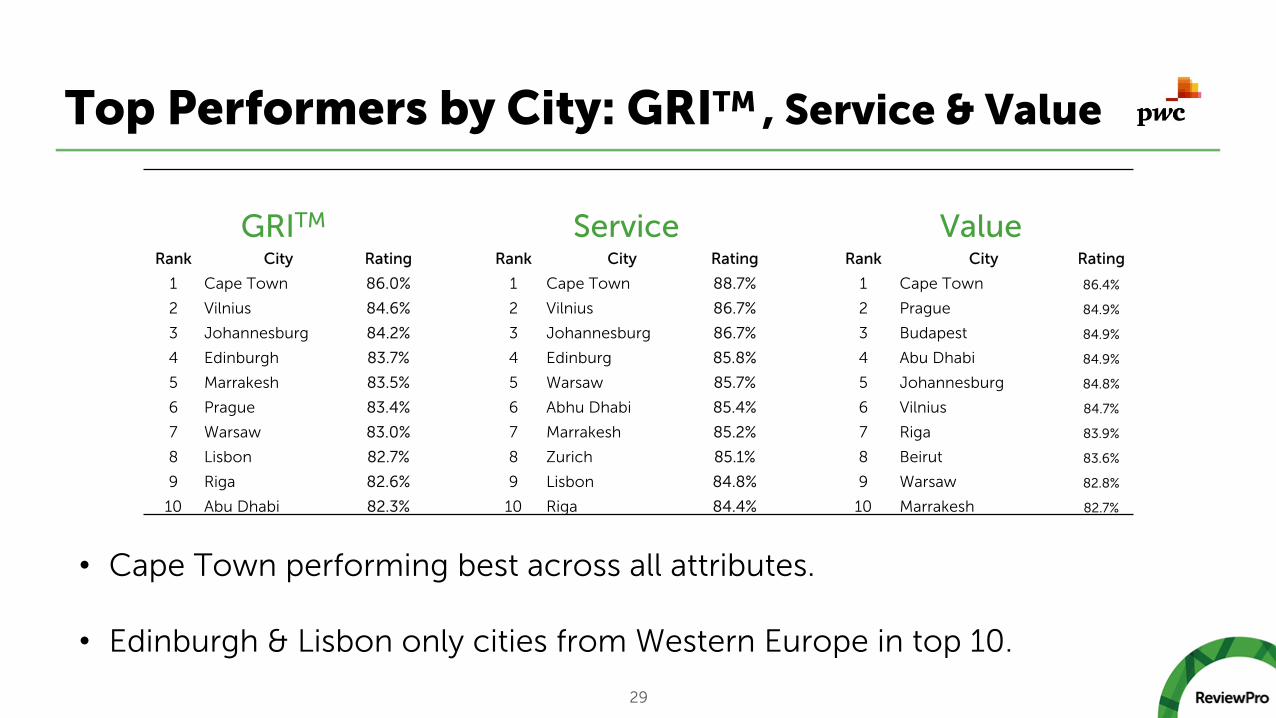
Top Performers by City: GRITM , Service & Value
29
• Cape Town performing best across all attributes.
• Edinburgh & Lisbon only cities from Western Europe in top 10.
GRITM Service Value Rank City Rating Rank City Rating Rank City Rating
1 Cape Town 86.0% 1 Cape Town 88.7% 1 Cape Town 86.4%
2 Vilnius 84.6% 2 Vilnius 86.7% 2 Prague 84.9%
3 Johannesburg 84.2% 3 Johannesburg 86.7% 3 Budapest 84.9%
4 Edinburgh 83.7% 4 Edinburg 85.8% 4 Abu Dhabi 84.9%
5 Marrakesh 83.5% 5 Warsaw 85.7% 5 Johannesburg 84.8%
6 Prague 83.4% 6 Abhu Dhabi 85.4% 6 Vilnius 84.7%
7 Warsaw 83.0% 7 Marrakesh 85.2% 7 Riga 83.9%
8 Lisbon 82.7% 8 Zurich 85.1% 8 Beirut 83.6%
9 Riga 82.6% 9 Lisbon 84.8% 9 Warsaw 82.8%
10 Abu Dhabi 82.3% 10 Riga 84.4% 10 Marrakesh 82.7%

30
Comparable Rankings for Australia
• On average, Victoria hotels rate even higher than in Melbourne.
Rank City Rating
1 Melbourne 83.4%
2 Brisbane 82.8%
4 Sydney 82.0%
5 Adelaide 80.7%
Service Rank City Rating
1 Melbourne 86.8%
2 Brisbane 85.7%
3 Sydney 85.3%
6 Adelaide 84.1%
Value Rank City Rating
1 Melbourne 83.8%
2 Brisbane 83.2%
3 Adelaide 82.3%
4 Sydney 81.8%
GRITM
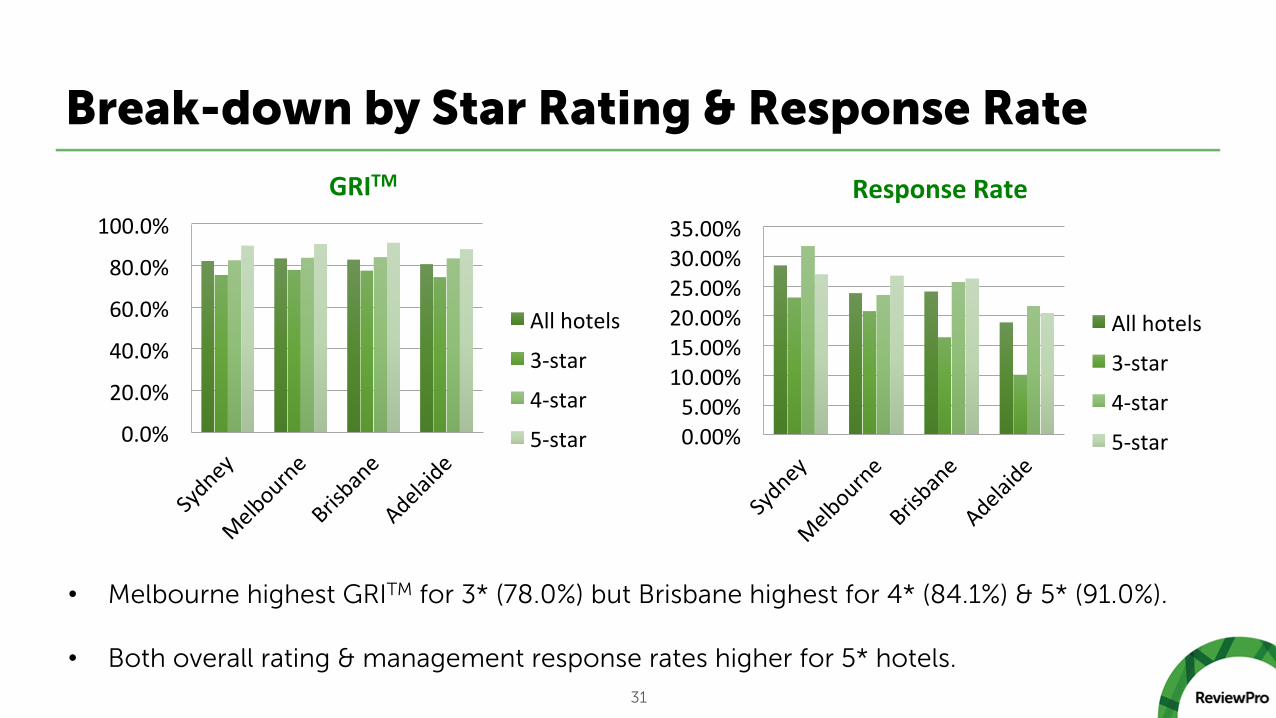
Break-down by Star Rating & Response Rate
31
0.0%
20.0%
40.0%
60.0%
80.0%
100.0%
GRITM
All hotels
3-‐star
4-‐star
5-‐star 0.00% 5.00% 10.00% 15.00% 20.00% 25.00% 30.00% 35.00%
Response Rate
All hotels
3-‐star
4-‐star
5-‐star
• Melbourne highest GRITM for 3* (78.0%) but Brisbane highest for 4* (84.1%) & 5* (91.0%).
• Both overall rating & management response rates higher for 5* hotels.
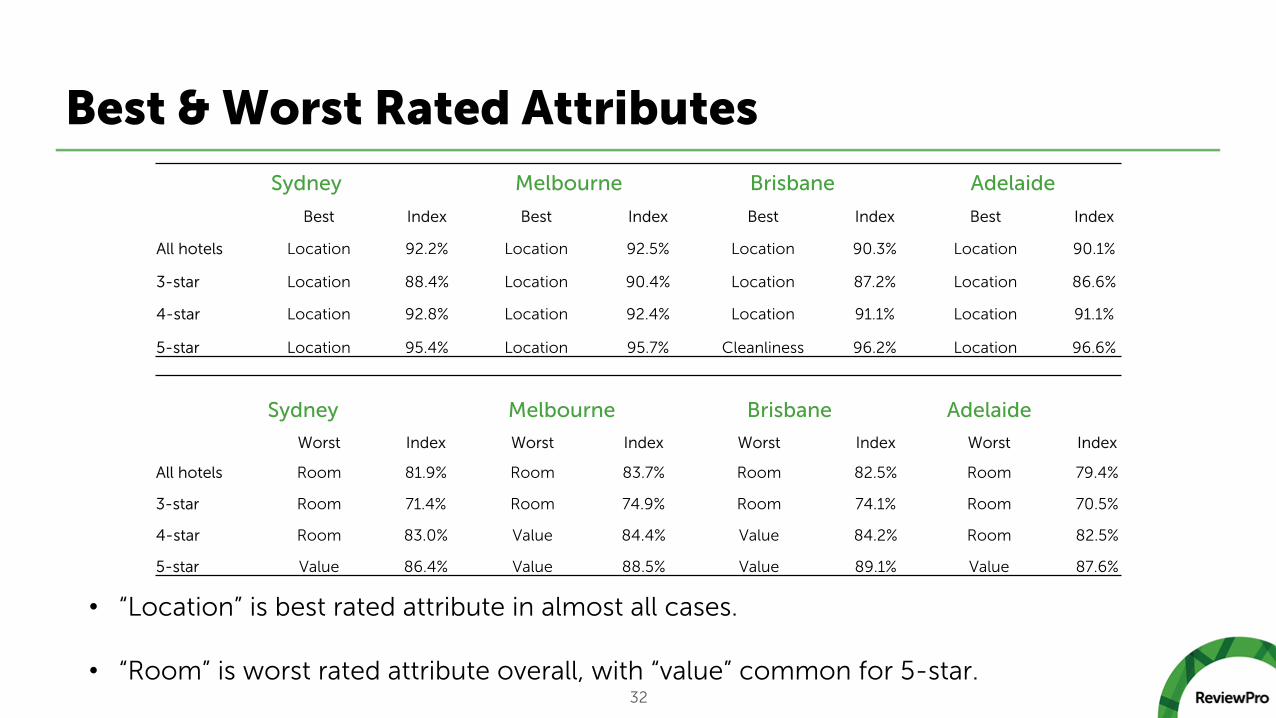
Best & Worst Rated Attributes
32
• “Location” is best rated attribute in almost all cases.
• “Room” is worst rated attribute overall, with “value” common for 5-star.
Sydney Melbourne Brisbane Adelaide
Best Index Best Index Best Index Best Index
All hotels Location 92.2% Location 92.5% Location 90.3% Location 90.1%
3-star Location 88.4% Location 90.4% Location 87.2% Location 86.6%
4-star Location 92.8% Location 92.4% Location 91.1% Location 91.1%
5-star Location 95.4% Location 95.7% Cleanliness 96.2% Location 96.6%
Sydney Melbourne Brisbane Adelaide Worst Index Worst Index Worst Index Worst Index
All hotels Room 81.9% Room 83.7% Room 82.5% Room 79.4%
3-star Room 71.4% Room 74.9% Room 74.1% Room 70.5%
4-star Room 83.0% Value 84.4% Value 84.2% Room 82.5%
5-star Value 86.4% Value 88.5% Value 89.1% Value 87.6%

The Importance of Storytelling
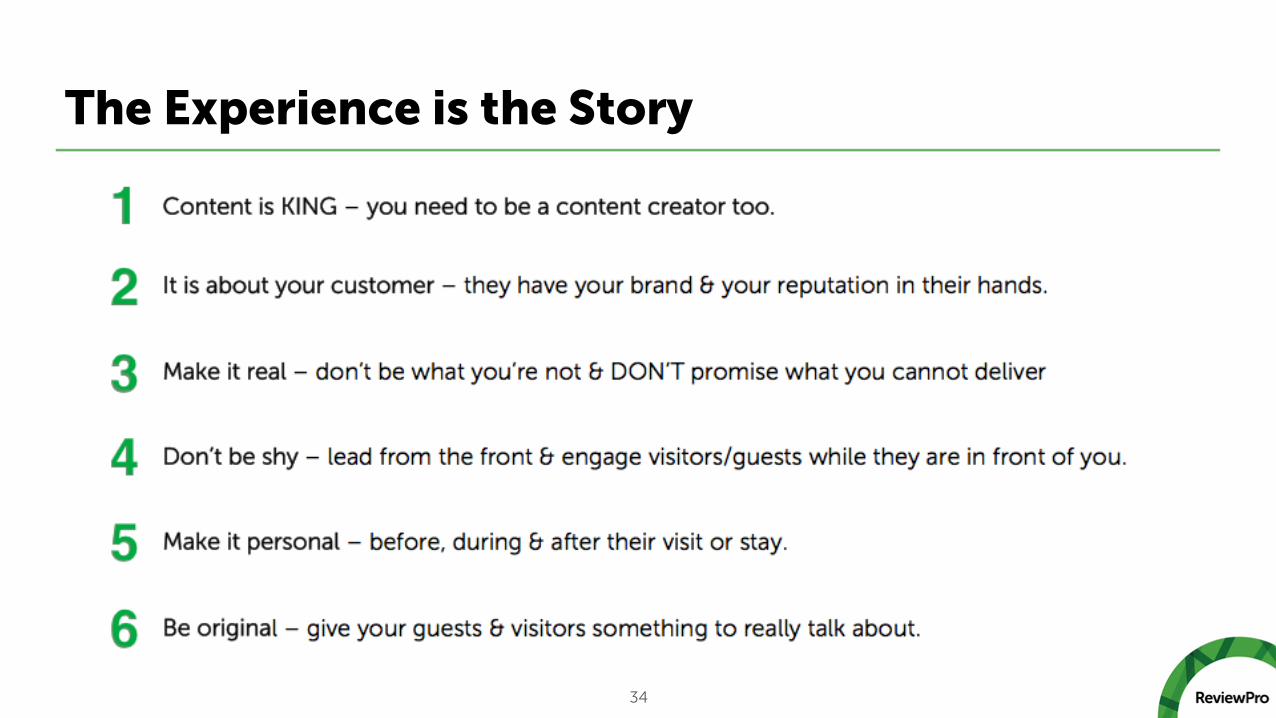
The Experience is the Story
34

Q & A