How Well Do Professionals Forecast Exchange Rates ...inceo/Survey Based Expectations.pdf · How...
36
How Well Do Professionals Forecast Exchange Rates? Evidence from Survey Expectations † Onur Ince * Tanya Molodtsova ** April 28, 2015 Abstract This paper examines rationality and forecasting accuracy of exchange rate survey expectations from two datasets that include 10 major and 40 minor currencies during the recent two decades. Based on the tests of unbiasedness and orthogonality, the forecasts for minor currencies are relatively more rational than the forecasts for major currencies at the short horizon of 3 months, and the forecasts for major currencies are relatively more rational at longer horizons of 12 and 24 months. We evaluate the predictive accuracy and directional accuracy of professional exchange rate forecasts and find that the evidence of forecasting accuracy is stronger at longer than at shorter forecast horizons and for minor currencies than for major currencies. JEL Classifications: C53, F31, F37, F47, G17 † We thank Alan Teck, Tatevik Shekhposyan, Olivier Coibion and participants at the Canadian Economic Association Meetings 2013 and Western Economic Association Meetings 2014 for helpful comments and discussions. * Department of Economics, Appalachian State University, Boone, NC 28608. Tel: +1 (828) 262-4033 Email: [email protected] ** Department of Economics, Appalachian State University, Boone, NC 28608. Tel: +1 (828) 262-2117 Email: [email protected]
Transcript of How Well Do Professionals Forecast Exchange Rates ...inceo/Survey Based Expectations.pdf · How...

How Well Do Professionals Forecast Exchange Rates?
Evidence from Survey Expectations†
Onur Ince*
Tanya Molodtsova**
April 28, 2015
Abstract
This paper examines rationality and forecasting accuracy of exchange rate survey expectations from two datasets that include 10 major and 40 minor currencies during the recent two decades. Based on the tests of unbiasedness and orthogonality, the forecasts for minor currencies are relatively more rational than the forecasts for major currencies at the short horizon of 3 months, and the forecasts for major currencies are relatively more rational at longer horizons of 12 and 24 months. We evaluate the predictive accuracy and directional accuracy of professional exchange rate forecasts and find that the evidence of forecasting accuracy is stronger at longer than at shorter forecast horizons and for minor currencies than for major currencies. JEL Classifications: C53, F31, F37, F47, G17
† We thank Alan Teck, Tatevik Shekhposyan, Olivier Coibion and participants at the Canadian Economic Association Meetings 2013 and Western Economic Association Meetings 2014 for helpful comments and discussions. * Department of Economics, Appalachian State University, Boone, NC 28608. Tel: +1 (828) 262-4033 Email: [email protected] ** Department of Economics, Appalachian State University, Boone, NC 28608. Tel: +1 (828) 262-2117 Email: [email protected]

1. Introduction
Exchange rate expectations play an important role in the literature on exchange rate
determination. Understanding how exchange rate expectations are formed is crucial for academic
analysis of exchange rate behavior, as well as for decision-making of both practitioners and
policymakers. Models of exchange rate determination in open-economy macroeconomics often
rely on assumptions about rationality of exchange rates expectations. It is practically impossible
to test the implications of theoretical exchange rate models, without running into the problem of
joint hypothesis testing in the absence of survey-based expectations. In addition to understanding
exchange rate behavior, the rationality assumption can have serious implications for evaluating
the effectiveness of many government policies. The availability of survey forecasts allows us to
evaluate the rational expectations hypothesis directly.
Although survey-based forecasts of other macroeconomic variables have been studied in
the literature for at least 60 years, research on rationality and accuracy of exchange rate forecasts
goes back only to the late 1980s. Limited data availability on professional exchange rate
forecasts is partially responsible for the short history of research on survey-based exchange rate
forecasts. Following early studies of Dominguez (1986) and Frankel and Froot (1987), many
researchers have studied the nature of exchange rate expectations using survey data. Engel
(1996) and Lewis (1995) summarize the literature on exchange rate expectations assuming
rational expectations. Takaji (1991), Macdonald (2000), and Jongen et al. (2007) summarize the
studies on survey-based exchange rate expectations. Two most commonly examined questions in
the literature on survey-based exchange rate expectations include rationality of the forecasts and
their predictive accuracy. We systematically evaluate these two questions for a sample of 10
major currencies and 40 minor currencies vis-à-vis the U.S. dollar over the last two decades.
Most of the previous studies on exchange rate forecasts, with the exception of Frankel
and Chinn (1993), Chinn and Frankel (1994, 2002), and Frankel and Poonawala (2010), focus
exclusively on major currencies. Conclusions about rationality and predictive accuracy of
exchange rate expectations in the literature on survey-based expectations depend on the sample
size, the set of countries that are considered, and estimation methods. Although the evidence is
mixed, existing studies predominantly find evidence against rationality of expectations and no
evidence of predictability of professional exchange rate forecasts.
1

In this paper, we systematically examine the characteristics of the exchange rate forecasts
for major and minor currencies at 3-, 6-, 12-, and 24-month horizons. We use two most
comprehensive datasets on survey-based expectations, Consensus Economics and FX4Casts. The
former is previously known as The Financial Times Currency Forecaster, and the latter as
Currency Forecasters’ Digest. These datasets contain exchange rate forecasts of 37 and 46
currencies vis-à-vis the U.S. dollar, respectively, with the sample period going back to January
1990 and ending in December 2012. Frankel and Poonawala (2010) consider exchange rate
forecasts for 35 currencies from Currency Forecasters’ Digest, including 15 minor currencies.
We expand the list of minor currencies from 15 to 40, combining both sources of data. The use
of the survey datasets that cover a large number of minor currencies, in addition to 10 major
currencies, over a broad range of forecast horizons during the last two decades allows us to study
systematic empirical regularities that couldn’t be observed so far.
We test the rationality of exchange rate expectations at 3-, 6-, 12-, and 24-month forecast
horizons using the unbiasedness and orthogonality tests. Even when unbiasedness and/or
orthogonality are rejected, exchange rate expectations can be rational under certain conditions.
These conditions include, for example, time-varying exchange rate process, peso problem, non-
linear forecasting model, or asymmetric loss function. In order to examine predictive accuracy of
the forecasts based on the mean squared prediction error (MSPE) comparison, we use Diebold
and Mariano (1995) and West (1996) tests (henceforth, DMW tests). for equal predictability of
survey forecasts relative to a random walk without drift1. In addition to MSPE-based tests, we
use Pesaran and Timmerman (1992) test for nonparametric dependence between the forecasts
and random walk benchmark. The advantage of using the direction of change tests of predictive
accuracy is that they do not impose any restrictions on the functional form of the forecasting
model and allow for learning behavior of exchange rate forecasters.
We find that the evidence of the forecast rationality and accuracy increases with the
horizon. The forecasts for minor currencies tend to be relatively more rational at the short
horizons of 3 and 6 months, while the forecasts for major currencies are relatively more rational
at the longer horizons of 12 and 24 months. The evidence of predictive accuracy is stronger for
minor than for major currencies, and it improves with the forecast horizon for both groups of
1 Since Meese and Rogoff (1983), evaluating exchange rate forecasts relative to the random walk benchmark has become a standard in the literature. We choose a more conservative benchmark of a random walk without drift that is more difficult to beat to reduce the possibility of finding spurious evidence of predictability.
2
countries. While the standard DMW statistics are unable to detect any evidence of predictive
accuracy at shorter forecast horizons for major currencies, the nonparametric tests indicate the
presence of significant dependence between actual and forecasted exchange rate depreciation.
This might suggest that the nature of the relationship is nonlinear, asymmetric, time-varying, or
all of the above.
2. Survey Data
We use the data on professional exchange rate forecasts from two data sources:
Consensus Economics and FX4casts, previously known as The Financial Times Currency
Forecaster and Currency Forecasters’ Digest, respectively. Both datasets contain exchange rate
forecasts for the same 9 major countries (Australia, Canada, Denmark, Japan, New Zealand,
Norway, Sweden, Switzerland, and the U.K.) plus the Euro Area during approximately the same
period between January 1990 and December 2012. In addition to 10 major currencies, Consensus
Economics contains forecasts for 27 minor currencies, and FX4casts reports forecasts for 37
minor currencies. Both data sets combined contain exchange rate forecasts for 40 minor
currencies.
We have excluded some countries with tightly fixed exchange rates. Following Frankel
and Poonawala (2010), we didn’t exclude currencies that have relatively stable exchange rates or
operate under capital controls. Although some of the included currencies operate under de jure
stabilizing arrangement relative to one currency or a basket of currencies, a sufficient amount of
movement is allowed for all of the included currencies. Appendix A and B lists each country’s
de jure exchange rate regime according to the recent IMF classification obtained from the
International Monetary Fund Annual Report on Exchange Arrangements and Exchange
Restrictions 2013. Recent research has shown that de facto exchange rate regime can deviate
from the de facto classification.
The forecasts reported each month are the geometric mean of the respondents' forecasts,
which minimizes the effect of extreme forecasts.2 Unfortunately, individual forecasts of each
respondent are not available. Thus, we couldn’t explore heterogeneity and other characteristics of
individual forecasters.
2 See Timmermann (2005) for an overview of the advantages of combining individual forecasts.
3

Consensus Economics dataset contains 3-, 12-, and 24-month ahead forecasts for 10
major currencies and 27 minor currencies vis-à-vis the U.S. dollar.3 Foreign Exchange
Consensus forecasts are produced as a result of a monthly survey of over 250 professional
currency forecasters.4 The comprehensive country coverage, which goes back to January 1990
for many major and minor countries, makes this dataset appropriate for our purposes. The
number of responders (typically around 30) varies across countries and over time periods. They
include investment banks, large non-financial enterprises, consulting firms, and university
economists. The survey is usually conducted on the second Monday of every month. In addition
to the forecasts of the level of the exchange rate 3-, 12- and 24-month ahead, Consensus
Economics reports the level of the spot exchange rate on the date of the forecast, or a nowcast.
Although Consensus Economics dataset provides a comprehensive coverage of major and
minor currencies and has not been extensively studied in the literature, the respondents include
business firms and academicians, who might not have strong incentives to provide accurate
forecasts. The second dataset that we use mitigates this problem by surveying exclusively
professional forecasters.
In addition to Consensus Economics dataset, we use 3-, 6-, and 12-month ahead forecasts
of 10 major currencies and 37 minor currencies vis-à-vis the U.S. dollar from FX4casts,
previously known as The Financial Times Currency Forecaster and Currency Forecasters’
Digest.5 The data for all major currencies, except New Zealand and the U.K. starts in January
1990, and the forecasts 37 minor currencies start in the early 2000’s. FX4casts puts an emphasis
on reliability of their forecasts by surveying 45 large financial institutions.6 The survey is usually
conducted on the last Friday of the month by email (or fax), with the responses returned during
Friday and the following Monday and Tuesday. In addition to the forecasts of the level of the
exchange rate 3-, 6- and 12-month ahead, FX4casts reports the level of the spot exchange rate on
the date of the forecast for each currency.
3 The list of major and minor currencies in Consensus Economics dataset is provided in Appendix A. 4 We work with mean forecasts for each country, because Consensus Economics forecasts for individual professional forecasters are not available. Total number of survey respondents and the number of respondents are taken from Consensus Economics website: http://www.consensuseconomics.com/forex_major.htm. 5 The list of major and minor currencies in FX4casts dataset is provided in Appendix B. 6 Total number of survey respondents and the number of respondents are taken from FX4casts website: http://www.FX4casts.com
4
3. Summary Statistics
We start by examining the summary statistics for the actual and expected exchange rate
depreciation and forecast errors in both datasets. Tables 1A and 1B provide summary statistics
for actual and expected exchange rate depreciation in Consensus Economics dataset. Table 1C
reports the mean and standard deviation of the forecast error in Consensus Economics dataset. In
all tables, Panel A reports the statistics for 10 major currencies, and Panel B provides the results
for 27 minor currencies. Three main patterns are apparent from examining the data.
First, the absolute value of the mean expected and actual depreciation in Tables 1A and
1B increases with the forecast horizon. Thus, forecasters do not believe that there is the exchange
rates in most countries follow a mean reverting process. This empirical finding is consistent with
the results reported by Dominguez (1986), Frankel and Froot (1987), Macdonald and Torrance
(1990). Both major and minor currencies exhibit increasing mean expected depreciation with the
forecast horizon. However, the number of exceptions from this regularity is larger for major
currencies than for minor currencies. The pattern is violated for Denmark, Japan and Switzerland
at the 12-month horizon, and for New Zealand and the U.K. at the 24 month horizon. Among the
minor currencies, only the Philippines show a declining mean expected depreciation at the 12-
month horizon. Thus, there is more evidence in favor of mean-reverting forecasts for major
currencies than for minor currencies. Comparing expected depreciation and actual depreciation,
the same pattern of increasing mean actual depreciation holds for all major currencies, except
Sweden and the U.K. at the 24 month horizon, and for all minor currencies except Bolivia and
Uruguay at the 24-month horizon and Paraguay at the 12-month horizon.
Second, the standard deviation of expected and actual depreciation in Tables 1A and 1B
increase with the horizon as well. Third, both the mean and standard deviations of the forecast
errors reported in Table 1C increase with the forecast horizon. This empirical result provides
evidence that exchange rate forecasting performance deteriorates as the forecast horizon expands
from 3 to 24 months ahead. The finding is in accord with the results in Dominguez (1986) and
Frankel and Froot (1987) for pooled forecasts of major currencies. It is worth noting that the
mean forecast error declines with the horizon for 2 out of 10 major currencies, and for 8 out of
27 minor currencies.
In order to verify that these patterns are not specific to Consensus Economics dataset, we
examine the summary statistics for a broader set of countries in FX4casts data. This dataset has
5

been used before by Frankel and Chinn (1993), Chinn and Frankel (1994, 2002), and Frankel and
Poonawala (2009) to study a smaller group of currencies over a different sample. Due to data
limitations many of the existing studies rely on pooled forecasts. We estimate individual
equations for each currency in the sample, as the sample is long enough. Since exchange rate
forecasts in this dataset are collected from a group of 45 financial institutions that specialize in
exchange rate forecasting, they can arguably better represent market expectations.
Tables 2A and 2B provide summary statistics for actual and expected exchange rate
depreciation in FX4casts dataset. Table 1C reports the mean and standard deviation of the
forecast error. In all three tables, Panel A reports the statistics for 10 major currencies, and Panel
B provides the results for 36 minor currencies. The same three main patterns are evident from
Tables 2A-2C. There are fewer countries that exhibit a mean reverting behavior in expected
exchange rate depreciation, and relatively more major countries with decreasing mean forecast
error at longer horizon of 6 or 12 month.
4. Rationality of Survey-Based Expectations
The availability of survey-based expectations allows us to test the rationality of exchange
rate expectations explicitly. Since Muth’s (1961) seminal paper, many definitions and tests of
rationality have been proposed. We apply two conventional tests of rationality of survey-based
expectations: tests of unbiasedness and orthogonality of expectations. Unbiasedness tests involve
testing whether the expected exchange rate is an unbiased predictor of the future spot rate.
Orthogonality condition assumes that professional forecasters fully incorporate all information
that is available at the time when the forecast is made. Thus, the forecast error should be
orthogonal to the information in the information set available to forecasters.
4.1 Unbiasedness of Expectations
Unbiasedness of exchange rate expectations can be tested by regressing actual
depreciation on expected depreciation:
htte
thttht ussss +++ +−+=− )( ,βα (1)
where ts is the log of the U.S. dollar nominal exchange rate determined as the domestic price of
foreign currency, so that an increase in ts is a depreciation of the dollar, ethts ,+ is the survey-
based expectation of the spot exchange rate at period t+h made at period t, and htu + is a white
6

noise error term. Testing for unbiasedness of exchange rate expectation involves testing a joint
null hypothesis that 0=α and 1=β in Equation (1). We estimate Equation (1) using OLS for
h=3, 12, and 24 month with Consensus Economics data and for h=3, 6, and 12 months with
FX4casts data.
Table 3 reports the results of estimating Equation (1) with Consensus Economics data for
3-, 12-, and 24-month ahead forecasts. The statistical significance of the estimated coefficients is
determined based on Newey-West standard errors. For each forecast horizon, we report the p-
values for the χ2 statistics for the joint null that 0=α and 1=β . At the 3-month horizon, there is
strong evidence against the unbiasedness hypothesis. The joint null hypothesis of unbiasedness is
rejected for all 10 major currencies, and for 23 out of 27 minor currencies. As the forecast
horizon increases, the bias in the forecasts for major currencies decreases dramatically. At the
12-month horizon, the joint null hypothesis of unbiasedness is rejected for 3 out of 10 major
currencies, and for 14 out of 27 minor currencies. At the 24-month horizon, the joint null
hypothesis of unbiasedness is rejected for all major currencies except the Japanese yen, and for
16 out of 27 minor currencies. Thus, there is more evidence of rationality at the 12- and 24-
month forecast horizon than at the 3-month horizon. The forecasts are relatively more biased for
major currencies than for minor currencies at the short horizon of 3 months, and relatively more
rational for major currencies than for minor currencies at longer horizons of 12 and 24 months.
Table 4 reports the results of estimating Equation (1) with FX4casts data for 3-, 6-, and
12-month ahead forecasts. As with Consensus Economics data, we find strong evidence against
the unbiasedness hypothesis at the 3-month ahead horizon, with the same number of rejections
for major and minor currencies. It is worth noting, however, that although the number of
rejections of the unbiasedness hypothesis is the same, FX4casts dataset contains 36 minor
currencies instead of 27 currencies in Consensus Economics. As the forecast horizon increases to
12 months, the bias in the forecasts decreases by half for major currencies and stays virtually the
same for minor currencies. At the 12-month horizon, the joint null hypothesis of unbiasedness is
rejected for 5 out of 10 major currencies, and for 23 out of 36 minor currencies. Thus, there is
more evidence of rationality at the 12-month forecast horizon than at the 3-month forecast
horizon. The forecasts are relatively more biased for major currencies than for minor currencies
at the short horizon of 3 months, and relatively more rational for major currencies than for minor
7

currencies at the longer horizon of 12 months. There is virtually no difference between the
performance of the forecasts at the 3- and 6-month horizon.
4.2 Orthogonality of Expectations
Orthogonality is another important condition of rationality of exchange rate expectations.
If professional forecasters fully incorporate information that is available to them at the time they
make forecasts, any variable that belongs to their information set should be orthogonal to the
forecast error. The first orthogonality test that we use involves regressing the forecast error on its
lagged value:
hte
httte
ththt ussss +−++ +−+=− )( ,, βα (2)
If the forecast error is orthogonal to past forecast errors, then 0=α and 0=β in equation (2).
The second test for orthogonality involves regressing the forecast error on lagged actual
exchange rate depreciation:
httte
ththt ussss +−++ +−+=− )( 1, βα (3)
If the forecast error is orthogonal to past exchange rate change, then 0=α and 0=β in equation
(3).
Table 5 reports the results of estimating Equation (2) with Consensus Economics data for
3-, 12-, and 24-month ahead forecasts. For each forecast horizon, the table reports the p-values
for the χ2 statistics for the joint test that 0=α and 0=β . At the 3-month horizon, we find
evidence against orthogonality for 5 out of 10 major currencies, and for 17 out of 27 minor
currencies. As the forecast horizon increases, the efficiency of the forecasts initially improves at
the 12-month horizon for both major and minor currencies and then deteriorates back to the same
level. At the 12-month horizon, the joint null hypothesis of orthogonality is rejected for 2 out of
10 major currencies, and for 11 out of 27 minor currencies. At the 24-month horizon, the joint
null hypothesis of orthogonality is rejected for 5 out of 10 major currencies, and for 16 out of 27
minor currencies. Thus, there is more evidence of rationality at the 12-month forecast horizon
than at the 3- or 24-month horizons. The forecasts are relatively less efficient for minor
currencies than for major currencies.
Table 6 reports the results of estimating equation (2) with FX4casts data for 3-, 6, and
12-month ahead forecasts. The findings are different than those obtained with Consensus
Economics data. At the 3-month horizon, we find evidence against orthogonality for 5 out of 10
8

major currencies, and for only 4 out of 36 minor currencies. Thus, minor currencies forecasts are
relatively more rational at the short forecast horizon. As the forecast horizon increases to 6
months, the efficiency of the forecasts improves dramatically for major currencies to 1 rejection
out of 10 and deteriorates for minor currencies to 17 rejections out of 36. At the 12-month
horizon, the joint null hypothesis of orthogonality is rejected for 2 out of 10 major currencies,
and for 21 out of 36 minor currencies. As with the tests of unbiasedness, the forecasts for minor
currencies are relatively more rational at the short horizon of 3 months, while the forecasts for
major currencies are relatively more rational at the longer horizons of 6 and 12 months. There is
virtually no difference between the performance of the forecasts at the 3- and 6-month horizon.
Finally, Table 7 reports the results of estimating equation (3) with Consensus Economics
data for 3-, 12-, and 24-month ahead forecasts. At the 3-month horizon, we find evidence against
orthogonality for 8 out of 10 major currencies, and for 21 out of 27 minor currencies. As the
forecast horizon increases, the efficiency of the forecasts initially improves. At the 12- and 24-
month horizon, the joint null hypothesis of orthogonality is rejected for 4 out of 10 major
currencies, and for 13 and 15 out of 27 minor currencies. Thus, there is more evidence of
rationality at the longer forecast horizon than at the short horizon.
Table 8 reports the results of estimating equation (3) with FX4casts data for 3-, 6, and 12-
month ahead forecasts. At the 3-month horizon, we find evidence against orthogonality for 3 out
of 10 major currencies, and for 6 out of 36 minor currencies. As the forecast horizon increases to
6 months, the efficiency of the forecasts improves to 1 rejection out of 10 for major currencies
and to only 3 rejections out of 36 for minor currencies. At the 12-month horizon, however, the
joint null hypothesis of orthogonality is rejected for 2 out of 10 major currencies, and for 15 out
of 36 minor currencies. As with the tests of unbiasedness, the forecasts for minor currencies are
relatively more rational at the short horizons of 3 and 6 months, while the forecasts for major
currencies are relatively more rational at the longer horizons of 12 months. There is no difference
between the performance of the major currency forecasts at the 6- and 12-month horizons.
5. Predictive Accuracy of Survey-Based Expectations
5.1 Tests Based on the MSPE Comparison
To compare the out-of-sample forecasting ability of the survey forecasts, this study
focuses on the minimum mean-squared prediction error (MSPE) approach, which became
9
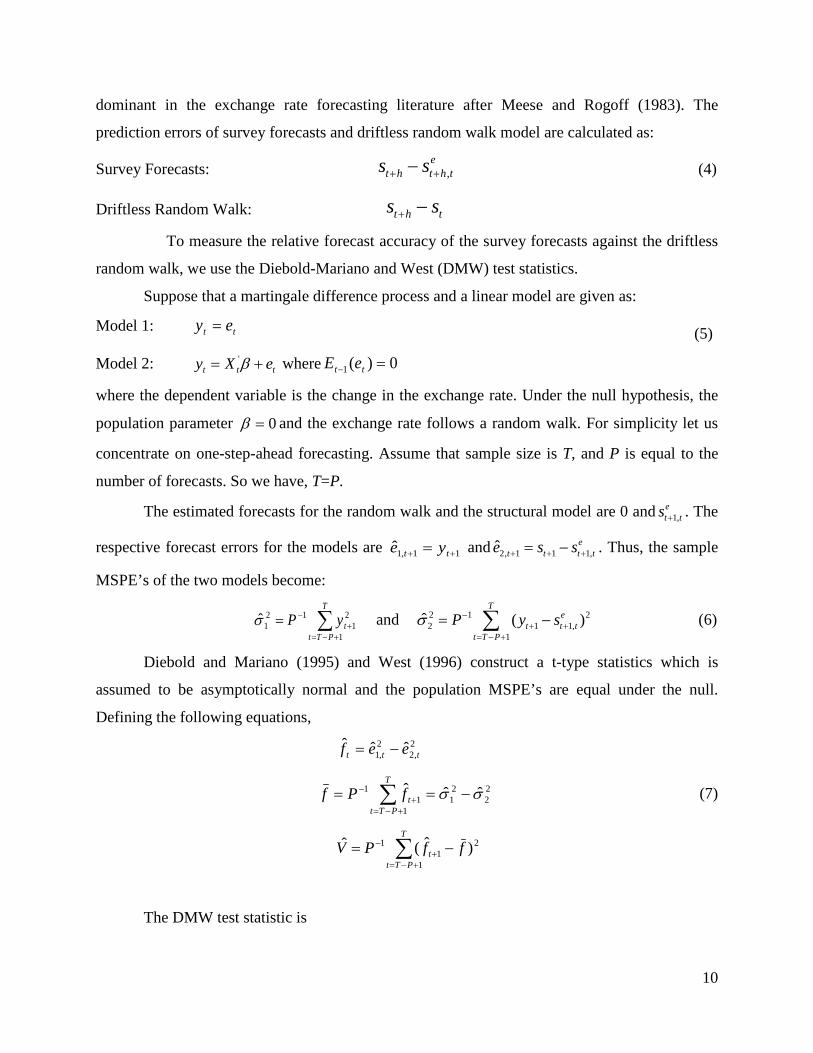
dominant in the exchange rate forecasting literature after Meese and Rogoff (1983). The
prediction errors of survey forecasts and driftless random walk model are calculated as:
Survey Forecasts: ,e
t h t h ts s+ +− (4)
Driftless Random Walk: t h ts s+ −
To measure the relative forecast accuracy of the survey forecasts against the driftless
random walk, we use the Diebold-Mariano and West (DMW) test statistics.
Suppose that a martingale difference process and a linear model are given as:
Model 1: tt ey = (5)
Model 2: ttt eXy += β' where 0)(1 =− tt eE
where the dependent variable is the change in the exchange rate. Under the null hypothesis, the
population parameter 0=β and the exchange rate follows a random walk. For simplicity let us
concentrate on one-step-ahead forecasting. Assume that sample size is T, and P is equal to the
number of forecasts. So we have, T=P.
The estimated forecasts for the random walk and the structural model are 0 and 1,et ts + . The
respective forecast errors for the models are 11,1 ++ = tt ye and 2, 1 1 1,ˆ et t t te s s+ + += − . Thus, the sample
MSPE’s of the two models become:
∑
+−=+
−=T
PTttyP
1
21
121σ and 2 1 2
2 1 1,1
ˆ ( )T
et t t
t T PP y sσ −
+ += − +
= −∑ (6)
Diebold and Mariano (1995) and West (1996) construct a t-type statistics which is
assumed to be asymptotically normal and the population MSPE’s are equal under the null.
Defining the following equations,
2,2
2,1 ˆˆˆ
ttt eef −=
∑+−=
+− −==
T
PTttfPf
1
22
211
1 ˆˆˆ σσ (7)
∑+−=
+− −=
T
PTtt ffPV
1
21
1 )ˆ(ˆ
The DMW test statistic is
10

VP
fDMWˆ1−
= (8)
Table 9 reports the ratio of the MSPE’s of survey forecasts to that of the driftless random
walk model and DMW statistics with Consensus Economics data for 3-, 12-, and 24-month ahead
forecasts. At the 3-month horizon, survey forecasts cannot outperform the random walk model.
The MSPE’s for 5 minor currencies are lower than MSPE’s of the driftless random walk,
however the difference is not significant. As the forecast horizon increases, predictive ability of
the survey forecasts improves. At the 12-month horizon, predictability is found for 1 major
currency, and for 8 minor currencies. At the 24-month horizon, survey forecasts outperform the
driftless random walk for 2 out of 10 major currencies, and for 12 out of 27 minor currencies.
Thus, there is more evidence of predictability at the 24-month forecast horizon than at the 3- or
12-month horizons.
Table 10 reports the out-of-sample predictability results with FX4casts data for 3-, 6, and
12-month ahead forecasts. At the 3-month horizon, survey forecasts outperform the driftless
random walk for 6 out of 36 minor currencies. As the forecast horizon increases to 6 months, the
evidence of predictability is found for 5 minor currencies. At the 12-month horizon, however, the
evidence of predictability improves to 13 out of 36 minor currencies.
The results in Tables 9 and 10 show that forecasting ability of the survey forecasts
increases as forecast horizon increases. Also, survey forecasts for minor currencies seem more
accurate compared to major currencies.
5.2 Directional Accuracy
To evaluate the directional accuracy of the survey forecasts, we rely on the non-
parametric test developed by Pesaran and Timmermann (1992) that focuses on the correct
prediction of the direction of change in the variable under consideration. Pesaran and
Timmermann test (PT test, henceforth) is based on the proportion of times that the direction of
change in the exchange rate is correctly forecasted.
Let y be a predictor of y , Pr( 0)y tp y= > , ˆ ˆPr( 0)y tp y= > , and p is the proportion of
times that the sign of y is correctly forecasted. The PT test statistic, nS is
*1/ 2
*
ˆ ˆˆ ˆ ˆ ˆ( ( ) ( ))n
p pSv p v p
−=
− (9)
11

where ˆ ˆ*ˆ (1 )(1 )y y y yp p p p p= + − − , * *1ˆ ˆ ˆ ˆ( ) (1 )v p p pn
= −
2 2ˆ ˆ ˆ ˆ ˆ* 2
1 1 1ˆ ˆ( ) (2 1) (1 ) (2 1) (1 4 (1 )(1 )y y y y y y y y y yv p p p p p p p p p p pn n n
= − − + − − ) + − −
The null hypothesis of the PT test is that y and y distributed independently, and 2nS is
asymptotically distributed as 21χ .
Table 11 presents the ratio of the proportion of survey forecasts that have correct sign and
the PT test statistics with Consensus Economics data for 3-, 12-, and 24-month ahead forecasts.7
At the 3-month horizon, we find evidence against the null of no dependence for 5 out of 10
major currencies, and for 7 out of 27 minor currencies. As the forecast horizon increases to 12
months, the independency is rejected 6 out of 10 for major currencies and 10 out of 27 for minor
currencies. At the 12-month horizon, however, the PT is significant for 5 out of 10 major
currencies, and for 6 out of 27 minor currencies.
The directional accuracy results with FX4casts data for 3-, 6, and 12-month ahead
forecasts are reported in Table 12. The null hypothesis of independency for major currencies is
rejected only for 12-month ahead forecasts for 8 currencies. At the 3-month horizon, PT test is
significant for 8 minor currencies. As the forecast horizon increases to 6 months, the evidence of
dependency is found for 21 minor currencies. At the 12-month horizon, however, the null of
independency is rejected for 24 out of 36 minor currencies. Overall, the results in Tables 11 and
12 show that the dependence of the distributions of actual and forecasted exchange rate
depreciations increases as forecast horizon increases.
5.3 Summary of the Results
We have reported the results of three tests of rationality and two tests of predictive
accuracy for two datasets of professional exchange rate forecasts that contain 37 and 46
currencies each. In order to summarize the results, Table 13 reports the number of significant
statistics for each dataset. Panel A summarizes the results for major currencies, and Panel B
summarizes the results for minor currencies. The first three rows in Panels A and B report the
number of times the joint null hypothesis of unbiasedness or orthogonality can be rejected at the
10% significance level or higher. Two tests for orthogonality include testing for orthogonality of
7 The PT test is not available for some minor currencies because all the forecasts have the same sign, which makes the denominator in equation (9) equal to 0.
12

the forecast errors to lagged forecast errors and lagged actual exchange rate depreciation. Lower
number of rejections indicates stronger evidence of rationality of exchange rate expectations.
The next three rows summarize the results on the predictive accuracy of the forecasts:
the number of MSPE ratios below 1, the number of significant DMW statistics , the number of
proportions of correctly signed forecasts above 0.50, and the number of significant Pesaran and
Timmermann (1992) statistics (at the 10% significance level or higher). The last row in each
panel is the overall number of countries in each group and each dataset. In Panel A, all the cells
have 10 possible rejections. In Panel B, all the cells for Consensus Economics Data have 27
possible rejections, and all the cells for FX4casts data have 36 possible rejections.
6. Conclusions
We re-examine rationality and predictive accuracy of survey-based exchange rate
expectations for 10 major currencies and 40 minor currencies in Consensus Economics and
FX4casts datasets over the last two decades. Using the tests for unbiasedness and orthogonality,
we find the exchange rate forecasts are more rational at the long horizons of 24 and 12 months
than at the 3-month ahead horizon. The forecasts for minor currencies are relatively more
rational than the forecasts for major currencies at the short horizon of 3 months, and the forecasts
for major currencies are relatively more rational at the longer horizons of 12 months and 24
months.
Using the tests based on the MSPE comparison and on the nonparametric dependence
between forecasted and actual depreciation, we find that the predictive accuracy of the forecasts
improves with the forecasts horizon. Although, the evidence of predictive accuracy is week,
survey forecasts for minor currencies seem to be relatively more accurate compared to major
currencies based on the MSPE comparison. Another interesting finding is that while the DMW
tests couldn’t detect any evidence that the forecasts for major currencies perform better than the
random walk at the 3- or 6-month horizons, the direction-of-change PT test indicates the
presence of significant dependence between actual and forecasted depreciation. This might
suggest that the nature of the relationship is nonlinear or asymmetric.
In this paper, we have focused our analysis on examining the characteristics of survey-
based exchange rate expectations over various forecasts horizons for major and minor currencies.
13

In a companion paper, we re-evaluate the uncovered interest rate parity and analyze the implied
risk premium for two groups of countries.
14

References Chinn, Menzie and Jeffrey Frankel, “Patterns in Exchange Rate Forecasts for 25 Currencies,” Journal of Money, Credit and Banking 26(4), 1994, 759-770. ____________, “Survey Data on Exchange Rate Expectations: More Currencies, More Horizons, More Tests,” in W. Allen and D. Dickinson (eds), Monetary Policy, Capital Flows and Financial Market Developments in the Era of Financial Globalisation: Essays in Honour of Max Fry, London:Routledge, 2002, 145-167. Diebold, Francis and Robert Mariano, “Comparing Predictive Accuracy” Journal of Business and Economic Statistics, 1995, 13, pp.253-263
Dominguez, Kathryn M., 1986. "Are Foreign Exchange Forecasts Rational? New Evidence from Survey Data," Economics Letters, 21(3), 277-281. Engel, Charles, “The Forward Discount Anomaly and the Risk Premium: A Survey of Recent Evidence,” Journal of Empirical Finance 3 (2), 1996, 123-192. Frankel, Jeffrey and Kenneth Froot, 1987. "Using Survey Data to Test Standard Propositions Regarding Exchange Rate Expectations," American Economic Review, 77(1), Reprinted in Frankel, On Exchange Rates, MIT Press, 1993.133-153. Frankel, Jeffrey and Jumana Poonawala, 2010, “The Forward Market in Emerging Currencies: Less Biased than in Major Currencies”, Journal of International Money and Finance, 29(3), 585-598. Frankel, Jeffrey and Menzie Chinn,“Exchange Rate Expectations and the Risk Premium: Tests for a Cross-Section of 17 Currencies,” Review of International Economics 1(2), 1993, 136-144. Jongen, Ron, Willem F.C. Verschoor, and Christian C.P. Wolff, 2008. “Foreign Exchange Rate: Survey and Synthesis,” Journal of Economic Surveys, 22(1), 140–165. Lewis, Karen K., “Changing Beliefs and Systematic Rational Forecast Errors with Evidence from Foreign Exchange,” American Economic Review 79(4), 1989, 621-636. Maddala, G.S., 1991. “Survey Data on Expectations: What Have We Learnt?”In M. Nerlove (ed.), Issues in Contemporary Economics: Proceedings of the Ninth World Congress of the International Economic Association, Vol. 2: Macroeconomics and Econometrics. London: Macmillan. 319–344. MacDonald, Ronald, 2000. “Expectations Formation and Risk in Three Financial Markets: Surveying What the Surveys Say,” Journal of Economic Surveys, 14(1), 69–100. Macdonald, Ronald, and Thomas S. Torrance, “Expectations Formation and Risk in Four Foreign Exchange Rate Markets.” Oxford Economic Papers 42(3), 1990, 544-561 Meese, Richard A. and Kenneth Rogoff, “Empirical Exchange Rate Models of the Seventies: Do They Fit Out of Sample?” Journal of International Economics 14, 1983, 3-24 Muth, Richard A., “Rational Expectations and the Theory of Price Movements,” Econometric 29(3), 1961, 315-335
15

Pesaran, M. Hashem, and Alan Timmerman, “A Simple Nonparametric Test of Predictive Performance,” Journal of Business and Economic Statistics 10, 561-565 Takagi, Shinji, 1991. "Exchange Rate Expectations: A Survey of Survey Studies." IMF Staff Papers 38(1), 156-183. Timmermann, Allan, 2006. "Forecast Combinations," Handbook of Economic Forecasting, Elsevier. West, Kenneth D., “Asymptotic Inference about Predictive Ability” Econometrica, 1996, 64, pp.1067-1084
16

Table 1A. Summary Statistics of Actual Depreciation: tht ss −+ (Consensus Economics)
Forecast horizon h=3 h=12 h=24
Country Mean SD Mean SD Mean SD A. Major currencies
Australia -0.26 7.91 -1.01 16.67 -2.13 24.49 Canada -0.20 3.69 -0.91 7.77 -2.35 10.24 Denmark -0.07 5.47 -0.14 10.49 -1.10 14.68 Euro Area -0.25 5.46 -1.39 10.71 -4.84 14.30 Japan -0.67 5.83 -2.76 10.05 -5.39 15.29 New Zealand -0.79 10.12 -3.33 21.05 -7.23 31.96 Norway -0.10 5.79 -0.24 11.21 -1.46 14.05 Sweden 0.18 6.49 0.86 13.29 0.01 17.23 Switzerland -0.50 5.84 -1.93 10.58 -4.71 14.45 U.K. 0.15 4.93 0.54 9.26 0.28 12.31
B. Minor Currencies Bangladesh 1.00 1.81 4.16 3.60 8.03 5.34 Egypt 1.02 3.50 4.23 8.61 8.94 14.55 Hong Kong -0.01 0.21 -0.01 0.32 0.01 0.37 India 0.76 3.63 3.00 8.15 4.90 9.74 Indonesia 1.84 14.20 7.43 31.39 15.08 40.51 Israel 0.10 4.37 -0.22 8.33 -1.38 10.12 Nigeria 1.04 4.21 3.94 8.07 7.58 10.62 Pakistan 1.59 3.19 6.39 7.40 12.35 11.35 Philippines 0.73 5.01 2.95 11.95 6.25 17.31 Singapore -0.39 2.93 -1.54 5.96 -2.89 8.89 South Africa 1.27 7.97 4.75 16.61 8.99 24.23 South Korea 0.51 7.38 2.14 14.70 4.22 19.61 Sri Lanka 1.34 2.35 5.39 5.56 10.06 7.90 Taiwan 0.12 2.92 0.44 6.15 0.89 8.01 Thailand 0.23 6.15 1.04 12.63 2.01 16.73 Vietnam 0.89 1.66 3.70 3.89 7.84 6.01 Argentina 1.67 7.27 3.54 10.40 7.66 11.67 Bolivia 0.13 1.27 0.27 4.47 -0.24 7.67 Brazil -0.17 9.53 -1.94 18.22 -8.59 19.39 Chile -0.51 6.37 -2.78 10.92 -6.91 11.96 Colombia -0.55 6.62 -2.31 12.49 -6.22 14.34 Costa Rica 0.93 2.39 3.80 6.86 7.42 11.14 Dom. Republic 1.99 9.51 8.20 24.72 16.40 30.95 Mexico 0.71 5.50 3.28 9.43 5.83 10.84 Paraguay 0.30 6.77 0.17 15.64 -3.59 18.49 Peru -0.71 2.41 -2.64 4.63 -5.45 4.35 Uruguay 0.91 9.04 3.61 21.95 2.08 27.82
Notes: The table reports the mean and standard deviation of actual depreciation for 3-, 12-, and 24-month ahead exchange rate forecasts in Consensus Economics sample.
17

Table 1B. Summary Statistics of Expected Depreciation: te
tht ss −+ , (Consensus Economics Data)
Forecast horizon h=3 h=12 h=24
Country Mean SD Mean SD Mean SD A. Major currencies
Australia 0.31 2.69 1.17 5.21 2.06 8.49 Canada -0.30 1.52 -1.07 2.55 -1.77 4.05 Denmark 0.23 2.82 -0.23 5.65 -1.86 7.10 Euro Area -0.65 2.35 -2.13 5.04 -2.65 7.59 Japan 0.19 2.55 0.08 5.14 -1.98 6.78 New Zealand -0.14 2.90 0.30 5.92 0.14 10.03 Norway -0.43 2.60 -1.43 5.50 -2.96 6.72 Sweden -1.05 2.84 -3.04 5.88 -5.87 7.24 Switzerland 0.32 2.82 0.15 5.82 -2.24 6.84 U.K. 0.53 1.57 1.00 2.97 0.91 3.68
B. Minor Currencies Bangladesh 1.87 1.42 5.06 2.11 9.03 3.17 Egypt 1.13 1.50 3.81 3.28 6.75 4.41 Hong Kong 0.08 0.19 0.16 0.29 0.20 0.39 India 0.51 1.75 1.59 4.03 4.43 5.72 Indonesia 0.05 3.20 -0.10 5.72 -0.94 7.55 Israel 0.90 1.95 2.03 3.19 4.33 4.30 Nigeria 2.46 2.97 9.09 6.66 21.63 14.60 Pakistan 2.39 1.76 6.56 2.99 11.43 4.57 Philippines 0.43 1.68 0.23 3.00 1.70 3.52 Singapore -0.15 1.37 -1.38 2.18 -3.74 1.72 South Africa 1.02 3.34 4.38 5.19 8.45 7.10 South Korea -0.58 1.85 -2.66 3.72 -5.59 4.86 Sri Lanka 1.73 1.50 5.14 2.44 9.69 3.39 Taiwan -0.55 1.25 -2.02 1.96 -3.98 1.96 Thailand 0.04 1.75 -0.71 2.39 -1.74 2.67 Vietnam 1.19 1.45 3.79 3.10 6.59 4.98 Argentina 2.41 3.51 9.06 10.19 15.71 16.62 Bolivia 1.08 1.12 3.63 2.98 7.49 4.38 Brazil 0.50 3.47 3.98 5.14 8.68 5.76 Chile 0.23 1.70 1.57 2.55 3.49 3.58 Colombia 1.28 2.74 4.67 4.04 9.14 4.64 Costa Rica 1.64 1.27 6.23 2.22 11.69 4.40 Dom. Republic 2.61 3.87 6.68 5.22 10.86 6.39 Mexico 0.25 2.20 2.35 3.22 5.40 3.49 Paraguay 3.00 2.94 7.55 4.18 12.59 4.99 Peru 0.09 1.30 0.82 1.78 2.29 2.20 Uruguay 2.59 3.67 7.17 5.17 12.27 7.49
Notes: The table reports the mean and standard deviation of expected depreciation for 3-, 12-, and 24-month ahead exchange rate forecasts in Consensus Economics dataset.
18

Table 1C. Summary Statistics of Forecast Errors: eththt ss ,++ −
(Consensus Economics Data) Forecast horizon h=3 h=12 h=24
Country Mean SD Mean SD Mean SD A. Major currencies
Australia -0.57 8.54 -2.18 16.84 -3.17 25.34 Canada 0.10 4.08 0.16 7.71 -2.18 10.95 Denmark -0.30 5.86 0.09 11.21 1.63 14.37 Euro Area 0.40 6.09 0.73 11.44 -2.19 13.89 Japan -0.86 6.52 -2.84 11.82 -0.84 15.44 New Zealand -0.65 10.72 -3.63 21.26 -4.90 31.09 Norway 0.32 6.23 1.18 10.91 1.59 14.08 Sweden 1.23 6.82 3.90 12.22 5.35 14.93 Switzerland -0.81 6.42 -2.08 11.70 -1.18 14.62 U.K. -0.38 4.99 -0.41 8.28 -1.11 11.07
B. Minor Currencies Bangladesh -0.87 2.37 -0.90 4.50 -0.99 5.22 Egypt -0.11 3.63 0.42 8.13 2.18 13.56 Hong Kong -0.09 0.24 -0.17 0.33 -0.14 0.32 India 0.25 3.90 1.41 8.73 0.46 10.08 Indonesia 1.79 14.76 7.53 30.96 18.08 41.79 Israel -0.80 4.37 -2.25 7.50 -5.71 8.86 Nigeria -1.43 4.94 -5.15 9.16 -14.05 16.02 Pakistan -0.80 3.61 -0.18 7.62 0.91 11.62 Philippines 0.30 5.19 2.72 12.16 4.55 17.03 Singapore -0.24 3.28 -0.16 6.60 2.27 9.34 South Africa 0.25 9.03 0.36 17.74 0.03 24.67 South Korea 1.09 7.36 4.80 14.31 9.99 21.34 Sri Lanka -0.39 2.71 0.25 5.84 0.37 7.22 Taiwan 0.67 3.18 2.46 6.10 5.11 7.98 Thailand 0.18 6.15 1.75 12.74 4.29 18.24 Vietnam -0.30 1.92 -0.09 4.60 1.25 8.09 Argentina -0.74 5.93 -5.52 14.82 -8.04 21.11 Bolivia -0.95 1.29 -3.36 3.56 -7.72 6.30 Brazil -0.66 10.07 -5.92 18.13 -17.26 20.97 Chile -0.74 6.25 -4.35 10.13 -10.40 10.27 Colombia -1.83 7.19 -6.98 11.69 -15.36 12.67 Costa Rica -0.71 2.95 -2.43 7.24 -4.27 11.27 Dom. Republic -0.62 9.68 1.51 25.18 5.53 33.03 Mexico 0.46 5.79 0.94 9.06 0.43 10.14 Paraguay -3.69 6.92 -7.38 15.03 -16.18 17.59 Peru -0.80 2.99 -3.46 5.28 -7.54 4.97 Uruguay -1.68 8.37 -3.56 20.06 -10.19 25.06
Notes: The table reports the mean and standard deviation of the forecast error for 3-, 12-, and 24-month ahead exchange rate forecasts in Consensus Economics dataset.
19

Table 2A. Summary Statistics of Actual Depreciation: tht ss −+ (FX4casts Data)
Forecast horizon h=3 h=6 h=12 Country Mean SD Mean SD Mean SD
C. Major currencies Australia 0.35 5.95 0.68 8.91 1.29 12.34 Canada -0.20 3.72 -0.38 5.58 -0.71 7.72 Denmark -0.14 5.39 -0.22 7.60 -0.29 10.36 Euro Area -0.28 6.85 -0.60 10.15 -1.00 14.75 Japan -0.65 5.68 -1.42 7.75 -2.68 10.04 New Zealand 0.50 6.22 0.96 9.86 1.76 14.37 Norway -0.16 5.73 -0.27 8.02 -0.33 10.73 Sweden 0.08 6.64 0.20 9.53 0.62 12.94 Switzerland -0.53 5.72 -0.98 7.89 -1.75 10.44 U.K. -0.04 5.13 -0.10 7.59 -0.55 9.43
D. Minor Currencies Algeria 0.31 3.13 0.69 4.61 0.99 6.24 Argentina 3.58 13.91 5.50 21.36 6.81 21.92 Bangladesh 0.93 2.11 1.91 2.93 4.06 4.33 Bolivia -0.31 1.20 -0.67 1.98 -1.53 3.27 Brazil -0.44 9.38 -0.81 14.66 -2.91 18.22 Chile -0.81 6.44 -1.59 9.15 -3.33 11.12 China -0.65 0.98 -1.28 1.67 -2.66 2.85 Colombia -0.56 6.62 -1.09 9.79 -2.74 12.83 Croatia -0.20 5.26 -0.33 7.81 -0.54 9.67 Czech Republic -1.48 6.89 -2.88 10.18 -5.42 12.36 Egypt -0.02 1.68 -0.08 2.59 -0.27 4.00 Hong Kong -0.01 0.21 -0.03 0.26 -0.05 0.29 Hungary -0.58 7.87 -1.06 11.57 -1.71 14.14 India 0.29 4.09 0.58 5.99 0.98 9.56 Indonesia -0.14 5.14 -0.29 7.92 -0.19 10.14 Israel -0.40 4.44 -0.81 6.82 -1.88 8.95 Jamaica 1.18 2.61 2.35 4.27 4.69 6.39 Kenya 0.34 5.13 0.56 7.55 0.84 9.57 Mexico 0.76 5.52 1.65 7.83 3.23 9.80 Nigeria 0.39 4.02 0.92 5.94 2.12 9.08 Pakistan 1.47 2.67 2.96 4.49 5.86 7.21 Paraguay -0.92 5.86 -1.74 9.12 -3.68 11.41 Peru -0.84 2.54 -1.69 3.91 -3.27 4.95 Philippines -0.70 3.18 -1.36 4.75 -2.88 7.08 Poland -0.58 7.99 -1.09 12.22 -2.25 15.33 Romania 0.15 6.78 0.35 10.48 0.51 13.55 Russia 0.07 5.30 0.15 7.86 0.02 10.41 Serbia 1.28 7.82 2.64 12.28 4.82 16.39 Singapore -0.92 2.57 -1.85 3.71 -3.59 4.62 South Africa -0.44 8.50 -1.20 12.15 -2.59 17.63 South Korea -0.38 5.67 -0.75 8.73 -1.12 12.77 Taiwan -0.39 2.76 -0.77 3.91 -1.48 4.61 Thailand -0.83 3.55 -1.63 5.24 -3.22 7.42 Turkey 0.36 7.97 1.04 10.57 1.79 13.57 Uruguay -1.15 5.47 -2.15 8.05 -4.36 10.77 Vietnam 0.81 1.61 1.65 2.21 3.50 3.56
Notes: The table reports the mean and standard deviation of actual depreciation for 3-, 6-, and 12-month ahead exchange rate forecasts in FX4casts dataset.
20

Table 2B. Summary Statistics of Expected Depreciation: te
ht ss −+ (FX4casts Data)
Forecast horizon h=3 h=6 h=12 Country Mean SD Mean SD Mean SD
A. Major currencies Australia 0.35 1.73 1.13 3.13 2.21 4.91 Canada -0.23 1.03 -0.59 1.64 -0.92 2.58 Denmark 0.52 2.13 0.87 4.08 0.61 6.04 Euro Area 0.78 2.73 2.07 4.30 3.49 4.87 Japan 0.89 1.99 1.89 3.47 2.52 4.84 New Zealand 0.70 1.83 1.65 2.87 2.63 4.50 Norway 0.33 2.27 0.37 4.17 0.14 5.89 Sweden 0.24 2.40 0.27 4.32 -0.18 6.42 Switzerland 0.45 2.30 0.78 4.26 0.74 6.46 U.K. -0.74 1.88 -1.37 3.92 -1.64 5.20
B. Minor Currencies Algeria 0.15 0.77 0.21 1.54 0.30 2.85 Argentina 1.23 3.37 2.96 6.54 5.06 5.79 Bangladesh 0.79 1.62 1.83 1.64 2.89 2.92 Bolivia -0.01 0.45 0.05 1.11 0.05 2.03 Brazil 0.28 1.28 0.86 2.92 1.74 4.63 Chile 0.04 1.30 -0.20 2.31 -0.43 3.77 China -0.47 0.50 -1.21 1.02 -2.30 1.93 Colombia 0.06 1.52 0.18 3.61 0.32 4.57 Croatia 0.31 0.98 0.42 1.89 0.82 3.17 Czech Republic 0.15 1.71 -0.07 2.63 -0.07 4.01 Egypt 0.46 0.84 0.77 1.59 0.92 2.79 Hong Kong 0.01 0.08 0.03 0.11 0.04 0.13 Hungary 0.18 1.64 0.10 2.47 0.11 3.92 India -0.33 0.98 -1.06 1.55 -2.06 2.73 Indonesia -0.52 0.99 -1.32 1.52 -2.49 2.25 Israel 0.13 0.99 0.47 1.80 0.90 3.09 Jamaica 0.55 0.76 1.21 1.22 2.25 2.08 Kenya 0.62 1.08 1.23 1.83 2.26 3.50 Mexico 0.19 1.32 0.63 1.97 1.31 3.12 Nigeria 0.71 1.12 1.40 2.02 2.23 3.49 Pakistan 0.86 0.86 1.59 1.47 2.92 2.64 Paraguay -0.36 0.98 -0.72 1.83 -1.26 3.30 Peru -0.45 0.82 -0.81 1.39 -1.06 2.36 Philippines -0.21 0.97 -0.72 1.63 -1.38 2.81 Poland 0.06 1.52 -0.12 2.30 -0.13 3.89 Romania -0.02 1.80 0.37 2.00 0.74 3.40 Russia 0.18 1.19 0.58 2.18 1.16 3.92 Serbia 0.98 1.25 1.99 1.87 3.62 2.84 Singapore -0.44 0.74 -1.20 1.07 -2.34 1.45 South Africa 0.94 2.39 2.65 3.97 5.17 5.77 South Korea -0.48 1.36 -1.62 1.93 -3.11 2.39 Taiwan -0.51 0.75 -1.46 1.31 -2.76 1.79 Thailand -0.12 1.21 -0.66 2.01 -1.54 3.03 Turkey 1.44 3.24 3.68 5.70 7.19 9.84 Uruguay -0.33 1.07 -0.39 2.10 -0.66 3.61 Vietnam 0.46 0.50 0.98 0.82 2.06 1.25
The table reports the mean and standard deviation of expected depreciation for 3-, 6-, and 12-month ahead exchange rate forecasts in FX4casts dataset.
21
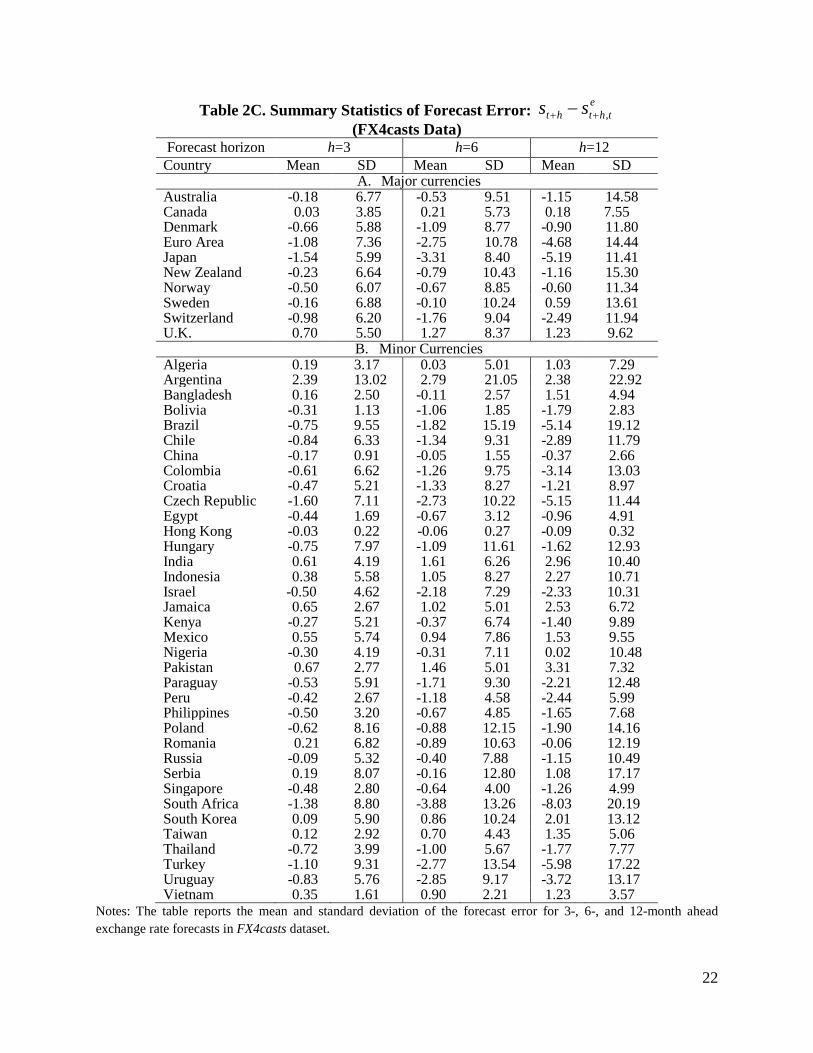
Table 2C. Summary Statistics of Forecast Error: eththt ss ,++ −
(FX4casts Data) Forecast horizon h=3 h=6 h=12 Country Mean SD Mean SD Mean SD
A. Major currencies Australia -0.18 6.77 -0.53 9.51 -1.15 14.58 Canada 0.03 3.85 0.21 5.73 0.18 7.55 Denmark -0.66 5.88 -1.09 8.77 -0.90 11.80 Euro Area -1.08 7.36 -2.75 10.78 -4.68 14.44 Japan -1.54 5.99 -3.31 8.40 -5.19 11.41 New Zealand -0.23 6.64 -0.79 10.43 -1.16 15.30 Norway -0.50 6.07 -0.67 8.85 -0.60 11.34 Sweden -0.16 6.88 -0.10 10.24 0.59 13.61 Switzerland -0.98 6.20 -1.76 9.04 -2.49 11.94 U.K. 0.70 5.50 1.27 8.37 1.23 9.62
B. Minor Currencies Algeria 0.19 3.17 0.03 5.01 1.03 7.29 Argentina 2.39 13.02 2.79 21.05 2.38 22.92 Bangladesh 0.16 2.50 -0.11 2.57 1.51 4.94 Bolivia -0.31 1.13 -1.06 1.85 -1.79 2.83 Brazil -0.75 9.55 -1.82 15.19 -5.14 19.12 Chile -0.84 6.33 -1.34 9.31 -2.89 11.79 China -0.17 0.91 -0.05 1.55 -0.37 2.66 Colombia -0.61 6.62 -1.26 9.75 -3.14 13.03 Croatia -0.47 5.21 -1.33 8.27 -1.21 8.97 Czech Republic -1.60 7.11 -2.73 10.22 -5.15 11.44 Egypt -0.44 1.69 -0.67 3.12 -0.96 4.91 Hong Kong -0.03 0.22 -0.06 0.27 -0.09 0.32 Hungary -0.75 7.97 -1.09 11.61 -1.62 12.93 India 0.61 4.19 1.61 6.26 2.96 10.40 Indonesia 0.38 5.58 1.05 8.27 2.27 10.71 Israel -0.50 4.62 -2.18 7.29 -2.33 10.31 Jamaica 0.65 2.67 1.02 5.01 2.53 6.72 Kenya -0.27 5.21 -0.37 6.74 -1.40 9.89 Mexico 0.55 5.74 0.94 7.86 1.53 9.55 Nigeria -0.30 4.19 -0.31 7.11 0.02 10.48 Pakistan 0.67 2.77 1.46 5.01 3.31 7.32 Paraguay -0.53 5.91 -1.71 9.30 -2.21 12.48 Peru -0.42 2.67 -1.18 4.58 -2.44 5.99 Philippines -0.50 3.20 -0.67 4.85 -1.65 7.68 Poland -0.62 8.16 -0.88 12.15 -1.90 14.16 Romania 0.21 6.82 -0.89 10.63 -0.06 12.19 Russia -0.09 5.32 -0.40 7.88 -1.15 10.49 Serbia 0.19 8.07 -0.16 12.80 1.08 17.17 Singapore -0.48 2.80 -0.64 4.00 -1.26 4.99 South Africa -1.38 8.80 -3.88 13.26 -8.03 20.19 South Korea 0.09 5.90 0.86 10.24 2.01 13.12 Taiwan 0.12 2.92 0.70 4.43 1.35 5.06 Thailand -0.72 3.99 -1.00 5.67 -1.77 7.77 Turkey -1.10 9.31 -2.77 13.54 -5.98 17.22 Uruguay -0.83 5.76 -2.85 9.17 -3.72 13.17 Vietnam 0.35 1.61 0.90 2.21 1.23 3.57
Notes: The table reports the mean and standard deviation of the forecast error for 3-, 6-, and 12-month ahead exchange rate forecasts in FX4casts dataset.
22

Table 3. Tests of Unbiasedness: htte
httht ussss +++ +−+=− )(βα (Consensus Economics Data)
h=3 h=12 h=24 β χ2 β χ2 β χ2
A. Major currencies Australia -0.21 0.000*** 0.40 0.281 0.51 0.577 Canada -0.16 0.000*** 0.57 0.756 -0.09 0.011** Denmark 0.22 0.000*** 0.26 0.077* 0.73 0.852 Euro Area -0.15 0.000*** 0.18 0.165 0.60 0.214 Japan -0.16 0.000*** -0.23 0.000*** 0.50 0.577 New Zealand -0.24 0.000*** 0.37 0.354 0.68 0.733 Norway 0.12 0.001*** 0.61 0.517 0.57 0.657 Sweden 0.22 0.000*** 0.89* 0.244 0.96* 0.162 Switzerland 0.05 0.000*** 0.13 0.008*** 0.52 0.577 U.K. 0.38 0.084* 1.47*** 0.670 1.80*** 0.249
B. Minor Currencies Bangladesh -0.09 0.000*** -0.32 0.000*** 0.57 0.014** Egypt 0.28 0.076* 0.87 0.914 1.22 0.869 Hong Kong 0.28*** 0.000*** 0.44*** 0.000*** 0.63*** 0.000*** India 0.17 0.001*** 0.20 0.067* 0.40 0.115 Indonesia -0.30 0.001*** 0.91 0.278 3.07** 0.160 Israel 0.50 0.077* 1.15*** 0.364 1.15*** 0.045** Nigeria 0.12 0.000*** 0.29 0.000*** 0.16 0.000*** Pakistan 0.04 0.000*** 0.32 0.225 0.35 0.235 Philippines 0.18 0.009*** 0.22 0.176 0.90 0.554 Singapore -0.07 0.000*** -0.35 0.000*** 0.24 0.252 South Africa -0.32* 0.000*** -0.22 0.078* 0.75 0.932 South Korea 0.54 0.018** 0.91** 0.124 1.29** 0.164 Sri Lanka 0.10 0.000*** 0.22 0.164 0.95*** 0.969 Taiwan -0.01 0.000*** 0.59 0.013** 2.18*** 0.019** Thailand 0.50 0.219 0.28 0.177 1.65** 0.613 Vietnam 0.28** 0.000*** 0.19 0.000*** -0.09 0.000*** Argentina 1.22*** 0.235 -0.04 0.000*** -0.06 0.000*** Bolivia 0.48*** 0.000*** 0.91*** 0.000*** 1.00*** 0.002*** Brazil 0.06 0.003*** 0.56 0.368 -0.46 0.001*** Chile 0.75*** 0.432 1.78*** 0.052* 1.97*** 0.000*** Colombia -0.03 0.000*** 1.10** 0.013** 1.55** 0.000*** Costa Rica -0.43 0.000*** -0.05 0.247 0.38 0.164 Dom. Republic 0.39* 0.001*** 0.08 0.131 -1.13 0.001*** Mexico 0.15 0.058* 0.83*** 0.595 1.11** 0.980 Paraguay 0.38 0.013** 1.03*** 0.126 1.16*** 0.002*** Peru -0.41 0.000*** -0.51 0.000*** -0.10 0.000*** Uruguay 0.93* 0.237 1.98*** 0.025** 1.80*** 0.000***
Notes: The OLS estimates of the slope coefficient in Equation (1) are reported in column β . Newey-West standard errors are used to determine the significance level. The column called χ2 reports the p-values for the χ2 statistics for the joint null hypothesis that α=0 and β=1 in Equation (1). *, **, and *** indicate significance at the 10, 5, and 1% significance level, respectively.
23

Table 4. Tests of Unbiasedness: htte
httht ussss +++ +−+=− )(βα (FX4casts Data)
h=3 h=6 h=12 β χ2 β χ2 β χ2
A. Major currencies Australia -0.16 0.000*** -0.07 0.003*** 0.08 0.111 Canada 0.05 0.000*** 0.18 0.038** 0.70 0.819 Denmark -0.11 0.000*** -0.07 0.000*** 0.08 0.001*** Euro Area 0.02 0.000*** 0.15 0.000*** 0.70 0.047** Japan 0.05 0.000*** 0.07 0.000*** -0.11 0.000*** New Zealand -0.32 0.000*** -0.22 0.030** -0.20 0.183 Norway 0.11 0.000*** 0.10 0.000*** 0.31 0.024** Sweden 0.21 0.003*** 0.13 0.003*** 0.28 0.147 Switzerland -0.04 0.000*** -0.03 0.000*** 0.12 0.000*** U.K. -0.05 0.000*** 0.10 0.000*** 0.42 0.111
B. Minor Currencies Algeria 0.26 0.267 -0.01 0.054** -0.39 0.000*** Argentina 1.54*** 0.655 0.65 0.093* -0.21 0.007*** Bangladesh 0.17 0.000*** 0.14 0.000*** 0.16 0.000*** Bolivia 0.87*** 0.003*** 0.68** 0.000*** 0.82*** 0.000*** Brazil 0.06 0.298 -0.45 0.108 -0.32 0.083* Chile 0.92** 0.601 0.23 0.085* -0.01 0.094* China 0.74*** 0.016** 0.69*** 0.114 0.63** 0.056* Colombia 0.49 0.440 0.52** 0.124 0.39 0.423 Croatia 0.81 0.811 0.41 0.613 1.11** 0.811 Czech Republic -0.01 0.002*** 0.45 0.307 1.16 0.007*** Egypt 0.48*** 0.006*** 0.21 0.008*** 0.00 0.015** Hong Kong 0.45 0.098* 0.21 0.000*** 0.08 0.000*** Hungary 0.20 0.145 0.43 0.734 1.52*** 0.560 India 0.08 0.017** -0.18 0.000*** -0.54 0.000*** Indonesia -0.51 0.000*** -0.67 0.004*** -0.58 0.004*** Israel -0.30 0.006*** -0.54 0.000*** -1.00* 0.000*** Jamaica 0.34 0.019** 0.25 0.006*** 0.11 0.000*** Kenya 0.16 0.265 0.24 0.298 0.27 0.112 Mexico -0.19 0.012** 0.44 0.423 0.77** 0.644 Nigeria -0.06 0.003*** -0.34 0.000*** -0.51 0.000*** Pakistan 0.08 0.007*** 0.22 0.001*** 0.88 0.029** Paraguay 0.22 0.198 -0.34 0.000*** -0.74* 0.000*** Peru 0.03 0.002*** -0.08 0.003*** -0.49 0.000*** Philippines 0.43 0.123 0.32 0.001*** -0.02 0.000*** Poland -0.11 0.058* 0.65 0.887 1.61** 0.141 Romania 0.43 0.304 1.60** 0.705 1.93*** 0.307 Russia 0.42 0.206 0.48 0.232 0.45 0.188 Serbia 0.45 0.763 0.29 0.560 0.20 0.787 Singapore -0.59** 0.000*** -0.43 0.000*** -0.29** 0.000*** South Africa 0.06 0.013** -0.36 0.000*** -0.87 0.000*** South Korea -0.22 0.000*** -0.34 0.001*** -0.22 0.102 Taiwan -0.30 0.000*** -0.71*** 0.000*** -0.14 0.000*** Thailand -0.62*** 0.000*** -0.07 0.007*** 0.24 0.235 Turkey -0.57*** 0.000*** -0.18 0.000*** -0.05 0.000*** Uruguay -0.93* 0.000*** -1.29** 0.000*** -1.53*** 0.000*** Vietnam 0.51 0.019** 0.38 0.023** 0.47 0.492
Notes: See notes to Table 3.
24

Table 5. Tests of Orthogonality: hte
httte
ththt ussss +−++ +−+=− )( .,, βα (Consensus Economics Data)
h=3 h=12 h=24 β χ2 β χ2 β χ2
A. Major currencies Australia 0.16* 0.074* 0.11 0.459 0.34*** 0.000*** Canada 0.32*** 0.000*** 0.09 0.905 0.28 0.012** Denmark 0.15* 0.154 0.24 0.267 0.12 0.691 Euro Area 0.15 0.254 0.14 0.619 -0.28 0.000*** Japan 0.15** 0.028** 0.30* 0.068 -0.17 0.063* New Zealand 0.15 0.259 0.16 0.162 0.34*** 0.000*** Norway 0.14* 0.252 0.08 0.835 0.20 0.631 Sweden 0.19** 0.006*** 0.09 0.415 -0.06 0.221 Switzerland 0.14* 0.092* 0.26 0.096* 0.25 0.239 U.K. 0.11 0.427 -0.02 0.741 -0.14 0.705
B. Minor Currencies Bangladesh 0.31** 0.000*** 0.26 0.214 -0.63*** 0.000*** Egypt 0.25*** 0.003*** 0.20 0.419 0.07 0.923 Hong Kong 0.39*** 0.000*** 0.21 0.007*** -0.07 0.000*** India 0.24** 0.047** -0.24 0.287 0.10 0.923 Indonesia 0.11 0.419 -0.18** 0.022** -0.10 0.326 Israel 0.27*** 0.004*** -0.20 0.157 -0.25*** 0.003*** Nigeria 0.13 0.000*** 0.01 0.009*** 0.44*** 0.000*** Pakistan 0.24** 0.001*** 0.07 0.878 0.03 0.932 Philippines 0.14 0.733 -0.05 0.527 0.22* 0.085* Singapore 0.11 0.440 0.12 0.670 0.30*** 0.016** South Africa 0.32*** 0.003*** 0.17 0.705 -0.07 0.951 South Korea 0.07 0.336 -0.10 0.110 -0.19 0.399 Sri Lanka 0.33*** 0.000*** -0.07 0.887 0.24 0.538 Taiwan 0.14* 0.042** -0.26*** 0.003*** -0.30*** 0.005*** Thailand 0.06 0.951 -0.17* 0.137 0.01 0.980 Vietnam 0.05 0.162 0.13 0.771 -0.02 0.887 Argentina 0.18 0.115 -0.05 0.502 -0.06 0.811 Bolivia 0.56 0.000*** 0.15 0.000*** 0.02 0.000*** Brazil 0.30*** 0.001*** -0.09 0.020** -0.21 0.001*** Chile 0.10 0.228 -0.38** 0.000*** -0.41*** 0.000*** Colombia 0.26** 0.009*** -0.27 0.003*** -0.31*** 0.000*** Costa Rica 0.61*** 0.000*** 0.12 0.174 0.04 0.118 Dom. Republic 0.49** 0.008*** -0.22 0.432 -0.31*** 0.000*** Mexico 0.17 0.463 -0.25 0.141 -0.54** 0.007*** Paraguay 0.43*** 0.000*** -0.18 0.000*** -0.07 0.000*** Peru 0.35** 0.001*** -0.62*** 0.000*** -0.42** 0.000*** Uruguay 0.13 0.144 -0.10 0.008*** -0.16*** 0.000***
Notes: The OLS estimates of the slope coefficient in equation (2) are reported in column β . Newey-West standard errors are used to determine the significance level. The column called χ2 reports the p-values for the χ2 statistics for the joint null hypothesis that α=0 and β=1 in Equation (2). *, **, and *** indicate significance at the 10, 5, and 1% significance level, respectively.
25

Table 6. Tests of Orthogonality: 3.,, )( +−++ +−+=− te
httte
ththt ussss βα (FX4casts Data)
h=3 h=6 h=12 β χ2 β χ2 β χ2
A. Major currencies Australia 0.18** 0.038** 0.04 0.844 -0.01 0.803 Canada 0.14** 0.078* -0.07 0.698 -0.11 0.835 Denmark 0.08 0.219 0.05 0.726 0.09 0.657 Euro Area 0.11* 0.039** 0.01 0.169 0.18 0.042** Japan -0.01 0.019** 0.01 0.012** 0.24 0.008*** New Zealand -0.28*** 0.026** 0.12 0.684 0.02 0.869 Norway 0.03 0.560 -0.06 0.756 -0.14 0.698 Sweden 0.11 0.375 -0.04 0.951 -0.07 0.869 Switzerland 0.03 0.237 0.04 0.432 0.12 0.249 U.K. 0.11 0.186 -0.13 0.372 -0.06 0.763
B. Minor Currencies Algeria 0.01 0.951 -0.15 0.330 -0.37 0.212 Argentina 0.35 0.031** -0.14*** 0.009*** -0.23*** 0.000*** Bangladesh 0.10 0.787 0.22*** 0.278 0.23* 0.206 Bolivia 0.26 0.131 0.02 0.072* -0.18 0.167 Brazil 0.26** 0.018** -0.15 0.247 -0.29* 0.001*** Chile 0.01 0.638 -0.30 0.000*** -0.44*** 0.000*** China 0.29** 0.073* 0.16 0.670 -0.27* 0.126 Colombia 0.06 0.571 -0.22* 0.087* -0.43*** 0.000*** Croatia 0.07 0.445 -0.36*** 0.000*** -0.49*** 0.000*** Czech Republic 0.09 0.110 -0.33*** 0.001*** -0.47** 0.007*** Egypt 0.03 0.232 0.10 0.756 -0.27** 0.060* Hong Kong -0.16 0.147 -0.21 0.024** -0.31** 0.042** Hungary 0.08 0.477 -0.32*** 0.006*** -0.37** 0.023** India 0.09 0.468 0.26* 0.119 -0.32** 0.080* Indonesia 0.07 0.295 -0.16 0.235 -0.24 0.188 Israel 0.15 0.267 -0.22 0.113 0.49** 0.001*** Jamaica 0.30 0.230 0.02 0.698 -0.26 0.571 Kenya -0.02 0.878 0.30*** 0.004*** -0.47*** 0.008*** Mexico 0.04 0.748 -0.25** 0.033** -0.34* 0.017** Nigeria 0.05 0.664 0.04 0.887 -0.36** 0.000*** Pakistan 0.34 0.239 0.16 0.492 -0.16 0.346 Paraguay 0.16 0.320 -0.30 0.126 -0.51** 0.002*** Peru 0.16 0.244 -0.21 0.131 -0.61*** 0.000*** Philippines 0.02 0.577 0.01 0.607 -0.25 0.058* Poland 0.16 0.326 -0.31*** 0.010*** -0.51** 0.046* Romania 0.15 0.571 -0.28*** 0.019** -0.30** 0.125 Russia 0.07 0.869 -0.22* 0.181 -0.34* 0.000*** Serbia 0.20*** 0.026** -0.19 0.120 -0.44 0.247 Singapore 0.06 0.289 -0.27*** 0.005*** -0.47** 0.000*** South Africa 0.13 0.110 0.14 0.265 0.19 0.330 South Korea 0.10 0.507 -0.04 0.419 -0.23 0.206 Taiwan 0.04 0.923 -0.33*** 0.007*** -0.33 0.326 Thailand 0.10 0.375 -0.03 0.631 -0.18 0.247 Turkey -0.07 0.670 -0.11 0.336 -0.15 0.177 Uruguay 0.08 0.478 -0.16 0.005*** -0.58*** 0.009*** Vietnam -0.21 0.151 0.35* 0.000*** 0.20 0.298
Notes: See notes to Table 5.
26
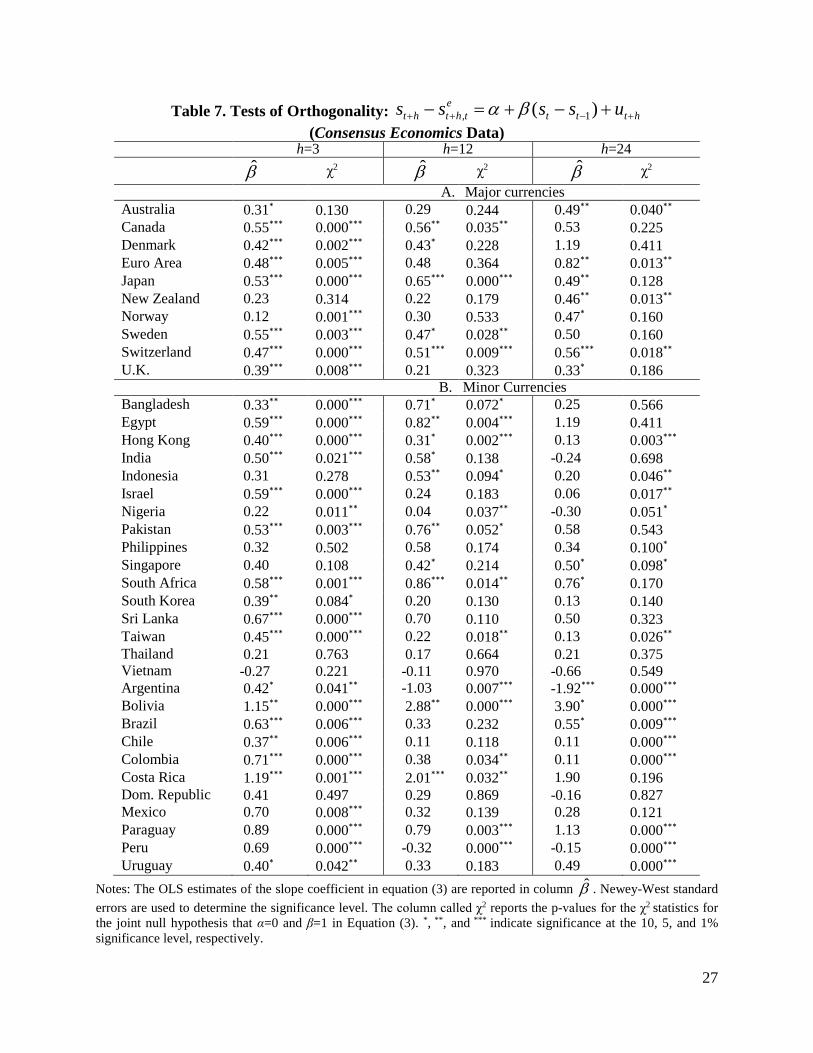
Table 7. Tests of Orthogonality: httte
ththt ussss +−++ +−+=− )( 1, βα (Consensus Economics Data)
h=3 h=12 h=24 β χ2 β χ2 β χ2
A. Major currencies Australia 0.31* 0.130 0.29 0.244 0.49** 0.040** Canada 0.55*** 0.000*** 0.56** 0.035** 0.53 0.225 Denmark 0.42*** 0.002*** 0.43* 0.228 1.19 0.411 Euro Area 0.48*** 0.005*** 0.48 0.364 0.82** 0.013** Japan 0.53*** 0.000*** 0.65*** 0.000*** 0.49** 0.128 New Zealand 0.23 0.314 0.22 0.179 0.46** 0.013** Norway 0.12 0.001*** 0.30 0.533 0.47* 0.160 Sweden 0.55*** 0.003*** 0.47* 0.028** 0.50 0.160 Switzerland 0.47*** 0.000*** 0.51*** 0.009*** 0.56*** 0.018** U.K. 0.39*** 0.008*** 0.21 0.323 0.33* 0.186
B. Minor Currencies Bangladesh 0.33** 0.000*** 0.71* 0.072* 0.25 0.566 Egypt 0.59*** 0.000*** 0.82** 0.004*** 1.19 0.411 Hong Kong 0.40*** 0.000*** 0.31* 0.002*** 0.13 0.003*** India 0.50*** 0.021*** 0.58* 0.138 -0.24 0.698 Indonesia 0.31 0.278 0.53** 0.094* 0.20 0.046** Israel 0.59*** 0.000*** 0.24 0.183 0.06 0.017** Nigeria 0.22 0.011** 0.04 0.037** -0.30 0.051* Pakistan 0.53*** 0.003*** 0.76** 0.052* 0.58 0.543 Philippines 0.32 0.502 0.58 0.174 0.34 0.100* Singapore 0.40 0.108 0.42* 0.214 0.50* 0.098* South Africa 0.58*** 0.001*** 0.86*** 0.014** 0.76* 0.170 South Korea 0.39** 0.084* 0.20 0.130 0.13 0.140 Sri Lanka 0.67*** 0.000*** 0.70 0.110 0.50 0.323 Taiwan 0.45*** 0.000*** 0.22 0.018** 0.13 0.026** Thailand 0.21 0.763 0.17 0.664 0.21 0.375 Vietnam -0.27 0.221 -0.11 0.970 -0.66 0.549 Argentina 0.42* 0.041** -1.03 0.007*** -1.92*** 0.000*** Bolivia 1.15** 0.000*** 2.88** 0.000*** 3.90* 0.000*** Brazil 0.63*** 0.006*** 0.33 0.232 0.55* 0.009*** Chile 0.37** 0.006*** 0.11 0.118 0.11 0.000*** Colombia 0.71*** 0.000*** 0.38 0.034** 0.11 0.000*** Costa Rica 1.19*** 0.001*** 2.01*** 0.032** 1.90 0.196 Dom. Republic 0.41 0.497 0.29 0.869 -0.16 0.827 Mexico 0.70 0.008*** 0.32 0.139 0.28 0.121 Paraguay 0.89 0.000*** 0.79 0.003*** 1.13 0.000*** Peru 0.69 0.000*** -0.32 0.000*** -0.15 0.000*** Uruguay 0.40* 0.042** 0.33 0.183 0.49 0.000***
Notes: The OLS estimates of the slope coefficient in equation (3) are reported in column β . Newey-West standard errors are used to determine the significance level. The column called χ2 reports the p-values for the χ2 statistics for the joint null hypothesis that α=0 and β=1 in Equation (3). *, **, and *** indicate significance at the 10, 5, and 1% significance level, respectively.
27

Table 8. Tests of Orthogonality: httte
ththt ussss +−++ +−+=− )( 1, βα (FX4casts Data)
h=3 h=6 h=12 β χ2 β χ2 β χ2
A. Major currencies Australia 0.23 0.350 0.28 0.242 0.13 0.852 Canada 0.12 0.543 0.07 0.811 0.01 0.990 Denmark 0.10 0.221 -0.00 0.644 0.01 0.923 Euro Area 0.19** 0.023** 0.14 0.114 0.25 0.181 Japan 0.25** 0.004*** -0.17 0.006*** 0.33 0.009*** New Zealand 0.35** 0.128 0.35 0.275 0.24 0.827 Norway 0.10 0.432 0.05 0.787 -0.17 0.726 Sweden 0.17 0.267 0.03 0.980 -0.07 0.887 Switzerland 0.04 0.188 -0.12 0.259 0.02 0.502 U.K. 0.16 0.089* -0.05 0.487 -0.22 0.387
B. Minor Currencies Algeria -0.05 0.923 -0.05 0.990 -0.63 0.347 Argentina 0.86*** 0.000*** 0.75*** 0.003*** 0.25 0.432 Bangladesh -0.08 0.887 0.20 0.403 -0.39 0.185 Bolivia 0.17 0.088* 0.67 0.025** 0.34 0.026 Brazil 0.32 0.126 0.18 0.449 -0.47* 0.031** Chile 0.07 0.482 0.01 0.719 -0.42** 0.011** China 0.39 0.202 0.38 0.571 0.08 0.844 Colombia 0.02 0.787 0.08 0.549 -0.42 0.043** Croatia 0.10 0.644 -0.04 0.763 -0.71*** 0.000*** Czech Republic 0.14 0.063* 0.03 0.223 -0.43** 0.006*** Egypt 0.09 0.102 -0.05 0.625 -0.69 0.267 Hong Kong -0.16 0.194 -0.11 0.254 -0.13 0.287 Hungary 0.15 0.419 0.04 0.763 -0.47** 0.055* India 0.11 0.512 0.35 0.210 0.31 0.254 Indonesia 0.01 0.878 -0.04 0.712 -0.33 0.357 Israel 0.06 0.771 0.30 0.145 -0.57* 0.097* Jamaica 0.49 0.254 0.63 0.275 0.23 0.159 Kenya 0.19 0.698 -0.08 0.932 -0.70*** 0.008*** Mexico 0.27 0.619 -0.09 0.664 -0.25 0.533 Nigeria 0.26** 0.072* 0.27* 0.121 -0.04 0.980 Pakistan 0.55 0.225 0.92* 0.204 0.49 0.151 Paraguay 0.33** 0.060* -0.10 0.651 -0.67 0.160 Peru 0.01 0.577 0.36 0.482 -0.88* 0.000*** Philippines 0.13 0.399 0.17 0.449 0.05 0.691 Poland 0.28 0.239 0.10 0.748 -0.55** 0.010*** Romania 0.19 0.607 0.16 0.733 -0.51** 0.119 Russia 0.23 0.445 0.19 0.607 -0.34* 0.168 Serbia 0.27** 0.091* 0.20 0.657 -0.69** 0.031** Singapore 0.07 0.361 -0.13 0.619 -0.55** 0.002*** South Africa 0.12 0.273 -0.21 0.387 0.02 0.336 South Korea 0.09 0.914 -0.04 0.657 -0.35 0.055* Taiwan 0.18 0.638 -0.13 0.482 -0.67 0.027** Thailand 0.10 0.387 -0.06 0.577 0.01 0.595 Turkey 0.07 0.670 -0.13 0.391 -0.20 0.391 Uruguay 0.37* 0.087 0.35 0.214 -0.70* 0.051* Vietnam -0.08 0.307 0.52* 0.000*** 0.18 0.468
Notes: See notes to Table 7.
28

Table 9. Tests of Predictive Accuracy: Consensus Economics Data h=3 h=12 h=24
MSPE Ratio
DMW MSPE Ratio
DMW MSPE Ratio
DMW
A. Major currencies Australia 1.169 -4.532 1.033 -0.999 1.011 -0.334 Canada 1.219 -3.377 0.971 0.549 1.073 -1.338 Denmark 1.152 -2.118 1.141 -1.923 0.909 1.183 Euro Area 1.244 -3.192 1.126 -1.445 0.867 1.350* Japan 1.255 -4.730 1.361 -5.886 0.971 0.443 New Zealand 1.119 -3.984 1.024 -0.937 0.966 1.188 Norway 1.156 -2.295 0.958 0.604 0.974 0.319 Sweden 1.142 -1.883 0.928 0.915 0.927 0.733 Switzerland 1.218 -3.014 1.221 -3.394 0.946 0.839 U.K. 1.029 -0.567 0.799 3.353*** 0.784 5.175***
B. Minor Currencies Bangladesh 1.496 -4.435 0.692 4.033*** 0.302 10.430*** Egypt 0.997 0.022 0.720 2.854*** 0.645 5.176*** Hong Kong 1.576 -3.538 1.408 -2.418 0.825 1.120 India 1.112 -1.325 1.036 -0.655 0.855 2.054** Indonesia 1.079 -1.610 0.975 1.206 0.888 4.991*** Israel 1.033 -0.377 0.883 1.669** 1.066 -0.921 Nigeria 1.405 -2.379 1.369 -2.894 2.669 -6.574 Pakistan 1.075 -0.653 0.605 5.387*** 0.481 8.069*** Philippines 1.053 -0.916 1.024 -0.622 0.916 3.129*** Singapore 1.233 -3.649 1.149 -3.100 1.051 -0.878 South Africa 1.255 -4.431 1.054 -1.097 0.861 2.843*** South Korea 1.011 -0.290 1.032 -0.929 1.085 -2.193 Sri Lanka 1.021 -0.198 0.570 7.374*** 0.318 9.955*** Taiwan 1.238 -4.121 1.136 -2.820 1.155 -2.836 Thailand 1.000 -0.005 1.028 -0.984 0.987 0.569 Vietnam 1.061 -0.199 0.731 2.981*** 0.685 5.008*** Argentina 0.642 1.236 2.073 -2.021 2.615 -2.588 Bolivia 1.584 -3.483 1.202 -1.647 1.696 -4.030 Brazil 1.120 -1.656 1.084 -1.435 1.644 -6.575 Chile 0.972 0.621 0.958 0.813 1.122 -2.314 Colombia 1.249 -2.782 1.150 -1.536 1.629 -5.883 Costa Rica 1.397 -1.994 0.948 0.352 0.808 1.339* Dom. Republic 0.996 0.034 0.937 0.944 0.912 1.830** Mexico 1.100 -0.978 0.831 2.878*** 0.677 4.219*** Paraguay 1.204 -1.600 1.148 -1.508 1.615 -4.923 Peru 1.511 -3.023 1.404 -5.493 1.742 -8.176 Uruguay 0.883 0.686 0.838 1.767** 0.941 0.503
Notes: The table reports the ratio of the out-of-sample MSPE’s of survey forecasts to that of the random walk model without drift and the DMW statistics for the test of equal predictability between the two models. The MSPE Ratio below 1 indicates that the MSPE of survey forecasts is lower than that of the random walk. Significant test statistics indicates rejection of the null of no predictability. *, **, and *** indicate significance at the 10, 5, and 1% significance level respectively.
29

Table 10. Tests of Predictive Accuracy: FX4casts Data h=3 h=6 h=12
MSPE Ratio
DMW
MSPE Ratio
DMW
MSPE Ratio
DMW
A. Major currencies Australia 1.108 -3.116 1.136 -3.195 1.129 -2.107 Canada 1.065 -1.816 1.052 -1.391 0.947 1.143 Denmark 1.205 -4.215 1.352 -5.417 1.304 -3.836 Euro Area 1.178 -1.442 1.197 -2.489 1.055 -1.253 Japan 1.171 -3.361 1.315 -4.999 1.457 -6.548 New Zealand 1.134 -2.675 1.116 -2.379 1.123 -2.142 Norway 1.129 -3.190 1.223 -3.942 1.119 -1.798 Sweden 1.077 -1.402 1.153 -2.708 1.111 -1.528 Switzerland 1.195 -3.842 1.343 -5.196 1.327 -4.358 U.K. 1.166 -2.955 1.243 -3.231 1.061 -0.728
B. Minor Currencies Algeria 1.022 -0.408 1.102 -1.381 1.358 -3.823 Argentina 0.849 1.440* 0.926 0.866 1.007 -0.074 Bangladesh 1.178 -0.540 0.868 1.010 0.754 1.857** Bolivia 0.899 1.668** 0.925 1.023 0.861 1.646** Brazil 1.039 -0.923 1.086 -2.284 1.152 -3.074 Chile 0.967 0.989 1.026 -0.541 1.092 -1.505 China 0.628 3.590*** 0.539 3.810*** 0.473 4.606*** Colombia 1.002 -0.064 0.997 0.073 1.042 -0.663 Croatia 0.986 0.393 1.016 -0.338 0.874 1.901** Czech Republic 1.068 -1.650 0.999 0.026 0.864 2.797*** Egypt 1.081 -1.084 1.298 -2.371 1.558 -2.592 Hong Kong 1.027 -0.326 1.154 -1.933 1.255 -2.887 Hungary 1.030 -0.815 1.007 -0.169 0.838 3.423*** India 1.066 -1.834 1.156 -3.576 1.268 -4.890 Indonesia 1.074 -2.248 1.107 -2.372 1.165 -2.669 Israel 1.082 -2.505 1.154 -3.355 1.334 -6.104 Jamaica 0.903 1.531* 0.920 1.522* 0.802 2.637*** Kenya 1.029 -0.636 1.038 -0.636 1.082 -0.900 Mexico 1.070 -1.122 0.978 0.611 0.879 2.588*** Nigeria 1.083 -1.209 1.182 -2.525 1.262 -4.066 Pakistan 0.869 3.080*** 0.808 3.883*** 0.745 4.573*** Paraguay 0.999 0.027 1.037 -0.911 1.117 -2.217 Peru 1.011 -0.284 1.013 -0.229 1.186 -2.110 Philippines 0.988 0.231 0.984 0.262 1.055 -0.746 Poland 1.045 -0.989 0.986 0.389 0.849 3.321*** Romania 1.010 -0.201 0.920 1.723** 0.808 4.285*** Russia 1.008 -0.184 1.006 -0.131 1.028 -0.459 Serbia 0.983 0.421 0.973 0.720 0.956 0.849 Singapore 1.078 -1.269 0.953 0.666 0.773 3.061*** South Africa 1.094 -1.659 1.281 -2.290 1.489 -3.401 South Korea 1.080 -2.180 1.088 -2.193 1.072 -1.591 Taiwan 1.101 -1.879 1.265 -3.113 1.172 -1.467 Thailand 1.237 -3.418 1.104 -1.670 0.969 0.511 Turkey 1.379 -1.869 1.463 -1.519 1.775 -2.518 Uruguay 1.086 -2.377 1.211 -4.169 1.386 -5.257 Vietnam 0.836 2.082** 0.717 3.361*** 0.569 5.453***
Notes: See notes to Table 9.
30

Table 11. Tests of Directional Accuracy: Consensus Economics Data
h=3 h=12 h=24
PCS PT PCS PT PCS PT A. Major currencies
Australia 0.418 0.005*** 0.508 0.778 0.482 0.615 Canada 0.446 0.006*** 0.487 0.543 0.425 0.007*** Denmark 0.502 0.938 0.596 0.003*** 0.596 0.006*** Euro Area 0.461 0.218 0.622 0.004*** 0.639 0.002*** Japan 0.425 0.015** 0.367 0.000*** 0.497 0.325 New Zealand 0.421 0.010*** 0.542 0.171 0.539 0.310 Norway 0.494 0.743 0.588 0.006*** 0.549 0.169 Sweden 0.510 0.949 0.592 0.003*** 0.622 0.000*** Switzerland 0.482 0.590 0.533 0.274 0.508 0.784 U.K. 0.550 0.079* 0.588 0.002*** 0.591 0.000***
B. Minor Currencies Bangladesh 0.650 0.662 0.883 0.621 0.938 - Egypt 0.558 0.439 0.620 0.407 0.616 - Hong Kong 0.517 0.415 0.602 0.000*** 0.694 0.000*** India 0.523 0.642 0.654 0.000*** 0.617 0.413 Indonesia 0.586 0.027** 0.673 0.000*** 0.653 0.000*** Israel 0.477 0.551 0.583 0.002*** 0.550 0.024** Nigeria 0.521 0.599 0.622 0.449 0.701 0.691 Pakistan 0.668 0.171 0.863 - 0.886 - Philippines 0.472 0.233 0.561 0.126 0.585 0.319 Singapore 0.479 0.080* 0.520 0.008*** 0.591 0.800 South Africa 0.513 0.785 0.619 0.753 0.720 0.001*** South Korea 0.505 0.887 0.572 0.045** 0.508 0.774 Sri Lanka 0.743 0.008*** 0.790 0.014** 0.917 0.770 Taiwan 0.484 0.435 0.492 0.712 0.518 - Thailand 0.433 0.016** 0.378 0.000*** 0.549 0.997 Vietnam 0.804 0.022** 0.888 0.453 0.979 - Argentina 0.695 0.115 0.782 0.804 0.822 0.035 Bolivia 0.355 0.760 0.372 0.464 0.393 0.179 Brazil 0.522 0.158 0.450 0.449 0.436 0.160 Chile 0.587 0.014** 0.512 0.073* 0.410 0.031** Colombia 0.464 0.774 0.411 0.347 0.308 0.269 Costa Rica 0.710 0.091* 0.713 0.530 0.709 - Dom. Republic 0.739 0.362 0.853 - 0.855 0.688 Mexico 0.522 0.417 0.628 0.021** 0.667 0.042** Paraguay 0.471 0.550 0.434 0.224 0.274 - Peru 0.406 0.400 0.411 0.893 0.239 0.456 Uruguay 0.464 0.638 0.465 0.559 0.256 -
Notes: The table reports the ratio of the proportion of forecasts that have correct sign and the Pesaran and Timmermann (1992) statistics for the test of directional accuracy of the forecasts. Significant test statistics indicates rejection of the null. *, **, and *** indicate significance at the 10, 5, and 1% significance level respectively.
31

Table 12. Tests of Directional Accuracy: FX4casts Data h=3 h=6 h=12 PCS PT PCS PT PCS PT
A. Major currencies Australia 0.491 0.437 0.533 0.632 0.580 0.066* Canada 0.502 0.736 0.496 0.762 0.576 0.010*** Denmark 0.513 0.562 0.522 0.379 0.561 0.039** Euro Area 0.542 0.183 0.548 0.199 0.602 0.002*** Japan 0.476 0.573 0.456 0.203 0.386 0.037** New Zealand 0.513 0.832 0.565 0.364 0.548 0.587 Norway 0.531 0.315 0.485 0.541 0.625 0.000*** Sweden 0.465 0.197 0.478 0.350 0.568 0.026** Switzerland 0.491 0.858 0.522 0.404 0.530 0.191 U.K. 0.505 0.797 0.493 0.742 0.602 0.000***
B. Minor Currencies Algeria 0.509 0.722 0.534 0.548 0.433 0.145 Argentina 0.598 0.912 0.612 0.346 0.675 0.478 Bangladesh 0.623 0.879 0.670 0.188 0.784 0.933 Bolivia 0.415 0.001*** 0.456 0.083* 0.443 0.070* Brazil 0.462 0.691 0.403 0.145 0.423 0.584 Chile 0.530 0.626 0.558 0.481 0.642 0.010*** China 0.500 0.000*** 0.558 0.000*** 0.691 0.000*** Colombia 0.583 0.090* 0.543 0.706 0.602 0.120 Croatia 0.528 0.452 0.583 0.036** 0.660 0.000*** Czech Republic 0.492 0.740 0.605 0.046** 0.724 0.000*** Egypt 0.708 0.000*** 0.728 0.000*** 0.691 0.000*** Hong Kong 0.045 0.000*** 0.062 0.000*** 0.065 0.000*** Hungary 0.462 0.391 0.496 0.798 0.707 0.000*** India 0.492 0.217 0.457 0.008*** 0.439 0.001*** Indonesia 0.492 0.306 0.465 0.027** 0.472 0.042** Israel 0.415 0.064* 0.388 0.028** 0.227 0.000*** Jamaica 0.654 0.733 0.693 0.067* 0.674 0.056* Kenya 0.575 0.147 0.621 0.003*** 0.567 0.031* Mexico 0.538 0.274 0.581 0.048** 0.618 0.008*** Nigeria 0.509 0.282 0.573 0.055* 0.608 0.015** Pakistan 0.660 0.391 0.709 0.082* 0.825 0.539 Paraguay 0.547 0.795 0.515 0.250 0.474 0.051* Peru 0.619 0.271 0.667 0.709 0.604 0.469 Philippines 0.560 0.471 0.602 0.369 0.598 0.949 Poland 0.485 0.593 0.605 0.039** 0.740 0.000*** Romania 0.585 0.087* 0.573 0.132 0.711 0.000*** Russia 0.538 0.446 0.605 0.008*** 0.618 0.000*** Serbia 0.531 0.330 0.537 0.168 0.596 0.032** Singapore 0.417 0.000*** 0.628 0.000*** 0.740 0.001*** South Africa 0.462 0.407 0.426 0.553 0.463 0.392 South Korea 0.545 0.588 0.543 0.023** 0.650 0.053* Taiwan 0.538 0.147 0.550 0.001*** 0.577 0.048** Thailand 0.439 0.028** 0.481 0.132 0.545 0.761 Turkey 0.379 0.143 0.434 0.130 0.545 0.366 Uruguay 0.547 0.190 0.388 0.000*** 0.433 0.000*** Vietnam 0.726 0.613 0.806 0.083* 0.876 0.717
Notes: See notes to Table 11.
32

Table 13. Summary of the Results
Consensus Economics Data FX4casts Data h=3 h=12 h=24 h=3 h=6 h=12
A. Major Currencies Rationality Tests Unbiasedness Test 10 3 1 10 10 5 Orthogonality Test 1 5 2 5 5 1 2 Orthogonality Test 2 8 4 4 3 1 1 Predictive Accuracy Tests MSPE Ratio<1 0 4 8 0 0 1 DMW Test 0 1 2 0 0 0 PCS>0.5 3 8 7 6 5 9 PT Test 5 6 5 0 0 8 Number of countries 10 10 10 10 10 10
B. Minor Currencies Rationality Tests Unbiasedness Test 23 14 16 23 24 23 Orthogonality Test 1 17 11 16 4 17 21 Orthogonality Test 2 21 13 15 6 3 15 Predictive Accuracy Tests MSPE Ratio<1 5 12 15 11 15 15 DMW Test 0 8 12 6 5 13 PCS>0.50 17 19 20 23 24 26 PT Test 7 10 6 9 21 24 Number of countries 27 27 27 36 36 36
Notes: The first three rows in Panels A and B report the number of significant χ2 statistics (at the 10% significance level or higher) for the joint null of unbiasedness and orthogonality. “Orthogonality Test 1” and “Orthogonality Test 2” denote the tests of orthogonality of the forecast errors to lagged forecast errors and lagged actual exchange rate depreciation, respectively. The last five rows in Panels A and B report the number MSPE ratio less than one, the number of significant DMW statistics, the number of proportions of correctly signed forecasts above 0.50, the number of significant PT statistics (at the 10% significance level or higher), and the overall number of countries in each group and each dataset. In Panel A, all the cells have 10 possible rejections. In Panel B, all the cells for Consensus Economics Data have 27 possible rejections, and all the cells for FX4casts data have 36 possible rejections.
33

Appendix A. List of Countries in Consensus Economics Dataset
Forecast horizon, h = 3, 12
h = 24 Country Exchange Rate
Sample Period N Sample
N
A. Major Currencies 1. Australia Free floating 01/1990 – 12/2012 276 12/1994 – 12/2012 217 2. Canada Free floating 01/1992 – 12/2012 252 12/1994 – 12/2012 217 3. Denmark Free floating 01/1992 – 12/2012 252 12/1994 – 12/2012 217 4. Euro Area Free floating 01/1999 – 12/2012 168 01/1999 – 12/2012 168 5. Japan Free floating 01/1990 – 12/2012 276 12/1994 – 12/2012 217 6. New Zealand Free floating 01/1990 – 12/2012 276 12/1994 – 12/2012 217 7. Norway Free floating 01/1992 – 12/2012 252 12/1994 – 12/2012 217 8. Sweden Free floating 01/1992 – 12/2012 252 12/1994 – 12/2012 217 9. Switzerland Free floating 01/1992 – 12/2012 252 12/1994 – 12/2012 217 10. UK Free floating 01/1992 – 12/2012 252 12/1994 – 12/2012 217
B. Minor Currencies 1. Argentina Crawl-like arr. 02/2002 – 12/2012 131 02/2002 – 12/2012 131 2. Bangladesh Other managed arr. 12/1994 – 12/2012 217 12/1994 – 12/2012 217 3. Bolivia Stabilized arr. 12/1994 – 12/2012 217 12/1994 – 12/2012 217 4. Brazil Floating 12/1994 – 12/2012 217 12/1994 – 12/2012 217 5. Chile Free floating 12/1994 – 12/2012 217 12/1994 – 12/2012 217 6. Colombia Floating 12/1994 – 12/2012 217 12/1994 – 12/2012 217 7. Costa Rica Stabilized arr. 12/1994 – 12/2012 217 12/1994 – 12/2012 217 8. Dominican Rep. Crawl-like arr. 12/1994 – 12/2012 217 12/1994 – 12/2012 217 9. Egypt Crawl-like arr. 06/1998 – 12/2012 175 06/1998 – 12/2012 175 10. Hong Kong Currency board 11/1990 – 12/2012 266 12/1994 – 12/2012 217 11. India Floating 12/1994 – 12/2012 217 12/1994 – 12/2012 217 12. Indonesia Crawl-like arr. 11/1990 – 12/2012 266 12/1994 – 12/2012 217 13. Israel Free floating 06/1998 – 12/2012 175 06/1998 – 12/2012 175 14. Mexico Free floating 04/2001 – 12/2012 141 04/2001 – 12/2012 141 15. Nigeria Other managed arr. 01/1999 – 12/2012 168 01/1999 – 12/2012 168 16. Pakistan Floating 12/1994 – 12/2012 217 12/1994 – 12/2012 217 17. Paraguay Other managed arr. 12/1994 – 12/2012 217 12/1994 – 12/2012 217 18. Peru Floating 04/2001 – 12/2012 141 04/2001 – 12/2012 141 19. Philippines Floating 12/1994 – 12/2012 217 12/1994 – 12/2012 217 20. Singapore Crawl-like arr. 11/1990 – 12/2012 266 12/1994 – 12/2012 217 21. South Africa Floating 06/1993 – 12/2012 235 12/1994 – 12/2012 217 22. South Korea Floating 01/1990 – 12/2012 276 12/1994 – 12/2012 217 23. Sri Lanka Floating 12/1994 – 12/2012 217 12/1994 – 12/2012 217 24. Taiwan Free floating 11/1990 – 12/2012 266 12/1994 – 12/2012 217 25. Thailand Floating 11/1990 – 12/2012 266 12/1994 – 12/2012 217
26. Uruguay Floating 12/1994 – 12/2012 217 12/1994 – 12/2012 217 27. Vietnam Stabilized arr. 12/1994 – 12/2012 217 12/1994 – 12/2012 217 Note: Information on exchange rate regime was obtained from the International Monetary Fund Annual Report on Exchange Arrangements and Exchange Restrictions 2013, https://www.imf.org/external/pubs/nft/2013/areaers/ar2013.pdf.
34

Appendix B. List of Countries in FX4Casts Dataset Forecast horizon h = 3, 6, 12
Country Exchange Rate Regime Sample Period N
A. Major Currencies 1. Australia Free floating 01/1990 – 09/2012 273 2. Canada Free floating 01/1990 – 09/2012 273 3. Denmark Free floating 01/1990 – 09/2012 273 4. Euro Area Free floating 01/1990 – 09/2012 273 5. Japan Free floating 01/1990 – 09/2012 273 6. New Zealand Floating 12/1993 – 09/2012 226 7. Norway Free floating 01/1990 – 09/2012 273 8. Sweden Free floating 01/1990 – 09/2012 273 9. Switzerland Other managed arrangement 01/1990 – 09/2012 273 10. UK Free floating 01/1992 – 12/2012 252
B. Minor Currencies 1. Algeria Other managed arrangement 12/2003 – 12/2012 109 2. Argentina Crawl-like arrangement 10/2001 – 12/2012 132 3. Bangladesh Other managed arrangement 12/2003 – 12/2012 109 4. Bolivia Stabilized arrangement 12/2003 – 12/2012 109 5. Brazil Floating 10/2001 – 12/2012 132 6. Chile Free floating 10/2001 – 12/2012 132 7. China Crawl-like arrangement 10/2001 – 12/2012 132 8. Croatia Crawl-like arrangement 12/2003 – 12/2012 109 9. Colombia Floating 10/2001 – 12/2012 132 10 Czech Republic Free floating 10/2001 – 12/2012 132 11. Egypt Crawl-like arrangement 12/2003 – 12/2012 109 12. Hong Kong Currency board 10/2001 – 12/2012 132 13. Hungary Floating 10/2001 – 12/2012 132 14. India Floating 10/2001 – 12/2012 132 15. Indonesia Crawl-like arrangement 10/2001 – 12/2012 132 16. Israel Free floating 12/2003 – 12/2012 109 17. Jamaica Crawl-like arrangement 02/2004 – 12/2012 107 18. Kenya Floating 12/2003 – 12/2012 109 19. Mexico Free floating 10/2001 – 12/2012 132 20. Nigeria Other managed arrangement 12/2003 – 12/2012 109 21. Pakistan Floating 12/2003 – 12/2012 109 22. Paraguay Other managed arrangement 12/2003 – 12/2012 109 23. Peru Floating 01/2004 – 12/2012 108 24. Philippines Floating 01/2003 – 12/2012 119 25. Poland Free floating 10/2001 – 12/2012 132 26. Romania Floating 12/2003 – 12/2012 109 27. Russia Other managed arrangement 10/2001 – 12/2012 132 28. Serbia Floating 08/2004 – 12/2012 101 29. Singapore Crawl-like arrangement 10/2001 – 12/2012 132 30. South Africa Floating 10/2001 – 12/2012 132 31. South Korea Floating 10/2001 – 12/2012 132 32. Taiwan Free floating 10/2001 – 12/2012 132 33. Thailand Floating 10/2001 – 12/2012 132 34. Turkey Floating 10/2001 – 12/2012 132 35. Uruguay Floating 12/2003 – 12/2012 109 36. Vietnam Stabilized arrangement 12/2003 – 12/2012 109
Note: Information on exchange rate regime was obtained from the International Monetary Fund Annual Report on Exchange Arrangements and Exchange Restrictions 2013, https://www.imf.org/external/pubs/nft/2013/areaers/ar2013.pdf.
35