How to Work with Excel Report and Interactive...
114
How-To Guide SAP Business One, version for SAP HANA Document Version: 1.4 – 2016-07-29 PUBLIC How to Work with Excel Report and Interactive Analysis SAP Business One 9.2 PL04 and Later, version for SAP HANA
Transcript of How to Work with Excel Report and Interactive...

How-To GuideSAP Business One, version for SAP HANADocument Version: 1.4 – 2016-07-29
PUBLIC
How to Work with Excel Report and InteractiveAnalysisSAP Business One 9.2 PL04 and Later, version for SAP HANA

2Public© 2016 SAP SE or an SAP affiliate company. All rights reserved.
How to Work with Excel Report and Interactive AnalysisTypographic Conventions
Typographic Conventions
Type Style Description
Example Words or characters quoted from the screen. These include field names, screen titles,pushbuttons labels, menu names, menu paths, and menu options.
Textual cross-references to other documents.
Example Emphasized words or expressions.
EXAMPLE Technical names of system objects. These include report names, program names,transaction codes, table names, and key concepts of a programming language when theyare surrounded by body text, for example, SELECT and INCLUDE.
Example Output on the screen. This includes file and directory names and their paths, messages,names of variables and parameters, source text, and names of installation, upgrade anddatabase tools.
Example Exact user entry. These are words or characters that you enter in the system exactly asthey appear in the documentation.
<Example> Variable user entry. Angle brackets indicate that you replace these words and characterswith appropriate entries to make entries in the system.
EXAMPLE Keys on the keyboard, for example, F2 or ENTER .

How to Work with Excel Report and Interactive AnalysisDocument History
PublicError! Reference source not found.© 2016 SAP SE or an SAP affiliate company. All rights reserved. 3
Document History
Version Date Change
1.0 2016-01-12 First version for the following versions:
· SAP Business One 9.1 PL10 and later
· SAP Business One 9.2 PL00 and later
· SAP Business One analytics 1.2 powered by SAP HANA and later
· SAP Business One 9.2 PL00, version for SAP HANA
1.1 2016-01-12 Guide updated for SAP Business One 9.2 PL01, version for SAP HANA.Changes mainly focus on the new feature of report parameters; for moreinformation, see Report Parameters and iaParam Function.
Guide version 1.0 still applies to SAP Business One 9.1 PL10 and later; SAPBusiness One 9.2 PL00 and later; SAP Business One analytics 1.2 poweredby SAP HANA and later; and SAP Business One 9.2 PL00, version for SAPHANA.
1.2 2016-02-26 Guide updated for SAP Business One 9.2 PL02, version for SAP HANA.Changes mainly focus on the new feature of looking up data sources in theSelect Data Source window. For more information, see Selecting the DataSource.
1.3 2016-04-27 Guide updated for SAP Business One 9.2 PL03, version for SAP HANA.Changes mainly focus on the following:
· The solution name was changed from Interactive Analysis 2.0 to ExcelReport and Interactive Analysis.
· Besides the Excel reports, which were previously known as interactiveanalysis reports, you can now design and manage pivot tables on theINTERACTIVE ANALYSIS tab of the Excel report and interactive analysisdesigner. For more information, see INTERACTIVE ANALYSIS Tab.
1.4 2016-07-29 Guide updated for SAP Business One 9.2 PL04, version for SAP HANA.Changes mainly focus on the new feature of time functions. For moreinformation, see Working with Time Functions.

4Public© 2016 SAP SE or an SAP affiliate company. All rights reserved.
How to Work with Excel Report and Interactive AnalysisContents
Contents
1 Introduction .............................................................................................................................. 5
2 Authorizations for Excel Report and Interactive Analysis.................................................... 6
3 Launching the Excel Report and Interactive Analysis Designer............................................8
4 Logging on to a Company ....................................................................................................... 9
5 EXCEL REPORT Tab ............................................................................................................... 105.1 Tab Overview........................................................................................................................................ 10
5.1.1 EXCEL REPORT Ribbon ...................................................................................................... 105.1.2 Formula Bar .......................................................................................................................... 125.1.3 Data Source Panel ................................................................................................................ 125.1.4 Worksheet ............................................................................................................................. 135.1.5 Group and Section Panel ..................................................................................................... 135.1.6 Message Panel...................................................................................................................... 13
5.2 Basic Operations...................................................................................................................................145.2.1 Creating the Excel Report.................................................................................................... 155.2.2 Saving the Report ................................................................................................................. 315.2.3 Viewing the Report Result ................................................................................................... 31
5.3 Advanced Operations .......................................................................................................................... 325.3.1 Working with Parameters ................................................................................................... 325.3.2 Working with Filters ............................................................................................................ 555.3.3 Working with Group, Details Group, and Field .................................................................. 595.3.4 Working with Functions ...................................................................................................... 805.3.5 Working with Calculations .................................................................................................. 865.3.6 Working with Time Functions ............................................................................................. 885.3.7 Managing Excel Reports ................................................................................................... 103
6 INTERACTIVE ANALYSIS Tab ............................................................................................ 1046.1 Tab Overview...................................................................................................................................... 104
6.1.1 INTERACTIVE ANALYSIS Ribbon .................................................................................... 1046.1.2 Formula Bar ....................................................................................................................... 1056.1.3 Worksheet .......................................................................................................................... 1056.1.4 Message Panel................................................................................................................... 105
6.2 Basic Operations................................................................................................................................ 1056.2.1 Creating the Pivot Table ................................................................................................... 1066.2.2 Saving the Pivot Table ........................................................................................................111
6.3 Managing Pivot Tables ........................................................................................................................111
7 Troubleshooting ....................................................................................................................112

How to Work with Excel Report and Interactive AnalysisIntroduction
Public© 2016 SAP SE or an SAP affiliate company. All rights reserved. 5
1 Introduction
Excel Report and Interactive Analysis is a solution that provides a report designer and predefined reports. In thereport designer, you can design and manage Excel reports and pivot tables on the EXCEL REPORT andINTERACTIVE ANALYSIS tabs, respectively. When you utilize its exclusive functions together with standardMicrosoft Excel features, the Excel report and interactive analysis designer enables you to create reports in anintuitive way based on semantic layers. In addition, by leveraging the SAP in-memory computing technology, itprovides real-time computing for your reports, giving you instantaneous access to your data.
This guide has been designed using Microsoft Windows 7 and Microsoft Excel 2010, and updated using MicrosoftWindows 7 and Microsoft Excel 2013. Screenshots may vary slightly if you are using a different platform or adifferent version of Microsoft Excel.
This guide assumes you are familiar with Microsoft Excel. If you are not familiar with Excel, refer to thedocumentation that came with Microsoft Excel for further explanation.
To work with Excel Report and Interactive Analysis, you must meet the following prerequisites.
· You have installed Microsoft Excel 2010 or 2013.
· You have installed the SAP HANA client on your workstation, and ensured that the bit-width of the clientmatches that of your Excel 2010 or 2013. That is, if Excel 2010 64-bit is installed, then the 64-bit SAP HANAclient must be installed. For more information about installing the SAP HANA client, see SAP HANA ClientInstallation and Update Guide at https://help.sap.com/hana_platform.
To check the bit-width of Excel 2010, go to the File ribbon, and select Help. The bit-width is indicated on theright-hand side, alongside the product version number. To check the bit-width of Excel 2013, go to the Fileribbon, select Account, and choose About Excel. The bit-width is indicated at the top of the window alongsidethe product version number.
· You have initialized the company database on the SAP HANA database server. For more information, look forSAP Business One Administrator's Guide, version for SAP HANA on sappartneredge.com.
For more information about prerequisites and authorizations for various user tasks, see Authorizations for ExcelReport and Interactive Analysis.
Note
If you are working with the Microsoft Analysis ToolPak add-in, the report designer cannot work properly.To work smoothly with the report designer, deactivate the analysis add-in.
NoteFor more information about installing Excel Report and Interactive Analysis, its post-requisites, and itstroubleshooting, look for SAP Business One Administrator's Guide, version for SAP HANA onsappartneredge.com.
6Public© 2016 SAP SE or an SAP affiliate company. All rights reserved.
How to Work with Excel Report and Interactive AnalysisAuthorizations for Excel Report and Interactive Analysis
2 Authorizations for Excel Report andInteractive Analysis
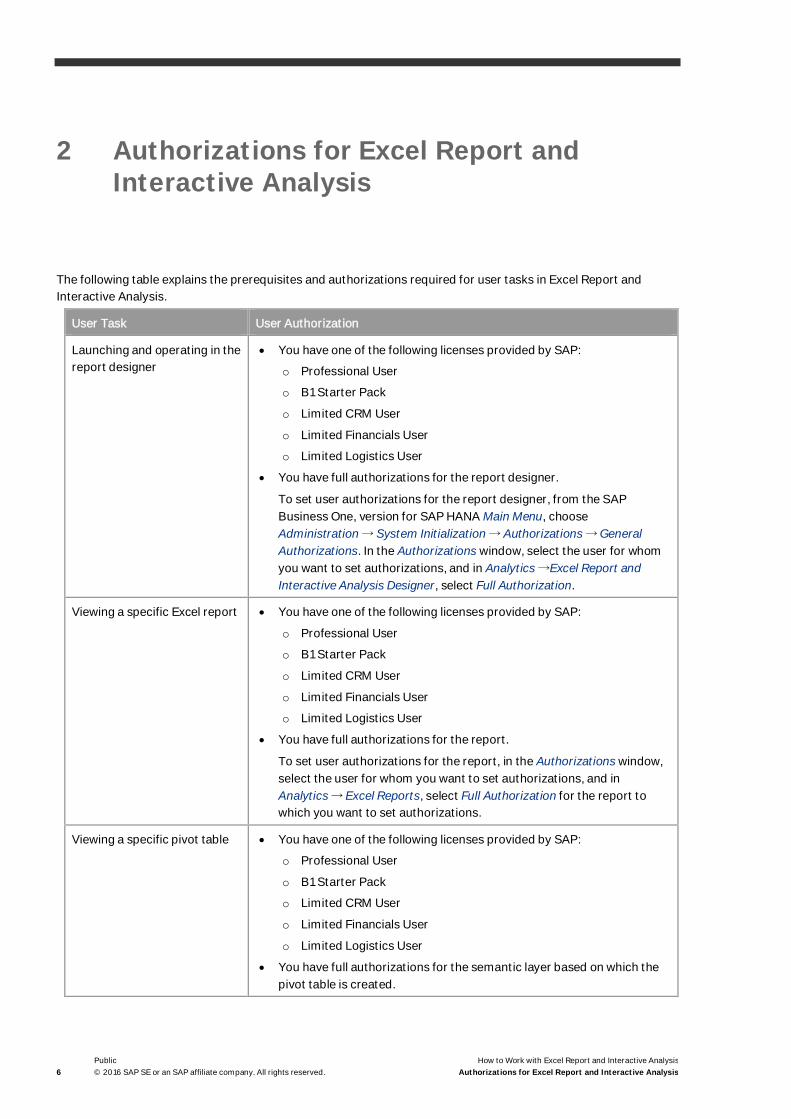
The following table explains the prerequisites and authorizations required for user tasks in Excel Report andInteractive Analysis.
User Task User Authorization
Launching and operating in thereport designer
· You have one of the following licenses provided by SAP:
o Professional User
o B1 Starter Pack
o Limited CRM User
o Limited Financials User
o Limited Logistics User
· You have full authorizations for the report designer.
To set user authorizations for the report designer, from the SAPBusiness One, version for SAP HANA Main Menu, chooseAdministration → System Initialization → Authorizations → GeneralAuthorizations. In the Authorizations window, select the user for whomyou want to set authorizations, and in Analytics →Excel Report andInteractive Analysis Designer, select Full Authorization.
Viewing a specific Excel report · You have one of the following licenses provided by SAP:
o Professional User
o B1 Starter Pack
o Limited CRM User
o Limited Financials User
o Limited Logistics User
· You have full authorizations for the report.
To set user authorizations for the report, in the Authorizations window,select the user for whom you want to set authorizations, and inAnalytics → Excel Reports, select Full Authorization for the report towhich you want to set authorizations.
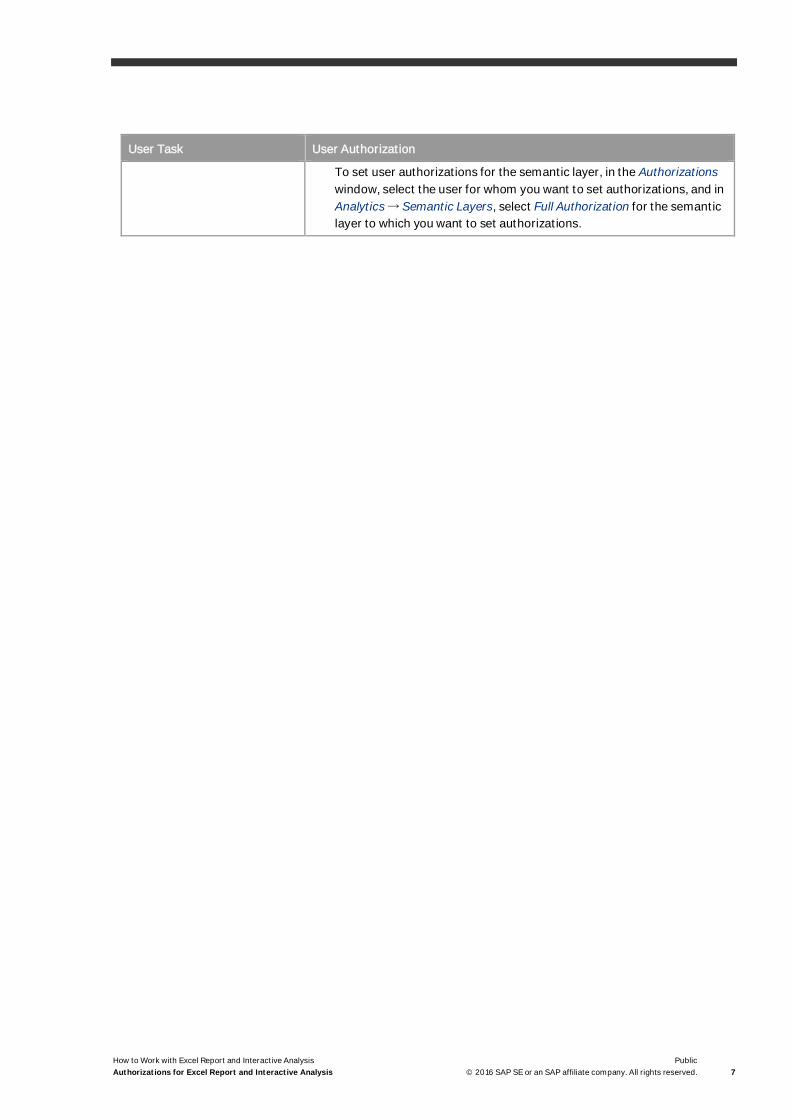
Viewing a specific pivot table · You have one of the following licenses provided by SAP:
o Professional User
o B1 Starter Pack
o Limited CRM User
o Limited Financials User
o Limited Logistics User
· You have full authorizations for the semantic layer based on which thepivot table is created.
How to Work with Excel Report and Interactive AnalysisAuthorizations for Excel Report and Interactive Analysis
Public© 2016 SAP SE or an SAP affiliate company. All rights reserved. 7
User Task User Authorization
To set user authorizations for the semantic layer, in the Authorizationswindow, select the user for whom you want to set authorizations, and inAnalytics → Semantic Layers, select Full Authorization for the semanticlayer to which you want to set authorizations.

8Public© 2016 SAP SE or an SAP affiliate company. All rights reserved.
How to Work with Excel Report and Interactive AnalysisLaunching the Excel Report and Interactive Analysis Designer
3 Launching the Excel Report and InteractiveAnalysis Designer
There are two ways of launching the report designer.
Procedure
You can launch the designer from the SAP Business One, version for SAP HANA client as follows:
1. In the SAP Business One, version for SAP HANA toolbar, choose Tools →Excel Report and Interactive AnalysisDesigner.
2. The designer opens in Microsoft Excel with the current SAP Business One, version for SAP HANA user loggedon. Select the EXCEL REPORT tab to view the EXCEL REPORT ribbon.
You can launch the designer from the Microsoft Windows Start menu as follows:
1. In the lower left corner of your screen, choose Start. Alternatively, press the Windows logo key on yourkeyboard.
The Start menu appears.
2. In the search box, enter SAP Business One Excel Report and Interactive Analysis, and in the listof results, click SAP Business One Excel Report and Interactive Analysis.
3. The designer opens in Microsoft Excel. Select the EXCEL REPORT tab to view the EXCEL REPORT ribbon.
How to Work with Excel Report and Interactive AnalysisLogging on to a Company
Public© 2016 SAP SE or an SAP affiliate company. All rights reserved. 9
4 Logging on to a Company
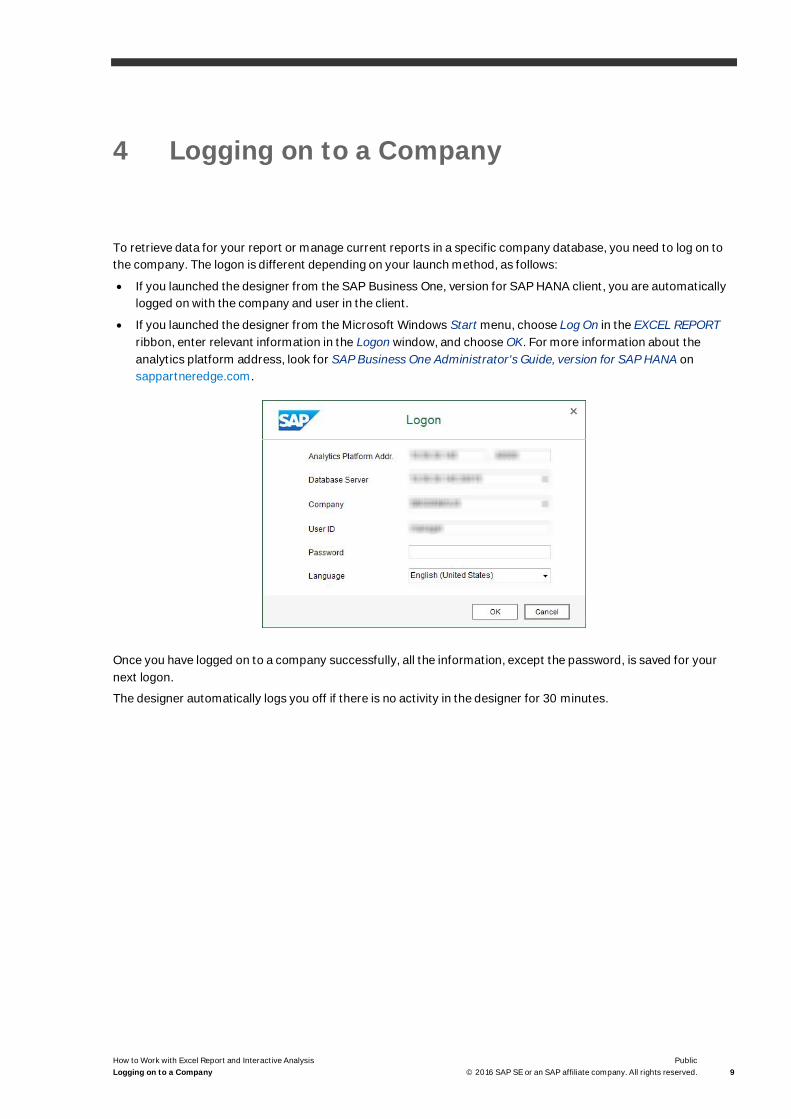
To retrieve data for your report or manage current reports in a specific company database, you need to log on tothe company. The logon is different depending on your launch method, as follows:
· If you launched the designer from the SAP Business One, version for SAP HANA client, you are automaticallylogged on with the company and user in the client.
· If you launched the designer from the Microsoft Windows Start menu, choose Log On in the EXCEL REPORTribbon, enter relevant information in the Logon window, and choose OK. For more information about theanalytics platform address, look for SAP Business One Administrator's Guide, version for SAP HANA onsappartneredge.com.
Once you have logged on to a company successfully, all the information, except the password, is saved for yournext logon.
The designer automatically logs you off if there is no activity in the designer for 30 minutes.

10Public© 2016 SAP SE or an SAP affiliate company. All rights reserved.
How to Work with Excel Report and Interactive AnalysisEXCEL REPORT Tab
5 EXCEL REPORT Tab
5.1 Tab Overview
This section introduces different parts of the main window of the EXCEL REPORT tab, and their respectivefunctions.
You can find the screenshot of the main window as follows, with the Inventory by Item Group per Warehousereport as an example:
5.1.1 EXCEL REPORT Ribbon
This section is section 1 in the overview screenshot. It contains the following commands:
· Log On (<User ID>): choose this command to log on to a specific company database. For more information,see Logging on to a Company.
· New Excel Report: choose this command to create a new Excel report. For more information, see Creating theExcel Report.
· Open Report: choose this command to open an existing report. For more information about predefinedreports, see Predefined Excel Reports.
· Save Report: choose this command to save changes to the current report.
· Save As Report: choose this command to save the report as a new one.
How to Work with Excel Report and Interactive AnalysisEXCEL REPORT Tab
Public© 2016 SAP SE or an SAP affiliate company. All rights reserved. 11
NoteYou cannot make changes to a predefined report, so use this command to save the changes to a newreport.
· Repository Management: choose this command to open the Repository Management window. For moreinformation, see Managing Excel Reports.
· Undo: choose this command to undo the most recent operation in the worksheet.
· Redo: choose this command to redo the most recent operation that you undid using the Undo command.
· Panel Options: choose this command to display or hide the data source panel, group and section panel, ormessage panel.
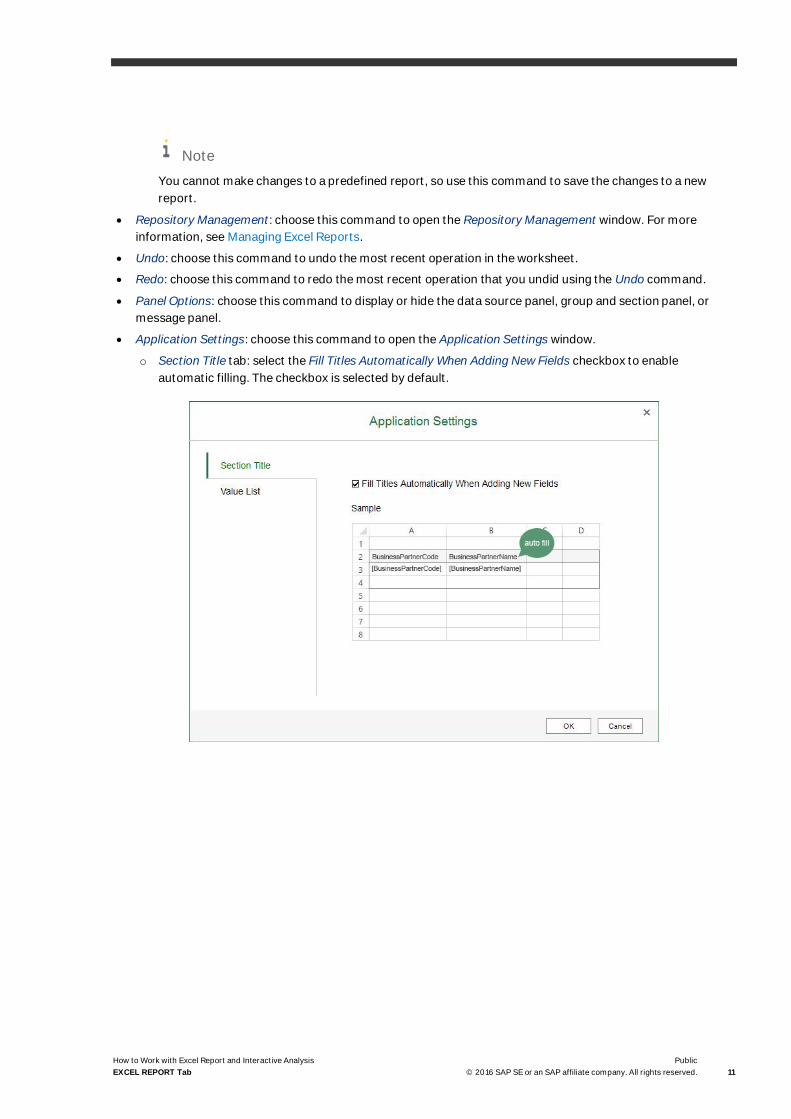
· Application Settings: choose this command to open the Application Settings window.
o Section Title tab: select the Fill Titles Automatically When Adding New Fields checkbox to enableautomatic filling. The checkbox is selected by default.

12Public© 2016 SAP SE or an SAP affiliate company. All rights reserved.
How to Work with Excel Report and Interactive AnalysisEXCEL REPORT Tab
o Value List tab: in the Max. Number of List Values field, specify the maximum number of values to bedisplayed in a value list. The default number is 100. Value lists are used in parameters and filters. Formore information, see Working with Parameters and Working with Filters.
· Restore Section Border: choose this button to restore what was the section border when you started yourreport. As the border can be customized using the regular Microsoft Excel border function, and you may notwant the customized border at a certain point, this button lets you restore the original section border.
· Run Report: choose this command to view the result of the report that you are designing. Every time you viewthe report result, Excel Report and Interactive Analysis retrieves data from the database, displaying real-timestatistics in the report.
· About: choose this command to view the copyrights and version of the report designer.
· Help: choose this command to open this guide.
5.1.2 Formula Bar
This section is section 2 in the overview screenshot. It displays the name and content of the cell you select in theworksheet. For more information about the formula bar, see the documentation that came with Microsoft Excel.
5.1.3 Data Source Panel
This section is section 3 in the overview screen shot. It displays the data source that you are currently workingwith. In this panel, you can change the data source parameter values, change the data source, use the quick

How to Work with Excel Report and Interactive AnalysisEXCEL REPORT Tab
Public© 2016 SAP SE or an SAP affiliate company. All rights reserved. 13
calculation methods, and manage report parameters. For more information, see Working with Parameters,Selecting the Data Source and Working with Calculations.
5.1.4 Worksheet
This section is section 4 in the overview screenshot. For more information about the worksheet, see thedocumentation that came with Microsoft Excel.
Note
Only one worksheet is supported.
5.1.5 Group and Section Panel
This section is section 5 in the overview screenshot. It displays the group information, and you can perform groupand section related operations in this section. For more information, see Working with Group, Details Group, andField.
5.1.6 Message Panel
This section is section 6 in the overview screenshot. It displays messages during your operation. Messages arecategorized as follows:
· DEBUG
· INFO
· WARN
· ERROR
· FATAL
One log file is generated every time you launch the Excel report and interactive analysis designer, containing themessages you encountered during operation.
To filter a certain message category in the log file, follow the procedure below:
1. In the installation path of SAP Business One, version for SAP HANA, you can find a folder called SAP BusinessOne Excel Report and Interactive Analysis. In the folder, open SAP.InteractiveAnalysis.dll.log4net.
2. In this file, you can find the attributes of the Excel Report and Interactive Analysis log file, including its type,name, location, and so on.
3. You can find the message category in the level value tag. The default category is ERROR. To change thecategory, enter one of the following in the level value tag:
o ALL: to display all categories in the log file
o DEBUG
o INFO
o WARN

14Public© 2016 SAP SE or an SAP affiliate company. All rights reserved.
How to Work with Excel Report and Interactive AnalysisEXCEL REPORT Tab
o ERROR
o FATAL
o OFF: to display no category in the log file
5.2 Basic Operations
This section provides an introduction to the EXCEL REPORT tab of the report designer as you create Excel reportInventory by Item Group per Warehouse. The report shows the in-stock quantity, cost price, and in-stock inventoryvalue of items for each item group in each warehouse.
The report in the worksheet looks like the following:
The report result looks like the following:

How to Work with Excel Report and Interactive AnalysisEXCEL REPORT Tab
Public© 2016 SAP SE or an SAP affiliate company. All rights reserved. 15
5.2.1 Creating the Excel Report
Use the blank workbook as a starting point for creating the Excel report.
CautionFor blank workbooks that are NOT opened using one of the two launching methods provided above, youmay encounter errors while using Excel Report and Interactive Analysis.
For example, you may encounter errors while using Excel Report and Interactive Analysis if you open ablank workbook from the New option on the File tab of Microsoft Excel as follows:
NoteThe order of the procedures in this section may vary based on the working preference of each person. Forexample, you may add fields before adding the groups, or add a child group for the ItemGroup groupinstead of adding a parent group for the ItemDescriptionAndCode group, as described below.

16Public© 2016 SAP SE or an SAP affiliate company. All rights reserved.
How to Work with Excel Report and Interactive AnalysisEXCEL REPORT Tab
5.2.1.1 Selecting the Data Source
Procedure
1. In the EXCEL REPORT ribbon, choose New Excel Report.
The Select Data Source window appears, displaying all the semantic layers in the SAP HANA model packagethat you have deployed.
The pre-defined model package was deployed during the database initialization, and for more informationabout customized SAP HANA model packages, see Managing SAP HANA Models in the online help of SAPBusiness One, version for SAP HANA.
How to Work with Excel Report and Interactive AnalysisEXCEL REPORT Tab
Public© 2016 SAP SE or an SAP affiliate company. All rights reserved. 17
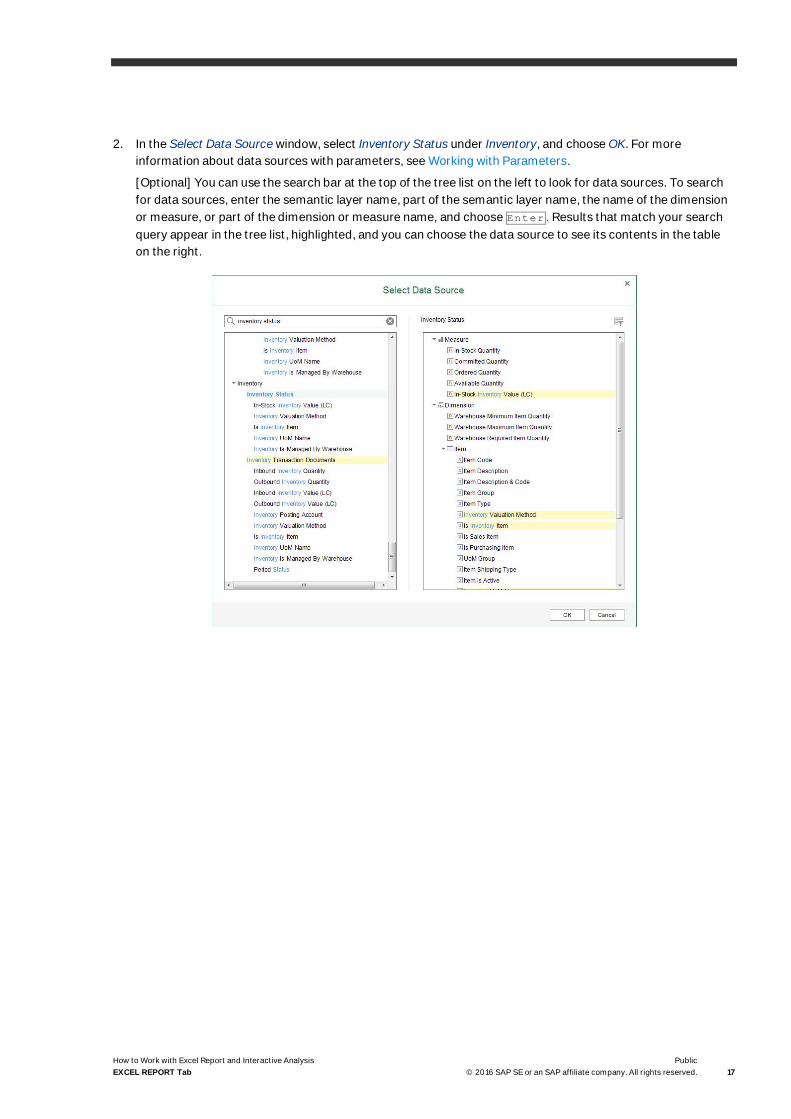
2. In the Select Data Source window, select Inventory Status under Inventory, and choose OK. For moreinformation about data sources with parameters, see Working with Parameters.
[Optional] You can use the search bar at the top of the tree list on the left to look for data sources. To searchfor data sources, enter the semantic layer name, part of the semantic layer name, the name of the dimensionor measure, or part of the dimension or measure name, and choose Enter . Results that match your searchquery appear in the tree list, highlighted, and you can choose the data source to see its contents in the tableon the right.

18Public© 2016 SAP SE or an SAP affiliate company. All rights reserved.
How to Work with Excel Report and Interactive AnalysisEXCEL REPORT Tab
The measures and dimensions appear in the data source panel.
o Number type is labeled with .
o String type is labeled with .
o Datetime type is labeled with .
o Date type is labeled with .

How to Work with Excel Report and Interactive AnalysisEXCEL REPORT Tab
Public© 2016 SAP SE or an SAP affiliate company. All rights reserved. 19
5.2.1.2 Adding the Item Group
As you need the in-stock inventory information of each item, you will add the item information that is grouped byitems to the report. For more information about the field types, see Working with Group, Details Group, and Field.
Procedure
1. Under Item, drag Item Description & Code to the worksheet. The New Section window appears.
2. In the New Section window, define the section size, select the Add as a Row Group radio button, and chooseOK.
Result
· In the worksheet, the title of this column is automatically filled. To disable the automatic filling, choose theApplication Settings command in the EXCEL REPORT ribbon. For more information, see EXCEL REPORTRibbon.
· In the worksheet, the section looks like the following:

20Public© 2016 SAP SE or an SAP affiliate company. All rights reserved.
How to Work with Excel Report and Interactive AnalysisEXCEL REPORT Tab
· In the Group and Section panel, you can find the position and information of this group as follows:
· In the EXCEL REPORT ribbon, choose Run Report.
The report result shows all the items in the database.

How to Work with Excel Report and Interactive AnalysisEXCEL REPORT Tab
Public© 2016 SAP SE or an SAP affiliate company. All rights reserved. 21
5.2.1.3 Adding a Parent Group
As you need to group the items by item groups, you will add a parent group to group the items by item groups.
Procedure
1. Insert a column before the Item Description & Code column to reserve a place for the item group column.
The section looks like the following:
2. Select the ItemDescriptionAndCode group using either of the following two methods:
o In the Group and Section panel, select the staple.
o In the worksheet, select the whole ItemDescriptionAndCode group row in the section or select the wholeExcel row as follows:
In the Group and Section panel, the staple is marked in green, indicating that the group has been selected.
3. In the Group and Section panel, choose Group → Add Parent Group.
The Add Parent Group window appears.

22Public© 2016 SAP SE or an SAP affiliate company. All rights reserved.
How to Work with Excel Report and Interactive AnalysisEXCEL REPORT Tab
4. In the Group By dropdown list, select Item Group, and choose OK.
Result
· In the worksheet, the section looks like the following:
· In the Group and Section panel, you can find the position and information of this parent group as follows:

How to Work with Excel Report and Interactive AnalysisEXCEL REPORT Tab
Public© 2016 SAP SE or an SAP affiliate company. All rights reserved. 23
· In the EXCEL REPORT ribbon, choose Run Report.
The report result shows all the items grouped by item groups.
5.2.1.4 Adding Fields and Calculated Values
As you need the in-stock inventory quantity, cost price, and in-stock inventory value of each item, you will add thein-stock inventory information as fields to the report. For more information about the field types, see Working withGroup, Details Group, and Field.
Procedure
1. Drag measures In-Stock Quantity and In-Stock Inventory Value (LC) from the data source panel to theworksheet as follows:
2. In the column between the In-Stock Quantity and In-Stock Inventory Value (LC) columns, enter the title for thecost price of each item as follows:
3. As the cost price is the in-stock inventory value divided by the in-stock quantity, in the cell under Cost Price,enter the formula:
=IF(iaCellRef(<name of the InStockQuantity cell>)=0,0,iaCellRef(<name of theInStockInventoryValueLC cell>)/iaCellRef(<name of the InStockQuantity cell>))
In the example, the name of the InStockQuantity cell is E7, and the name of the InStockInventoryValueLC cellis G7, so you will enter the following:

24Public© 2016 SAP SE or an SAP affiliate company. All rights reserved.
How to Work with Excel Report and Interactive AnalysisEXCEL REPORT Tab
=IF(iaCellRef(E7)=0,0,iaCellRef(G7)/iaCellRef(E7))
For more information about the functions, see Working with Functions.
Result
· In the worksheet, the section looks like the following:
· When you select the cell under Cost Price, the formula bar looks like the following:
· In the EXCEL REPORT ribbon, choose Run Report.
The report result shows the in-stock inventory quantity, cost price, and in-stock inventory value of each item;the items are grouped by item group.
How to Work with Excel Report and Interactive AnalysisEXCEL REPORT Tab
Public© 2016 SAP SE or an SAP affiliate company. All rights reserved. 25
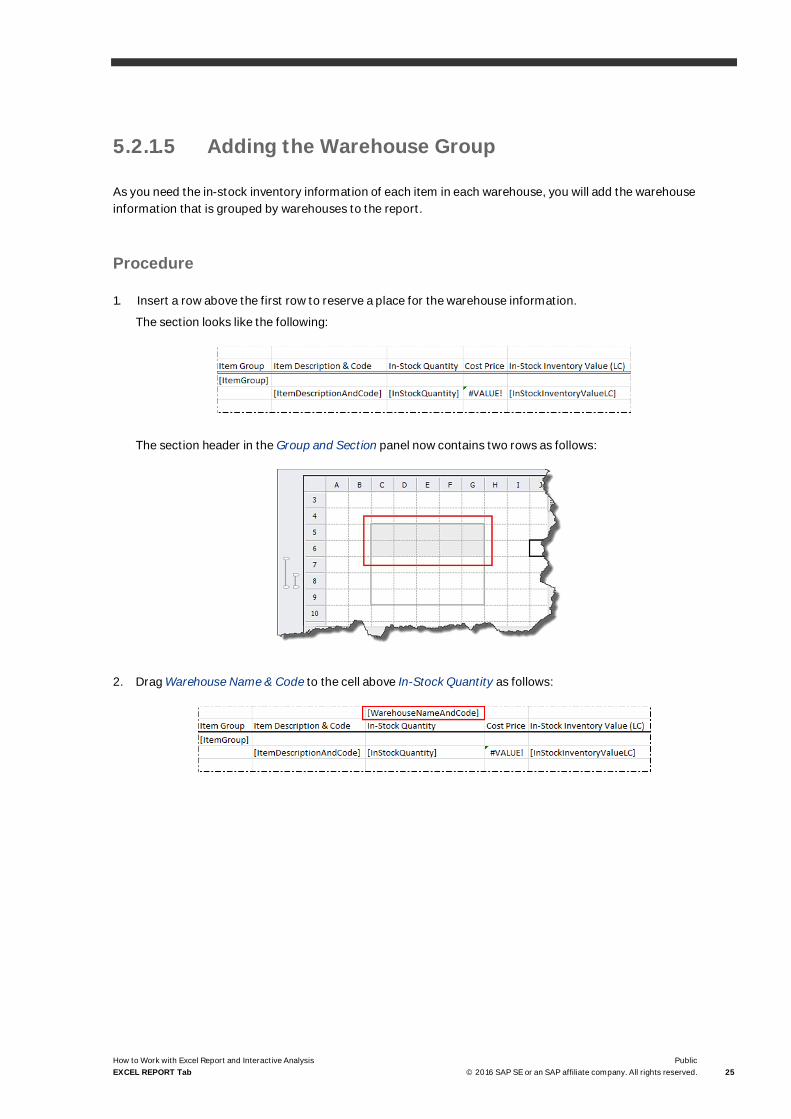
5.2.1.5 Adding the Warehouse Group
As you need the in-stock inventory information of each item in each warehouse, you will add the warehouseinformation that is grouped by warehouses to the report.
Procedure
1. Insert a row above the first row to reserve a place for the warehouse information.
The section looks like the following:
The section header in the Group and Section panel now contains two rows as follows:
2. Drag Warehouse Name & Code to the cell above In-Stock Quantity as follows:

26Public© 2016 SAP SE or an SAP affiliate company. All rights reserved.
How to Work with Excel Report and Interactive AnalysisEXCEL REPORT Tab
A column group is automatically added and is grouped by WarehouseNameAndCode. You can find the groupinformation in the Group and Section panel.

How to Work with Excel Report and Interactive AnalysisEXCEL REPORT Tab
Public© 2016 SAP SE or an SAP affiliate company. All rights reserved. 27
3. As you need all the in-stock inventory information of each item in each warehouse, you will enlarge theWarehouseNameAndCode group to cover the three in-stock inventory columns. To do so, in the Group andSection panel, enlarge the WarehouseNameAndCodegroup by dragging the staple.

28Public© 2016 SAP SE or an SAP affiliate company. All rights reserved.
How to Work with Excel Report and Interactive AnalysisEXCEL REPORT Tab
Result
In the EXCEL REPORT ribbon, choose Run Report.
The report result looks like the following, displaying the in-stock inventory quantity, cost price, and in-stockinventory value of each item in each warehouse.
5.2.1.6 Modifying the Layout
To make the report clearer to read, add a title, and make some changes in the report as follows:

How to Work with Excel Report and Interactive AnalysisEXCEL REPORT Tab
Public© 2016 SAP SE or an SAP affiliate company. All rights reserved. 29
5.2.1.6.1 Tips to Center a Value for a Multi-Column Group
NoteThe report designer does not support using the Merge & Center or Merge cells function to achieve thefollowing result. You can always merge cells using the Merge & Center or Merge cells function in the reportresult.
The report result of the current layout looks like the following, displaying the warehouse information to the left ofthe WarehouseNameAndCode group:
Procedure
To display the warehouse information in the center of the group, follow the procedure below:
1. In the worksheet, select the three cells in the section header.
2. Right-click the area and choose Format Cells.
The Format Cells window appears.

30Public© 2016 SAP SE or an SAP affiliate company. All rights reserved.
How to Work with Excel Report and Interactive AnalysisEXCEL REPORT Tab
3. On the Alignment tab, in the Text Alignment section, in the Horizontal dropdown list, select Center AcrossSelection, and choose OK.
Result
In the EXCEL REPORT ribbon, choose Run Report.
The report result now looks like the following, displaying the warehouse information in the center of theWarehouseNameAndCode group:
You have now completed the report design.
How to Work with Excel Report and Interactive AnalysisEXCEL REPORT Tab
Public© 2016 SAP SE or an SAP affiliate company. All rights reserved. 31
5.2.2 Saving the Report
To save the report, follow the procedure below.
1. In the EXCEL REPORT ribbon, choose Save Report.
2. In the Save window, select the folder to place the report, define a report name, and choose OK.
Result
· To open the saved reports, in the EXCEL REPORT ribbon, choose Open Report. Alternatively, you can open thesaved reports under the menu entry of Excel Report and Interactive Analysis in the SAP Business One, versionfor SAP HANA client.
NoteFor newly saved reports to appear in the SAP Business One, version for SAP HANA client, you need to logoff the client and log on again.
· To manage the saved reports, in the EXCEL REPORT ribbon, choose Repository Management. For moreinformation, see Managing Excel Reports.
5.2.3 Viewing the Report Result
NoteYou can view the report result at any time during your design process.
Every time you view the report result, Excel Report and Interactive Analysis retrieves data from the database,displaying real-time statistics in the report.
Procedure
To view the report result, you can do either of the following:
· In the EXCEL REPORT ribbon of the report designer, choose Run Report.
The report opens in the report designer.
· In the Main Menu of the SAP Business One, version for SAP HANA client, choose Excel Report and InteractiveAnalysis → <the report you want to view>.
The report opens in Microsoft Excel with no EXCEL REPORT ribbon.

32Public© 2016 SAP SE or an SAP affiliate company. All rights reserved.
How to Work with Excel Report and Interactive AnalysisEXCEL REPORT Tab
5.3 Advanced Operations
5.3.1 Working with Parameters
In the report designer, there are two types of parameters: the data source parameter and the report parameter.
A data source parameter is designed in the semantic layer that you can use as a data source, and in order tocreate a meaningful report, you must define the parameter value when you select the data source. To change thedata source parameter value, you need to go to the report designer. While a report parameter is what you createduring your report design, you must define the parameter value when you run the report. You can change thereport parameter value every time you run the report.
You can link together the two types of parameters. When the two types of parameters are linked, you do not needto go to the report designer every time you want to view the report based on different data source parametervalues; instead, you can do so by defining the linked report parameter values when you run the report. The reportparameter values will then be transferred to the data source parameter, and your report appears according to thereport parameter values you define when you run the report. For more information, see Linking ReportParameters to Data Source Parameters.
5.3.1.1 Data Source Parameters
Certain semantic layers are designed with data source parameters. To create a meaningful report, you mustdefine those parameter values once you have selected such semantic layers.
NoteWhen the data source you are using contains a data source parameter, you cannot use the Dynamic inputtype in your report parameters. For more information, see Report Parameters.

How to Work with Excel Report and Interactive AnalysisEXCEL REPORT Tab
Public© 2016 SAP SE or an SAP affiliate company. All rights reserved. 33
Procedure
You can define or change data source parameter values in the Select Data Source window as follows:
1. In the Select Data Source window, when you select a semantic layer with parameters, the Change Parametersicon becomes available in the upper right corner of the window.
2. To define or change the parameter values, choose (Change Parameters).
The Enter Parameters window appears.
Alternatively, choose OK in the Select Data Source window. The Enter Parameters window also appears.

34Public© 2016 SAP SE or an SAP affiliate company. All rights reserved.
How to Work with Excel Report and Interactive AnalysisEXCEL REPORT Tab
3. For different kinds of parameters, define their values, and choose OK.
o For a date type parameter, select a date.
o For a value type parameter, specify a value.

How to Work with Excel Report and Interactive AnalysisEXCEL REPORT Tab
Public© 2016 SAP SE or an SAP affiliate company. All rights reserved. 35
o For a value-list parameter, select a value. The values are retrieved from the database to which you loggedon.
NoteTo display more or fewer values in the list, use the Max. Number of List Values field on the Value List tab ofthe Application Settings window. For more information, see EXCEL REPORT Ribbon.
o For a value-selection parameter, select a value. The values are retrieved from the semantic layer.
In the example below, C stands for customer, S stands for supplier, and L stands for leads.

36Public© 2016 SAP SE or an SAP affiliate company. All rights reserved.
How to Work with Excel Report and Interactive AnalysisEXCEL REPORT Tab
You can change data source parameter values when you are designing a report, as follows:
1. When you are designing a report whose data source has parameters, the Change Parameters iconbecomes available in the upper right corner of the Data Source panel.
2. To change the parameter values, choose (Change Parameters).
The Enter Parameters window appears.
3. For different kinds of parameters, define their values, and choose OK.
For more information about different kinds of parameters, see the procedure above.
5.3.1.2 Report Parameters
While designing your report, you can create report parameters and use those parameters in the section and in thefilters, or link them to the data source parameter. Every time you run the report, you must define the reportparameter values in the Input Parameter window by selecting a value from the value dropdown list or entering avalue for the corresponding parameter.

How to Work with Excel Report and Interactive AnalysisEXCEL REPORT Tab
Public© 2016 SAP SE or an SAP affiliate company. All rights reserved. 37
5.3.1.2.1 Creating Report Parameters
Procedure
1. On the Report Parameter tab of the data source panel, choose .
The Parameter Settings window appears.
2. Enter the code and description for the parameter. The code will appear as the parameter name in the InputParameter window, and the description will appear as a tooltip when your hover your mouse over theparameter name. You cannot change the code after adding the parameter.
NoteYou cannot use quotation marks (") or backslashes (\)in your parameter code.

38Public© 2016 SAP SE or an SAP affiliate company. All rights reserved.
How to Work with Excel Report and Interactive AnalysisEXCEL REPORT Tab
3. [Optional] Select the Link To checkbox to link the report parameter to a data source parameter. For moreinformation, see Linking Report Parameters to Data Source Parameters.
NoteWhen you link your report parameter to a data source parameter that is a value-list parameter, you canonly use the input type User Input for the report parameter.
4. Select the input type for the parameter. There are three input types, as follows:
o Dynamic: The parameter values are retrieved from the data source you defined in the Data Sourcedropdown list. When you select this input type, the measures and dimensions appear in the Data Sourcedropdown list. Select a measure or dimension as the data source for the parameter values.
NoteWhen the data source you are using contains a data source parameter, this input type is not available.

How to Work with Excel Report and Interactive AnalysisEXCEL REPORT Tab
Public© 2016 SAP SE or an SAP affiliate company. All rights reserved. 39
o Static: The parameter values are retrieved from the values you defined for this parameter. When youselect this input type, you can define the following data types and specific values for the parameter.
o String: The parameter value must be a string.
o Boolean: The parameter value must be True or False. In the Value column, you can select from thetwo options using the dropdown list.
o DATE: The parameter value must be a date in the format YYYY.MM.DD or YYYY-MM-DD. In the Valuecolumn, you can select the date using the date picker.
o DateTime: The parameter value must be a date and time in the format YYYY.MM.DDHH:MM:SS.FFFFFF or YYYY-MM-DD HH:MM:SS.FFFFFF. In the Value column, you can select thedate using the date picker. The time is optional. If you do not enter a time, 00:00:00.000000 will besaved in the database.
o Double: The parameter value must be a number with or without a decimal point. This data type ismore accurate in calculations compared to the Integer data type.
o Integer: The parameter value must be a whole number without a decimal point.
The display values will appear as the options for you to select in the Default Value dropdown list or in theInput Parameter window, and the values you defined will be transferred from the parameter to the placeyou use it, the cell in the section, the filter, or the data source parameter.

40Public© 2016 SAP SE or an SAP affiliate company. All rights reserved.
How to Work with Excel Report and Interactive AnalysisEXCEL REPORT Tab
o User Input: The parameter value, the one that will be transferred from the parameter to the place you useit, is what you enter in the Input Parameter window. When you select this input type, you must define thedata types in the Data Type dropdown list. For more information about the data type, see the above inputtype.
5. [Optional] To enable selecting or entering multiple values in the Input Parameter window, select the Multiple-Value Selection checkbox.
6. In the Default Value field, select or enter a default value, depending on the input type of the parameter. Thisvalue appears in the Input Parameter window as the default value for the parameter.
o For the Dynamic type, select a value from the measure or dimension.
o For the Static type, select a display value from the ones you defined in the table.
o For the User Input type, enter a value according to the data type of the parameter.
7. To save the parameter, choose OK.
5.3.1.2.2 Using Report Parameters
You can use parameters in the section or in the filters. The parameter value you select or enter when you run thereport is then transferred to the section as a display value, or to the filter as a filtering value, respectively.Therefore, you do not need to go to the report designer every time you need to change the display value or thefiltering value; instead, you can change them every time you run the report.
In the following example, you will create a report to view the in-stock quantities of items in different warehousesusing a Dynamic report parameter. The parameter value you select when you run the report will be transferred tothe section as a display value and to the filter as a filtering value.

How to Work with Excel Report and Interactive AnalysisEXCEL REPORT Tab
Public© 2016 SAP SE or an SAP affiliate company. All rights reserved. 41
Procedure
1. Select Inventory Status as your data source, and drag Item Description & Code to the worksheet. The NewSection window appears.
2. In the New Section window, define the section size, select the Add as a Row Group radio button, and chooseOK.
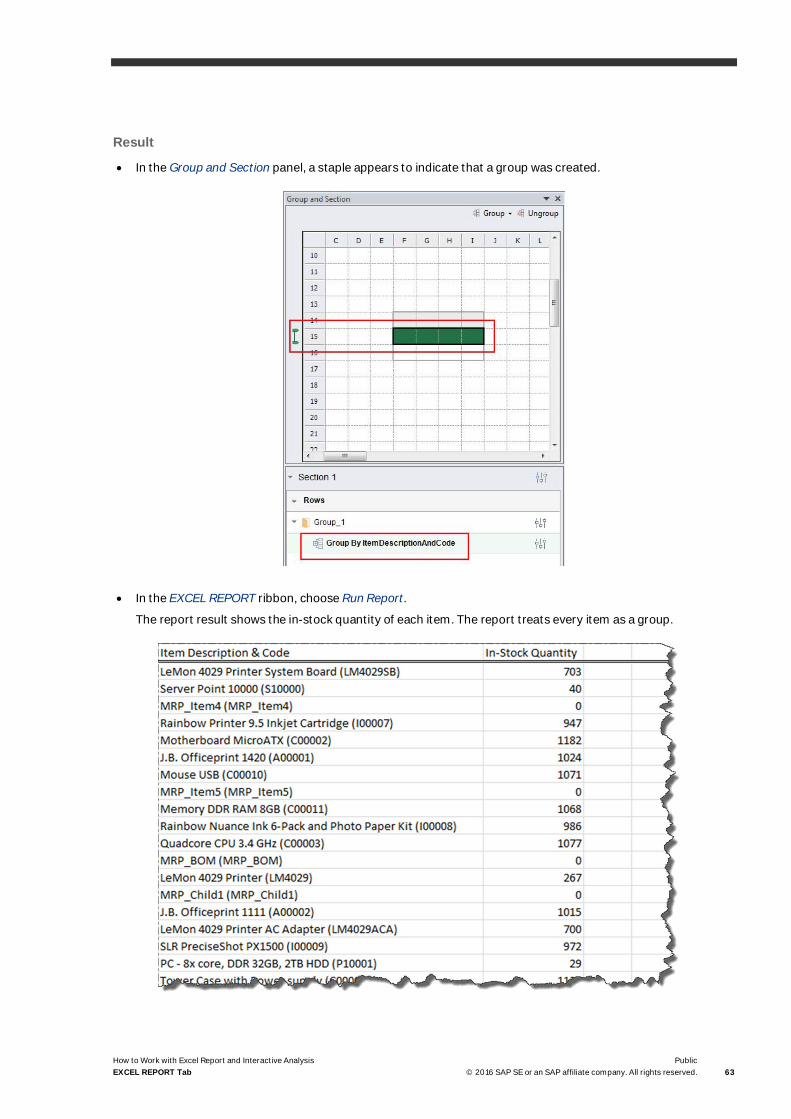
In the Group and Section panel, a staple appears to indicate that a group was created.
3. Drag In-Stock Quantity to the group, as follows:
4. On the Report Parameter tab of the data source panel, choose .
42Public© 2016 SAP SE or an SAP affiliate company. All rights reserved.
How to Work with Excel Report and Interactive AnalysisEXCEL REPORT Tab
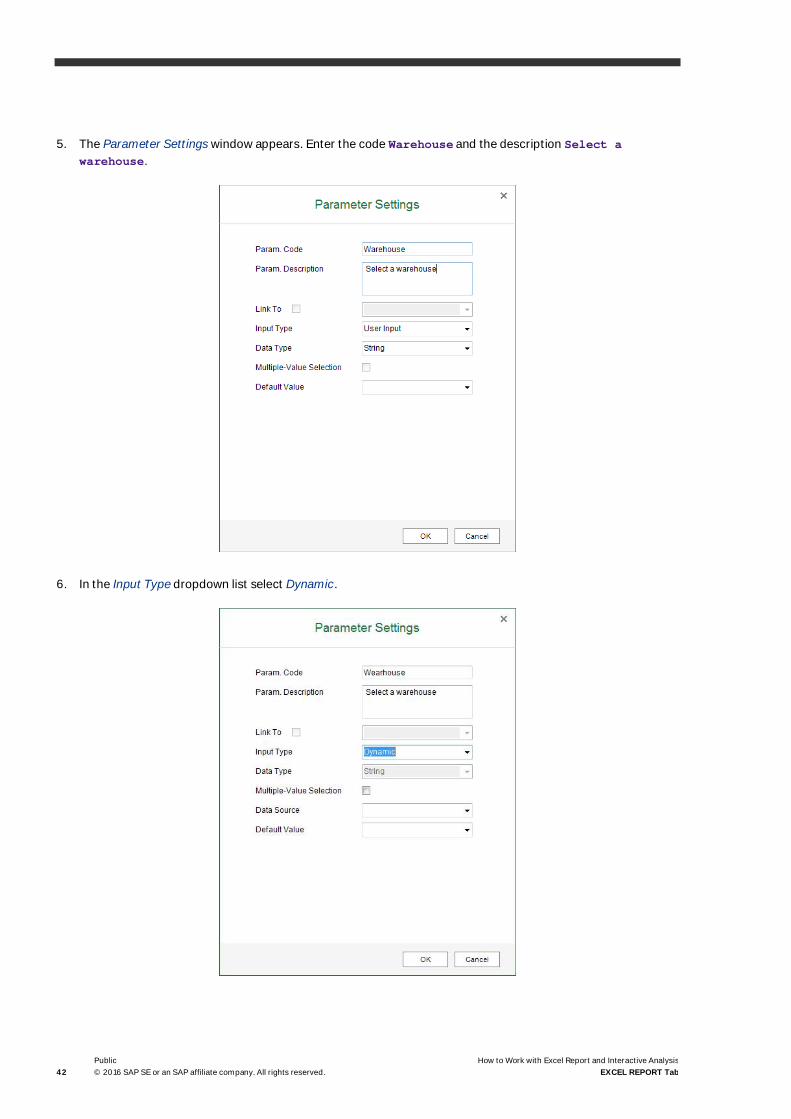
5. The Parameter Settings window appears. Enter the code Warehouse and the description Select awarehouse.
6. In the Input Type dropdown list select Dynamic.

How to Work with Excel Report and Interactive AnalysisEXCEL REPORT Tab
Public© 2016 SAP SE or an SAP affiliate company. All rights reserved. 43
7. In the Data Source dropdown list, select Warehouse Name.
8. In the Default Value dropdown list, select General Warehouse.
9. In the Parameter Settings window, choose OK.

44Public© 2016 SAP SE or an SAP affiliate company. All rights reserved.
How to Work with Excel Report and Interactive AnalysisEXCEL REPORT Tab
10. In the Group and Section panel, choose the Settings button next to the section.
The Settings window appears.
11. On the Filter tab, in the Dimension, Attribute, and Operator dropdown lists, select Warehouse, WarehouseName, and = respectively.

How to Work with Excel Report and Interactive AnalysisEXCEL REPORT Tab
Public© 2016 SAP SE or an SAP affiliate company. All rights reserved. 45
12. In the Value column, choose the triangle.
The Filter Value window appears.
13. On the Parameter tab, select the parameter that you have created, and choose OK.

46Public© 2016 SAP SE or an SAP affiliate company. All rights reserved.
How to Work with Excel Report and Interactive AnalysisEXCEL REPORT Tab
The iaParam function appears in the Value column. For more information, see iaParam Function.
Alternatively, you can enter iaParam("Warehouse") directly in the Value column.
14. In the Settings window, choose OK.
15. From the Report Parameter tab of the data source panel, drag Warehouse to the worksheet, and enterWarehouse as its title.
Alternatively, you can enter iaParam("Warehouse") directly in the relevant cell.
Result
You can view the in-stock quantities of items in different warehouses as follows:
· To view the in-stock quantities of items in the general warehouse, follow the procedure below:
1. In the EXCEL REPORT ribbon, choose Run Report. The Input Parameter window appears, and the defaultvalue for the parameter appears in the dropdown list.

How to Work with Excel Report and Interactive AnalysisEXCEL REPORT Tab
Public© 2016 SAP SE or an SAP affiliate company. All rights reserved. 47
2. In the Input Parameter window, choose OK. The report result looks like the following:
The value you select in the Input Parameter window is transferred to the place where you use the reportparameter.
o The report parameter value is transferred to the filter as a filtering value, so only the quantity in thegeneral warehouse is displayed.
o The report parameter value is transferred to the section as a display value, so General Warehouseappears in the Warehouse column.
· To view the in-stock quantities of items in the west cost warehouse, follow the procedure below:
1. In the EXCEL REPORT ribbon, choose Run Report. The Input Parameter window appears, and the defaultvalue for the parameter appears in the dropdown list.

48Public© 2016 SAP SE or an SAP affiliate company. All rights reserved.
How to Work with Excel Report and Interactive AnalysisEXCEL REPORT Tab
2. In the Input Parameter window, select West Cost Warehouse, and choose OK. The report result looks likethe following.
The value you select in the Input Parameter window is transferred to the place where you use the reportparameter.
o The report parameter value is transferred to the filter as a filtering value, so only the quantity in thewest cost warehouse is displayed.
o The report parameter value is transferred to the section as a display value, so West Cost Warehouseappears in the Warehouse column.
5.3.1.2.3 Linking Report Parameters to Data SourceParameters
You can link report parameters to data source parameters. The parameter value you select or enter when you runthe report is then transferred to the data source parameter as a data source parameter value. Therefore, you donot need to go to the report designer every time you want to view the report based on different data sourceparameter values; instead, you can do so by defining the linked report parameter values when you run the report.
In the following example, you will create a report to view the unsettled trade receivable or payable amount basedon different aging dates for different business partner types using report parameters that are linked to data

How to Work with Excel Report and Interactive AnalysisEXCEL REPORT Tab
Public© 2016 SAP SE or an SAP affiliate company. All rights reserved. 49
source parameters. The parameter value you select when you run the report will be transferred to the data sourceparameter as a data source parameter value.
NoteWhen you link your report parameter to a data source parameter that is a value-list parameter, you canonly use the input type User Input for the report parameter.
Procedure
1. Select Account Receivable & Payable Analysis as your data source, and in the Enter Parameters window,define your specific data source parameter values or take the default values. You can always define specificreport parameter values when you run the report and transfer them to the data source parameters.
2. Drag Business Partner Name & Code to the worksheet. The New Section window appears.

50Public© 2016 SAP SE or an SAP affiliate company. All rights reserved.
How to Work with Excel Report and Interactive AnalysisEXCEL REPORT Tab
3. In the New Section window, define the section size, select the Add as a Row Group radio button, and chooseOK.
In the Group and Section panel, a staple appears to indicate that a group was created.
4. Drag Aging Balance Due (LC) to the group, as follows:
5. On the Report Parameter tab of the data source panel, choose .
The Parameter Settings window appears.

How to Work with Excel Report and Interactive AnalysisEXCEL REPORT Tab
Public© 2016 SAP SE or an SAP affiliate company. All rights reserved. 51
6. Select the Link To checkbox, and select the data source parameter P_AgingDate.
The parameter code is filled automatically.
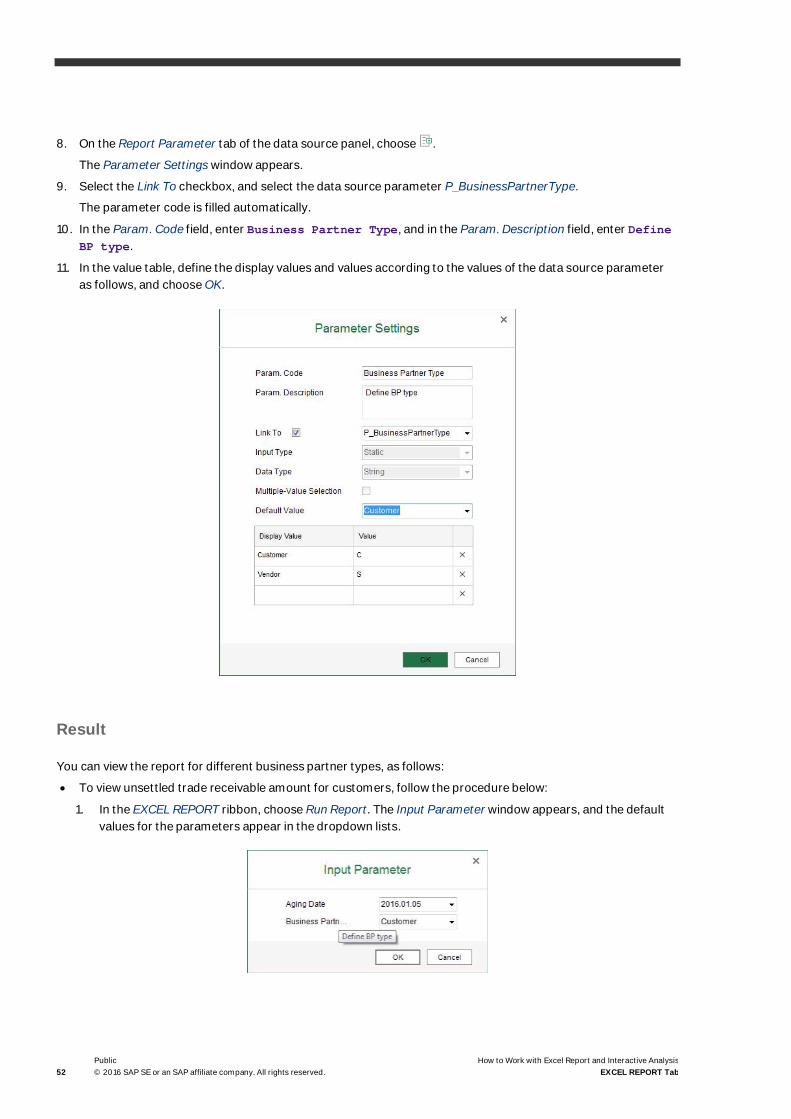
7. In the Param. Code field, enter Aging Date, in the Param. Description field, enter Define an aging date,and choose OK.
52Public© 2016 SAP SE or an SAP affiliate company. All rights reserved.
How to Work with Excel Report and Interactive AnalysisEXCEL REPORT Tab
8. On the Report Parameter tab of the data source panel, choose .
The Parameter Settings window appears.
9. Select the Link To checkbox, and select the data source parameter P_BusinessPartnerType.
The parameter code is filled automatically.
10. In the Param. Code field, enter Business Partner Type, and in the Param. Description field, enter DefineBP type.
11. In the value table, define the display values and values according to the values of the data source parameteras follows, and choose OK.
Result
You can view the report for different business partner types, as follows:
· To view unsettled trade receivable amount for customers, follow the procedure below:
1. In the EXCEL REPORT ribbon, choose Run Report. The Input Parameter window appears, and the defaultvalues for the parameters appear in the dropdown lists.

How to Work with Excel Report and Interactive AnalysisEXCEL REPORT Tab
Public© 2016 SAP SE or an SAP affiliate company. All rights reserved. 53
2. In the Input Parameter window, choose OK. The report result looks like the following:
The values you select in the Input Parameter window are transferred to the data source parameterP_BusinessPartnerType so only customers are displayed.
· To view unsettled trade payable amount for vendors, follow the procedure below:
1. In the EXCEL REPORT ribbon, choose Run Report. The Input Parameter window appears, and the defaultvalues for the parameters appear in the dropdown lists.
2. In the Input Parameter window, select Vendor, and choose OK. The report result looks like the following.
The values you select in the Input Parameter window are transferred to the data source parameterP_BusinessPartnerType so only vendors are displayed.
You can view the report for different aging dates, as follows:

54Public© 2016 SAP SE or an SAP affiliate company. All rights reserved.
How to Work with Excel Report and Interactive AnalysisEXCEL REPORT Tab
· To view unsettled trade receivable amount for customers on the aging date of 2016.01.01, follow theprocedure below:
1. In the EXCEL REPORT ribbon, choose Run Report. The Input Parameter window appears, and the defaultvalues for the parameters appear in the dropdown lists.
2. In the Input Parameter window, select 2016.01.01, and choose OK. The report result looks like thefollowing.
The value you select in the Input Parameter window is transferred to the data source parameterP_AgingDate so the unsettled trade receivable amount for customers on the aging date of 2016.01.01 isdisplayed.
· To view unsettled trade receivable amount for customers on the aging date of 2012.01.01, follow theprocedure below:
1. In the EXCEL REPORT ribbon, choose Run Report. The Input Parameter window appears, and the defaultvalues for the parameters appear in the dropdown lists.

How to Work with Excel Report and Interactive AnalysisEXCEL REPORT Tab
Public© 2016 SAP SE or an SAP affiliate company. All rights reserved. 55
2. In the Input Parameter window, select 2012.01.01, and choose OK. The report result looks like thefollowing:
The value you select in the Input Parameter window is transferred to the data source parameterP_AgingDate so the unsettled trade receivable amount for customers on the aging date of 2012.01.01 isdisplayed.
5.3.1.2.4 Managing Report Parameters
· To edit a report parameter, on the Report Parameter tab of the data source panel, select the reportparameter, and choose .
· To delete a report parameter, on the Report Parameter tab of the data source panel, select the reportparameter, choose , and confirm the message.
5.3.2 Working with Filters
NoteYou can filter only by dimensions.
You can set filters on the section or group set level. A group set is a group hierarchy that contains one or moregroups that are related to each other.
To see the section or group set information, use the Settings button next to them.
56Public© 2016 SAP SE or an SAP affiliate company. All rights reserved.
How to Work with Excel Report and Interactive AnalysisEXCEL REPORT Tab
Procedure
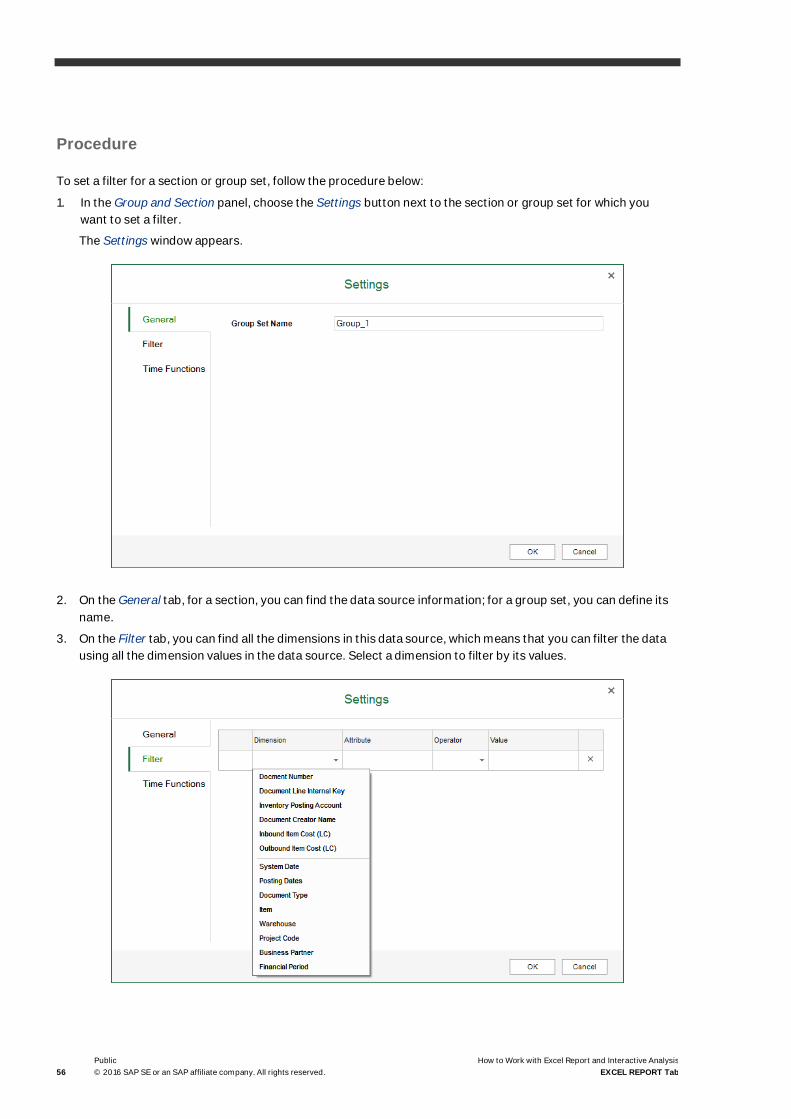
To set a filter for a section or group set, follow the procedure below:
1. In the Group and Section panel, choose the Settings button next to the section or group set for which youwant to set a filter.
The Settings window appears.
2. On the General tab, for a section, you can find the data source information; for a group set, you can define itsname.
3. On the Filter tab, you can find all the dimensions in this data source, which means that you can filter the datausing all the dimension values in the data source. Select a dimension to filter by its values.

How to Work with Excel Report and Interactive AnalysisEXCEL REPORT Tab
Public© 2016 SAP SE or an SAP affiliate company. All rights reserved. 57
4. In the Operator dropdown list, select an operator for the filter. The following operators are available:
o =: the filtered value is equal to the value you select in the Value column.
o <>: the filtered values are not equal to the value you select in the Value column.
o >: the filtered values are greater than the value you select in the Value column.
o >=: the filtered values are greater than or equal to the value you select in the Value column.
o <: the filtered values are smaller than the value you select in the Value column.
o <=: the filtered values are smaller than or equal to the value you select in the Value column.
o IN: the filtered values are equal to one of the values you select in the Value column.
5. In the Value column, enter or select a value or report parameter, using the date picker (for a date-typedimension), the value list on the Value tab of the Filter Value window (for all dimensions), or the Parameter tabof the Filter Value window. For more information about report parameters, see Report Parameters andiaParam Function.
NoteTo display more or fewer values in the value list, use the Max. Number of List Values field on the Value Listtab of the Application Settings window. For more information, see EXCEL REPORT Ribbon.
6. If you define more than one line in the filter, define the condition And or Or to combine the filter lines.
NoteYou cannot use And and Or in one filter at the same time
7. To save the settings, choose OK.
58Public© 2016 SAP SE or an SAP affiliate company. All rights reserved.
How to Work with Excel Report and Interactive AnalysisEXCEL REPORT Tab
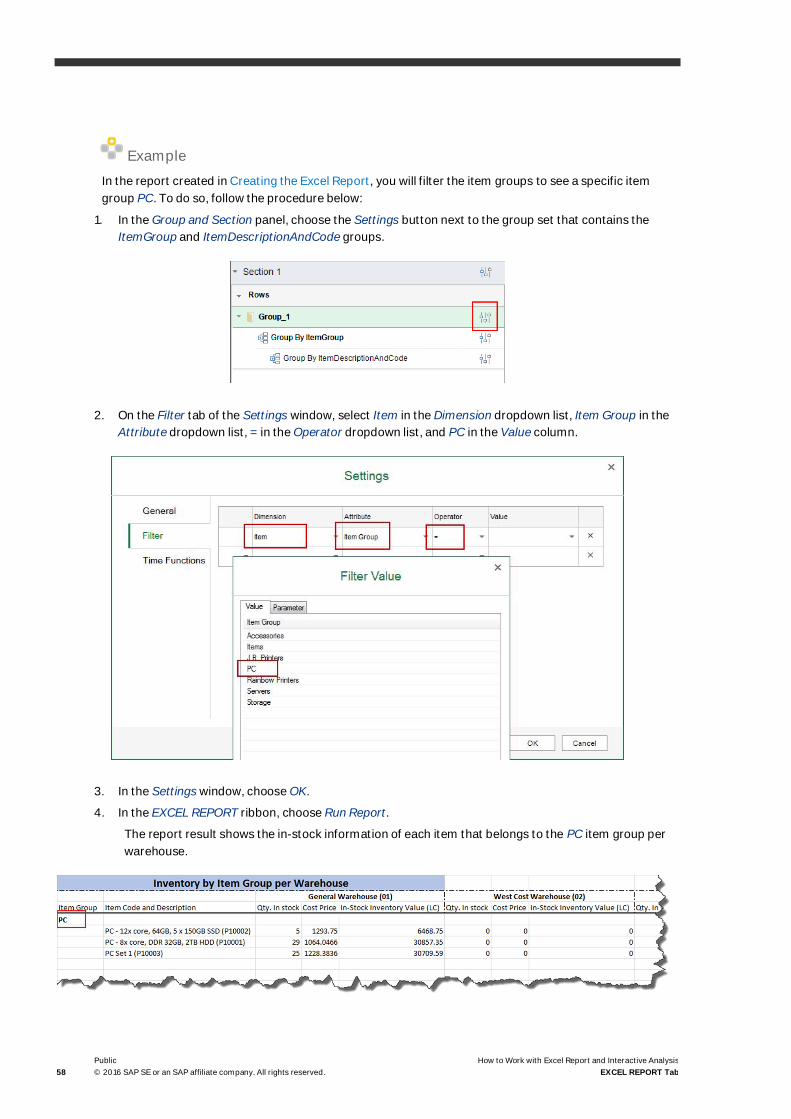
ExampleIn the report created in Creating the Excel Report, you will filter the item groups to see a specific itemgroup PC. To do so, follow the procedure below:
1. In the Group and Section panel, choose the Settings button next to the group set that contains theItemGroup and ItemDescriptionAndCode groups.
2. On the Filter tab of the Settings window, select Item in the Dimension dropdown list, Item Group in theAttribute dropdown list, = in the Operator dropdown list, and PC in the Value column.
3. In the Settings window, choose OK.
4. In the EXCEL REPORT ribbon, choose Run Report.
The report result shows the in-stock information of each item that belongs to the PC item group perwarehouse.
How to Work with Excel Report and Interactive AnalysisEXCEL REPORT Tab
Public© 2016 SAP SE or an SAP affiliate company. All rights reserved. 59
5.3.3 Working with Group, Details Group, and Field
Excel Report and Interactive Analysis provides the following field types:
· Group: this field type retrieves all the values of a dimension from the database and treats each value as agroup. The group must be grouped by a dimension.
· Details group: you can treat this field type as a group, as the operations for this field type are almost thesame as those for a group. However, this field type does not treat each value as a group; instead, a detailsgroup displays every record of all dimensions in the group. The details group does not have a Group Byattribute.
· Field: this field type retrieves values depending on the data source.
o If the data source is a measure, this field type retrieves the sum of all the values in the database for thecorresponding group (if it has a corresponding group).
o If the data source is a dimension, this field type retrieves the largest value in the database for thecorresponding group (if it has a corresponding group).
5.3.3.1 Group and Details Group
NoteWhen you copy a group hierarchy, all the information is copied, including the Group By attribute, thecalculated value, and so on.
NoteYou can add paralleled groups only on the first level of group hierarchies.
5.3.3.1.1 Adding a Group
When you add a group that is grouped by a dimension, the report result displays all the values of the dimension inthe database with the Group By attribute, that is, the report treats each value of the dimension as a group.

60Public© 2016 SAP SE or an SAP affiliate company. All rights reserved.
How to Work with Excel Report and Interactive AnalysisEXCEL REPORT Tab
Adding a Group When You Start
You will create a report that displays the in-stock quantity of each item in the database.
Procedure
To add a group when you start designing a report, follow the procedure below:
1. Select Inventory Status as your data source, and drag Item Description & Code to the worksheet. The NewSection window appears.
2. In the New Section window, define the section size, select the Add as a Row Group radio button, and chooseOK.
In the Group and Section panel, a staple appears to indicate that a group was created.
3. Drag In-Stock Quantity to the group, as follows:

How to Work with Excel Report and Interactive AnalysisEXCEL REPORT Tab
Public© 2016 SAP SE or an SAP affiliate company. All rights reserved. 61
Result
In the EXCEL REPORT ribbon, choose Run Report.
The report result shows the in-stock quantity of each item. The report treats every item as a group.
Adding a Group During Your Design
You will create a report that displays the in-stock quantity of each item per each warehouse in the database.
Procedure
When you are in the middle of designing a report, to add a group by using the Add New Group option in the Groupand Section panel, follow the procedures below:
1. With the Inventory Status data source, you have added In-Stock Quantity and Item Description & Code as twofields in the worksheet.

62Public© 2016 SAP SE or an SAP affiliate company. All rights reserved.
How to Work with Excel Report and Interactive AnalysisEXCEL REPORT Tab
2. Select the whole Excel row as follows.
NoteIf you want to add a column group, select the whole Excel column.
3. In the Group and Section panel, choose Group → Add New Group.
4. In the Group By dropdown list of the Add New Group window, select Item Description & Code, and choose OK.
How to Work with Excel Report and Interactive AnalysisEXCEL REPORT Tab
Public© 2016 SAP SE or an SAP affiliate company. All rights reserved. 63
Result
· In the Group and Section panel, a staple appears to indicate that a group was created.
· In the EXCEL REPORT ribbon, choose Run Report.
The report result shows the in-stock quantity of each item. The report treats every item as a group.

64Public© 2016 SAP SE or an SAP affiliate company. All rights reserved.
How to Work with Excel Report and Interactive AnalysisEXCEL REPORT Tab
Procedure
When you are in the middle of designing a report, to add a group by directly dragging a dimension to the sectionheader, follow the procedures below:
1. In the report created in the previous procedure, insert a row in the section header.

How to Work with Excel Report and Interactive AnalysisEXCEL REPORT Tab
Public© 2016 SAP SE or an SAP affiliate company. All rights reserved. 65
2. Drag Warehouse Name & Code to the section header as follows:
A column group is automatically created.

66Public© 2016 SAP SE or an SAP affiliate company. All rights reserved.
How to Work with Excel Report and Interactive AnalysisEXCEL REPORT Tab
Result
In the EXCEL REPORT ribbon, choose Run Report.
The report result shows the in-stock quantity of each item per each warehouse.
Adding a Parent or Child Group
You will create a report that displays the in-stock quantity of each item, and the items are grouped by item group.
Procedure
To create the report by adding a parent group, follow the procedure below:
1. With the Inventory Status data source, you have added a group that is grouped by Item Description & Code,and added In-Stock Quantity to the group.
2. Insert a column before the Item Description & Code column to reserve a place for the item group column.
The section looks like the following:

How to Work with Excel Report and Interactive AnalysisEXCEL REPORT Tab
Public© 2016 SAP SE or an SAP affiliate company. All rights reserved. 67
3. Select the ItemDescriptionAndCode group using either of the following two methods:
o In the Group and Section panel, select the staple.
o In the worksheet, select the whole ItemDescriptionAndCode group row in the section or select the wholeExcel row as follows:
In the Group and Section panel, the staple is marked in green, indicating that the group has been selected.
4. In the Group and Section panel, choose Group → Add Parent Group.
The Add Parent Group window appears.
5. In the Group By dropdown list, select Item Group, and choose OK.
68Public© 2016 SAP SE or an SAP affiliate company. All rights reserved.
How to Work with Excel Report and Interactive AnalysisEXCEL REPORT Tab
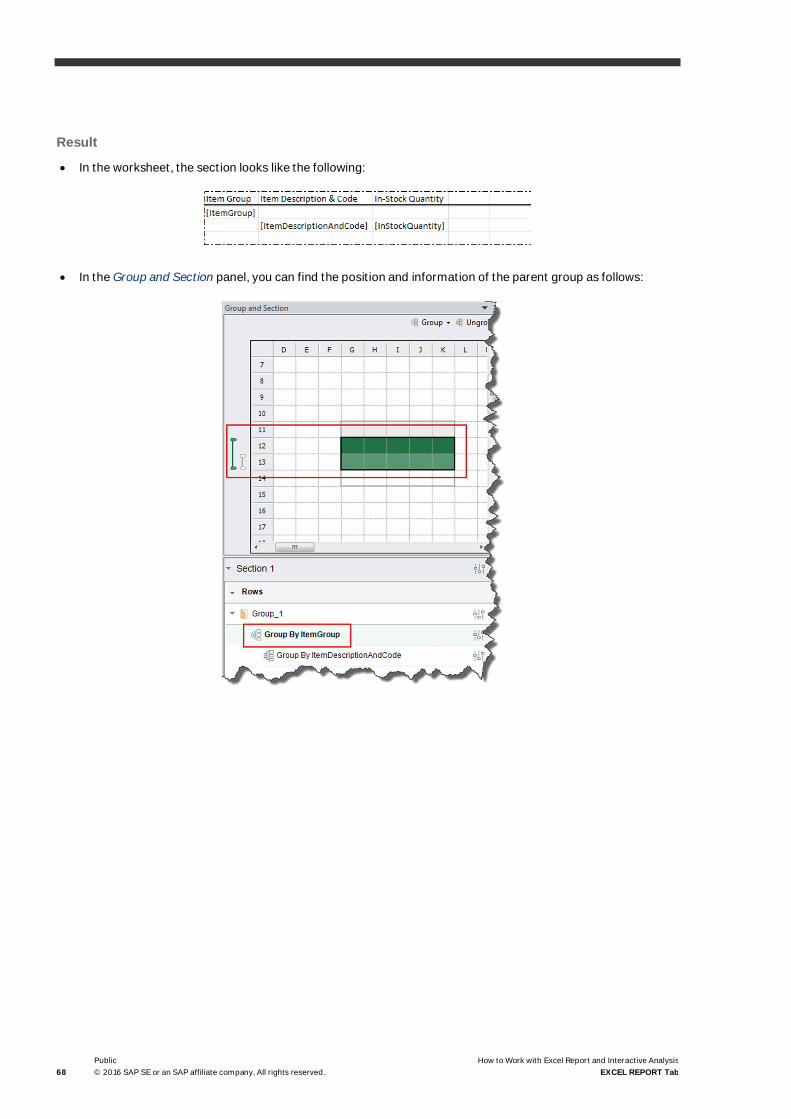
Result
· In the worksheet, the section looks like the following:
· In the Group and Section panel, you can find the position and information of the parent group as follows:

How to Work with Excel Report and Interactive AnalysisEXCEL REPORT Tab
Public© 2016 SAP SE or an SAP affiliate company. All rights reserved. 69
· In the EXCEL REPORT ribbon, choose Run Report.
The report result shows the in-stock quantity of each item, and the items are grouped by item group.
Procedure
To create the report by adding a child group, follow the procedure below:
1. With the Inventory Status data source, you have added a group that is grouped by Item Group.
2. Select the ItemGroup group using either of the two methods provided in the third step of the previousprocedure, and in the Group and Section panel, choose Group → Add Child Group.
The Add Child Group window appears.
3. In the Position section, to place the child group in the next row of the parent group, select the MultipleRow/Column Mode radio button. You will select this radio button in this procedure. The result looks like thefollowing:

70Public© 2016 SAP SE or an SAP affiliate company. All rights reserved.
How to Work with Excel Report and Interactive AnalysisEXCEL REPORT Tab
In the Position section, to place the child group in the same row as the parent group, select the SingleRow/Column Mode radio button. The result looks like the following:
NoteThe Add Parent Group option is not available for the first level group. Therefore, for groups in the singlerow/column mode, you cannot add a parent group to the first level group.
4. In the Group By dropdown list, select Item Description & Code, and choose OK.
5. Drag In-Stock Quantity to the ItemDescriptionAndCode group.
Result
The results are the same as the results for the previous procedure.
5.3.3.1.2 Adding a Details Group
When you add a details group, the report result displays all records in the database without the Group Byattribute, that is, this field does not treat each value as a group; instead, a details group displays every record of alldimensions in the group.

How to Work with Excel Report and Interactive AnalysisEXCEL REPORT Tab
Public© 2016 SAP SE or an SAP affiliate company. All rights reserved. 71
NoteWhen there is a column group, you cannot add a details group in the row direction; and when there is arow group, you cannot add a details group in the column direction.
Adding a Details Group When You Start
You will create a report that displays the inbound inventory quantity for each item on each posting date.
Procedure
To add a details group when you start designing a report, follow the procedure below:
1. Select Inventory Transaction Documents as your data source, and drag Item Description & Code to theworksheet. The New Section window appears.
2. In the New Section window, define the section size, select the Add as a Row Group radio button together withthe Show Details with No Group By checkbox, and choose OK.
In the Group and Section panel, a staple with three lines appears to indicate that a details group was created.
3. Drag Inbound Inventory Quantity and Posting Date to the details group as follows:

72Public© 2016 SAP SE or an SAP affiliate company. All rights reserved.
How to Work with Excel Report and Interactive AnalysisEXCEL REPORT Tab
Result
In the EXCEL REPORT ribbon, choose Run Report.
The report result shows every record in the group, and the sum of inbound inventory quantity for each record.
Adding a Details Group During Your Design
This procedure is the same as the one for adding a group when you are in the middle of designing a report byusing the Add New Group option in the Group and Section panel, except that you need to select the Show Detailswith No Group By radio button in the Add New Group window. For more information, see the first procedure inAdding a Group During Your Design.
Note
In the Add New Group window, when you select the Show Details with No Group By radio button, youcannot edit the Group By dropdown list, because a details group does not have the Group By attribute,and it displays every record of all dimensions in the group.

How to Work with Excel Report and Interactive AnalysisEXCEL REPORT Tab
Public© 2016 SAP SE or an SAP affiliate company. All rights reserved. 73
Adding a Child Details Group
NoteA details group must be in the lowest level of a group hierarchy, so you cannot add a parent details group.
This procedure is the same as the one for adding a child group, except that you need to select the Show Detailswith No Group By radio button in the Add Child Group window. For more information, see the second procedure inAdding a Parent or Child Group.
NoteIn the Add Child Group window, when you select the Show Details with No Group By radio button, youcannot edit the Group By dropdown list, because a details group does not have the Group By attribute,and it displays every record of all dimensions in the group.
5.3.3.1.3 Deleting a (Details) Group
Note
In the Single Row/Column Mode, you cannot delete the highest-level group if it has child groups.
To delete a group, in the Group and Section panel, select the staple of the group that you want to delete, andchoose Ungroup as follows:

74Public© 2016 SAP SE or an SAP affiliate company. All rights reserved.
How to Work with Excel Report and Interactive AnalysisEXCEL REPORT Tab
5.3.3.1.4 Modifying and Sorting a (Details) Group
NoteSorting does not support calculated fields, such as iaGet("Attribute_A")/iaGet("Attribute_B")or MIN(iaCellRef(F10)). Only dimensions and measures, that is, the simple iaGet functions, aresupported. For more information about the iaGet function, see iaGet Function.
In the Settings window of a group, you can define its name, the Group By attribute (this is not available for detailsgroups), and the sorting rules. You can define sorting rules for all the dimensions, measures, and the Group Byattribute in the group, except those that are also in a group on the other direction.
ExampleFor example, Qty. In Stock, Cost Price, and In-Stock Inventory Value (LC) are included in two groups: theWarehouseNameAndCode group, and the ItenDescriptionAndCode group.
When you choose the Settings icon of the ItenDescriptionAndCode group, in the Attribute dropdown liston the Sorting tab, only Item Description & Code is available.
When you ungroup the WarehouseNameAndCode group, in the Attribute dropdown list on the Sorting tabof the ItenDescriptionAndCode group, you can see that Item Description & Code, In-Stock Quantity, andIn-Stock Inventory Value (LC) are all available. Cost Price is not available because it is a calculated field.

How to Work with Excel Report and Interactive AnalysisEXCEL REPORT Tab
Public© 2016 SAP SE or an SAP affiliate company. All rights reserved. 75
To open the Settings window of a group, in the Group and Section panel, choose the Settings icon of the specificgroup.
Procedure
You will sort the item group in descending order in the query report Inventory by Item Group per Warehouse.
1. In the report created in Creating the Excel Report, in the Group and Section panel, choose the Settings icon ofthe ItemGroup group.
The Settings window of the ItemGroup group appears.
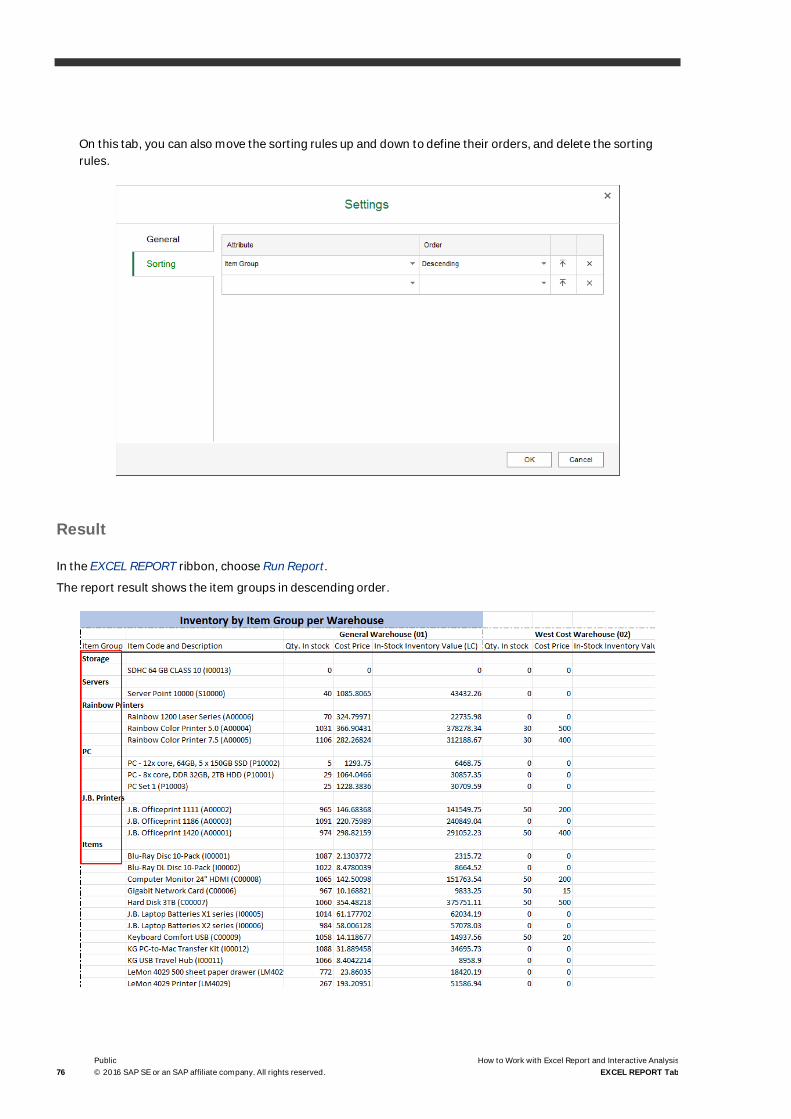
2. On the Sorting tab, select ItemGroup as the attribute, Descending as the order, and choose OK.
76Public© 2016 SAP SE or an SAP affiliate company. All rights reserved.
How to Work with Excel Report and Interactive AnalysisEXCEL REPORT Tab
On this tab, you can also move the sorting rules up and down to define their orders, and delete the sortingrules.
Result
In the EXCEL REPORT ribbon, choose Run Report.
The report result shows the item groups in descending order.

How to Work with Excel Report and Interactive AnalysisEXCEL REPORT Tab
Public© 2016 SAP SE or an SAP affiliate company. All rights reserved. 77
5.3.3.2 Field
When you add a measure or dimension as a field, the report result displays the following:
· If the data source is a measure, this field type retrieves the sum of all the values in the database for thecorresponding group (if it has a corresponding group).
· If the data source is a dimension, this field type retrieves the largest value in the database for thecorresponding group (if it has a corresponding group).
5.3.3.2.1 Adding a Field
Procedure
You can use the following procedures to add a measure or dimension as a field.
· To add a measure or dimension as a field by dragging when you start designing a report, follow theprocedures below:
o In the following example, you will add a measure as a field.
1. Select Inventory Transaction Documents as your data source, and drag Inbound Item Cost (LC) to theworksheet. The New Section window appears.
2. In the New Section window, define the section size, select the Add as a Field radio button, and chooseOK.
3. In the EXCEL REPORT ribbon, choose Run Report.
The report result shows the sum of all the values in the database.
o In the following example, you will add a dimension as a field.
1. Select Inventory Transaction Documents as your data source, and drag Item Description & Code to theworksheet. The New Section window appears.
2. In the New Section window, define the section size, select the Add as a Field radio button, and chooseOK.
3. In the EXCEL REPORT ribbon, choose Run Report.
The report result shows the largest value in the database, which starts with the letter W.
· When you are in the middle of designing a report, to add a measure or dimension as a field by dragging, dragthe dimension of measure inside the section.
· To add a measure or dimension as a field by entering it in the cell or formula bar, see iaGet Function.

78Public© 2016 SAP SE or an SAP affiliate company. All rights reserved.
How to Work with Excel Report and Interactive AnalysisEXCEL REPORT Tab
5.3.3.3 Differences Between Group, Details Group, and Field
The following example will explain the differences between the three field types. The section looks like thefollowing:
· Select Inventory Transaction Documents as your data source, add Item Description & Code as a row group,and drag Inbound Inventory Quantity and Posting Date to the worksheet. The report result shows the sum ofinbound inventory quantity and the largest value of the posting date of each item. Every item is treated as agroup.

How to Work with Excel Report and Interactive AnalysisEXCEL REPORT Tab
Public© 2016 SAP SE or an SAP affiliate company. All rights reserved. 79
· Select Inventory Transaction Documents as your data source, add Item Description & Code as a details group,and drag Inbound Inventory Quantity and Posting Date to the details group. The report result shows everyrecord in the group and the sum of inbound inventory quantity for each record.
· Select Inventory Transaction Documents as your data source, add Item Description & Code as a field, and dragInbound Inventory Quantity and Posting Date to the worksheet. The report result shows the largest value ofitem, the sum of inbound inventory quantity, and the largest value of posting date.

80Public© 2016 SAP SE or an SAP affiliate company. All rights reserved.
How to Work with Excel Report and Interactive AnalysisEXCEL REPORT Tab
5.3.4 Working with Functions
Excel Report and Interactive Analysis provides the following three functions:
· iaGet: Use this function to retrieve values from the data source.
· iaCellRef: Use this function to retrieve values from the cells in the worksheet.
· iaParam: Use this function to retrieve values from the report parameter when you run the report.
To view the formulas in all the cells, in the Formulas ribbon, select Show Formulas, and the section looks like thefollowing:
5.3.4.1 iaGet Function
The iaGet function retrieves values from the data source.
The retrieved value depends on the data source:
· If the data source is a measure, the iaGet function retrieves the sum of all the values in the database for thecorresponding group (if it has a corresponding group).
· If the data source is a dimension, the iaGet function retrieves the largest value in the database for thecorresponding group (if it has a corresponding group).
Syntax: iaGet("<name of the dimension or measure>")
For example:
· =iaGet("OrderedQuantity")
· =iaGet("ItemCode")
Argument Description
<name of the dimension or measure> The name of the dimension or measure in the data source. To seethe name of the dimension or measure, you can use either of thetwo following methods:
· Drag the dimension or measure to the section, and the nameappears in both the cell and formula bar.
· Look for How to Work with Semantic Layers in SAP BusinessOne on sappartneredge.com. In the package, you can find theSemantic Layer Model Package Reference guide, in which youcan find the corresponding attribute and measure for the UIlabel you see in the data source panel.
In formulas, the usage of the iaGet function is as follows:
· You can combine the iaGet function for a measure with numbers or other iaGet functions for measures, andthe expressions can be "+" (plus sign); "-" (minus sign); "*" (multiply sign); "/" (divide sign).

How to Work with Excel Report and Interactive AnalysisEXCEL REPORT Tab
Public© 2016 SAP SE or an SAP affiliate company. All rights reserved. 81
· You can combine the iaGet function of a dimension with strings or other iaGet functions of dimensions, andthe expression can be "+" (plus sign).
ExampleIn the data source Inventory Status, the sum of ordered quantity is 356, and the sum of committedquantity is 810. The largest value of item code is Z00002.
Formula Description
=iaGet("OrderedQuantity") Retrieves the sum of ordered quantity. The result is 356.
=iaGet("ItemCode") Retrieves the largest value of item code. The result is Z00002.
=iaGet("OrderedQuantity")+iaGet("CommittedQuantity")
Adds the sum of ordered quantity and sum of committed quantity.The following expressions are supported: "+" (plus sign); "-" (minussign); "*" (multiply sign); "/" (divide sign). The result is 1166.
=iaGet("OrderedQuantity")+100 Add the sum of ordered quantity and 100. The following expressionsare supported: "+" (plus sign); "-" (minus sign); "*" (multiply sign);"/" (divide sign). The result is 456.
=iaGet("ItemCode")+"abc" Combines the largest value of item code and string "abc". The resultis Z00002abc.
5.3.4.1.1 Tips to Get the Subtotal Using iaGet
As the iaGet function retrieves the sum of all the values in the database for the corresponding group, you can useit to calculate the subtotal of a group as in the following example.
In the report designer, you want to see the subtotal of in-stock quantity of each item group.
The report result looks like the following, displaying the in-stock quantity for each item, and the items are groupedby item group.

82Public© 2016 SAP SE or an SAP affiliate company. All rights reserved.
How to Work with Excel Report and Interactive AnalysisEXCEL REPORT Tab
Prerequisite
You have added Item Description & Code as a group, Item Group as its parent group, and In-Stock Quantity as afield, as follows:
Procedure
To get the subtotal of in-stock quantity for each item group, drag In-Stock Quantity to or enter=iaGet("InStockQuantity") in the cell above the current In-Stock Quantity field as follows.
Result
The report result looks like the following, displaying the subtotal of in-stock quantity of each item group.

How to Work with Excel Report and Interactive AnalysisEXCEL REPORT Tab
Public© 2016 SAP SE or an SAP affiliate company. All rights reserved. 83
5.3.4.2 iaCellRef Function
The iaCellRef function retrieves values from the cells in the worksheet.
Syntax: iaCellRef("<name of the cell>")
For example:
· =iaCellRef("E7")
· =iaCellRef("G16")
Argument Description
<name of the cell> A cell name such asB6.
In formulas, you can combine the iaCellRef function with all the functions in Microsoft Excel.
NoteIn Excel Report and Interactive Analysis, you cannot use the iaCellRef function in a group to retrievevalues from cells that are in its upper-level groups and not in the group itself.
ExampleIn the report designer, you want to see the sum of in-stock quantity for all items. The name of theInStockQuantity cell is E10. Add =SUM(iaCellRef(E10)) to the sum cell as follows:
The report result looks like the following:
5.3.4.2.1 iaCellRef and Cell Reference
The iaCellRef function is somewhat similar to a cell reference in regular Excel operations. They both retrievevalues from the cells. However, the regular cell reference function retrieves values from fixed cells, and theiaCellRef function automatically references the expanded cells in the group result, thus retrieving values on adynamic basis. In general, the iaCellRef function can replace the cell reference function, and works better in

84Public© 2016 SAP SE or an SAP affiliate company. All rights reserved.
How to Work with Excel Report and Interactive AnalysisEXCEL REPORT Tab
groups. The following example will explain the differences between the iaCellRef function and regular cellreferences.
In the report designer, you want to see the in-stock quantity, ordered quantity and their difference for each item.
Prerequisite
You have added Item Description & Code as a group, and added In-Stock Quantity and Ordered Quantity as twofields, as follows:
Procedure
Add a regular cell reference and the iaCellRef function to see the different results as follows.
· In the first scenario, you added a regular cell reference to D2: =B2-C2.
In the report, the In-Stock - Ordered column always displays the result of B2 minus C2.

How to Work with Excel Report and Interactive AnalysisEXCEL REPORT Tab
Public© 2016 SAP SE or an SAP affiliate company. All rights reserved. 85
The following screenshot shows the result in a clearer way.
· In the second scenario, you added the iaCellRef function to D2:=iaCellRef(B2)-iaCellRef(C2).
In the report, the In-Stock - Ordered column displays the result for each corresponding row.

86Public© 2016 SAP SE or an SAP affiliate company. All rights reserved.
How to Work with Excel Report and Interactive AnalysisEXCEL REPORT Tab
The following screenshot shows the result in a clearer way.
5.3.4.3 iaParam Function
The iaParam function retrieves values from the report parameter when you run the report.
Syntax: iaParam("<report parameter code>")
For example:
· =iaParam("Warehouse")
· =iaParam("BP")
Argument Description
<report parameter code> The code of a report parameter.
You can use the iaParam function in the section or filters to retrieve values from the report parameter when yourun the report, and transfer the values to the section as a display value, or to the filter as a filtering value.
For more information about using the iaParam function, see Using Report Parameters.
Note
You cannot combine the iaParam function with functions in Microsoft Excel.
5.3.5 Working with Calculations
You can use all the functions in Microsoft Excel together with the iaCellRef function. For more information aboutthe iaCellRef function, see iaCellRef Function. However, to use the various functions in Microsoft Excel togetherwith the iaCellRef function, you need to enter them manually in cells. For quicker utilizations of Microsoft Excel

How to Work with Excel Report and Interactive AnalysisEXCEL REPORT Tab
Public© 2016 SAP SE or an SAP affiliate company. All rights reserved. 87
functions in Excel Report and Interactive Analysis, you can use the following five quick calculation methods in theCalculation section:
· SUM: adds all of its arguments
· COUNT: counts the number of cells that contain numbers, and counts numbers within the list of arguments
· AVERAGE: returns the average (arithmetic mean) of the arguments
· MIN: returns the smallest number in a set of values
· MAX: returns the largest value in a set of values
For more information about the above Microsoft Excel functions, see the documentation that came with MicrosoftExcel. One way to find the help is to select the cell that uses the function, and choose in the formula bar. In theFunction Arguments window, choose the Help on this function link.
Procedure
To use the quick calculation methods, follow the procedure below:
1. In the Calculation section, drag a function to the cell that you want to display the function results.
The Calculation window appears.
2. In the Calculation dropdown list, you can change the functions.

88Public© 2016 SAP SE or an SAP affiliate company. All rights reserved.
How to Work with Excel Report and Interactive AnalysisEXCEL REPORT Tab
3. In the Reference Cell field, enter the name of the cell to which you want to refer, or select a cell in the section,and the name of that cell is automatically entered.
4. To save the calculation, choose OK.
The Microsoft Excel function, together with the iaCellRef function, appears in the cell to which you drag thequick calculation method.
5.3.6 Working with Time Functions
This feature enables you to retrieve dates and financial period codes dynamically as a list based on your availablestatistics in the database, and to filter your data with the dates and financial period codes it retrieves. You canapply the functions via two approaches, either by dragging them to the section, or by setting them up in theSettings window of the section or group sets.
For time functions, SAP provides the following two types, date functions and period functions. You can apply themaccordingly as follows:
· Apply date functions to dimensions of date and datetime types.
· Apply period functions to the Financial Period Code dimension.

How to Work with Excel Report and Interactive AnalysisEXCEL REPORT Tab
Public© 2016 SAP SE or an SAP affiliate company. All rights reserved. 89
5.3.6.1 Date Functions and Period Functions
Date Functions
Name Description Parameter Example
YTD Retrieves availabledates in the currentcalendar year up to theday you run the report
N/A Running on July 7, 2016, YTD()returns available dates in 2016up to July 7, 2016.
QTD Retrieves availabledates in the currentcalendar quarter up tothe day you run thereport
N/A Running on July 7, 2016, QTD()returns available dates in thethird quarter of 2016 up to July7, 2016.
MTD Retrieves availabledates in the currentcalendar month up tothe day you run thereport
N/A Running on July 7, 2016, MTD()returns available dates in July2016 up to July 7, 2016.
CalendarMonth Retrieves availabledates in the calendarmonth that covers thegiven date
A date in the format ofYYYYMMDD. Whenempty, the default valueis the date on which yourun the report.
CalendarMonth(20160707)returns available dates in July2016.
Running on June 7, 2015,CalendarMonth() returnsavailable dates in June 2015.
CalendarQuarter Retrieves availabledates in the calendarquarter that covers thegiven date
A date in the format ofYYYYMMDD. Whenempty, the default valueis the date on which yourun the report.
CalendarQuarter(20160707)returns available dates in thethird quarter of 2016.
Running on June 7, 2015,CalendarQuarter() returnsavailable dates in the secondquarter of 2015.
CalendarYear Retrieves availabledates in the calendaryear that covers thegiven date
A date in the format ofYYYYMMDD. Whenempty, the default valueis the date on which yourun the report.
CalendarYear(20160707)returns available dates in 2016.
Running on June 7, 2015,CalendarYear() returnsavailable dates in 2015.
SameMonthLastYear Retrieves availabledates in the samemonth as that coveringthe given date, of theprevious year
A date in the format ofYYYYMMDD. Whenempty, the default valueis the date on which yourun the report.
SameMonthLastYear(20160707) returns available dates inJuly 2015.
Running on June 7, 2015,SameMonthLastYear() returnsavailable dates in June 2014.

90Public© 2016 SAP SE or an SAP affiliate company. All rights reserved.
How to Work with Excel Report and Interactive AnalysisEXCEL REPORT Tab
Name Description Parameter Example
SameQuarterLastYear Retrieves availabledates in the samequarter as thatcovering the given date,of the previous year
A date in the format ofYYYYMMDD. Whenempty, the default valueis the date on which yourun the report.
SameQuarterLastYear(20160707) returns available dates inthe third quarter of 2015.
Running on June 7, 2015,SameQuarterLastYear()returns available dates in thesecond quarter of 2014.
LastNMonths Retrieves availabledates in the N calendarmonths before that ofthe given date
· A date in the formatof YYYYMMDD. Whenempty, the defaultvalue is the date onwhich you run thereport.
· The number ofprevious months.When empty, thedefault value is 1.
LastNMonths(20160707, 3)returns available dates in April,May, and June 2016.
Running on June 7, 2015,LastNMonths() returnsavailable dates in May 2015.
LastNQuarters Retrieves availabledates in the N calendarquarters before that ofthe given date
· A date in the formatof YYYYMMDD. Whenempty, the defaultvalue is the date onwhich you run thereport.
· The number ofprevious quarters.When empty, thedefault value is 1.
LastNQuarters(20160707, 3)returns available dates in thefirst and second quarters of2016, and the fourth quarter of2015.
Running on June 7, 2015,LastNQuarters() returnsavailable dates in the firstquarter of 2015.
LastNYears Retrieves availabledates in the N calendaryears before that of thegiven date
· A date in the formatof YYYYMMDD. Whenempty, the defaultvalue is the date onwhich you run thereport.
· The number ofprevious years. Whenempty, the defaultvalue is 1.
LastNYears(20160707, 3)returns available dates in theyears of 2013, 2014, and 2015.
Running on June 7, 2015,LastNYear() returns availabledates in 2014.

How to Work with Excel Report and Interactive AnalysisEXCEL REPORT Tab
Public© 2016 SAP SE or an SAP affiliate company. All rights reserved. 91
Period Functions
Name Description Parameter Example
YTDPeriodsThisFiscalYear Retrieves thefinancial periodcodes in thecurrent fiscalyear up to theday you run thereport
N/A Running on July 7, 2016,YTDPeriodsThisFiscalYear()returns the financial periodcodes in the fiscal year thatcovers July 7, 2016 up to July 7,2016.
FiscalPeriod Retrieves thecode of thefinancial periodthat covers thegiven date
A date in the format ofYYYYMMDD. When empty,the default value is thedate on which you run thereport.
FiscalPeriod(20160707)returns the code of the financialperiod that covers July 7, 2016.
Running on June 7 2015,FiscalPeriod() returns the codeof the financial period thatcovers June 7, 2015.
SamePeriodLastFiscalYear Retrieves thecode of thesame financialperiod as thatcovering thegiven date, ofthe previousfiscal year
A date in the format ofYYYYMMDD. When empty,the default value is thedate on which you run thereport.
SamePeriodLastFiscalYear(20160707) returns the code of thesame financial period as thatcovering July 7, 2016, of theprevious fiscal year.
Running on June 7, 2015,SamePeriodLastFiscalYear()returns the code of the samefinancial period as that coveringJune 7, 2015, of the previousfiscal year.
LastNPeriods Retrieves thecodes of the Nfinancialperiods beforethat of thegiven date
· A date in the format ofYYYYMMDD. Whenempty, the defaultvalue is the date onwhich you run thereport.
· The number ofprevious financialperiods. When empty,the default value is 1.
LastNPeriods (20160707, 3)returns the codes of the threefinancial periods before thatcovering July 7, 2016.
Running on June 7, 2015,LastNPeriods () returns thecode of the financial periodbefore that covering June 7,2015.
AllPeriodsThisFiscalYear Retrieves allfinancial periodcodes in thefiscal year thatcovers the dayyou run thereport
N/A Running on July 7, 2016,AllPeriodsThisFiscalYear()returns all financial periodcodes in the fiscal year thatcovers July 7, 2016.

92Public© 2016 SAP SE or an SAP affiliate company. All rights reserved.
How to Work with Excel Report and Interactive AnalysisEXCEL REPORT Tab
Name Description Parameter Example
AllPeriodsLastFiscalYear Retrieves allfinancial periodcodes in thefiscal yearbefore thatcovering theday you run thereport
N/A Running on July 7, 2016,AllPeriodsThisFiscalYear()returns all financial periodcodes in the fiscal year beforethat covering July 7, 2016.

How to Work with Excel Report and Interactive AnalysisEXCEL REPORT Tab
Public© 2016 SAP SE or an SAP affiliate company. All rights reserved. 93
5.3.6.2 Using Time Functions
This section will provide a general procedure together with two examples of using time functions.
NoteThe Time Function tab appears only when one of the following dimensions exists in the data source youselected:
o Dimensions of date type. Date functions appear when this type of dimension exists.
o Dimensions of datetime type. Date functions appear when this type of dimension exists.
o The Financial Period Code dimension. Period functions appear when this dimension exists.
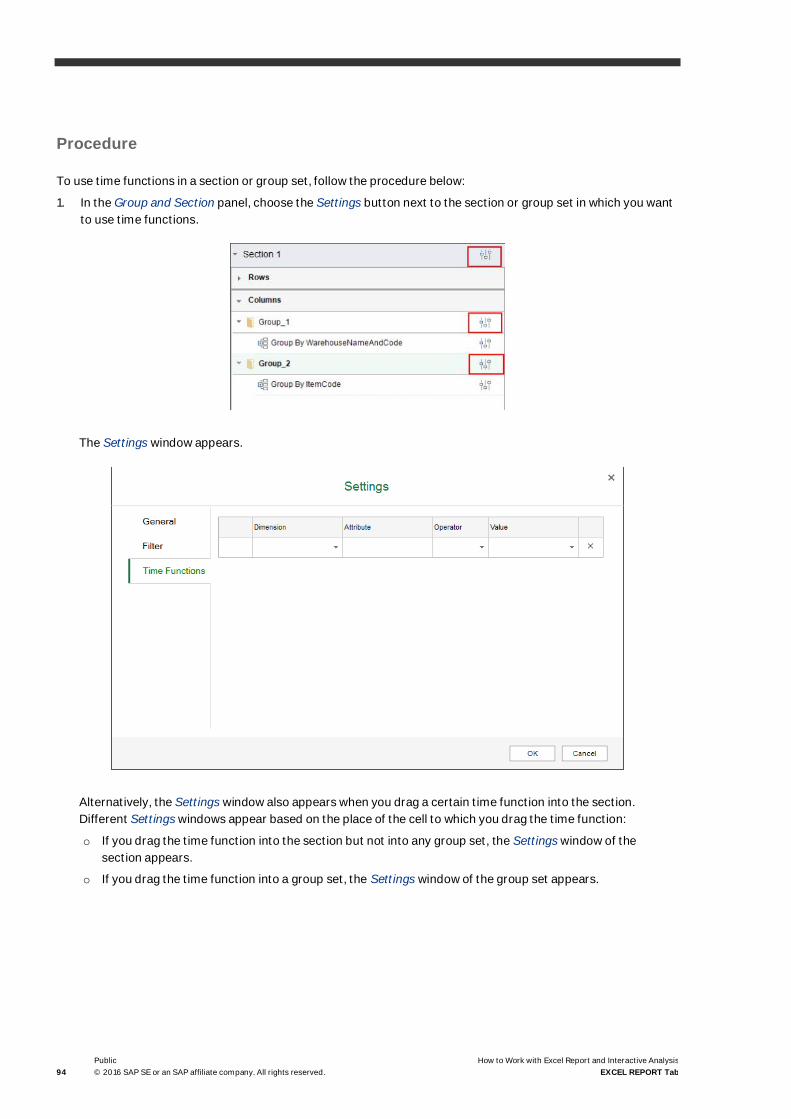
94Public© 2016 SAP SE or an SAP affiliate company. All rights reserved.
How to Work with Excel Report and Interactive AnalysisEXCEL REPORT Tab
Procedure
To use time functions in a section or group set, follow the procedure below:
1. In the Group and Section panel, choose the Settings button next to the section or group set in which you wantto use time functions.
The Settings window appears.
Alternatively, the Settings window also appears when you drag a certain time function into the section.Different Settings windows appear based on the place of the cell to which you drag the time function:
o If you drag the time function into the section but not into any group set, the Settings window of thesection appears.
o If you drag the time function into a group set, the Settings window of the group set appears.

How to Work with Excel Report and Interactive AnalysisEXCEL REPORT Tab
Public© 2016 SAP SE or an SAP affiliate company. All rights reserved. 95
o If you drag the time function to a cell that belongs to both a row and column group, you can choose toopen the Settings window of the row group set, the column group set, or the section.
2. On the Time Functions tab, you can find all the available dimensions in the data source, i.e., all dimensions ofdate and datetime types, and the Financial Period Code dimension.
In the Dimension and Attribute columns, specify the dimension from which you want to retrieve the time-related data.
3. In the Operator column, the equal sign (=) is automatically entered.

96Public© 2016 SAP SE or an SAP affiliate company. All rights reserved.
How to Work with Excel Report and Interactive AnalysisEXCEL REPORT Tab
4. In the Value column, enter the time function or choose the triangle next to the field, and select a time functionin the Time Functions window. Date functions or period functions appear in the window based on thedimension you select in the previous columns. The descriptions of the time function and parameters alsoappear in the window when you select a specific time function.
5. In the bracket of the time function, enter the parameter if it has any.
6. If you define more than one function for the section of group set, define the condition And or Or to combinethem.
Note
You cannot use And and Or on the same Time Functions tab at the same time.
7. To save the settings, choose OK.

How to Work with Excel Report and Interactive AnalysisEXCEL REPORT Tab
Public© 2016 SAP SE or an SAP affiliate company. All rights reserved. 97
Example 1In this example, you will create a report to see the net sales amount for each business partner in specificfinancial periods. To do so, follow the procedure below:
1. In the EXCEL REPORT ribbon, choose New Excel Report.
2. In the Select Data Source window, select Sales Analysis by Document, and choose OK.
3. In the data source panel, under Financial Period, drag Financial Period Code to the worksheet.
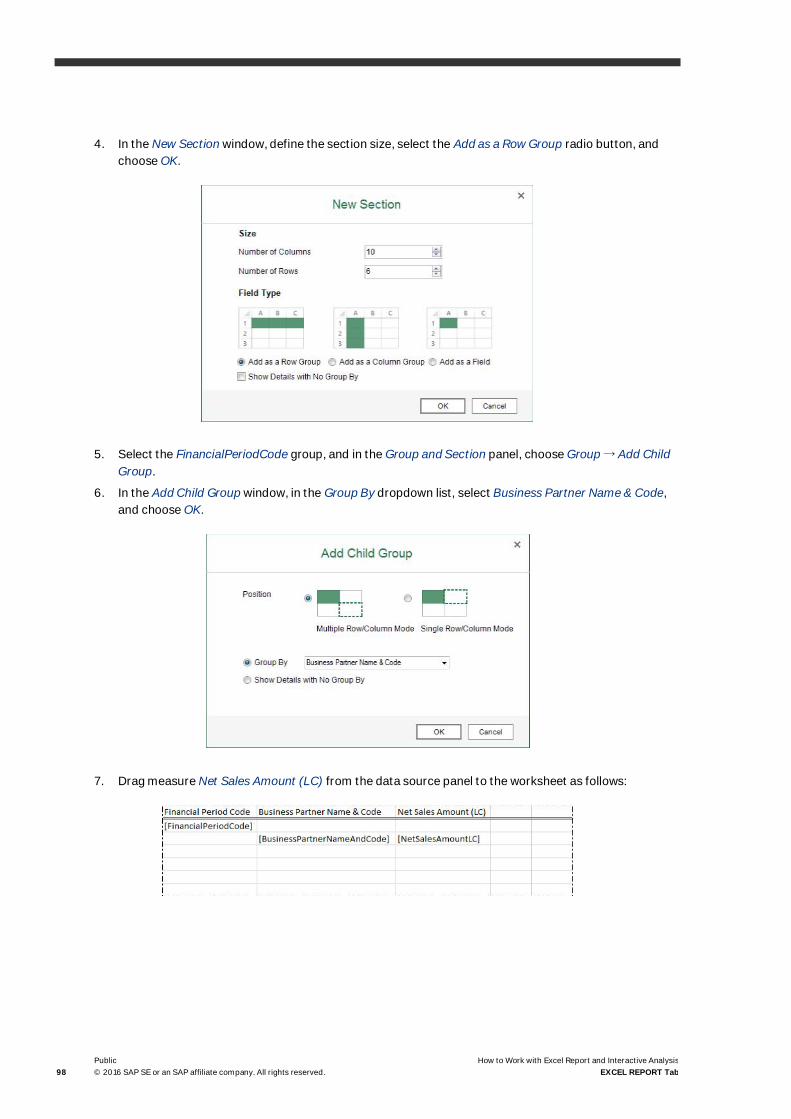
98Public© 2016 SAP SE or an SAP affiliate company. All rights reserved.
How to Work with Excel Report and Interactive AnalysisEXCEL REPORT Tab
4. In the New Section window, define the section size, select the Add as a Row Group radio button, andchoose OK.
5. Select the FinancialPeriodCode group, and in the Group and Section panel, choose Group → Add ChildGroup.
6. In the Add Child Group window, in the Group By dropdown list, select Business Partner Name & Code,and choose OK.
7. Drag measure Net Sales Amount (LC) from the data source panel to the worksheet as follows:

How to Work with Excel Report and Interactive AnalysisEXCEL REPORT Tab
Public© 2016 SAP SE or an SAP affiliate company. All rights reserved. 99
The report result now shows the net sales amount of each business partner in all financial periods asfollows:
You will narrow the financial periods down to only the financial period covering 2012.01.01.
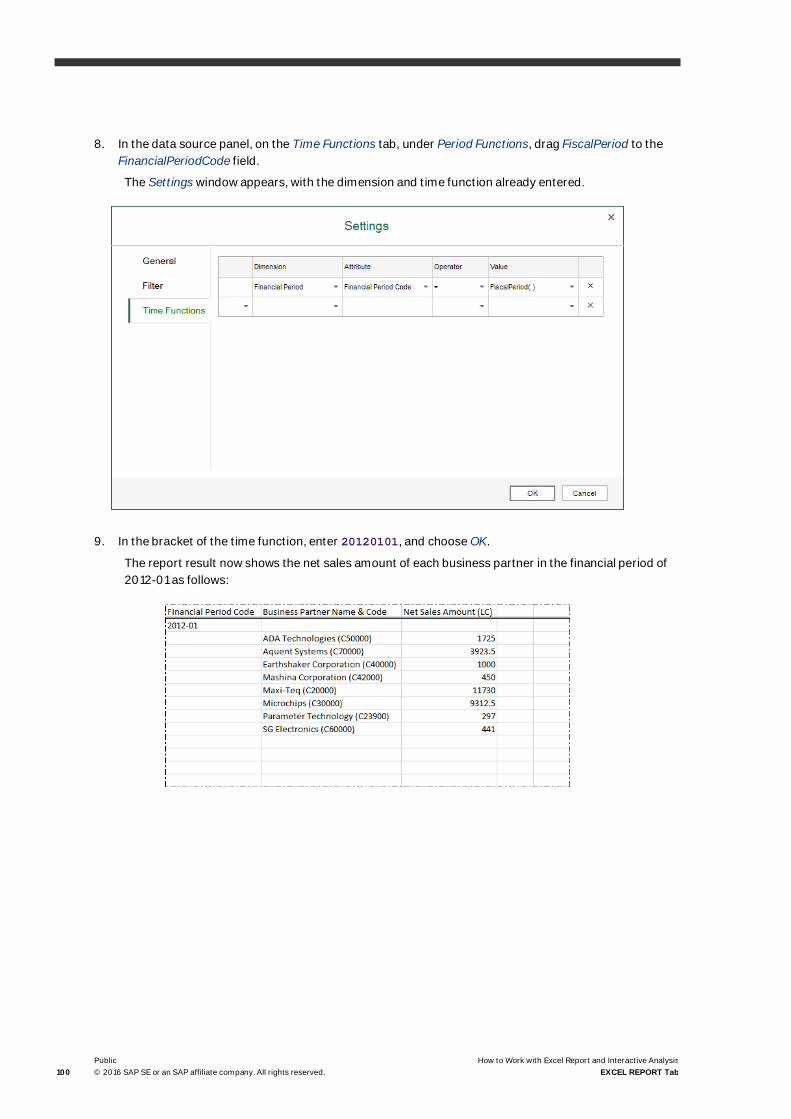
100Public© 2016 SAP SE or an SAP affiliate company. All rights reserved.
How to Work with Excel Report and Interactive AnalysisEXCEL REPORT Tab
8. In the data source panel, on the Time Functions tab, under Period Functions, drag FiscalPeriod to theFinancialPeriodCode field.
The Settings window appears, with the dimension and time function already entered.
9. In the bracket of the time function, enter 20120101, and choose OK.
The report result now shows the net sales amount of each business partner in the financial period of2012-01 as follows:

How to Work with Excel Report and Interactive AnalysisEXCEL REPORT Tab
Public© 2016 SAP SE or an SAP affiliate company. All rights reserved. 101
Example 2In this example, for the predefined report Sales Performance by Customer, you will add a time function tosee the data in the year 2012 specifically.
1. In the EXCEL REPORT ribbon, choose Open Report.
2. In the Open Report window, select Sales Performance by Customer, and choose Open.
The report result now shows the sales quantity and amount of each item for each customer in allhistory as follows:
You will narrow the history down to only the year 2012.

102Public© 2016 SAP SE or an SAP affiliate company. All rights reserved.
How to Work with Excel Report and Interactive AnalysisEXCEL REPORT Tab
3. In the Group and Section panel, choose the Settings button next to the section or group set.
4. On the Time Functions tab of the Settings window, select Posting Dates in the Dimension dropdown listand Posting Date in the Attribute dropdown list, and in the Value column, defineCalendarYear(20120101).
5. In the Settings window, choose OK.
The report result now shows the sales quantity and amount of each item for each customer in onlythe year 2012, as follows:

How to Work with Excel Report and Interactive AnalysisEXCEL REPORT Tab
Public© 2016 SAP SE or an SAP affiliate company. All rights reserved. 103
5.3.7 Managing Excel Reports
You can manage the Excel reports in the Repository Management window.
To open this window, in the EXCEL REPORT ribbon, choose Repository Management.
The Repository Management window appears, listing the following:
· On the left side of the window, you can find the default Excel Report and Interactive Analysis folder structure,with any new folders that you have created.
· On the right side of the window, you can find the information for the folder or report. A predefined folder orreport is tagged Yes in the SAP Predefined field.
o For a predefined folder or report, you cannot change anything.
o For a folder or report that is not predefined, you can change the name and description of the folder, or thename of the report. After modification, choose Update to save the changes.
· In the bottom of the window, you can use the following two buttons to modify the report structure:
o Use the New Folder button to add a child folder to the folder that you selected.
o Use the Delete button to delete reports or empty folders that are not predefined.
5.3.7.1 Predefined Excel Reports
In Excel Report and Interactive Analysis, SAP provides the following predefined Excel reports:
· Sales Performance by Customer: displays the sales performance of each customer for each sales employee.
· Delivery Schedule: displays the delivery schedule of each item for each business partner from eachwarehouse.
· Purchase Analysis Report: displays the purchasing information of each document for each business partner.
· Inventory by Item Group per Warehouse: displays the in-stock inventory quantity, cost price, and in-stockinventory value of items for each item group in each warehouse.
· Sales Opportunities Report: displays the information for each sales opportunity.
· Cost Center - Budget Versus Actual: compares the budget and actual amounts of each cost center in eachdimension.
· Financial Analysis - Transactions by Project: displays every transaction for each project.
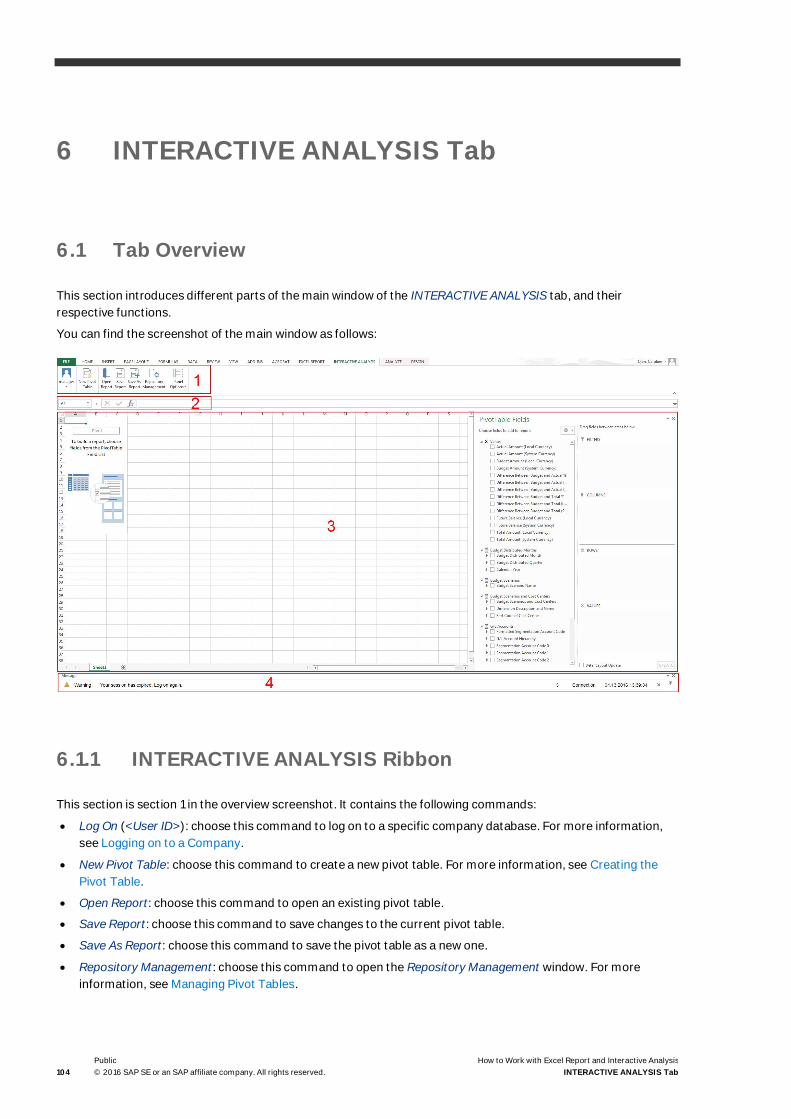
104Public© 2016 SAP SE or an SAP affiliate company. All rights reserved.
How to Work with Excel Report and Interactive AnalysisINTERACTIVE ANALYSIS Tab
6 INTERACTIVE ANALYSIS Tab
6.1 Tab Overview
This section introduces different parts of the main window of the INTERACTIVE ANALYSIS tab, and theirrespective functions.
You can find the screenshot of the main window as follows:
6.1.1 INTERACTIVE ANALYSIS Ribbon
This section is section 1 in the overview screenshot. It contains the following commands:
· Log On (<User ID>): choose this command to log on to a specific company database. For more information,see Logging on to a Company.
· New Pivot Table: choose this command to create a new pivot table. For more information, see Creating thePivot Table.
· Open Report: choose this command to open an existing pivot table.
· Save Report: choose this command to save changes to the current pivot table.
· Save As Report: choose this command to save the pivot table as a new one.
· Repository Management: choose this command to open the Repository Management window. For moreinformation, see Managing Pivot Tables.

How to Work with Excel Report and Interactive AnalysisINTERACTIVE ANALYSIS Tab
Public© 2016 SAP SE or an SAP affiliate company. All rights reserved. 105
· Panel Options: choose this command to display or hide the message panel.
6.1.2 Formula Bar
This section is section 2 in the overview screenshot. It displays the name and content of the cell you select in theworksheet. For more information about the formula bar, see the documentation that came with Microsoft Excel.
6.1.3 Worksheet
This section is section 3 in the overview screenshot. For more information about the worksheet, see thedocumentation that came with Microsoft Excel.
NoteOnly one worksheet is supported.
6.1.4 Message Panel
The behavior is the same as that in the EXCEL REPORT ribbon. For more information, see EXCEL REPORT Ribbon.
6.2 Basic Operations
This section provides an introduction to the INTERACTIVE ANALYSIS tab of the report designer with the SalesAnalysis by Document semantic layer as an example. For more information about using the pivot table tools, referto the documentation that came with Microsoft Excel.
If you encounter problems when creating or opening pivot tables, refer to Troubleshooting.

106Public© 2016 SAP SE or an SAP affiliate company. All rights reserved.
How to Work with Excel Report and Interactive AnalysisINTERACTIVE ANALYSIS Tab
6.2.1 Creating the Pivot Table
Use the blank workbook as a starting point for creating the pivot table.
CautionFor blank workbooks that are NOT opened using one of the two launching methods provided above, youmay encounter errors while using Excel Report and Interactive Analysis.
For example, you may encounter errors while using Excel Report and Interactive Analysis if you open ablank workbook from the New option on the File tab of Microsoft Excel as follows:

How to Work with Excel Report and Interactive AnalysisINTERACTIVE ANALYSIS Tab
Public© 2016 SAP SE or an SAP affiliate company. All rights reserved. 107
Procedure
1. In the INTERACTIVE ANALYSIS ribbon, choose New Pivot Table.
The Select Data Source window appears, displaying all the semantic layers in the SAP HANA model packagethat you have deployed.
The predefined model package was deployed during the database initialization, and for more informationabout customized SAP HANA model packages, see Managing SAP HANA Models in the online help of SAPBusiness One, version for SAP HANA.

108Public© 2016 SAP SE or an SAP affiliate company. All rights reserved.
How to Work with Excel Report and Interactive AnalysisINTERACTIVE ANALYSIS Tab
2. In the Select Data Source window, select Sales Analysis by Document under Multi-Document Scenarios underSales, and choose OK.
[Optional] You can use the search bar at the top of the tree list on the left to look for data sources. To searchfor data sources, enter the semantic layer name, part of the semantic layer name, the name of the dimensionor measure, or part of the dimension or measure name, and choose Enter . Results that match your searchquery appear highlighted in the tree list, and you can choose the data source to see its contents in the table onthe right.

How to Work with Excel Report and Interactive AnalysisINTERACTIVE ANALYSIS Tab
Public© 2016 SAP SE or an SAP affiliate company. All rights reserved. 109
The measures and dimensions of the Sales Analysis by Document semantic layer appear in the PivotTableFields section.
3. In the PivotTable Fields section, from the dimensions list, drag Business Partner to the Rows quadrant.
The Business Partner item appears in the worksheet, and the Business Partner checkbox in PivotTable Fieldsis selected.

110Public© 2016 SAP SE or an SAP affiliate company. All rights reserved.
How to Work with Excel Report and Interactive AnalysisINTERACTIVE ANALYSIS Tab
4. Drag Financial Period to the Columns quadrant.
Note that you do not see any numerical data for now, because you have not selected any measure item.
5. Drag Applied Net Sales Amount (LC) to the Values quadrant.
Microsoft Excel displays the applied net sales amount (LC) in each field, and also displays the grand totals.

How to Work with Excel Report and Interactive AnalysisINTERACTIVE ANALYSIS Tab
Public© 2016 SAP SE or an SAP affiliate company. All rights reserved. 111
6.2.2 Saving the Pivot Table
To save the pivot table, follow the procedure below.
1. In the INTERACTIVE ANALYSIS ribbon, choose Save Report.
2. In the Save window, select the folder in which to place the pivot table, define a name, and choose OK.
Result
All the changes, including the selection of values, dimensions, and filters, are saved. After saving the pivot table,you can perform the following:
· To open the saved pivot tables, in the INTERACTIVE ANALYSIS ribbon, choose Open Report. Alternatively, youcan open the saved pivot tables under the menu entry of Excel Report and Interactive Analysis in the SAPBusiness One, version for SAP HANA client.
NoteFor newly saved pivot tables to appear in the SAP Business One, version for SAP HANA client, you need tolog off the client and log on again.
Note
When you open a saved pivot table, the data is refreshed automatically.
· To manage the saved reports, in the INTERACTIVE ANALYSIS ribbon, choose Repository Management. Formore information, see Managing Pivot Tables.
6.3 Managing Pivot Tables
You can manage the pivot tables in the Repository Management window.
To open this window, in the INTERACTIVE ANALYSIS ribbon, choose Repository Management.
The Repository Management window appears, listing the following:
· On the left side of the window, you can find the default Excel Report and Interactive Analysis folder structure,with any new folders that you have created.
· On the right side of the window, you can find the information for the folder or pivot table. A predefined folder istagged Yes in the SAP Predefined field.
o For a predefined folder, you cannot change anything.
o For a folder that is not predefined or a pivot table, you can change the name and description of the folder,or the name of the pivot table. After modification, choose Update to save the changes.
· In the bottom of the window, you can use the following two buttons to modify the report structure:
o Use the New Folder button to add a child folder to the folder that you selected.
o Use the Delete button to delete pivot tables or empty folders that are not predefined.

112Public© 2016 SAP SE or an SAP affiliate company. All rights reserved.
How to Work with Excel Report and Interactive AnalysisTroubleshooting
7 Troubleshooting
If Excel Report and Interactive Analysis does not work as expected, you can check the following troubleshootinginformation to identify your issues and find solutions, before contacting technical support.
Cannot Create or Open Pivot Tables
Problem
On the INTERACTIVE ANALYSIS tab, after you choose the OK button in the Select Data Source or Open Reportwindow, the following window appears, and you cannot continue creating or opening pivot tables.
Solution
Restart the SAP Business One Services on Linux:
To restart the server tools, log on to the Linux server as root or the <sid>adm user (for example, ndbadm) andthen run the following command:
/etc/init.d/sapb1servertools restart
In addition, to stop or start the server tools, run the following commands respectively:
· /etc/init.d/sapb1servertools stop
· /etc/init.d/sapb1servertools start


www.sap.com/contactsap
© 2016 SAP SE or an SAP affiliate company. All rights reserved.No part of this publication may be reproduced or transmitted in anyform or for any purpose without the express permission of SAP SEor an SAP affiliate company.SAP and other SAP products and services mentioned herein as wellas their respective logos are trademarks or registered trademarks ofSAP SE (or an SAP affiliate company) in Germany and othercountries. All other product and service names mentioned are thetrademarks of their respective companies. Please see http://www.sap.com/corporate-en/legal/copyright/index.epx#trademark foradditional trademark information and notices.