![Borko Jovanovic, MS, PhD Biostatistician [email protected]](https://static.fdocuments.in/doc/165x107/61fb98b72e268c58cd600e97/borko-jovanovic-ms-phd-biostatistician-emailprotected.jpg)
How to Work with a Biostatistician for Power and Sample ...
45
How to Work with a Biostatistician for Power and Sample Size Calculations Amber W. Trickey, PhD, MS, CPH Senior Biostatistician, S-SPIRE 1070 Arastradero #225 [email protected]
Transcript of How to Work with a Biostatistician for Power and Sample ...

How to Work with a Biostatistician for Power and Sample Size
Calculations
Amber W. Trickey, PhD, MS, CPHSenior Biostatistician, S-SPIRE
1070 Arastradero #[email protected]

Goal: Effective Statistical Collaboration
Essentially all models are wrongbut some are useful
George E. P. Box

Topics
• Questions & Measures
• Hypothesis Testing
Research Fundamentals
• Estimation Parameters
• Assumptions
Power and Sample Size
• Communication
• Ethical ConsiderationsStatistical Collaboration
Pro Tips

Health Services/Surgical Outcomes Research
[Ban 2016: Is Health Services Research Important to Surgeons?]
Patient/Disease
• Comparative Effectiveness
• Meta-analyses
• Patient-centered Outcomes
• Decision Analysis
Hospital
• Disparities Research
• Quality Measurement
• Quality Improvement
• Patient Safety
• Implementation Science
Health Policy
• Policy Evaluation
• Cost Effectiveness Analysis
• Workforce

Where to Begin?
Research Question!

Research Question (PICO)
Patient population
• Condition / disease, demographics, setting, time
Outcome of interest
• Treatment effects, patient-centered outcomes, healthcare utilization
Comparison/Control group
• No treatment, standard of care, non-exposed
Intervention
• Procedure, policy, process, treatment

Example Research Question
• Do hospitals with 200+ beds perform better than smaller hospitals?
• Do large California hospitals with 200+ beds have lower surgical site infection rates for adults undergoing inpatient surgical procedures?
• Population: California adults undergoing inpatient surgical procedures with general anesthesia in 2017
• Intervention (structural characteristic): 200+ beds
• Comparison: smaller hospitals with <200 beds
• Outcome: surgical site infections within 30 days post-op
More developed question: specify population & outcome
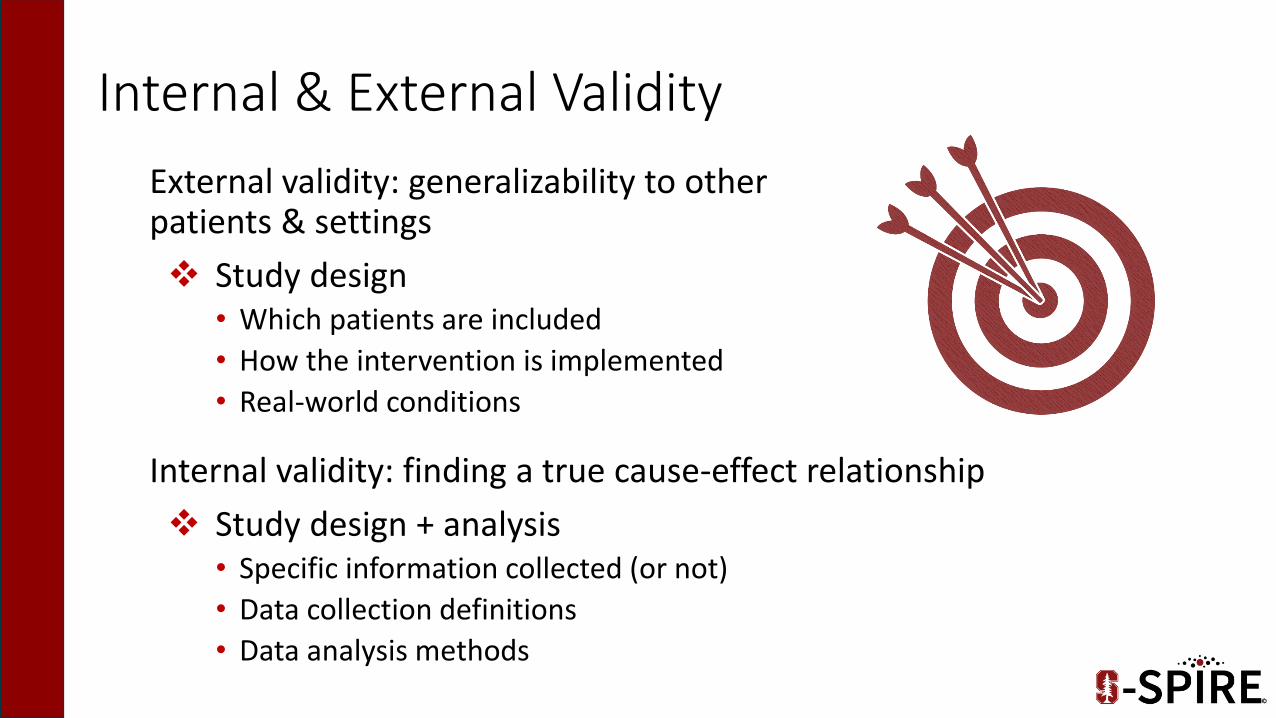
Internal & External Validity
External validity: generalizability to other patients & settings
Study design• Which patients are included
• How the intervention is implemented
• Real-world conditions
Internal validity: finding a true cause-effect relationship
Study design + analysis• Specific information collected (or not)
• Data collection definitions
• Data analysis methods

Variable Types
Independent Variable (primary IV) • Exposure (Intervention)• Occurring first• Causal relationship (?)
DVEffect?
IV (1⁰)Cause?
Confounder
Exposure Outcome
Dependent Variable (DV)• Outcome• Response variable• Occurring after predictors
Confounder(s)• Related to both outcome and exposure• Must be taken into account for internal validity

Variable Measurement Scales
Type of Measurement
Characteristics ExamplesDescriptive
StatsInformation
Content
ContinuousRanked spectrum;
quantifiableintervals
Mean (SD) + all below
Highest
Ordered Discrete Mean (SD) + all below
High
CategoricalOrdinal(Polychotomous)
Orderedcategories
Median Intermediate
Categorical Nominal(Polychotomous)
Unordered Categories
Counts, Proportions
Lower
Categorical Binary (Dichotomous)
Two categoriesCounts,
ProportionsLow
[Hulley 2007]
Weight, BMI
Number of cigs / day
ASA Physical Status Classification
Blood Type, Facility
Sex (M/F), Obese (Y/N)

Measures of Central Tendency
1. Mean = average• Continuous, normal distribution
2. Median = middle• Continuous, nonparametric distribution
3. Mode = most common• Categorical

Box Plot Components:
(75th percentile)
(25th percentile)
range
Variability
• For skewed distributions, range / IQR are more representative of variability than SD.
o E.g. $ and time (hospital charges, length of stay)
• Example measures: o SD = “average” deviation from meano Range = minimum – maximumo Interquartile range = 25th - 75th
percentiles
• Critical for describing & comparing populations.

HypothesisTesting

Hypothesis Testing
• Alternative Hypothesis (HA)
o Assumption being tested for superiority studies
Intervention/treatment has an effect
• Null Hypothesis (H0)
o Default assumption for superiority studies
Intervention/treatment has NO effect, i.e. no difference b/t groups
o Acts as a “straw man”, assumed to be true so that it can be knocked down as false by a statistical test.
• Non-inferiority study hypotheses are reversed: alternative hypothesis = no difference (within a specified range)

Error Types
Type I Error α: False positive
• Finding an effect that is not true
• Due to: Spurious association
• Solution: Repeat the study
Type II Error (β): False negative
• Do not find an effect when one truly exists
• Due to: Insufficient power, high variability / measurement error
• Solution: Increase sample size
Probability α = ?Probability α = 0.05
Hypothesis Testing
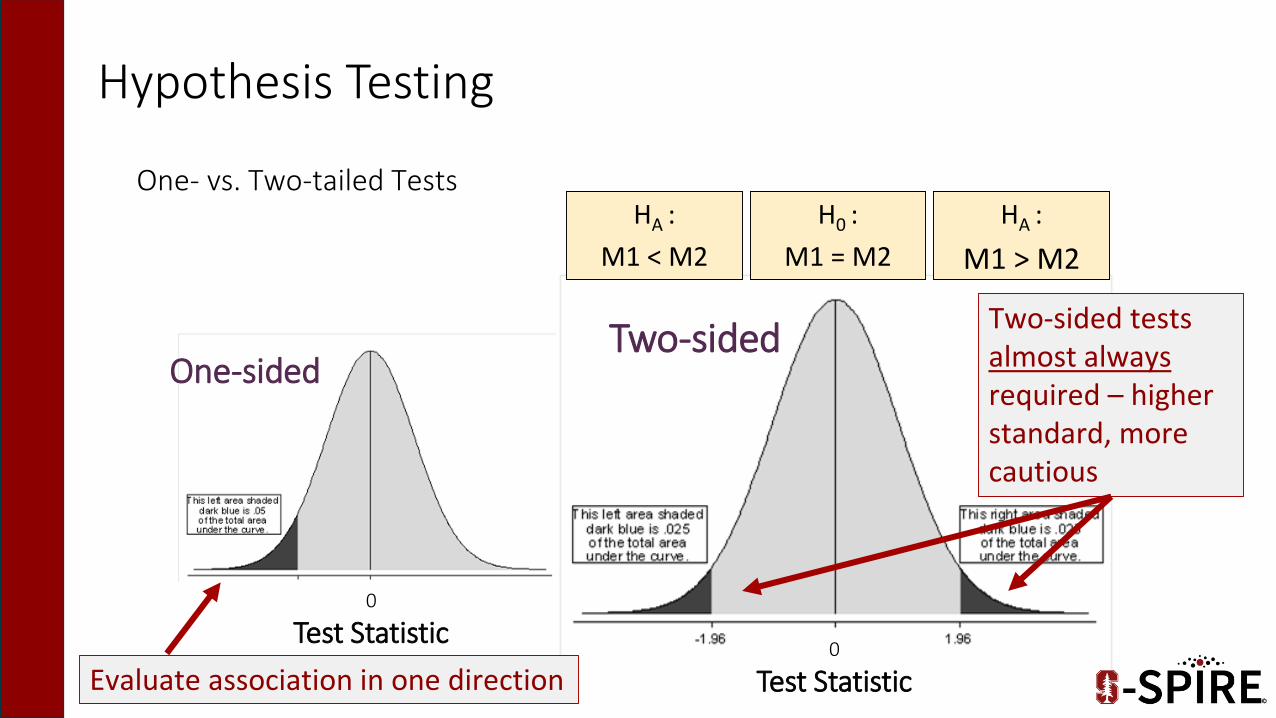
One- vs. Two-tailed Tests
One-sidedTwo-sided
0
Test Statistic
HA :
M1 < M2
HA :
M1 > M2
H0 :
M1 = M2
0
Test Statistic
Evaluate association in one direction
Two-sided tests almost always required – higher standard, more cautious

if the null hypothesis is true.
P-value Definition
The p-value represents the probability
of finding the observed,or a more extreme, test statistic
• Measures evidence against H0
• Smaller p-value, larger evidence against H0
• Reject H0 if p-value ≤ α

P-Value Pitfalls
• P is not dichotomous yes/no, but a continuum, <0.001 to >0.99
• The statistical significance …
does not equal clinical significance
does not equal effect size
Report descriptive statistics with p: n1, n2, %’s, means, SD…
• P is highly dependent on sample size

Which Statistical Test?
1. Number of IVs
2. IV Measurement Scale
3. Independent vs. Matched Groups
4. DV Measurement Scale

Common Regression Models
Outcome
Variable
Appropriate
Regression
Model
Coefficient
Continuous Linear RegressionSlope (β): How much the outcome increases for
every 1-unit increase in the predictor
Binary /
CategoricalLogistic Regression
Odds Ratio (OR): How much the odds for the outcome
increases for every 1-unit increase in the predictor
Time-to-
Event
Cox Proportional-
Hazards Regression
Hazard Ratio (HR): How much the rate of the outcome
increases for every 1-unit increase in the predictor
Count
Poisson Regression
or Negative Binomial
Regression
Incidence Rate Ratio (IRR): How much the rate of the
outcome increases for every 1-unit increase
in the predictor

Nested Data
Hierarchical / Mixed Effects Models
Correlated Data Grouping of subjects Repeated measures
over time Multiple related outcomes
Can handle Missing data Nonuniform measures
Outcome Variable(s) Categorical Continuous Counts
Level 1:Patients
Level 3:Hospitals
Level 2:Surgeons


EstimatingPower

Error Types
Type I Error (α): False positive
• Find an effect when it is truly not there
• Due to: Spurious association
• Solution: Repeat the study
Type II Error β: False negative
• Do not find an effect when one truly exists
• Due to: Insufficient power, high variability / measurement error
• Solution: Increase sample size
Probability β = ?? Probability β = 0.20

Statistical Power
• A study with low power has a high probability of committing type II error.
Sample size planning aims to select a sufficient number of subjects to keep α and β low without making the study too expensive or difficult.
We want to know: How many subjects do we need to find a statistically significant & meaningful effect size?
Power = 1 – β (typically 1 – 0.2 = 0.8)
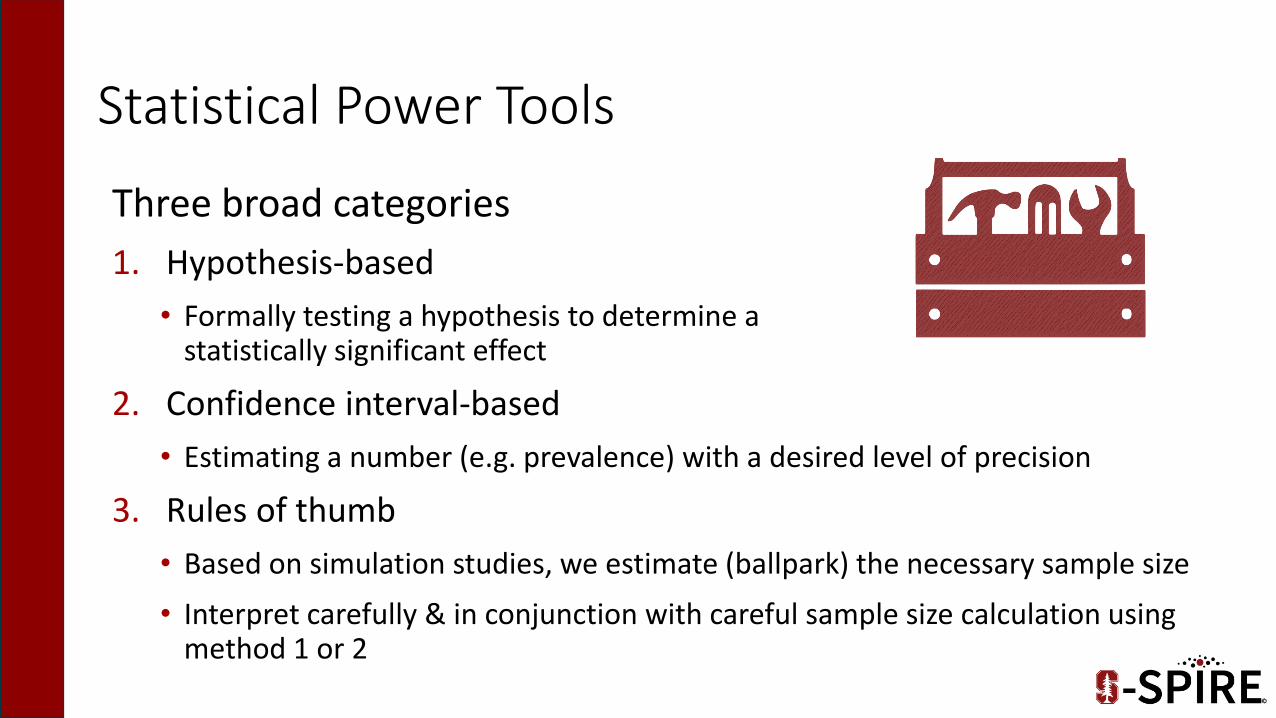
Statistical Power Tools
Three broad categories
1. Hypothesis-based
• Formally testing a hypothesis to determine a statistically significant effect
2. Confidence interval-based
• Estimating a number (e.g. prevalence) with a desired level of precision
3. Rules of thumb
• Based on simulation studies, we estimate (ballpark) the necessary sample size
• Interpret carefully & in conjunction with careful sample size calculation using method 1 or 2

Parameters of (1) Hypothesis-Based Power Calculations
• Outcome of interest
• Study design
• Effect Size
• Allocation ratio between groups
• Population variability
• Alpha (p-value, typically 0.05)
• Beta (1-power, typically 0.1-0.2)
• 1- vs. 2-tailed test

Effect Size
• Cohen’s d: comparison between two means
• d = m1 – m2 / pooled SD
• Small d=0.2; Medium d=0.5; Large d=0.8
• Minimal clinically important difference (e.g. 10% improvement)
• What is the MCID that would lead a clinician to change his/her practice?
• Expected meaningful differences in outcomes per group
• e.g. complications: 10% open vs. 3% laparoscopic
Expect an inverse relationship between effect size & sample size
↑ effect size, ↓ sample size
↓ effect size, ↑ sample size
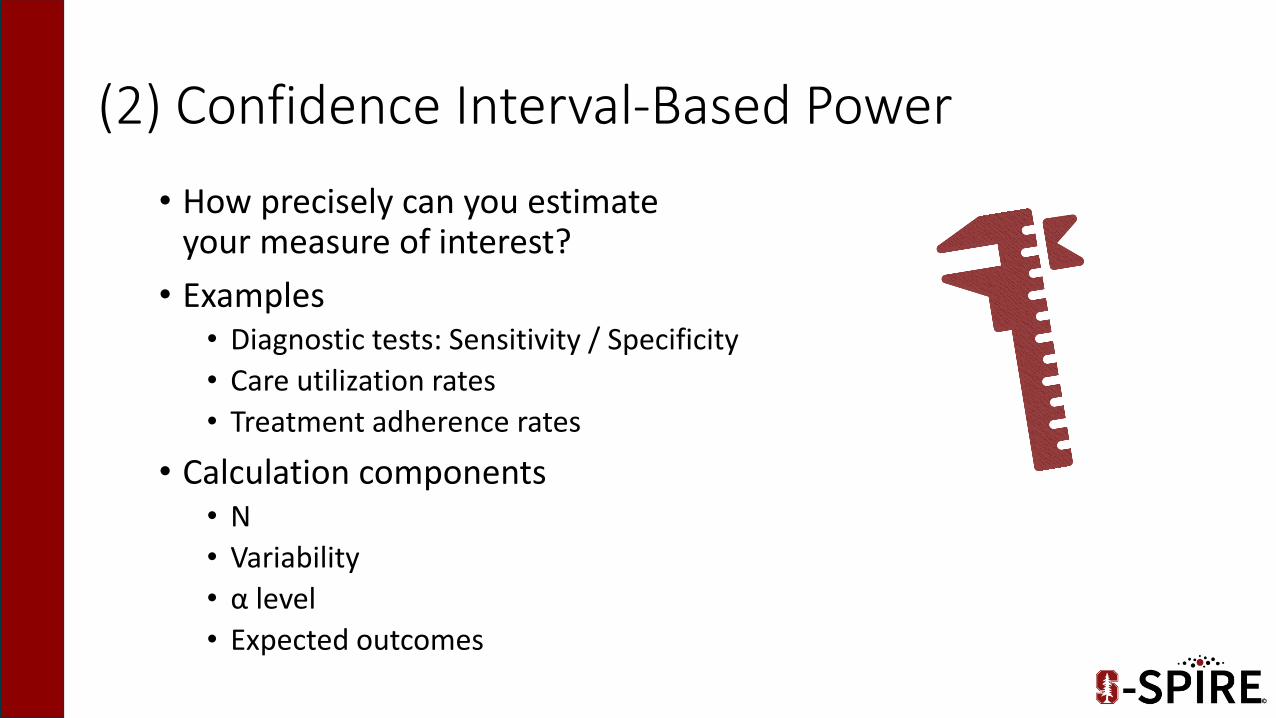
(2) Confidence Interval-Based Power
• How precisely can you estimate your measure of interest?
• Examples• Diagnostic tests: Sensitivity / Specificity
• Care utilization rates
• Treatment adherence rates
• Calculation components• N
• Variability
• α level
• Expected outcomes

(3) Rule of Thumb Power Calculations
• Simulation studies
• Degrees of freedom (df) estimates
• df: the number of IV factors that can vary in your regression model
• Multiple linear regression: ~15 observations per df
• Multiple logistic regression: df = # events/15
• Cox regression: df = # events/15
• Best used with other hypothesis-based or confidence interval-based methods

• Requires many assumptions
Conduct power sensitivity analyses to assess your assumptions
Power Pitfalls
• Effect sizes can vary between populations/sites/studies
• Power estimates should focus on the minimum clinically important difference (MCID)
• If power calculation estimated effect size >> observed effect size, sample may be inadequate or observed effect may not be meaningful.

Collaboration withBiostatisticians

Biostatistics Collaboration
• 2001 Survey of BMJ & Annals of Internal Medicine re: statistical and methodological collaboration
• Stats/methodological support – how often?• Biostatistician 53%• Epidemiologist 32%
• Authorship outcomes given significant contribution• Biostatisticians 78%• Epidemiologists 96%
• Publication outcomes• Studies w/o methodological assistance more likely to be
rejected w/o review: 71% vs. 57%, p=0.001
[Altman, 2002]

Power Questions from your Biostatistician
• What is the research question?
• What is the study design?
• What effect do you expect to observe?
• What other variables may affect your results?
• How many patients are realistic?
• Do you have repeated measures per individual/analysis unit?
• What are your expected consent and follow-up completion rates?
• Do you have preliminary data? • Previous studies / pilot data• Published literature

Stages of Power Calculation
[Pye, 2016]
Study Design
Hypothesis
Sample Size
Simulation/Rules of Thumb
Similar Literature
Feasible?Important?
Other Considerations?

Statistical Power Tips
• Seek biostatistician feedback early
*[Revicki, 2008]
• Report estimated power as a range, varying assumptions and conditions
• Calculate power before the study is implemented• Post hoc power calculations are less useful, unless to inform the next study
• Without pilot data, it is helpful to identify previous research with similar methods• If absolutely no information is available from a reasonable comparison study,
you can estimate power from the minimum clinically important difference*
• Calculations take time and typically a few iterations
International Committee of Medical Journal Editors (ICMJE):“All those designated as authors should meet all four criteria for authorship, and all who meet the four criteria should be identified as authors.”
AuthorshipAuthorship
Epidemiologist/Biostatisticians typically qualify for authorship(Sometimes an acknowledgement is appropriate)
• Authorship plan must be discussed
1. Substantial contributions to the conception or design of the work; or the acquisition, analysis, or interpretation of data for the work; AND
2. Drafting the work or revising it critically for important intellectual content; AND
3. Final approval of the version to be published; AND
4. Agreement to be accountable for all aspects of the work in ensuring that questions related to the accuracy or integrity of any part of the work are appropriately investigated and resolved.

Ethical Principles
• Statisticians aim to be knowledgeable about the system under study, yet recognize the limitations of their subject-matter knowledge
Real data are not “context-free”
• Honest statistical work has nothing to hide – it says what it says
• Admit where models are imperfect or conclusions are model-dependent
• Journal submissions should represent complete, high-quality, best effort
• Routinely take the advice of peer-review referees and editors
Typically their advice is constructive and improves the article
• Give appropriate credit with co-authorship
[Vardeman, 2003: Statistics and Ethics]

How do I collaborate with
?

S-SPIRE Biostatisticians
Qian Ding, MSBiostatistician
Rui Chen, MSBiostatistician
Amber Trickey, PhD, MS, CPH
Senior Biostatistician
Nic Barreto, MPHBiostatistician
Tong Meng, MPPBiostatistician
Kate Arnow, MSBiostatistician

http://med.stanford.edu/s-spire/research/research-collaboration-program.html

Timelines for Initial Collaboration Meeting
1. Conference abstract deadlines
• 4 weeks lead time with data ready for analysis (email 6 weeks out for appt)
2. Special issue or meeting paper deadlines
• 6 weeks lead time with data ready for analysis (email 8 weeks out for appt)
• Depending on the complexity of the analysis proposed, longer lead times may be necessary.
3. Grant application deadlines
• 8-12 weeks lead time (email 10-14 weeks out for appt)
• Statistical tests are tied to the research questions and design; earlier collaboration will better inform grant development
Summary• Power calculations are complex,
but biostatisticians can help
• Contact your biostatistician as early as possible
• Power/sample calculations are iterative and take time
• Gather information prior to meeting
1. Study design
2. Expected effect size
3. Feasible sample size
4. Similar literature
5. Pilot data
• Meet with us at 1070 Arastradero (PI must attend)

References1. Hulley SB, Cummings SR, Browner WS, Grady DG, Newman TB. (2007). Designing Clinical Research. 3rd
ed. Philadelphia, PA: Lippincott Williams & Wilkins.
2. Gordis, L. (2014). Epidemiology. Philadelphia: Elsevier/Saunders.
3. Ban KA, Bilimoria KY. Is health services research important for surgeons? Advances in surgery. 2016 Sep;50(1):143-55.
4. Vardeman SB, Morris MD. Statistics and ethics: some advice for young statisticians. The American Statistician. 2003 Feb 1;57(1):21-6.
5. Altman DG, Goodman SN, Schroter S. How statistical expertise is used in medical research. JAMA. 2002 Jun 5;287(21):2817-20.
6. Pye V, Taylor N, Clay-Williams R, Braithwaite J. When is enough, enough? Understanding and solving your sample size problems in health services research. BMC research notes. 2016 Dec;9(1):90.
7. Revicki D, Hays RD, Cella D, Sloan J. Recommended methods for determining responsiveness and minimally important differences for patient-reported outcomes. Journal of clinical epidemiology. 2008 Feb 1;61(2):102-9.
8. International Committee of Medical Journal Editors. http://www.icmje.org/recommendations/browse/roles-and-responsibilities/defining-the-role-of-authors-and-contributors.html