How to use the Offsets assessment guide · PDF fileHOW TO USE THE OFFSETS ASSESSMENT GUIDE 1....
22
HOW TO USE THE OFFSETS ASSESSMENT GUIDE 1. INTRODUCTION The EPBC Act environmental offsets policy (the policy) outlines the Australian Government’s approach to the use of environmental offsets (‘offsets’) under the Environment Protection and Biodiversity Conservation Act 1999 (EPBC Act). The policy is accompanied by the Offsets assessment guide (the guide). The guide has been developed in order to give effect to the requirements of the policy, utilising a balance sheet approach to estimate impacts and offsets for threatened species and ecological communities. The policy and guide provide a decision support framework in order to normalise the judgements associated with determination of proposed offsets for a given impact. The overarching test of both the policy and the guide is that suitable offsets must deliver an overall conservation outcome that improves or maintains the viability of the aspect of the environment that is protected by national environment law and affected by the proposed action. That is: The guide is used to support application of the policy in the assessment phase of an environmental impact assessment under the EPBC Act, as shown in Figure 1 of the policy. While the policy applies to all protected matters under the EPBC Act for which offsetting is proposed, appropriate and feasible, the guide is only used where the proposed action is likely to have a residual significant impact on a threatened species or ecological community. The guide is a tool to assist expert users in the department in determining the suitability of offset proposals. If the department determines that a proposed offset is not adequate in compensating for a proposed impact, the department will advise the proponent of this, and the proponent will have an opportunity to revise their offset proposal. The guide is also available to proponents to assist with planning for future development proposals and estimating potential future offset requirements. This document provides information about key concepts used in the guide (section 2), and instructions as to how to use it (section 3). The guide, which is shown in Appendix A, is comprised of four parts: Matter of National Environmental Significance assessment box, Impact calculator, Offset calculator, and Summary box. The guide is an Excel spreadsheet with embedded formulae, which can be downloaded at www.environment.gov.au/epbc/publications/environmental-offsets-policy.html . Macros need to be enabled in your browser settings in order to use it. The overarching decision-making framework of the policy and guide is shown in Figure 1.
Transcript of How to use the Offsets assessment guide · PDF fileHOW TO USE THE OFFSETS ASSESSMENT GUIDE 1....

HOW TO USE THE OFFSETS ASSESSMENT
GUIDE
1. INTRODUCTION
The EPBC Act environmental offsets policy (the policy) outlines the Australian Government’s
approach to the use of environmental offsets (‘offsets’) under the Environment Protection and
Biodiversity Conservation Act 1999 (EPBC Act).
The policy is accompanied by the Offsets assessment guide (the guide). The guide has been
developed in order to give effect to the requirements of the policy, utilising a balance sheet
approach to estimate impacts and offsets for threatened species and ecological communities.
The policy and guide provide a decision support framework in order to normalise the
judgements associated with determination of proposed offsets for a given impact. The
overarching test of both the policy and the guide is that suitable offsets must deliver an overall
conservation outcome that improves or maintains the viability of the aspect of the environment
that is protected by national environment law and affected by the proposed action. That is:
The guide is used to support application of the policy in the assessment phase of an
environmental impact assessment under the EPBC Act, as shown in Figure 1 of the policy.
While the policy applies to all protected matters under the EPBC Act for which offsetting is
proposed, appropriate and feasible, the guide is only used where the proposed action is likely
to have a residual significant impact on a threatened species or ecological community.
The guide is a tool to assist expert users in the department in determining the suitability of
offset proposals. If the department determines that a proposed offset is not adequate in
compensating for a proposed impact, the department will advise the proponent of this, and the
proponent will have an opportunity to revise their offset proposal.
The guide is also available to proponents to assist with planning for future development
proposals and estimating potential future offset requirements.
This document provides information about key concepts used in the guide (section 2), and
instructions as to how to use it (section 3).
The guide, which is shown in Appendix A, is comprised of four parts:
Matter of National Environmental Significance assessment box,
Impact calculator,
Offset calculator, and
Summary box.
The guide is an Excel spreadsheet with embedded formulae, which can be downloaded at
www.environment.gov.au/epbc/publications/environmental-offsets-policy.html. Macros need to
be enabled in your browser settings in order to use it.
The overarching decision-making framework of the policy and guide is shown in Figure 1.

2
Figure 1- Determining suitable offsets under the EPBC Act
3
2. DEFINITIONS AND GUIDANCE
A. Annual probability of extinction
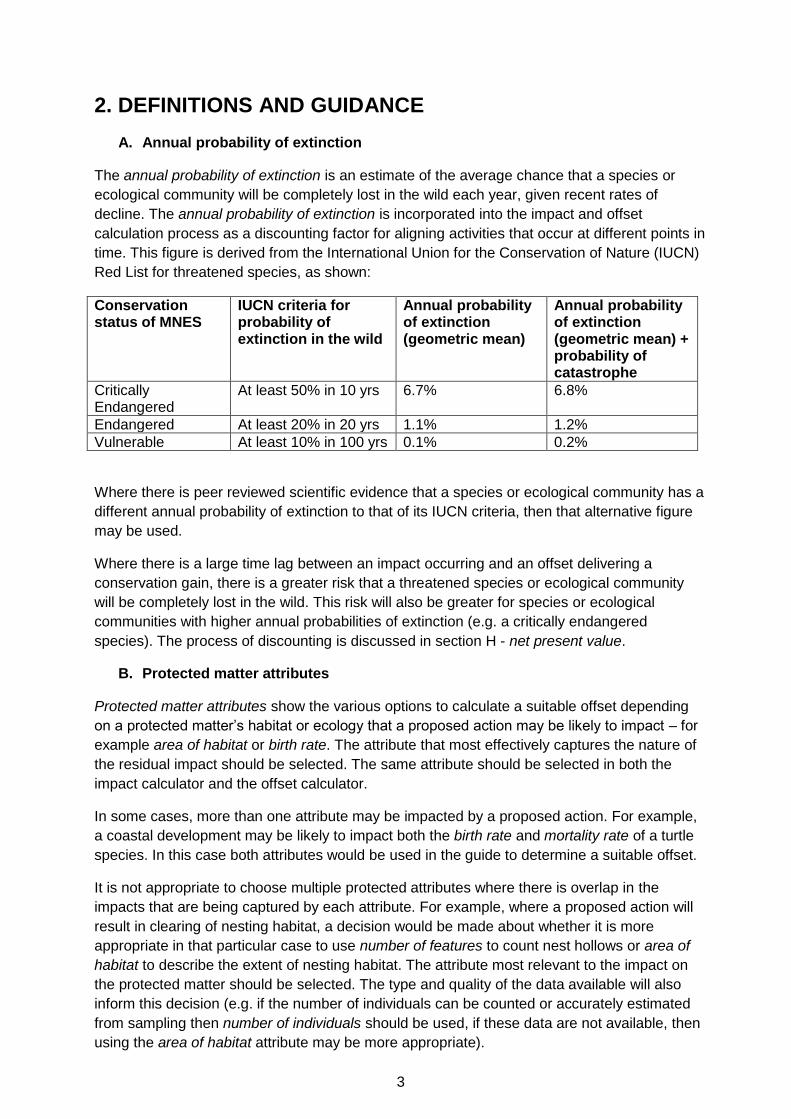
The annual probability of extinction is an estimate of the average chance that a species or
ecological community will be completely lost in the wild each year, given recent rates of
decline. The annual probability of extinction is incorporated into the impact and offset
calculation process as a discounting factor for aligning activities that occur at different points in
time. This figure is derived from the International Union for the Conservation of Nature (IUCN)
Red List for threatened species, as shown:
Conservation status of MNES
IUCN criteria for probability of extinction in the wild
Annual probability of extinction (geometric mean)
Annual probability of extinction (geometric mean) + probability of catastrophe
Critically Endangered
At least 50% in 10 yrs 6.7% 6.8%
Endangered At least 20% in 20 yrs 1.1% 1.2%
Vulnerable At least 10% in 100 yrs 0.1% 0.2%
Where there is peer reviewed scientific evidence that a species or ecological community has a
different annual probability of extinction to that of its IUCN criteria, then that alternative figure
may be used.
Where there is a large time lag between an impact occurring and an offset delivering a
conservation gain, there is a greater risk that a threatened species or ecological community
will be completely lost in the wild. This risk will also be greater for species or ecological
communities with higher annual probabilities of extinction (e.g. a critically endangered
species). The process of discounting is discussed in section H - net present value.
B. Protected matter attributes
Protected matter attributes show the various options to calculate a suitable offset depending
on a protected matter’s habitat or ecology that a proposed action may be likely to impact – for
example area of habitat or birth rate. The attribute that most effectively captures the nature of
the residual impact should be selected. The same attribute should be selected in both the
impact calculator and the offset calculator.
In some cases, more than one attribute may be impacted by a proposed action. For example,
a coastal development may be likely to impact both the birth rate and mortality rate of a turtle
species. In this case both attributes would be used in the guide to determine a suitable offset.
It is not appropriate to choose multiple protected attributes where there is overlap in the
impacts that are being captured by each attribute. For example, where a proposed action will
result in clearing of nesting habitat, a decision would be made about whether it is more
appropriate in that particular case to use number of features to count nest hollows or area of
habitat to describe the extent of nesting habitat. The attribute most relevant to the impact on
the protected matter should be selected. The type and quality of the data available will also
inform this decision (e.g. if the number of individuals can be counted or accurately estimated
from sampling then number of individuals should be used, if these data are not available, then
using the area of habitat attribute may be more appropriate).
4
C. Quality
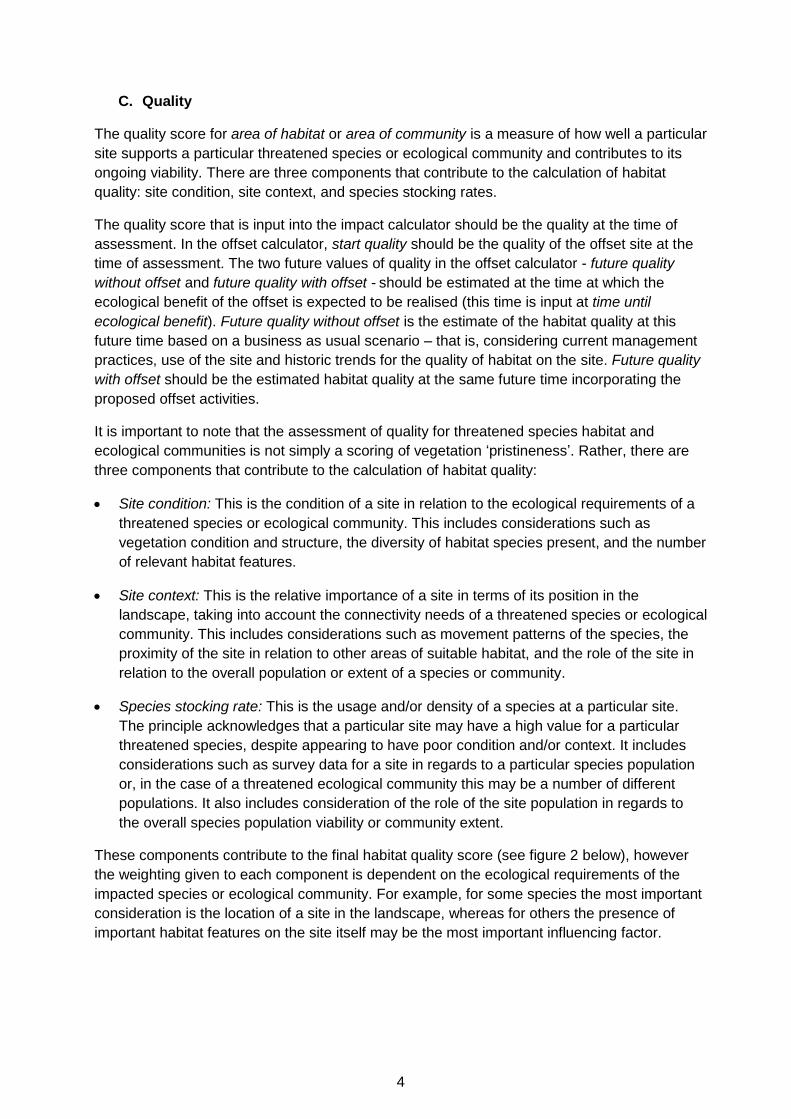
The quality score for area of habitat or area of community is a measure of how well a particular
site supports a particular threatened species or ecological community and contributes to its
ongoing viability. There are three components that contribute to the calculation of habitat
quality: site condition, site context, and species stocking rates.
The quality score that is input into the impact calculator should be the quality at the time of
assessment. In the offset calculator, start quality should be the quality of the offset site at the
time of assessment. The two future values of quality in the offset calculator - future quality
without offset and future quality with offset - should be estimated at the time at which the
ecological benefit of the offset is expected to be realised (this time is input at time until
ecological benefit). Future quality without offset is the estimate of the habitat quality at this
future time based on a business as usual scenario – that is, considering current management
practices, use of the site and historic trends for the quality of habitat on the site. Future quality
with offset should be the estimated habitat quality at the same future time incorporating the
proposed offset activities.
It is important to note that the assessment of quality for threatened species habitat and
ecological communities is not simply a scoring of vegetation ‘pristineness’. Rather, there are
three components that contribute to the calculation of habitat quality:
Site condition: This is the condition of a site in relation to the ecological requirements of a
threatened species or ecological community. This includes considerations such as
vegetation condition and structure, the diversity of habitat species present, and the number
of relevant habitat features.
Site context: This is the relative importance of a site in terms of its position in the
landscape, taking into account the connectivity needs of a threatened species or ecological
community. This includes considerations such as movement patterns of the species, the
proximity of the site in relation to other areas of suitable habitat, and the role of the site in
relation to the overall population or extent of a species or community.
Species stocking rate: This is the usage and/or density of a species at a particular site.
The principle acknowledges that a particular site may have a high value for a particular
threatened species, despite appearing to have poor condition and/or context. It includes
considerations such as survey data for a site in regards to a particular species population
or, in the case of a threatened ecological community this may be a number of different
populations. It also includes consideration of the role of the site population in regards to
the overall species population viability or community extent.
These components contribute to the final habitat quality score (see figure 2 below), however
the weighting given to each component is dependent on the ecological requirements of the
impacted species or ecological community. For example, for some species the most important
consideration is the location of a site in the landscape, whereas for others the presence of
important habitat features on the site itself may be the most important influencing factor.

5
Figure 2 - Key considerations in determining the quality of threatened species and
ecological community habitat
In all cases, habitat quality needs to be assessed consistently on both the impact and offset calculators of the guide. When determining the suitability of a proposed offset using the guide, the minimum
requirement is that the quality score of the offset site (future value with offset) must at least
reach the same value as the quality score of the impact site. For example, an impact on an
area of habitat with a quality of 6 must deliver an offset with a minimum equivalent future
quality with offset score. This may include improving an offset site from a lower score, such as
a 3, to a 6 over a specified time period through the proposed management actions.
Habitat Quality
Evaluate the key ecological attributes of the species or ecological community:
Habitat requirements and variability: What are the nesting, breeding, foraging, dispersal, migration and/or roosting
requirements of the species? What are the various ecological components and occurrence states for the ecological
community?
Lifecycle and population dynamics: What are the key life cycle stages of the species/community? How do these
impact its population viability or ecosystem integrity?
Movement and distribution patterns: How does the species population or ecological community function across
the landscape/ seascape?
Threatening processes: What are the threatening processes contributing to the loss of the species or ecological
community?
Determine site characteristics in relation to species or ecological community ecology:
Site Condition
What is the structure and
condition of the vegetation on
the site?
What is the diversity of relevant
habitat species present
(including both endemic and
non-endemic)?
What relevant habitat features
are on the site?
Site Context
What is the connectivity with
other suitable/known habitat or
remnants?
What is the importance of the
site in relation to the overall
species population or the
occurrence of the community?
What threats occur on or near
site?
Species Stocking Rate
What is the presence of the
species on the site?
(i.e. confirmed / modelled).
What is the density of species
known to utilise the site?
What is the role of the site
population in regards to the
overall species population?
6
D. Time over which loss is averted
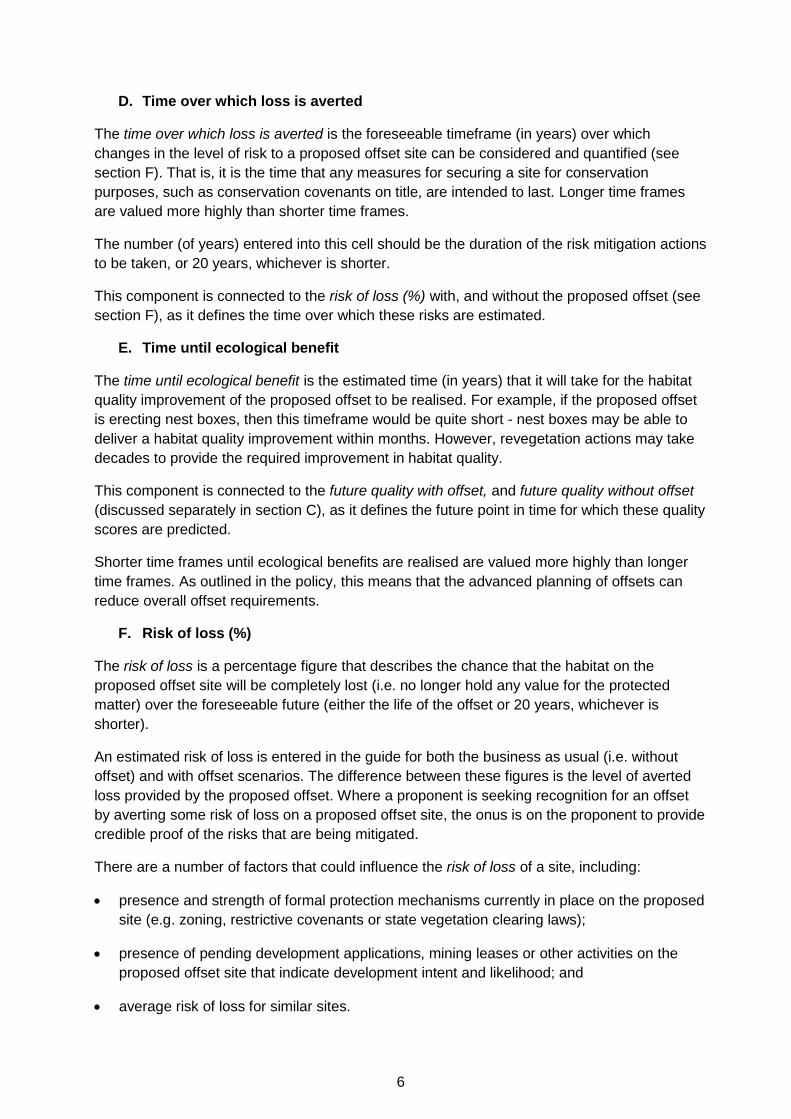
The time over which loss is averted is the foreseeable timeframe (in years) over which
changes in the level of risk to a proposed offset site can be considered and quantified (see
section F). That is, it is the time that any measures for securing a site for conservation
purposes, such as conservation covenants on title, are intended to last. Longer time frames
are valued more highly than shorter time frames.
The number (of years) entered into this cell should be the duration of the risk mitigation actions
to be taken, or 20 years, whichever is shorter.
This component is connected to the risk of loss (%) with, and without the proposed offset (see
section F), as it defines the time over which these risks are estimated.
E. Time until ecological benefit
The time until ecological benefit is the estimated time (in years) that it will take for the habitat
quality improvement of the proposed offset to be realised. For example, if the proposed offset
is erecting nest boxes, then this timeframe would be quite short - nest boxes may be able to
deliver a habitat quality improvement within months. However, revegetation actions may take
decades to provide the required improvement in habitat quality.
This component is connected to the future quality with offset, and future quality without offset
(discussed separately in section C), as it defines the future point in time for which these quality
scores are predicted.
Shorter time frames until ecological benefits are realised are valued more highly than longer
time frames. As outlined in the policy, this means that the advanced planning of offsets can
reduce overall offset requirements.
F. Risk of loss (%)
The risk of loss is a percentage figure that describes the chance that the habitat on the
proposed offset site will be completely lost (i.e. no longer hold any value for the protected
matter) over the foreseeable future (either the life of the offset or 20 years, whichever is
shorter).
An estimated risk of loss is entered in the guide for both the business as usual (i.e. without
offset) and with offset scenarios. The difference between these figures is the level of averted
loss provided by the proposed offset. Where a proponent is seeking recognition for an offset
by averting some risk of loss on a proposed offset site, the onus is on the proponent to provide
credible proof of the risks that are being mitigated.
There are a number of factors that could influence the risk of loss of a site, including:
presence and strength of formal protection mechanisms currently in place on the proposed
site (e.g. zoning, restrictive covenants or state vegetation clearing laws);
presence of pending development applications, mining leases or other activities on the
proposed offset site that indicate development intent and likelihood; and
average risk of loss for similar sites.
7
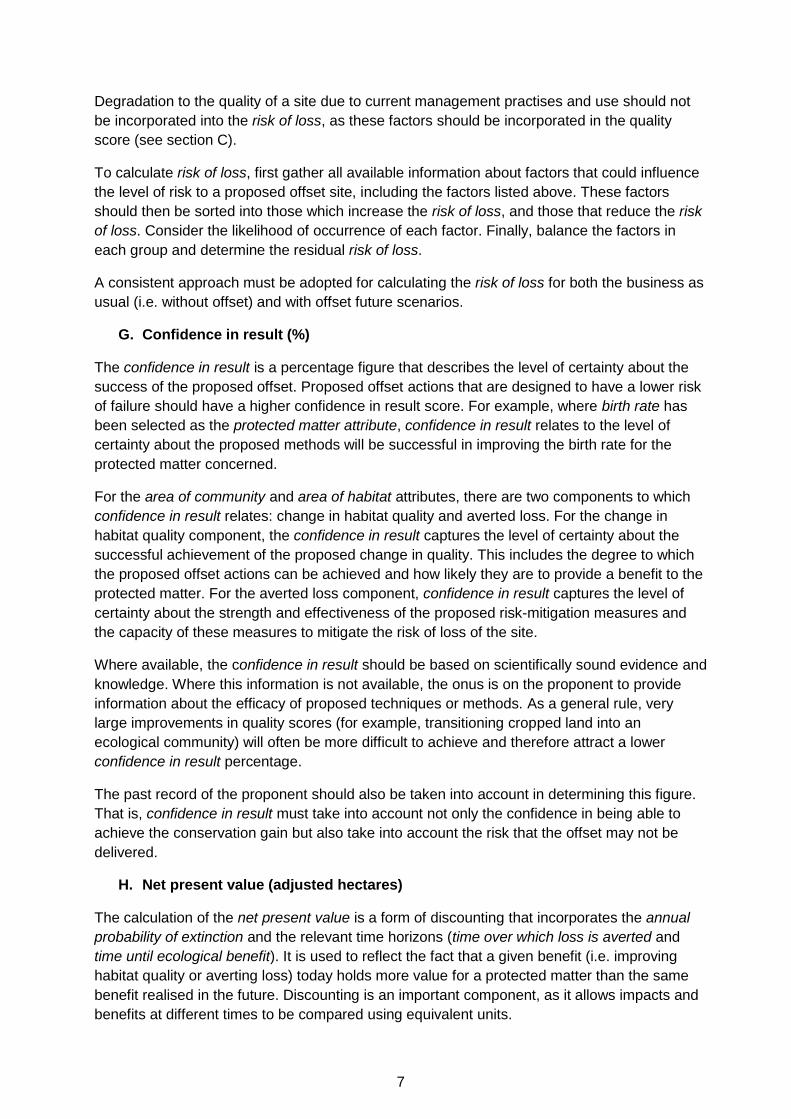
Degradation to the quality of a site due to current management practises and use should not
be incorporated into the risk of loss, as these factors should be incorporated in the quality
score (see section C).
To calculate risk of loss, first gather all available information about factors that could influence
the level of risk to a proposed offset site, including the factors listed above. These factors
should then be sorted into those which increase the risk of loss, and those that reduce the risk
of loss. Consider the likelihood of occurrence of each factor. Finally, balance the factors in
each group and determine the residual risk of loss.
A consistent approach must be adopted for calculating the risk of loss for both the business as
usual (i.e. without offset) and with offset future scenarios.
G. Confidence in result (%)
The confidence in result is a percentage figure that describes the level of certainty about the
success of the proposed offset. Proposed offset actions that are designed to have a lower risk
of failure should have a higher confidence in result score. For example, where birth rate has
been selected as the protected matter attribute, confidence in result relates to the level of
certainty about the proposed methods will be successful in improving the birth rate for the
protected matter concerned.
For the area of community and area of habitat attributes, there are two components to which
confidence in result relates: change in habitat quality and averted loss. For the change in
habitat quality component, the confidence in result captures the level of certainty about the
successful achievement of the proposed change in quality. This includes the degree to which
the proposed offset actions can be achieved and how likely they are to provide a benefit to the
protected matter. For the averted loss component, confidence in result captures the level of
certainty about the strength and effectiveness of the proposed risk-mitigation measures and
the capacity of these measures to mitigate the risk of loss of the site.
Where available, the confidence in result should be based on scientifically sound evidence and
knowledge. Where this information is not available, the onus is on the proponent to provide
information about the efficacy of proposed techniques or methods. As a general rule, very
large improvements in quality scores (for example, transitioning cropped land into an
ecological community) will often be more difficult to achieve and therefore attract a lower
confidence in result percentage.
The past record of the proponent should also be taken into account in determining this figure.
That is, confidence in result must take into account not only the confidence in being able to
achieve the conservation gain but also take into account the risk that the offset may not be
delivered.
H. Net present value (adjusted hectares)
The calculation of the net present value is a form of discounting that incorporates the annual
probability of extinction and the relevant time horizons (time over which loss is averted and
time until ecological benefit). It is used to reflect the fact that a given benefit (i.e. improving
habitat quality or averting loss) today holds more value for a protected matter than the same
benefit realised in the future. Discounting is an important component, as it allows impacts and
benefits at different times to be compared using equivalent units.

8
The discount factor used in the guide is the annual probability of extinction for specific listed
threatened species categories (see section A). Discounting by this factor adjusts the value of a
future benefit according to the likelihood that the protected matter will be extant at the time that
the main benefit of the proposed offset becomes available.

9
3. INSTRUCTIONS FOR USE
PART A: AREA OF HABITAT AND AREA OF COMMUNITY
The guide comprises cells that have different requirements as per the key below.
Key to Cell Colours
User input required
Drop-down list
Calculated output
Not applicable to attribute
Step 1 – Matter of National Environmental Significance box
Add the name and conservation status of the impacted protected matter as listed under the
EPBC Act. If more than one species/ecological community is impacted then a separate
worksheet should be used for each impacted protected matter (noting that offset requirements
for multiple species/ecological communities could overlap if one offset could compensate for
impacts to more than one species/ecological community).
Once the conservation status of the impacted protected matter is entered, the annual
probability of extinction is automatically displayed.
Matter of National Environmental Significance
Name Species or ecological community
name
EPBC Act status Select status
Annual probability of extinction
Based on IUCN category definitions
Where there is peer reviewed scientific evidence that a species or ecological community has a
different annual probability of extinction to that of its IUCN criteria, then that alternative figure
may be used by selecting “other” from the EPBC Act status box. This will bring up a separate
box in which a different probability of extinction and relevant information source can be
entered.
Other annual probability of extinction Information source

10
Step 2 – Select the relevant impact attribute(s)
Move to the impact calculator.
These instructions refer to area of habitat or area of community. For all other attributes, refer
to Part B.
Choose either area of habitat (if the protected matter is a threatened species)
Area of Habitat Yes
or area of community (if the protected matter is an endangered ecological community)
Area of Community Yes
by selecting Yes from the drop down box under the column attribute relevant to case? This
activates the row.
Step 3 – Impact description column
In the activated row in the description column of the impact calculator insert a description of
the impacts that the proposed action is likely to have on the protected matter. This does not
affect the impact calculation but provides important reference information.
Step 4 – Quantum of impact column
The quantum of impact column assesses how big the impact is. In the case of the area of
habitat or area of community row, this integrates considerations of area of impact and quality
of habitat, to provide a total quantum of impact.
First insert the estimated area of impact into the area box.
Area
Hectares
The quality box relates to the quality of the habitat for the protected matter on a scale of 0-10.
See section 2 C for further guidance. After considering relevant factors, insert the relevant
number in the quality box.
Quality
Scale 0-10
11
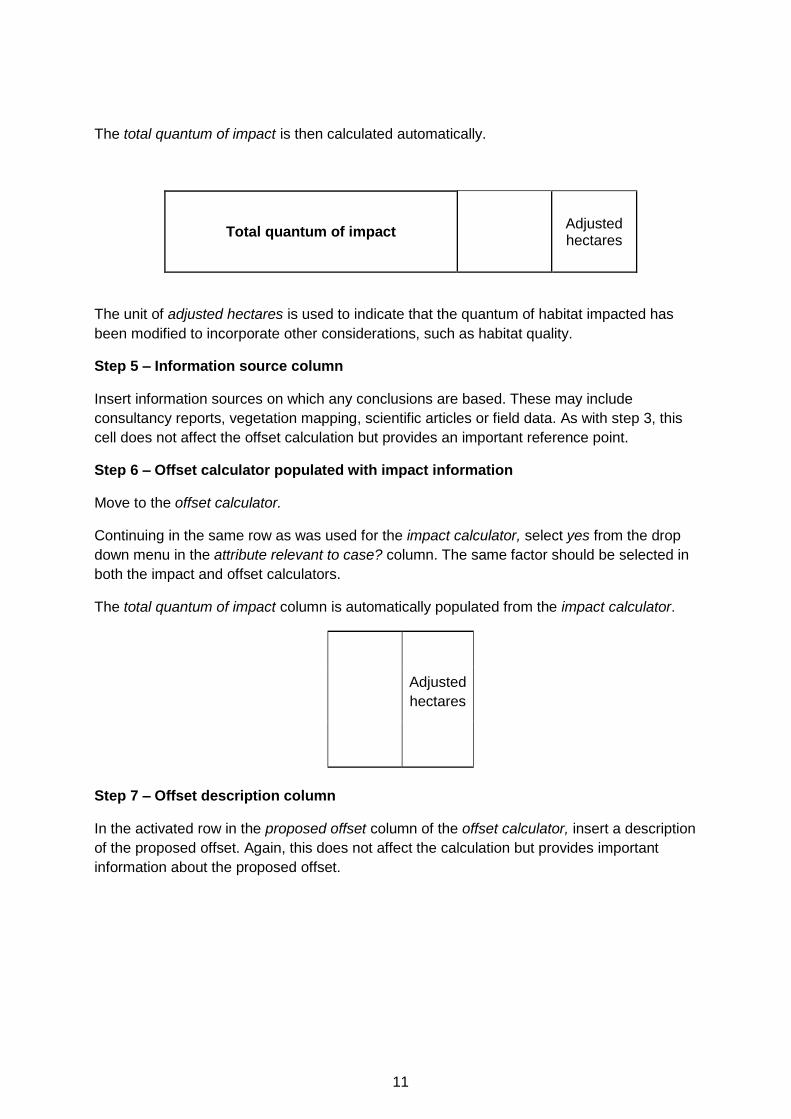
The total quantum of impact is then calculated automatically.
Total quantum of impact
Adjusted hectares
The unit of adjusted hectares is used to indicate that the quantum of habitat impacted has
been modified to incorporate other considerations, such as habitat quality.
Step 5 – Information source column
Insert information sources on which any conclusions are based. These may include
consultancy reports, vegetation mapping, scientific articles or field data. As with step 3, this
cell does not affect the offset calculation but provides an important reference point.
Step 6 – Offset calculator populated with impact information
Move to the offset calculator.
Continuing in the same row as was used for the impact calculator, select yes from the drop
down menu in the attribute relevant to case? column. The same factor should be selected in
both the impact and offset calculators.
The total quantum of impact column is automatically populated from the impact calculator.
Adjusted
hectares
Step 7 – Offset description column
In the activated row in the proposed offset column of the offset calculator, insert a description
of the proposed offset. Again, this does not affect the calculation but provides important
information about the proposed offset.

12
The next group of columns with headers shaded in pink all go toward calculating the figure in
net present value (adjusted hectares), the darker pink column. The calculation row is split at
this stage and the two components of conservation gain, averted loss and change in quality,
are treated separately as time frames and confidence levels may differ between the two
components.
Time
horizon
(years)
Start area
and quality
Future area
and quality
without
offset
Future
area and
quality
with offset
Raw gain
Confidence
in result
(%)
Adjusted
gain
Net
present
value
(adjusted
hectares)
Step 8 – Time horizon (years) column The box titled time over which loss is averted (max. 20 years) captures the time over which
averted loss can be calculated. This is capped at 20 years or the life of an offset, whichever is
shorter (see section 2 D for further information).
The box titled time until ecological benefit captures the time it will take for the habitat quality
improvement of the proposed offset to be realised (see section 2 E for further information).
Time over
which loss
is averted
(max. 20
years)
Time until
ecological
benefit
Step 9 – Start area and quality
The current area and quality of the proposed offset is inserted here.
Start area
(hectares)
Start quality
(scale of 0-10)

13
Step 10 – Future area and quality without offset
This column, along with the column future area and quality with offset contributes to a
calculation of the likely future quality and extent of the proposed offset site in two different
possible futures: one where an area is not used as the proposed offset, and the other where it
is used as the proposed offset. This calculation is described in Steps 10 to 14. The difference
between the future values of the proposed offset site in these two possible futures is then
calculated in the net present value (adjusted hectares) column (Step 15).
The averted loss component can be calculated by comparing the risk of loss without the
proposed offset with the risk of loss with the offset (discussed further at section 2 F). These
boxes sit above the arrow in the offset calculator.
Risk of loss (%)
without offset %
Future area without
offset (adjusted
hectares)
Begin by calculating the risk of loss to the proposed site without the offset and inserting this
figure in the risk of loss (%) without offset cell. A figure is then automatically calculated for the
future area without offset (adjusted hectares) cell based on the start area and the risk of loss
(%) without offset.
Step 11 – Future area and quality with offset
The risk of loss (%) with offset is the level of risk when either the area of habitat or area of
community attributes is used as an offset. A similar calculation to that in Step10 is performed
to determine the future area with offset (adjusted hectares).
Risk of loss
(%) with
offset
%
Future area
with offset
(adjusted
hectares)

14
Step 12 – Start quality and Future quality without offset (scale of 0-10) boxes
The change in quality component can be calculated by comparing the future quality without
offset with the future quality with offset. These boxes sit below the arrow in the offsets
calculator.
Start
quality
(scale of
0-10)
Future
quality
without
offset
(scale
of 0-10)
Begin by determining the current quality of the proposed offset site (discussed further in
section 2 C) and inserting the quality score in the cell for start quality (scale of 0-10). Next,
select the predicted future quality of the proposed offset at the time at which the ecological
benefit of the offset is expected to be realised (this time is input at time until ecological
benefit), based on a hypothetical scenario where it is not used as an offset. For example, if the
quality of the proposed offset is currently considered to be moderate (e.g. value =5), but is
being managed inadequately and is therefore likely to degrade over the specified time horizon,
then a lower quality value would be selected here (e.g. value = 2).
Step 13 – Future quality (with offset) box
Select the habitat quality score that the proposed offset measures intend to achieve (as
discussed in section 2 C).
Step 14 – Calculating adjusted gain using confidence in result (%)
The adjusted gain is calculated for both averted loss and change in quality by multiplying the
raw gain by the confidence in result.
Insert the confidence in result. This is a percentage that records the level of certainty regarding
the success of the proposed offset (see section 2 G).
Raw Gain
Confidence
in result
(%)
Adjusted
Gain
Future
quality
with offset
(scale of 0-
10)

15
Step 15 – Net present value (adjusted hectares)
This column calculates the net present value (adjusted hectares) of the proposed offset taking
into account the annual probability of extinction and the relevant time horizons (time over
which loss is averted and time until ecological benefit) with the adjusted gain for both the
averted loss and change in quality components.
The final net present value score is determined by calculating the sum of the improvement in
quality and the averted loss resulting from the proposed offset. This is calculated automatically
and expressed in adjusted hectares, which are the same units as for the total quantum of
impact (adjusted hectares):
The final score of the net present value (adjusted hectares) is equal to the sum of two
components of conservation gain. One relates to the change in quality, and the other relates to
the level of averted loss.
This is calculated based on the following formula:
Step 16 – Percentage of impact offset column This is calculated automatically and describes the degree to which the proposed offset
compensates for the total quantum of impact. This is calculated by dividing the net present
value of the proposed offset by the total quantum of impact and multiplying both by 100.
Step 17 - Minimum (90%) Direct Offset requirement met?
This is calculated automatically. The proposed offset is considered to have fulfilled the direct
offset requirement if it achieves at least 90% of the total offset requirement. In this case yes
will appear in the box under minimum (90%) direct offset requirement met?
Step 18 - Cost ($ Total) column
The estimated cost of the offset should be entered here. Where a direct offset does not meet
100% of the impact, this figure is used to calculate a dollar value for the other compensatory
measures required in an offset package.
Strong evidence must be provided by the proponent to support any estimate of cost.
Step 19 – Information source column
Insert information source on which any assumptions are based. These may be consultancy
reports, vegetation mapping, scientific articles or field data.

16
Step 20 – Summary
If the direct offset is between 90% and 100% move to the summary box below the offset
calculator to see the calculated requirement for other compensatory measures (in dollars).
The summary box incorporates the cost of the direct offset and the percentage of impact that
has been offset to determine the cost associated with other compensatory measures. All
values are automatically populated from the offset calculator.
Other compensatory measures are based on a diminishing marginal returns relationship
between cost and percentage of impact offset. This relationship recognises that for each
additional percentage point of impact that is offset, the marginal cost of offsetting increases.
The formula used to calculate this is:
P = the percentage of impact that has been offset, expressed as a decimal (e.g. 90% = 0.9)
c = a constant based on the relationship between Cost and proportion of impact offset for a
particular project
Cost = the cost of offsetting a certain proportion of the impact
k = the rate of diminishing marginal return, set as 3.
The process for calculating the cost of other compensatory measures occurs automatically in
the spreadsheet. It can be explained in three steps.
1. The cost of offsetting the % of impact offset is used to calculate the value of c. For example,
if it cost $6000 to offset 90% of the impact then Cost= 6000 and P = 0.9, and this calculates
c=0.0495.
2. The cost of offsetting 100% of the impact is calculated using the previously derived value of
c and setting P at 1. For example, if c = 0.0495 and P = 1, then this calculates Cost = $8230.
3. The cost of other compensatory measures is calculated from the difference between the
total coast and the cost of direct offsets. For example, $8230-$ 6000 = $2230.
17
PART B: NUMBER OF FEATURES, CONDITION OF HABITAT, BIRTH RATE, MORTALITY
RATE, AND NUMBER OF INDIVIDUALS
Step 1 – Matter of National Environmental Significance box
Enter the name and EPBC Act status of the threatened species or ecological community as
described in Part A above.
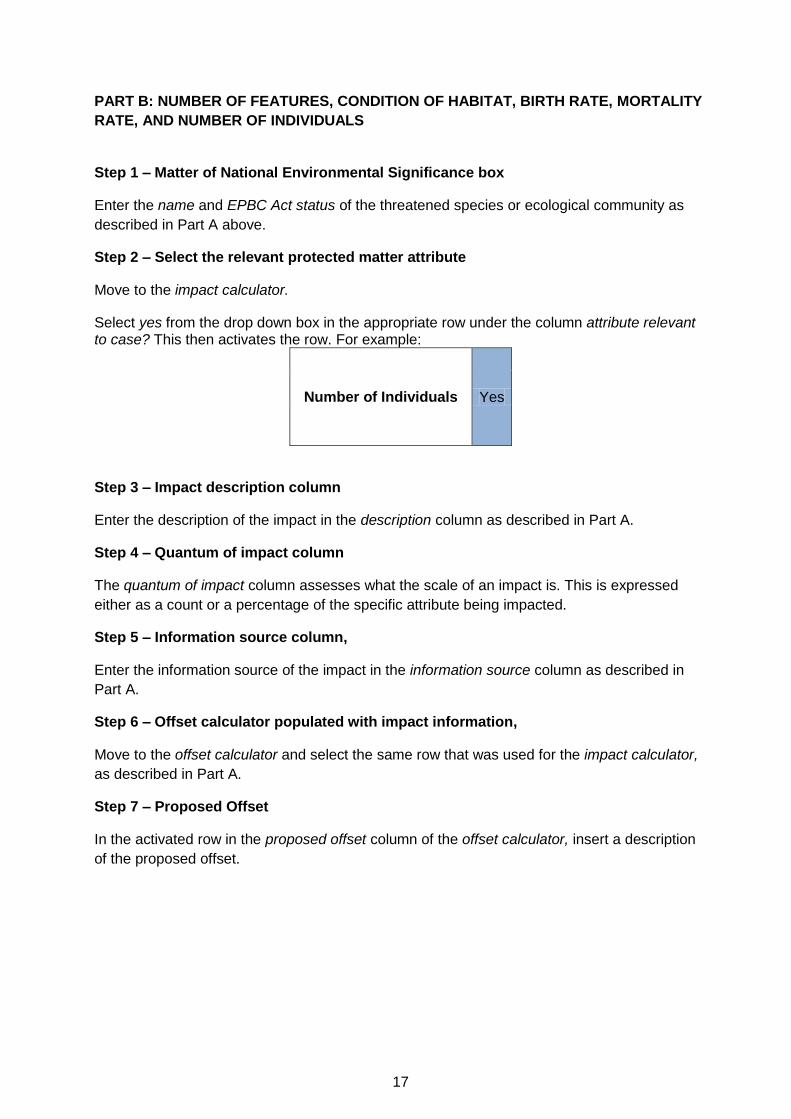
Step 2 – Select the relevant protected matter attribute
Move to the impact calculator.
Select yes from the drop down box in the appropriate row under the column attribute relevant to case? This then activates the row. For example:
Number of Individuals Yes
Step 3 – Impact description column
Enter the description of the impact in the description column as described in Part A.
Step 4 – Quantum of impact column
The quantum of impact column assesses what the scale of an impact is. This is expressed
either as a count or a percentage of the specific attribute being impacted.
Step 5 – Information source column,
Enter the information source of the impact in the information source column as described in
Part A.
Step 6 – Offset calculator populated with impact information,
Move to the offset calculator and select the same row that was used for the impact calculator,
as described in Part A.
Step 7 – Proposed Offset
In the activated row in the proposed offset column of the offset calculator, insert a description
of the proposed offset.

18
The next group of columns with headers shaded in pink all go toward calculating the figure in
the net present value (adjusted hectares), the darker pink column.
Time
horizon
(years)
Start value
Future
value
without
offset
Future
value with
offset
Raw gain
Confidence
in result
(%)
Adjusted
Gain
Net
present
value
Step 8 – Time horizon (years) column
This column refers to the proposed timeframe between the impact and the delivery of the
proposed offset.
Step 9 – Start value
The column start value describes the current value of the protected matter attribute. In some
cases this may be 0 – for instance if a proposed offset was the erection of nest boxes, and
there were currently no nest boxes or nesting sites at the offset site, then the start value would
be 0.
Step 10 – Future value without offset column
The columns future value without offset and future value with offset (steps 10 and 11)
contribute to a calculation of the likely future value of the proposed offset in two scenarios; one
where it is used as an offset and the other where it is not used as an offset. The difference
between the future value of the proposed offset in these two scenarios is then calculated in the
raw gain column in Step 12.
Insert the future value without offset. In some cases the future value without offset may be 0
as there will be no benefit without the proposed offset occurring (as with the example given
above, the nest boxes will not exist in the future without the offset occurring).
Step 11 – Future value with offset column
Insert the future value with offset. This is what the proponent is proposing as a suitable offset
for the proposed impact. Examples include compensating for impacted habitat features
erecting nest boxes, propagating or breeding individuals or undertaking measures that reduce
the mortality rate or increase the birth rate for an impacted threatened species.
Step 12 – Raw gain column
The raw gain is the difference between the total future value with offset and total future value
without offset. This is automatically calculated.
Step 13 – Confidence in result (%) column
Insert the confidence in result. This is a percentage that records the level of certainty regarding
the success of the proposed offset (see section 2 G).
19
Step 14 – Adjusted gain column
The adjusted gain is calculated by multiplying the raw gain by the confidence in result. This is
calculated automatically.
Step 15 – Net present value column
This column calculates the net present value of the proposed offset taking into account the
annual probability of extinction, the time horizon and the adjusted gain:
The annual probability of extinction was derived in Step 1. This is calculated automatically.
Step 16 – Percentage of impact offset column, Step 17 – Minimum (90%) direct offset
requirement met?, Step 18 – Cost ($ Total) column, Step 19 – Information source
column, and Step 20 – Summary
The above steps are all as described in Part A.

APPENDIX A – COMPONENTS OF THE EPBC ACT OFFSETS ASSESSMENT GUIDE
Annual probability of
extinction:
The annual probability of extinction
is an estimate of the chance that a
species will be completely lost in the
wild, given recent rates of decline.
Protected matter attributes:
These are the aspects of a
protected matter or its habitat that
are considered in quantifying an
impact and a proposed offset.
Quality:
The quality score for area of habitat
is a measure of how well a
particular site supports a particular
threatened species or ecological
community and contributes to its
ongoing viability.

2
Time over which loss is
averted:
This describes the timeframe over
which changes in the level of risk to
a proposed offset site can be
considered and quantified.
Time until ecological benefit:
This describes the estimated time
(in years) that it will take for the
main benefit of the habitat quality
improvement component of the
proposed offset to be realised.
Quality:
The quality score for area of habitat
is a measure of how well a
particular site supports a particular
threatened species or ecological
community and contributes to its
ongoing viability.
Risk of loss (%):
This describes the chance that the
habitat on the proposed offset site
will be completely lost (i.e. no longer
hold any value for the protected
matter of concern) over the
foreseeable future.
Confidence in result (%):
This describes the level of certainty
about the success of the proposed
offset.
Net present value:
The net present value calculation
incorporates the fact that a given
benefit today holds more value for a
protected matter than the same
benefit realised in the future.

1
% of impact offset
This is an assessment how much of
the offset requirement is met in
percentage terms.
The general requirement is that
direct offsets must make up at least
90% of the offset package.
Direct offset ($)
This is the actual or estimated cost
of the proposed offset.
Strong evidence must be provided
by the proponent to support any
estimate of cost.
Other compensatory
measures
This calculates the value of other
compensatory measures required
in instances where a direct offset
does not meet 100% of the offset
requirement.