How To Understand Where Your Advertising Turkish Liras Are Going on Mobile
45
-
Upload
mobile-istanbul -
Category
Mobile
-
view
249 -
download
1
Transcript of How To Understand Where Your Advertising Turkish Liras Are Going on Mobile

Leading the Mobile Advertising Analytics Market
AppsFlyer 81%
MobileAppTracking 75%
Apsalar 75%
adjust 58%
Kochava 16%
Leading in Scale
Leading in Retention
How are SDKs actually being used? March 13, 2015

Back to Basics

Mobil Reklamlarİçin FaydaAnalitiği
What is it
Why do you need it
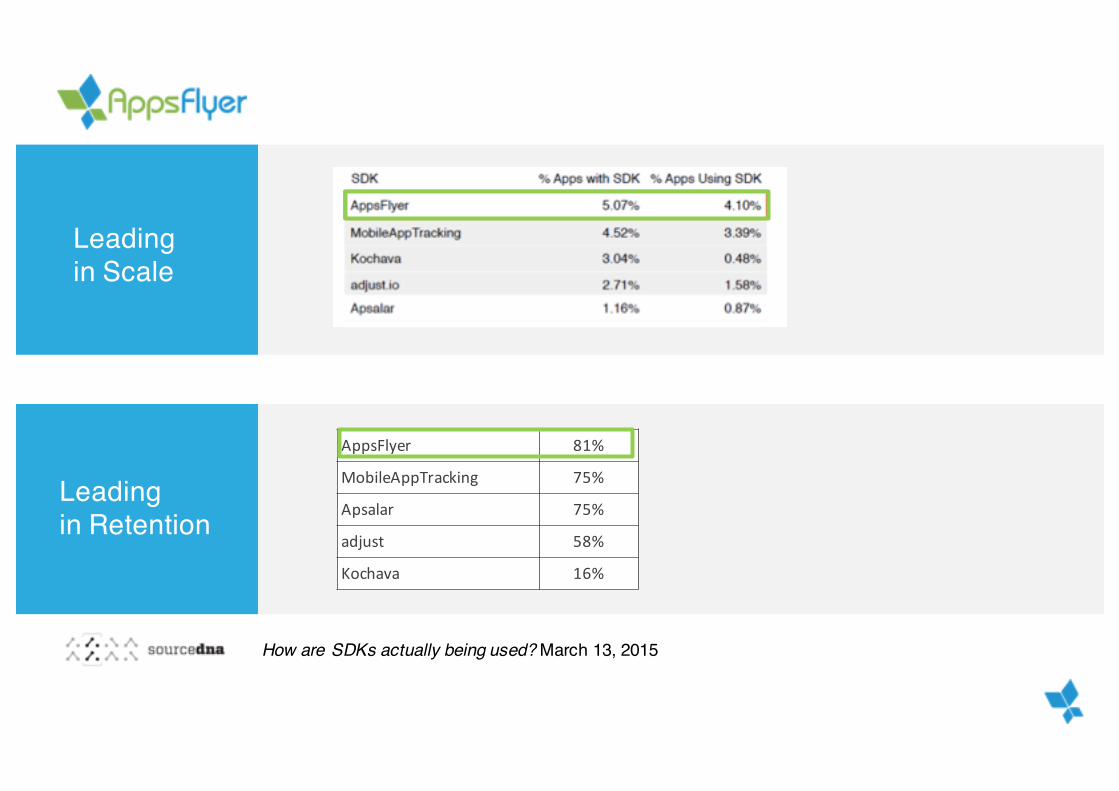
Advertisers
BeforeAd Networks Users

Advertisers
Ad Networks Users
Agencies
Campaign Analytics Attribution Authority
Ads Validation Optimization
CPA Enablement Agencies
Retargeting One Universal SDK
Advertisers
YOUR DATA
After

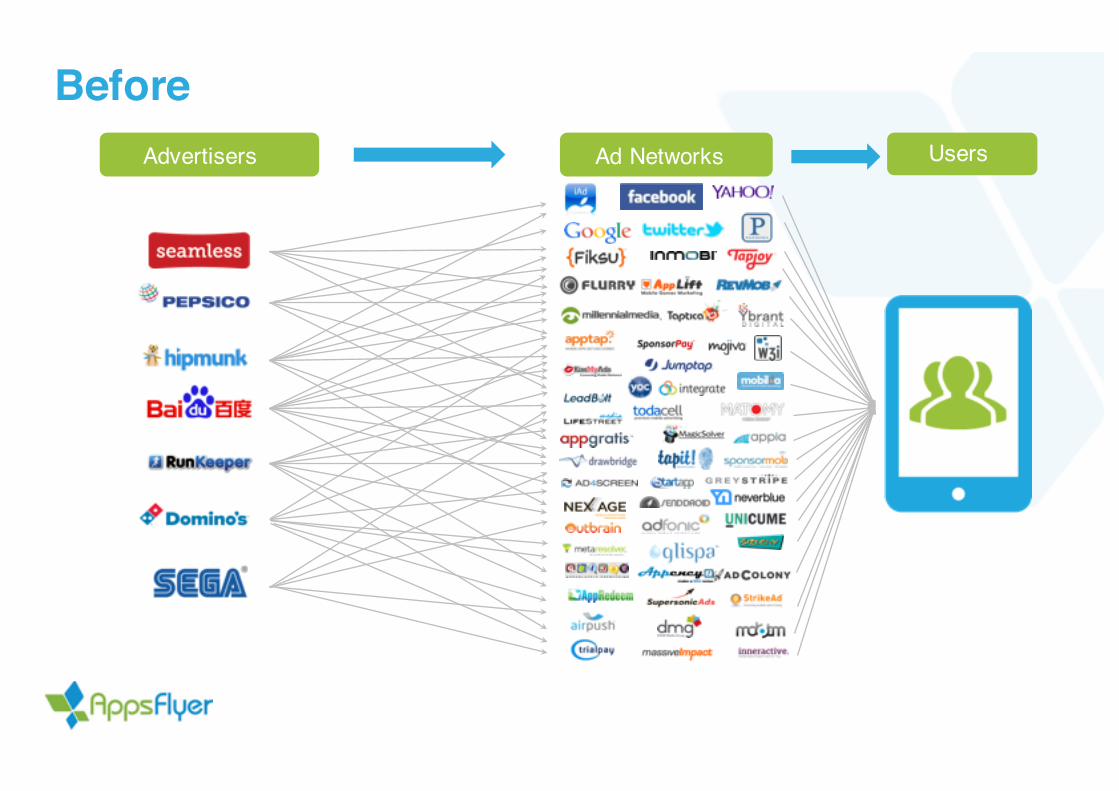
A Device is just as flooded and so are the app stores with numerous apps just waiting for their chance
42
APPS
APPS1.4M
32% 55% 87%USE 5-9 USE 1-4 USE 10
APPS PER DAY
APPS PER DEVICE
1.5M


This is your last chance. After this, there is no turning back. You take the blue pill - the story ends, you wake up in your bed and believe whatever you want to believe. You take the red pill - you stay in Wonderland and I show you how deep the rabbit hole goes.
True ROI?

Believe whatever you want to believe…
Exclude cost from your calculations
Continue living in a world of data silos
Ignore online-offline connection
Poor KPI tracking

…or see how deep the rabbit hole goes.
Focus on Tracking Revenue-Driven KPIs, Everywhere
Go Beyond Last Click Attribution
Measure Omni-Channel Impact
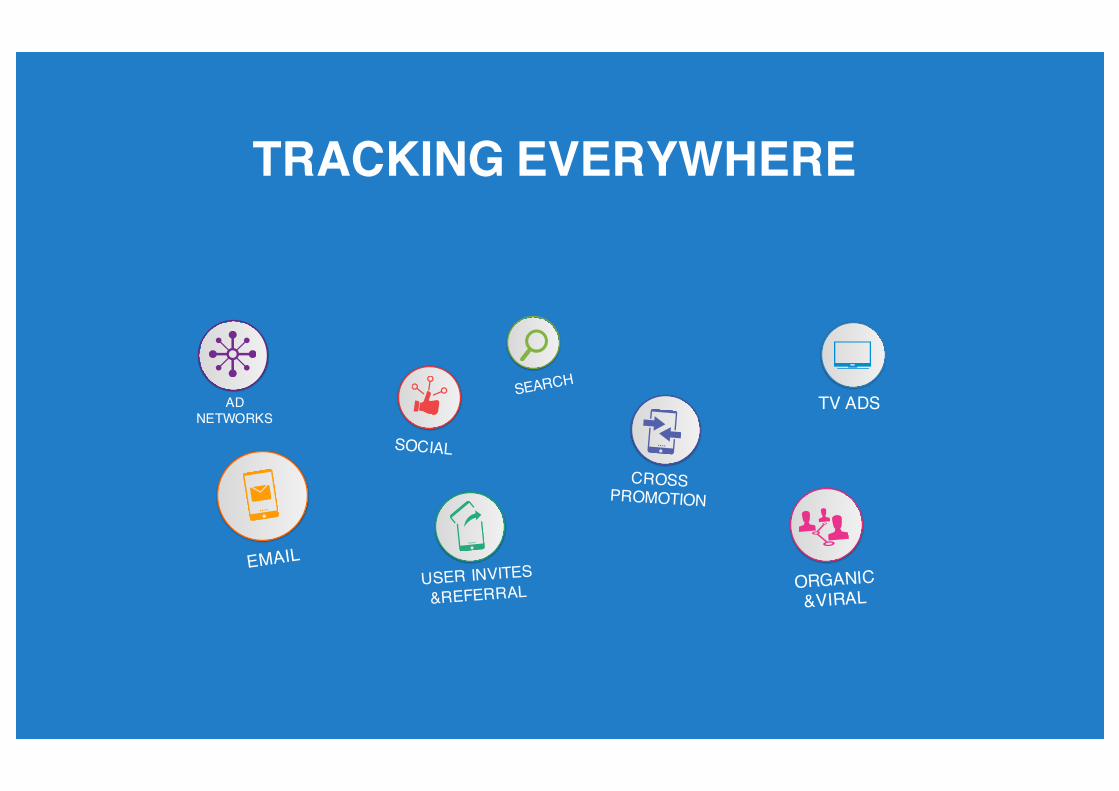
TRACKING EVERYWHERE
AD NETWORKS
TV ADS
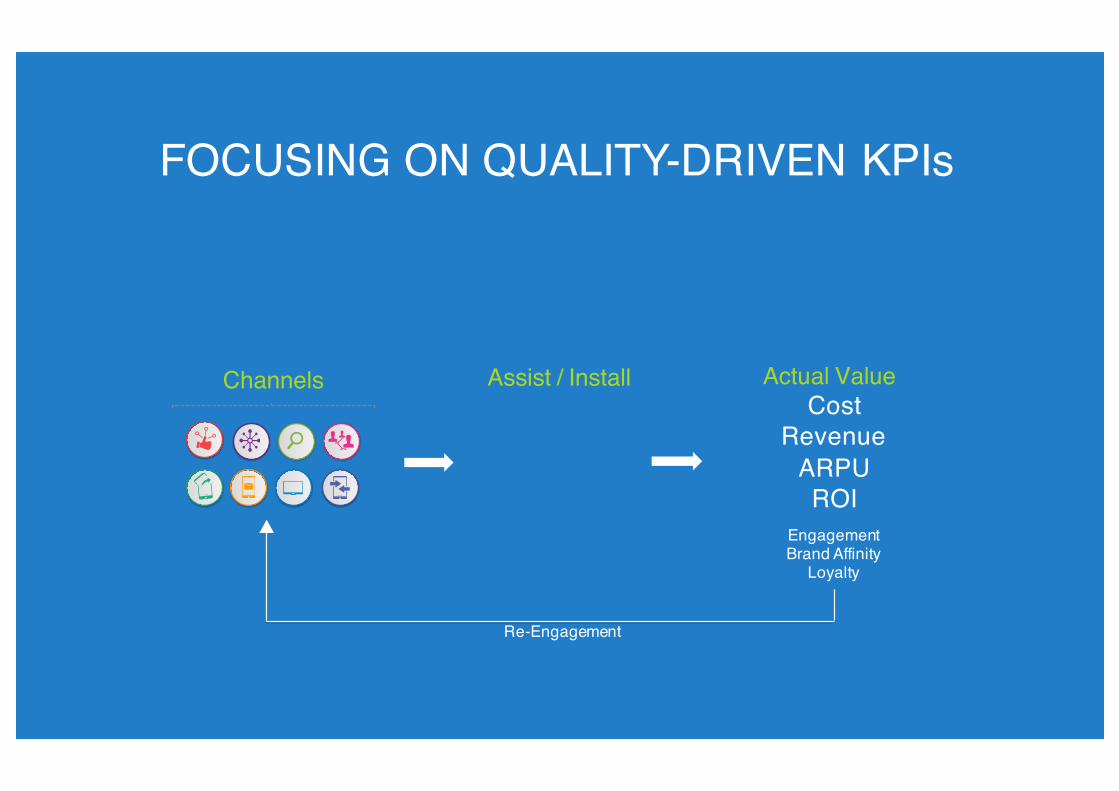
Channels Actual ValueAssist / InstallCost
RevenueARPUROI
EngagementBrand Affinity
Loyalty
Re-Engagement
FOCUSING ON QUALITY-DRIVEN KPIs
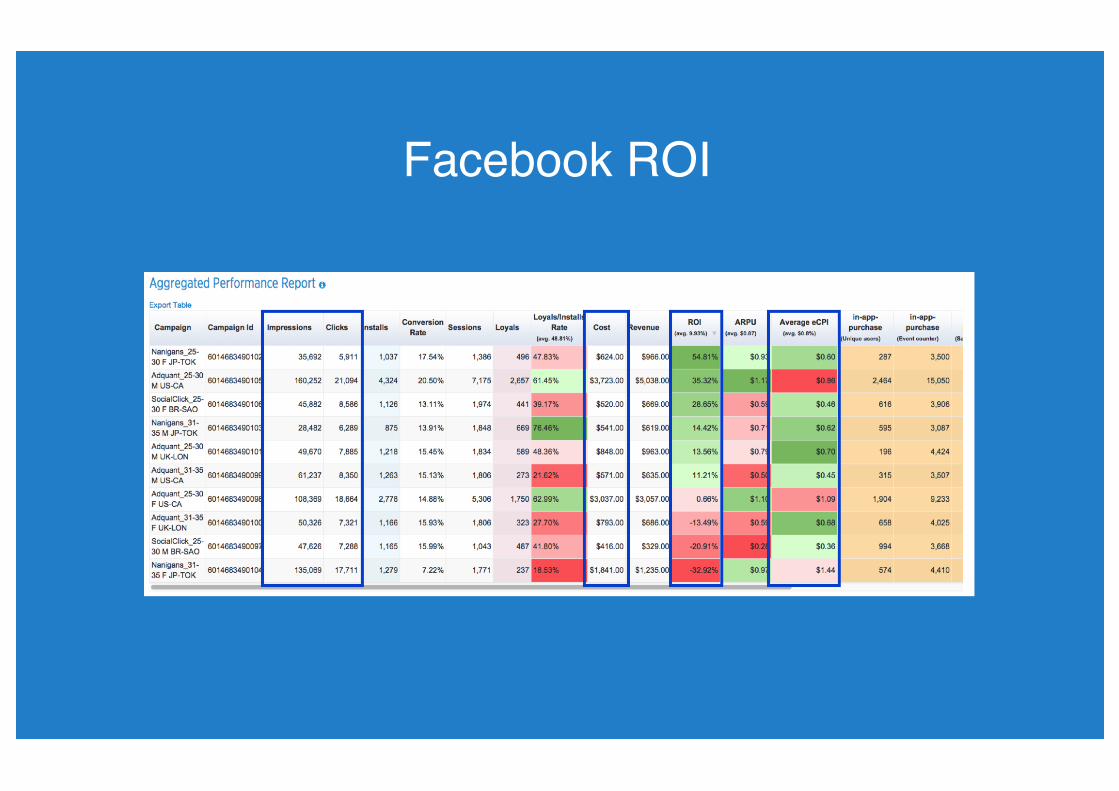
Facebook ROI

GOING BEYOND LAST CLICK ATTRIBUTION

Significant value contributing to conversions
GOING BEYOND LAST CLICK ATTRIBUTION

Measuring detailed user actions
Transferring data to networks in real time
Enabling advanced audience targeting campaigns
(lookalike, retargeting)
MAXIMIZING TRUE ROI POTENTIAL
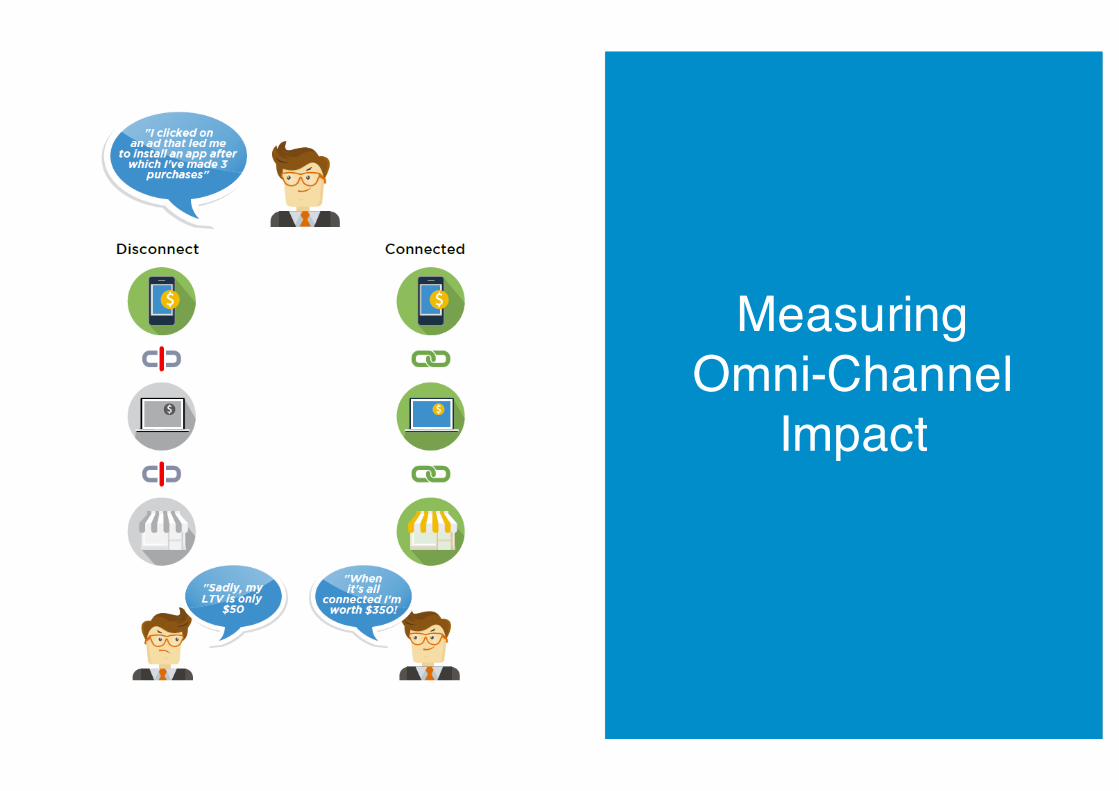
Measuring Omni-Channel
Impact

NON-GAMING RETENTION DATA STUDY
PERFORMANCE INDEX
Q3/2015


Power Ranking
Normalized Retention
Scope
Methodology
RetentionRate
An ‘apples to apples’ comparison of days 1, 7 and 30 where the highest retention figure per day was given the figure 1 and all others were then given a relative figure to 1 based on their actual retention. The normalized retention figure is therefore not the actual retention, only a relative number that is used solely for the purpose of ranking the top performers and the relative differences between them.
Over 450 million installs across hundreds of non-gaming apps running campaigns with hundreds of AppsFlyer’s integrated media partners during May to July 2015. Only apps with at least 5,000 installs were used in study.
The retention rate was calculated as the unique number of users who were active on days 1, 7 and 30 out of the total number of unique users who first launched the app in the selected timeframe. A rank combining two factors that were
given equal weight in the formula: both retention (quality) and the total number of installs it generated (quantity).
Advertising/MarketingRetention
Ad NetworksOrganic vs. non-organiciOS vs. Android

The Bird Flies High in Android
Key Takeaways• Twitter stands out with a 25% higher retention than 2nd place
• Google proves user intent is a great indication of loyalty
• Cheetah mobile’s investment in quality user acquisition pays off
Average Normalized Retention -Android Top 10

The Flock that FollowsAverage Normalized Retention-Android 11-25
#10#11

Power Ranking – Non-Gaming
• Facebook’s unrivaled reach and strong retention puts the social network well ahead of the crowd
• Twitter scale on Android not as high as its top retention position – landing it in 8th spot
• China grown networks (Mobvita, Cheeah Mobile, AppFlood, Yeah Mobi) emerging as dominant forces across the globe with 4 out of top 6 slots
• India’s mobile growth is evident with four networks (Komli, Tyroo, affle, InMobi) entering the top 25
Key Takeaways

Intent Drives Retention
Key Takeaways• Intent in iOS searches shows its value as Google AdWords tops chart• Social networks show very high value• Twitter proves its cross-platform value
Average Normalized Retention – iOS Top 10
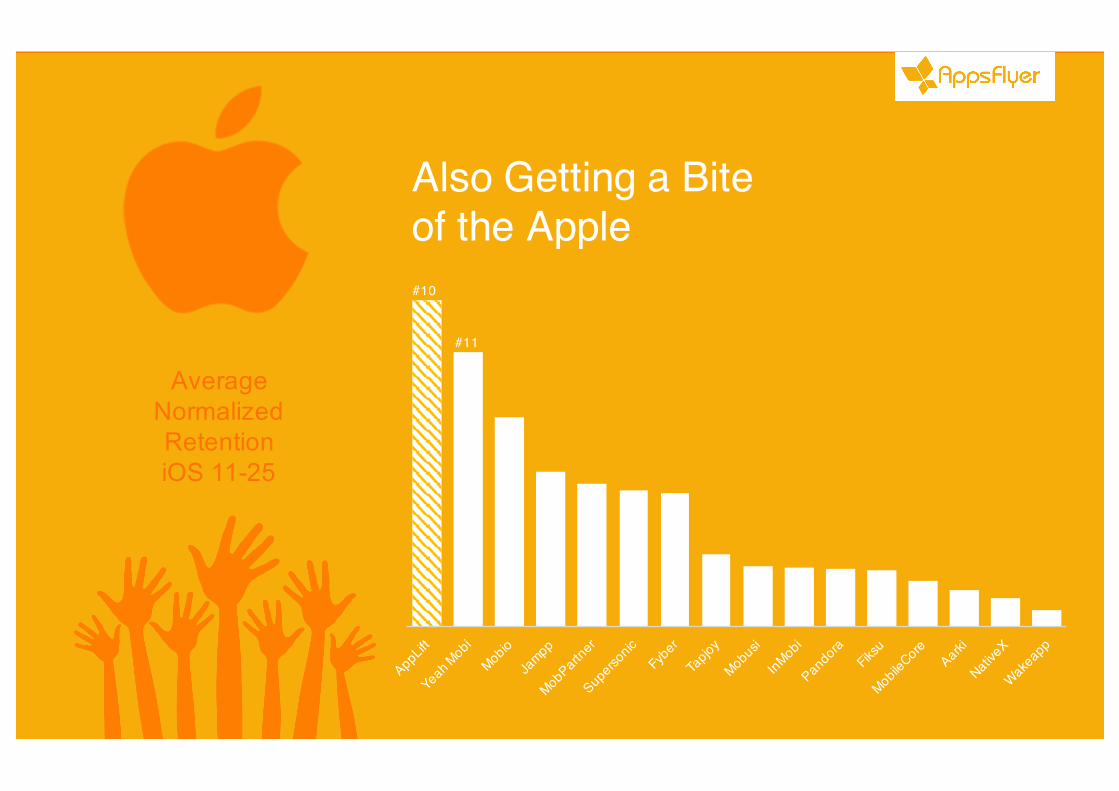
Also Getting a Bite of the Apple
Average Normalized Retention iOS 11-25
#10
#11

Power Ranking – Non-Gaming
Key Takeaways• On iOS just as on Android: Facebook’s unrivaled reach and strong retention puts social network well ahead of the crowd
• Great reach and great retention put Twitter in 2nd spot
• AppLovin proves focus on data bears fruit

Organic Retention Reigns Supreme
Day 1 Day 7 Day 30+46% +55% +156%
Organic Paid Organic Paid Organic Paid
Key Takeaway• Organic intent shows interest demonstrated by user will lead to higher retention• Gap widens over time – particularly in the long run, further proving the value of organic acquisition

Organic Retention Reigns Supreme
Day 1 Day 7 Day 30+20% +39% +133%
Organic Paid Organic Paid Organic Paid
Key TakeawayOrganic intent shows interest demonstrated by user will lead to higher retention, although not as large a gap as in Android
BrandsCountriesConnectionLanguagesOS versions
Device-Related Retention

Samsung Rules but Local Asian Suppliers Making a Mark

Neck & Neck 29.06%
10.99%
3.29%
25.53%
10.21%
3.17%
Day 1 Day 7 Day 30Android Apple
Android vs. iOS Retention

MUITO BEM!
Brazil Canada UK US Spain India Russia Mexico Germany France
Average Normalized Retention per Geo – iOS Top 10

US
RU
GB
IN BR
ESTOP 10 POWER RANKING GEO
DE
CA
FR MX

Europe Going Strong,Asian Nations Show Value
UK Spain Mexico Malaysia US Thailand Russia Brazil Indonesia Vietnam
Average Normalized Retention per Geo – Android Top 10

TOP 10 POWER RANKING GEO
US
RU
PH
IN BR
TH MY
VN
MX
IN

The newer, the better
5.0.1 5 4.4.4 5.0.2 4.3 4.4.2 4.1.2 4.2.2 2.3.6 4.2.1
Average Normalized Retention by OS Version – Android Top 10

TOP 10 POWER RANKING OS VERSION
4.4.2 4.4.4 4.2.2 4.1.2 5.0.2
4.3 5 5.0.1 4.0.4 4.2.1

Time
8.2 8.1.3 8.1.2 8.1 8.3 7.1.2 8.1.1 8.4 7.1.1
Average Normalized Retention OS Version - iOS
AdoptionTakes
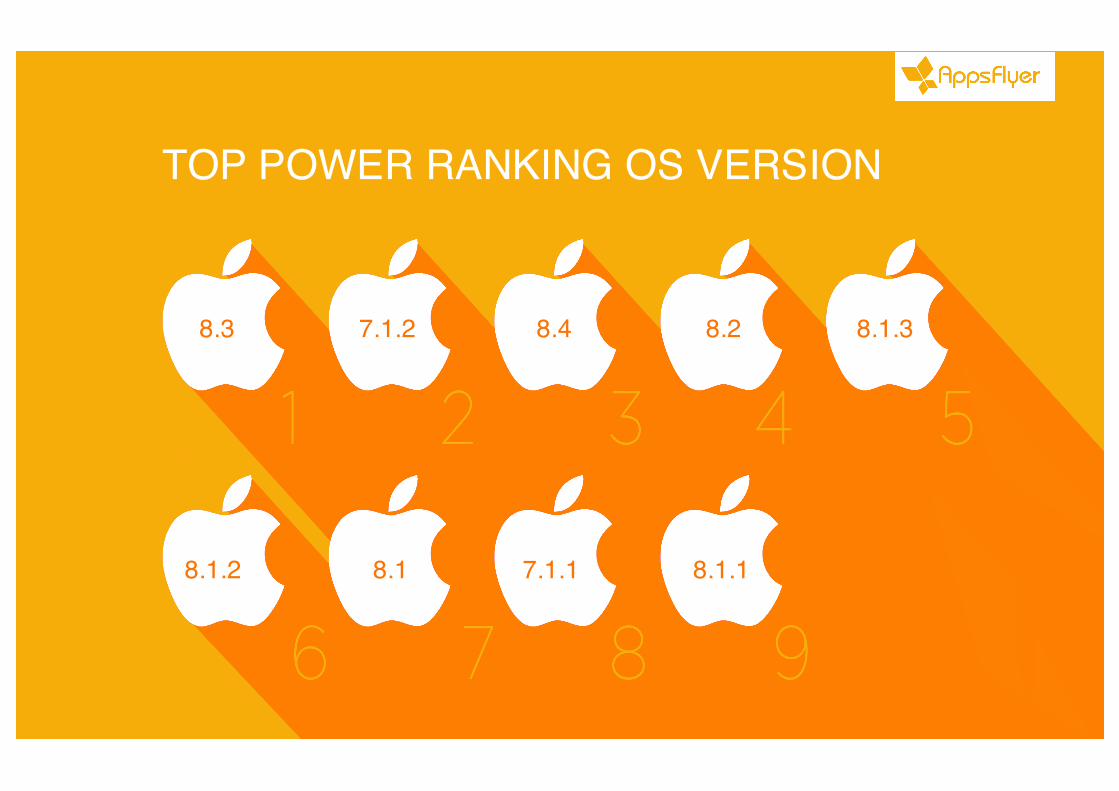
TOP POWER RANKING OS VERSION
8.3 7.1.2 8.4 8.2 8.1.3
8.1.2 8.1 7.1.1 8.1.1