How to Realize an ABC Analysis.doc
12
SAP (SAP America, Inc. and SAP AG) assumes no responsibility for errors or omissions in these materials. These materials are provided “as is” without a warranty of any kind, either express or implied, including but not limited to, the implied warranties of merchantability, fitness for a particular purpose, or non-infringement. SAP shall not be liable for damages of any kind including without limitation direct, special, indirect, or consequential damages that may result from the use of these materials. SAP does not warrant the accuracy or completeness of the information, text, graphics, links or other items contained within these materials. SAP has no control over the information that you may access through the use of hot links contained in these materials and does not endorse your use of third party web pages nor provide any warranty whatsoever relating to third party web pages. How to… Realize an ABC Analysis BUSINESS INFORMATION WAREHOUSE ASAP How to Paper Applicable Releases: BW 2.0B, 2.1C, 3.0A October 20 2001
-
Upload
sanjeev-malik -
Category
Documents
-
view
228 -
download
0
description
file adfdf fdf
Transcript of How to Realize an ABC Analysis.doc

SAP (SAP America, Inc. and SAP AG) assumes no responsibility for errors or omissions in these materials.
These materials are provided “as is” without a warranty of any kind, either express or implied, including but not limited to, the impliedwarranties of merchantability, fitness for a particular purpose, or non-infringement.
SAP shall not be liable for damages of any kind including without limitation direct, special, indirect, or consequential damages thatmay result from the use of these materials.
SAP does not warrant the accuracy or completeness of the information, text, graphics, links or other items contained within thesematerials. SAP has no control over the information that you may access through the use of hot links contained in these materials anddoes not endorse your use of third party web pages nor provide any warranty whatsoever relating to third party web pages.
How to…
Realize an ABC Analysis
BUSINESS INFORMATION WAREHOUSE
ASAP How to Paper
Applicable Releases: BW 2.0B, 2.1C, 3.0AOctober 20 2001

REALIZE AN ABC ANALYSIS
2001 SAP AMERICA, INC. AND SAP AG 1
1 Business Scenario
You have an InfoCube with Orders on a header and item level, customers and ordered quantity. In areporting szenario you want to create a web application where you graphically answer the question"Do I make 80% of my ordered quantity with only 30% of my customers?"
REALIZE AN ABC ANALYSIS
2001 SAP AMERICA, INC. AND SAP AG 2
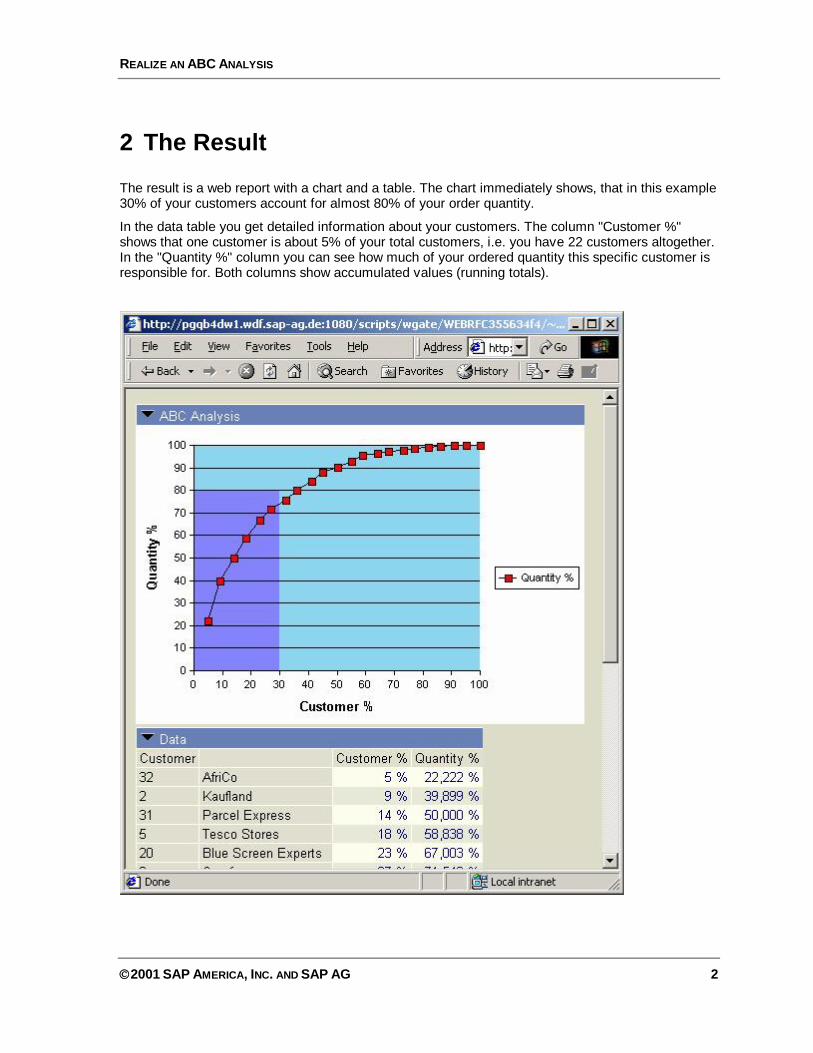
2 The Result
The result is a web report with a chart and a table. The chart immediately shows, that in this example30% of your customers account for almost 80% of your order quantity.
In the data table you get detailed information about your customers. The column "Customer %"shows that one customer is about 5% of your total customers, i.e. you have 22 customers altogether.In the "Quantity %" column you can see how much of your ordered quantity this specific customer isresponsible for. Both columns show accumulated values (running totals).

REALIZE AN ABC ANALYSIS
2001 SAP AMERICA, INC. AND SAP AG 3
3 The Step By Step Solution
In this step you learn how to create a query that shows the necessary result and how to show theresult in a web appliaction. The query can be realized with BEx Analyzer features only. It is notnecessary to change the data model of the InfoCube, create virtual key figures, etc.
1. Create a new Query. Placecharacteristic 'Customer' in the rows
2. Create a new calculated key figure.Define the formula by simplydragging ' Quantity' into theformula area.

REALIZE AN ABC ANALYSIS
2001 SAP AMERICA, INC. AND SAP AG 4
3. When you save the calculated keyfigure you have to specify its'Enhanced' properties. Press thebutton 'Enhance >>>' .

REALIZE AN ABC ANALYSIS
2001 SAP AMERICA, INC. AND SAP AG 5
4. New fields will appear. Here youhave to specify the 'ExceptionAggregation'. Set this parameter to'Counting all values' with referencecharacteristic being 'Customer'.Press the 'Ok' button
5. Now insert the newly definedcalculated key figure into yourrows.

REALIZE AN ABC ANALYSIS
2001 SAP AMERICA, INC. AND SAP AG 6
6. Create a new formula in the rows.The formula should be '1 %ASUMGT Quantity (Excp. Aggr.Count) '. This formula calculates thepercentage share of one customer tothe total number of customers.
7. Insert 'Quantity' into your rows.Change the title of the selection to'Quantity %'.

REALIZE AN ABC ANALYSIS
2001 SAP AMERICA, INC. AND SAP AG 7
8. The query should now look like this.
9. Now hide the first column. Fromthe context menu of the columnelement choose the propertiesdialogue. There you have to set thecheck box 'Hide'.

REALIZE AN ABC ANALYSIS
2001 SAP AMERICA, INC. AND SAP AG 8
10. In the properties dialogue of thefourth row set the number ofdecimal places to zero. Additionally,set the 'Cumulated' check box andchoose 'Calculate result as...''Summation'.
11. In the properties dialogue of thefifth row set the number of decimalplaces to zero. Set the 'Cumulated'check box and choose 'Calculatesingle values as normalization ofresult (incl. Filter)'

REALIZE AN ABC ANALYSIS
2001 SAP AMERICA, INC. AND SAP AG 9
12. Save and run the query. In the'Quantity %' column from thecontext menu choose 'Sort indescending order --> Quantity'.
13. Save the workbook and thequery view.
14. Publish the query view to theweb. Create a template with a tableitem and a chart item. When youparameterize the chart, choose anXY (Scatter) chart type withconnected value points.

REALIZE AN ABC ANALYSIS
2001 SAP AMERICA, INC. AND SAP AG 10
15. In the chart options set the titlefor the X- and Y-axis
16. Choose 'Format Plot area' todefine the quadrant that should behighlighted.

REALIZE AN ABC ANALYSIS
2001 SAP AMERICA, INC. AND SAP AG 11
17. For both axes choose 'FormatAxis'. Set the scaling parameters forthe axis: minimum = 0 andmaximum = 100. If you want to youcan specify minor and major unitsthat are going to be displayed.
18. Run the web application in abrowser to inspect the result


![a c:] 5 ooÐ L B 10.5 1 - Microsoft Word Abc Abc Abc Abc Abc Abc Abc Abc Abc Abc Abc Abc 1 - Microsoft Word Abc Abc Abc 505 7ï—L Mic SmartArt 1 - Microsoft Word Aa MS B 10.5 (Ctrl+L)](https://static.fdocuments.in/doc/165x107/5b180d777f8b9a19258b6a1e/a-c-5-ood-l-b-105-1-microsoft-word-abc-abc-abc-abc-abc-abc-abc-abc-abc-abc.jpg)