Factor Structure in Commodity Futures Returns and Volatility
RESEARCH ARTICLE
How to obtain high returns with lower volatility in emerging markets?Nipun Agarwal1*
Abstract: Emerging markets equity indexes are usually seen as high return with a high degree of volatility associated with them. However, this should not be the case, if you choose high-quality firms that have increasing returns and lower volatility. The intent of this paper is to introduce the risk weighted alpha (RWA) indexation method that helps identify stocks that have stable increasing returns with lower volatility. In order to review this method in the context of emerging markets scenario, this paper takes the example of the Sensex index listed on the Bombay Stock Exchange (BSE) that comprises India’s top 30 stocks by market capitalisation. Results show that some stocks like Hindustan Lever do show increasing returns and lower volatility. The RWA Sensex index outperforms the BSE Sensex index, while still maintaining a beta that is the same as that in the BSE Sensex index.
1. IntroductionEmerging equity markets are seen to provide higher yields when global stock markets are increasing. However, there is an exodus of funds from emerging markets to developed country markets when systematic risk seems to increase globally. In this paper, we take an example of the Sensex index that is the main index for the Bombay Stock Market (BSE) in India. This is a market capitalisation in-dex that comprises the top 30 stocks by market capitalisation listed on the Bombay Stock Exchange. Most of the major stock indexes globally, like the Dow Jones Industrial Average, S&P500 and FTSE100, are market capitalisation or price-weighted indexes. Market capitalisation and price-weighted in-dexes have been developed based on modern portfolio theory. These indexes are, therefore, consid-ered to be the most efficient portfolios, and as a result are the main indexes on these exchanges.
However, Arnott and Hsu (2008), Arnott, Hsu, and Moore (2005) and Arnott, Kalesnik, Moghtader, and Scholl (2010) developed the fundamental index method stating that five fundamental factors (revenue, sales, cash flow, employment and book value) could help select stocks more efficiently to comprise an index compared to the market capitalisation and price-weighted index methods. Since then there have been numerous empirical studies that have differing views; however, it is inconclu-sive if the fundamental indexation method is superior to the market capitalisation and price-weight-ed indexes (see Basu & Forbes, 2013; Blitz & Swinkels, 2008; Blitz, van der Grient, & van Vliet, 2010; Chen, Chen, & Bassett, 2007; Estrada, 2006; Hemminki & Puttonen, 2008; Hsu & Campollo, 2006; Hsu, Kalesnik, & Xie, 2011; Kaplan, 2008; Mar, Bird, Casavecchia, & Yeung, 2009; Seigel, 2006). Instead, the fundamental index method is seen to have a value and small cap bias that may help it perform better at times than the market capitalisation weighted index.
Equal-weighted and risk-weighted indexes are the other index methods that are prominent. Equal-weighted index method simply applies an equal weight of each stock in the index. There are a myriad of risk-weighted indexes, minimum variance, equally weighted portfolio, maximum Sharpe ratio, most diversified portfolio, equally weighted risk distribution portfolio and semi- variance
Agarwal, Cogent Economics & Finance (2014), 2: 890060http://dx.doi.org/10.1080/23322039.2014.890060
*Corresponding author: Nipun Agarwal, School of Economics, Finance and Marketing, RMIT University, Melbourne, AustraliaE-mail: [email protected]
Reviewing Editor:David McMillan, University of Stirling
Further author and article information is available at the end of the article
Received: 06 November 2013Accepted: 17 December 2013Published: 20 May 2014
© 2014 The Author(s). This open access article is distributed under a Creative Commons Attribution (CC-BY) 3.0 license.
Keywords: investment management, equity indexation, emerging markets, passive investing, long/short strategies
Page 1 of 16
Page 2 of 16
Agarwal, Cogent Economics & Finance (2014), 2: 890060http://dx.doi.org/10.1080/23322039.2014.890060
portfolio (Demey, Maillard, & Roncalli, 2010). While the fundamental index method aims to increase the portfolio’s alpha, the risk-weighted indexes look to reducing the portfolio’s risk through diversi-fication. The disadvantage of the equal-weighted index method is that it needs to be rebalanced frequently, has a high tracking error and it works as a take-profit strategy, where the stocks that have increased in price are sold and the stocks that have fallen in price are purchased to bring all the stocks to equal weight (Benartzi & Thaler, 2001; DeMiguel, Garlappi, & Uppal, 2009; Windcliff & Boyle, 2004).
Similarly, the risk-weighted index method has a disadvantage in that in some cases it could be concentrated in too few stocks or may require a covariance between stocks to be calculated; due to the higher dimensionality of this covariance matrix it is hard to use this method (Amenc, Goltz, Martellini, & Retkowsky, 2010; Chia, Melas, & Zhou, 2011; Choueifaty & Coignard, 2008; Chow, Hsu, Kalesnik, & Little, 2011; Clarke, de Silva, & Thorley, 2006; Haugen & Baker, 1991). As emerging equity markets have high volatility, it would seem plausible that risk-weighted indexes would be a suitable index option. However, due to the diversification strategy used by these indexes, while unsystematic risk is reduced significant systematic risk remains. The intent of the risk weighted alpha (RWA) index method being introduced in this paper is to develop a method that selects stocks that have increas-ing returns and lower volatility. In effect, such an index will look to provide a higher return and have lower systematic risk than the market capitalisation weighted indexes.
2. RWA Index Construction for the BSE IndexRWA index method intends to provide higher weight to stocks that have higher returns and lower variance. In order to achieve this it uses Jensen’s alpha to identify stocks that provide higher actual returns compared to their expected returns when considering systematic risk as derived by the capi-tal asset pricing model. However, it is important that we find risk-weighted Jensen’s alpha, as some of these stocks may take on higher risk in order to provide a higher return. As a result, the risk-weighted Jensen’s alpha will identify stocks that provide the highest alpha per unit risk. The following formula explains the RWA index method:
Risk Adjusted Jensen�s Alpha=
Ri−[Rf +�i(Rm−Rf )]
�i
where,Ri = actual return on the stockRf = risk free rateRm = return on the market indexβi = beta of the stockσi = standard deviation of the stock
In effect, once the RWA is obtained, this model assigns index weight to each stock based on this value. As it re-weighs the BSE index, it is possible that some stocks have a negative RWA. As a result, these stocks will have a negative index weight, which would mean that the investor should short these stocks as they do not provide sufficient return compared to the risk associated with them. It is also noticed that stocks with a positive RWA over a significant period are those stocks that have consistently increasing stock prices over time with lower stock price volatility. This paper uses the BSE index as an example in the next section in order to explain the RWA index method. Financial data used in this paper were obtained from the Thomson Reuters Tick History database using daily price data for the BSE index from 2 January 2002–31 December 2012.
3. Performance Characteristics—RWA and BSE IndexBSE index is a market capitalisation weighted index comprised of the top 30 stocks listed on the Bombay Stock Exchange (BSE). This paper analyses if the RWA method will provide superior return and lower variance by re-weighting the stocks in the BSE index. Performance of the RWA against the market cap-weighted BSE index is provided in Table 1.
Page 3 of 16
Agarwal, Cogent Economics & Finance (2014), 2: 890060http://dx.doi.org/10.1080/23322039.2014.890060
Table 1. Performance—RWA IndexIndex 2003
(%)2004 (%)
2005 (%)
2006 (%)
2007 (%)
2008 (%)
2009 (%)
2010 (%)
2011 (%)
2012 (%)
Index return (%)
BSE30 index 56.54 15.55 36.79 41.59 41.57 −64.27 65.30 17.34 −26.13 23.94 208.21
RWA BSE30 index 40.30 31.26 53.93 43.32 35.52 41.55 −26.84 −9.80 51.59 42.69 303.51
The RWA index seems to have provided a higher return (303.51%) from January 2002 to December 2012 compared to the BSE30 index, which is a market cap-weighted index, while the beta for both these indexes is close to .9. The reason why the RWA index has provided a higher return is due to the fact that it weighs stocks with increasing returns and lower volatility. Existing index methods do not specifically weight stocks based on their alpha while the fundamental indexation method uses five fundamental factors to increase the portfolio’s alpha. The RWA index method assumes that only high-performing stocks will consistently be able to provide a positive alpha per unit risk over an extended period of time. If a stock, however, does provide a higher alpha, but it also has a higher level of volatility in its returns, then it is unlikely that this stock will be provided an above-average weight due to the higher volatility.
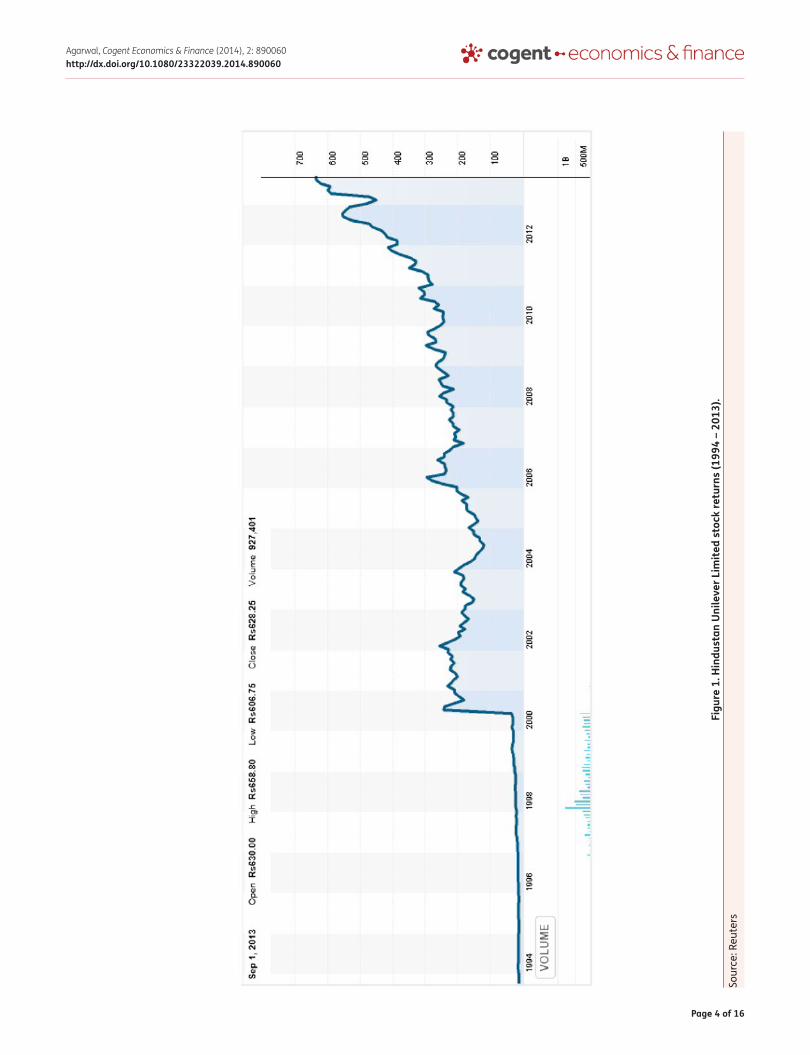
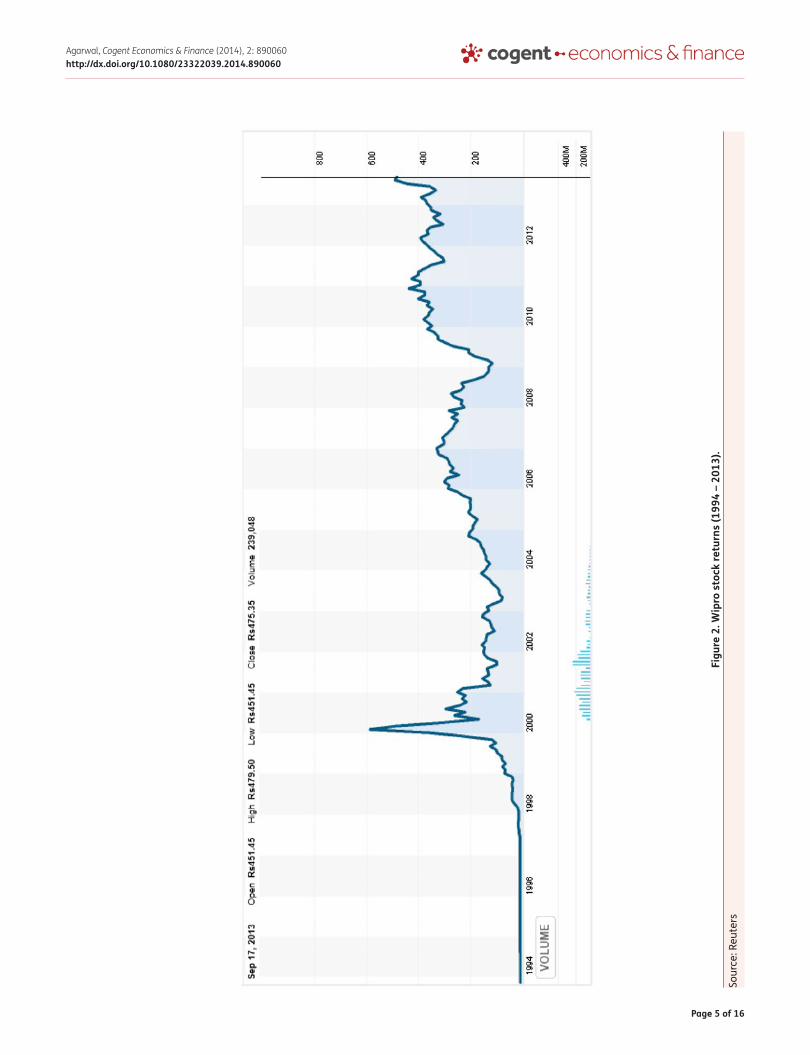
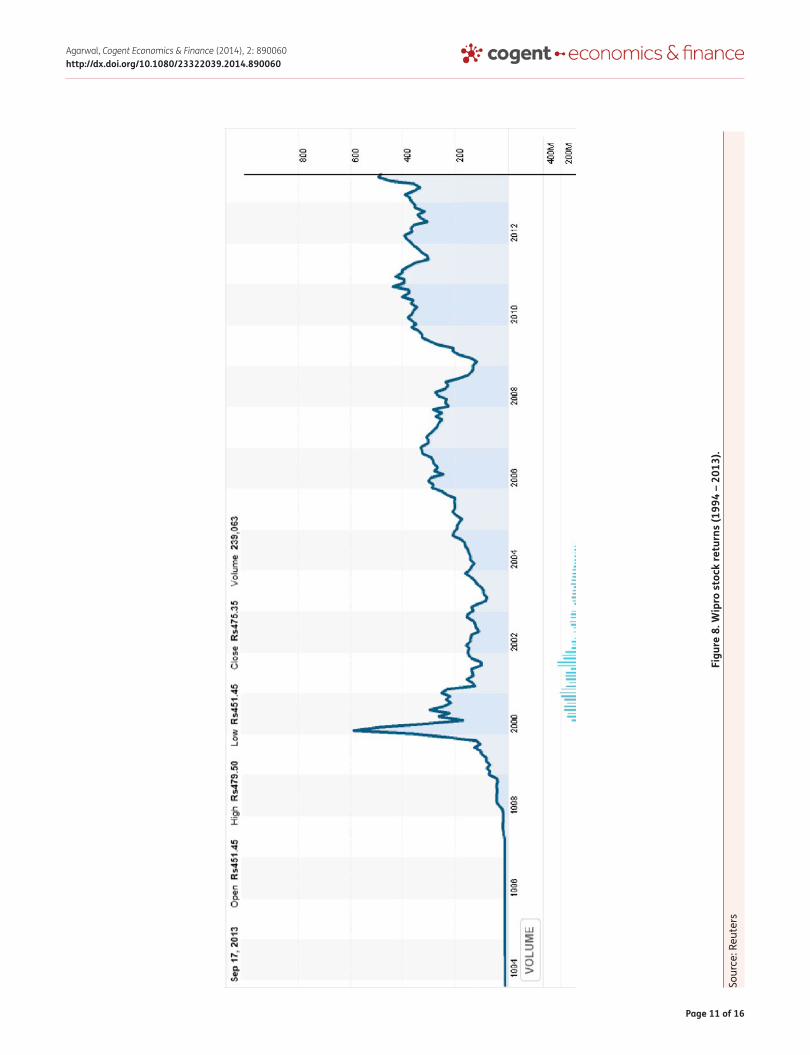
Let us look at the profiles of the best- and worst-performing stocks in each of these methods (see Figures 1–10). Using the RWA index method, data show that the Hindustan Unilever stock performed well as it had a higher RWA. If you notice Figure 1, the stock price has steadily increased from 2002 to 2013. On the contrary, the worst-performing stock in the RWA index was Wipro, and the figure below shows that the stock price has high volatility over the sample period (2002–2012) and is less than half of what it was in January 2002.
You can see that the returns for Hindustan Unilever are steadily increasing compared to those of Wipro. Also, the volatility of the returns is lower for the Hindustan Unilever stocks compared to the Wipro stock.
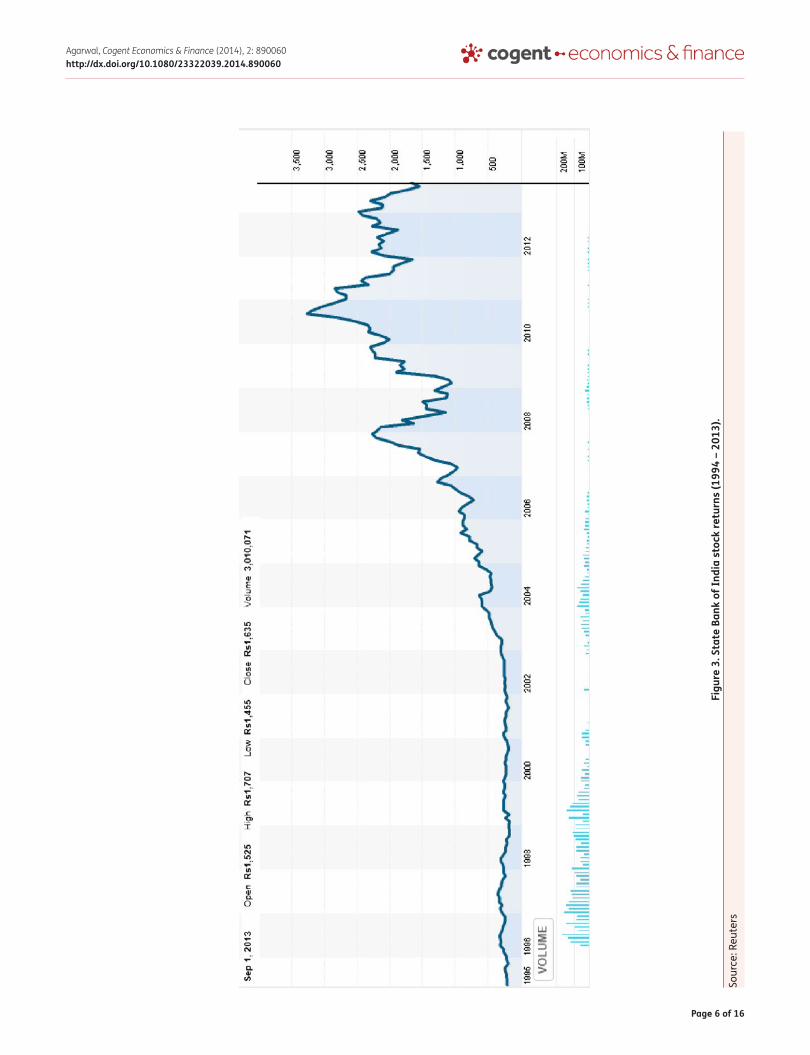
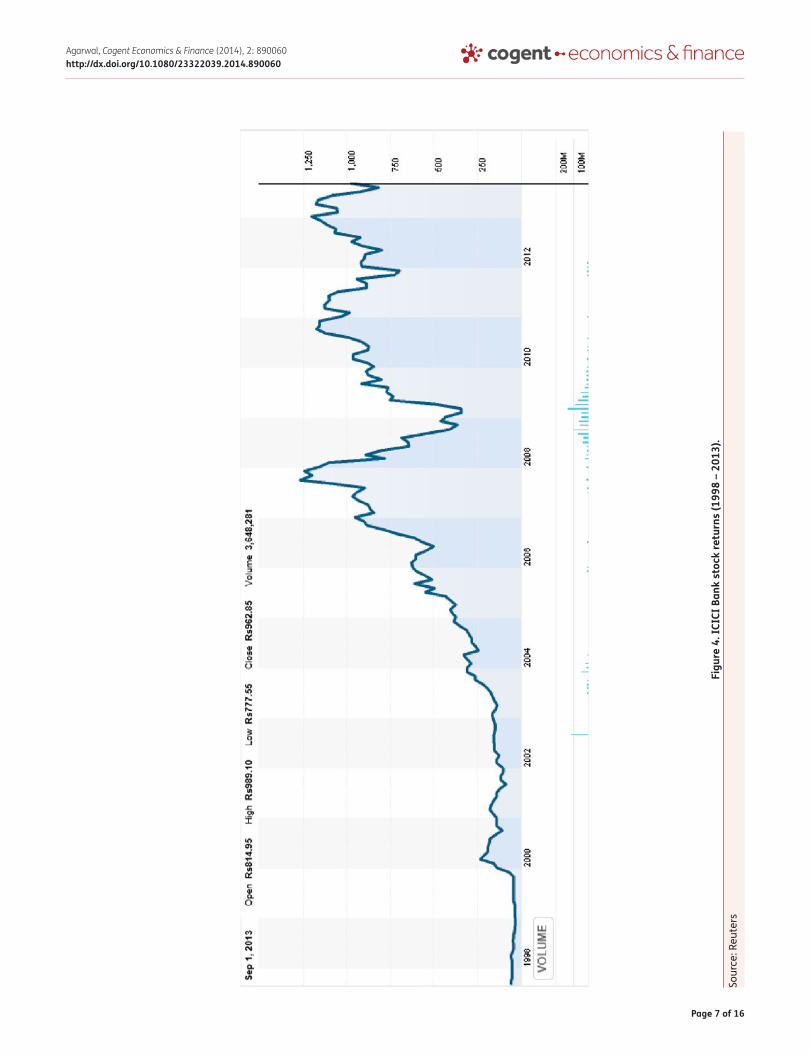
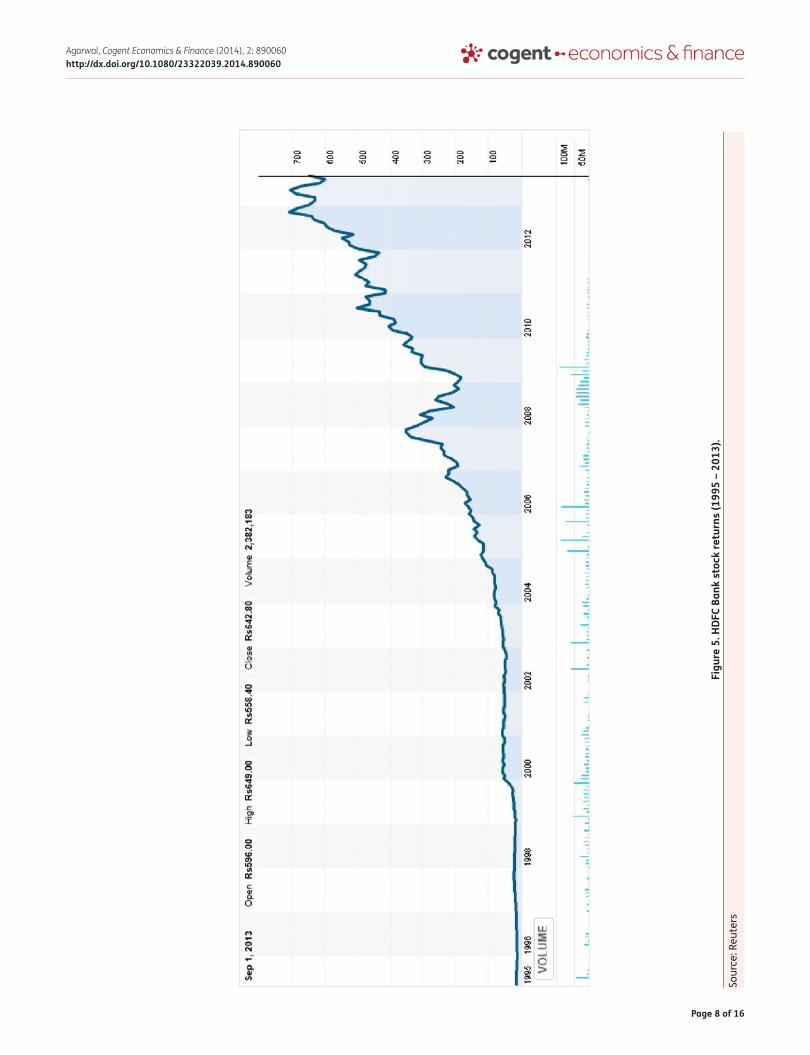
Why don’t we analyse stocks within the same industry, for example let’s compare three banks that are part of the BSE30 index to explain why the RWA identifies stocks that perform well over a long term. Most importantly, however, we need to make sure that we take significant amount of sample data before calculating the RWA. Usually, 10 years of daily data or 30 years of monthly data will be suitable. Any shorter duration will not work as it will possibly not consider a complete business cycle and it will result in providing incorrect index weights for stocks.
The three banks that are part of the BSE30 index which are being analysed are: the State Bank of India (index weight of 4.6951%), ICICI Bank (index weight of 3.1285%) and HDFC Bank (index weight of 2.5781%). You will notice that stocks with lower weights have either lower returns or higher volatility. Compare the three figures below.
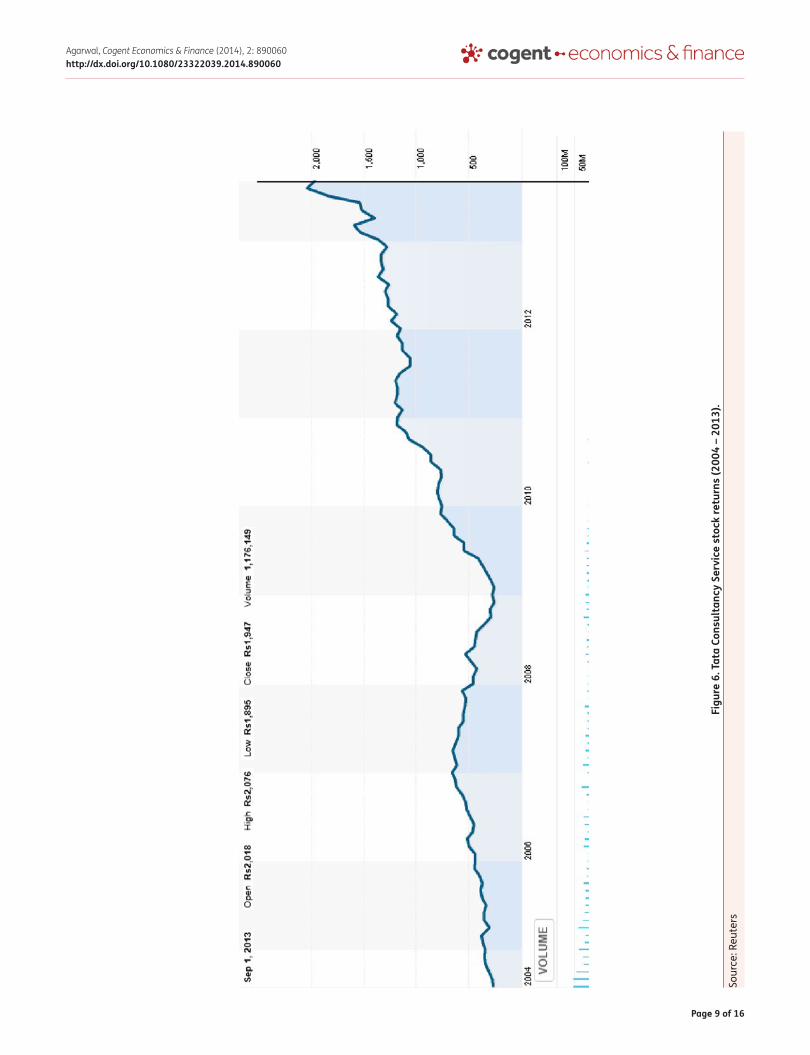
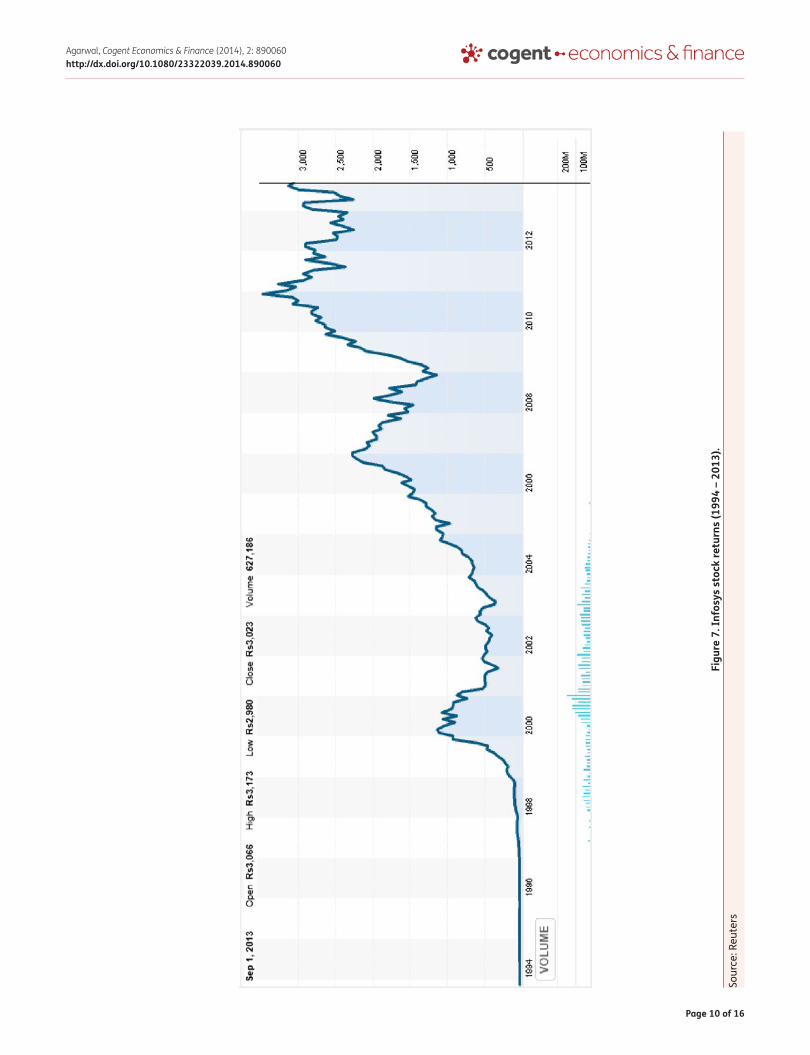
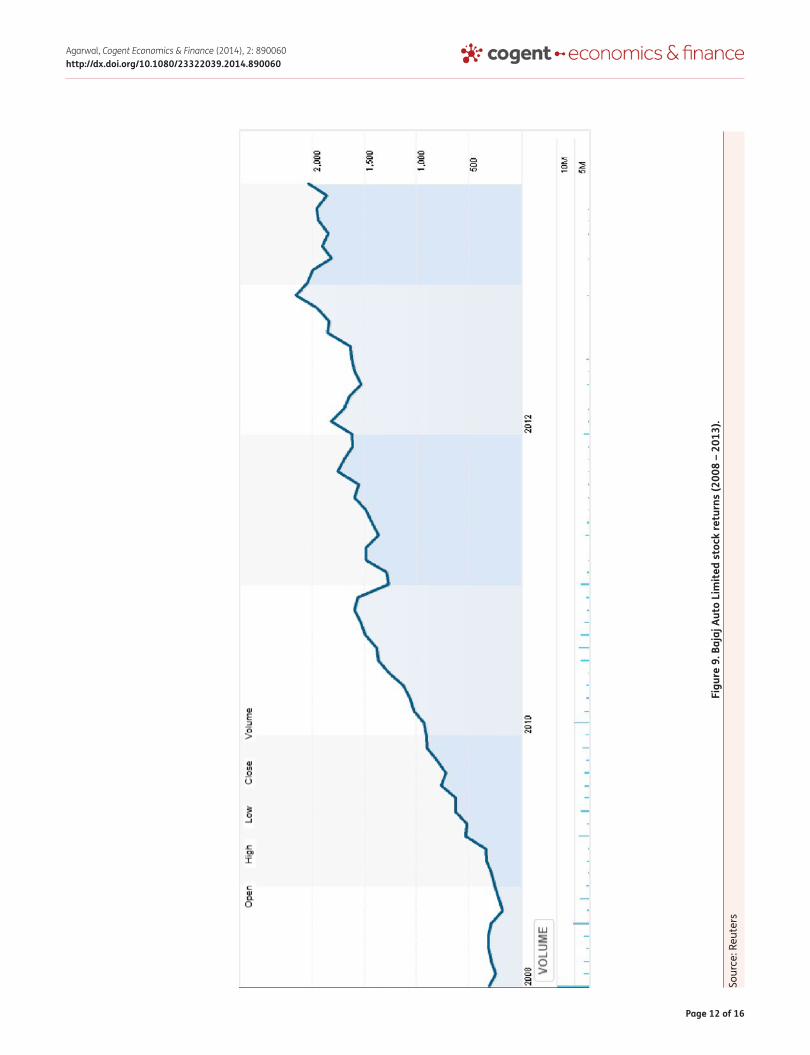
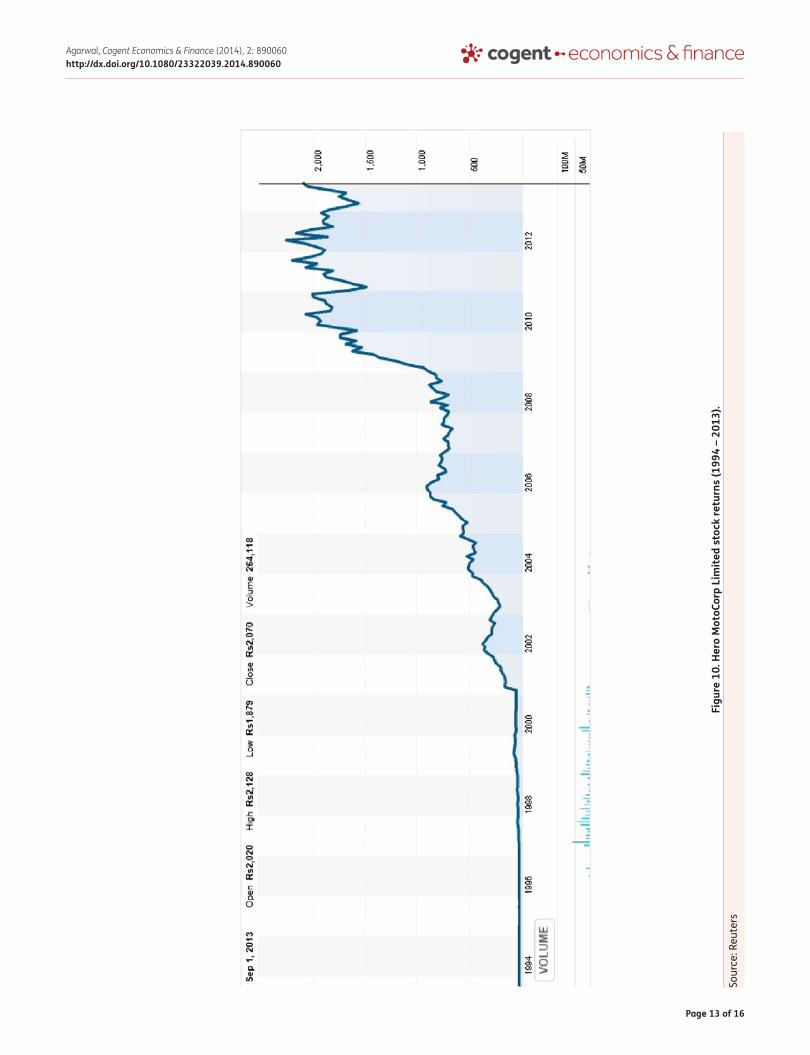
We have also compared the three Indian IT companies (see figures above): Tata Consultancy Services (TCS), Infosys and Wipro. You will notice that the TCS stock has an increasing and stable stock price compared to that of Infosys. On the other hand, the Wipro stock price is more volatile and has a smaller increase compared to the other two stocks (TCS and Infosys). In order to prove the point that the RWA helps identify stocks with increasing returns and lower volatility, we also consider the stocks of two auto manufacturers: Bajaj Auto (index weight of 1.8401%) and Hero MotoCorp Limited (index weight of .2937%). These figures prove that the Bajaj Auto stock has higher returns as it has increased from 500 Indian rupees to 2000 Indian rupees from 2008 to 2012 compared to the Hero MotoCorp stock where the stock price increased by the same amount but it took longer (2002–2012) for this increase to occur.
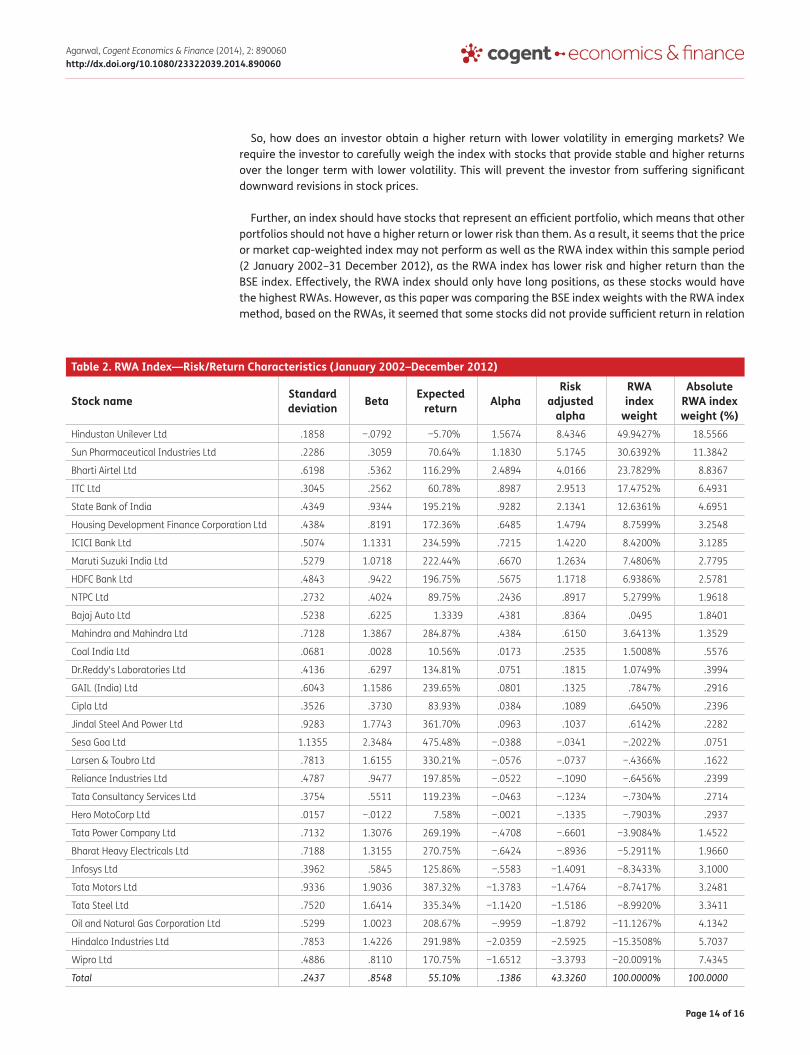
The risk-return characteristics for the RWA index are provided below. Table 2 shows that the stocks that perform better and have lower volatility have a higher weight in this index.
Page 4 of 16
Agarwal, Cogent Economics & Finance (2014), 2: 890060http://dx.doi.org/10.1080/23322039.2014.890060
Figu
re 1
. Hin
dust
an U
nile
ver L
imite
d st
ock
retu
rns
(199
4 –
2013
).So
urce
: Reu
ters
Page 5 of 16
Agarwal, Cogent Economics & Finance (2014), 2: 890060http://dx.doi.org/10.1080/23322039.2014.890060
Figu
re 2
. Wip
ro s
tock
retu
rns
(199
4 –
2013
).So
urce
: Reu
ters
Page 6 of 16
Agarwal, Cogent Economics & Finance (2014), 2: 890060http://dx.doi.org/10.1080/23322039.2014.890060
Figu
re 3
. Sta
te B
ank
of In
dia
stoc
k re
turn
s (1
994
– 20
13).
Sour
ce: R
eute
rs
Page 7 of 16
Agarwal, Cogent Economics & Finance (2014), 2: 890060http://dx.doi.org/10.1080/23322039.2014.890060
Figu
re 4
. ICI
CI B
ank
stoc
k re
turn
s (1
998
– 20
13).
Sour
ce: R
eute
rs
Page 8 of 16
Agarwal, Cogent Economics & Finance (2014), 2: 890060http://dx.doi.org/10.1080/23322039.2014.890060
Figu
re 5
. HDF
C Ba
nk s
tock
retu
rns
(199
5 –
2013
).So
urce
: Reu
ters
Page 9 of 16
Agarwal, Cogent Economics & Finance (2014), 2: 890060http://dx.doi.org/10.1080/23322039.2014.890060
Figu
re 6
. Tat
a Co
nsul
tanc
y Se
rvic
e st
ock
retu
rns
(200
4 –
2013
).So
urce
: Reu
ters
Page 10 of 16
Agarwal, Cogent Economics & Finance (2014), 2: 890060http://dx.doi.org/10.1080/23322039.2014.890060
Figu
re 7
. Inf
osys
sto
ck re
turn
s (1
994
– 20
13).
Sour
ce: R
eute
rs
Page 11 of 16
Agarwal, Cogent Economics & Finance (2014), 2: 890060http://dx.doi.org/10.1080/23322039.2014.890060
Figu
re 8
. Wip
ro s
tock
retu
rns
(199
4 –
2013
).So
urce
: Reu
ters
Page 12 of 16
Agarwal, Cogent Economics & Finance (2014), 2: 890060http://dx.doi.org/10.1080/23322039.2014.890060
Figu
re 9
. Baj
aj A
uto
Lim
ited
stoc
k re
turn
s (2
008
– 20
13).
Sour
ce: R
eute
rs
Page 13 of 16
Agarwal, Cogent Economics & Finance (2014), 2: 890060http://dx.doi.org/10.1080/23322039.2014.890060
Figu
re 1
0. H
ero
Mot
oCor
p Li
mite
d st
ock
retu
rns
(199
4 –
2013
).So
urce
: Reu
ters
Page 14 of 16
Agarwal, Cogent Economics & Finance (2014), 2: 890060http://dx.doi.org/10.1080/23322039.2014.890060
So, how does an investor obtain a higher return with lower volatility in emerging markets? We require the investor to carefully weigh the index with stocks that provide stable and higher returns over the longer term with lower volatility. This will prevent the investor from suffering significant downward revisions in stock prices.
Further, an index should have stocks that represent an efficient portfolio, which means that other portfolios should not have a higher return or lower risk than them. As a result, it seems that the price or market cap-weighted index may not perform as well as the RWA index within this sample period (2 January 2002–31 December 2012), as the RWA index has lower risk and higher return than the BSE index. Effectively, the RWA index should only have long positions, as these stocks would have the highest RWAs. However, as this paper was comparing the BSE index weights with the RWA index method, based on the RWAs, it seemed that some stocks did not provide sufficient return in relation
Table 2. RWA Index—Risk/Return Characteristics (January 2002–December 2012)
Stock name Standard deviation Beta Expected
return AlphaRisk
adjusted alpha
RWA index
weight
Absolute RWA index weight (%)
Hindustan Unilever Ltd .1858 −.0792 −5.70% 1.5674 8.4346 49.9427% 18.5566
Sun Pharmaceutical Industries Ltd .2286 .3059 70.64% 1.1830 5.1745 30.6392% 11.3842
Bharti Airtel Ltd .6198 .5362 116.29% 2.4894 4.0166 23.7829% 8.8367
ITC Ltd .3045 .2562 60.78% .8987 2.9513 17.4752% 6.4931
State Bank of India .4349 .9344 195.21% .9282 2.1341 12.6361% 4.6951
Housing Development Finance Corporation Ltd .4384 .8191 172.36% .6485 1.4794 8.7599% 3.2548
ICICI Bank Ltd .5074 1.1331 234.59% .7215 1.4220 8.4200% 3.1285
Maruti Suzuki India Ltd .5279 1.0718 222.44% .6670 1.2634 7.4806% 2.7795
HDFC Bank Ltd .4843 .9422 196.75% .5675 1.1718 6.9386% 2.5781
NTPC Ltd .2732 .4024 89.75% .2436 .8917 5.2799% 1.9618
Bajaj Auto Ltd .5238 .6225 1.3339 .4381 .8364 .0495 1.8401
Mahindra and Mahindra Ltd .7128 1.3867 284.87% .4384 .6150 3.6413% 1.3529
Coal India Ltd .0681 .0028 10.56% .0173 .2535 1.5008% .5576
Dr.Reddy's Laboratories Ltd .4136 .6297 134.81% .0751 .1815 1.0749% .3994
GAIL (India) Ltd .6043 1.1586 239.65% .0801 .1325 .7847% .2916
Cipla Ltd .3526 .3730 83.93% .0384 .1089 .6450% .2396
Jindal Steel And Power Ltd .9283 1.7743 361.70% .0963 .1037 .6142% .2282
Sesa Goa Ltd 1.1355 2.3484 475.48% −.0388 −.0341 −.2022% .0751
Larsen & Toubro Ltd .7813 1.6155 330.21% −.0576 −.0737 −.4366% .1622
Reliance Industries Ltd .4787 .9477 197.85% −.0522 −.1090 −.6456% .2399
Tata Consultancy Services Ltd .3754 .5511 119.23% −.0463 −.1234 −.7304% .2714
Hero MotoCorp Ltd .0157 −.0122 7.58% −.0021 −.1335 −.7903% .2937
Tata Power Company Ltd .7132 1.3076 269.19% −.4708 −.6601 −3.9084% 1.4522
Bharat Heavy Electricals Ltd .7188 1.3155 270.75% −.6424 −.8936 −5.2911% 1.9660
Infosys Ltd .3962 .5845 125.86% −.5583 −1.4091 −8.3433% 3.1000
Tata Motors Ltd .9336 1.9036 387.32% −1.3783 −1.4764 −8.7417% 3.2481
Tata Steel Ltd .7520 1.6414 335.34% −1.1420 −1.5186 −8.9920% 3.3411
Oil and Natural Gas Corporation Ltd .5299 1.0023 208.67% −.9959 −1.8792 −11.1267% 4.1342
Hindalco Industries Ltd .7853 1.4226 291.98% −2.0359 −2.5925 −15.3508% 5.7037
Wipro Ltd .4886 .8110 170.75% −1.6512 −3.3793 −20.0091% 7.4345
Total .2437 .8548 55.10% .1386 43.3260 100.0000% 100.0000
Page 15 of 16
Agarwal, Cogent Economics & Finance (2014), 2: 890060http://dx.doi.org/10.1080/23322039.2014.890060
to their risk unsystematic risk. The RWA index is designed to be a long only or long/short index and is based to improve investments into stocks with increasing returns and low volatility. While we have intended to develop the RWA index as a passive indexation method, regardless, it is possible to use this method in high frequency or algorithmic trading as this method automatically calculates RWAs for each stock every time the weights are recalibrated.
4. ConclusionThis paper has introduced the RWA indexation methodology for index/portfolio construction. It argues that stocks with superior RWA will have lower volatility and increasing returns. RWA is calculated as Jensen’s alpha divided by the standard deviation of the stock. Analysing the stocks that comprise the BSE index and re-weighting these stocks based on the RWA indexation method, it was seen that the RWA index provided nearly five times the return with approximately the same systematic risk as the BSE index through the duration of 2 January 2002–31 December 2012.
Author detailsNipun Agarwal1E-mail: [email protected] School of Economics, Finance and Marketing,
RMIT University, Melbourne, Australia.
Article InformationCite this article as: How to obtain high returns with lower volatility in emerging markets?, N. Agarwal, Cogent Economics & Finance (2014), 2: 890060.
ReferencesAmenc, N., Goltz, F., Martellini, L., & Retkowsky, P. (2010,
February). Efficient indexation: An alternative to cap-weighted indices. Paris: EDHEC-Risk Institute.
Arnott, R. D., & Hsu, J. C. (2008). Noise, CAPM and the size and value effects. Journal of Investment Management, 6(1), 1–11.
Arnott, R. D., Hsu, J., & Moore, P. (2005). Fundamental indexation. Financial Analysts Journal, 61, 83–99.
Arnott, R. D., Kalesnik, V., Moghtader, P., & Scholl, C. (2010). Beyond cap weight: The empirical evidence for a diversified beta. Journal of Indexes, 13, 16–29.
Basu, A. K., & Forbes, B. (2013). Does fundamental indexation lead to better risk-adjusted returns? New evidence from Australian Securities Exchange. Accounting & Finance, 53(3), 1–30.
Benartzi, S., & Thaler, R. H. (2001). Naive diversification strategies in defined contribution saving plans. American Economic Review, 91, 79–98.
Blitz, D., & Swinkels, L. (2008). Fundamental indexation: An active value strategy in disguise. Journal of Asset Management, 9, 264–269. http://dx.doi.org/10.1057/jam.2008.23
Blitz, D., van der Grient, B., & van Vliet, P. (2010). Fundamental indexation: Rebalancing assumptions and performance. The Journal of Index Investing, 1, 82–88. http://dx.doi.org/10.3905/jii.2010.1.2.082
Chen, C., Chen, R., & Bassett, G. W. (2007). Fundamental indexation via smoothed cap weights. Journal of Banking & Finance, 31, 3486–3502.
Chia, C. P., Melas, D., & Zhou, T. (2011). Turbulent times ahead: Does risk-based strategy diversification work? Journal of Indexes Europe, (February), 20–35.
Choueifaty, Y., & Coignard, Y. (2008). Toward maximum diversification. The Journal of Portfolio Management, 35, 40–51.
Chow, T.-M., Hsu, J., Kalesnik, V., & Little, B. (2011). A survey of alternative equity index strategies. Financial Analysts Journal, 67, 37–57.
Clarke, R. G., de Silva, H., & Thorley, S. (2006). Minimum-variance portfolios in the U.S. equity market. The Journal of Portfolio Management, 33, 10–24. http://dx.doi.org/10.3905/jpm.2006.661366
Demey, P., Maillard, S., & Roncalli, T. (2010, March). Risk-based indexation. Working Paper. Paris: Lyxor Asset Management.
DeMiguel, V., Garlappi, L., & Uppal, R. (2009). Optimal versus naive diversification: How inefficient is the 1/N portfolio strategy? Review of Financial Studies, 22, 1915–1953.
Estrada, J. (2006). Fundamental indexation and international diversification. Journal of Portfolio Management, 34, 93–109. http://dx.doi.org/10.3905/jpm.24.2.74
Haugen, R. A., & Baker, N. L. (1991). The efficient market inefficiency of capitalization-weighted stock portfolios. The Journal of Portfolio Management, 17, 35–40. http://dx.doi.org/10.3905/jpm.1991.409335
Hemminki, J., & Puttonen, V. (2008). Fundamental indexation in Europe. Journal of Asset Management, 8, 401–405.
Hsu, J. C. & Campollo, C. (2006). An examination of fundamental indexation. New Frontiers in Index Investing. Journal of Indexes, 58, 32–37. http://dx.doi.org/10.3905/jii.2010.1.2.014
Hsu, J. C., Kalesnik, V., & Xie, S. (2011, March). What makes fundamental index methodology work? Working Paper. Newport Beach, CA: Research Affiliates.
Kaplan, P. D. (2008). Why fundamental indexation might—Or might not—Work. Financial Analysts Journal, 64, 32–39. http://dx.doi.org/10.2469/faj.v64.n1.5
Mar, J., Bird, R., Casavecchia, L., & Yeung, D. (2009). Fundamental indexation: An Australian investigation. Australian Journal of Management, 34(1), 1–20.
Seigel, J. J. (2006). The ‘noisy market’ hypothesis. The Wall Street Journal, A14.
Windcliff, H., & Boyle, P. (2004). The 1/n Pension investment puzzle. North American Actuarial Journal, 8, 32–45. http://dx.doi.org/10.1080/10920277.2004.10596151
Page 16 of 16
Agarwal, Cogent Economics & Finance (2014), 2: 890060http://dx.doi.org/10.1080/23322039.2014.890060
© 2014 The Author(s). This open access article is distributed under a Creative Commons Attribution (CC-BY) 3.0 license.You are free to: Share — copy and redistribute the material in any medium or format Adapt — remix, transform, and build upon the material for any purpose, even commercially.The licensor cannot revoke these freedoms as long as you follow the license terms.
Under the following terms:Attribution — You must give appropriate credit, provide a link to the license, and indicate if changes were made. You may do so in any reasonable manner, but not in any way that suggests the licensor endorses you or your use. No additional restrictions You may not apply legal terms or technological measures that legally restrict others from doing anything the license permits.
Cogent Economics & Finance (ISSN: 2332-2039) is published by Cogent OA, part of Taylor & Francis Group. Publishing with Cogent OA ensures:• Immediate, universal access to your article on publication• High visibility and discoverability via the Cogent OA website as well as Taylor & Francis Online• Download and citation statistics for your article• Rapid online publication• Input from, and dialog with, expert editors and editorial boards• Retention of full copyright of your article• Guaranteed legacy preservation of your article• Discounts and waivers for authors in developing regionsSubmit your manuscript to a Cogent OA journal at www.CogentOA.com