HOW TO IMPROVE THE ‘TEAMNESS’ OF AN AGILE … · • Creation of the Agile team skills model of...
113
HOW TO IMPROVE THE ‘TEAMNESS’ OF AN AGILE SOFTWARE DEVELOPMENT TEAM Designing and testing a teamwork model as the base of an Agile team skills tool. Author: Colinda de Beer Student number: 836071594 Date: June 23 2017
Transcript of HOW TO IMPROVE THE ‘TEAMNESS’ OF AN AGILE … · • Creation of the Agile team skills model of...

HOW TO IMPROVE THE ‘TEAMNESS’ OF AN AGILE
SOFTWARE DEVELOPMENT TEAM
Designing and testing a teamwork model as the base of an Agile team skills tool.
Author: Colinda de Beer Student number: 836071594
Date: June 23 2017

Faculty: Management Sciences - Open Universiteit Nederland For the degree of: Master of Science in Management Specialisation: Implementation and Change Management
Supervisor: prof. dr. ir. Rini van Solingen Examiner OU: prof. dr. Rob Kusters

ii
ABSTRACT
During the last decade, Agile frameworks, such as Scrum and Kanban, have been adopted by more and more software companies. Agile software development is generally associated with the ability to quickly respond to ever faster changing technologies and worldwide market conditions. A company that can respond to change faster has a better chance of successfully creating software that is valued by the customer and, therefore, of ‘surviving’. Agile teamwork requires other skills than when working as a solo developer. The question is, what are these skills and how can they be measured and improved? The objective of the research presented in this thesis was to investigate if and how teamwork models can be used to improve the ‘teamness’ in Agile software development teams. To answer this question literature review was done to provide an overview of the existing models that have been used in Agile practice. The knowledge from the review was used to create a new model based on the existing ones. The model was then used to create a tool that can be easily used by scrum masters and Agile coaches to measure and improve the teamness of an Agile software development team. The tool was tested in 7 software development teams and proved to be valuable for Agile practitioners. Looking at the results the main contributions of this research are:
• Creation of a tested version of the Agile team skills tool that can provide a starting point for Scrum Masters / Agile coaches to discuss ‘teamness’ and improve the output of the team.
• Creation of the Agile team skills model of which the description of the elements can be the beginning of a common language regarding the skills needed by Agile teams.
• Presenting an overview of the research in the field of Agile software development using team models. • Description and comparison of the teamwork models used in Agile software development. • Research questions from Agile practitioners regarding the use of the team skills model in teams
outside software development and as a tool for measuring and assessing teams and individuals in an Agile team.
Keywords: Agile software development, Scrum, team models, self-organizing teams, team skills, tool, software engineering, software process improvement, retrospective, teamness.

iii
SUMMARY
During the last decade, Agile frameworks, such as Scrum and Kanban, have been adopted by more and more software companies. Agile software development is generally associated with the ability to quickly respond to ever faster changing technologies and worldwide market conditions. A company that can respond to change faster has a better chance of successfully creating software that is valued by the customer and, therefore, of ‘surviving’. Working in an Agile team is the norm for most software developers nowadays. Agile teamwork requires other skills than when working as a solo developer. The question is, what are these skills and how can they be measured and improved? The objective of the research presented in this thesis was to investigate if and how teamwork models can be used to improve the ‘teamness’ in Agile software development teams. Looking at the results the main contributions of this research are:
• Creation of a tested version of the Agile team skills tool that can provide a starting point for Scrum Masters / Agile coaches to discuss ‘teamness’ and improve the output of the team.
• Creation of the Agile team skills model of which the description of the elements can be the beginning of a common language regarding the skills needed by Agile teams.
• Presenting an overview of the research in the field of Agile software development using team models. • Description and comparison of the teamwork models used in Agile software development. • Research questions from Agile practitioners regarding the use of the team skills model in teams
outside software development and as a tool for measuring and assessing teams and individuals in an Agile team.
A literature review formed the first step of this research. It appeared from this review that in the past ten years, 13 papers have been published that investigated the use of team models in Agile software contexts. These papers describe eight teamwork models that have been used. These models have overlapping elements. Sometimes the names of the elements are different, in other places the names are the same but the description given by the authors is different. After analysing the models and the description of their elements, an aggregated model, the Agile team skills model, has been created in this study. In a first version, this model contains the elements: communication, sharing workload, autonomy, adapting to change, keeping track of the work, sharing leadership, and team goals over individual goals The next question in the research was how to use the knowledge from the Agile team skills model. The aim of this investigation was to deliver a result that would be useful to Agile practitioners. This meant it had to be readily accessible and easy to understand. Based on this, we decided to create a tool highlighting the skills that are essential for a great software team. This part of the research was conducted according to the design science research methodology (DSRM). DSRM was chosen because it focusses on creating and evaluating innovative (IT) artefacts. An important part of this methodology is to create a prototype and iteratively improve it together with actual users. In a second step, a 3-hour focus group session was held with specialists from the field of Agile software development. This expert group contained developers, coaches, HR managers and senior managers. The results of this session showed that the dimension of trust was the most important to the experts and the development of a tool measuring ‘trust’ had the highest number of votes. During the discussion in the focus group and in follow-up literature research, it appeared that that this would be too large and complex and would mean we needed to start almost completely from scratch. However, the number two topic coming from the focus group did match with our line of research: looking at all the skills available in a team. Therefore, we continued developing a tool to measure and improve ‘teamness’ within Agile teams. But not neglecting this number one finding on trust: while developing the tool, extra focus was placed on the issue of trust to create a safe environment for using the tool. To highlight the importance of trust even more, it was added as a separate dimension and together with communication, became a coordinating dimension in the model. Communication and trust were given this special place because without them, working as a team seems indeed impossible.
iv
After this adjustment, the Agile team skills model contained the following dimensions: adapting to change, autonomy, keeping track of the work, sharing leadership, sharing workload, team goals over individual goals and the coordinating dimensions communication and trust. In a third step, a tool was developed and tested by seven Agile software teams. The tool measures the eight dimensions of the model using a survey with 24 questions. The resulting radar graph forms the basis for a team retrospective. A retrospective format was chosen because it is the known way to inspect and adapt in Agile teams and, therefore, a format already familiar to Agile practitioners. The first version of the retrospective format was facilitated by the researcher in three Agile software teams. In a survey after the retrospective, the participants gave feedback on the format of the tool. After the first three tests, a second version of the tool was created that includes a description of the format for the retrospective to be used by the Scrum Master. This description was used by the Scrum Masters of four teams. The researcher was an observer during the test sessions for two of the four teams.
Looking at the Net Promoter Score (NPS), the Scrum Master and the Agile coach score higher than the other participants. The NPS combined over the two test versions was 67% for the Scrum Master / coach which is considered high. The other participants have a score of 5%. The big difference could be because the Scrum Masters / coaches had previous had contact with the researcher and decided that they wanted to try this format and, therefore, were positively biased. This research shows that team skills are an important factor influencing the output in an Agile environment. The research aims to ‘translate’ that knowledge from academia into a practical tool for practitioners in Agile (Scrum) teams. With this tool, Scrum Masters have been given a starting point to discuss ‘teamness’. The description of the model elements can be the beginning of a common language regarding the skills of teams. By repeating the survey and following the changes over time, the status of an Agile team can be followed. At the moment, the tool has only been tested with a limited number of teams in an Agile software development context. Further research could be conducted with more teams and to see whether this tool is also useful in teams outside software development. The tool could also be adapted for (self-)assessments of individual team members, but a critical look at the dimensions is then needed as the tools and model have an initial team focus. Besides looking at the results of this research, it will be useful to look into the possibilities of using this tool as a measurement that is performed repetitive over time. Does the team result change over time or if actions are taken such as extra coaching of the team or adding or removing people? There is also the issue of looking further into ‘trust’ as an important skill for members of an Agile team. Due to time constraints, a tool focussing on trust has not been developed although it was the highest scoring use case from the focus group. This could be considered as a subject for further research. Another topic for research would be to find out what the radar graph depiction the skills of a ‘great’ team would look like. Things to focus on could be ‘Is it necessary for all people in the team to score a five on all skills?’, ‘Is it enough that all the skills are covered by at least some team members?’, ‘Is there a different score to be expected for teams in different phases of teambuilding (Tuckman’s norming, storming.)?’. Last but not least, research could be conducted to link the team graphs resulting from the tool and the actual results that teams achieve in terms of ‘delivering value for the customer’.
v
PRE FACE AND ACKNOWLEDGEMENT
With this thesis, I finalize my master study management science at the Open Universiteit Nederland. After graduating with a bachelor degree in horticulture it wasn’t long before I started my next study. This time it was information technology and I finished my first course at the Open Universiteit in 1997. In the following years, I completed more IT courses and switched jobs from horticultural researcher to software developer. After developing control software for greenhouses at Hoogendoorn for ten years I was ready for a new challenge. That challenge presented itself in the form of a function as manager software development and later as R&D manager. This inspired me to learn more about the skills that are important for my new job as a manager. That was the beginning of my third study, management sciences. Meanwhile I introduced Agile software development in the company. ‘Changing an organization and its people’ (if that is at all possible) sure had its challenges! This experience made me choose implementation and change management as a specialization. It also inspired me to find the subject for this thesis, how do you improve an Agile software development team. First, I would like to thank all Agile practitioners that helped me in my research by joining in a focus group, testing out the tool as a participant or facilitator and giving feedback on my ideas. This research would not have been possible without you. Next, I would like to thank my supervisor prof. dr. ir. Rini van Solingen for his advice, enthusiasm and ‘nudges’ in the right direction. It was his first book ‘De kracht van Scrum’ that made me discover Scrum in 2010. I’m proud that Rini wanted to be my thesis supervisor! I would also like to thank prof. dr. Rob Kusters for his feedback. Last but not least I would like to thank Martin van Gogh BSc. MBA, CEO of Hoogendoorn, for being my coach and mentor during my years as an employee at Hoogendoorn Growth Management. He taught me the ‘power’ of having a growth mindset and was a great inspirator and example as a manager. I hope you will enjoy reading this thesis and if you are an Agile practitioner will find inspiration to improve the teamness in your team! Meanwhile I am wondering what my next study might be…..
Colinda de Beer Honselersdijk, June 23, 2017
“Effort is one of those things that gives meaning to life. Effort means you care about
something, that something is important to you and you are willing to work for it.” ~ Carol S. Dweck

6
TABLE OF CONTE NTS
1 Introduction ................................................................................................................................................... 8
1.1 Motivation .................................................................................................................................... 8 1.2 Research questions ....................................................................................................................... 9 1.3 Methodology .............................................................................................................................. 10 1.4 Relevance for theory and practice ............................................................................................... 13 1.5 Structure of this thesis ................................................................................................................ 13
2 Step 1 - literature Review ............................................................................................................................ 14 2.1 Method for literature review ...................................................................................................... 14 2.2 Research on Agile teamwork models .......................................................................................... 14 2.3 Differences and similarities of the models used .......................................................................... 17 2.4 Measuring the model elements ................................................................................................... 21
3 Step 2 - focus group ..................................................................................................................................... 22 3.1 Focus group methodology and planning...................................................................................... 22 3.2 Focus group session results ......................................................................................................... 24 3.3 Adapting model v1.0 to v2.0 ....................................................................................................... 26
4 Step 3 – Agile team skills tool v1.1 ............................................................................................................... 29 4.1 Agile team skills tool v1.1 methodology and planning ................................................................ 29 4.2 Agile team skills tool v1.1 results ................................................................................................ 31 4.3 Adapting tool v1.1 to v1.2 ........................................................................................................... 34
5 Step 4 – Agile team skills tool v1.2 ............................................................................................................... 35 5.1 Agile team skills tool v1.2 methodology and planning ................................................................ 35 5.2 Agile team skills tool v1.2 results ................................................................................................ 36
6 Conclusion, discussion and recommendations ............................................................................................. 39 6.1 Conclusion ................................................................................................................................... 39 6.2 Discussion ................................................................................................................................... 40 6.3 Limitations .................................................................................................................................. 42 6.4 Recommendations for further research ...................................................................................... 42 6.5 Recommendations for practitioners ............................................................................................ 43
7 Reflection .................................................................................................................................................... 44 References ........................................................................................................................................................... 46

7
List of tables ......................................................................................................................................................... 48 List of figures ........................................................................................................................................................ 49 Appendix A Description of the teamwork models used .................................................................................. 50 Appendix B Description of the Individual Elements of the teamwork models ................................................ 53 Appendix C Individual elements of the teamwork models ............................................................................. 56 Appendix D Description of aggregated elements and the different models .................................................... 57 Appendix E Combined model v1.0 used in Focus group ................................................................................. 58 Appendix F Teamwork questions used by Moe, Dingsøyr, and Røyrvik (2009) ............................................... 59 Appendix G Teamwork questions used by Stettina and Heijstek (2011) ......................................................... 60 Appendix H Teamwork questions used by Park et al. (2005) .......................................................................... 61 Appendix I Teamwork questions after combining questionares and rewriting .............................................. 62 Appendix J Teamwork survey before retrospective ....................................................................................... 63 Appendix K Focus group invitation Email ....................................................................................................... 66 Appendix L Protocol of the focus group ......................................................................................................... 67 Appendix M Room setup of Focus group session............................................................................................. 72 Appendix N Result of focus group session—Help and Hinder teamwork ........................................................ 73 Appendix O Pictures of use cases and fish bowl ............................................................................................. 75 Appendix P Result of focus group session—combined Help and Hinder teamwork ........................................ 76 Appendix Q Result of focus group session—use cases .................................................................................... 78 Appendix R Protocol of the Agile Team skills Tool v1.1. ................................................................................. 80 Appendix S Survey questions after retrospective—Participants. ................................................................... 87 Appendix T Survey questions after retrospective—Scrum Master. ................................................................ 89 Appendix U Radar graphs created from survey before retrospective v1.1 ...................................................... 90 Appendix V Perfection game; Results of survey after retrospective v1.1 ........................................................ 92 Appendix W Description of the Agile Team skills Tool v1.21 ............................................................................ 94 Appendix X Radar graphs created from survey before retrospective v1.21 .................................................. 109 Appendix Y Perfection game; Results of survey after retrospective v1.21 .................................................... 111

8
1 INTRODUCTION
1.1 Motivation
During the last decade, the use of Agile frameworks, such as Scrum and Kanban, have been adopted by more and more software companies. Agile software development is generally associated with the ability to quickly respond to ever faster changing technologies and changing worldwide market conditions (Stare, 2014). A company that can respond to change faster has a better chance of successfully creating software that is valued by the customer. Solingen, Berghout, Kusters, and Trienekens (2000) stated that: “The success of a software project is largely determined by having the right people on the right place at the right time. As software development is a knowledge intensive industry, the ‘quality’ of these people is primarily determined by their knowledge and skills.” In a self-organizing context, project management activities are meant to be shared between managers, customers, and team members (Hoda, 2011). Everyday project management activities, such as estimation, planning, and requirements elicitation, are part of the job of all the team members in an Agile team. Conboy, Coyle, Wang, and Pikkarainen (2011) identified some of the ‘people’ issues that may occur when transitioning to an Agile organisation. Where a developer used to work more solo, tasks are now shared among a team of developers. This causes fear among some developers, because it increases the visibility of their shortcomings. Whiteboard sessions and constant communication about the features under development put a magnifying glass on the skills and deficiencies of the developer. They need to be competent in a broad range of skills instead of being the expert in one (technical) skill. Individual team members may have to learn new skills but looking at the effectiveness, research shows that it is important for the individuals to work as a team. As in football, a team consisting of just top strikers would not be successful, since there is also a need for a good goalkeeper and defenders. Salas, Sims, and Burke (2005) argue that teams require a complex mixture of factors that include organizational support and individual skills, and also teamwork skills. According to Dingsøyr and Lindsjørn (2013) “Team performance refers to evaluations of the results of the teamwork. Such results are: The quality of the developed software, the ability of the team to meet project goals and budgets and the motivation of team members to work together in the future.” The question is “What teamwork skills help and hinder team performance and how can this knowledge be used by Agile practitioners?”. Practitioners such as Scrum Masters, Agile coaches and managers but also the individual developers could use this knowledge to improve their teams.

9
1.2 Research questions
The objective of this research is to investigate if and how teamwork models can be used to improve the ‘teamness’ in Agile software development teams. Hollenbeck, Beersma, and Schouten (2012) identified 42 types of teams in the literature and more than 138 models and frameworks that explain teams. This richness makes it difficult to select an appropriate teamwork theory to apply in a study. In this research, teamwork models that have already been used in research on Agile software development will be described and a model to use in a tool for practitioners will be chosen or created. Possible uses of such a tool are to select, assess or train members of a self-organizing Agile team. To achieve the creation of such a tool the following research questions were formulated: RQ-1. Which team models have been used in Agile software development contexts?
This question intends to investigate literature and provide an overview of the existing models that have been used in Agile practice. Based on this overview it is expected to either select one as is, or to use the available models as input to create a new one or revise an existing one. Therefore, this is the first question to answer.
RQ-2. What are the differences and similarities of the models? By studying the models and their descriptions, it might be established if there are actual differences in the content of the model skills or if only the naming is different. If this has been established a grounded choice can be made either to use an existing model as is or to combine models to a new one.
RQ-3. How can the elements in the combined model be measured? For the dimensions in the model to be easily usable in practice it should be possible to measure the skills in a simple and consistent way. The measurements can then be used in a tool that is to be developed to give insight in the ‘teamness’ of Agile teams. It is intended to investigate literature to establish if and how the skills of teamwork models have been measured in earlier research.
RQ-4. What would be use cases in the Agile practice of such a tool? With a teamwork model and a means to measure the skills in the model, it would be possible to put it to use in practice in many different ways. This question is aimed at investigating what would be the most valuable use case of such a tool for practitioners.
RQ-5. What could a tool based on the model look like? When the use case with the highest value for Agile practitioners has been established the tool itself would have to be created. Rather than aiming to create a tool in one step it is expected that some iterations are needed to find out what works. Teams differ in maturity and compositions and this may influence the way the tool is used. Several Agile teams will be asked to test the tool.
RQ-6. What would be the value of such a tool for Agile practitioners? After creating the tool, it would have to be established if such a tool would be valuable for the intended users. This will be established by having the teams that test the tool rate the usefulness of the tool.
10
1.3 Methodology
This paragraph describes the design of this research. It describes the chosen methodology and presents the research model. Since the research contains several iterative steps, more detailed information about the methodology is given at the beginning of each chapter describing that step. This provides the information in a more relevant context.
1.3.1 Research design
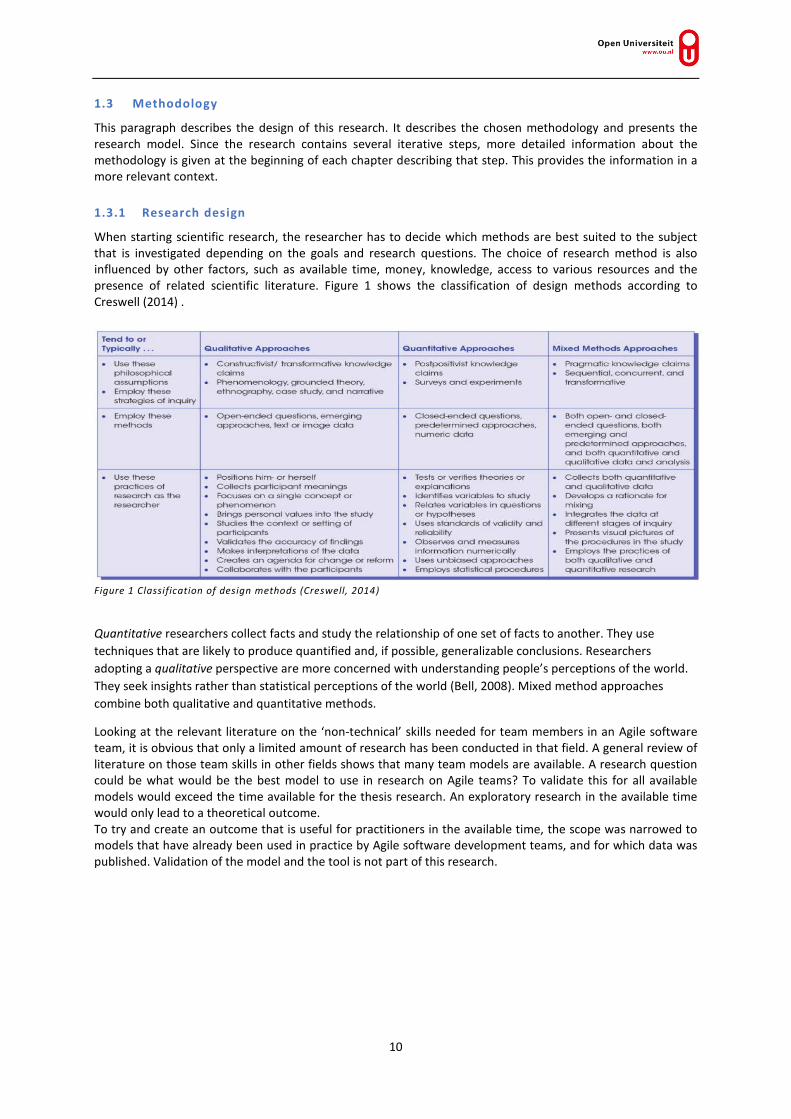
When starting scientific research, the researcher has to decide which methods are best suited to the subject that is investigated depending on the goals and research questions. The choice of research method is also influenced by other factors, such as available time, money, knowledge, access to various resources and the presence of related scientific literature. Figure 1 shows the classification of design methods according to Creswell (2014) .
Figure 1 Classification of design methods (Creswell, 2014)
Quantitative researchers collect facts and study the relationship of one set of facts to another. They use techniques that are likely to produce quantified and, if possible, generalizable conclusions. Researchers adopting a qualitative perspective are more concerned with understanding people’s perceptions of the world. They seek insights rather than statistical perceptions of the world (Bell, 2008). Mixed method approaches combine both qualitative and quantitative methods.
Looking at the relevant literature on the ‘non-technical’ skills needed for team members in an Agile software team, it is obvious that only a limited amount of research has been conducted in that field. A general review of literature on those team skills in other fields shows that many team models are available. A research question could be what would be the best model to use in research on Agile teams? To validate this for all available models would exceed the time available for the thesis research. An exploratory research in the available time would only lead to a theoretical outcome. To try and create an outcome that is useful for practitioners in the available time, the scope was narrowed to models that have already been used in practice by Agile software development teams, and for which data was published. Validation of the model and the tool is not part of this research.
11
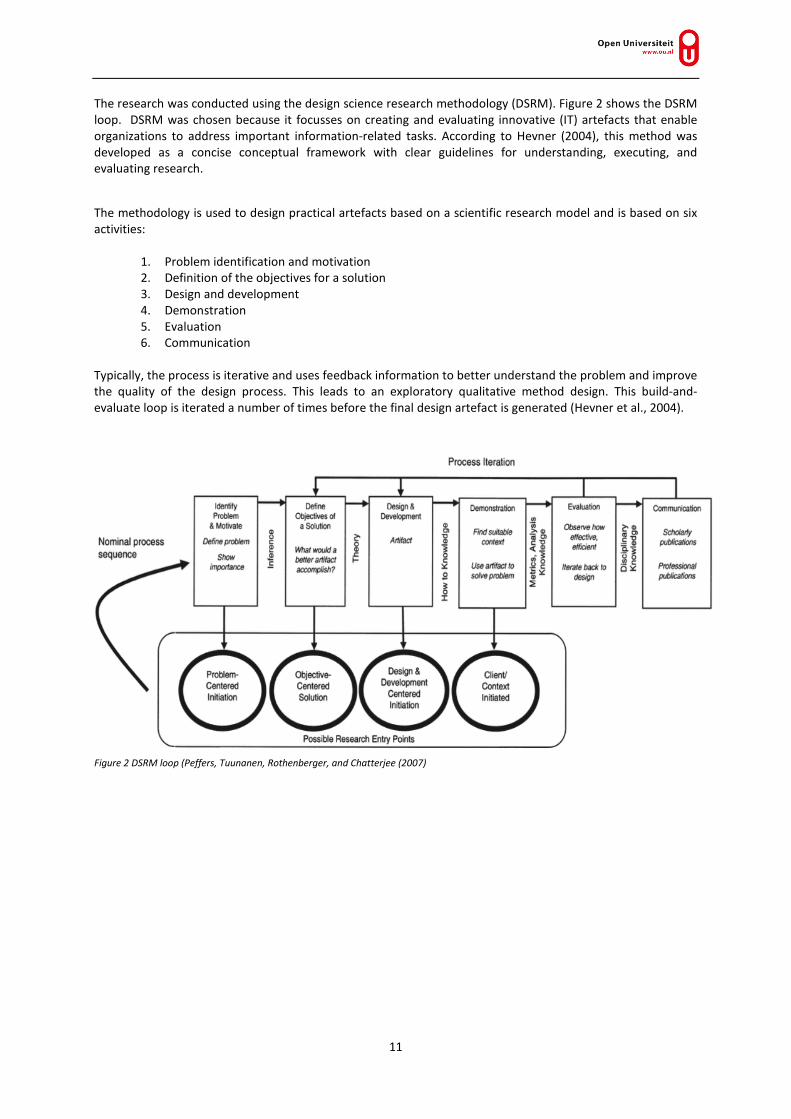
The research was conducted using the design science research methodology (DSRM). Figure 2 shows the DSRM loop. DSRM was chosen because it focusses on creating and evaluating innovative (IT) artefacts that enable organizations to address important information-related tasks. According to Hevner (2004), this method was developed as a concise conceptual framework with clear guidelines for understanding, executing, and evaluating research.
The methodology is used to design practical artefacts based on a scientific research model and is based on six activities:
1. Problem identification and motivation 2. Definition of the objectives for a solution 3. Design and development 4. Demonstration 5. Evaluation 6. Communication
Typically, the process is iterative and uses feedback information to better understand the problem and improve the quality of the design process. This leads to an exploratory qualitative method design. This build-and-evaluate loop is iterated a number of times before the final design artefact is generated (Hevner et al., 2004).
Figure 2 DSRM loop (Peffers, Tuunanen, Rothenberger, and Chatterjee (2007)

12
Figure 3 presents a visual overview of the research design and research questions. Step 1 contains a literature review that answers the first three research questions. This step results in an Agile team skills model that forms the basis for step 2. In a focus group session, experts are consulted to discover the use case for the model that is most valuable for Agile practitioners. In this focus group, the 4th research question is answered. At the beginning of step 3, a first version of the Agile team skills tool is created. After testing the first version of the tool, it is adapted based on real user feedback. In step 4, the adapted version is tested. Steps 3 and 4 answer the last research questions 5 and 6.
Figure 3 Research design following the DSRM loop

13
1.4 Relevance for theory and practice
With the increasing adoption of Agile approaches in the (software) industry, research into Agile approaches has become more common. According to Gregory, Barroca, Sharp, Deshpande, and Taylor (2016), it is important to ensure that academic research is relevant to practice. For that, “researchers need to keep abreast of practitioner challenges, have a grounded understanding of them, and be able to tackle the changing landscape of practitioner challenges as it evolves.” In a 2016 paper, they identified the seven main themes relevant to practice. Several of the themes they describe contain issues that are relevant for the research questions in this thesis:
• “Concerns around ’how to’ introduce Agile ways of working either into teams or into the wider organization” (Organization)
• “Fear of change and the unknown as Agile appears less structured with people ‘doing their own thing’” (Organization)
• “Agile is more than a set of practices used by IT requiring wide ranging change to work patterns” (Culture)
• “Uncertainty and perhaps lack of training in specific practices or techniques” (Teams) • “Agile requires skilled, self-directed and motivated team players” (Teams)
This research adds to the formation of a theory on ‘people’ factors that influence forming and improving Agile teams. Most research on the influence of people factors on successful Agile teams are aimed at the leadership of such teams. This research is aimed at all members of the team. For practice, this research translates the available theory into a model that helps Agile practitioners to successfully form new teams and improve existing teams. The developed tool is an example of how to use the model in practice.
1.5 Structure of this thesis
In this thesis, we start with describing the research questions in Chapter 1. Next, in Chapter 2 the first three research questions are answered using a literature review of models used in Agile team research. The result of the literature review is an overview of the previously used teamwork models in Agile research. After studying the differences and resemblances of these models a new combined model is created to be used as the basis for the selection of possible use cases in practice and a questionnaire for use in the tool. In Chapter 3 we describe the empirical research done to answer the 4th research question. In Chapters 4 and 5 the steps are described that were used to create and adapt the tool and assess its usefulness. In Chapter 4, the first testing step of the Agile team skills tool v1.1 in practice is presented. Based on the results, v1.2 op the tool was created in a next iteration, which is described in Chapter 5. Chapter 6 contains our conclusions, a discussion on the overall research, its limitations and recommendations, further research and tips for practitioners. Finally, Chapter 7 provides a personal reflection on the research, the research process, and improvement ideas in hindsight.
14
2 STEP 1 - L ITERATURE RE VIEW
2.1 Method for l iterature review
In software engineering, the main recommended first step is using search strings in a number of databases, while in information systems, snowballing is recommended as the first step (Jalali & Wohlin, 2012). Jalali and Wohlin compared both methods searching for articles on “Agile practices in global software engineering” and concluded that “despite the differences in the included papers, the conclusions and the patterns found in both studies are quite similar. It is concluded that none of the first steps is outperforming the other”. For this thesis, both the backward snowballing method (from the reference lists) and the forward snowballing method (finding citations to the papers) was used. After a first review of the available literature on teamwork models and their use in Agile software development, a paper by Strode (2015) was found that described literature on the use of teamwork models in an Agile context. This paper, which looked at information until July 2015, was used as the starting point for the literature review.
2.2 Research on Agile teamwork models
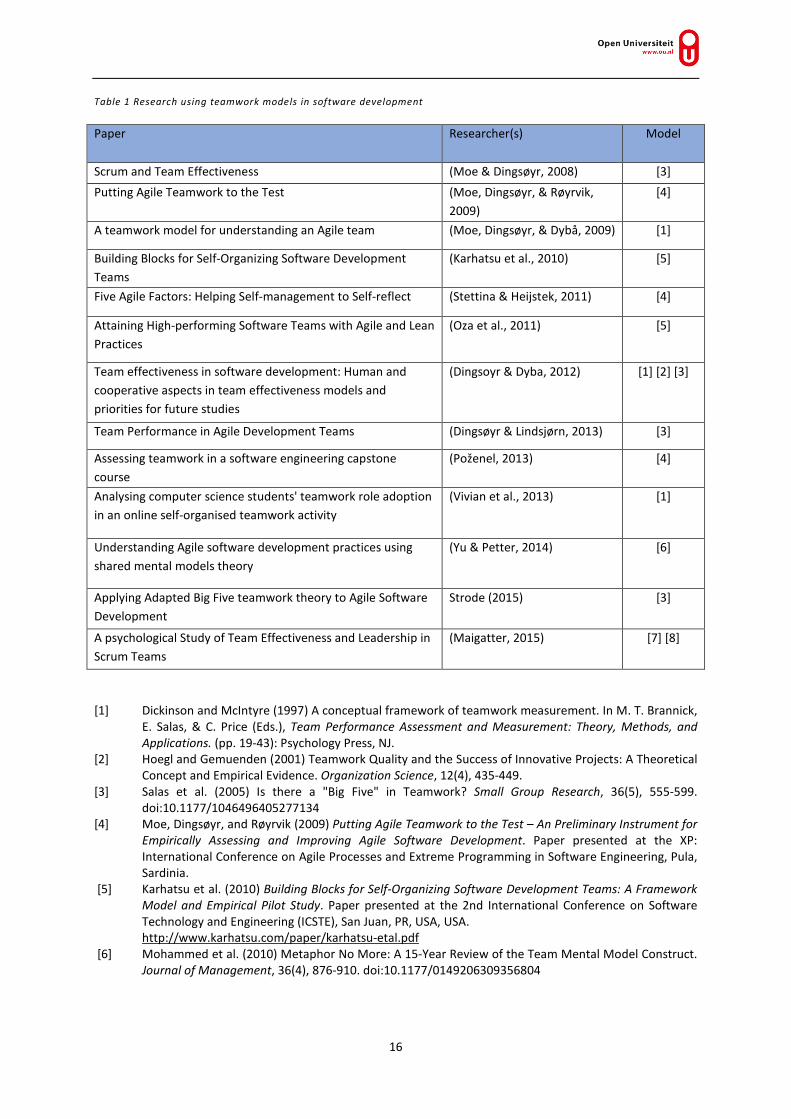
According to the Merriam-Webster dictionary, teamwork is “work done by several associates with each doing a part but all subordinating personal prominence to the efficiency of the whole”. Teamwork is central to Agile software development. About 58% of the respondents in the 11th annual state of Agile report (VersionOne.com, 2017) works with Scrum teams. An Agile team is responsible for many aspects of the work that used to be performed by a manager or team lead. In addition to writing the software, tasks like planning, scheduling, and making decisions are a responsibility of the team now. This raises several questions. Are software developers able and prepared to take over these extra tasks? What is good teamwork in an Agile setting? What is needed to select the right people for an Agile team and how should they be assessed and trained? To answer these questions a literature review was conducted of the use of teamwork models in research on Agile software development. Table 1 gives an overview of research on team models used in the thesis. Appendix A shows a short description of the models used in previous research. According to Strode (2015), teamwork research has seldom been applied to the Agile software development project context. In a 2015 literature review, Strode located three studies that focus exclusively on applying teamwork theory to Agile software development. First Moe and Dingsøyr (2008) used the Big Five theory of teamwork (Salas et al., 2005) in a single case study on a Scrum project to test whether the theory was applicable to Scrum. They found that each component and coordination mechanism in the theory was reflected in the Agile project with the exception of team leadership. The definition of the team leadership role in the Big Five theory is at odds with the accepted leadership profile in an Agile project, which promotes shared distributed leadership among all team members. In a second study by Moe et al. (2009), the Dickinson and McIntyre model (1997) was used to explore the nature of self-organizing Agile teams. They chose this theoretical model because it is one of the few theories that explains self-organising teams. This is because it includes concepts of shared leadership and double-loop learning, which are characteristics of self-managing Agile teams. In a third study, Yu and Petter (2014) used the shared mental model theory of Mohammed (2010). Yu and Petter argued that practices from extreme programming and Scrum, such as the system metaphor, stand-up meeting and on-site customer, achieve a shared mental model in the project team. In the literature review, more research on using team models in Agile software development was found than the list compiled by Strode (2015). Moe, Dingsøyr, and Røyrvik (2009) proposed the use of “five dimensions of Agile teamwork” in a tool to assess and improve Agile software development. The dimensions shared leadership, team orientation, redundancy, learning and autonomy were used to create a radar plot that shows the status of the teamwork.

15
Additionally, Stettina and Heijstek (2011) tested the tool created by (Moe, Dingsøyr, & Røyrvik) in a study in eight international Scrum teams. They found that the tool can be used to compare and measure values for each of the factors. Karhatsu et al. (2010) extended the five dimensions model of Moe with the dimension ‘communication and collaboration’. The extended model was validated in two case studies. In the case studies, autonomy, communication and collaboration were the main components for building self-organizing software development teams. Oza, Kettunen, Abrahamsson, and Münch (2011) used the six dimensions of the Karhatsu model in an empirical case study on how to attain high-performing software teams. They found that certain Agile software practices influenced developing self-organization in the team. Autonomy and shared leadership had clear connections to high-performing team characteristics. Dingsøyr and Dyba (2012) described three teamwork models, the Dickinson and McIntyre model (1997), the teamwork quality model (TWQ) of Hoegl and Gemuenden (2001) and the Big Five teamwork model of Salas (2005). They discussed priorities for future studies on software teams and asked: “Do we need our own effectiveness model for software teams?” The answer to that question was “We cannot say whether we need our own models of team effectiveness in software research, but we need to increase the understanding of the genuine characteristics of software development to know what applies.” Poženel (2013) used the five dimensions of Agile teamwork by Moe et al. (2009) to look at the quality of teamwork in a software engineering course with students. A further study with students was done by Vivian, Falkner, and Falkner (2013). They used the Dickinson and McIntyre model to look at role adaption of science students. In 2013 Dingsøyr & Lindsjørn (2013) performed a focus group study investigating the factors that influence effective teamwork according to software practitioners. For this research, they used the factors of the Big Five teamwork model (Salas et al., 2005). They found that the Salas model seems to fit well with what practitioners perceive as factors that affect team performance. Finally, Maigatter (2015) used the model of team effectiveness (Hackman, 1983) and the team diagnostic survey (Wageman, Hackman, & Lehman, 2005) to study team effectiveness and leadership in Scrum teams. This model mainly looks at the structure of the team. It should be a ‘real team’ and have a compelling direction, an enabling structure, a supportive organizational context and expert coaching.
16
Table 1 Research using teamwork models in software development Paper Researcher(s)
Model
Scrum and Team Effectiveness (Moe & Dingsøyr, 2008) [3] Putting Agile Teamwork to the Test (Moe, Dingsøyr, & Røyrvik,
2009) [4]
A teamwork model for understanding an Agile team (Moe, Dingsøyr, & Dybå, 2009) [1]
Building Blocks for Self-Organizing Software Development Teams
(Karhatsu et al., 2010) [5]
Five Agile Factors: Helping Self-management to Self-reflect (Stettina & Heijstek, 2011) [4]
Attaining High-performing Software Teams with Agile and Lean Practices
(Oza et al., 2011) [5]
Team effectiveness in software development: Human and cooperative aspects in team effectiveness models and priorities for future studies
(Dingsoyr & Dyba, 2012) [1] [2] [3]
Team Performance in Agile Development Teams (Dingsøyr & Lindsjørn, 2013) [3]
Assessing teamwork in a software engineering capstone course
(Poženel, 2013) [4]
Analysing computer science students' teamwork role adoption in an online self-organised teamwork activity
(Vivian et al., 2013) [1]
Understanding Agile software development practices using shared mental models theory
(Yu & Petter, 2014) [6]
Applying Adapted Big Five teamwork theory to Agile Software Development
Strode (2015) [3]
A psychological Study of Team Effectiveness and Leadership in Scrum Teams
(Maigatter, 2015) [7] [8]
[1] Dickinson and McIntyre (1997) A conceptual framework of teamwork measurement. In M. T. Brannick,
E. Salas, & C. Price (Eds.), Team Performance Assessment and Measurement: Theory, Methods, and Applications. (pp. 19-43): Psychology Press, NJ.
[2] Hoegl and Gemuenden (2001) Teamwork Quality and the Success of Innovative Projects: A Theoretical Concept and Empirical Evidence. Organization Science, 12(4), 435-449.
[3] Salas et al. (2005) Is there a "Big Five" in Teamwork? Small Group Research, 36(5), 555-599. doi:10.1177/1046496405277134
[4] Moe, Dingsøyr, and Røyrvik (2009) Putting Agile Teamwork to the Test – An Preliminary Instrument for Empirically Assessing and Improving Agile Software Development. Paper presented at the XP: International Conference on Agile Processes and Extreme Programming in Software Engineering, Pula, Sardinia.
[5] Karhatsu et al. (2010) Building Blocks for Self-Organizing Software Development Teams: A Framework Model and Empirical Pilot Study. Paper presented at the 2nd International Conference on Software Technology and Engineering (ICSTE), San Juan, PR, USA, USA.
http://www.karhatsu.com/paper/karhatsu-etal.pdf [6] Mohammed et al. (2010) Metaphor No More: A 15-Year Review of the Team Mental Model Construct.
Journal of Management, 36(4), 876-910. doi:10.1177/0149206309356804
17
[7] Hackman (1983) A normative model of work team effectiveness (technical report #2). Retrieved from http://scholar.google.nl/scholar_url?url=http://www.dtic.mil/cgi-bin/GetTRDoc%3FAD%3DADA136398&hl=en&sa=X&scisig=AAGBfm3SqQf7LhGfvgrXC4asGFfHdWprUw&nossl=1&oi=scholarr&ved=0ahUKEwik4rqpuNTNAhUBXRQKHfoaBCIQgAMIGygAMAA
[8] Wageman et al. (2005) Team diagnostic survey Development of an Instrument. The journal of applied behavioural science, 41(4).
The models by Hackman (1983) and Wageman et al. (2005) are not used in this research because they mainly describe the desired structure of the team instead of behaviour of the team members as the other models do. Structure does influence the behaviour of the team member but is left outside of the scope for this thesis.
2.3 Differences and similarit ies of the models used
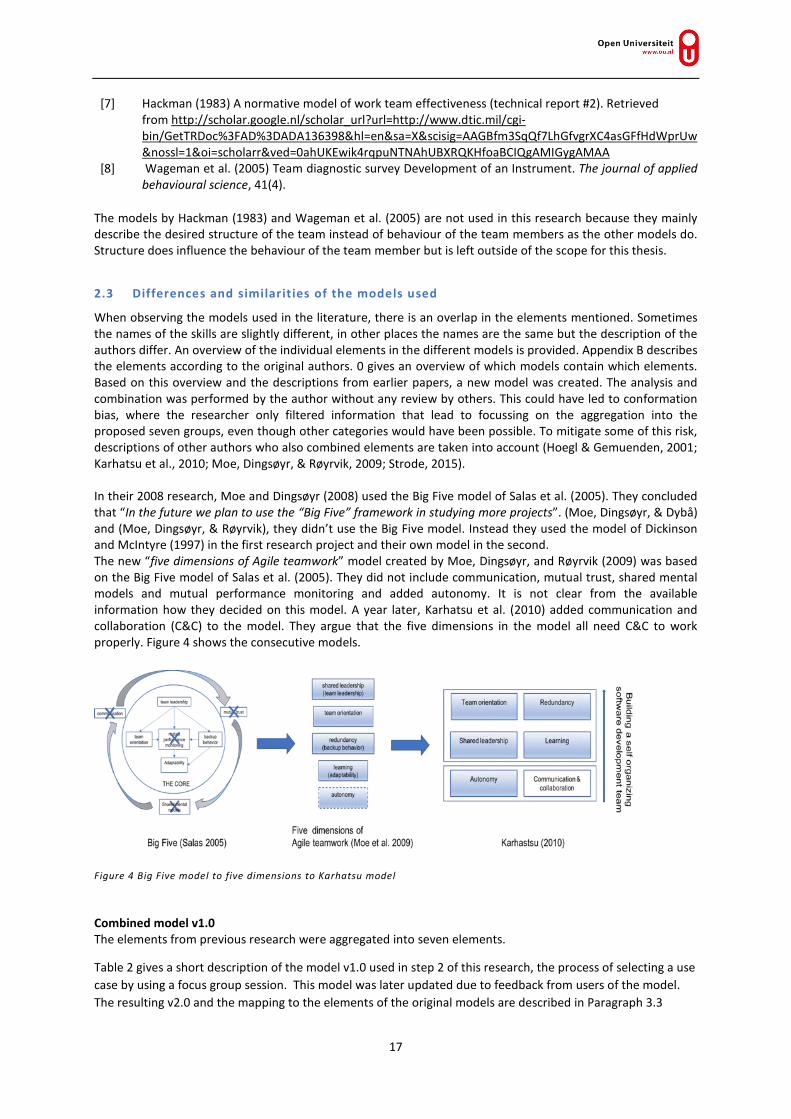
When observing the models used in the literature, there is an overlap in the elements mentioned. Sometimes the names of the skills are slightly different, in other places the names are the same but the description of the authors differ. An overview of the individual elements in the different models is provided. Appendix B describes the elements according to the original authors. 0 gives an overview of which models contain which elements. Based on this overview and the descriptions from earlier papers, a new model was created. The analysis and combination was performed by the author without any review by others. This could have led to conformation bias, where the researcher only filtered information that lead to focussing on the aggregation into the proposed seven groups, even though other categories would have been possible. To mitigate some of this risk, descriptions of other authors who also combined elements are taken into account (Hoegl & Gemuenden, 2001; Karhatsu et al., 2010; Moe, Dingsøyr, & Røyrvik, 2009; Strode, 2015). In their 2008 research, Moe and Dingsøyr (2008) used the Big Five model of Salas et al. (2005). They concluded that “In the future we plan to use the “Big Five” framework in studying more projects”. (Moe, Dingsøyr, & Dybå) and (Moe, Dingsøyr, & Røyrvik), they didn’t use the Big Five model. Instead they used the model of Dickinson and McIntyre (1997) in the first research project and their own model in the second. The new “five dimensions of Agile teamwork” model created by Moe, Dingsøyr, and Røyrvik (2009) was based on the Big Five model of Salas et al. (2005). They did not include communication, mutual trust, shared mental models and mutual performance monitoring and added autonomy. It is not clear from the available information how they decided on this model. A year later, Karhatsu et al. (2010) added communication and collaboration (C&C) to the model. They argue that the five dimensions in the model all need C&C to work properly. Figure 4 shows the consecutive models.
Figure 4 Big Five model to five dimensions to Karhatsu model Combined model v1.0 The elements from previous research were aggregated into seven elements.
Table 2 gives a short description of the model v1.0 used in step 2 of this research, the process of selecting a use case by using a focus group session. This model was later updated due to feedback from users of the model. The resulting v2.0 and the mapping to the elements of the original models are described in Paragraph 3.3

18
Table 2 Short description of the combined model v1.0
The description of the combined model, including a short description and terms used in the original models, is in Appendix E. This model was one used in the focus group described in Appendix L. Figure 5 shows the aggregated model v1.0.
Figure 5 Agile team skills model v1.0
In the remainder of this paragraph, the reason for combining these elements is described. Appendix D gives an overview of the aggregated elements and their place in the various models.
Short description
Adapting to change • Altering a course of action or team repertoire in response to changing conditions
• Short iterations, giving and receiving of feedback Autonomy • The team’s ability to regulate their boundary conditions, to authorize
the team and have someone to protect them
Communication • A way to exchange information between a sender and a receiver irrespective of the medium
Keeping track of the work
• Team members executing their activities in a timely and integrated manner
• Work together in open workspace, share information daily, visualize progress
Sharing leadership • Leadership should be rotated to the person with the key knowledge, skills, and abilities for the particular issues facing the team at any given moment
Sharing workload • The possibility and willingness of team members to help each other with the work
Team goals over individual goals
• Team goal should be valued over the individual goals • Members should accept and work according to the team norms

19
Communication Most models contain some reference to communication. The dimensions communication combines the elements of ‘communication’, ‘closed-loop communication’ and ‘communication and collaboration’. Salas et al. (2005), Dickinson and McIntyre (19978) and Hoegl and Gemuenden (2001) respectively describe the importance of communication as “a way to exchange information between a sender and a receiver irrespective of the medium”, “the exchange of information between two or more team members” and as “communication being the most elementary component of the TWQ model”. In the model of Karhatsu et al. (2010), communication is combined with collaboration. They describe communication as “sending and receiving information”. Sharing workload Backup behaviour, mutual support and redundancy all involve the possibility and willingness of team members to help each other with the work. This requires “members [to] have an understanding of other members’ tasks.” (Dickinson & McIntyre, 1997). It also means that there needs to be the “ability to anticipate other team members’ needs through accurate knowledge about their responsibilities. This includes the ability to shift workload among members to achieve balance during high periods of workload or pressure” (Salas et al., 2005). For Hoegl and Gemuenden (2001), the main question is “Do team members help and support each other in carrying out their tasks?” Moe, Dingsøyr, and Røyrvik (2009) and Karhatsu et al. (2010) use the term ‘redundancy’ to describe the fact that team members need multiple skills to be able to perform part of each other’s job and substitute for each other when needed. Autonomy Autonomy is only described as a separate component of successful Agile teamwork by Moe, Dingsøyr, and Røyrvik (2009) and Karhatsu et al. (2010). It is “the team’s ability to regulate their boundary conditions, to authorize the team and have someone to protect them.” It could be argued that autonomy has more to do with the structure of the team and or organisation and thus should not have a place in the model that looks at skills needed by the team members. It was added in this research because it is a skill the team needs to ‘defend’ their autonomy and right to make their own choices. Adapting to change This element combines ‘adaptability’, ‘learning’ and ‘feedback’. Salas et al. (2005) define adaptability as “Altering a course of action or team repertoire in response to changing conditions (internal or external)”. According to Moe, Dingsøyr, and Røyrvik (2009), “...studies of self-organizing teams show that this kind of organization requires a capacity for learning that allows operating norms and rules to change in relation to transformations in the wider environment”. Karhatsu et al. (2010) advocate that to learn, the team should “Have short iterations. Have end-of-iteration review sessions. Give continuous feedback. Moreover, the team cannot make correct decisions in a changing environment without learning.” Hoegl and Gemuenden (2001) consider learning to be a positive outcome of the five other components of their model. Learning is part of the category personal success: “For the purpose of this investigation, the two variables satisfaction and learning build the category personal success of team members. Satisfaction with working in teams leads to increased motivation for participating in future team projects. Also, collaborating with other people provides the opportunity for learning social, project management, technical, and creative skills. Such acquisition of new skills relates to team members' desire for personal and professional growth.” Finally, feedback as part of the Dickinson and McIntyre (1997) model is aimed at seeking and giving information on performance and accepting time-saving suggestions offered by other team members. This could also be important to adapting to change and learning.

20
Keeping track of the work For this element, the elements of ‘coordination’, ‘(mutual performance) monitoring’ and ‘collaboration’ are combined. In the model of Dickinson and McIntyre (1997), coordination is defined as “team members executing their activities in a timely and integrated manner”. Salas et al. (2005) use the term mutual performance monitoring for “the ability to develop common understandings of the team environment and apply appropriate task strategies to accurately monitor teammate performance”. Hoegl and Gemuenden (2001) discuss the importance of harmonizing and synchronizing the individual contributions to maximize the quality of the collaboration in a team. This means that “the teams have to develop and agree upon a common task-related goal structure that has sufficiently clear sub goals for each team member, free of gaps and overlaps.” In the model of Karhatsu et al. (2010), collaboration is part of “communication and collaboration” in which collaboration is defined as “Work together in open workspace. Share information daily. Visualize progress.” Sharing leadership Apart from the model of Hoegl and Gemuenden (2001), all models contain a component for shared or team leadership. In the Hoegl model leadership is considered important but outside the scope of the model. The model of Salas et al. (2005) is not created with an aim at self-organizing teams. It states that a team leader should have the “ability to direct and coordinate the activities of other team members, assess team performance, assign tasks, develop team knowledge, skills and abilities, motivate team members, plan and organize, and establish a positive atmosphere.” In the other three models, leadership does not reside in one person. According to Moe, Dingsøyr, and Røyrvik (2009), “Leadership should be rotated to the person with the key knowledge, skills, and abilities for the particular issues facing the team at any given moment”. The skills needed are similar to the ones Salas et al. (2005) describe: “[leadership] involves providing direction, structure, and support for other team members. It does not necessarily refer to a single individual with formal authority over others. Team leadership can be shown by several team members, e.g. explaining to other team members exactly what is needed from them during an assignment; listening to the concerns of other team members”. Team goals over individual goals The elements ‘team orientation’, ‘balance of member contributions’, ‘effort’, ‘mutual trust’, ‘shared mental models’ and ‘cohesion’ are combined into ‘team goals over individual goals’. The team members ‘working as a team’ is an important part of all models. Most models state that the team goal should be valued over the individual goals and that members should accept and work according to the team norms (Dickinson & McIntyre, 1997), (Salas et al., 2005) (Moe, Dingsøyr, & Røyrvik, 2009) (Karhatsu et al., 2010) (Hoegl & Gemuenden, 2001). The component ‘mutual trust’ in the Salas et al. (2005) model is described as “the shared belief that team members will perform their roles and protect the interest of their teammates.” Shared mental models in the Salas et al. (2005) model also describe the organization of the team and how the team members interact. Mohammed et al. (2010) describe shared mental models as “organized mental representations of the key elements within a team’s relevant environment that are shared across team members”. Cohesion in the model of Hoegl and Gemuenden (2001) considers whether the team members are motivated to maintain the team and what the team spirit is like. They state that “High TWQ can hardly be achieved without an adequate level of cohesion. If team members lack a sense of togetherness and belonging, if there is little desire to keep the team going, then intensive collaboration seems unlikely.” Another component of the Hoegl model is effort: “To achieve high TWQ and avoid conflict among team members, it is important for everyone in the team to know and accept the work norms concerning sufficient effort”. Finally, the Hoegl model contains a ‘balance of member contributions’ component. This describes the possibility for all team members to bring in their expertise to their full potential. Although team goals are important, team members should have sufficient possibilities to express and use their own skills as a member of the team.

21
2.4 Measuring the model elements
Rather than creating a totally new questionnaire, the questionnaire was composed using existing work. One advantage of using these existing questions is that they were tested at the time of first use. In this case, an exact questionnaire for the model was not available because the model was aggregated from several existing models. However, some previous examples of questionnaires were found that covered part of the dimensions of the Agile skills model. For a large action research project, Moe, Dingsøyr, and Røyrvik (2009) needed a way to describe and diagnose the status of teams. For that purpose, they created an instrument that described the five dimensions that they identified in previous research. The instrument consisted of a series of open-ended questions for the dimensions shared leadership, team orientation, redundancy, learning, and autonomy. Based on an interview with all members of a software team the researchers discussed the answers and gave the team a score of 0 to 10 on each dimension. The scores were then plotted in a radar graph. The questions are shown in Appendix F. Stettina and Heijstek (2011) adjusted the questions so they could be used in an online survey. A standard Likert scale consisting of five items was used. Appendix G gives an overview of the questions. The survey of Stettina and Heijstek does not contain questions for the dimensions ‘communication’ and ‘coordination’ (keeping track of the work). For these dimensions, questions are used from a study by Park, Henkin, and Egley (2005). For their study on teacher team commitment, teamwork and trust, they used a survey based on work of Rosenstein (1994) to measure the skills of their subjects. Each skill was measured by three survey items adapted from Rosenstein’s study. The teamwork components—communication, team orientation, team leadership, monitoring, feedback, backup behaviour, and coordination—were based on the team model of Dickinson and McIntyre (1997). Combining the questions of Stettina and Heijstek (2011) with the questions for the dimensions communication and coordination from Park et al. (2005), the questionnaire in Appendix I was created. The questions were rewritten to fit the purpose of using them in an online questionnaire on the skills of a team. For example, one of the open-ended questions of Moe et al.— “Is everyone involved in the decision-making process?”—was changed to “I feel everyone is involved in the decision-making process” by Stettina. For the new survey for this research, it was rephrased to “I experience everyone is involved in the team decisions”.
22
3 STEP 2 - FOCUS GROUP
3.1 Focus group methodology and planning
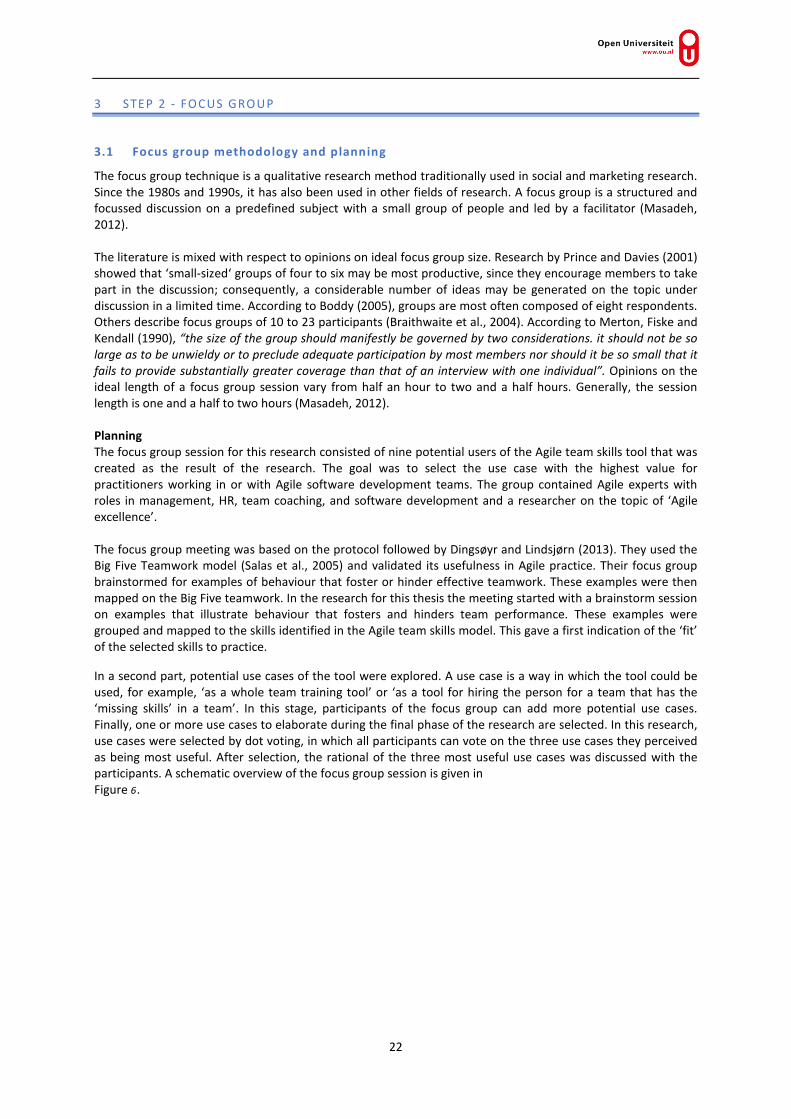
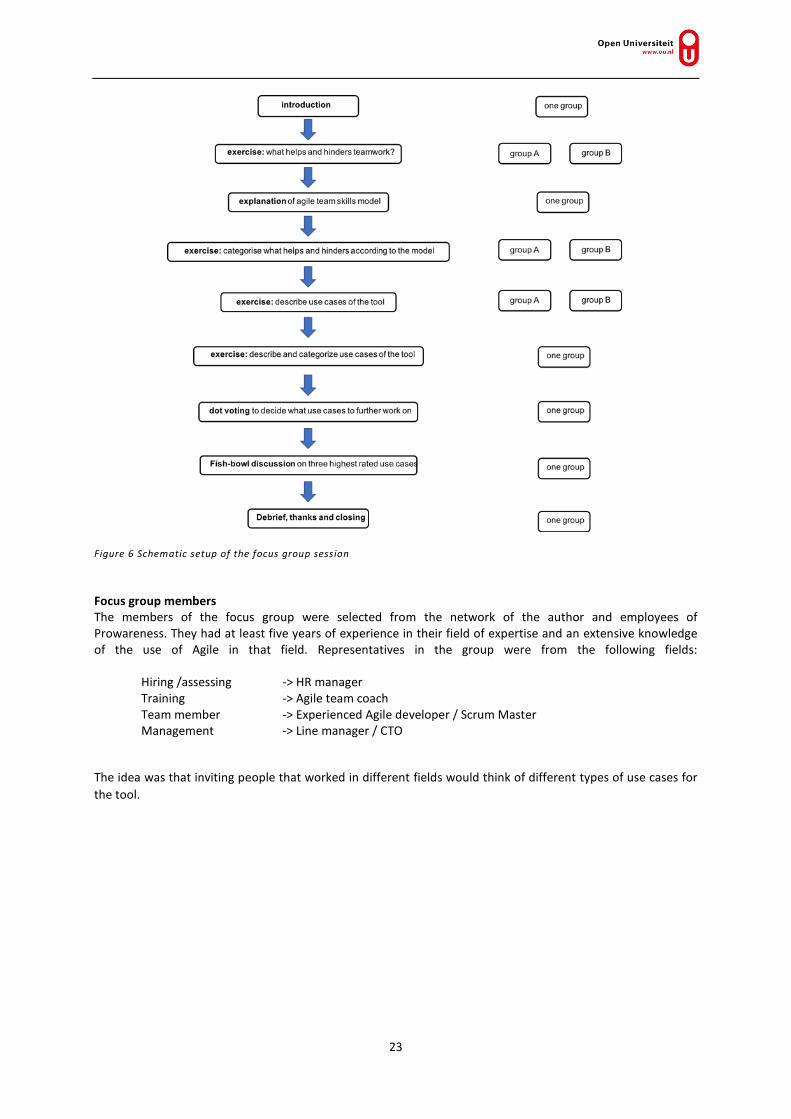
The focus group technique is a qualitative research method traditionally used in social and marketing research. Since the 1980s and 1990s, it has also been used in other fields of research. A focus group is a structured and focussed discussion on a predefined subject with a small group of people and led by a facilitator (Masadeh, 2012). The literature is mixed with respect to opinions on ideal focus group size. Research by Prince and Davies (2001) showed that ‘small-sized‘ groups of four to six may be most productive, since they encourage members to take part in the discussion; consequently, a considerable number of ideas may be generated on the topic under discussion in a limited time. According to Boddy (2005), groups are most often composed of eight respondents. Others describe focus groups of 10 to 23 participants (Braithwaite et al., 2004). According to Merton, Fiske and Kendall (1990), “the size of the group should manifestly be governed by two considerations. it should not be so large as to be unwieldy or to preclude adequate participation by most members nor should it be so small that it fails to provide substantially greater coverage than that of an interview with one individual”. Opinions on the ideal length of a focus group session vary from half an hour to two and a half hours. Generally, the session length is one and a half to two hours (Masadeh, 2012). Planning The focus group session for this research consisted of nine potential users of the Agile team skills tool that was created as the result of the research. The goal was to select the use case with the highest value for practitioners working in or with Agile software development teams. The group contained Agile experts with roles in management, HR, team coaching, and software development and a researcher on the topic of ‘Agile excellence’. The focus group meeting was based on the protocol followed by Dingsøyr and Lindsjørn (2013). They used the Big Five Teamwork model (Salas et al., 2005) and validated its usefulness in Agile practice. Their focus group brainstormed for examples of behaviour that foster or hinder effective teamwork. These examples were then mapped on the Big Five teamwork. In the research for this thesis the meeting started with a brainstorm session on examples that illustrate behaviour that fosters and hinders team performance. These examples were grouped and mapped to the skills identified in the Agile team skills model. This gave a first indication of the ‘fit’ of the selected skills to practice. In a second part, potential use cases of the tool were explored. A use case is a way in which the tool could be used, for example, ‘as a whole team training tool’ or ‘as a tool for hiring the person for a team that has the ‘missing skills’ in a team’. In this stage, participants of the focus group can add more potential use cases. Finally, one or more use cases to elaborate during the final phase of the research are selected. In this research, use cases were selected by dot voting, in which all participants can vote on the three use cases they perceived as being most useful. After selection, the rational of the three most useful use cases was discussed with the participants. A schematic overview of the focus group session is given in Figure 6.
23
Figure 6 Schematic setup of the focus group session Focus group members The members of the focus group were selected from the network of the author and employees of Prowareness. They had at least five years of experience in their field of expertise and an extensive knowledge of the use of Agile in that field. Representatives in the group were from the following fields: Hiring /assessing -> HR manager Training -> Agile team coach Team member -> Experienced Agile developer / Scrum Master Management -> Line manager / CTO
The idea was that inviting people that worked in different fields would think of different types of use cases for the tool.
24
3.2 Focus group session results
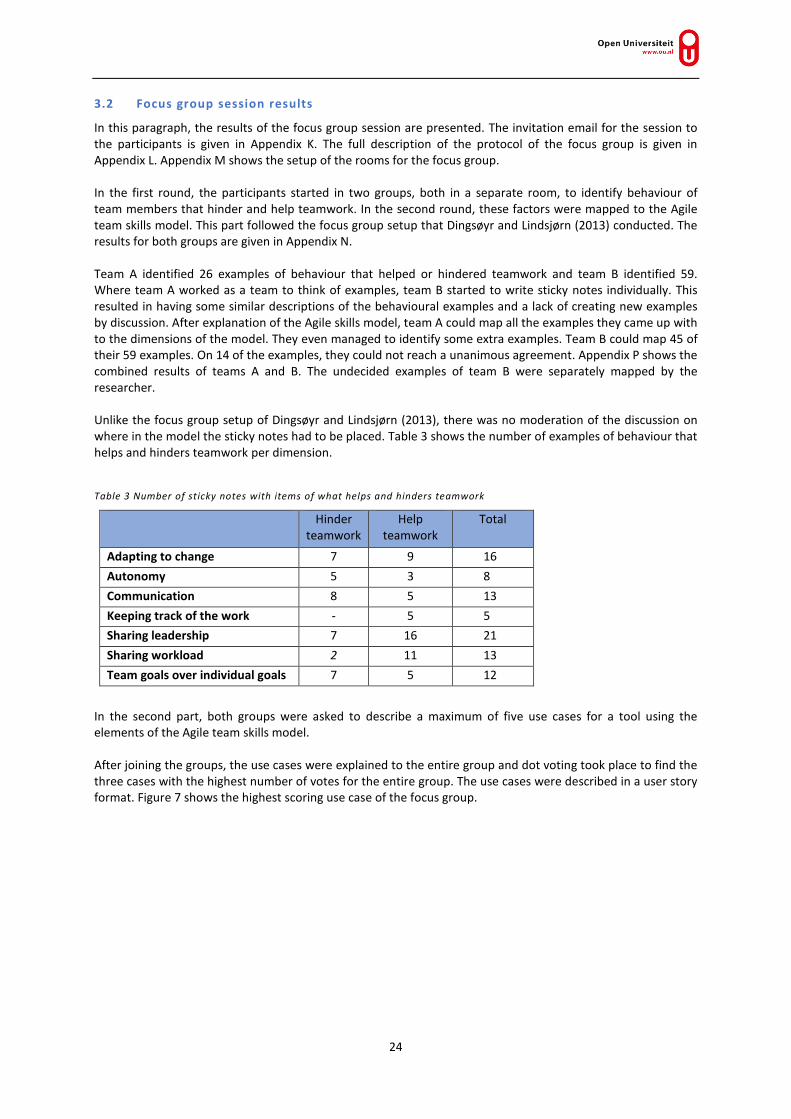
In this paragraph, the results of the focus group session are presented. The invitation email for the session to the participants is given in Appendix K. The full description of the protocol of the focus group is given in Appendix L. Appendix M shows the setup of the rooms for the focus group. In the first round, the participants started in two groups, both in a separate room, to identify behaviour of team members that hinder and help teamwork. In the second round, these factors were mapped to the Agile team skills model. This part followed the focus group setup that Dingsøyr and Lindsjørn (2013) conducted. The results for both groups are given in Appendix N. Team A identified 26 examples of behaviour that helped or hindered teamwork and team B identified 59. Where team A worked as a team to think of examples, team B started to write sticky notes individually. This resulted in having some similar descriptions of the behavioural examples and a lack of creating new examples by discussion. After explanation of the Agile skills model, team A could map all the examples they came up with to the dimensions of the model. They even managed to identify some extra examples. Team B could map 45 of their 59 examples. On 14 of the examples, they could not reach a unanimous agreement. Appendix P shows the combined results of teams A and B. The undecided examples of team B were separately mapped by the researcher. Unlike the focus group setup of Dingsøyr and Lindsjørn (2013), there was no moderation of the discussion on where in the model the sticky notes had to be placed. Table 3 shows the number of examples of behaviour that helps and hinders teamwork per dimension. Table 3 Number of sticky notes with items of what helps and hinders teamwork
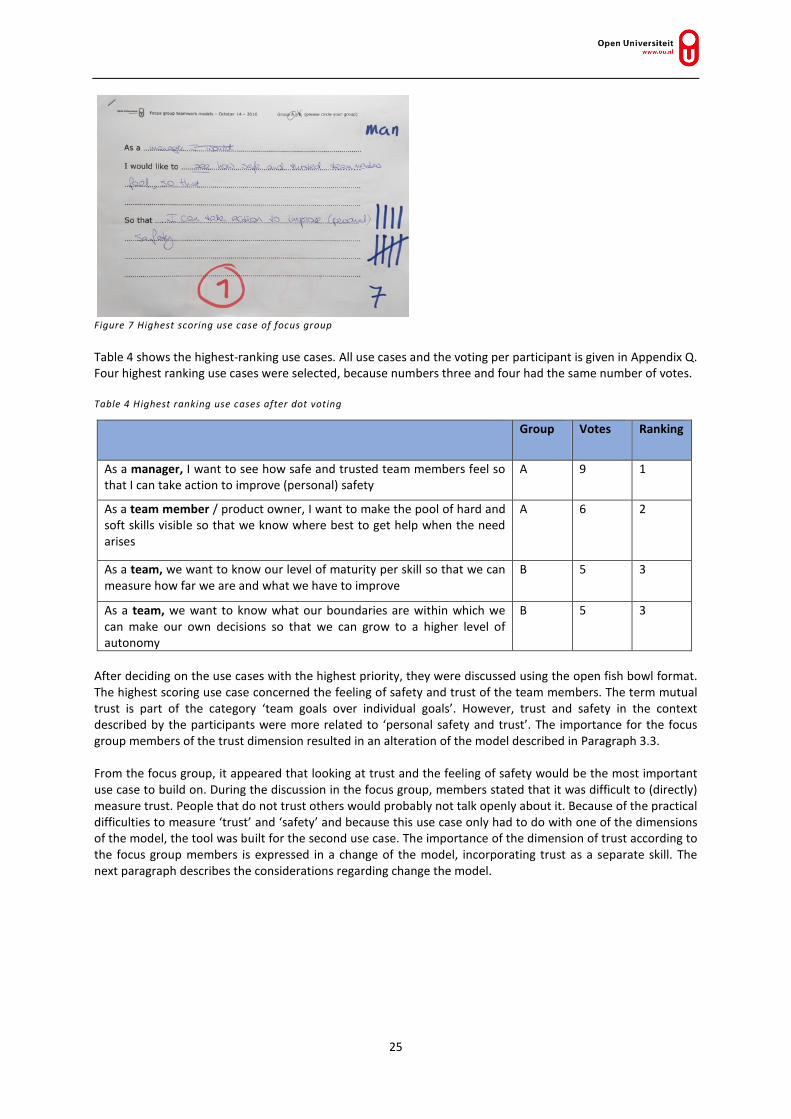
In the second part, both groups were asked to describe a maximum of five use cases for a tool using the elements of the Agile team skills model. After joining the groups, the use cases were explained to the entire group and dot voting took place to find the three cases with the highest number of votes for the entire group. The use cases were described in a user story format. Figure 7 shows the highest scoring use case of the focus group.
Hinder teamwork
Help teamwork
Total
Adapting to change 7 9 16 Autonomy 5 3 8 Communication 8 5 13 Keeping track of the work - 5 5 Sharing leadership 7 16 21 Sharing workload 2 11 13 Team goals over individual goals 7 5 12
25
Figure 7 Highest scoring use case of focus group Table 4 shows the highest-ranking use cases. All use cases and the voting per participant is given in Appendix Q. Four highest ranking use cases were selected, because numbers three and four had the same number of votes. Table 4 Highest ranking use cases after dot voting
After deciding on the use cases with the highest priority, they were discussed using the open fish bowl format. The highest scoring use case concerned the feeling of safety and trust of the team members. The term mutual trust is part of the category ‘team goals over individual goals’. However, trust and safety in the context described by the participants were more related to ‘personal safety and trust’. The importance for the focus group members of the trust dimension resulted in an alteration of the model described in Paragraph 3.3. From the focus group, it appeared that looking at trust and the feeling of safety would be the most important use case to build on. During the discussion in the focus group, members stated that it was difficult to (directly) measure trust. People that do not trust others would probably not talk openly about it. Because of the practical difficulties to measure ‘trust’ and ‘safety’ and because this use case only had to do with one of the dimensions of the model, the tool was built for the second use case. The importance of the dimension of trust according to the focus group members is expressed in a change of the model, incorporating trust as a separate skill. The next paragraph describes the considerations regarding change the model.
Group Votes Ranking
As a manager, I want to see how safe and trusted team members feel so that I can take action to improve (personal) safety
A
9 1
As a team member / product owner, I want to make the pool of hard and soft skills visible so that we know where best to get help when the need arises
A
6 2
As a team, we want to know our level of maturity per skill so that we can measure how far we are and what we have to improve
B 5 3
As a team, we want to know what our boundaries are within which we can make our own decisions so that we can grow to a higher level of autonomy
B 5 3
26
3.3 Adapting model v1.0 to v2.0
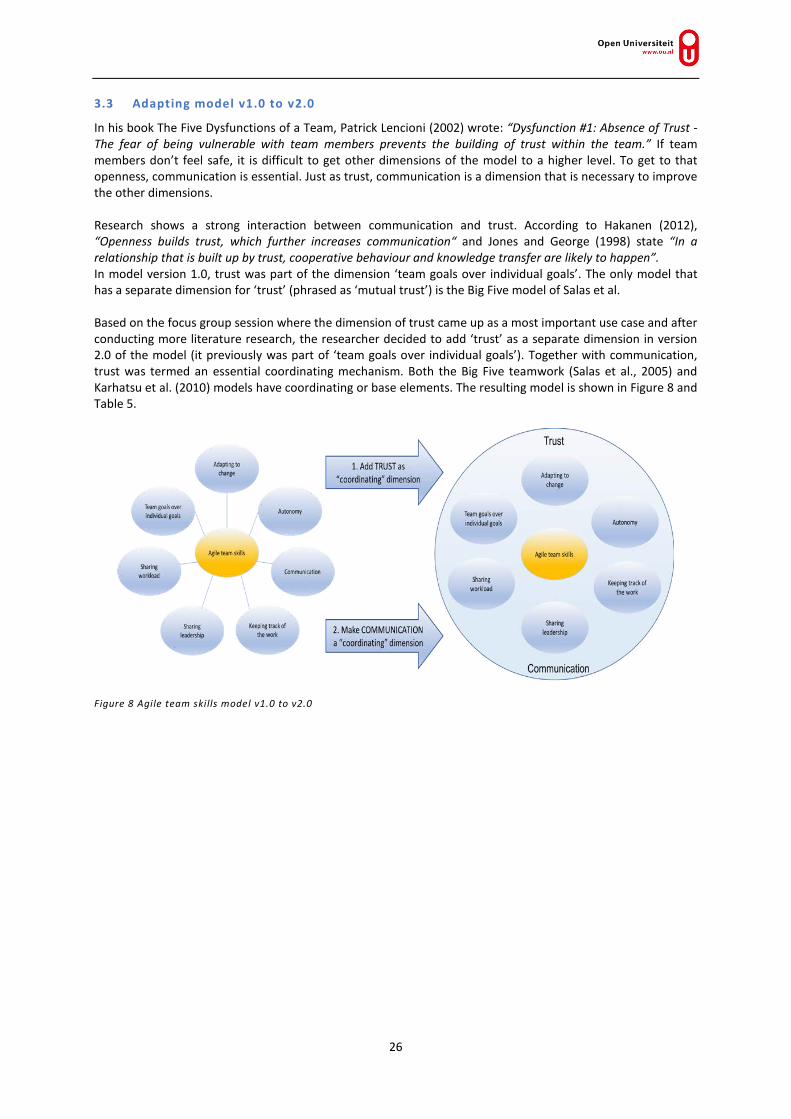
In his book The Five Dysfunctions of a Team, Patrick Lencioni (2002) wrote: “Dysfunction #1: Absence of Trust - The fear of being vulnerable with team members prevents the building of trust within the team.” If team members don’t feel safe, it is difficult to get other dimensions of the model to a higher level. To get to that openness, communication is essential. Just as trust, communication is a dimension that is necessary to improve the other dimensions. Research shows a strong interaction between communication and trust. According to Hakanen (2012), “Openness builds trust, which further increases communication“ and Jones and George (1998) state “In a relationship that is built up by trust, cooperative behaviour and knowledge transfer are likely to happen”. In model version 1.0, trust was part of the dimension ‘team goals over individual goals’. The only model that has a separate dimension for ‘trust’ (phrased as ‘mutual trust’) is the Big Five model of Salas et al. Based on the focus group session where the dimension of trust came up as a most important use case and after conducting more literature research, the researcher decided to add ‘trust’ as a separate dimension in version 2.0 of the model (it previously was part of ‘team goals over individual goals’). Together with communication, trust was termed an essential coordinating mechanism. Both the Big Five teamwork (Salas et al., 2005) and Karhatsu et al. (2010) models have coordinating or base elements. The resulting model is shown in Figure 8 and Table 5.
Figure 8 Agile team skills model v1.0 to v2.0

27
Table 5 Short description of the combined model v2.0
Going back to the models used in earlier research, Figure 4 showed the progression from the Big Five model (Salas et al., 2005) to the five dimensions of Agile teamwork (Moe, Dingsøyr, & Røyrvik, 2009) and the model of Karhatsu et al. (2010). Figure 9 compares the Karhatsu model to the Agile team skills model v2.0. Except for ‘trust’, all the dimensions of the Agile team skills model v2.0 are found in the Karhatsu model. Sometimes the names of the dimensions differ (sharing workload versus redundancy), but the meaning is similar. In the Karhatsu model, communication and collaboration are represented as a single dimension. ‘Sharing information daily’ and ‘visualize progress’ is found in the description for C&C. These dimensions map directly to the ‘keeping track of the work’ dimension of the Agile team skills model.
Short description
Adapting to change • Altering a course of action or team repertoire in response to changing conditions
• Short iterations, giving and receiving of feedback Autonomy • The team’s ability to regulate their boundary conditions,
authorize the team and have someone to protect them
Keeping track of the work • Team members executing their activities in a timely and integrated manner
• Work together in open workspace, share information daily, visualize progress
Sharing leadership • Leadership should be rotated to the person with the key knowledge, skills, and abilities for the issues facing the team at any given moment
Sharing workload • The possibility and willingness of team members to help each other with the work
Team goals over individual goals • Team goal should be valued over the individual goals Members should accept and work according to the team norms
Communication • A way to exchange information between a sender and a receiver irrespective of the medium
Trust • Faith in others’ behaviour and goodwill that can grow or vanish due to interaction and experiences

28
Figure 9 Comparing the Karhatsu model to Agile team skills model v2.0
Another main model used in earlier research on (Agile) teams is the model of Dickinson and McIntyre (1997). Figure 10 shows how this model compares to the Agile team skills model. These models also have a large overlap, except for ‘trust’ and ‘autonomy’.
Figure 10 Comparing the Dickinson and McIntyre model to Agile team skills model v2.0
29
4 STEP 3 – AGILE TE AM SKILLS TOOL V1.1
4.1 Agile team skills tool v1.1 methodology and planning
During the literature review, questionnaires were found that have been used in research on (software) team development. The questionnaire in Appendix I was created by combining and adapting three existing questionnaires (Appendix F, Appendix G, Appendix H). Although it is usually better to use an existing and tested questionnaire, it was chosen to adapt the existing questions because they were unclear and sometimes ambiguous. The new questionnaire was used as the input for a retrospective with three software development teams. Retrospective The retrospective is a very important event in Agile software development. The Scrum guide (Schwaber & Sutherland, 2016) describes the (sprint) retrospective as: “The Sprint Retrospective is an opportunity for the Scrum team to inspect itself and create a plan for improvements to be enacted during the next Sprint.”
According to the Sprint Guide, the purpose of a sprint retrospective is:
• Inspect how the last Sprint went with regards to people, relationships, process, and tools; • Identify and order the major items that went well and potential improvements; • Create a plan for implementing improvements to the way the Scrum Team does its work.
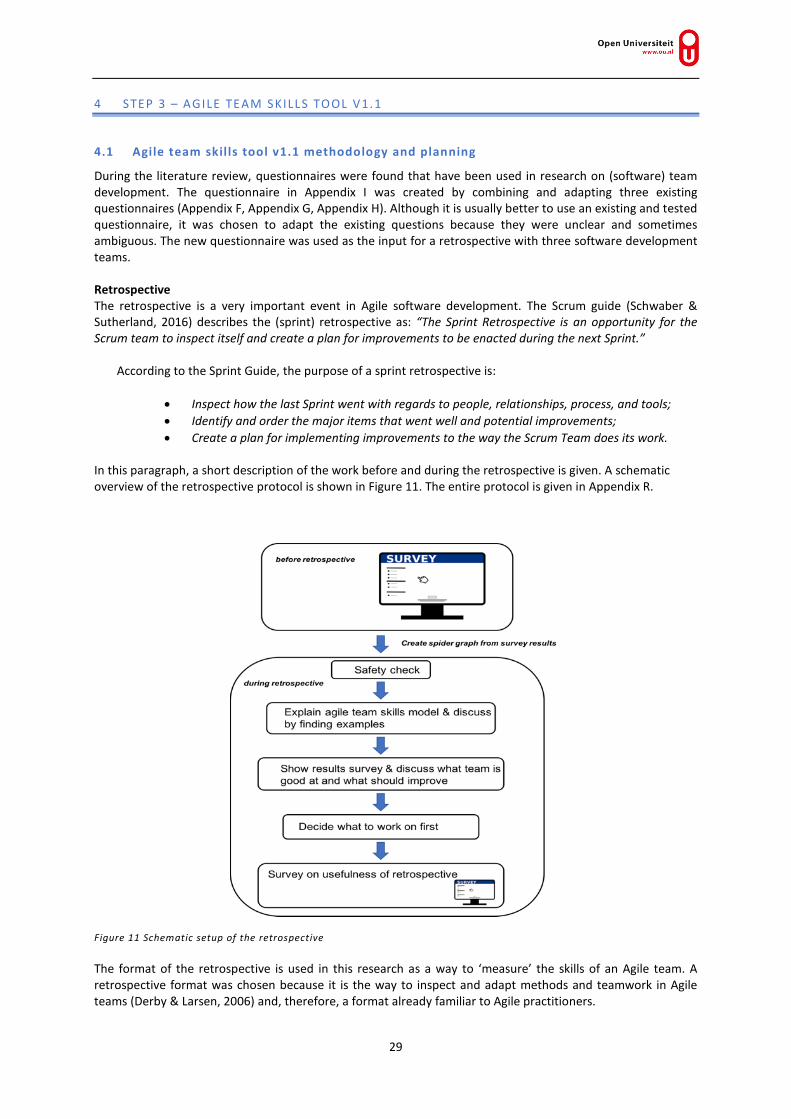
In this paragraph, a short description of the work before and during the retrospective is given. A schematic overview of the retrospective protocol is shown in Figure 11. The entire protocol is given in Appendix R.
Figure 11 Schematic setup of the retrospective The format of the retrospective is used in this research as a way to ‘measure’ the skills of an Agile team. A retrospective format was chosen because it is the way to inspect and adapt methods and teamwork in Agile teams (Derby & Larsen, 2006) and, therefore, a format already familiar to Agile practitioners.

30
Some work had to be completed before the retrospective. The Scrum Masters of the teams that performed the retrospective asked their team members to fill out an online survey that contained the questions of the Agile team skills tool. To reduce the bias, the team members filled out the survey anonymously. They had not been told at that stage what the survey questions represented. An overview of the survey is given in Appendix J. The survey was created using the online tool Typeform (https://www.typeform.com). From the result of the survey, a spider graph with a line for every team member was created. An example of such a spider graph is shown in Figure 12.
Figure 12 Example of spider graph based on survey results In the actual retrospective, the graph for the team was shown after the underlying model had been explained and discussed. During the discussion, the team members were asked to describe what ‘good’ and ‘bad’ examples of the skills would look like. After looking at the resulting spider graphs for the team, the individual team members were asked to write down what they thought is going well for the team and what could be improved. Each team member was asked to write three sticky notes for each. The outcome was displayed using the circle technique, where the inner circle represented where progress has already been made and the outer circle represents where further progress is needed. Next, the sticky notes were aggregated and the team decided what issues to work on first. This could be a skill that the team is weak at or a ‘strong’ skill where the team sees benefit in becoming even better at it. The team chose what to work on using dot voting. For the topic with the highest number of votes, the team decided on an actionable goal to make sure the team gets better at the chosen skill. The Agile team skills tool was used in three different teams in the presence of the researcher to get an indication of the usefulness of the tool and a description of the retrospective. The researcher facilitated the retrospective. At the end of the retrospective, the team was asked to fill out a survey about the usability of this format to improve on team skills. There was a separate survey for the Scrum Master / facilitator of the team. The survey for the team members and the Scrum Master are given in Appendix S and Appendix T. Selecting participating teams The participation teams were selected from the network of the author. For the first three sessions, Scrum Masters were directly approached via email and or phone.

31
4.2 Agile team skills tool v1.1 results
A test with v1.1 was carried out on May the 10th in one team and on May the 11th in two teams. On the 10th, the retrospective was carried out with a software development team (team A, GIS development). The team had recently switched to working with Agile and the Scrum Master of the team was an external Agile professional. Besides the Scrum Master, six developers and a project manager were present. On the next day, the retrospective was carried out in two teams (team B and C) of the same company. Both teams had also recently switched to working Agile. The Scrum Master had been working at the company for some time, but only became a Scrum Master with the recent switch to Agile. The Scrum Master was responsible for both teams and was coached by an external Agile coach, who also joined both retrospectives. Six developers, the Scrum Master and the Agile coach took part in the morning retrospective. Six developers, the product owner, the Scrum Master and the Agile coach took part in the afternoon retrospective. All three retrospectives were facilitated by the researcher. Appendix U shows the results of the radar graphs created based on the surveys before the retrospective and used as input for the discussions in the teams.
4.2.1 Results from retrospective facilitation v1.1
In the first test (team A), the retrospective took 1 hour and 45 minutes. At the end, the retrospective had to be stopped due to a planned meeting. This meant that the last phase—dot voting on what to work on first and deciding on an actionable improvement for the next sprint—was cut short. The first part of the retrospective took longer than anticipated. This was because people needed more time than expected to write down and explain their examples to the group. The second retrospective (team B) took around 1 hour and 30 minutes and resulted in an actionable improvement to try during the next sprint. It was an early morning retrospective and there was some discussion about a team member not being at the retrospective without telling the team and Scrum Master. Most participants joined in actively. The third retrospective took 60 minutes, although 1 hour and 30 minutes was available. This was because the steps of finding examples and deciding what to do were combined. The idea was to first come up with ‘general examples’ and in the next step find more specific examples for the team. These separate steps were created for the team to first talk about examples in general. Such ‘anonymous’ examples were expected to make it easier for the team to talk about them. This team wanted to proceed straight to the concrete examples in the team itself. The Agile coach later suggested that not everything had been said by the team. This is easier to be spotted and addressed by the Scrum Master of the team who knows the people and the context, than by an external facilitator, who knows nothing about the team members. Team members generally had the idea that ‘their lines’ in the graph showed the result that they would expect. If they thought the team did ‘good’ on a dimension it was more towards the higher score in the graph and if they thought the team could improve the scores it tended to be towards the lower scores. The graph lines were shared anonymously through coded lines in all three teams. Team members knew which line in the graph was theirs. Some team members decided to share that knowledge during discussions, others choose not to.

32
4.2.2 Survey results after the retrospective v1.1
The participants of the retrospective were asked to fill out a survey to rate the retrospective format. The survey questions for the Scrum Masters can be found in Appendix T and in Appendix S for the other participants.
Figure 13 shows the results of the multiple-choice question of the survey (n/m) that asked the participants to select the option(s) that applied.
• The retrospective content was related to the skills and knowledge I need • The retrospective made me think about my own actions • The retrospective gave me new insight into the needs of other team members • This retrospective gave me new insights into our functioning as a team • The retrospective will help us to improve as a team
Figure 13 Where did the retrospective give insight? test v1.1 In all teams, the percentage of team members who thought that the retrospective would help them improve as a team was high (75%). The score for ‘The retrospective content was related to the skills and knowledge I need’ was low, with an average over all the participants of 10%.
In Table 6, the average results for the rating of the retrospective and the likelihood that participants will encourage others to use the format is shown. Table 7 shows the Net Promoter Score (NPS) for the participants. For both, the scores of the Scrum Master / Agile coach are presented separately from those of the other participants, because the Scrum Masters are usually the ones to decide on the format of the retrospective and in that respect, could be seen as the ‘buyers’ of this retrospective format.

33
Table 6 Average rating for retrospective test v1.1
• On a scale from 1 to 10, how would you rate this retrospective format?
average
Scrum Master / Agile coach 8,9 (n=5)
Other participants 7,8 (n=20)
Total 8,0
• On a scale from 1 to 10, how likely is it that you would encourage others to use this retrospective format? (1 unlikely, 10 highly likely)
average
Scrum Master / Agile coach 9,2 (n=5)
Other participants 7,6 (n=20)
Total 7,9
Table 7 NPS for retrospective test v1.1
Detractor Passive Promotors NPS
Scrum Master / Agile coach 0% 20% 80% 80% (n=5)
Other participants 20% 60% 20% 0% (n=20)
Total 16% 52% 32% 16%
Looking at the averages and NPS, the Scrum Master and the Agile coach score higher than the other participants. In the NPS scoring system, participants who score a 6 or lower are called detractors and are basically ‘unsatisfied customers’. Passives scores of 7 or 8 are satisfied but unenthusiastic customers. Promotors score a 9 or 10 on the question how likely it is that they would encourage others to use the tool. They are loyal enthusiasts that will ‘sell’ the tool to others. The score for the Scrum Master / coach was 80%, which is high. The other participants have a score of 0. The big difference could be because the Scrum Master / coach had previous had contact with the researcher and decided that they wanted to try this format and, therefore, were positively biased. In the survey, the perfection game was used to ask for feedback. In the perfection game, participants are supposed to score a 10 if they think the format cannot be improved upon. A lower score should lead to suggestions for possible improvements. Besides possible improvements, the participant had to state what they liked about the retrospective. Appendix V gives the results for the questions ‘what would need to improve to make this format perfect’ and ‘what I like about the retrospective’. Looking at the results from the survey, it appeared that the participants did not just rate the retrospective format as asked, but also the retrospective and the facilitation.

34
4.3 Adapting tool v1.1 to v1.2
Based on the tests and feedback of version 1.1, the retrospective format and description were adapted. As one participant stated: “I have the feeling that this is a great retrospective format but some tweaks are needed”. The survey questions before the retrospective were also used in version 1.2. The feedback of the participants is sometimes contradictory. Some want a shorter retro, some a longer. Some want more explanation of the model elements while others want a shorter intro. Another important factor is that the Scrum Master should be able to facilitate the retrospective without help. To make this easier, more background information and some tips are given in the description. Changes in version 1.2:
• No longer described as a ‘protocol’ but as a document for a retrospective format to be used by a Scrum Master
• Possibilities to adjust the length of the retrospective were added • Tips for facilitating were added • Practical examples of the dimensions were added • Information on the used research / models was added

35
5 STEP 4 – AGILE TE AM SKILLS TOOL V1.2
5.1 Agile team skills tool v1.2 methodology and planning
Just as in the test of the v1.1 of the tool the basis is a survey on the eight dimensions of the Agile team skills. The team members filled out the survey before the retrospective. The survey results in a radar graph that are used as input for the retrospective. Retrospective v 1.2
In this version, the retrospective had a basic length of 60 minutes and could be lengthened by adding selected parts. This was changed because some participants of the test version 1.1 thought that version was too long (90 minutes), while others wanted more time for in-depth discussion. A Scrum Master / coach will usually choose a basic or extended version of the retrospective based on circumstance like the available time and whether the team has already used this format. In this paragraph, the work before and during the retrospective is briefly described. A schematic overview of the retrospective is shown in Figure 14, the complete description is given in Appendix W.
Figure 14 Schematic setup of the retrospective v1.1 and v 1.2 The setup before the retrospective remained the same, with the same survey questions used as in version 1.1 and resulting in the same kind of radar graph. In v1.1, the model was explained and then the team was asked to write sticky notes with (general) examples of what behaviour would be visible if a team was good or bad at the skills in the model; the questions is now rephrased to ‘what is your team good at of the eight skills and where could it get better’. The writing on sticky notes is kept in the retrospective to make sure that not just the more ‘vocal’ team members are talking. It is also possible to extend the retrospective by giving a more in-depth theoretical explanation of the model.
36
In the basic version after showing and discussing the resulting radar graph, the team is asked to decide on what to work on first during the coming sprint. This can be done by writing down the eight dimensions and dot voting on what to work on. Here, the sticky notes from the earlier phase and the findings during the discussion on the radar graphs can be used. For the dimension with the highest number of votes, an actionable goal will be created. In case the extended model is used, a specific round with writing sticky notes of examples of what goes well for the team and what could be improved can be written, discussed and dot voted. In a further extension, several possible actionable goals can be written down and the team can dot vote on which one to work on first. Selecting participating teams Just as with the test for v1.0 teams were selected from the network of the author. For the sessions, the Scrum Masters were directly approached via email and or phone.
5.2 Agile team skills tool v1.2 results
A test with v1.2 was carried out by two Scrum Masters with the researcher present to observe and by two Scrum Masters on their own who reported their experience by email. The tests were carried out between May 24th and June 2nd. A first test with v1.2 was carried out on May 24th with a software development team (team D, web development). Besides the Scrum Master, six developers and the product owner were present. On June 12th, v1.2 was tested by two teams in a combined retrospective (team F, software development). The teams consisted of 11 people and a Scrum Master. Both in team D and team F, the Scrum Master facilitated the retrospective using the format created by the researcher. The researcher joined as an observer.
On May 29th (Team E, front and back-end development) and June 2nd (team G), the tool was tested by two software development teams without the researcher being present. When team E tested the format, six software developers and a Scrum Master were present. In team G, five developers and a Scrum Master were present. Appendix X shows the results of the radar graphs that were created based on the surveys before the retrospective and used as input for the discussions in the teams.
5.2.1 Results from retrospective observation / feedback from Scrum Masters
When sending the radar graphs of the team to the Scrum Masters before the retrospective, it was difficult for them to interpret the results. The first question often was, “How do you think we are doing as a team?” To help the Scrum Masters, a general rule of thumb was suggested that a score of three means not good and not bad. Higher than a three means ‘good’ and lower than three means ‘could be improved’. Also, some suggestions were given by the researcher on what might be relevant dimensions for discussion. This could be a big variation in scores for a certain skill or a high score for most dimensions with one being much lower. The retrospective of team D took two hours in total, including a short break. The Scrum Master stated that without good time keeping skills, it was easy to overrun the time allotted for the retrospective. The Scrum Master asked the researcher to give some examples of the dimensions. The score of the team for most dimensions was around a four, meaning they scored themselves as good on most dimensions. Still, this experienced team focussed on the value that was lowest and tried to find out how to ‘repair’ this. This led to a situation where instead of first looking at the results and deciding what to work on, a lot of ad-hoc solutions were thought out. In the end, one developer decided what would be worked on instead of everybody giving an opinion. The (very experienced) Agile coach, who acted as a Scrum Master for team F, took an approach that was a little different from the described format. He took more time explaining and discussing the model with the team before looking at possible points to improve. The difference in experience with the Scrum Master of team D was clear from the way the retrospective was facilitated and time was kept.

37
For the two retrospectives conducted by the Scrum Master without the researcher observing, information about the result of the retrospective was exchanged via email. The Scrum Master of team E stated in his email after the retrospective that they finished it early (before the end of the hour). They did not find much to discuss, because most people’s values were similar. He thought it was a good format, but better suited for teams with bigger differences. Team G also concluded that they were doing fine as a team, so there was not a lot to discuss. The Scrum Master stated that he thought it was good to use a different format every now and then and that this was valuable for him. The graph lines were ‘shared’ anonymously through coded lines in all four teams. Team members knew which line in the graph was theirs. Some team members decided to share that knowledge during discussions, others choose not to.
5.2.2 Survey results after the retrospective v1.2
The participants of the retrospective were asked to fill out forms to rate the retrospective format. Figure 15 shows the results of the multiple-choice questions of the survey (n/m) that asked the participants to select the option(s) that applied.
• The retrospective content was related to the skills and knowledge I need • The retrospective made me think about my own actions • The retrospective gave me new insight into the needs of other team members • This retrospective gave me new insights into our functioning as a team • The retrospective will help us to improve as a team
Figure 15 Where did the retrospective give insight? test v1.2 In all teams, the percentage of team members who thought that the retrospective would help them improve as a team was high (almost 70% of all people filling out the survey after the retrospective).
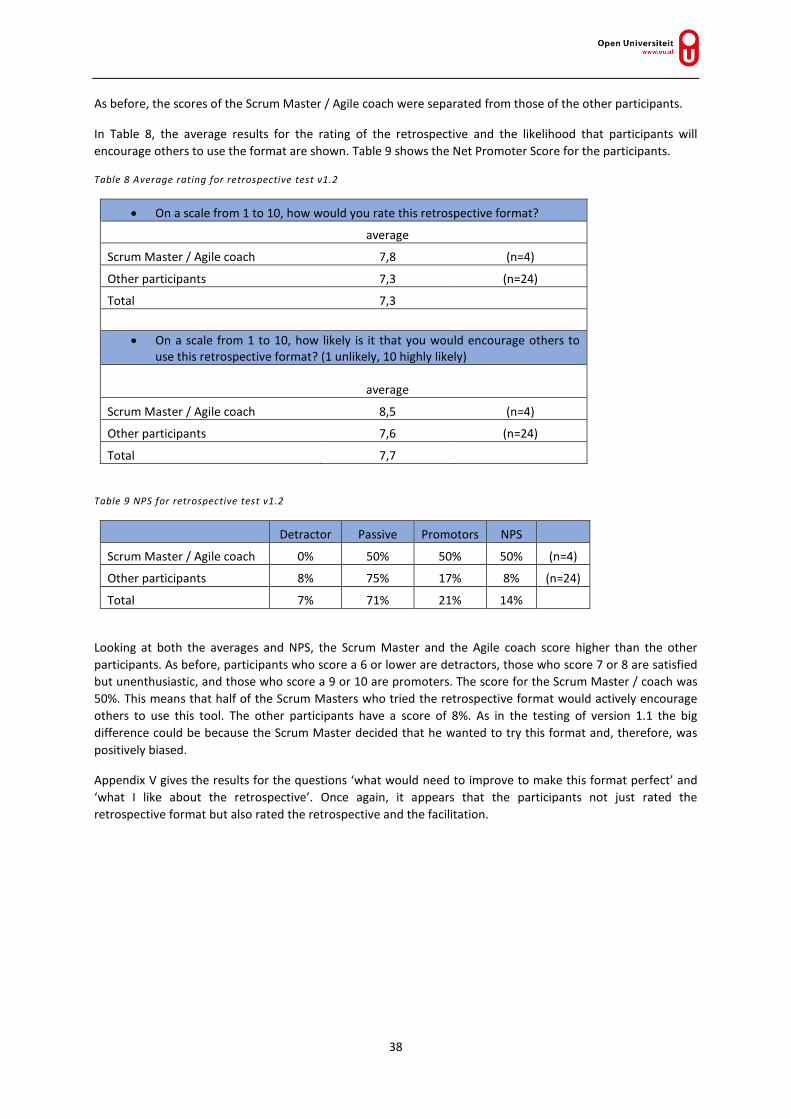
38
As before, the scores of the Scrum Master / Agile coach were separated from those of the other participants.
In Table 8, the average results for the rating of the retrospective and the likelihood that participants will encourage others to use the format are shown. Table 9 shows the Net Promoter Score for the participants.
Table 8 Average rating for retrospective test v1.2
• On a scale from 1 to 10, how would you rate this retrospective format?
average
Scrum Master / Agile coach 7,8 (n=4)
Other participants 7,3 (n=24)
Total 7,3
• On a scale from 1 to 10, how likely is it that you would encourage others to use this retrospective format? (1 unlikely, 10 highly likely)
average
Scrum Master / Agile coach 8,5 (n=4)
Other participants 7,6 (n=24)
Total 7,7
Table 9 NPS for retrospective test v1.2
Detractor Passive Promotors NPS
Scrum Master / Agile coach 0% 50% 50% 50% (n=4)
Other participants 8% 75% 17% 8% (n=24)
Total 7% 71% 21% 14%
Looking at both the averages and NPS, the Scrum Master and the Agile coach score higher than the other participants. As before, participants who score a 6 or lower are detractors, those who score 7 or 8 are satisfied but unenthusiastic, and those who score a 9 or 10 are promoters. The score for the Scrum Master / coach was 50%. This means that half of the Scrum Masters who tried the retrospective format would actively encourage others to use this tool. The other participants have a score of 8%. As in the testing of version 1.1 the big difference could be because the Scrum Master decided that he wanted to try this format and, therefore, was positively biased.
Appendix V gives the results for the questions ‘what would need to improve to make this format perfect’ and ‘what I like about the retrospective’. Once again, it appears that the participants not just rated the retrospective format but also rated the retrospective and the facilitation.

39
6 CONCLUSION, DISCUSSION AND RE COMME NDATIONS
6.1 Conclusion
The objective of the research presented in this thesis was to investigate if and how teamwork models can be used to improve the ‘teamness’ in Agile software development teams. Working in an Agile team is the norm for most software developers nowadays. Agile teamwork requires other skills than when working as a solo developer. The question is, what are these skills and how can they be measured and improved? Looking at the results the main contributions of this research are:
• Creation of a tested version of the Agile team skills tool that can provide a starting point for Scrum Masters / Agile coaches to discuss ‘teamness’ and improve the team.
• Creation of the Agile team skills model of which the description of elements can be the beginning of a common language regarding the skills of teams.
• Presenting an overview of the research in the field of Agile software development using team models. • Description and comparison of the teamwork models used in Agile software development. • Research questions from Agile practitioners regarding the use of the team skills model in teams
outside software development and as a tool for measuring and assessing teams and individuals in an Agile team.
The literature review showed that several models have been used in research on teamwork in Agile teams over the past ten years. After reviewing these models, the skills described in the models were combined into a single model containing eight skills. The new Agile team skills models contains the following elements of which the last two are described as coordinating dimensions: adapting to change, autonomy, keeping track of the work, sharing leadership, sharing workload, team goals over individual goals, communication, and trust. These skills can be measured using a survey containing three questions for each skill. The tool developed to measure these skills gives an overview of the ‘teamness’ of a team as perceived by its members. Almost 70 % of Agile practitioners state that the tool is useful to help them improve as a team. Looking at the Net Promoter Score (NPS), the Scrum Master and the Agile coach score higher than the other participants. The NPS combined over the two test versions was 67% for the Scrum Master / coach which is considered high. The other participants have a score of 5%. The big difference could be because the Scrum Master / coach had previous had contact with the researcher and decided that they wanted to try this format and, therefore, were positively biased. The model can also be used to act as a foundation to talk about some of the more ‘difficult’ skills like trust. Just explaining that both trusting others to do their job right and to trust themselves to ‘open up’ about problems will be useful. The experience and maturity of the scrum master using the tool seems to influence the actual output of using the tool. The scrum master should be able to adjust the format based on what happens during the retrospective and should feel when to ‘dig deeper’ because the real issues are not discussed. Although more research needs to be done, the results from this research on the use of teamwork models seems to be able to help to improve the ‘teamness’ of Agile software development teams. For members of a team it helps to know which skills ‘matter’ when working together as a team. Team members ‘recognize’ the skills in the model and say that they are normally not discussed explicitly. Measuring the skills over time can give both the team members as other stakeholders like management and HR an idea if the team is improving and what skills need to be worked on.
40
6.2 Discussion
In this paragraph, the research questions are revisited.
6.2.1 RQ-1: team models used in Agile software development context
To answer the first question: Which team models have been used in Agile software development contexts? a literature review was conducted. Eight models have been used in Agile research during the last 10 years:
• Dickinson anf McIntyre teamwork model • Team effectiveness model • The Big Five teamwork theory • Five dimensions of Agile teamwork • Karhatsu framework • Shared mental model theory • Model of team effectiveness • Team diagnostic survey
A paper by Strode (2015) was used as key paper and starting point for the literature review. Strode found three studies using three models before 2015. In the literature review for this research, 11 studies using six different models were found for the same period as the earlier literature review by Strode. A further two models were found in papers from 2015, but those may not have been published before Strode’s review.
6.2.2 RQ-2: differences and similarities of the models used
After looking for models used in Agile software development, the second question was: What are the differences and similarities of the models? Looking at the used models, there is an overlap in the elements mentioned. Sometimes the names of the dimensions are slightly different, in other places the names are the same but the description by the authors differ. The descriptions of the original authors of the models were analysed and combined with literature of other authors who have also combined elements in a new model. The new model created in this research was named the Agile team skills model. The original Agile team skills model v1.0 after the literature review contained seven dimensions, but feedback from the focus group led to a combined model that contains eight elements, of which the last two are described as coordinating dimensions:
• Adapting to change • Autonomy • Keeping track of the work • Sharing leadership • Sharing workload • Team goals over individual goals • Communication • Trust
The Agile team skills model is most similar to the Big Five teamwork model of Salas et al. (2005). The difference is that the latter includes autonomy.
6.2.3 RQ-3: measuring the elements of the combined model
Question three: How can the elements in the combined model be measured? is answered by looking at the methods used in previous research. Earlier researchers used interviews or a survey to measure the dimensions in their model. Their methods ranged from open-ended interview questions to questions in a survey using a 5 point Likert scale.
41
Although it is usually better to use an existing and tested questionnaire, the existing questions were adapted because they were unclear and sometimes ambiguous. All participants answered the questions with a view of the skills of their team. Examples of questions are:
• “I experience that team members can easily complete a task from another team member” • “I experience that the team knows what to achieve as a team and which rules apply”
The newly created survey contains three questions on each of the eight dimensions of the model and the results are presented (per team member) as a line in a radar graph. When discussing the results, most participants could identify their own line, even when shown with a code unknown to them. Although the survey was not formally validated, participants agreed that the lines fit with what they thought about the team.
6.2.4 RQ-4: possible use cases in the Agile practice
To answer the forth question: What would be use cases in the Agile practice of such a tool? a focus group was organised. In a three-hour session, the participants were introduced to the Agile team skills model and came up with ideas about how the model could be used to help Agile software teams. The number one idea resulting from the focus group, looking at ‘trust’, was not feasible to develop in the time available for this research. Instead, the number two topic, ‘looking at the skills available in a team’, was developed. While developing the tool, extra focus was placed on the issue of trust to create a safe environment for using the tool.
6.2.5 RQ-5: tool based on the model
To answer question five: What could a tool based on the model look like? a tool was created and tested by several teams of Agile software developers. The tool measures the eight dimensions of the model using a survey. The resulting radar graph forms the basis for a team retrospective. After testing version 1.1 of the tool in three teams, version 1.2 was created based on feedback from Agile practitioners. This tool was tested in four teams.
6.2.6 RQ-6: value of a tool for Agile practitioners
Answering the question What would be the value of such a tool for Agile practitioners? is not straightforward. It would have been easy if a clear definition of ‘a good Agile team’ and exact knowledge of the skills its members need had been available. The answer however, as often in Agile when asked for the ‘right’ answer, is “it depends!” No ‘silver bullet’ or ‘golden recipe’ was found in research to build ‘a good Agile team’. What is clear from earlier research, however, is that some skills are important factors in “environments in which people can address complex adaptive problems, while productively and creatively delivering products of the highest possible value.” (Schwaber & Sutherland, 2016) This research aims to translate that knowledge from academia into a practical tool for practitioners in Agile (Scrum) teams. The retrospective format is used as a tool, since ‘inspect and adapt’ is used on a regular basis in all Agile frameworks. Developers in an Agile software team are familiar with this format, which helps to make the tool more accessible. 75% of the developers participating in tests on this retrospective format stated that the tool helps them improve as a team. From the observed retrospectives and from the email exchange with the Scrum Masters from the unobserved retrospectives, there is a clear difference in the result of the retrospective depending on the experience and knowledge of the Scrum Master. Experienced and well-educated Scrum Masters get more out of the retrospective format and can easily adjust the given format to their needs.

42
6.3 Limitations
As with any research, there are limitations that have to be taken into account when interpreting the results of this (exploratory) research. The reliability of research is defined by the possibility for others to exactly repeat the research and get the same outcomes. The analysis and combining of other models was performed by the author without any review by others. This could have led to conformation bias, where the researcher only filtered information that led to focussing on the aggregation into the proposed groups even though other categories would have been possible. Another researcher might have created a different model. To mitigate some of this risk, descriptions of other authors who also combined elements were taken into account. Another limitation of the tool is the scoring of the dimensions in the radar graph. It might seem that it is an ‘objective representation’ of what is ‘good and bad’. Care should be taken in explaining that this is not the case and that the score of one team cannot be compared with that of another team to decide which team is doing better. Next, validity can be separated into internal and external validity. Internal validity checks whether the research measures what it aims to measure. External validity checks whether the research can be generalized to other teams, places and times. Strong Internal validity of the survey questions would result from using a validated questionnaire where it has been assured that the questions accurately measure the skills. Although it is normally good practice to use a validated questionnaire, in this research the questionnaire for the Agile team skills tool was adapted. The tool was specifically developed to be usable by general Agile practitioners and the existing questions unclear and sometimes ambiguous. Not using validated questions gives a weak internal validation. Having said that, most users of the tool felt that the results in the radar graph gave a good representation about the way they thought about the skills in the team. Looking at the graph with anonymized lines people could ‘find’ their line in the graph without knowing what the code was. For external validity, the selected teams do not represent the general group of Agile teams. The ways the teams where selected resulted in Scrum Masters / facilitators who were keen on testing the tool and wanted to put some effort in it. Their decision to test the tool likely influenced their rating of the tool and the likelihood that they would recommend the tool to others. The tool has only been tested in a limited number of teams and the teams were of different types and maturity, although they were all Scrum teams developing software. This means that the results only give a first indication of the tool’s usefulness in Agile software teams in general. For now, the (small) number of teams that the two versions of the tool were tested on was the best that could be achieved in the limited time available. Moreover, the aim was to perform an exploratory research. For external validity of the model and tool, more validation would be needed.
6.4 Recommendations for further research
Recommendations for further research arose from the limitations of this research, requests from Agile practitioners and the researcher herself. The results of the focus group session showed that the dimension of trust was the most important to the experts and the development of a tool measuring ‘trust’ had the highest number of votes. In further discussions, it appeared that that this would be too large and complex and would mean we needed to start almost completely from scratch. Future research could focus on measuring and creating trust in Agile teams. Observations indicated that it was easier for experienced Scrum masters or agile coaches to spot if the real issues in a team where discovered during the conversations in the retrospective. It also showed that these experienced practitioners found it easier to adjust the program ‘on the go’ depending on what happened

43
during the retrospective. This observation leads to a recommendation to look at the influence of the maturity and experience of the Scrum master or Agile coach of a team on the ‘teamness’. Looking at the limitations, the questions of the survey that is the basis of the tool could be validated and tested by a bigger number of teams through statistical research. Right now, the tool has only been tested with Scrum teams developing software, but it might also be usable in Scrum teams outside software development. The usefulness could be tested in such teams. While the tool was tested by team members rating their team on the eight dimensions, it can be used in other ways, which further research could investigate. The questions of the survey could be reformulated to turn it into a self-assessment on the skills. Another alternative is using it as a 360-degree assessment. Further research could also investigate using the tool as an assessment of the improvement of the team. Does the team improve over time or if certain actions are taken, such as extra coaching of the team or adding or removing people? Another topic for research would be to find out what the radar graph depiction the skills of a ‘great’ team would look like. Things to focus on could be things like ‘Is it necessary for all people in the team to score a five on all skills?’, ‘Is it enough that all the skills are covered by at least some team members?’, ‘Is there a different score to be expected for teams in different phases of the teambuilding phase (Tuckman’s norming, storming etc.)?’. Last but not least, research could be conducted to link the team graphs resulting from the tool and the actual results that teams achieve in terms of ‘delivering value for the customer’.
6.5 Recommendations for practitioners
The resulting tool from this research is aimed at Agile practitioners. Rather than developing a theory that would then have to be translated for use in practice, the focus of this research was Agile practice itself. The results were shared with Agile practitioners and the idea is to keep doing this by making the tool publicly available under Creative Commerce license. Although more research is needed to validate the model and the tool, with this research, Agile practitioners can gain insight into what is known from academic research on Agile teams. The developed model and tool provide a starting point for Scrum Masters / facilitators to discuss ‘teamness’ and the description of the model elements can be the beginning of a common language regarding the skills of teams. By repeating the survey and following the changes over time, the status of an Agile team can be followed. From research, it seems that there isn’t a conclusive set of skills that will always lead to a ‘great software team’. It is clear though that the skills in the model have a positive effect on quality and amount of work delivered. In practice, the skills that a team needs to focus on might change over time. In a ‘new’ team other skills may be important than in a experienced team that has been working together for a long time. The focus of some of two of the teams that just started as Agile teams and tested the tool, quickly shifted to ‘keeping track of the work’. Those teams had not yet established a good routine in visualising and informing each other about the state of the workload. When that is the case it is difficult to share the workload and responsibilities. For all the other skills to ‘flourish’ clear communication and trust is needed. From the observed retrospective, it appeared that it is difficult to openly discuss trust. Still it is a very important skill and should be highly on the agenda of a team that wants to adapt to change and deliver value for the customer. Observing the Scrum Masters using the tool showed that the insight gained by the teams from using the tool was influenced by the experience and insights of the Scrum Master. An experienced Scrum Master knows when to dig deeper and how to adapt the format depending on what is happening in the team during the retrospective.

44
7 REFLECTION
This chapter gives a personal reflection on the process of the thesis research and the results. Research subject and questions Being a ‘mature’ student with a lot of practical experience is both an advantage and a disadvantage, especially when choosing a subject to work on. The terms ‘Agile’ and ‘team’ featured from the beginning, but there were so many questions! First the subject was too wide and when narrowed down, it seemed difficult to make it relevant for practitioners. Talking to some Agile researchers on the XP2016 conference gave the right level and limitations to the subject and research questions. Even after this, the questions and focus was slightly changed during the research process. Literature review The original plan was to conduct a systematic literature review (SLR). After starting this review, the number of ‘hits’ quickly rose to hundreds of papers. In hindsight, this had to do with not limiting the research topic and questions enough. When a paper was found using the adapted Big Five teamwork theory on Agile software development, that helped narrow down the subject. A conference paper by Strode (2015) contained the frameworks used in exploring teamwork in cases of Agile software development until July 2015. From there on, Strode’s paper was used as a key to find more research on the subject by looking at the references in that paper and by searching for papers that cited the Strode paper. Strode’s paper located three studies that focussed exclusively on applying teamwork theory to Agile software development before 2015. Further literature research showed that in the period before 2015, eight more papers focussed on teamwork in an Agile context were available. The question is whether the original idea about using SLR would have given a better insight if the limits for the search would have been clearer. Since the key paper that also was based on an extensive literature research only came up with three uses of teamwork models, it seems that the literature review for this thesis that found eight additional papers on the topic gave a good overview of the available knowledge from research. Methodology The design science research methodology was chosen as a methodological framework for the research. It still seems a logical choice, because it is specifically intended for designing (IT) artefacts. That said, not all of the phases of the framework may have had the same amount of focus. All the phases (1) problem identification and motivation, (2) definition of the objectives for a solution, (3) design and development, (4) demonstration, (5) evaluation and (6) communication, were found in the research, maybe with the exception of communication. That step contains the scholarly and professional publication of the artefact. This thesis might be a step towards that goal. Another important feature of the DSRM loop is the iteration loop over the phases. The question is, how many iterations are needed before the generated artefact is ‘done’? The methodology doesn’t answer this. Due to the limited time available for this research, two iterations were performed to adjust and test the tool. This delivers a tool that is useful for Agile practitioners and can be used for further research. Comparing the models and creating a new one The researcher compared the models used before into a new model without consulting others. This was done mainly because of time constraints. Consulting others would have taken a lot of time, especially in a way that it would have resulted in an ‘academically’ sound way. The researcher decided that it would be more useful to take all steps from finding models, compare them, combine them into a model that is useful for Agile practitioners and create a tool to use the model. This a tool might be called a ‘minimal viable product’. Some of the risk in creating a new model without consulting others was mitigated by using the work of earlier researchers who created or adjusted models based on other models.
45
Finding a use case – Focus group Part of the research was to let experts decide what was the most valuable tool to develop for Agile practitioners based on the Agile skills model. For this, a focus group session was organized with experts representing the fields of hiring (HR manager), training (Agile coach), developing (Agile developer) and managing (line manager / CTO). The idea was to present the model and through a series of exercises let the participants decide what kind of tool would give them most value. During the session, it appeared that the protocol was not clear enough on the aim of the focus group. In the part where the participants worked in two separate groups, one group worked together, discussing ideas as is the aim of a focus group. The other group worked more solo in brainstorming ideas. The number one use case the focus group came up with was not achievable in the time available to develop the tool. This resulted in developing the use case that had the second most votes and using some of the input from the use case with the highest number of votes to adapt the original model. The focus group format was chosen to have experts from different fields decide what would be most valuable use case without influencing them too much. Due to the nature of a focus group, it essential to follow the script to the letter and not ‘influence’ the group. This meant that when the experts did not take their role (e.g., developer, HR manager) into account, no action could be taken. In the post-session debrief, the experts stated that they did not think along the lines of their role while in the session. In hindsight, this part of the research should have been changed to a different format. For example, interviewing 10 experts would not have allowed a discussion between experts, but would probably have given a better idea about possible use cases. This is even taking into account that the researcher might have influenced the ideas. The researcher is an experienced Agile practitioner in the field of Agile development, management and coaching and so could have come up with some possibilities as the basis for a discussion. Although in this case, there would be a risk of the researcher not being impartial and becoming part of the research. Deciding on the value of the tool for Agile practitioners Deciding how to measure the value of the tool for Agile practitioners has to do with the kind of questions asked, who is asked and how to interpret them. In the test of the first version, the researcher facilitated the retrospective in the teams. It was found from the results of the survey and from participants’ comments that they not only rated the value of the retrospective format, but also the retrospective itself and its facilitator. It is difficult to separate the format and the actual retrospective that they took part in. In the test of the second version, the retrospective was facilitated by the Scrum Master of the team. The Scrum Master’s range of knowledge and experience changed the facilitation. Since the participants seem to find it difficult to make a difference in rating the ‘format’ of the retrospective and the actual retrospective, the results of the survey after the retrospective were most likely not just based on the format of the retrospective. The fact that the average score for the retrospective and the Net Promoter Score was lower for the second version of the tool should not lead to the conclusion that this version was ‘worse’ than the first version. The participants likely influenced the results of the rating of the retrospective format. The Scrum Masters all decided that they wanted to test the tool, so were positively biased. The Scrum Masters who did not think the tool would be valuable for them did not join the experiment. In some cases the team members were asked by the Scrum Master if they wanted to join the experiment, other Scrum Masters decided for the team.

46
REFE REN CES
Bell, J. (2008). Doing your research project - A guide for first-time researchers in education, health and social
science (4th edition ed.): Open University Press. Boddy, C. (2005). A rose by any other name may smell as sweet but “group discussion” is not another name for
a “focus group” nor should it be. Qualitative Market Research: An International Journal, 8(3), 248-255. doi:doi:10.1108/13522750510603325
Braithwaite, J., Hindle, D., Finnegan, T. P., Graham, E. M., Degeling, P. J., & Westbrook, M. T. (2004). How important are quality and safety for clinician managers? Evidence from triangulated studies. Clinical Governance: An International Journal, 9(1), 34-41. doi:doi:10.1108/14777270410517700
Conboy, K., Coyle, S., Wang, X., & Pikkarainen, M. (2011). People Over Process- Key People Challenges in Agile Development. IEEE Software, 28(4). doi:http://doi.ieeecomputersociety.org/10.1109/MS.2010.132
Creswell, J. W. (2014). Research Design. Qualitative, Quantitative, and Mixed Methods Approaches (4th edition ed.): SAGE.
Derby, E., & Larsen, D. (2006). Agile Retrospectives: Making Good Teams Great: Pragmatic Bookshelf. Dickinson, T. L., & McIntyre, R. M. (1997). A conceptual framework of teamwork measurement. In M. T.
Brannick, E. Salas, & C. Price (Eds.), Team Performance Assessment and Measurement: Theory, Methods, and Applications. (pp. 19-43): Psychology Press, NJ.
Dingsoyr, T., & Dyba, T. (2012). Team effectiveness in software development: Human and cooperative aspects in team effectiveness models and priorities for future studies. 27-29. doi:10.1109/chase.2012.6223016
Dingsøyr, T., & Lindsjørn, Y. (2013). Team Performance in Agile Development Teams: Findings from 18 Focus Groups. In H. Baumeister & B. Weber (Eds.), Agile Processes in Software Engineering and Extreme Programming: 14th International Conference, XP 2013, Vienna, Austria, June 3-7, 2013. Proceedings (pp. 46-60). Berlin, Heidelberg: Springer Berlin Heidelberg.
Gregory, P., Barroca, L., Sharp, H., Deshpande, A., & Taylor, K. (2016). The challenges that challenge: Engaging with agile practitioners’ concerns. Information and Software Technology, 75, 26-38. doi:10.1016/j.infsof.2016.03.003
Hackman, R. J. (1983). A normative model of work team effectiveness (technical report #2). Retrieved from http://scholar.google.nl/scholar_url?url=http://www.dtic.mil/cgi-bin/GetTRDoc%3FAD%3DADA136398&hl=en&sa=X&scisig=AAGBfm3SqQf7LhGfvgrXC4asGFfHdWprUw&nossl=1&oi=scholarr&ved=0ahUKEwik4rqpuNTNAhUBXRQKHfoaBCIQgAMIGygAMAA
Hakanen, M. a. A. S. (2012). Building Trust in High-Performing Teams Technology Innovation Management Review, 38-41.
Hevner, A. R., March, S. T., Park, J., & Ram, S. (2004). Design Science in Information Systems Research. MIS Quarterly, Vol. 28(No. 1 (Mar., 2004)), 75-105. doi:http://www.jstor.org/stable/25148625
Hoda, R. (2011). Self-Organizing Agile Teams: A Grounded Theory. (Doctor of Philosophy in Computer Science.), Victoria University of Wellington. Retrieved from http://researcharchive.vuw.ac.nz/bitstream/handle/10063/1617/thesis.pdf?sequence=2
Hoegl, M., & Gemuenden, H. G. (2001). Teamwork Quality and the Success of Innovative Projects: A Theoretical Concept and Empirical Evidence. Organization Science, 12(4), 435-449.
Hollenbeck, J. R., Beersma, B., & Schouten, M. E. (2012). Beyond Team Types and Taxonomies: A Dimensional Scaling Conceptualization for Team Description. Academy of Management Review, 37(1), 82-106. doi:10.5465/amr.2010.0181
Jalali, S., & Wohlin, C. (2012). Systematic literature studies: database searches vs. backward snowballing. Paper presented at the Proceedings of the ACM-IEEE international symposium on Empirical software engineering and measurement, Lund, Sweden.
Johnson-Laird, P. N. (1983). Mental models: towards a cognitive science of language, inference, and consciousness: Harvard University Press.
Jones, G. R., & George, J. M. (1998). The Experience and Evolution of Trust: Implications for Cooperation and Teamwork. The Academy of Management Review, 23(3), 531-546. doi:10.2307/259293
Karhatsu, H., Ikonen, M., Kettunen, P., Fagerholm, F., & Abrahamsson, P. (2010). Building Blocks for Self-Organizing Software Development Teams: A Framework Model and Empirical Pilot Study. Paper presented at the 2nd International Conference on Software Technology and Engineering (ICSTE), San Juan, PR, USA, USA. http://www.karhatsu.com/paper/karhatsu-etal.pdf
47
Lencioni, P. (2002). The Five Dysfunctions of a Team. New York: Jossey-Bass. Maigatter, A. (2015). A psychological Study of Team Effectiveness and Leadership in Scrum Teams.
Fachhochschule Nordwestschweiz. Retrieved from https://irf.fhnw.ch/bitstream/handle/11654/17614/Masterarbeit_Anne_Maigatter.pdf?sequence=1
Masadeh, M. A. (2012). Focus Group: Reviews and Practices. International Journal of Applied Science and Technology, 2(10), 63-68.
Merton, R. K., Fiske, M., & Kendall, P. L. (1990). The focused interview: A manual of problems and procedures. (2nd ed.). London: Collier MacMillan.
Moe, N. B., & Dingsøyr, T. (2008). Scrum and Team Effectiveness: Theory and Practice. 9, 11-20. doi:10.1007/978-3-540-68255-4_2
Moe, N. B., Dingsøyr, T., & Dybå, T. (2009). A teamwork model for understanding an agile team: A case study of a Scrum project. Information and Software Technology, 52(5), 480-491. doi:10.1016/j.infsof.2009.11.004
Moe, N. B., Dingsøyr, T., & Røyrvik, E. A. (2009). Putting Agile Teamwork to the Test – An Preliminary Instrument for Empirically Assessing and Improving Agile Software Development. Paper presented at the XP: International Conference on Agile Processes and Extreme Programmig in Software Engineering, Pula, Sardinia.
Mohammed, S., Ferzandi, L., & Hamilton, K. (2010). Metaphor No More: A 15-Year Review of the Team Mental Model Construct. Journal of Management, 36(4), 876-910. doi:10.1177/0149206309356804
Oza, V., Kettunen, P., Abrahamsson, P., & Münch, J. r. (2011). Attaining High-performing Software Teams with Agile and Lean Practices: An Empirical Case Study.
Park, S., Henkin, A. B., & Egley, R. (2005). Teacher team commitment, teamwork and trust: exploring associations. Journal of Educational Administration, 43(5), 462-479. doi:10.1108/09578230510615233
Peffers, K. E. N., Tuunanen, T., Rothenberger, M. A., & Chatterjee, S. (2007). A Design Science Research Methodology for Information Systems Research. Journal of Management Information Systems, 24(3), 45-77.
Poženel, M. (2013). Assessing teamwork in a software engineering capstone course. World Transactions on Engineering and Technology Education, Vol.11(No.1).
Prince, M., & Davies, M. (2001). Moderator teams: an extension to focus group methodology. Qualitative Market Research: An International Journal, 4(4), 207-216.
Rosenstein, R. (1994). The Teamwork Components Model: An Analysis Using Structural Equation Modeling. Salas, E., Sims, D. E., & Burke, C. S. (2005). Is there a "Big Five" in Teamwork? Small Group Research, 36(5), 555-
599. doi:10.1177/1046496405277134 Schwaber, K., & Sutherland, J. (2016). The Scrum Guide. Retrieved from http://www.scrumguides.org/scrum-
guide.html Solingen, v., R., Berghout, E., Kusters, R., & Trienekens, J. (2000). From process improvement to people
improvement: enabling learning in software development. Information and Software Technology, 42(14), 965-971. doi:10.1016/s0950-5849(00)00148-8
Stare, A. (2014). Agile Project Management in Product Development Projects. Procedia - Social and Behavioral Sciences, 119, 295-304. doi:http://dx.doi.org/10.1016/j.sbspro.2014.03.034
Stettina, C. J., & Heijstek, W. (2011). Five Agile Factors: Helping Self-management to Self-reflect. 172, 84-96. doi:10.1007/978-3-642-22206-1_8
Strode, D. (2015). Applying Adapted Big Five Teamwork Theory to Agile Software Development. Paper presented at the Australasian Conference on Information Systems, Adelaide.
VersionOne.com. (2017). 11th annual state of Agile report. Retrieved from https://explore.versionone.com/state-of-agile
Vivian, R., Falkner, K., & Falkner, N. (2013). Analysing computer science students' teamwork role adoption in an online self-organised teamwork activity. 105-114. doi:10.1145/2526968.2526980
Wageman, R., Hackman, R. J., & Lehman, E. (2005). Team diagnostic survey Development of an Instrument. The journal of applied behavioural science, 41(4).
Yu, X., & Petter, S. (2014). Understanding agile software development practices using shared mental models theory. Information and Software Technology, 56(8), 911-921. doi:10.1016/j.infsof.2014.02.010

48
L IST OF TABLE S
Table 1 Research using teamwork models in software development .................................................................. 16 Table 2 Short description of the combined model v1.0 ........................................................................................ 18 Table 3 Number of sticky notes with items of what helps and hinders teamwork .............................................. 24 Table 4 Highest ranking use cases after dot voting ............................................................................................... 25 Table 5 Short description of the combined model v2.0 ........................................................................................ 27 Table 6 Average rating for retrospective test v1.1................................................................................................ 33 Table 7 NPS for retrospective test v1.1 ................................................................................................................. 33 Table 8 Average rating for retrospective test v1.2................................................................................................ 38 Table 9 NPS for retrospective test v1.2 ................................................................................................................. 38 Table 10 Individual elements of the teamwork models ........................................................................................ 56 Table 11 Aggregation of model elements ............................................................................................................. 57 Table 12 Agile team skills model used in focus group........................................................................................... 58 Table 13 Teamwork questions by Moe, Dingsøyr, and Røyrvik (2009) ................................................................. 59 Table 14 Teamwork items by Stettina and Heijstek (2011) based on Moe, Dingsøyr, and Røyrvik (2009) .......... 60 Table 15 Teamwork items by Park et al. (2005) based on Rosenstein (1994) ...................................................... 61 Table 16 Help and hinder—results of team A ....................................................................................................... 73 Table 17 Help and hinder—results of team B ....................................................................................................... 73 Table 18 Combined examples from focus group for both teams of what helps and hinders teamwork ............. 76 Table 19 Uses cases and dot voting focus group .................................................................................................. 78 Table 20 Individual voting use cases focus group ................................................................................................. 79 Table 21 Description of the eight dimensions of Agile team work (model v2.0) .................................................. 83

49
L IST OF F IGURE S
Figure 1 Classification of design methods (Creswell, 2014) .................................................................................. 10 Figure 2 DSRM loop (Peffers, Tuunanen, Rothenberger, and Chatterjee (2007) .................................................. 11 Figure 3 Research design following the DSRM loop .............................................................................................. 12 Figure 4 Big Five model to five dimensions to Karhatsu model ............................................................................ 17 Figure 5 Agile team skills model v1.0 .................................................................................................................... 18 Figure 6 Schematic setup of the focus group session ........................................................................................... 23 Figure 7 Highest scoring use case of focus group ................................................................................................. 25 Figure 8 Agile team skills model v1.0 to v2.0 ........................................................................................................ 26 Figure 9 Comparing the Karhatsu model to Agile team skills model v2.0 ............................................................ 28 Figure 10 Comparing the Dickinson and McIntyre model to Agile team skills model v2.0 ................................... 28 Figure 11 Schematic setup of the retrospective ................................................................................................... 29 Figure 12 Example of spider graph based on survey results ................................................................................. 30 Figure 13 Where did the retrospective give insight? test v1.1 ............................................................................. 32 Figure 14 Schematic setup of the retrospective v1.1 and v 1.2 ............................................................................ 35 Figure 15 Where did the retrospective give insight? test v1.2 ............................................................................. 37 Figure 16 Dickinson and McIntyre teamwork model (1997) ................................................................................. 50 Figure 17 Teamwork quality according to Hoegl and Gemuenden (2001) ........................................................... 50 Figure 18 The Big Five teamwork theory (Salas et al., 2005) ................................................................................ 51 Figure 19 Five dimensions of Agile teamwork (Moe, Dingsøyr, & Røyrvik, 2009) ................................................ 51 Figure 20 Framework for building a self-organizing software development team (Karhatsu et al., 2010) .......... 52 Figure 21 Room setup focus group ....................................................................................................................... 72 Figure 22 Table setup focus group ........................................................................................................................ 72 Figure 23 Flip-over for categories (categories hidden) ......................................................................................... 72 Figure 24 Brainstorming help and hinder ............................................................................................................. 72 Figure 25 Categorization of sticky notes ............................................................................................................... 72 Figure 26 Use cases discussed during fish bowl .................................................................................................... 75 Figure 27 Four people sitting during fish bowl ..................................................................................................... 75 Figure 28 Five people standing during fish bowl................................................................................................... 75 Figure 29 Example of results of safety check ........................................................................................................ 82 Figure 30 Example of spider graph based on survey results ................................................................................. 84 Figure 31 Example of using circle technique and dot voting ................................................................................ 85 Figure 32 Agile team skills tool results team A ..................................................................................................... 90 Figure 33 Agile team skills tool results team B ..................................................................................................... 90 Figure 34 Agile team skills tool results team C ..................................................................................................... 91 Figure 35 Agile team skills tool results team D ................................................................................................... 109 Figure 36 Agile team skills tool results team E .................................................................................................... 109 Figure 37 Agile team skills tool results team F .................................................................................................... 110 Figure 38 Agile team skills tool results team G ................................................................................................... 110
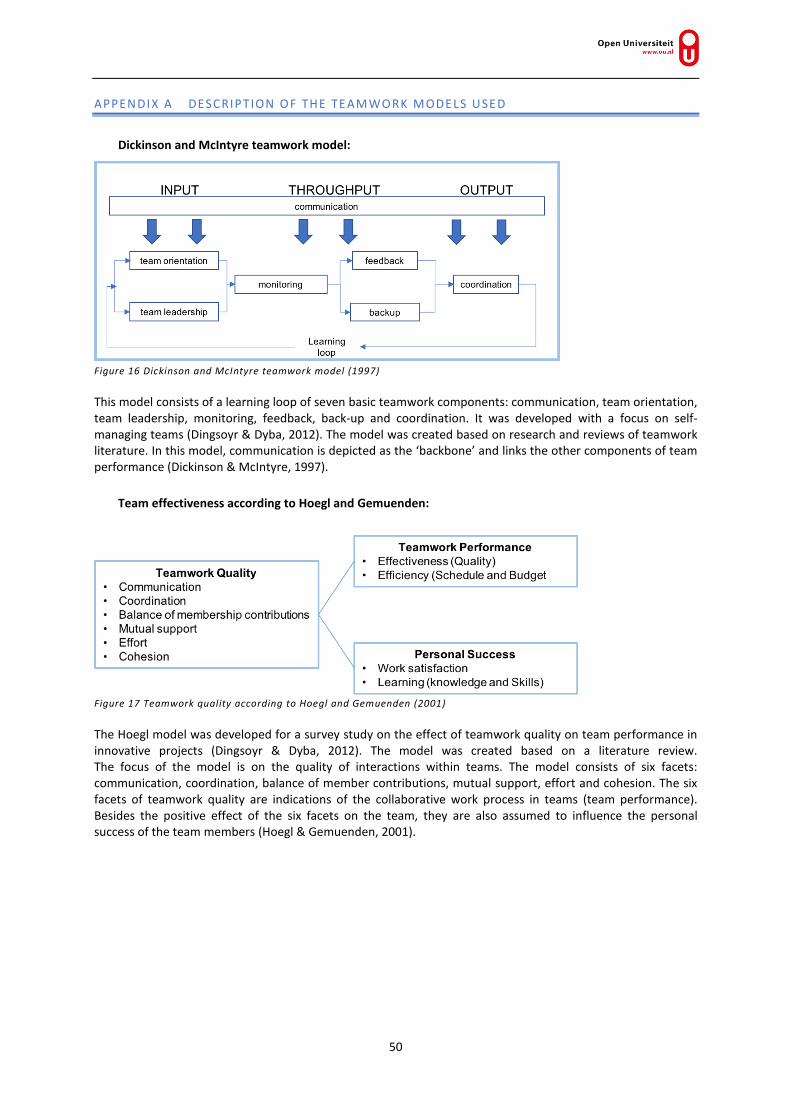
50
APPENDIX A DESCRIPTION OF THE TE AMWORK MODE LS USE D
Dickinson and McIntyre teamwork model:
Figure 16 Dickinson and McIntyre teamwork model (1997) This model consists of a learning loop of seven basic teamwork components: communication, team orientation, team leadership, monitoring, feedback, back-up and coordination. It was developed with a focus on self-managing teams (Dingsoyr & Dyba, 2012). The model was created based on research and reviews of teamwork literature. In this model, communication is depicted as the ‘backbone’ and links the other components of team performance (Dickinson & McIntyre, 1997).
Team effectiveness according to Hoegl and Gemuenden:
Figure 17 Teamwork quality according to Hoegl and Gemuenden (2001) The Hoegl model was developed for a survey study on the effect of teamwork quality on team performance in innovative projects (Dingsoyr & Dyba, 2012). The model was created based on a literature review. The focus of the model is on the quality of interactions within teams. The model consists of six facets: communication, coordination, balance of member contributions, mutual support, effort and cohesion. The six facets of teamwork quality are indications of the collaborative work process in teams (team performance). Besides the positive effect of the six facets on the team, they are also assumed to influence the personal success of the team members (Hoegl & Gemuenden, 2001).

51
Figure 18 The Big Five teamwork theory (Salas et al., 2005) The Big Five teamwork theory by Salas et al. (2005) is based on extensive literature research on teamwork in the field of psychology. The model defines five core components: team leadership, mutual performance monitoring, backup behaviour, adaptability and team orientation. It also contains three coordinating mechanisms that should exist in effective teamwork: shared mental models, mutual trust and closed loop communication. The authors describe that the manifestation of the components differs based on the task at hand: “Although we put forth that each of the “Big Five” is required for team effectiveness, we acknowledge that each component may be manifested differently across most team task types because of the constraints of the team task and the varying needs of the team during a given challenge” (Salas et al., 2005).
Five dimensions of Agile teamwork:
Figure 19 Five dimensions of Agile teamwork (Moe, Dingsøyr, & Røyrvik, 2009) The five dimensions framework was set up as an instrument to describe and diagnose the status of a team. It consists of the dimensions shared leadership, team orientation, redundancy, learning and autonomy. The instrument is based on teamwork challenges identified in previous studies and experience from action research with several Agile teams. The instrument consists of a series of open-ended questions for each of the five dimensions. Based on a 20-minute interview with all team members, the researchers discuss and give the team a score between 0 and 10 on each dimension. The score is then plotted on a radar chart and is the basis of feedback sessions with the team (Moe, Dingsøyr, & Røyrvik, 2009).
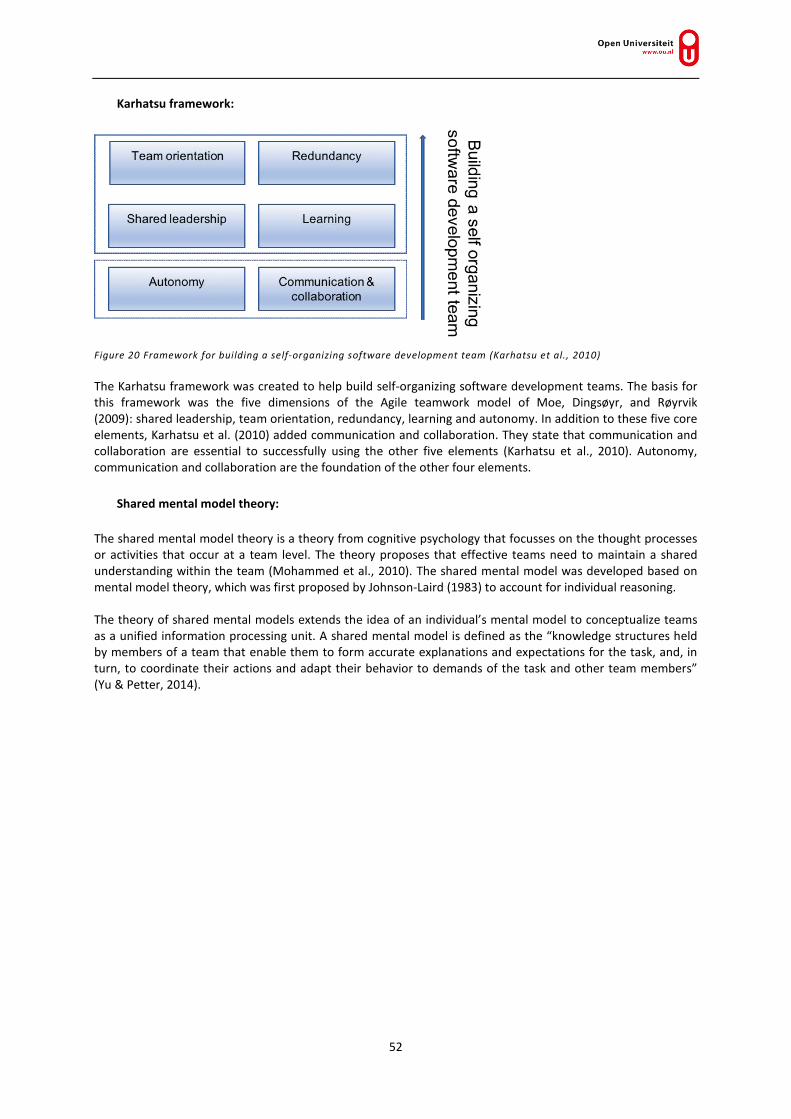
52
Karhatsu framework:
Figure 20 Framework for building a self-organizing software development team (Karhatsu et al., 2010) The Karhatsu framework was created to help build self-organizing software development teams. The basis for this framework was the five dimensions of the Agile teamwork model of Moe, Dingsøyr, and Røyrvik (2009): shared leadership, team orientation, redundancy, learning and autonomy. In addition to these five core elements, Karhatsu et al. (2010) added communication and collaboration. They state that communication and collaboration are essential to successfully using the other five elements (Karhatsu et al., 2010). Autonomy, communication and collaboration are the foundation of the other four elements.
Shared mental model theory:
The shared mental model theory is a theory from cognitive psychology that focusses on the thought processes or activities that occur at a team level. The theory proposes that effective teams need to maintain a shared understanding within the team (Mohammed et al., 2010). The shared mental model was developed based on mental model theory, which was first proposed by Johnson-Laird (1983) to account for individual reasoning. The theory of shared mental models extends the idea of an individual’s mental model to conceptualize teams as a unified information processing unit. A shared mental model is defined as the “knowledge structures held by members of a team that enable them to form accurate explanations and expectations for the task, and, in turn, to coordinate their actions and adapt their behavior to demands of the task and other team members” (Yu & Petter, 2014).

53
APPENDIX B DESCRIPTION OF THE INDIVIDUAL E LEME NTS OF THE TE AMWORK MODELS
Adaptability: The ability to adjust strategies based on information gathered from the environment using backup behaviour and reallocation of intra-team resources and to altering a course of action or team repertoire in response to changing conditions (internal or external) (Salas et al., 2005) Autonomy: The autonomy of teams is described in the socio-technical literature as the team’s ability to regulate their boundary conditions (Moe, Dingsøyr, & Røyrvik, 2009). Authorize the team. Have someone to protect the team. (Karhatsu et al., 2010) Backup behaviour: This involves being available to assist other team members. This implies that members understand other members’ tasks. It also implies that team members are willing and able to provide and seek assistance when needed, for instance: -filling in for another member who is unable to perform the task; -helping another member correct a mistake (Dickinson & McIntyre, 1997). The ability to anticipate other team members’ needs through accurate knowledge about their responsibilities. This includes the ability to shift workload among members to achieve balance during high periods of workload or pressure (Salas et al., 2005) Balance of member contributions: Can all team members bring in their expertise to their full potential? It is considered essential to TWQ that contributions to the team task are balanced with respect to each member's specific knowledge and experience. While not everyone must bring in, for instance, the exact same number of ideas, no one should be limited in presenting and contributing relevant knowledge to the team (Hoegl & Gemuenden, 2001). Closed-loop communication: The exchange of information between a sender and a receiver irrespective of the medium (Salas et al., 2005). Cohesion: Are team members motivated to maintain the team? Is there team spirit? If team members lack a sense of togetherness and belonging, if there is little desire to keep the team going, then intensive collaboration seems unlikely. An adequate level of cohesion is necessary to maintain a team, to engage in collaboration, and thus to build the basis for high TWQ (Hoegl & Gemuenden, 2001). Communication: Involves the exchange of information between two or more team members in the prescribed manner and using appropriate terminology. Often, the purpose of communication is to clarify or acknowledge the receipt of information, for instance: -verifying information prior to making a report; -acknowledging and repeating messages to ensure understanding (Dickinson & McIntyre, 1997). Is there sufficiently frequent, informal, direct, and open communication? The quality of communication within a team can be described in terms of the frequency, formalization, structure, and openness of the information exchange (Hoegl & Gemuenden, 2001). Communication and collaboration: Intimate and open customer relationship. Work together in open workspace. Share information daily. Visualize progress. Communication means sending and receiving information and collaboration means actively working together to deliver a product or make a decision (Karhatsu et al., 2010).

54
Coordination: Refers to team members executing their activities in a timely and integrated manner. It implies that the performance of some team members influences the performance of others. This may involve an exchange of information that subsequently influences another member’s performance. Coordination represents the output of the model and reflects the execution of team activities such that members respond as a function of the behaviour of others, for instance: -efficiently passing performance-relevant data to other members; -facilitating the performance of other members’ jobs (Dickinson & McIntyre, 1997). Are individual efforts well-structured and synchronized within the team? Teams need to agree on common work-down structures, schedules, budgets, and deliverables. Thus, coordination means that the teams have to develop and agree upon a common task-related goal structure that has sufficiently clear sub goals for each team member, free of gaps and overlaps (Hoegl & Gemuenden, 2001). Effort: Do team members exert all their effort to the team's tasks? To achieve high TWQ and avoid conflict among team members, it is important for everyone in the team to know and accept the work norms concerning sufficient effort. A uniformly high level of effort by all team members is essential to high quality collaboration (Hoegl & Gemuenden, 2001). Feedback: Involves the giving, seeking, and receiving of information among team members. Giving feedback refers to providing information regarding other team members’ performance. Seeking feedback refers to requesting input or guidance regarding performance and receiving feedback means accepting positive and negative information regarding performance. Examples are: -responding to other members’ requests for information about their performance; -accepting time-saving suggestions offered by other team members (Dickinson & McIntyre, 1997). Learning: Learning is important for teams for a number of reasons, including to develop shared mental models and improve team performance. Additionally, studies of self-organizing teams show that this kind of organization requires a capacity for learning that allows operating norms and rules to change in relation to transformations in the wider environment (Moe, Dingsøyr, & Røyrvik, 2009). Have short iterations. Have end-of-iteration review sessions. Give continuous feedback. Track progress. (Karhatsu et al., 2010). Monitoring: Refers to observing the activities and performance of other team members and recognizing when a team member performs correctly. It implies that team members are individually competent and that they may subsequently provide feedback and backup (Dickinson & McIntyre, 1997). Mutual performance monitoring: The ability to develop common understandings of the team environment and apply appropriate task strategies to accurately monitor teammate performance (Salas et al., 2005). Mutual support: Do team members help and support each other in carrying out their tasks? Team members working on a common goal should display mutual respect, grant assistance when needed, and develop other team members' ideas and contributions rather than trying to outdo each other (Hoegl & Gemuenden, 2001). Mutual trust: The shared belief that team members will perform their roles and protect the interest of their teammates (Salas et al., 2005).
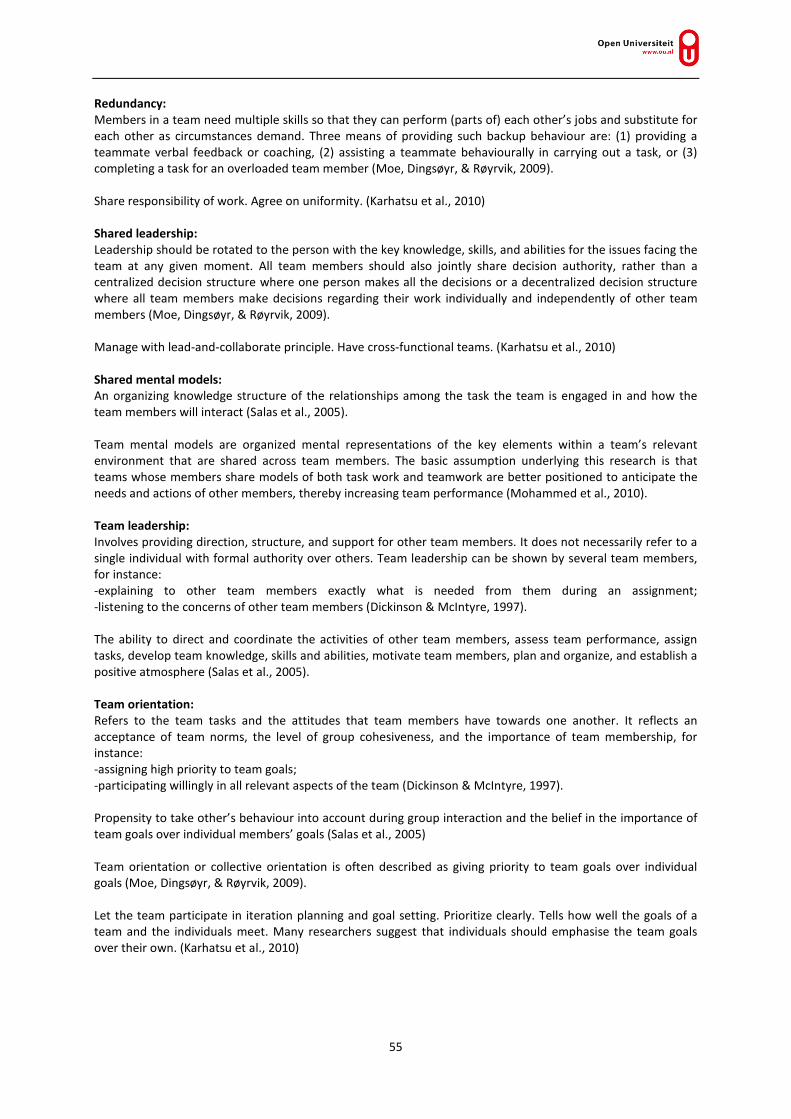
55
Redundancy: Members in a team need multiple skills so that they can perform (parts of) each other’s jobs and substitute for each other as circumstances demand. Three means of providing such backup behaviour are: (1) providing a teammate verbal feedback or coaching, (2) assisting a teammate behaviourally in carrying out a task, or (3) completing a task for an overloaded team member (Moe, Dingsøyr, & Røyrvik, 2009). Share responsibility of work. Agree on uniformity. (Karhatsu et al., 2010) Shared leadership: Leadership should be rotated to the person with the key knowledge, skills, and abilities for the issues facing the team at any given moment. All team members should also jointly share decision authority, rather than a centralized decision structure where one person makes all the decisions or a decentralized decision structure where all team members make decisions regarding their work individually and independently of other team members (Moe, Dingsøyr, & Røyrvik, 2009). Manage with lead-and-collaborate principle. Have cross-functional teams. (Karhatsu et al., 2010) Shared mental models: An organizing knowledge structure of the relationships among the task the team is engaged in and how the team members will interact (Salas et al., 2005). Team mental models are organized mental representations of the key elements within a team’s relevant environment that are shared across team members. The basic assumption underlying this research is that teams whose members share models of both task work and teamwork are better positioned to anticipate the needs and actions of other members, thereby increasing team performance (Mohammed et al., 2010). Team leadership: Involves providing direction, structure, and support for other team members. It does not necessarily refer to a single individual with formal authority over others. Team leadership can be shown by several team members, for instance: -explaining to other team members exactly what is needed from them during an assignment; -listening to the concerns of other team members (Dickinson & McIntyre, 1997). The ability to direct and coordinate the activities of other team members, assess team performance, assign tasks, develop team knowledge, skills and abilities, motivate team members, plan and organize, and establish a positive atmosphere (Salas et al., 2005). Team orientation: Refers to the team tasks and the attitudes that team members have towards one another. It reflects an acceptance of team norms, the level of group cohesiveness, and the importance of team membership, for instance: -assigning high priority to team goals; -participating willingly in all relevant aspects of the team (Dickinson & McIntyre, 1997). Propensity to take other’s behaviour into account during group interaction and the belief in the importance of team goals over individual members’ goals (Salas et al., 2005) Team orientation or collective orientation is often described as giving priority to team goals over individual goals (Moe, Dingsøyr, & Røyrvik, 2009). Let the team participate in iteration planning and goal setting. Prioritize clearly. Tells how well the goals of a team and the individuals meet. Many researchers suggest that individuals should emphasise the team goals over their own. (Karhatsu et al., 2010)

56
APPENDIX C INDIVIDUAL ELE MEN TS OF THE TEAMWORK MODELS Table 10 Individual elements of the teamwork models

57
APPENDIX D DESCRIPTION OF AGGRE GATE D E LEMENTS AND THE DIFFERENT MODE LS Table 11 Aggregation of model elements

58
APPENDIX E COMBINE D MODEL V1.0 USE D IN FOCUS GROUP Table 12 Agile team skills model used in focus group

59
APPENDIX F TE AMWORK QUESTION S USE D BY MOE, DINGSØYR, AND RØYRVIK (2009) Table 13 Teamwork questions by Moe, Dingsøyr, and Røyrvik (2009) Shared leadership
Team orientation
Redundancy
Learning
Autonomy

60
APPENDIX G TE AMWORK QUESTION S USE D BY STE TTINA AN D HEI JSTE K (2011)
Table 14 Teamwork items by Stettina and Heijstek (2011) based on Moe, Dingsøyr, and Røyrvik (2009)

61
APPENDIX H TE AMWORK QUESTION S USE D BY PARK E T AL . (2005) Table 15 Teamwork items by Park et al. (2005) based on Rosenstein (1994)

62
APPENDIX I TE AMWORK QUESTION S AFTE R COMBINING QUE STIONARES AN D REWRITING
Adapting to change:1 I experience that the team explicitly keeps doing the things that work well I experience that if something in the development process doesn’t work, the team finds a better way and fixes it I experience that team members are used to give and receive feedback Autonomy:1 I experience that the team likes to stay together as a team for a longer time I experience that people outside the team are not allowed to influence daily operational team decisions I experience that daily operational team decisions are respected and accepted by people outside the team Communication:2 I experience that team members communicate in a clear way I experience that team members do their best to ensure that others can understand them and ask questions to clarify if needed I experience team members regularly discuss task-related subjects Keeping track of the work: 2 I experience that team members are concerned with the performance of other team members I experience that team members help each other when necessary I experience team members support a colleague who makes a mistake Sharing leadership:1 I experience that everyone is involved in the team decisions I experience that team members trust each other in making important decisions for the team I experience that the team knows what to achieve as a team and which rules apply Sharing workload:1 I experience that team members can easily complete a task from another team member I experience that team members get help from others when needed I experience that I help others when they have problems Team goals over individual goals:1 I experience that team members take alternative suggestions into account during discussions I experience that team members value alternative options when I or others suggest them I experience that everybody takes their turn doing the ‘unpopular’ tasks Trust: 2 I experience that team members have a positive working relationship with each other I experience that team members can talk freely to each other about difficulties they have at work I experience that team members are competent and prepared for their position in the team 1 based on Stettina and Heijstek (2011) 2 based on Park et al. (2005)

63
APPENDIX J TE AMWORK SURVE Y BE FORE RE TROSPE CTIVE
Field Type of output Example
output Model dimension
# generated by typeform
abf7cdf67 de4ac18702
4 2e404b9ae2
d9
What is your name? text a
Please select your company text Other
Please add the name of your team text a
I experience that the team explicitly keeps doing the things that work well
1-5; strongly disagree -
strongly agree
5 adapting to change
I experience the team likes to stay together as a team for a longer time
1-5; strongly disagree -
strongly agree
5 autonomy
I experience that team members communicate in a clear way
1-5; strongly disagree -
strongly agree
5 communication
I experience that team members are concerned with the performance of other team members
1-5; strongly disagree -
strongly agree
5 keeping track of the work
I experience everyone is involved in the team decisions
1-5; strongly disagree -
strongly agree
5 sharing leadership
I experience that team members can easily complete a task from another team member
1-5; strongly disagree -
strongly agree
5 sharing workload
I experience that team members take alternative suggestions into account during discussions
1-5; strongly disagree -
strongly agree
5 team goals over individual goals
I experience that team members have a positive working relationship with each other
1-5; strongly disagree -
strongly agree
5 trust
I experience that if something in the development process does not work, the team finds a better way and fixes it
1-5; strongly disagree -
strongly agree
5 adapting to change
I experience that people outside the team are not allowed to influence daily operational team decisions
1-5; strongly disagree -
strongly agree
5 autonomy
I experience that team members do their best to ensure that others can understand them and ask questions to clarify if needed
1-5; strongly disagree -
strongly agree
5 communication
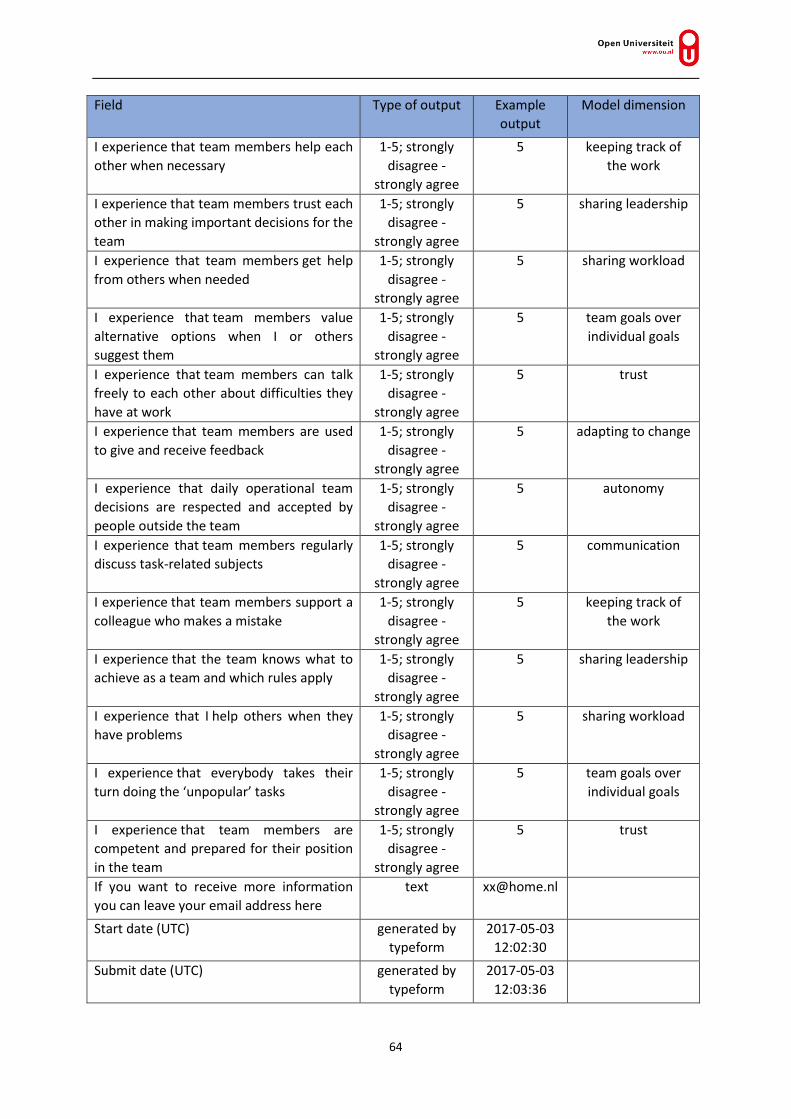
64
Field Type of output Example output
Model dimension
I experience that team members help each other when necessary
1-5; strongly disagree -
strongly agree
5 keeping track of the work
I experience that team members trust each other in making important decisions for the team
1-5; strongly disagree -
strongly agree
5 sharing leadership
I experience that team members get help from others when needed
1-5; strongly disagree -
strongly agree
5 sharing workload
I experience that team members value alternative options when I or others suggest them
1-5; strongly disagree -
strongly agree
5 team goals over individual goals
I experience that team members can talk freely to each other about difficulties they have at work
1-5; strongly disagree -
strongly agree
5 trust
I experience that team members are used to give and receive feedback
1-5; strongly disagree -
strongly agree
5 adapting to change
I experience that daily operational team decisions are respected and accepted by people outside the team
1-5; strongly disagree -
strongly agree
5 autonomy
I experience that team members regularly discuss task-related subjects
1-5; strongly disagree -
strongly agree
5 communication
I experience that team members support a colleague who makes a mistake
1-5; strongly disagree -
strongly agree
5 keeping track of the work
I experience that the team knows what to achieve as a team and which rules apply
1-5; strongly disagree -
strongly agree
5 sharing leadership
I experience that I help others when they have problems
1-5; strongly disagree -
strongly agree
5 sharing workload
I experience that everybody takes their turn doing the ‘unpopular’ tasks
1-5; strongly disagree -
strongly agree
5 team goals over individual goals
I experience that team members are competent and prepared for their position in the team
1-5; strongly disagree -
strongly agree
5 trust
If you want to receive more information you can leave your email address here
text [email protected]
Start date (UTC) generated by typeform
2017-05-03 12:02:30
Submit date (UTC) generated by typeform
2017-05-03 12:03:36

65
Field Type of output Example output
Model dimension
Network ID generated by typeform
148c2ec57a

66
APPENDIX K FOCUS GROUP INVITATION EMAIL
Dear <name>, First of all, thank you for your willingness to participate in this research. The research on Agile teamwork will be carried out by me as a graduate student in the field of management science at the Open Universiteit. The main goal of this research is to answer the following question: “How can the theory on teamwork models used in research on Agile teams, be used to create better Agile software development teams.” As part of this research, a focus group session is organized in which experts can contribute to the research. This focus group will help identify possible use cases of a teamwork model that would be useful for Agile practitioners. The focus group session will be held on Friday the 14th of October 2016, from 13:00 to 16:00, in Delft at Prowareness, Brassersplein 1, 2612 CT Delft. We will have coffee available for you, from 12:30. This will help us start punctually. Information is provided in English to allow the international community to examine the research. During the focus group, the assignments will be in English as well. Interactions, however, can be in Dutch if the group consists of all Dutch speakers. With best regards, Colinda de Beer, master student Open Universiteit Mobile: +31 6xxxxxxxx Email: [email protected]
67
APPENDIX L PROTOCOL OF THE FOCUS GROUP
The focus group technique is a quantitative research method traditionally used in social and marketing research. Since the 1980s and 1990s, it has also been used in different fields of research. It is a structured and focussed discussion on a predefined subject with a small group of people and led by a facilitator (Masadeh, 2012). The focus group session for this research will consist of nine potential users of the Agile team skills tool that will be created as the result of the research. The goal is to select the use case with the highest value for practitioners working in or with Agile software development teams. The group will consist of Agile experts with roles in management, HR, team coaching, software development and a researcher on the topic of ‘Agile excellence’. Prior to the focus group: The participants have only been told that the focus group will be on the topic of ‘teamwork models’ and that they do not need to prepare anything. Preparation of the focus group: The focus group session will be held at the Prowareness office in Delft. The participants are split into two groups with every expertise represented in both groups. The groups will each have their own room to start with. In the second part, the groups will come together. Items needed for focus group session:
• Two rooms • Name forms of group members (for placing on table) • Two tables • Two bundles of sticky notes (yellow and green) • Two flipcharts (with sheets) • Twi printouts of timeline and text • Twelve ‘A4’ descriptions of the Agile team skills model • Tape • Eighteen use case forms • Twelve dot vote forms • Markers / pens • Present / thank you for the participants

68
Group session agenda 13:00 – 13:05 Introduction (5 min) <one group> Part 1 13:05 – 13:25 Group exercise 1 – Help and hinder teamwork (20 min) <two groups> 13:25 – 13:35 Explanation of the Agile Team Skills model (10 min) <one group> 13:35 – 13:55 Group exercise 2 – Categorise according to the model (20 min) <two groups> Part 2 13:55 – 14:25 Group exercise 3 – Describe max five use cases of tool (30 min) <two groups> 14:25 – 14:35 Short break (10 min) Groups will be joined and work as one group from here 14:35 – 15:05 Describe and categorize use cases (30 min) <one group> 15:05 – 15:15 Dot voting (10 min) <one group> 15:15 – 15:45 Rationale for three use cases with highest number of votes; open fish-bowl (30 min) <one group> 15:45 – 16:00 Debrief, thanks and closing (15 min) <one group> 13:00 – 13:05 Introduction (5 min) <The facilitators will be introduced; a short explanation of the program for the rest of the afternoon and a presentation on the role of this focus group in the research are given.> Introduction by Rini - plenary (5 min) “Welcome everyone, thank you for your time. I am Rini van Solingen and this is Colinda de Beer, together we are investigating Agile team composition as part of Colinda’s master thesis on management sciences at the Open Universiteit, for which I am the responsible professor. We will be facilitating today’s session; today’s objective is to gain insights into the practical use of teamwork models in Agile software development. The scientific nature of this session requires that the internal validity is guaranteed. For this reason, we ask you to follow the instructions provided by us carefully, for example, when asked to do an exercise individually, do so individually, do not discuss any aspect of the exercise. Before starting each exercise, it will be explained to you in this room. To start, we will work in two groups and towards the end of the focus group session, we will join both groups. As long as we are working in two groups, please refrain from talking to people in the other group. We want to take pictures of the session. Is there anybody that does not want the be included in the pictures? We have randomly selected people for two teams to have expertise from the backgrounds of HR, management, coaching and development. Group A consists of: Esther, Kees, Barend and Stacy. They will start in the room on the other side of the corridor. Group B consists of Yvonne, Angelique, Els, Alex and Christoph and will work in this room. Before the beginning of a new exercise, we want to ask group A to come to this room so we can explain the next exercise.”
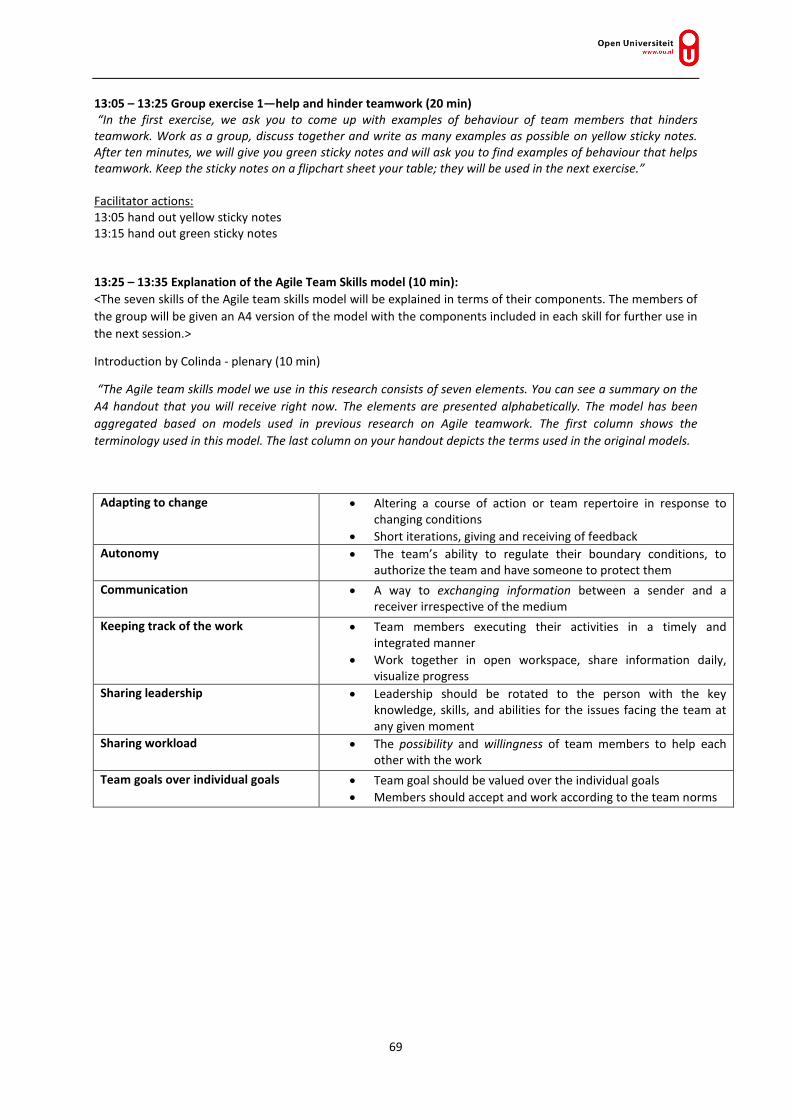
69
13:05 – 13:25 Group exercise 1—help and hinder teamwork (20 min) “In the first exercise, we ask you to come up with examples of behaviour of team members that hinders teamwork. Work as a group, discuss together and write as many examples as possible on yellow sticky notes. After ten minutes, we will give you green sticky notes and will ask you to find examples of behaviour that helps teamwork. Keep the sticky notes on a flipchart sheet your table; they will be used in the next exercise.” Facilitator actions: 13:05 hand out yellow sticky notes 13:15 hand out green sticky notes 13:25 – 13:35 Explanation of the Agile Team Skills model (10 min): <The seven skills of the Agile team skills model will be explained in terms of their components. The members of the group will be given an A4 version of the model with the components included in each skill for further use in the next session.>
Introduction by Colinda - plenary (10 min)
“The Agile team skills model we use in this research consists of seven elements. You can see a summary on the A4 handout that you will receive right now. The elements are presented alphabetically. The model has been aggregated based on models used in previous research on Agile teamwork. The first column shows the terminology used in this model. The last column on your handout depicts the terms used in the original models.
Adapting to change • Altering a course of action or team repertoire in response to changing conditions
• Short iterations, giving and receiving of feedback Autonomy • The team’s ability to regulate their boundary conditions, to
authorize the team and have someone to protect them Communication • A way to exchanging information between a sender and a
receiver irrespective of the medium Keeping track of the work • Team members executing their activities in a timely and
integrated manner • Work together in open workspace, share information daily,
visualize progress Sharing leadership • Leadership should be rotated to the person with the key
knowledge, skills, and abilities for the issues facing the team at any given moment
Sharing workload • The possibility and willingness of team members to help each other with the work
Team goals over individual goals • Team goal should be valued over the individual goals • Members should accept and work according to the team norms
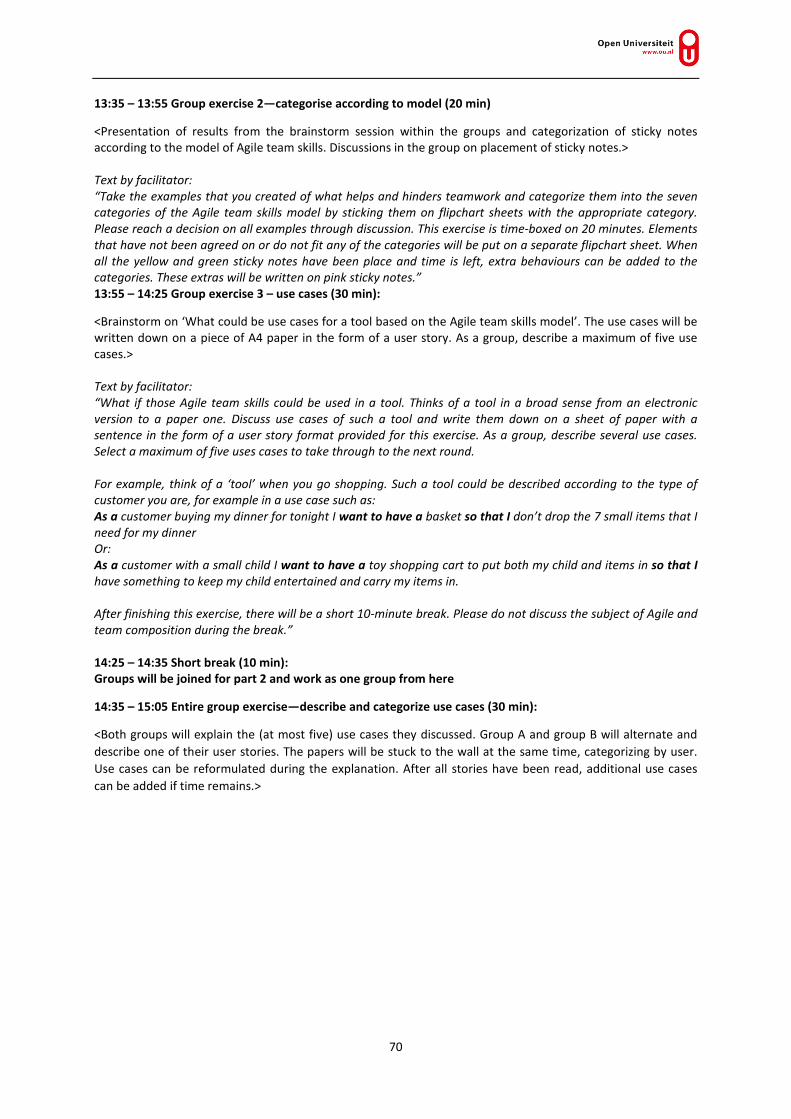
70
13:35 – 13:55 Group exercise 2—categorise according to model (20 min)
<Presentation of results from the brainstorm session within the groups and categorization of sticky notes according to the model of Agile team skills. Discussions in the group on placement of sticky notes.> Text by facilitator: “Take the examples that you created of what helps and hinders teamwork and categorize them into the seven categories of the Agile team skills model by sticking them on flipchart sheets with the appropriate category. Please reach a decision on all examples through discussion. This exercise is time-boxed on 20 minutes. Elements that have not been agreed on or do not fit any of the categories will be put on a separate flipchart sheet. When all the yellow and green sticky notes have been place and time is left, extra behaviours can be added to the categories. These extras will be written on pink sticky notes.” 13:55 – 14:25 Group exercise 3 – use cases (30 min):
<Brainstorm on ‘What could be use cases for a tool based on the Agile team skills model’. The use cases will be written down on a piece of A4 paper in the form of a user story. As a group, describe a maximum of five use cases.> Text by facilitator: “What if those Agile team skills could be used in a tool. Thinks of a tool in a broad sense from an electronic version to a paper one. Discuss use cases of such a tool and write them down on a sheet of paper with a sentence in the form of a user story format provided for this exercise. As a group, describe several use cases. Select a maximum of five uses cases to take through to the next round. For example, think of a ‘tool’ when you go shopping. Such a tool could be described according to the type of customer you are, for example in a use case such as: As a customer buying my dinner for tonight I want to have a basket so that I don’t drop the 7 small items that I need for my dinner Or: As a customer with a small child I want to have a toy shopping cart to put both my child and items in so that I have something to keep my child entertained and carry my items in. After finishing this exercise, there will be a short 10-minute break. Please do not discuss the subject of Agile and team composition during the break.” 14:25 – 14:35 Short break (10 min): Groups will be joined for part 2 and work as one group from here
14:35 – 15:05 Entire group exercise—describe and categorize use cases (30 min):
<Both groups will explain the (at most five) use cases they discussed. Group A and group B will alternate and describe one of their user stories. The papers will be stuck to the wall at the same time, categorizing by user. Use cases can be reformulated during the explanation. After all stories have been read, additional use cases can be added if time remains.>

71
Text by facilitator: “Take the use cases that you created and categorize them by user, sticking them on flipchart sheets with the appropriate category. Group A starts with the first use case and group B can ask questions if they don’t understand the use case or the use case can be re-formulated if group B has a use case that is similar or a better use case comes up during discussion. Next, the same pattern will follow with group B presenting a use case and group A asking questions. Do this until all use cases have been explained. Be short in your presentation of the use case because of the limited time available. If time is left, new use cases that come up after discussing the use cases described by the two separate groups can be added. This exercise is time-boxed on 30 minutes.” Facilitator actions: Record the session audio Make sure the use cases are numbered before dot voting starts
15:05 – 15:15 Entire group—dot voting (10 min):
<Everybody gets time to look at the use cases present and decide which use case would be most useful to further look into. Five votes should be given. More than one vote can be given per use case. After everybody has written down their votes without consulting each other, the votes will be added to the use cases on the wall.>
Text by facilitator: “We will now use dot voting to decide which uses cases would be most useful to further explore in practice. For this dot vote session, you get five votes. We will give each of you a flipchart sheet of paper; please write down your name and the three use cases that you vote for. After everybody has written down their vote without consulting each other, please hand in your forms and the votes will be added to the use cases on the wall. This exercise is time-boxed on 10 minutes.” 15:15 – 15:45 Entire group—rational (30 min):
<As a group, discuss the three use cases with the highest number of votes in an open fish-bowl form and describe why they are important for practical use. What problem(s) would be solved if such a tool would be available?>
Text by facilitator: “We now have three use cases that would be most valuable to look into further. What problem(s) would be solved if a tool was available? Start with the use case with the highest number of votes. We will discuss the topic in an open fish-bowl format. This means that four chairs will be arranged in the middle of a semi-circle. The remaining chairs will be placed around them in a semi-circle. At the start of the discussion, three people that have something to say about the use case will sit on the chairs in the middle. The people on the chairs in the ‘outside circle’ will be listening to the discussion. Anyone that wants to join in can sit on the empty chair in the middle. When that happens, one of the people in the inner circle has to get up and leave the discussion. After a maximum of ten minutes, the next use case will be discussed.” Facilitator actions: Write down the problems solved, ideas about what the tool would look like and how to validate it. 15:45 – 16:00 Entire group—debrief, thanks and closing (15 min)

72
APPENDIX M ROOM SE TUP OF FOCUS GROUP SE SS ION
Figure 21 Room setup focus group
Figure 22 Table setup focus group Figure 23 Flip-over for categories (categories hidden)
Figure 24 Brainstorming help and hinder Figure 25 Categorization of sticky notes
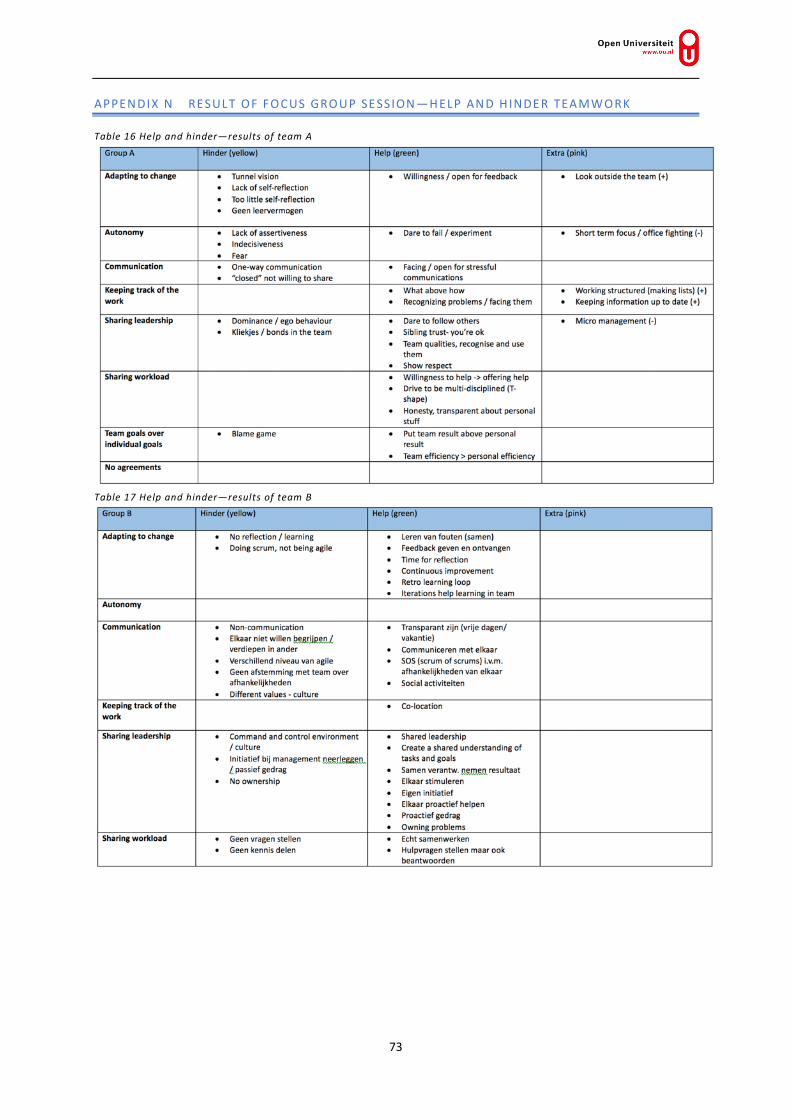
73
APPENDIX N RESULT OF FOCUS GROUP SE SS ION—HELP AN D HINDE R TEAMWORK Table 16 Help and hinder—results of team A
Table 17 Help and hinder—results of team B

74

75
APPENDIX O PICTURES OF USE CASES AND FISH BOWL
Figure 26 Use cases discussed during fish bowl
Figure 27 Four people sitting during fish bowl
Figure 28 Five people standing during fish bowl

76
APPENDIX P RESULT OF FOCUS GROUP SE SS ION —COMBINE D HELP AN D HIN DE R TE AMWORK
Table 18 Combined examples from focus group for both teams of what helps and hinders teamwork Hinder (yellow) Help (green)
Adapting to change
• Tunnel vision • Lack of self-reflection • Too little self-reflection • Geen leervermogen • Look outside the team • No reflection / learning • Doing Scrum, not being Agile
• Willingness / open for feedback • Leren van fouten (samen) • Feedback geven en ontvangen • Time for reflection • Continuous improvement • Retrospective learning loop • Iterations help learning in team • Teaching others • Enthousiasme + passie
Autonomy • Lack of assertiveness • Indecisiveness • Fear • Not enough focus because of budget
goals • Geen commitment afgeven op het werk
• Dare to fail / experiment • Short term focus / office fighting • PO uit de business
Communication • One-way communication • “closed”; not willing to share • Non-communication • Elkaar niet willen begrijpen/ verdiepen
in ander • Verschillend niveau van Agile • Geen afstemming met team over
afhankelijkheden • Different values / culture • Over collega’s praten niet met
• Facing / open for stressful communications
• Transparant zijn (vrije dagen/ vakantie) • Communiceren met elkaar • SOS (Scrum of Scrums) i.v.m.
afhankelijkheden van elkaar • Social activiteiten
Keeping track of the work
• What above how • Recognizing problems / facing them • Working in a structured manner
(making lists) • Keeping information up to date • Co-location
Sharing leadership
• Dominance / ego behaviour • Kliekjes / bonds in the team • Micro management • Command and control environment /
culture • Initiatief bij management neerleggen/
passief gedrag • No ownership • Niet open staan voor elkaars inbreng
• Dare to follow others • Sibling trust—you’re ok • Team qualities, recognise and use them • Show respect • Shared leadership • Create a shared understanding of tasks
and goals • Samen verantw. nemen resultaat • Elkaar stimuleren • Eigen initiatief • Elkaar proactief helpen • Proactief gedrag • Owning problems • Trust; create atmosphere of trust • Collega’s niet vertrouwen • Niet willen toegeven als iemand

77
Hinder (yellow) Help (green)
wellicht beter idee heeft • Quality time in team
Sharing workload • Geen vragen stellen • Geen kennis delen
• Willingness to help; offering help • Drive to be multi-disciplined (T-shape) • Honesty, transparent about personal
stuff • Echt samenwerken • Hulpvragen stellen maar ook
beantwoorden • Vragen stellen in team (wegnemen
onduidelijkheden) • Elkaar helpen • Kennis delen • T-shape model van kennis • Alle disciplines in team • Teambuilding to know who has which
competence
Team goals over individual goals
• Blame game • Ieder zijn taak, niet samen aan 1 ding
werken • Alleen met individueel resultaat bezig
zijn i.p.v. team resultaat • Eigen belang voor teambelang • Silo thinking • Too service minded, not saying ‘no’ • No common goal / vision
• Put team result above personal result • Team efficiency > personal efficiency • Eén doel uitdragen • Commitment voor teamresultaat • Successen vieren
Team A Team B Team B not decided -> decided by researcher
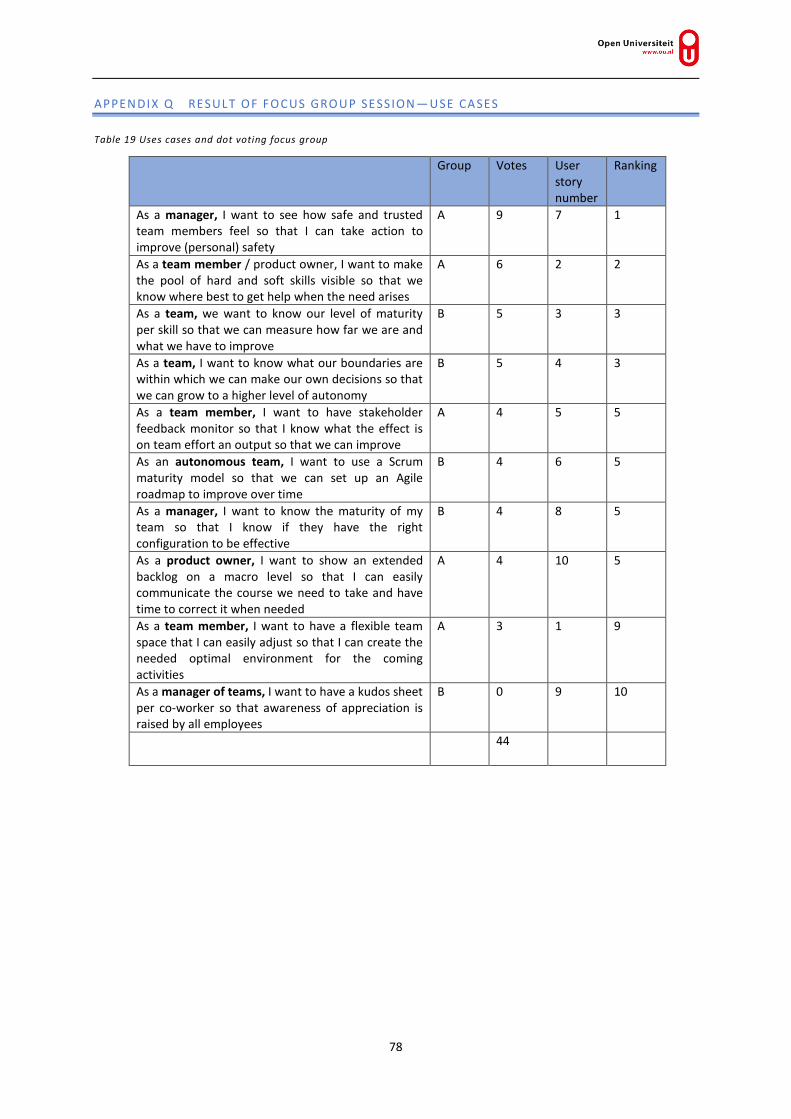
78
APPENDIX Q RESULT OF FOCUS GROUP SE SS ION —USE CASES
Table 19 Uses cases and dot voting focus group
Group Votes User story number
Ranking
As a manager, I want to see how safe and trusted team members feel so that I can take action to improve (personal) safety
A
9 7 1
As a team member / product owner, I want to make the pool of hard and soft skills visible so that we know where best to get help when the need arises
A
6 2 2
As a team, we want to know our level of maturity per skill so that we can measure how far we are and what we have to improve
B 5 3 3
As a team, I want to know what our boundaries are within which we can make our own decisions so that we can grow to a higher level of autonomy
B 5 4 3
As a team member, I want to have stakeholder feedback monitor so that I know what the effect is on team effort an output so that we can improve
A 4 5 5
As an autonomous team, I want to use a Scrum maturity model so that we can set up an Agile roadmap to improve over time
B 4 6 5
As a manager, I want to know the maturity of my team so that I know if they have the right configuration to be effective
B 4 8 5
As a product owner, I want to show an extended backlog on a macro level so that I can easily communicate the course we need to take and have time to correct it when needed
A 4 10 5
As a team member, I want to have a flexible team space that I can easily adjust so that I can create the needed optimal environment for the coming activities
A 3 1 9
As a manager of teams, I want to have a kudos sheet per co-worker so that awareness of appreciation is raised by all employees
B 0 9 10
44

79
Table 20 Individual voting use cases focus group
Use case
1 2 3 4 5 6 7 8 9 10 Total Group A
Esther Visser HR 1 1 2 1 5 Kees van Grieken MA 1 1 2 1 5 Barend van de Plas CO 2 1 2 5 Stacy Cashmore TE 1 2 1 1 5
Group B Yvonne Heemskerk HR 1 1 2 4 Angelique Taal MA 1 1 1 2 5 Els Verkaik CO 1 1 1 1 1 5 Alex Roos TE 3 1 1 5 Christoph Stettina RE 1 2 1 1 5 Total 3 6 5 5 4 4 9 4 0 4 44 HR HR manager MA manager CO coach TE team member RE researcher
80
APPENDIX R PROTOCOL OF THE AGILE TE AM SKILLS TOOL V1.1.
This document describes the protocol that will be used by the Scrum Master / facilitator of the tool. *One week prior to the retrospective Scrum Master: Ask the participants to fill out a survey in preparation for the retrospective. The members of a team will be sent the following text in an email by the Scrum Master of the team: --------- Dear <name>, In preparation for our next retrospective, I want to ask you to fill out a survey at http://bit.ly/teamskillsV1_1 Please make sure that you will fill out the survey before <todo date 2 days before the retrospective> as some processing of the data needs to be done. Thanks, and looking forward to meeting for our retrospective on <todo date and time of retrospective> <name of Scrum Master / facilitator> --------- *Items needed for the retrospective:
• Two bundles of sticky notes (two different colours) • Flipchart (with sheets) or whiteboard • Two printouts of timeline and text • Results of survey (printout or on slide) • A4 description of the Agile Team Skills model for every team member • Markers / pens • Enough printed surveys to rate the retrospective at the end or access to a smartphone or computer
with internet connection to fill the survey out online

81
*During the retrospective According to Derby and Larssen, a retrospective is setup using the following stages:
1. Set the stage Set the goal; Give people time to arrive and get into the right mood
2. Gather data Help everyone remember; create a shared pool of information (everybody sees the world differently)
3. Generate insight Why did things happen the way they did? Identify patterns; see the big picture
4. Decide what to do Pick a few issues to work on and create concrete action plans of how you’ll address them
5. Close the retrospective Clarify follow-up; appreciations; clear end; how could the retrospectives improve?
In the retrospective that is part of the tool, this setup will be followed. Agenda in short: 00:00 – 00:10 Introduction (10 min) Introduction; how safe do you feel? 00:10 – 00:30 Gather data (20 minutes) - Explain the model - Find positive and negative examples 00:30 – 00:50 Generate insights (20 minutes) -Show survey results -Discussion on what are we good at and what should we improve as a team 00:50 – 01:10 Decide what to do (20 minutes) -Decide what to work on first -Discuss actionable goal for next sprint(s) to improve chosen dimension 01:10 – 01:25 Close the retrospective (15 minutes) -Conduct survey on the usefulness of this retrospective 00:00 – 00:10 Introduction For the introduction, the description of the safety check at http://www.akashb.com/blog/2012/05/28/Agile-retrospectives-the-safety-check/ and http://www.funretrospectives.com/safety-check/ and https://www.benlinders.com/2016/what-to-do-when-safety-is-low-in-a-retrospective/ have been used. < Note to Scrum Master: make sure a poster / slide / handout of the meaning of the numbers in the safety check are available / visible when you start. > Introduction by Scrum Master: “Welcome everyone, to this retrospective, where we will look at how we work as a team and our strong and weak points. This will be discussed based on the (anonymous) results of the survey you filled out earlier this week. After discussing the results, we will decide together what to work on to improve as a team. Before we start this retrospective, I want to check how comfortable you feel to be in this retro and how willing you are to talk about your role as a team member and the team as a whole. I want to do this by doing a safety check. To do this you will all get a sticky note and a marker. On this note please anonymously write down the number that applies from the following 5 descriptions. Then fold the sticky note so the number is invisible and put is in this box/hat. When everybody is ready the sticky notes will be taken out of the box/hat and we will look at the results together to see if we can proceed with the retro.

82
5. I want to talk about anything, want to explore other’s thoughts as well as my own. 4. I want to talk about most things, but small few topics I may keep quite on. 3. I am happy to sit and listen, I will talk if something I am very passionate about comes up. 2. I am not comfortable talking, even when I have a strong opinion, I will keep it to myself. 1. I am not comfortable being here, I want to leave.
Figure 29 Example of results of safety check < Note to Scrum Master: Here is what you can say when the safety is high: “It seems that many people in the room are willing to talk about many topics, therefore it is worth moving to the next activity, which should trigger many conversations.” the safety is medium: “As visible on the safety check results, some people are not willing to talk about all topics. Let’s have this in mind and I (as a facilitator) will not ask everyone’s opinion, given some people are not comfortable to talk about everything.” the safety is low: “As visible on the safety check results, the group safety seems low. For this reason, let’s use the remaining time to run an activity which might help us increase the group safety level.” What counts as “low” safety should be left to the discretion of the Scrum Master of the team, who will know the team best to decide when they feel unsafe. Generally, if most of the team members score a 1 or 2, it would be better to first try and make the situation safer, for example, by using: http://www.funretrospectives.com/creating-safety/ and then redoing the safety check. If it’s still not safe enough, prepare to stop the retrospective. end note to Scrum Master > 00:10 – 00:30 Gather data (20 minutes) < Note to Scrum Master: make sure a poster / slide / handout of the model and the results of the survey are available and visible when you start your explanation. > Explanation of the model by the Scrum Master: (5 minutes) “I will start with a short explanation of the Agile team skills model that was created based on literature review on teamwork models used in research on Agile software development. The Agile team skills model consists of eight dimensions that according to teamwork research influence the efficiency and quality of the products of an Agile software team. The questions you answered in the survey before this retrospective all have to do with the eight dimensions of teamwork. You answered three questions per dimension and the answers were plotted on a radar graph. Here you see the answers of your team, where every line shows the result of one team member. The model consists of eight dimensions or skills. The dimensions in the model are: two coordinating dimensions, communication and trust, without which working as a team would be impossible. The other six dimensions are: adapting to change, autonomy, keeping track of the work, sharing leadership, sharing workload, team goals over individual goals. The description of the dimensions is given in Table 21.”
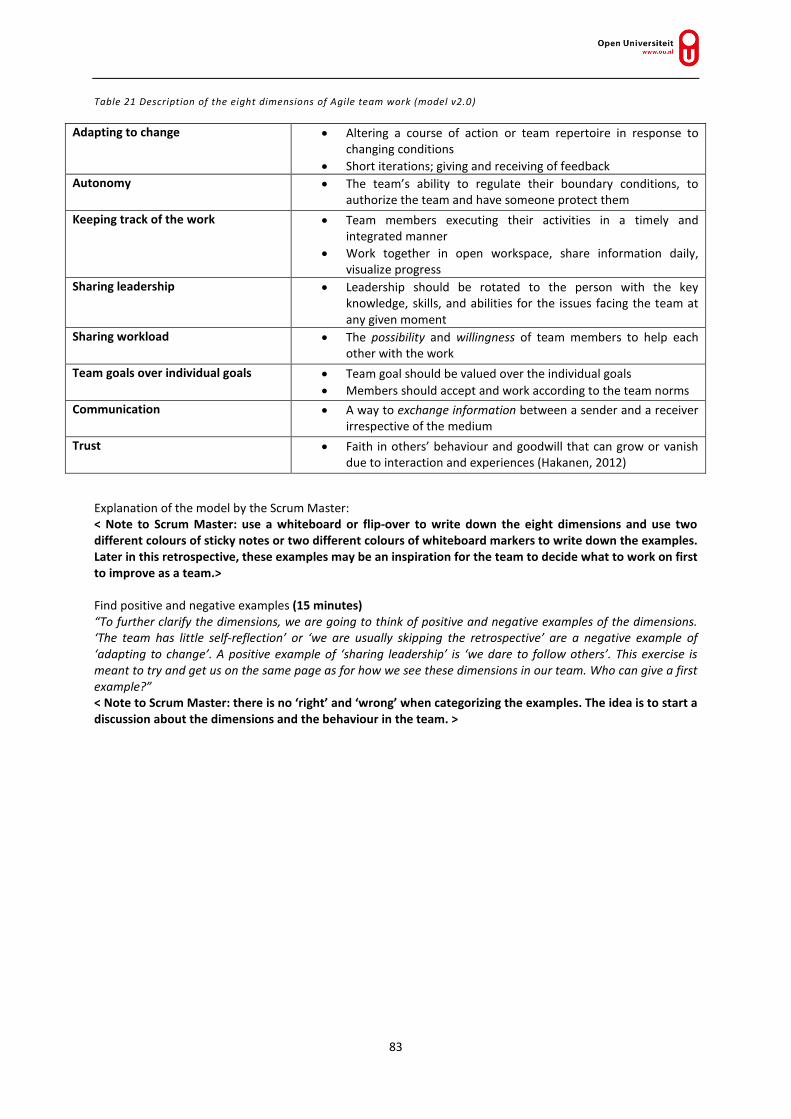
83
Table 21 Description of the eight dimensions of Agile team work (model v2.0)
Explanation of the model by the Scrum Master: < Note to Scrum Master: use a whiteboard or flip-over to write down the eight dimensions and use two different colours of sticky notes or two different colours of whiteboard markers to write down the examples. Later in this retrospective, these examples may be an inspiration for the team to decide what to work on first to improve as a team.> Find positive and negative examples (15 minutes) “To further clarify the dimensions, we are going to think of positive and negative examples of the dimensions. ‘The team has little self-reflection’ or ‘we are usually skipping the retrospective’ are a negative example of ‘adapting to change’. A positive example of ‘sharing leadership’ is ‘we dare to follow others’. This exercise is meant to try and get us on the same page as for how we see these dimensions in our team. Who can give a first example?” < Note to Scrum Master: there is no ‘right’ and ‘wrong’ when categorizing the examples. The idea is to start a discussion about the dimensions and the behaviour in the team. >
Adapting to change • Altering a course of action or team repertoire in response to changing conditions
• Short iterations; giving and receiving of feedback Autonomy • The team’s ability to regulate their boundary conditions, to
authorize the team and have someone protect them Keeping track of the work • Team members executing their activities in a timely and
integrated manner • Work together in open workspace, share information daily,
visualize progress Sharing leadership • Leadership should be rotated to the person with the key
knowledge, skills, and abilities for the issues facing the team at any given moment
Sharing workload • The possibility and willingness of team members to help each other with the work
Team goals over individual goals • Team goal should be valued over the individual goals • Members should accept and work according to the team norms
Communication • A way to exchange information between a sender and a receiver irrespective of the medium
Trust • Faith in others’ behaviour and goodwill that can grow or vanish due to interaction and experiences (Hakanen, 2012)

84
00:30 – 00:50 Generate insights (20 minutes) < Note to Scrum Master: Make sure that you have a handout or slide of the resulting spider graphs of the survey. The graphs could look something like Figure 30 > Show and discuss survey results (20 minutes) “The online survey that you did before this retrospective had questions related to the eight dimensions of the Agile team skills model. The results can be seen in the following spider graph. Every coloured line depicts the score of one of you for each of the eight dimensions. The higher the score, the better you think the team as a whole is performing on the given dimension. What do you think about the results? I want to discuss the results.”
Figure 30 Example of spider graph based on survey results < Note to Scrum Master: Questions you could ask: Do you see differences between the lines of different people? Where do we score low? Where do we score high? Are these results in accordance with your general feeling? Are some dimensions more important for the team? Should everybody be equally good at all dimensions? < This discussion helps the team in the next step of this retrospective to decide what is the most important dimension the team should improve on> 00:50 – 01:10 Decide what to do (20 minutes) < Note to Scrum Master: Make sure that you have a flip-over or whiteboard at hand> Decide what to work on first (10 minutes) “Based on the discussion of the survey results, I want to decide which dimension we will start working on as a team. I want to do that using the circle technique. With this, we put a big inside circle on the board to depict what we are good at. Around that, we draw another circle and in this outer circle we put the things that we want to improve on. Looking at the dimensions in the outer circle, we decide what we first want to start working on to get to the inner circle.
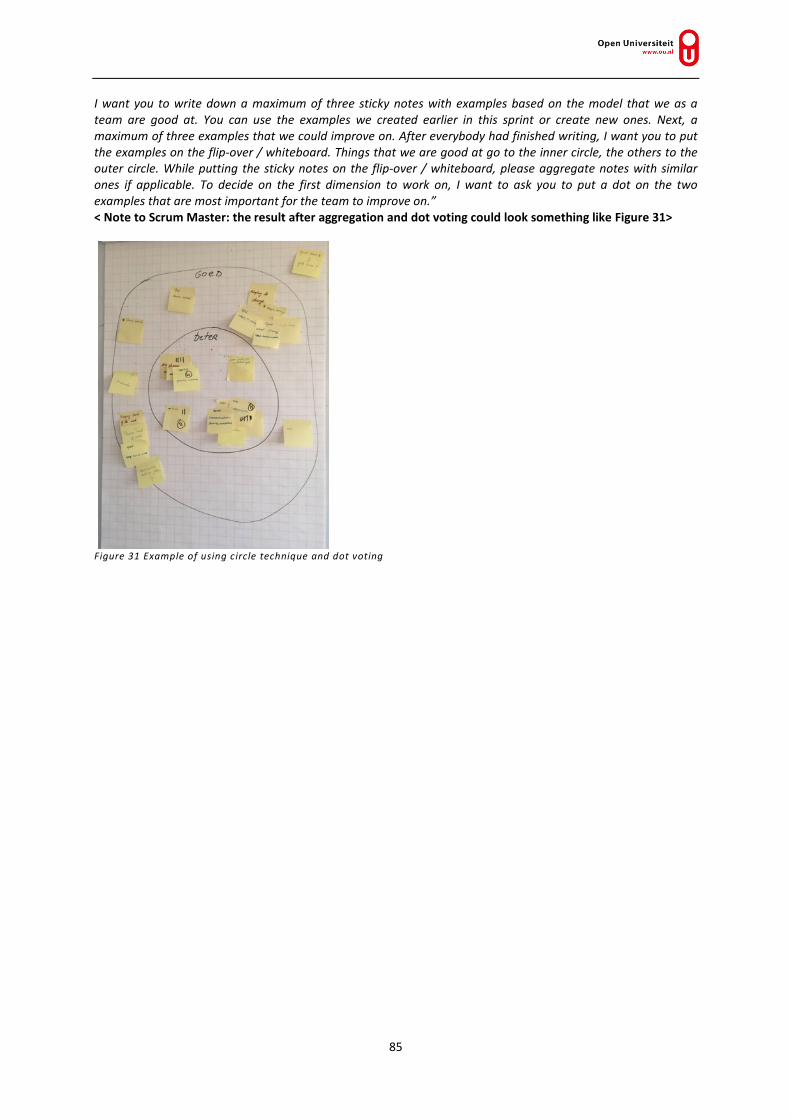
85
I want you to write down a maximum of three sticky notes with examples based on the model that we as a team are good at. You can use the examples we created earlier in this sprint or create new ones. Next, a maximum of three examples that we could improve on. After everybody had finished writing, I want you to put the examples on the flip-over / whiteboard. Things that we are good at go to the inner circle, the others to the outer circle. While putting the sticky notes on the flip-over / whiteboard, please aggregate notes with similar ones if applicable. To decide on the first dimension to work on, I want to ask you to put a dot on the two examples that are most important for the team to improve on.” < Note to Scrum Master: the result after aggregation and dot voting could look something like Figure 31>
Figure 31 Example of using circle technique and dot voting

86
Discuss actionable goal for next sprint(s) to improve chosen skill (10 minutes) “Looking at the chosen dimension, what could we do in the next sprint to improve on this dimension as a team? If the step to improvement is too big, what small step could we take during the next sprint? Can we already think of how to follow up during a longer period?” 01:10 – 01:25 Close the retrospective: (15 minutes) < Note to Scrum Master: Make sure that you have enough survey forms at hand or that the team members have immediate access to a smartphone or computer with internet connection> Survey on the usefulness of this retrospective (15 minutes) “In the next sprint, we will work on <todo: describe dimension to improve> and at the end of the sprint we can measure it by <todo: describe progress made>. To end this retrospective, I want to ask you to fill out a short survey about it. The survey takes about two minutes and can be done online via a smartphone or a computer. This model and the retrospective have been designed as part of a research for a thesis on Agile team skills. On behalf of the author of the thesis, I want to thank you for filling out the survey. The thesis will be available later this year for those who want to know more about it.” *After the retrospective < Note to Scrum Master: surveys to fill out can be found at http://bit.ly/teamskillsParticipantV1_1 for participants and at http://bit.ly/teamskillsSMV1_1. If surveys at the end have not been filled out online, please scan them to a pdf or take pictures and sent them to [email protected]. I would also like you to fill out a Scrum Master / facilitator survey if you facilitated the above retrospective. >

87
APPENDIX S SURVE Y QUE STIONS AFTER RE TROSPE CTIVE—PARTICIPANTS.
Field Type of output Example output
# generated by typeform
13ea021b5ca326 5f652354019e1817bb
Your name (optional) Text anon
Please select your company (optional) Text Other
Please add the name of your team (optional) Text A team
When did you do the retrospective? (optional) text
What I liked about this retrospective text I liked…
What would have made this retrospective perfect text What could be better…
On a scale from 1 to 10, how would you rate this retrospective format?
1-10 10
Please select the option(s) that apply multiple choice (n/m)
• The retrospective content was related to the skills and knowledge I need
The retrospective content was related to the skills and knowledge I need
• The retrospective made me think about my own actions
• The retrospective gave me new insight into the needs of other team members
• This retrospective gave me new insights into our functioning as a team
This retrospective gave me new insights into our
functioning as a team • The retrospective will help us to improve as a
team The retrospective will help
us to improve as a team
On a scale from 1 to 10, how likely is it that you would encourage others to use this retrospective format?
1-10; 1 unlikely, 10 highly likely
10
Please leave your email address (optional) if you want to receive more information about the thesis / retrospective
Start date (UTC) generated by typeform
2017-05-03 12:05:11
Submit date (UTC) generated by typeform
2017-05-03 12:06:07

88
Field Type of output Example output
Network ID generated by typeform
148c2ec57a

89
APPENDIX T SURVE Y QUE STIONS AFTER RE TROSPE CTIVE—SCRUM MASTER.
Field Type of output Example output
# generated by typeform
4a4246c27ea7 cadde444069e
50e655d4 Your name (optional) text anon
Please select your company (optional) text Prowareness
Please add the name of your team (optional) text A team
When did you facilitate the retrospective? (optional)
date 2017-05-03
What I liked about this retrospective text what I liked...
What would have made this retrospective perfect text what could be better…
On a scale from 1 to 10, how would you rate this retrospective format?
1-10 10
What was the length of the retrospective? text 1,5 hours
On a scale from 1 to 10, how likely is it that you would encourage other Scrum Masters to use this retrospective format?
1-10; 1 unlikely, 10 highly likely
10
Please leave your email address (optional) if you want to receive more information about the thesis / retrospective.
text [email protected]
Start date (UTC) generated by typeform
2017-05-03 12:13:15
Submit date (UTC) generated by typeform
2017-05-03 12:14:36
Network ID generated by typeform
148c2ec57a

90
APPENDIX U RADAR GRAPHS CREATE D FROM SURVE Y BEFORE RE TROSPE CTIVE V1.1
Figure 32 Agile team skills tool results team A
Figure 33 Agile team skills tool results team B

91
Figure 34 Agile team skills tool results team C

92
APPENDIX V PERFECTION GAME; RE SULTS OF SURVE Y AFTE R RE TROSPECTIVE V1.1
Results of ‘improve to make perfect’ question:
-More ‘deep dive’ practical examples -Get to the action points faster. In the end, you will only use one or two points for now -Be able to say everything in trust -Whole team should have been here -More personal feeling should be discussed -A break / a bit more time -It’s difficult to get from dimensions to actions -Dot vote on more concrete improvements / actions -Be ready to adapt the format during the retrospective -Shorter explanation; get to work faster -More information radiators instead of presentation -More information about the eight skills -Start from practical points of what went well this sprint instead of the model -More in-depth definition and explanation of the team skills and definition -If repeated (each sprint for example), focus on some or even one of the points -Ask deeper questions, discussion stayed close to the surface -More visual data / statistics -Game format -Not everything was said. It’s easy not to get to the real point -Good retrospective format but some improvements are needed -Depending on the team the ‘general’ naming examples of plus and minus points and looking at what the team is good at and could improve can be skipped / combined
Results of ‘what I like about this retrospection’ question:
-Openness, everybody gave input -Great facilitator! -Use of survey before the retrospective to find out more about the weak points of the team -Open, to the point and clarifying -Structure is clear -Nice different way of looking at things -Gives confirmation about previous retrospectives on team / task responsibilities -Gives a good insight into which themes help to become a better team -Structured and giving focus for the next sprint -The survey before the retrospective and the graph were good additions -Gives a good overview of the team -A sort of zero-measurement -No long discussions -Open discussions -Format -Brought on good discussions -Looking at positive as well as negative aspects -Not wanting to change everything but keep it small -It came up with an actual action for the team -Different point of view on team behaviour -Structured way to evaluate the previous sprint -Openness and clearness -It’s clearer to me what the + and – signs of the team are -Concrete items for the team—what is good and what needs to be improved -To the point, effective

93
-Short and to the point -Clear -Nice framework -Format of retrospective to identify a clear goal was perfect -Engaging -Open setting -Flexible program and easy to adjust based on feedback of the group -There is a red line present, working from abstract to clear

94
APPENDIX W DESCRIPTION OF THE AGILE TEAM SKILLS TOOL V1.21

95

96

97
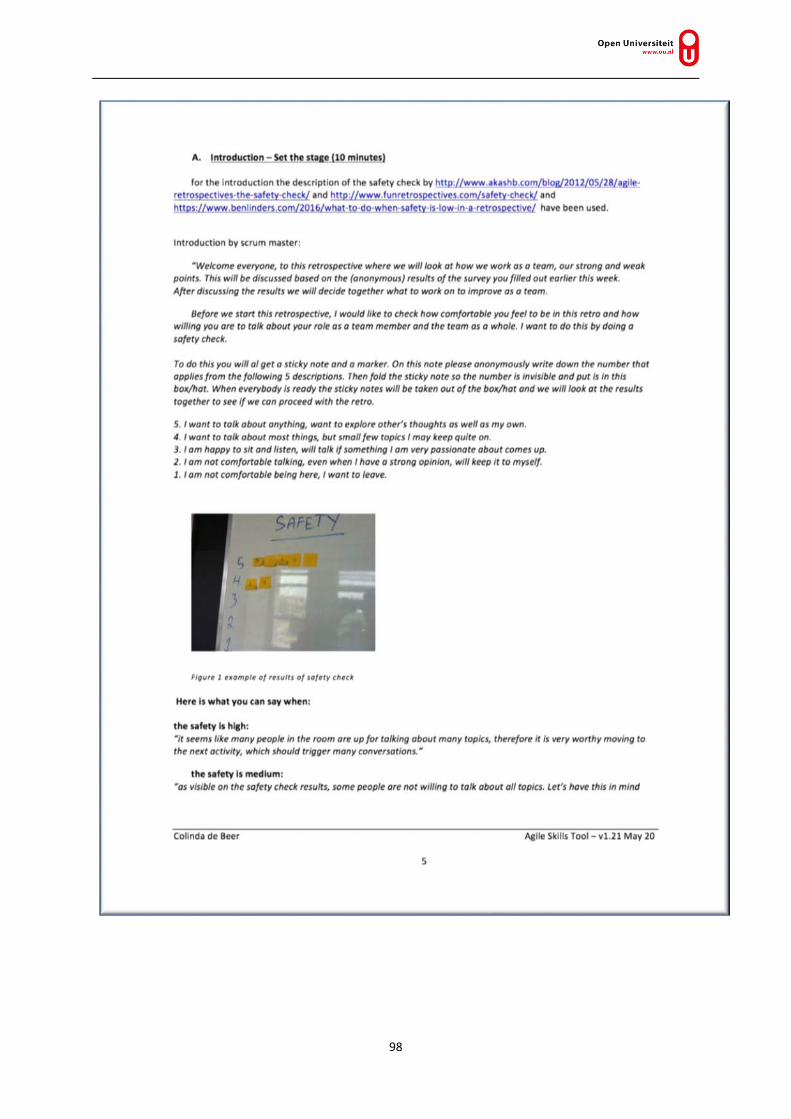
98

99

100
101

102

103

104

105

106
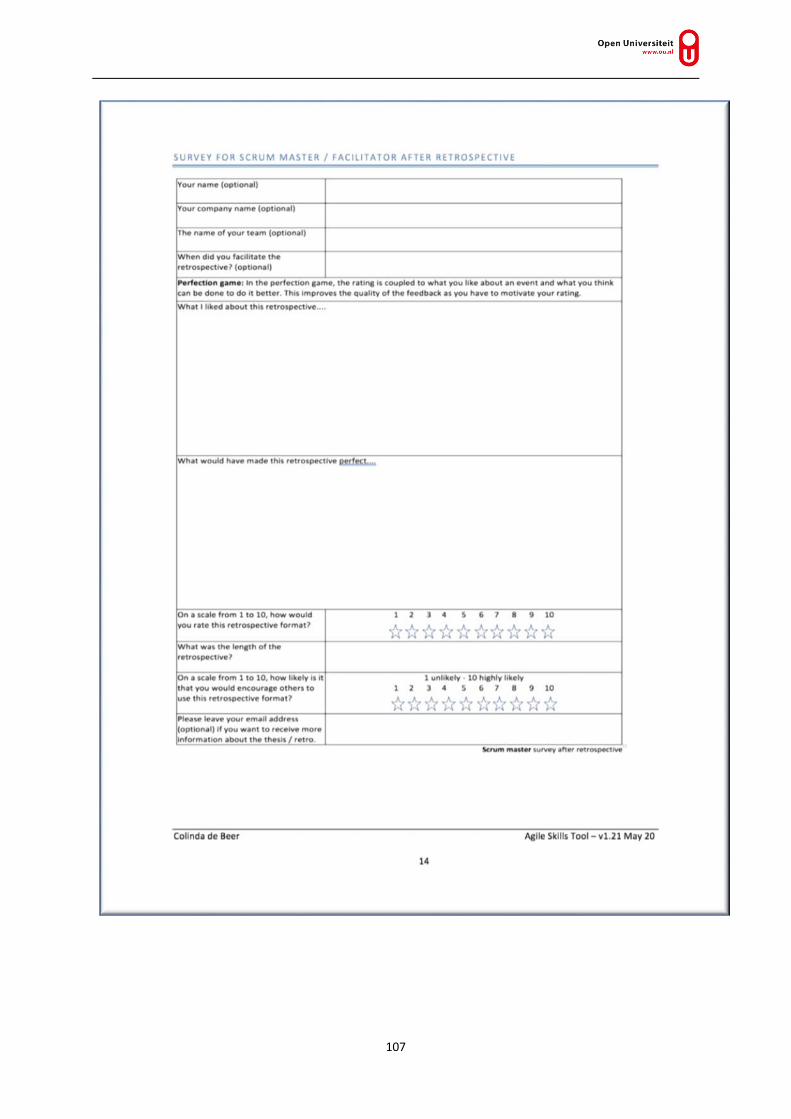
107
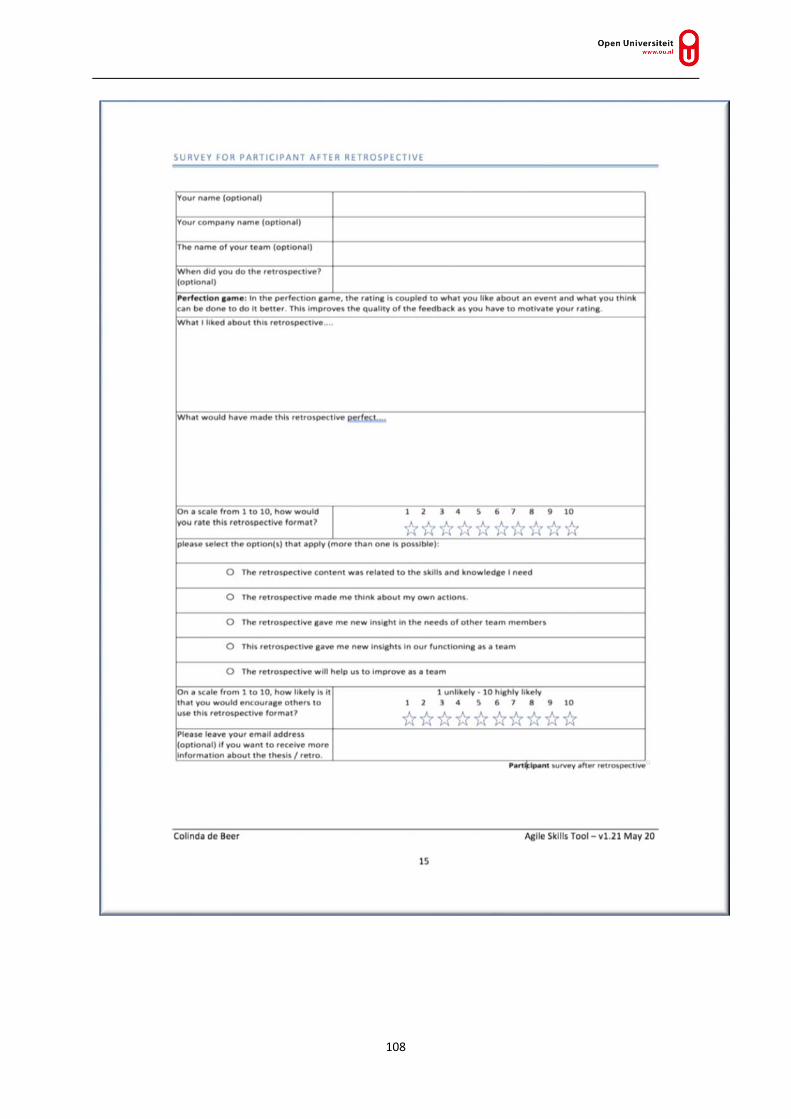
108

109
APPENDIX X RADAR GRAPHS CREATE D FROM SURVE Y BEFORE RE TROSPE CTIVE V1.21
Figure 35 Agile team skills tool results team D
Figure 36 Agile team skills tool results team E
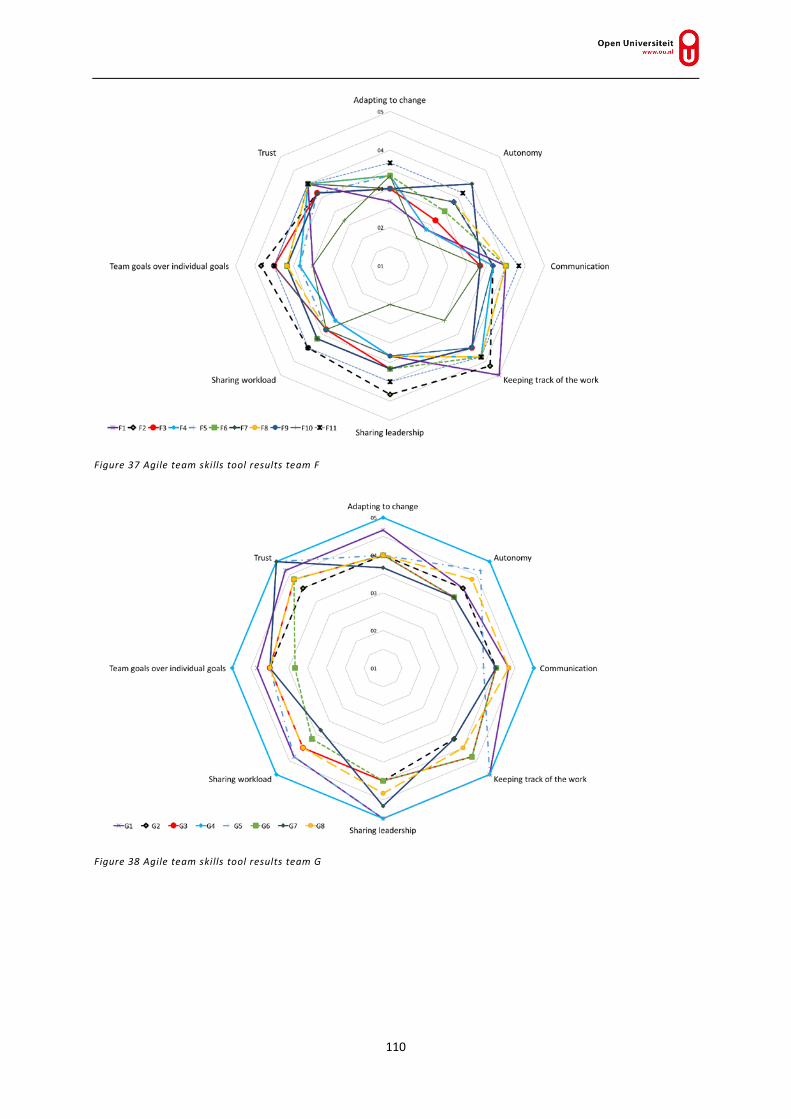
110
Figure 37 Agile team skills tool results team F
Figure 38 Agile team skills tool results team G

111
APPENDIX Y PERFECTION GAME; RE SULTS OF SURVE Y AFTE R RE TROSPECTIVE V1.21
Results of ‘improve to make perfect’ question:
-Time keeping is of the essence -Meer handvatten om de onder werpen op da radar concrete te maken. Moeite om vanuit de radar concrete verbeterpunten te halen -Maybe focus on one or two things to improve on instead of everything -It’s hard to link points that came up in the retrospective to Agile skills model and get the idea how we are doing -We spent too much time on some points. Nobody facilitated the retrospective to move on. We just fast-forwarded to the last part -More of a discussion about SMART when coming up with goals for the next sprint -Maybe more description about how we should react to the graph (if there are too many differences / similarities in an area) -Was already good enough -While it was fun to visualise, I believe that the relation between the questions and their represented dimensions was not concrete enough for me to warrant real conclusions -Verschillen te klein om er echt iets mee te kunnen. Had leuker geweest als de verschillen megagroot waren -Tester present -Start with a discussion how to interpret and limit the subject before giving scores -More different answers -It is too abstract, not concrete enough -Model verduidelijken voordat je survey laat invullen -Vergelijk tov andere scores bij bedrijven. Hoe doen we het in verhouding? -What to do to improve the team feelings -Conclusies verzamelen en publiceren -Iets meer toelichting bij de vragen -Focus on reality—what is realistic to achieve -Neem andere zaken waarom een project goed/fout gaat ook mee -Talk more about how people feel about each other in the team -Nog meer to the point (korter) -Lets van een advies, cases uit de praktijk - Een tip voor uitbreiding is om de vragenlijst ook op de persoon te laten uitvoeren. Nu wordt er gevraagd naar de score voor het team, maar het lijkt me ook interessant om dit af te zetten tegen wat iedereen over zichzelf roept - I wouldn't change anything to make it better Results of ‘what I like about this retrospection’ question:
-Fantastisch handvat om een team te helpen een stap in de goede richting te zetten -Lets anders dan anders -Dat we breder hebben gesproken over team, proces, etc. -Op deze manier vallen we niet direct in details van een sprint maar bediscussiëren we zaken waar we anders niet over gesproken hadden -It was structured and gave some good insights -Mooie manier om een breed beeld te krijgen waar een/het team staat -I liked the figure that showed the team setup and who has what kind of personality -Insight into the team’s composition -Visual clues as to where we think alike and where we have different views about points -Focus for team to look at the visualisation rather than a random discussion -Detailed classification of the area that we are discussing makes the retrospective more structured and organized -Open mind, free talk, team spirit -It was fun to visualize the team spectrum of feelings / opinions -Ledereen was open

112
-Duidelijke tool -Open and constructive dialogs -Focus a retrospective more on the team over a longer period -It started a discussion among the team members on improving the team and coming up with ideas on improving the team -Teamwork komt eens heel expliciet aan de orde -Een stapje afstand nemen en over algeheel team functioneren spreken -Shows the current team feelings -Meetbaar -Opening -Geeft de situatie in het team wel goed weer -Uitgebreid -Betrokkenheid teamleden -Fun, clear, useful -The graphs -Het is weer eens wat anders (frisse wind) -Je bekijkt team / project uit ander standpunt, daardoor krijg je andere verbeterpunten -Open, rustig, positieve insteek -Het brengt je terug naar de basis van de team waarden in een Agile omgeving. In de dagelijkse gang van zaken wil je nog weleens "vergeten" waarom we zo werken en wat er van een team verwacht wordt. Ook voor meer ervaren teams is het belangrijk om af en toe stil te staan bij deze competenties. -I liked it because it focussed on the results of an effective Agile method. Not on the method itself.


![Agile V Model.ppt - RBCS, Inc · I’ll show you… The Agile V Model ... agile The Agile V Model ... Agile V Model.ppt [Compatibility Mode]](https://static.fdocuments.in/doc/165x107/5acdaca47f8b9a6a678dca0e/agile-v-modelppt-rbcs-inc-ll-show-you-the-agile-v-model-agile-the-agile.jpg)