How to improve sales promotion effectiveness: the - DSpace Home
94
Corso di Laurea magistrale (ordinamento ex D.M. 270/2004) in Marketing e Comunicazione Tesi di Laurea How to improve sales promotion effectiveness: the role of age and product category Relatore Ch. Prof. Vladi Finotto Laureando Carolina Conte Matricola 816347 Anno Accademico 2011 / 2012
Transcript of How to improve sales promotion effectiveness: the - DSpace Home
Corso di Laurea magistrale (ordinamento ex D.M. 270/2004) in Marketing e Comunicazione Tesi di Laurea How to improve sales promotion effectiveness: the role of age and product category
Relatore Ch. Prof. Vladi Finotto Laureando Carolina Conte Matricola 816347 Anno Accademico 2011 / 2012

0
TABLE OF CONTENTS
I. ABSTRACT 1
II. INTRODUCTION 2
III. LITERATURE REVIEW: 3
1 The world of sales promotions 3
1.1 Contextualisation 3
1.2 Previous studies on sales promotions 5
1.3 Definition of sales promotions 6
1.4 Different typologies of promotions 9
1.5 Objectives of sales promotions 21
1.6 Limitation and risks of sales promotions 25
1.7 The consumers perception of price and of different promotional frames 29
1.8 How to measure the promotion effectiveness 33
2 The cosmetic sector 39
2.1 A short presentation of this market 39
2.2 Luxury and non-‐luxury products 41
2.3 Two different targets for two different consumer behaviours 45
IV. THE PROBLEMATIC AND THE RESEARCH METHODOLOGY 48
3 The problematic 48
4 Objectives of the investigation 49
5 The pre-‐test 51
6 The methodology 55
6.1 The sample 55
6.2 The research methodology 57
6.3 Design and procedure 58
V. RESULTS 60
VI. DISCUSSION AND MANAGERIAL IMPLICATIONS 76
VII. LIMITATIONS OF THE RESEARCH 80
VIII. FURTHER RESEARCHES 82
IX. BIBLIOGRAPHY 84
X. ANNEXES 87
1
ABSTRACT Recently the sales promotions have achieved a more important role within the marketing
sector, deserving even more marketing budget and augmenting the range of promotional
typologies. A real switch from advertising toward sales promotions has occurred and from
this phenomenon new issues arise. One of these focuses on how to improve sales promotion
effectiveness. This research paper aim to look for new ways to improve how consumers
perceive different sales promotional frames, in particular it focuses on two main variables.
The research problematic developed in the following thesis aim to discover whether some
the way different sales promotional frames appear to be more likely to influence costumers.
The outcomes indicate that marketers should take into account these two variables while
planning a sales promotional campaign, because thanks to it they may improve the
effectiveness of this strategy.
Key words: sales promotion, effectiveness, promotional frame, cosmetic sector
RESUMÉ
Récemment les promotions sur les ventes ont obtenu un rôle plus important dans le
domaine du marketing, méritent une plus grosse partie du budget marketing et augmentant
la variété de typologies de promotions. Un vrai changement de la publicité à les promotions
ifié et à partir de ce phénomène des nouveaux problèmes se sont
manifestés. Un parmi ces problèmes se concentre sur la façon par laquelle améliorer
es promotions sur les ventes. Le but de ce mémoire de recherche est de
rechercher nouveaux méthodes pour améliorer la façon dans laquelle les consommateurs
percevant les diffèrent typologies de promotions, en particulier il se concentre sur deux
variables.
La problématique développée dans ce mémoire atteinte à découvrir s ils existent des
dans laquelle les consommateurs sont plus favorables à être influencés par ces promotions.
Les résultats indiquent que les promoteurs des marques doivent considérer ces deux
variables quand il planifient des campagnes de promotions des ventes, parce que grâce à ça
Mots clés : promotions, efficacité, typologies de promotions, secteur cosmétique

2
I. INTRODUCTION
In any business, managers are always looking for new ways to improve the efficiency of
the campaigns marketing strategy. Whether in the past
advertising has always been considered the most effective marketing tool to increase the
success of a brand, in recent years an important phenomenon has occurred. Advertising
indeed, has lost is leading role due to a significant switching toward sales promotions.
Several economic, social and environmental factors have contributed in changing the
current society. Marketing activities are deeply related and ground their roots within the
society, it derives therefore that the more these are updated with social changes, the more
these might be effective. People change their needs and their perception of stimuli
according to the context that surround them, and it comes directly from here the evident
necessity of concreteness and short-‐term orientation, that characterize sales promotion
rather than advertising. This is the reason why marketing strategies have been adapted to
this new trend and switched from advertising toward sales promotions.
Sales promotions focus on having a direct impact on consumers and influencing their
purchase behavior. They are more short-‐term oriented, even if some of them aim for having
-‐term effect.
Since the begin of their use, a plenty of different typologies has been developed and
nowadays it becomes more and more challenging for marketers to choose among them, the
more effective, according to a particular context or the particular target they want to reach.
The purpose of the research developed in this thesis is thus to be a useful tool for
marketers, when they plan sales promotions activities, and solve in part the problem of
which sales promotional frame should be chosen among the huge existent variety. The
objective is to identify whether a relation exists between a demographical characteristic
(age) of consumers and the way they perceive different price frames. In other words, which
promotional frame is more likely to influence their purchase decision? And, moreover, is this
relation influenced by the product category they are considering to buy?

3
II. LITERATURE REVIEW
1. The world of sales promotions
In the following section, the concept of sales promotion will be deeply explored. At first the
context in which sales promotions developed will be described as well as previous studies
that focus upon this field. It has been then retained necessary, to provide readers a
definition and a classification of sales promotions, including the objectives and the
limitations that these involve.
The last part relates more with the objectives
perception of different promotional frames and on the concept of effectiveness.
1.1 Contextualization
In many industries, a significant percentage of the marketing mix budget is allocated to
promotions. Since the end of the last century, a quarter of marketing managers budget for
advertising has been devoted to consumer promotions and this amount has constantly
increased (Folkes and Wheat, 1995). Whereas in the past, advertising appeared to be the
most effective strategy to reach new consumer and to push them into purchasing, today it
has been noticed a switch of emphasis by marketers away advertising and toward sales
promotions.
This change has been pushed by several factors regarding the consumer, the distribution
side, the competitive context:
The purchasing power of consumers has decreased in recent years and now they
appear to be more price sensitive and more reactive to promotional activities which
appear to be real, concrete and often immediate;
The rising costs of advertising caused a decline in the use of mass media promotion
which became also less effective;
Distributors, who are more concentrated and powerful, ask producers for more
promotions in order to build store traffic;
Gaining market share is always more challenging due to a strong competitive context
and implementing a sales promotion strategy gives a greater visibility to the brand
and differentiates it from concurrent;

4
The decline of sales volume pushes marketing managers to be more concerned about
short-‐term results and sales promotions give the possibility to generate quick sales
results;
Sales promotions appear to be more flexible and easier to carry out or modify rather
than advertising campaigns;
Consumers in a period of economic crises show more interest toward concrete
solutions, this is why they respond favorably to money-‐saving opportunity and they
do not trust t ;
Advertising suffers of a lack of reliability from consumers probably due to an
excessive use of it during the last few years;
Consumers show a reduced brand loyalty due to an overuse of advertising, which
causes an augmentation of the switching phenomenon among different brands and
products.
In the current period of economic crises, sales promotions are chosen among other forms of
marketing communication to be short-‐term oriented and, therefore, to provide return on
investment very rapidly (Yeshin, 2006). Moreover, compared with other communication
tools, they appear to be easy to implement and less expensive. Another characteristic, that
explains why sales promotions are preferred by marketers, is that their economic effects are
directly measurable in terms of increases in sales volume; in other words, monetary gain
results for producers and for retailers. These concrete outcomes are particularly important
at times of economic instability, when consumers are more price sensitive and markets are
mature.
From the consumer perspective, they show a strong price-‐orientation that influences
their purchases to the point of comparing different products on the basis of prices instead of
simply buying a particular brand or product. Moreover, promotions produce a sense of
urgency to buyers, who are induced to purchase a product when the promotion is going on
or the deal is available (Yeshin, 2006). The effect of this evident new price-‐orientation
showed by shoppers, es
continuously in

5
On the other side, the retailing environment appears to be increasingly competitive
and sales promotions are used by retailers and producers to differentiate themselves from
competitors within a store. For this reason they employ a variety of ingenious promotional
strategies that also have the objective of attracting consumers and influencing their
purchase intentions. In order to better understand the role played by sales promotions
within a marketing strategy, a broad definition and its analysis is furtherer provided in this
thesis.
Table 1: Responsible factors of the switch from advertising to sales promotions
FROM ADVERTISING TO SALES PROMOTIONS
CONSUMERS COMPANIES/RETAILERS
Reduced purchase budget Rising costs of advertising
Intangibility of advertising Necessity to build store traffic
Lack of reliability of advertising messages Competitive context
Reduced brand loyalty Short term orientation
Easy and flexibility of sales promotions
1.2 Previous studies on sales promotions
How different sales promotional frames are differently perceived by consumers and
how these influence their purchase behavior has been largely explored in previous studies.
The research developed in this thesis make a new contribute to previous studies through the
insertion of new variables such as: target age and product differentiation. This permit to
make more precise distinctions about which promotional frame is more effective in a
specific context. Through these results sellers might have more awareness on how to choose
among the existent variety of promotional frames, and they might be able to better address
a particular promotion to a specific target, being consequently more effective in terms of
sales volume achieved.

6
From the available literature it results that there is no prior studies that explore the topic of
promotion effectiveness in relation with the cosmetic sector, previous researches mainly
concentrated on groceries, supermarket, thus in dairy products (S. Li, Y. Sun and Y. Wang
2007).
In a closer field to the one of cosmetics, Sonal K and Preeta V. (2003) conducted a research
in order to discover how promotions framed in absolute and relative terms are perceived by
consumers. They demonstrated that in toilet soap category, premiums and price-‐offs were
the two most applied promotions, but in terms of effectiveness, the second one achieved a
greater appreciations toward consumers.
Moreover, a great number of the studies conducted since now, have mainly analysed the
relationship between the type of promotion used to increase the sales of a specific product
and the related quality perception felt by the consumer (Zeithaml, 1988). The price-‐quality
ratio has been so deeply explored because perceived quality has always been considered
one of the most important factor to build long-‐term buyer-‐seller relationships and, in this
. Loyalty programs are as well to be
considered as sales promotions, in the sense that they offer added value over the product,
but, differently from the other typologies that will be discussed subsequently, they are long-‐
term oriented, their main goal is indeed to push consumers into repeating purchasing
behaviour.
However, the research developed in this thesis focuses on the short term effectiveness of
different promotional frames typologies. The intention is thus to measure consumer
reactions according to the way a promotion is framed at the very moment of purchasing, in
other word, how their buying process is influenced.
1.3 Definition of sales promotions
In the literature it is almost impossible to find a unique designation of sales promotion;
thus, in order not to miss any important characteristic, several definitions are proposed
followed by a synthesis of the main attributes highlighted by each.
Blattberg and Neslin (1990, p.3) define sales promotion as an action-‐oriented marketing
event whose purpose is to have .

7
is a range of tactical marketing techniques designed within a strategic marketing frame add
value to a produc
Kotler P. (1988, p.645
incentive tools, mostly short-‐term, designed to stimulate quicker and/or greater purchase of
From these definitions it can be noticed that the heart of sales promotion is represented by
the value that it adds to a product or a service. This value may be different according to
different types of promotions: an extra free product, money saving, a gift or a sample, the
opportunity to win a prize etc. thus in general by something new, added to the usual product
that consumers would not get under normal circumstances. The added value therefore
provides an extra incentive to buy, an inducement that changes temporarily the perception
of the price and the value of the product. It is supposed to provide a direct impact on
behavior, a sort of acceleration to the selling process that pushes the consumer to a faster
purchase.
The aforementioned definitions view sales promotions as well-‐framed
tec that they are not unplanned activities carried out by the company at
the very last moment with the only aim of increasing sales volume but, by contrast, they are
completely part of the marketing strategy and designed to be integrated with the
communication mix.
Sales promotions offer consumers several benefits. Initially, the most important
benefit offered to consumers was considered the monetary saving related to the deal
(Blattberg and Neslin, 1990), however furtherer studies demonstrated the importance of
consider other benefits, such as: entertainment, quality, value expression, convenience etc.
All the aforementioned benefits have been later classified in utilitarian and hedonic
benefits1. Utilitarian benefits are defined as functional and tangible, they therefore allow
consumers to maximize their purchasing utility and efficiency. Generally, utilitarian benefits
include: monetary saving, convenience and quality (Kwok and Uncles, 2002). On the other
side, hedonic benefits are intangible and more experiential, usually related with fun and
pleasure and these include: entertainment, value expression and exploration.
1 See table 3
8
As it will be explained in section 1.4, different typologies of sales promotions offer different
benefits: usually utilitarian benefits are provided by monetary promotions, while non-‐
monetary promotions offer more hedonic benefits. However, some typologies of
promotions may offe
The number of different sales promotions that marketers can adopt to reach consumers
(coupons, rebates, sales, discounts, special displays, trade deals, premium, sweepstakes,
is huge and what it is interesting is also how marketing managers choose
among these types of promotions. Obviously, in the choice between a promotional frame or
another they take into account lots of considerations, both company oriented (e.g. handling
costs) and consumer oriented. Hereafter the issue of framing will be defined and then
Several previous researches have already demonstrated the effects that different frames
cess. Various frames of the same promotion might be
differently perceived by consumers, who consequently might take opposite decisions.
people reacted to the same situation, when this was presented in a positive or in a negative
frame. When the problem was presented positively, its benefits were emphasized, contrarily
when it was negatively framed its risks were underlined. The results showed that people
react in two opposite ways when presented to one or the other frame, according therefore
with the prospect theory (Thaler, 1985)2.
How is this related to sales promotions? The way a person perceives and internalizes an
external stimulus is in part related with how this is framed and in part with the habits, norms
and personal characteristics of the person. Considering the price of a product as a stimulus
in the purchase process, the way it is framed is fundamental to determine the consumer
behavior. Even if the main objective of manufacturers or retailers in implementing a sales
promotion campaign is to communicate a superior value of the deal, in order to accelerate
e process, how much they increase the money amount of the deal is not
communicate a price and, previous studies proved that its framing can significantly change
the transaction value perceived by a consumer (Gamliel and Herstein, 2011). People thus 2 See section 1.7 for more details

9
-‐
variables, and in the case of sales promotions these include semantic cues of the price.
These considerations well-‐explain why framing is considered such an important issue in
planning a sales promotional campaign.
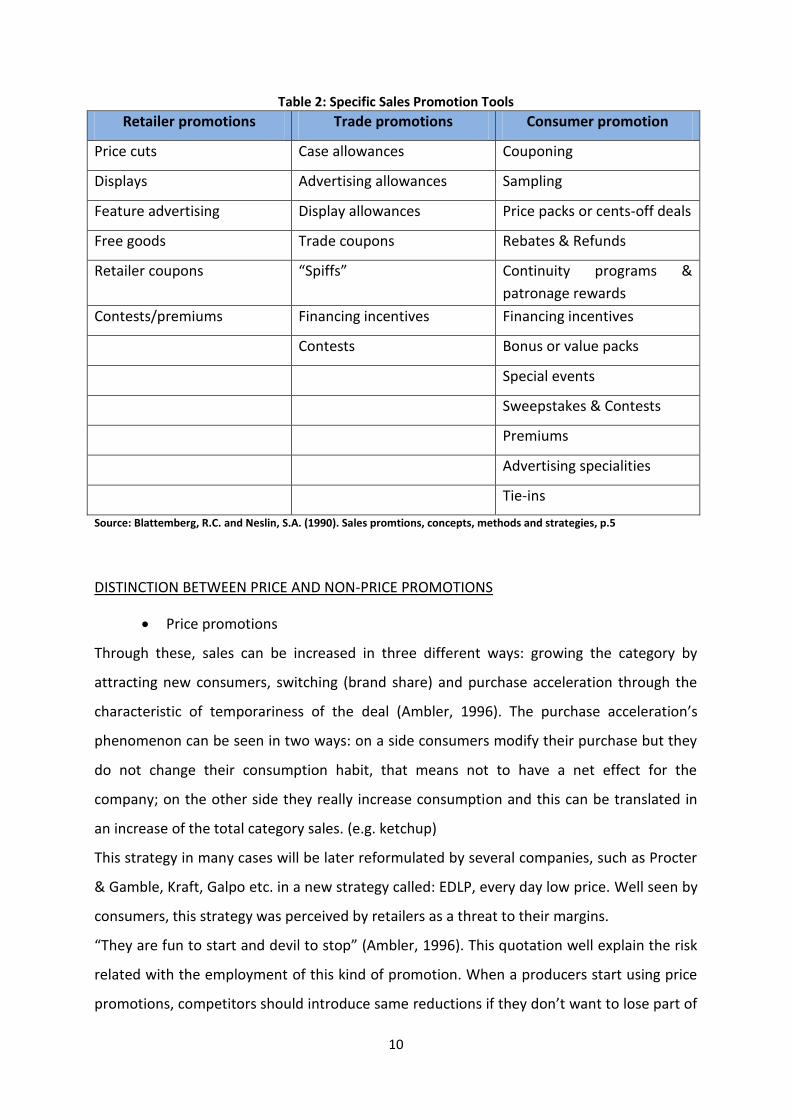
1.4 Different typologies of promotions
Three main categories of sales promotions can be defined according to the person who plans
them, and the target it is addressed to: retailer promotions, trade promotions and consumer
promotions (Table 2). Each category includes several typologies of promotions which will be
further described and analysed:
1. manufacturer addresses directly to
the consumer. This is the larger and most known category among the three and it is
upon it that this thesis is focused;
2.
without the influence of the manufacturer;
3.
and Neslin, 1990).
The following table does not claim to be exhaustive for each of the three categories, but
provides however a wide range of promotions for each of the three categories, however the
that are the central topic of this thesis.
Analysing each of the sales promotional frame presented in the Table 2 would be extremely
is provided only the description of consumer promotions.
Before the aforementioned classification, it has been included a distinction between price
and non-‐price-‐promotion. This two main categories include all the others that will be
presented furtherer and might be helpful to understand which objectives each promotional
frame aim for.
10
Table 2: Specific Sales Promotion Tools Retailer promotions Trade promotions Consumer promotion
Price cuts Case allowances Couponing
Displays Advertising allowances Sampling
Feature advertising Display allowances Price packs or cents-‐off deals
Free goods Trade coupons Rebates & Refunds
Retailer coupons Continuity programs & patronage rewards
Contests/premiums Financing incentives Financing incentives
Contests Bonus or value packs
Special events
Sweepstakes & Contests
Premiums
Advertising specialities
Tie-‐ins
Source: Blattemberg, R.C. and Neslin, S.A. (1990). Sales promtions, concepts, methods and strategies, p.5
DISTINCTION BETWEEN PRICE AND NON-‐PRICE PROMOTIONS
Price promotions
Through these, sales can be increased in three different ways: growing the category by
attracting new consumers, switching (brand share) and purchase acceleration through the
characteristic of temporariness of the deal (Ambler, 1996).
phenomenon can be seen in two ways: on a side consumers modify their purchase but they
do not change their consumption habit, that means not to have a net effect for the
company; on the other side they really increase consumption and this can be translated in
an increase of the total category sales. (e.g. ketchup)
This strategy in many cases will be later reformulated by several companies, such as Procter
& Gamble, Kraft, Galpo etc. in a new strategy called: EDLP, every day low price. Well seen by
consumers, this strategy was perceived by retailers as a threat to their margins.
1996). This quotation well explain the risk
related with the employment of this kind of promotion. When a producers start using price
promotions, competitors should introduce same

11
the market, in other words they all have to adequate not to lose money. If on a side, to
adequate is imperative, to stop is almost impossible. Indeed, the first player who will
interrupt a price promotion will quite for sure lose part of the market as well as the one who
Previous studies demonstrated that monetary promotions
-‐monetary promotions to be positively perceived by
consumers (Campbell and Diamond, 1990) and, moreover, price promotions provide more
utilitarian benefits and for this reason they appear to be more effective for utilitarian
products;
Non-‐price promotions
These have the purpose of adding value to the brand through the use of any kind of tool that
(Ambler, 1996). NPP can assume countless shapes that stand out for originality, fun, fashion
goal is to communicate the positioning and a reason to purchase in a different way, in a way
that can easily be kept in mind by consumers. Contrary to price promotions, these provide
more hedonic benefits, and are therefore more efficient for hedonic products;
CLASSIFICATION OF SALES PROMOTIONS
Coupons
evice that provides cents-‐off savings to consumers upon its
Coupons can be distributed through Neslin, 1990):
-‐ direct-‐mail, coupons are sent directly to consumers by the manufacturer or by other
services and each mail can contain more than one coupon;
-‐ retailer-‐distributed coupons, this vehicle allow the manufacturer and the retailer to
distribute coupons directly in the store handy or through a coupon-‐dispensing
machines;
-‐ media-‐distributed, these coupons are inserted in newspapers or magazines, usually
in a separate page, section or supplements;
12
-‐ package, here the coupons can be offered in different ways. First of all, it might be
inside or outside the package, so visible or not to consumers. Then it might be used
for a subsequent purchase or it might be instantly redeemable, the timing of the
promotion might have a different impact on consumers and might be the reason that
accelerates the purchase or not; then coupons might also be referred to another
brand or product of the same manufacturer or a different one.
Besides the vehicle through which coupons are distributed another important characteristic
is their expiration date. This is the day until which the coupon should be redeemed,
otherwise it loose its validity. The expiration date might play a different impact on
consumers according to the product category in which the coupon is used. Coupons applied
to products with a low purchase frequency should therefore have a longer expiration date
rather than coupons of high purchase frequency products.
Frequently the main goal in using this promotion is to get the consumer back in the same
store or chain to purchase one more time. In the long term the manufacturer tries through
this strategy to maintain repeat consumption rates of frequent brand clients, or increase
those for new triers or infrequent consumers.
Coupons appear to be really useful both to promote early trial of new products or to attract
brand switchers. New triers are consumers who have never bought that product before and
who should be convinced thanks to an added value to the product to purchase it. For them
the perceived risk is particularly relevant because of the uncertainty related with a product
that they have never been tried before, so in a certain way, the presence of the coupon
provides a concrete advantage for the consumers and compensate the mentioned
uncertainty.
Brand switchers are those people who are not loyal to a specific brand or product but whose
purchases are influenced by several variables. Coupons indeed provide a powerful incentive
to switch from a brand to another. Here, the perceived transaction utility (Munger and
Grewal, 2001; Blattberg and Neslin, 1990) is higher, thanks to the presence of a concrete
monetary saving, that acts as an added value. This economic benefit plays thus an important
role inducing the consumer to switch.
In general, coupons appear to increase the product consumption and thus the sales volume.
This thanks to a greater brand awareness, the acquisition of new consumers, the attraction

13
of brand switchers and the increase of the purchase frequency or purchase quantity of loyal
consumers.
strategy consists in a thin balance between the amount of saving offered by
the promotion and the rate of redemption of these. Obviously, people will return more
frequently coupons with a high monetary value. The challenge in using this typology of
promotion is to offer an amount of money that is perceived enough interesting by
consumers but, at the same time, remunerative for the producer that carries it on.
Manufacturers or retailers have to afford two typologies of costs while putting in practise a
mpaign: distribution and redemption costs.
Distribution costs include all the expenses of making coupons available to clients and so they
vary according to the kind of vehicle chosen. Redemption costs depend on the monetary
amount that manufacturers must give back to consumers when they redeem their coupons.
retailers to have an increase of sales volume enough important to compensate the costs
they have to afford to put it in practice.
Sometimes, coupons are considered expensive to administer and wasteful, due to the fact
decrease of the redemption rate is mainly due to the fact that consumers perceive this
promotion as a mass-‐anonymous strategy. This awareness pushes marketers to develop new
coupons strategies, they are therefore starting even more to conduct targeting coupons
campaigns. By this way, marketers are exploring new ways to reach consumers and to bring
coupons more down to a consumer-‐dimension instead of a market dimension.
For example, the use of text-‐messaging coupons has, in last years increased a lot, with an
evident positive reaction from consumers, especially from young people. Coupons appear
them;
Sampling
It consists in giving a gift at the moment of purchase, even if the final product has not been
bought. Sampling might also be
deliver an actual-‐ or trial-‐

14
Sometimes the objective is to persuade consumers to join the product and, by this way to
test down; in other occasions the goal is simply to make the
product positively perceived by consumers. Sampling appears to be quite expensive,
especially when it is combined with a price promotion.
According to Shimp (2003, p.489-‐490), the way samples can be distributed includes a variety
of methods:
-‐ Direct mail: consumers reached through this channel usually have been previously
targeted by demographic or geographic characteristics;
-‐ Newspapers and magazines: this method allow the manufacturer or retailer to reach
a larger target thanks to the high purchase rate and the high purchase frequency of
these products;
-‐ Door to door: reaching directly consumers at home provides some advantages thanks
to the possibility of having a closer relation and contact, in addiction it requires lower
costs than other channels;
-‐ On-‐ or in-‐pack sampling: here the sample might be visible from the exterior of the
package or it might be at the interior of it;
-‐ High-‐traffic location: this channel exploit the extremely big target that can be
reached in a specific place such as a shopping center, a theater, an airport, a forum or
in a special event;
-‐ In-‐store sampling: consumers are invited to a first trial while they are shopping, the
objective is to influence their purchase process, inducing them to buy;
-‐ Another possibility is to attach the sample to another product or sometimes mix
some of them to form a sample pack.
During the last few years a particular kind of sampling has developed: free software. People
are nowadays used to downlo
will appear as a cost for producers, the positive side of this new habit is that, after having
freely purchased software, consumers are happily willing to buy upgrades. This method is
widely u free download, persuade consumers
to know the product and to passionate to it and after they will gain from the interest of
people of knowing additional functions of the program.
As the most part of sales promotions, sampling asks the producer to be particularly carful
about the consistency between the promotion and the brand or the product. Planning the

15
strategy, marketers should always keep in mind that it serves as reinforcement of the
positioning, and that not every aspect of this can be measured, for example how the style of
the sampling is perceived by consumers;
Price packs or cents-‐off deals
In this case, the regular price of the product is temporally reduced and consumers will
receive a saving. This appear directly on the packaging of the product or on the label.
Generally the discount amount goes from 10 to 25 percent of the full price.
Retailers or manufacturers can achieve important advantages through the use of this
promotion. They can reward present users of the brand for their loyalty, they can induce
consumers to buy larger quantities of the promoted product exploiting the reduced price
and by this way they will reduce their assortment, they might be able to anticipate the
concurrence, they can establish a repeat purchase pattern after a first trial, they provide the
sales force with a great incentive to obtain their support.
Moreover price-‐offs push retailers to reduce the number of suppliers but to increase each
demanded volume, they can then facilitate the sale of products and minimize costs for the
supplier.
Price packs can be shaped mainly in two ways: few products packed together in order to
form a unique pack with a reduced price ( e.g. buy two, pay one) or two or more different
products of similar categories packed together and offered with a price discount ( e.g.
Shampoo and cream);
Cash refunds and rebates
Here the difference from coupons is that the price reduction occurs not directly in the store
producers who, then will give part of the purchase price back.
Even if these two promotions are often interchanged, they differ according to the product
they are related to. Refund usually is adopted to reduction for packaged goods, and rebate
for durable goods.
The characteristic of being delayed in time, nowadays affect negatively consumers. They
indeed are used to consider them as an hassle and sometimes they think that manufacturers
or retailers use them only when they are in a bad economic situation. Beside these
16
considerations, these promotion, whether appreciated by consumers, are particularly good
to reinforce brand loyalty and to make the package more appealing to consumers;
Loyalty schemes or continuity programs
Examples of these are electronic forms of credit collection. Compared with some of the
previous types of sales promotions they appear easier to control and closer to the idea of
promotion as a way to build a relationship with consumers. The fundamental difference
from coupons, for example, is that here the saving is personalized. In this way the
manufacturer is paying attention to each single purchaser instead of giving money away
Loyalty schemes can be performed in several different ways, their aim is to encourage
repeated purchase, especially when the products to which it is matched, provides a low
switching cost and a low and generic brand loyalty. These promotions are particularly used
in petrol stations, supermarkets, take-‐away restaurant, flight tickets etc.
The problem with loyalty schemes is that nowadays, they are over-‐used in numerous market
sector; the consumer indeed perceive less the value and the exclusivity of this kind of
promotion and start to think at them as to something superfluous that almost every
retailer/producer offers;
Patronage rewards
This promotion is addressed to people that regularly purchase or use a particular product.
The company give consumers the possibility to
to receive a bigger advantage according to the quantity collected. Well known is the example
of airlines companies, that allow clients to receive money discounts or even to have free
airlines trips the more they collect points for miles traveled. The same is nowadays
promoted by highway companies, train companies etc. Another typical example of this
strategy is also put into practice by pizza take-‐away restaurants, these usually attribute one
point for each purchased pizza, and by re-‐purchasing consumers can get a discount or a free
pizza;
17
Financing incentives
Manufacturers often offer them as a part of a promotion for the sale of their products or
services. The incentive can have different shapes, it might consists in cash, in a special prize
such as a car, a travel, a cruise etc.;
Value or bonus pack
t in place of, or sometimes in addit
, p.559).
The most relevant advantage that this kind of promotion carries out is that people like them.
The gain in terms of additional product quantity within the product container is perceived as
something tangible, readily apparent and more concrete rather that a percentage price
promotion.
A possible problem related with the use of this promotion is that the offered quantity of
product will be bought by regular consumers who will have purchased it even without the
promotion;
Special events
Events are used to engage potential consumers, to build brand awareness or to address the
company toward a particular market. This typology of promotion allow the manufacturer or
retailer to achieve several advantages. First of all, events have the strength of attracting an
homogeneous target that, whether interested in the brand, will permit to achieve great
impact on sales promotion. Events and sponsorships also allow to achieve some advantages
internally to the company. They indeed strengthen relations among employees and make
hese kind of promotions are relatively
easy to plan, even if they present some risks. Therefore it is really important the coherence
event;
Contest, sweepstakes and games
Sometimes consumers can be also attracted through the possibility to win cash, trips, goods.
18
winners are determined on the capability of solving a specific contest problem.
Nowadays, sweepstakes are generally much more preferred than contest, first of all because
they require less effort from customers, secondly because they involve a lower cost-‐related
risk. The advantages of sweepstakes are indeed to be simple to create and to execute, and
relatively inexpensive (Shimp, 2003). In addition, they might be really useful to achieve
various objectives, such as:
-‐
-‐ Make a focus on the advertising
-‐ Encourage distribution and retailer stocking
-‐ Enhance sales-‐force excitement
-‐ Attract the attention of specific targets
The greatest efficiency of these promotions can be achieved when these are mixed with
other promotional tools, so that the final result can be expanded.
This strategy allow producers/retailers to offer more expensive, desirable and valuable
Not to reduce the target would cause high costs for the company and probably the only
alternative would be switching to other kinds of prizes, less expensive, more closer to some
of the previous mentioned strategies.
The importance of the sales force in this situation is huge, it has indeed to involve people,
make them dream the chance to win and attract them by showing the possibility of a real
prize;
Premiums
Premiums are really similar to samples, they indeed consist in every kind of good that can be
offered for free or at a very low price. However these are distributed, their objective is to
stimulate the first trial of a product or the re-‐purchase. The impact of this strategy is quite
Premiums can be offered through several forms (Shimp, 2003):

19
-‐ Free-‐in-‐the mail premiums: submitting a mandatory number of proofs of purchase,
consumers get a premium from the retailer or manufacturer, this method in
particular encourage repeat-‐purchase behaviour;
-‐ In-‐, on-‐, and near pack premiums: here the premium can be more or less visible to
consumers and so it can differently tempt them;
-‐ Self-‐liquidating premiums: this method it is also called costs-‐free because the cost of
the premium is paid by consumers through a stipulated number of purchase.
In particular, this strategy has shown great results whether used in kids-‐product categories.
Often for example Kellogg cereals contain, within their packaging, little toys that stimulate
part of a bigger group to
collect. Children, as many recent research demonstrated, influence more and more their
parents purchases, and inducing them to collect items means, obviously, stimulate their
parents in re-‐purchasing.
Unfortunately, it is important to remind that the in-‐pack promotion needs high costs to be
the size, the smell, the materials, the toxicity and the protection in order to respect the
hygienic standards (Brassington and Pettitt, 2006). In the case the gift is attached to the
packaging, limitations are concretely reduced.
On a superficial base, attached premiums should be more effective in terms of impact on
consumers, because they are immediately visible and tangible and, by this way, they
influence more their purchase decisions;
Advertising specialties (promotional products)
These could be included in the previous category due to similarities between their
characteristics, but they can appear in such a number of different shapes that it is better to
analyze them a part and more specifically.
This category includes every kind of good that can bring on his surface the name, the logo,
the picture or the message of a brand or of a product. These items can be given to
consumers in several ways (personally, door-‐to-‐door etc.) and in different situations (during
special event, in sponsored events, in the shop etc.).
T-‐shirt, stickers, pens, cups, hats, calendars, mouse pads, shopping bags, golf balls etc. are
only some of the items often used by marketers as a gift for consumers. This strategy has

20
proved to be really effective, especially because it causes great brand recognition and recall
and, as consequent, marketers spend always more money on this. The strength of this
promotional product is also that the more they are used in everyday life the more the brand
will be recognized and recalled;
Tie-‐In promotions
Especially during a period of economic crises, this method allow manufacturers or retailers
to reduce costs of a single promotion through the agglomeration of some of these. Tie-‐ins
-‐
because each single costs is shared among different products or different brands.
This promotion can have two main forms:
-‐ Intra-‐company pooling, when the different promotions refer to brand or product of
the same company;
-‐ Inter-‐company tie-‐ins, when the goods (products or services) or brands involved
belong to different companies, which collaborate with each other and are not in
direct competition.
Obviously the second form implies more risks. It requires definitely more collaboration
between the two organizations, that means more time to launch the program.
Moreover, it might causes some creative conflicts due to the fact that the two partners
might interpret differently the promotion and might be interested in achieving different
goals. The complementarity of the two companies is indeed essential for a good
implementation of the promotional strategy, and their images should reinforce each
other.

21
Table 3: Summary of the main characteristics of consumer promotions
Consumer
promotion
Delayed or immediate
benefit?
Utilitarian or
hedonic benefit?
Couponing Trial impact/ customer holding
Immediate Utilitarian
Sampling Trial impact Immediate Hedonic
Price packs Customer holding/ trial
impact
Immediate Utilitarian
Refunds and
rebates
Customers holding Delayed (proof of
purchase)
Utilitarian
Continuity
programs &
patronage rewards
Customer holding Delayed Both
Financing
incentives
Customer holding Delayed Hedonic
Bonus or value
packs
Customer holding Immediate Utilitarian
Special events Image reinforcement Delayed Hedonic
Sweepstakes &
contests
Image reinforcement Delayed Hedonic
Premiums Customer holding/ image
reinforcement
both utilitarian
Advertising
specialities
Image reinforcement Immediate hedonic
Tie-‐ins Image reinforcement immediate utilitarian
In the next section, the various objectives that can be achieved by an appropriate use of a
sales promotional campaign will be described.
1.5 Objectives of sales promotions
Why do marketing managers show such a great interest in using sales promotions?

22
As aforementioned, sales promotions has increased mainly in recent years due to
occurred changes in the economical context. Many businesses nowadays suffer from a
monetary instability, and the use of sales promotions enable them to answer a precise
necessity: gaining quickly economical results. This characteristic, known as short-‐time
orientation, is the proof of an important change in marketing strategies. The previous
marketing campaigns were overall developed in order to build a long-‐term relationship with
consumers and to make them re-‐purchase. The scope of traditional advertising was indeed
to encourage loyalty between buyers and sellers. Nowadays, the economic situation
attribute even more importance to concrete and monetary outcomes, which is a reason why
the short-‐term orientation of promotions is preferred, they indeed provide a motivation to
buy it now . Despite this consideration, there are still some sales promotion that can be
considered loyalty-‐oriented, such as frequent flyers programs, smart cards, etc. (Brassington
and Pettitt, 2006).
It appears that the so wide use of sales promotions is mainly related with the fact that these
are the most effective way to increase sales (Blattberg, Briesh, and Fox, 1995). But actually
this is only the most tangible, immediate and therefore attractive result in using it. Of equal
interest is the way promotional campaigns can be improved, for examples by the use
different frames typologies (see section 1.4), and this issue is still matter of study. Sales
promotions, whether well-‐framed, bring advantages for both retailers and producers.
The main goal for both categories (retailers and producers) in using these strategies is
to communicate a superior deal value to shoppers and, in so doing, accelerate the purchase
decision. Between perception of the deal and the purchase decision, what is
modified by a well-‐framed promotion is the transaction value or transaction utility of the
product they are considering to buy. Munger and Grenwal (2001) assert that the transaction
utility is derived from comparing the actual selling price of a product to the expected fair
price;
Retailers can through sales promotions increase store traffic (Blattberg, Briesh, and
Fox, 1995). For example, people who are not used to visit a particular store could be
attracted by money-‐off coupons delivered directly to their home postbox or printed in the

23
local newspaper. These are examples of effective tools to reach new segments and to push
consumers into different stores from those in which they usually purchase.
Over the great advantage of reaching new targets, sales promotions, give the
possibility to discover specific sub-‐groups of consumers within bigger target. Through
coupons, small competitions, premiums etc. personal data of consumers can be collected
and then analyzed, in order to meet better their needs in the long-‐term and build a loyal
relationship with them.
Promotions also increase the frequency and the amount of purchases. Even if
sales promotion make them feel the pressure of a temporary deal that could not be still
available at the moment of the next purchase. In this way they are induced to accelerate or
anticipate the purchase not to lose the added value that the deal offers.
A direct consequence of the previous advantage is the augmentation of the store
loyalty by consumers, this happens especially in supermarkets. Even if sometimes this loyalty
-‐prone nature of consumers.
The modification of the sales rate provides another positive effect: it modifies stocks
of an existing product. Two opposite situations are possible:
1. First, promotions are employed to reduce stocks, through the reduction of price, the
volume of sales is supposed to augment and thus reserves will be reduced;
2. Second proposing a promotion to retailers can induce them to purchase a greater
quantity of the product to benefit from the temporary deal.
It appears also as an effective way for producers to face seasonal demand of a product and
for retailers to handle fluctuations of sales volume (Brassington and Pettitt, 2006).
Promotions, moreover, allow small producers or new ones to compete against big
companies that possess larger advertising budgets. Small companies indeed are often not
able to plan and put in practice advertising campaigns, mainly due to the high costs that the
use of communication channels requires; but through a sales promotion campaign they
might obtain an increase of the sales volume incurring lower costs.
Through sales promotion,
which provides greater prominence for the product. Moreover, the retailer could be
conveyed to enrich the store with some temporary displays, advertising features etc., which
add a sort of excitement in consumers.
24
Sales promotions showed to be an effective way of motivation for the sales force
(Yeshin, 2006), both if this is within the company or directly in the space of the retailer. The
sales force is a key element to achieve specific sales volumes and should be properly
motivated trough specific incentives. Almost the same effect may be reached on the
intermediaries side, they also need an appropriate motivation to achieve the desired
performance.
In conclusion, sales promotion should be considered a proper tool to be competitive,
to remain on the store shelves. Products or brands that do not compete with others are
destined to disappear from shelves because they should offer at least what competitors
offer.
The aforementioned objectives widely illustrate the advantages of employing a sales
promotion strategy within the marketing plan of both retailer and producer. Most of the
time these advantages also coincide with the objectives the these two categories intend to
achieve when they approach such a strategy. Despite traits that retailers and producers have
in common in planning sales promotions, as Ambler (1996) explained, they play different
roles within this strategy.
The role of retailers is to sell stock quickly and efficiently to consumers. For this reason they
try to stimulate/accelerate a particular preference for
a brand rather than another. Therefore, they are not interested in adding value to a specific
brand, but they concern in selling everything not to have left-‐overs.
On the other side, producers concern most of all in building brand and in differentiating
themselves from competitors, which is obviously something different and far away from
sales promotions. These two different points of view well explain the fears among producers
of the even more growth of power of retailers (Ambler, 1996). Will this change encumber
the development and the birth of new brands? That is still a matter of discussion among
researchers.
The aforementioned considerations lead to the conclusion that what it is relevant in
is that both retailers and producers consider more important to find an
appropriate framing of promotions instead of, for example, changing the monetary amounts
of the deals.

25
Semantic factors on deal evaluation are thus determinant on its effectiveness. Previous
studies have demonstrated that even if the deal value is mathematically the same,
consumers are differently influenced by the way these are framed. A great part of the results
obtained by previous studies, which will be discussed in section 1.7, completely contradict
This principle states that the relation of preference should not depend on how the
promotion are framed (description invariance) neither on the method used to choose among
options (procedure invariance).
The post-‐purchase process has not been included in the current research, but, despite of
this, it should be clarified that the meaning of the monetary saving provided by the
promotion is different among the various way of framing and these considerations will affect
the price the consumer will be willing to pay when the product will be no longer offered with
a promotion.
1.6 Limitations and risks of sales promotions
After having widely illustrated the objectives of sales promotions and the relative
advantages that these are supposed to bring to retailers/producers, here further the
problems and the limitations are consequently investigated.
The characteristic of sales promotion to be completely assigned to obtain short-‐term results,
negatively affect their possibility to have a constructive impact in the long-‐term, especially
for what concerns the brand recall and brand loyalty (Blattberg, Briesh, and Fox, 1995). Even
if the research conducted in this thesis focuses on effectiveness of sales promotions in the
short period, it is really important, while planning a promotional campaign, to keep in mind
that long terms results cannot be completely replaced by immediate effects but they both
should be take into consideration by marketers.
Blattberg and
Neslin point out five possible limitations that could negatively affect sales promotions both
at the very moment of purchasing and when the promotion is over.
1. The major criticism done to sales promotions is indeed, the fact to be only focused
on the short term and moreover to provoke a negative affection of consumers
toward brands. Sales promotions therefore, induce shoppers to brand switching not
26
only in the very moment of purchasing but they also cause a loss in the loyalty that
people preserve to brands. Previous researches have proved that sales impact affect
sales only in the short-‐term and that most of the time, when the promotions is over,
sales rates come back to the same amount there was before this. This consideration
means that sales promotions fail in gaining new loyal consumers: the increase of
sales is possible due to the switching of consumers to the promoted product but that,
after the end of the campaign, will in the majority switch again into another brand.
Belonging to this point of view, consumers might appear opportunist in the way they
try to get the best accessible deal for their shopping, without caring about other
variable except for price.
The conclusion is that often, the impact on extra-‐consumers is something temporary,
rarely stimulates repeat purchases and so it will increase volume of purchasing in the
short-‐term but decrease brand loyalty in the future;
2. The use of sales promotions also cause an increase of category price sensitivity.
Consumers indeed get used to pay a strong attention on price more than on other
Sales promotions educate therefore buyers to be more price sensitive and the result
of this in the long-‐term are lower profits;
3.
effect: they indeed induce people to anticipate their purchases from a later period,
with the consequence for the retailer/producers of a decreasing of the sales volume.
When this behaviour belong to the retailers, it can cause serious problem for the
producers. If the retailer, for example, decides to buy the 100% of their merchandise
during the promotion period, the manufacturer is obliged to satisfy this demand in
order to get great volume but, on the other hand, he will stop the production after
extreme, this case well explain the risks related with forward buying. The problem is
not only for the manufacturer to adapt the production to the variable demand, but
also for the retailer, who, gaining by acquiring at a lower price, will be forced to
spend money to stock an overabundance of goods.
Very similar to this is the problem of diversion. Manufacturers, who operate in big
countries, such as United Stated, might offer different promotions in each country

27
travel to reach and buy in
the country where the best deal is offered, belonging to them, reducing the demand
in their market of origin; or, even more unpleasant, some retailers might buy big
quantities taking advantage of the sales promotion and then, sell these products a
second time to other retailers in other country with a price that allows them to gain a
little margins and allows the buyers to save money. This phenomenon is known as
grey market;
4.
quality image of promoted produ
perceptions of brand quality. They can also change their price expectations for this
specific brand and postpone their purchase in order to wait for promotions;
5. In the end, a risk in using repeatedly sales promotion stand in their characteristic to
be focused on short-‐term effectiveness. They could be indeed mortgaging in the
future, that means a reduction of the sales volume for the company, which might
lead the producers to carry on
promotion should therefore always integrated in a bigger marketing plan in order not
to forget both short-‐term and long-‐term objectives.
Marketers, before implementing a sales promotion campaign, should also pay attention to
other variables or other previous variations of price that could negatively affect the
credibility of the promotional strategy. As Chen, Shih-‐Fen S. Monroe, Kent B. Lou, Yung-‐
Chien (1998) demonstrated, there are in particular two tactics that could threaten the
credibility of the promotion:
-‐ to rise the normal price before the campaign;
-‐ to hide a permanent reduction of the price with a temporary price promotion.
In the first situation, consumers might become suspicious of a too large reduction and they
could notice an inflation of the regular price before the promotion. The promotion will not
appear credible and trustworthy.
In the second situation, when the discount appear bigger than usual consumer might think
that the promotion will be follow by a permanent price reduction.
These researches also proved that this frame of mind toward price reductions change with
the category of product taken into consideration. For example, the attitude of consumers
28
toward price reductions in high-‐level product is to perceive higher likelihood of inflation or
of permanent reduction when the discount is framed in absolute terms rather than in
percentage terms (Chen, Monroe and Lou, 1998).
In the following research, the distinction between these two categories of product, high-‐
level or luxury and low-‐level or non-‐luxury, has a central role. Consumers, indeed, from
previous researches (see section 1.7), show to perceive differently the same promotional
frame according to the product category which it belongs to. They will consequently behave
in different ways in their purchase decisions and the understanding of this mental process is
supposed to be helpful to marketers in the framing process to reach the desired target.
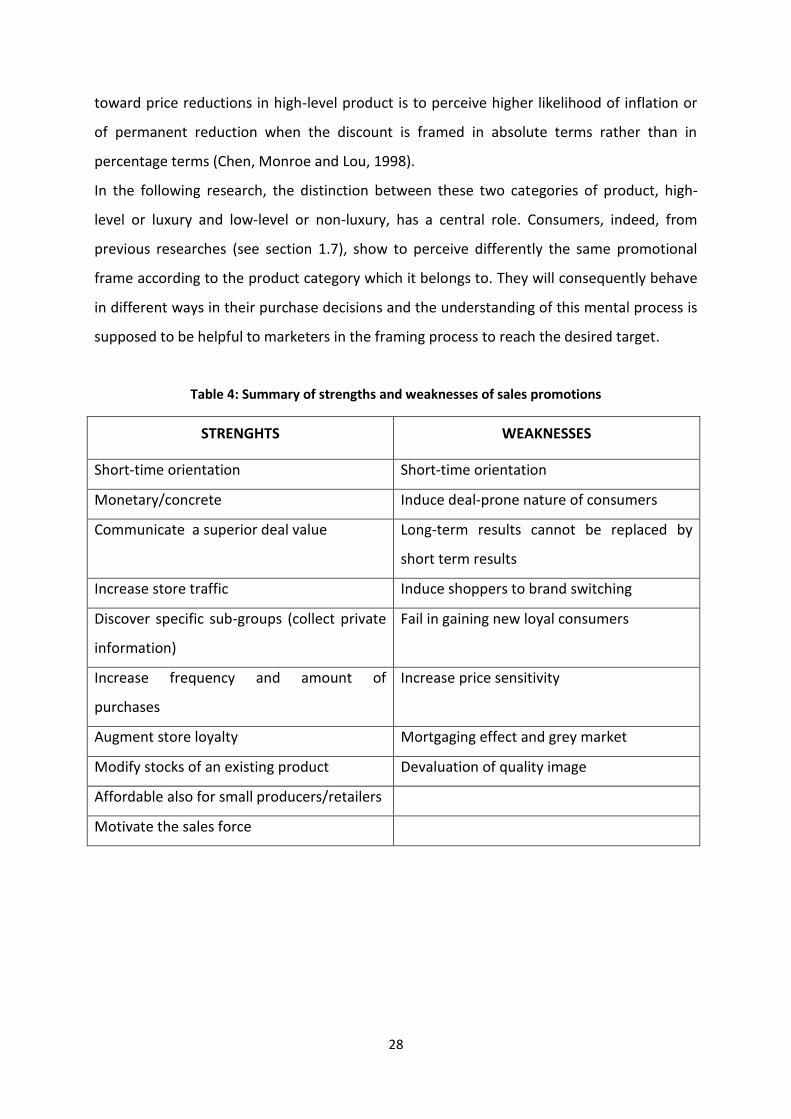
Table 4: Summary of strengths and weaknesses of sales promotions
STRENGHTS WEAKNESSES
Short-‐time orientation Short-‐time orientation
Monetary/concrete Induce deal-‐prone nature of consumers
Communicate a superior deal value Long-‐term results cannot be replaced by
short term results
Increase store traffic Induce shoppers to brand switching
Discover specific sub-‐groups (collect private
information)
Fail in gaining new loyal consumers
Increase frequency and amount of
purchases
Increase price sensitivity
Augment store loyalty Mortgaging effect and grey market
Modify stocks of an existing product Devaluation of quality image
Affordable also for small producers/retailers
Motivate the sales force
29
1.7 The consumer perception of price and of different promotional frames
In the following section the issue of promotional frames will be deeply analyzed, presenting
perception of the deal.
In several previous studies it has been demonstrated how the prediction of the
Several previous studies explored how consumers react to different typologies of sales
promotions, through the comparison of the effectiveness of two or more different sales
promotional frames within the same research. Moreover, previous researches also verified
that the nature of framing affects differently consumer perception and consequently
purchases, even when the deal is economically speaking the same (Sinha and Smith, 2000).
Pandelaere Mario and Briers Barbara (2011), starting with the assumption that
consumers prefer quantitative information rather than qualitative, explored the units effect
in options comparison. They demonstrated, on the stream of several psychological research,
that promotions with the same nominal value will affect consumer differently. Through a
field experiment, they verified that consumers focus on the number rather than the type of
units. This theo affirms that the dimension of the scale used to
tend
to associate bigger numbers with bigger quantities.
Previously the units effect had already been matter of study by several authors (K. Monroe,
S. Chen and JC Lou, 1998; D. Hardesty, W. Bearden 2003; D. DelVecchio, H. Krishnan and D.
Smith, 2007; S. Li, Y. Sun and Y. Wang 2007), who analysed how consumer react when they
are asked to choose between products whose price promotions are expressed in absolute or
relative terms ($ versus % off). Moreover, it has also been demonstrated the importance of
sales promotions in the long term. A promotional frame may also have a significant impact
on the price expectations in the future for the product to which it is applied. Percentage off
promotions lead in the future to higher price expectations than cents-‐off promotions (D.
DelVecchio, H. Krishnan and D. Smith, 2007).
30
The comparison between bonus packs and discounts (D. Hardesty and W. Bearden, 2003)
revealed that these two promotional frames are evaluated similarly by consumers when
these are applied to low benefit level, but, whether the benefit level is high price discounts
are preferred.
One more step has been done by I. Sinha and M. Smith (2004), they compared not only
three different typologies of sales promotions (percentage promotion, extra-‐product
promotion and a mixed promotion, a combination of the previous two) but they also put
them in relation with two other variables: stock up characteristic and price level. The
outcomes showed that percentage-‐off promotion was perceived by consumers as providing
the greatest transaction value.
Sometimes previous theories about consumers attitudes towards different sales
promotional frames, have been proved them wrong. This is the case of E. Gamliel and R.
Herstein (2011), who demonstrated that consumers are not significantly influenced by the
positive or negative frame of a sales promotion. This conclusion contradicts the findings
achieved by W. Diamond and A. Sanyal (1990), who on the contrary, proved that consumers
are less willing to purchase products offered in sales promotions, when these are presented
with a negative frame rather than a positive ones. The reason of this, belonging to their
study (1990), relies upon the meaning itself of the negative frame, it emphasises, indeed the
monetary loss associated with failing to purchase the product; on the other side the positive
frame emphasises the monetary gain associated with the purchase.
Thaler (1985) gave an analytical proof to this behavioural effect considering the prospect
theory (Tversky and Kahneman, 1981) holding
(risk-‐averse) over gains and convex (risk-‐seeking) in the loss domain. Belonging to his study,
this is the reason why people psychologically segregate multiple gains but integrate losses.
Coherently with these studies, Grewal et al. (1996) proved that for moderate price discount
($34.99 reduced to $24.99), buyers process data more expansively than for high or low price
discount levels, that is, an inverted U depiction of shoppers information processing (D. M.
Hardesty and W. O. Bearden, 2003).
These researches show that the problem in option comparison relies upon the
difficulty for consumer in counting the final price. In many case, people perceive percentage
off promotions as larger than equivalent cents-‐off promotions, but what appears to be

31
always preferred are certain outcomes; it means that if the percentage appear as an easy
calculation, the product with the relative discount will be chosen, otherwise if the count
appear too complicated, a certain and determined cents-‐off promotion will be preferred. In
other words, the effects of promotional frames on price expectation, and then on choice,
arise from the difficulty of processing percentage-‐off discounts, rather than when they are
easier to compute.
unit price model which can lead the consumer to different purchasing behaviour (D.
Diamond 1992). Differences has been highlighted
nominal (e.g.: extra product promotions presented in ounces) and price promotions. Some
people appear to be unwilling or unable to convert one in to the other; they often calculate
a medium-‐size promotion. This simplification could obviously lead them to overestimate the
nominal value of large promotion and underestimate the value of large promotion.
Credibility of different types of promotions has been considered (Blattberg and Neslin 1990)
as another issue in order to measure the relative effectiveness. They demonstrated that
coupons result as more credible than other type of price discounts mainly because they
make the discount very salient for consumers, who perceive to receive a better deal than the
marked price.
The following research differs from previous studies also in the choice of the
promotional frames among which consumers are asked to choose. It combines, as
alternatives to the full price, four monetary promotions, framed in terms of percentage
(percentage off), nominal value (cents-‐off), coupons and bundles (called price packs).
The insertion of the target age as a variable in this study, has been done in order to
achieve a more precise measure of the promotional frames effectiveness. Previous studies
(Hulicka and Weiss, 1965; Kausler and Klein 1978) demonstrated that some consumer
demographic characteristics such as age, have a great impact on how they perceive and
encode stimulus from different promotional frames. Younger subjects, compared with
adults, appear to be able to process mental operations that lead to information of more
elaborate encoding. In addition, older people demonstrate more susceptibility from the
irrelevant component of a stimulus. These results point out the importance of considering
the age when trying to measure the effectiveness of a promotional frames. Diverse targets
32
are supposed to be differently influenced by promotions due to the fact that they do not
share the same background in terms of experiences, historical and technological context,
From these previous outcomes derives the prediction belonging to which adults will
demonstrate less willingness to process mental operation and they will be more attracted by
sure discounts, thus cents-‐off promotions.
Hp.4 Elderly participants rather than young participants prefer cents-‐off promotions rather
than other promotional frames for both the products categories, luxury and non-‐luxury.
Hp.5 In purchasing luxury products, young participants rather than elderly participants
appear to be more likely to be influenced by percentage-‐off promotions.
Hp.6 When purchasing non-‐luxury products, young participant rather than elder participants
appear to be more likely to be influenced by coupon promotions.
With regard to the product differentiation, between mass and premium products, the
prediction is that promotions framed in absolute terms (cents-‐off) will be preferred by
consumers more for higher-‐priced products instead of lower-‐priced products. P. R. Das
(1992) conducted a study in order to verify how consumers perceive four mathematically
equivalent deals over eight different products. This experim
typology, lower-‐price versus higher-‐price, strongly affect consumer evaluation of deals.
One of the most significant outcomes was, indeed that evident monetary savings are
preferred for higher-‐priced products. The same result was achieved by another study
conducted by Chen, Monroe and Lou (1998). They demonstrated that consumers perceived
as more significant a promotion framed in dollar terms than one in percentage terms, when
purchasing high price products rather than low price products. moreover, their research
demonstrated that coupons were more favourably perceived than discount promotions in
purchasing lower-‐price products.
33
Hp.1: Elderly participants prefer cents-‐off promotions rather than the other promotional
frames considering the luxury products category rather than the non-‐luxury product
category.
Hp.2: Young participants appear to be more likely to be influenced by percentage-‐off
promotions rather than the other promotional frames when considering the luxury products
category as opposite to the non-‐luxury products category.
Hp.3: Both the age categories of interviewee prefer cents-‐off promotions rather than other
promotional frames whether asked to purchase luxury products rather than non-‐luxury
products.
1.8 How to measure sales promotion effectiveness
The process of evaluating sales for
will deeply influence the decisions that follow the end of
ective of
the organisation should be to analyse results in order to understand whether prefixed goals
have been reached or not. In the case, the company notices a discrepancy between desired
and effective results, the next step to put into practice should be a review of the overall
strategy and, then its modification in order to make it more suitable to the market.
Then, having a proper evaluation of results achieved by each specific promotion
implemented by the company, allow it to identify their single outcome and to understand
which was the target market to these. Measuring separately achieved results of
each typology of promotion and of each target, appears to be extremely useful because
might give concrete information about how differently consumers have been
influenced by various promotional frames in a particular shop environment, within which
some specific elements might have played a significant role in influencing consumers.
The competitive advantage of owning these data, consists in the possibility of addressing the
most effective promotional frame to the right target or/and exploiting some environmental
34
consequently lead to maximizing the outcomes and having more returns in terms of
effectiveness of the promotion.
However, as aforementioned, sales promotions do not give the certainty of extending
their outcomes also in the long term, therefore even if managers during this evaluation
process come across positive results, they should be aware of the need of regularly
reinvesting in these activities to achieve long lasting effects.
The weakness of a promotion in the long period is also affected by some characteristics of
the current market, that has constantly proved to be able to adapt itself really quickly to
innovations, in particular to those that give opportunities of increasing sales. Managers are
indeed always looking for new ways to improve the efficiency and the effectiveness of their
strategies, in particular because to the sales promotional area is often given the largest
discretionary part of the budget devoted to promotions.
Having a proper evaluation system appears therefore to be needed for two main reasons
(Yeshin, T. 2006) :
1. To ensure that sales promotional expenses do not exceed reasonable levels;
2. To evaluate concrete outcomes of this expenditures.
This is the reason why, marketing managers are always looking for new evaluation methods
of the efficiency and the effectiveness of different sales promotional typologies.
The system of measurement must be as more objectives as possible, it means that it
must take into consideration all the external and internal factors, events and conditions that
could affect measures and could cause errors in the calculation.
The research developed in this thesis focuses on the short term effectiveness of a
promotion. The measurement process indeed aim to identify which, among different
promotional frames, has a greater impact on consumers and is more likely to influence their
belonging to Yeshin T. (2006) analysis, consider the following factors:
Profitability
Local market conditions
Effects on channel partners

35
The synergy between different types of sales promotions
The profitability of a certain promotion is deeply linked with the product category in
have different perception of promotions depending on the
them for example would never accept to switch from the brand they are used to buy to
another one, neither whether a worth promotion is offered. Some consumers are thus
strictly loyal to a single brand for a specific product, others have no brand loyalty at all and
will purchase each time the most favourable product, in economic terms, even if it means
switching from a brand to another one every time. These are obviously two extremes of a
continuum in which the major part of consumers position themselves. Terence A. Shimp in
responsiveness. This model well explains how much each segment is willing to switch from
the product they use to buy, to another one which presents a temporary promotion. One
limitation of this analysis is the fact that it can be applied only within a unique product
e sensible to deals when these
are applied to low involvement products; to which people do not manifest a strong
attachment or a deep brand loyalty.
Coming back to the concept of profitability, it means that there are some products toward
which consumers appear to be deal-‐insensitive because they are not willing to renounce to
the product they are used to buy, even if they could receive a money saving purchasing
another one. In this case, sales promotions are more likely to be unprofitable, because the
volume of sales during the promotion campaign will not be enough high to compensate the
loss in profit margins.
Essential to understand this process is the concept of contribution margin. The margin is the
=
36
During the promotional period variable costs are higher because they suffer from the
increase costs of the promotional campaign and the costs of putting in place the offer; and
so the direct consequence is that the margin is reduced. When the margin of a product is
reduced, the only way to maintain or to increase the final profit is to reach a sales volume (q)
enough large to compensate the loss of margin for each sold unit.
= ( × )
The matter of whether a promotion will be profitable or not is thus deeply linked with the
composition of consumers, in terms of target, for this particular market in which it is applied.
very difficult for marketer to forecast whether a promotion will sufficiently increase the sales
volume or not.
Fortunately, there are some tools that can be used by marketing researchers to better
identify the proportion of buyers within a product category that belong to a specific
segment, in this way they can further use these information to estimate the effectiveness in
terms of sales volume that the promotion would achieve and to conclude whether it will be
profitable or not.
The main conclusion Terence A. Shimp (2003) achieved through his analysis is that if the
market in which the promotion is applied is made by promotion-‐insensitive or very brand
loyal consumers, this will not be profitable. On the other hand, if the market is composed by
consumers who buy only on deal, the promotion will have much more probabilities to reach
enough sales volume to compensate the loss of per-‐unit margin.
Since here, promotion effectiveness has been treated mainly by a mathematical point
of view, supporting its measuring process with the profitability concept.
The effectiveness of sales promotion, however, it is not only a matter of numerical
calculation but must take into consideration also others intangible aspects.
The general condition of the market, for example, deeply influence this effectiveness in
terms of sales as well as the effects that promotions cause on retailers. Often, retailers and
suppliers have different goals to achieve and even the way of putting into practice a
particular promotion could show some differences. They should, thus, discuss their single

37
objectives before its implementation in order to avoid misunderstanding and situation in
which their own aims contrast one with the others.
The measure of sales promotion effectiveness should also take in consideration, to
be as much objective as possible, whether others promotions have taken place during the
same period. A common error done by marketers in measuring monetary returns of
promotional campaigns, is to aggregate the single variation in sales volume achieved by each
typology of promotion only because these are all identified as promotional activities in the
marketing budget and plan. The impact of the promotional strategy cannot be calculated at
the aggregate level, because this method could hide whether some promotions had negative
profit and other generated increases in sales volume. On the other side, some kind of
promotion could also show a sort of synergy between them. In this case their outcomes will
be augmented by the presence of the other promotion and, one more time, an aggregated
evaluation of them will not give to marketers the possibility to notice it and take advantage
of it. Since the evaluation of sales promotion effectiveness will affect the further strategy of
the company, doing it from an aggregate level will probably lead to incorrect conclusions
and then, to unsuccessful decisions.
Another way of conceptualizing the measurement of sales promotions effectiveness
relies upon the distinction between hedonic and utilitarian benefits. The existence of
different levels of benefits well-‐explain the reason why every-‐day-‐low-‐price (EDLP) is not
always the most profitable solution. Whether consumers would only look for money saving,
the EDLP strategy would be the most effective, because it offers consumers with monetary
savings and, at the same time, it is cost efficient regarding the company. But this is not,
therefore previous studies repeatedly proved that consumers are influenced also by other
more hedonic benefits and monetary savings are not the only reason that pushes consumers
to be influenced by sales promotions. Belonging to this model (Chandon, Wansink and Gilles,
2000) the effectiveness of a sales promotion is determined by the nature of the benefits it
provides, whether hedonic or utilitarian, and the measure in which these benefits are
congruent with the promoted product.
Hedonic benefits are opportunities for value-‐expression, exploration and entertainment; the
utilitarian ones are the more shopping convenience, the monetary savings and the higher
quality of the product. The conclusion of their research was that monetary promotions
38
appear to be more efficient whether used for utilitarian products rather than hedonic
products
The managerial implication related to this analysis, knowing that monetary and non-‐
monetary promotions provide consumers with different benefits, is that managers are
presented with an additional knowledge to better apply one specific promotional frame to a
particular product. The direct consequence of this pattern is that they might be able to
improve the effectiveness of their sales promotion activities.
specific product categories, has influenced the bases upon which the research carried out in
this thesis has been grounded.
First of all the choice of concentrating the survey only within a specific sector, was mainly
made in order to limit the range of possible products to be taken into consideration; the
reason why the cosmetic sector has been chosen belong to the fact that in this sector a
plenty of different promotional frames are nowadays used in order to induce people to try a
new product or to increase sales; and after this, at the moment there are no previous
research that concentrate specifically on this field. Within the cosmetic sector a further
distinction has been done between luxury and non-‐luxury products. It has been considered
necessary to include this additional repartition because of the number of products included
in the cosmetic sector and, as aforementioned, because of the several different attitudes
that these items involve. A person would not have therefore the same approach toward an
expensive perfume and a mascara, and neither between a foundation and a lipstick.
The analysis of these two categories (luxury and non-‐luxury products) will be better
investigated in the section 2, completely dedicated to the exploration of the cosmetic sector;
suffice it here to know that consumers react to promotions in different ways belonging to
the product taken into consideration. Each product could involve a diverse attachment to
the same product category and even if they may save money from the switching. From here
the choice to split the overall sector in two large subcategories. The explored patterns are
therefore between sales promotional frames, age and product categories and the
effectiveness of each promotional frame will be measured in terms of the power that this

39
may achieve through patterns with the other two variables (age and product categories) and
in its capability of increasing the total sales volume.
2. The cosmetic sector
This section focuses on three main points: a general exploration of the cosmetic sector, a
developed in this thesis focuses on the definition of luxury and non-‐luxury products within
the cosmetic sector, this is the reason why having an overall knowledge of the composition
of this business is of particular importance.
2.1 A short presentation of this market
Nowadays lots of business sectors are going through big changes, and the cosmetic sector is
part of these. The organisational survival and success of a company depends on the
capability of managers to forecast, interpret and if needed bring some changes to the
organisation. Social, economic and historical events have a deep impact on the market and
more specifically on people themselves. Consumers are continuously changing and their
needs too; the competitive context is adjusting as well and the availability of resources to
produce too, it is therefore imperative for companies to adapt themselves to this moody
environment to be always competitive on the market.
The cosmetic business in Europe has always proved to be able to reach great results,
in terms of profits, despite the economic events occurred in lasts years were not so
favourable toward it. The cosmetic market size in Europe is almost as huge as in the U.S and
in Japan counted together, mainly thanks to its very large population (source: Euromonitor
International). Obviously each country develops specific trends within its society, and these
can be not present in others because of cultural reasons, or social tendencies.
The cosmetic sector in Europe operates through four principal distribution networks:
selective perfumeries, big supermarket, pharmacies and Para pharmacies.
40
Just to give an idea of the business dimensions, only in France at the end of September 2011,
the cosmetic sector achieves the number of 2051 big and medium specialized surfaces and it
gives work to 14111 employees. The selective perfumeries occupy the half of the market and
can be considered the most important distribution network in this country. Some of the
most known companies that operate in this sector are Sephora, Marionnaud and Nocibé.
In 2012 it is expected, belonging to a study made by XERFI700, an increase of the
consummation of cosmetic products in Europe. Despite the fact that the purchase power of
people has been reduced in lasts years due to the consequences of the economic crises, such
as austerity measures, taxes augmentation, increasing of the unemployment level etc., other
The demand of these goods will be indeed stimulated by the fact that people in general
attribute more and more importance to well-‐being and appearance and they appear to be
willing to increase the budget devoted to this kind of purchases, even if their economic
situation has (in general) not improved compared to previous years.
Another important phenomenon that conduce to optimistic forecasts in this sector is
the enlargement of the market. New targets therefore appear on the scenario and are now
becoming new segment to be reached by companies. Men and adolescents demonstrate
indeed an increasing interest in this kind of products and this phenomenon reflects itself in
an augmentation of sales volumes. Another population segment is having a strong positive
impact on the cosmetic sector development: the seniors. As it is well known, the current
society is facing a social ageing and this social change is immediately reflected in the
-‐aging product therefore
registered an year by year increase and a lot of companies now concentrate their R&D
budget in the development of new anti-‐aging products.
However, within the huge category of cosmetic products different trends are
expected (XERFI700). As already mentioned, people demonstrate to have different attitudes
toward products, even when these belong to the same product category. These differences
rception are obviously reflected in the amount of their monetary budget they
are willing to allocated on them. Just to make an example: in the cosmetic sector people,
whether they are forced to reduce their purchase budget, demonstrate to be more willing to
renounce or to choose low-‐price items, for skin and body beauty products or for sun creams.

41
On the other side they do not demonstrate to be as willing to save money for products as
perfumes or make-‐up because they generally attribute more importance to these product
typologies, and whether forced, they will reduce the expenses somewhere else (XERFI700,
2011).
(A proof of what aforementioned it is that in France,
represented the 65% of total sales volume and reveal a 2% increase of revenues from the
precedent year.)
It could appear weird that in an historical moment characterized by a strong reduction of
the consumer purchase power, an expensive product as perfumes are, still demonstrates a
growth in sales volume. The reason of this is that consumers appear not to be willing to save
money on this category product. At the same time, they anyway demonstrate a certain
sensibility toward price, which limits the producers and retailers in the price revision and
make them accept almost always the same margin.
Finally another relevant phenomenon is modifying somehow the strategy of the
companies which operate in this sector. The concurrence indeed is becoming more and
more strong, and in particular for what concern skin care products. Several big surfaces (e.g.
supermarket) nowadays offer large lines of beauty products at very competitive prices. The
consequences of this is that a certain number of consumers have decided to switch for one
retailer to another attracted by lower prices. Other retails proved to be out of this system,
like for example pharmacies and Para pharmacies. They probably benefit from the degree of
quality that consumers attribute to their products, that they are not willing to replace with
For sure, the change in the purchase behaviour is different from one consumer to another
and it depends on how much commitment and involvement they have toward the
considered product.
2.2 Luxury and non-luxury products
Within the cosmetic sector two main categories of products can be identified: perfumes and
beauty products.
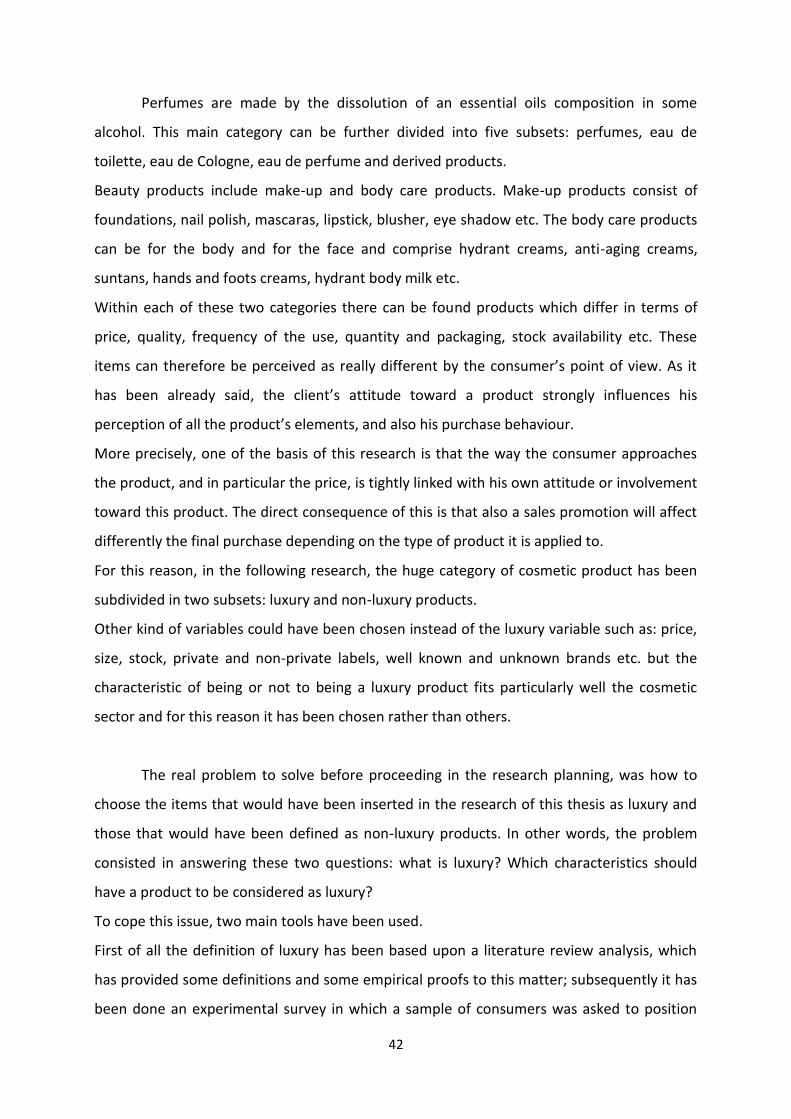
42
Perfumes are made by the dissolution of an essential oils composition in some
alcohol. This main category can be further divided into five subsets: perfumes, eau de
toilette, eau de Cologne, eau de perfume and derived products.
Beauty products include make-‐up and body care products. Make-‐up products consist of
foundations, nail polish, mascaras, lipstick, blusher, eye shadow etc. The body care products
can be for the body and for the face and comprise hydrant creams, anti-‐aging creams,
suntans, hands and foots creams, hydrant body milk etc.
Within each of these two categories there can be found products which differ in terms of
price, quality, frequency of the use, quantity and packaging, stock availability etc. These
attitude toward a product strongly influences his
More precisely, one of the basis of this research is that the way the consumer approaches
the product, and in particular the price, is tightly linked with his own attitude or involvement
toward this product. The direct consequence of this is that also a sales promotion will affect
differently the final purchase depending on the type of product it is applied to.
For this reason, in the following research, the huge category of cosmetic product has been
subdivided in two subsets: luxury and non-‐luxury products.
Other kind of variables could have been chosen instead of the luxury variable such as: price,
size, stock, private and non-‐private labels, well known and unknown brands etc. but the
characteristic of being or not to being a luxury product fits particularly well the cosmetic
sector and for this reason it has been chosen rather than others.
The real problem to solve before proceeding in the research planning, was how to
choose the items that would have been inserted in the research of this thesis as luxury and
those that would have been defined as non-‐luxury products. In other words, the problem
consisted in answering these two questions: what is luxury? Which characteristics should
have a product to be considered as luxury?
To cope this issue, two main tools have been used.
First of all the definition of luxury has been based upon a literature review analysis, which
has provided some definitions and some empirical proofs to this matter; subsequently it has
been done an experimental survey in which a sample of consumers was asked to position
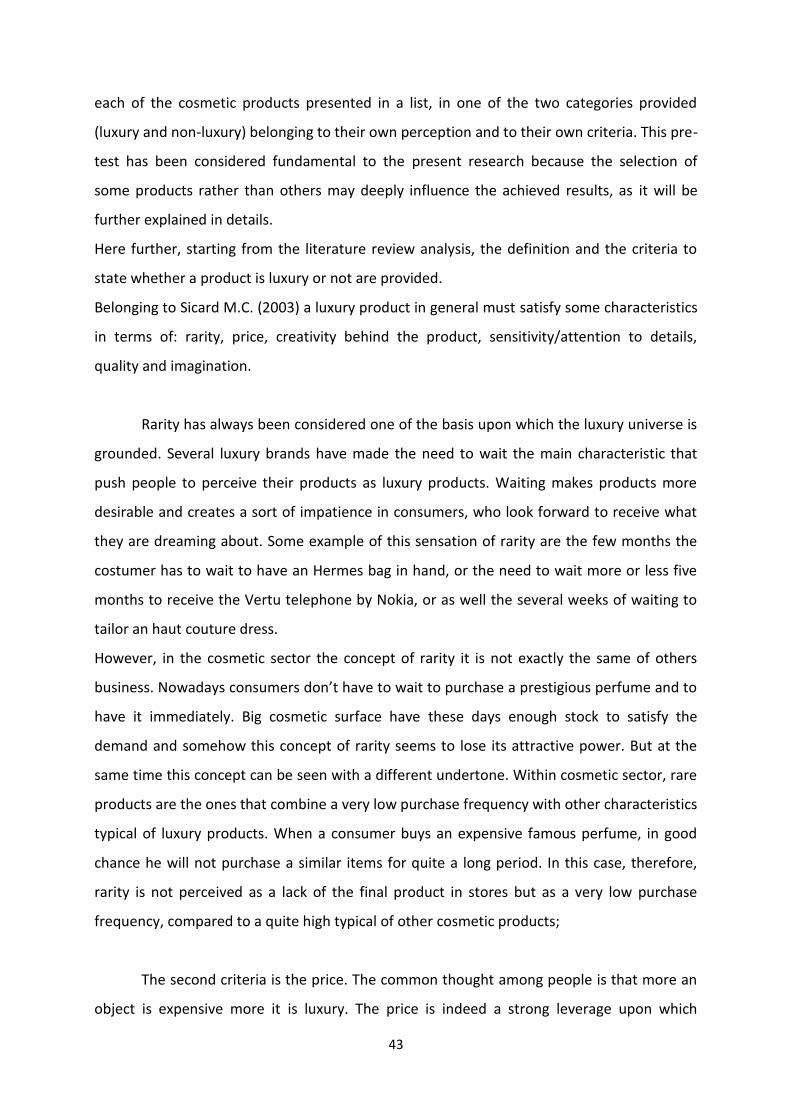
43
each of the cosmetic products presented in a list, in one of the two categories provided
(luxury and non-‐luxury) belonging to their own perception and to their own criteria. This pre-‐
test has been considered fundamental to the present research because the selection of
some products rather than others may deeply influence the achieved results, as it will be
further explained in details.
Here further, starting from the literature review analysis, the definition and the criteria to
state whether a product is luxury or not are provided.
Belonging to Sicard M.C. (2003) a luxury product in general must satisfy some characteristics
in terms of: rarity, price, creativity behind the product, sensitivity/attention to details,
quality and imagination.
Rarity has always been considered one of the basis upon which the luxury universe is
grounded. Several luxury brands have made the need to wait the main characteristic that
push people to perceive their products as luxury products. Waiting makes products more
desirable and creates a sort of impatience in consumers, who look forward to receive what
they are dreaming about. Some example of this sensation of rarity are the few months the
costumer has to wait to have an Hermes bag in hand, or the need to wait more or less five
months to receive the Vertu telephone by Nokia, or as well the several weeks of waiting to
tailor an haut couture dress.
However, in the cosmetic sector the concept of rarity it is not exactly the same of others
have it immediately. Big cosmetic surface have these days enough stock to satisfy the
demand and somehow this concept of rarity seems to lose its attractive power. But at the
same time this concept can be seen with a different undertone. Within cosmetic sector, rare
products are the ones that combine a very low purchase frequency with other characteristics
typical of luxury products. When a consumer buys an expensive famous perfume, in good
chance he will not purchase a similar items for quite a long period. In this case, therefore,
rarity is not perceived as a lack of the final product in stores but as a very low purchase
frequency, compared to a quite high typical of other cosmetic products;
The second criteria is the price. The common thought among people is that more an
object is expensive more it is luxury. The price is indeed a strong leverage upon which

44
several companies concentrate their efforts in order to create a brand image deeply related
with the luxury universe. To be correct, an expensive price is a necessary condition for a
product to be luxury buy not sufficient. There are a lot of things in this world that are still
considered luxury even if they are not expensive: a fresh Prosecco drunk in the Tuscan
countryside, a concert by Pollini in the Champs-‐ the
Mont Blanc and so on (Sicard, 2003).
In the cosmetic sector the price plays an important role, it is indeed one of the most
important keys to distinguish luxury from non-‐luxury products. Creating a link with the
previous criteria, it can be said that generally more the frequency of purchase is low, higher
it is the probability for that product to be more expensive. It is, for example, the case of
perfumes, which usually have a low rate purchase and an expensive price. Also in this
example, it is underlined the fact that a high price itself is not sufficient to define a product
as luxury, therefore a really expensive perfume, whether not in possession of other
characteristics typical of luxury products, will not be considered luxury by consumers;
Behind a luxury product, beside its price and beside its rarity and the need to wait for
it, there is the fact that this kind of products need a long process of innovation and creation.
This procedure is both an important characteristic of luxury product and at the same time a
reason why for the precedent criteria.
Innovation within cosmetic product category is extremely important and committed in every
subset. It is permanent and companies often stress on it to prove their commitment in
developing new products and to be at the cutting edge;
Deeply related with the idea that a luxury product has a long history behind its
creation, is the sensibility to details concept. Nowadays the importance of details holds a
more and more important role in almost all the retail sectors, but in the luxury industry this
is particularly true. It is also related with the need to wait to have the physical product in
hands. The attendance create expectation in consumers, who are convinced that the reason
why they have to wait such a long time is due to the long and precise process of production
behind the product. Longer is the process, more the product is supposed to be precious and
rich in details. A product made with attention to the smallest detail is perceived by
costumers as an handcrafted item and they used to assign it more value.

45
In the case of cosmetic products the attention to details appears to be more related with the
quality of an item. The quality characteristic can really make the difference between a luxury
and a non-‐luxury product in the cosmetic industry and for this reason it has been taken into
consideration in the research conducted in this thesis.
In the cosmetic sector, the three last criteria mentioned appear to implement one the other.
A cosmetic product that has a long productive process behind its creation, it is supposed to
have been made paying attention to the smallest detail and it is therefore considered in the
most part of the cases an high quality product.
For example, an expensive anti-‐aging cream before being commercialized has pass through
several research and test which have proved its efficacy. During and after this step each
single component of this cream have been analysed and selected and through these phases
the quality of this product has been improved;
Finally, the characteristic of the imagination cannot be omitted. It is so important
that almost always it is inserted among the criteria used for the brand evaluation and in
luxury products it is particularly emphasized.
Several cosmetic brands, such as Chanel just to make an example, invest great budget in
creating a story behind their products. The company in this way try to build a collective
imagination around the brand and at the same time to increase the brand awareness. The
imagination allow also the company to steal the consumer subconscious and to reach at first
the recognition and then the recall level.
Nowadays, actually imagination is no more an exclusive characteristic of luxury brands but a
lot of other big companies leverage upon t
toward the multitude of brands present in the market.
2.3 Two different targets for two different consumer behaviours
The second variable that has been introduced in the following research in order to have a
more in depth insight of how consumers react to sales promotion is a demographical
Belonging to several studies, demographic characteristics such as age, sex, nationality etc.
deeply influence the way of purchasing and the way these people perceive external stimuli

46
(Paco Underhill, 2007; Kausler & Kleim, 1978). But since now the relation between the
perception of economically equivalent deals and variables of consumers background as
Ev
perception of sales promotion, others do not cause any evident change. Indeed, as Kwok S.
o have a
substantial impact on how consumers perceive sales promotions and for this reason the
analysis of the promotional frames perception can be carried out in a multicultural context.
al role in the way these
people purchase. Even in the same context and in the same environment it would be
impossible to find to persons who react to stimuli in the same way. Individuals do not
evaluate stimulus, such as for example price, in absolute terms, but therefore in relatives
ones. Each person makes indeed reference to his own previous experiences and the
reminisces that these generate internally and externally (Sinha J. & Smith M. 2000).
Perception is one intermediate variable that acts between a stimulus and its response, and it
(1973) suggests, is therefore extremely important to take into consideration also the context
and demographic variables, because these factors may guide to price perceptions that differ
significantly among consumers.
At the same time also the reasons that push shopping could be different: a way to pass time,
to reward oneself, an excuse to go out, to distract oneself, to amuse oneself etc.
This awareness well explain the reason why a supplementary variable has been introduced
to the research in addition to the luxury or non-‐luxury characteristic of a product.
Despite the fact that every consumer differs from another one, one of the purpose of
stimuli, more specifically to different promotional frames. This generalisation will be further
useful to marketers to address the right promotional frame to the right target, achieving in
this way a more successful result.
environment and he has subsequently stated some generalisation about man and women;
and young and elder people. Leaving aside his studies about gender differences, some of the
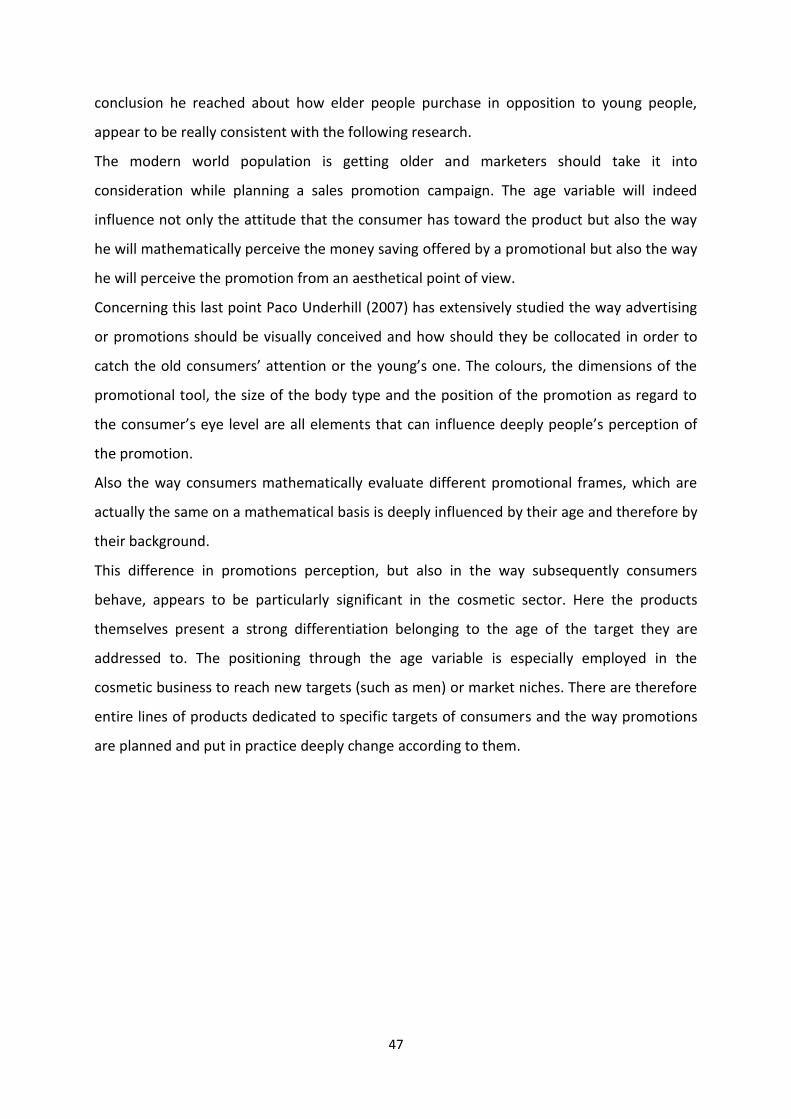
47
conclusion he reached about how elder people purchase in opposition to young people,
appear to be really consistent with the following research.
The modern world population is getting older and marketers should take it into
consideration while planning a sales promotion campaign. The age variable will indeed
influence not only the attitude that the consumer has toward the product but also the way
he will mathematically perceive the money saving offered by a promotional but also the way
he will perceive the promotion from an aesthetical point of view.
Concerning this last point Paco Underhill (2007) has extensively studied the way advertising
or promotions should be visually conceived and how should they be collocated in order to
promotional tool, the size of the body type and the position of the promotion as regard to
the promotion.
Also the way consumers mathematically evaluate different promotional frames, which are
actually the same on a mathematical basis is deeply influenced by their age and therefore by
their background.
This difference in promotions perception, but also in the way subsequently consumers
behave, appears to be particularly significant in the cosmetic sector. Here the products
themselves present a strong differentiation belonging to the age of the target they are
addressed to. The positioning through the age variable is especially employed in the
cosmetic business to reach new targets (such as men) or market niches. There are therefore
entire lines of products dedicated to specific targets of consumers and the way promotions
are planned and put in practice deeply change according to them.
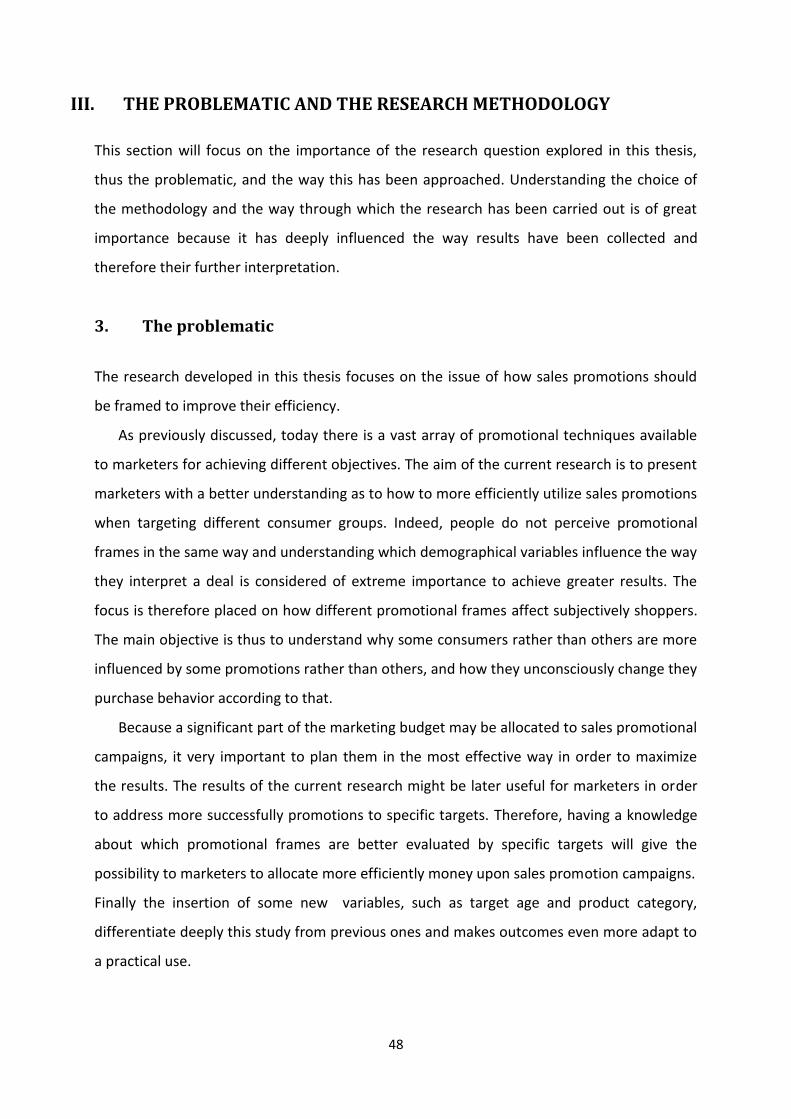
48
III. THE PROBLEMATIC AND THE RESEARCH METHODOLOGY This section will focus on the importance of the research question explored in this thesis,
thus the problematic, and the way this has been approached. Understanding the choice of
the methodology and the way through which the research has been carried out is of great
importance because it has deeply influenced the way results have been collected and
therefore their further interpretation.
3. The problematic
The research developed in this thesis focuses on the issue of how sales promotions should
be framed to improve their efficiency.
As previously discussed, today there is a vast array of promotional techniques available
to marketers for achieving different objectives. The aim of the current research is to present
marketers with a better understanding as to how to more efficiently utilize sales promotions
when targeting different consumer groups. Indeed, people do not perceive promotional
frames in the same way and understanding which demographical variables influence the way
they interpret a deal is considered of extreme importance to achieve greater results. The
focus is therefore placed on how different promotional frames affect subjectively shoppers.
The main objective is thus to understand why some consumers rather than others are more
influenced by some promotions rather than others, and how they unconsciously change they
purchase behavior according to that.
Because a significant part of the marketing budget may be allocated to sales promotional
campaigns, it very important to plan them in the most effective way in order to maximize
the results. The results of the current research might be later useful for marketers in order
to address more successfully promotions to specific targets. Therefore, having a knowledge
about which promotional frames are better evaluated by specific targets will give the
possibility to marketers to allocate more efficiently money upon sales promotion campaigns.
Finally the insertion of some new variables, such as target age and product category,
differentiate deeply this study from previous ones and makes outcomes even more adapt to
a practical use.

49
4. Objectives of the investigation
The aim of the present research is to compare two types of consumer targets in terms of
their perceptions of various promotional frames.
Consistent with the research literature, it is assumed that the way a promotion is framed
influences the way consumers perceive it. A percentage discount is not perceived in the
same way of a cents-‐off discount or of a coupon and so on. The matrix below (see table 5)
shows the two targets of consumers, object of the research, and the two subcategories of
products in the cosmetic sector. The two targets are supposed, from the concepts developed
in the literature review, to differ in their purchase behaviour, principally due to differences
in the demographic characteristics of age, which influence the way they take into account
external variables while they are purchasing (Hulika and Weiss, 1965; Kausler and Klein
1978).
Consumers are expected to try to maximize the efficiency of their purchase, maximize the
monetary value while minimizing the costs expended in the purchase. In this case, the price
is considered as the only cost to afford while purchasing because of the limitations in
recreating a real shopping environment. The purchase context, that interviewee face while
answering the survey, is significantly simplified and several external variables such as the
location of the store, the loyalty to a particular store etc. are not considered.
Thus, it has been considered interesting, to study whether there is a relation between
customer age and the subsequent perception of promotional frame; that is, the intent is to
investigate how differences in framing of promotions, that offer the same price reduction,
Moreover, it has been considered of particular relevance to
perception of the deal is also influenced by the type of product they are facing (luxury or
non-‐luxury). In this thesis the promotion effectiveness is interpreted as the measure in
which a promotional frame matches the variables and the characteristics that influence the
price perception of a specific target.
and the typology of the purchased product influence how customers perceive four different
sales promotional frames.
Six hypothesis are therefore derived:

50
Hp.1: Elderly participants prefer cents-‐off promotions rather than the other promotional
frames considering the luxury products category rather than the non-‐luxury product
category.
Hp.2: Young participants appear to be more likely to be influenced by percentage-‐off
promotions rather than the other promotional frames when considering the luxury products
category as opposite to the non-‐luxury products category.
Hp.3: Both the age categories of interviewee prefer cents-‐off promotions rather than other
promotional frames whether asked to purchase luxury products rather than non-‐luxury
products.
Hp.4 Elderly participants rather than young participants prefer cents-‐off promotions rather
than other promotional frames for both the products categories, luxury and non-‐luxury.
Hp.5 In purchasing luxury products, young participants rather than elderly participants
appear to be more likely to be influenced by percentage-‐off promotions.
Hp.6 When purchasing non-‐luxury products, young participant rather than elder participants
appear to be more likely to be influenced by coupon promotions.
Table 5: Structure
PRODUCTS
LUXURY (two products)
NON-‐LUXURY (two products)
UNDER 35 years old
Percentage off Cents off Coupon Product bundling
Percentage off Cents off Coupon Product bundling
OVER 50 years old
Percentage off Cents off Coupon Product bundling
Percentage off Cents off Coupon Product bundling

51
5. The pre-test
After having theoretically defined the distinction between luxury and non-‐luxury products, a
pre-‐test has been conducted in order to definitively decide which products would have been
selected as luxury and which as non-‐luxury.
In the section 2.2 some definitions of luxury have been provided and in addition to these,
some criteria that characterise luxury products. The sources have been mainly books on the
luxury business because there were not found articles which studied how to distinguish
these two products categories.
It would have been in some way reductive to base the choice of the products to be insert in
the following research, only on the previous literature review, and from here derives the
decision of introducing a second tool of selection, a pre-‐test.
The main objective of the pre-‐test was therefore measure, simply calculating absolute and
relatives frequencies, how consumers perceive products belonging to these two different
categories.
The pre-‐test has been conducted on a sample of fifty women of different age and
nationalities. Coherently with what previously said, the gender has been limited only to
women because it has been retained that within the cosmetic sector, attitudes toward
several products cannot be considered homogeneous with regard to this demographic
characteristic. Within this business indeed, the perception that male and women have
toward products is deeply different (Underhill, 2007), and whether not taken sufficiently into
account, it could have in some way negatively affected the re
same purchase behaviour of women toward some cosmetic products and the direct
which the price. Their willingness to spend a certain amount of money on a body cream, for
example, can be very dissimilar, and consequently the way they perceive sales promotions
as well.
If one of the aims of this research is also to serve as a tool for marketer in the future to catch
trough the right promotional frame the desired target, it should be as more precise as
possible and this consideration drove to the choice of including only the feminine gender.

52
Other demographic characteristic such as age and nationality have not been considered as
potential elements of inconvenience and for this reason no limitation has been drawn the
line at them (see section 1.7).
Here further the structure of the survey is described.
Through an online survey, interviewees were presented with a lists of ten products and were
asked to address each of them to one of the two possible product categories: luxury and
non-‐luxury. These items were well-‐known cosmetic products and next to the name of each
of them a picture representing them was provided.
People were invited to declare whether, in their opinion, that product was to be considered
as luxury or non-‐luxury. There was also presented them the possibility of not to take a
made to avoid
know the presented product.
The survey was therefore really fast and easy to be completed, and so reached the expected
number of participants in a short time.
Interviewees were not provided of any additional information about the product itself or the
purchase context, they have been thus let completely free to answer using their own
criteria.
In this way it has been possible to achieve a general prospective of which products are
considered as luxury in the collective imagination, without any other external information
The results have been collected and the products which have picked out were the ones that
showed the greatest difference between the two possibilities (luxury and non-‐luxury). These
have been subsequently compared with the criteria, mentioned in section 2.2, in order to
prove a sort of coherence between the two tools used for the choice.
In the following table it is possible to see the results collected for each product, calculated
both in absolute and relative terms.

53
Table 6: Results of the pre-‐test
LUXURY NON-‐LUXURY TOTAL
Lancome -‐ Trèsor 38 (76%) 12 (24%) -‐ 50
Dior -‐ 44 (88%) 6 (12%) -‐ 50
YSL -‐ Red Lipstick 44 (88%) 6 (12%) -‐ 50
Givenchy -‐ Photo
perfect foundation
35 (70%) 10 (20%) 5 (10%) 50
Clarins -‐ Daily hydro
cream
6 (12%) 42 (84%) 2 (4%) 50
Dior -‐ Hydro Life cream 27 (54%) 23 (46%) -‐ 50
Clinique -‐ Bottom lash
mascara
5 (10%) 45 (90%) -‐ 50
Dior -‐ pure colour nail
polish
31 (62%) 12 (24%) 7 (14%) 50
Shisheido -‐
Monocolour eye
shadow
19 (38%) 30 (60%) 1 (2%) 50
Clinique -‐ Deep
comfort body butter
8 (16%) 39 (78%) 3 (6%) 50
As it is easily detectable from the table above, the pink highlighted products (Dior -‐
and YSL-‐ Red Lipstick) have been chosen by interviewees as luxury products and the green
ones (Clarins Daily hydra cream and Clinique -‐ Bottom Lash Mascara) have been selected
as non-‐luxury products. These four products have been selected among others because they
show the greatest percentage value, which means that interviewee strongly addressed them
in one of the two product categories. They are represented below in picture 1 and 2.
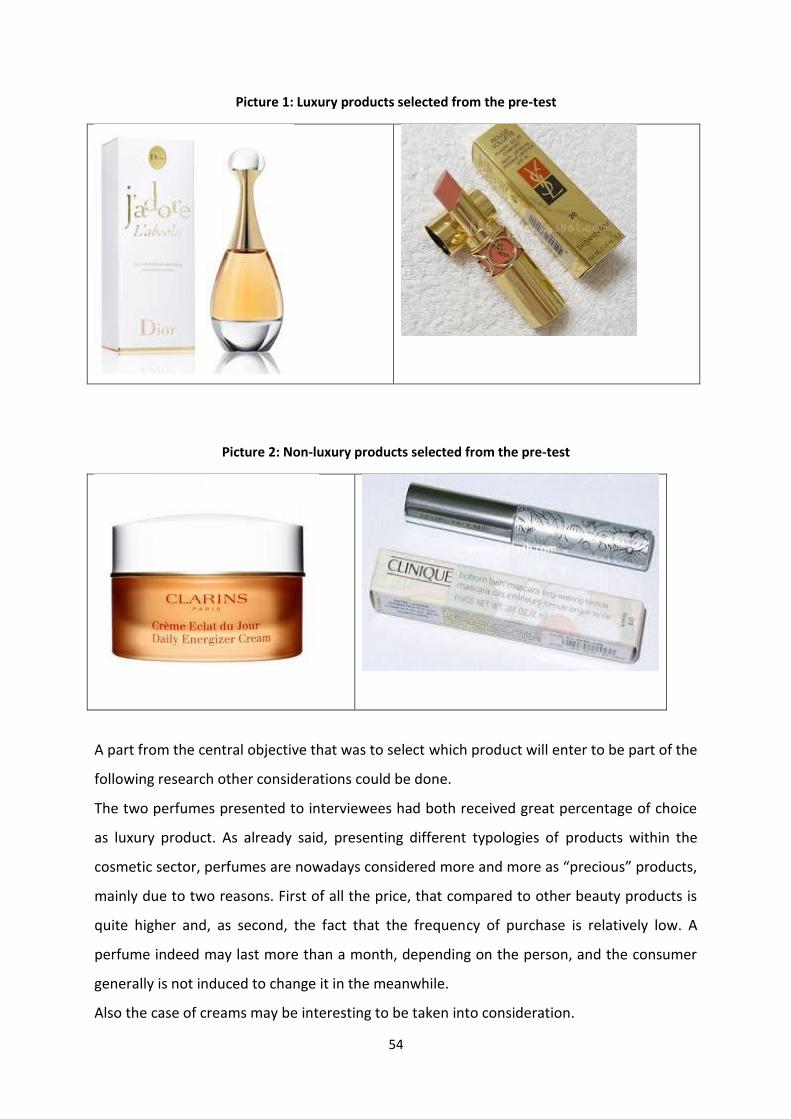
54
Picture 1: Luxury products selected from the pre-‐test
Picture 2: Non-‐luxury products selected from the pre-‐test
A part from the central objective that was to select which product will enter to be part of the
following research other considerations could be done.
The two perfumes presented to interviewees had both received great percentage of choice
as luxury product. As already said, presenting different typologies of products within the
mainly due to two reasons. First of all the price, that compared to other beauty products is
quite higher and, as second, the fact that the frequency of purchase is relatively low. A
perfume indeed may last more than a month, depending on the person, and the consumer
generally is not induced to change it in the meanwhile.
Also the case of creams may be interesting to be taken into consideration.
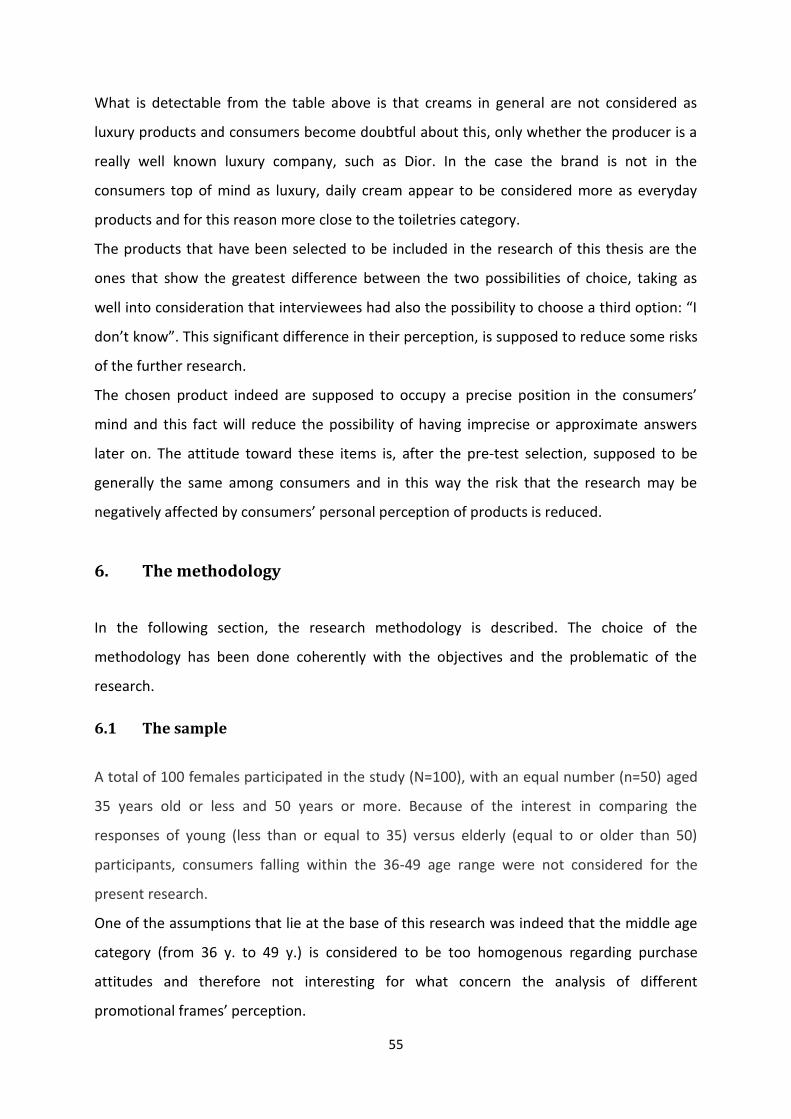
55
What is detectable from the table above is that creams in general are not considered as
luxury products and consumers become doubtful about this, only whether the producer is a
really well known luxury company, such as Dior. In the case the brand is not in the
consumers top of mind as luxury, daily cream appear to be considered more as everyday
products and for this reason more close to the toiletries category.
The products that have been selected to be included in the research of this thesis are the
ones that show the greatest difference between the two possibilities of choice, taking as
uce some risks
of the further research.
mind and this fact will reduce the possibility of having imprecise or approximate answers
later on. The attitude toward these items is, after the pre-‐test selection, supposed to be
generally the same among consumers and in this way the risk that the research may be
6. The methodology
In the following section, the research methodology is described. The choice of the
methodology has been done coherently with the objectives and the problematic of the
research.
6.1 The sample
A total of 100 females participated in the study (N=100), with an equal number (n=50) aged
35 years old or less and 50 years or more. Because of the interest in comparing the
responses of young (less than or equal to 35) versus elderly (equal to or older than 50)
participants, consumers falling within the 36-‐49 age range were not considered for the
present research.
One of the assumptions that lie at the base of this research was indeed that the middle age
category (from 36 y. to 49 y.) is considered to be too homogenous regarding purchase
attitudes and therefore not interesting for what concern the analysis of different
promotional frame perception.
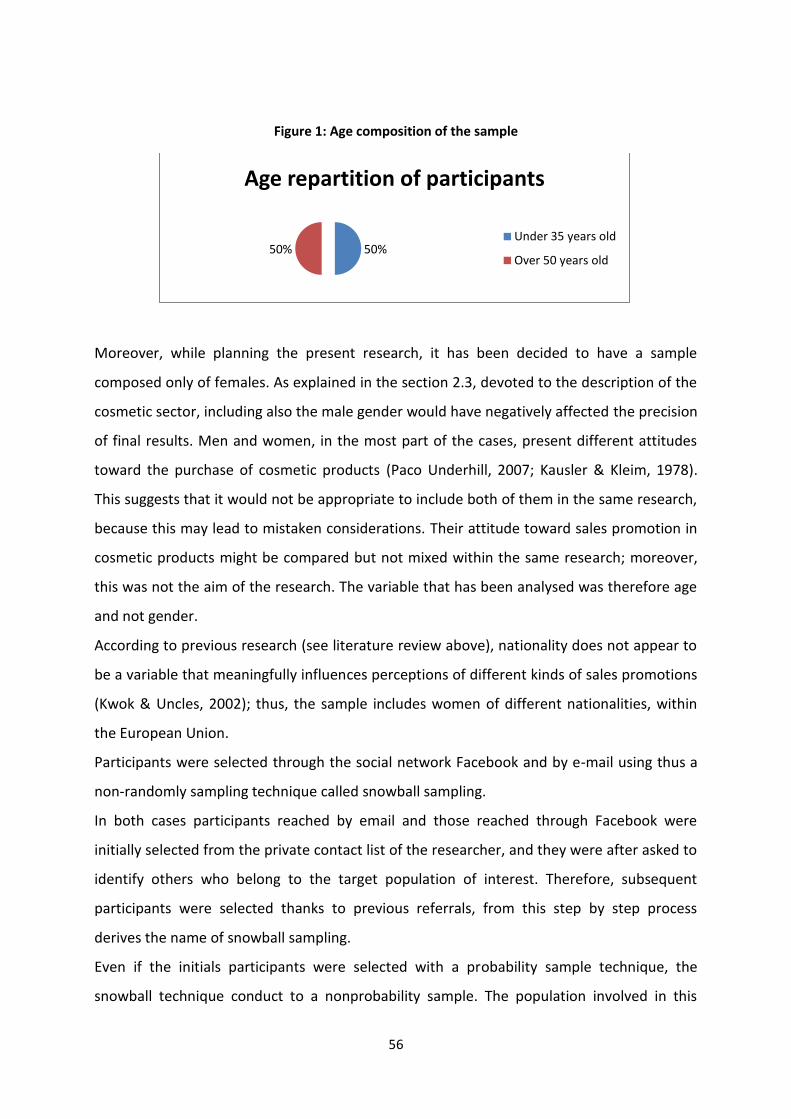
56
Figure 1: Age composition of the sample
Moreover, while planning the present research, it has been decided to have a sample
composed only of females. As explained in the section 2.3, devoted to the description of the
cosmetic sector, including also the male gender would have negatively affected the precision
of final results. Men and women, in the most part of the cases, present different attitudes
toward the purchase of cosmetic products (Paco Underhill, 2007; Kausler & Kleim, 1978).
This suggests that it would not be appropriate to include both of them in the same research,
because this may lead to mistaken considerations. Their attitude toward sales promotion in
cosmetic products might be compared but not mixed within the same research; moreover,
this was not the aim of the research. The variable that has been analysed was therefore age
and not gender.
According to previous research (see literature review above), nationality does not appear to
be a variable that meaningfully influences perceptions of different kinds of sales promotions
(Kwok & Uncles, 2002); thus, the sample includes women of different nationalities, within
the European Union.
Participants were selected through the social network Facebook and by e-‐mail using thus a
non-‐randomly sampling technique called snowball sampling.
In both cases participants reached by email and those reached through Facebook were
initially selected from the private contact list of the researcher, and they were after asked to
identify others who belong to the target population of interest. Therefore, subsequent
participants were selected thanks to previous referrals, from this step by step process
derives the name of snowball sampling.
Even if the initials participants were selected with a probability sample technique, the
snowball technique conduct to a nonprobability sample. The population involved in this
50%50%
Age repartition of participants
Under 35 years old
Over 50 years old

57
locations, ethnicity, race, nationality, gender, age, career, but also marital and
socioeconomic status.
6.2 The research methodology
The survey developed to investigate the problematic of this thesis, is structured according to
a quantitative research approach because it is used to test specific hypotheses and draw a
conclusion. This approach is particularly applied because it allows researchers to investigate
objectives in a very clear and specific way and it enables the statistical testing of hypotheses.
The research methods used in this thesis was the questionnaire, but other quantitative
methods that could have been chosen are: controlled observations, laboratory experiments
etc.
Consideration of the advantages and disadvantages of the quantitative and qualitative
research approaches suggests that quantitative research approach was more appropriate
give the objectives of the current research.
Moreover, the nature of the research carried out in this thesis follows the approach of a
descriptive research by testing hypotheses pertaining to the relationship between the age of
consumers and their reaction towards different promotional frames when applied to luxury
and non-‐luxury products. The data analysis will therefore measure the degree to which these
two variables are related, in order to be able to generalize the final result and then make
predictions. The degree of relation between two variables is known as correlation and its
strength influence the further predictions.
The data used in the current research are primary data. The data collected via the online
survey are considered as primary data because they have been gathered specifically for the
research of this thesis, and were not available before.
Other sources of data were used in the literature review. These included previous studies,
research papers, market research reports, internet sources, books and articles. The
utilization of these documents had been necessary to define the context in which the
research is conducted and to analyze the previous studies conducted in this field.

58
6.3 Design and procedure
The research was carried out through an online survey. This was created using a specific
The use of an online survey conveys different advantages:
-‐ They are inexpensive and simple to distribute;
-‐ The period of data collection is usually shorter than with other methodologies;
-‐ Respondents can have a more dynamic interaction with the questionnaire and
perceive it as less intrusive than questionnaire conducted by telephone or face to
face;
-‐ They are flexible to different situations (for example, respondents are allowed to
stop at a certain point of the survey, save it and continue it later);
-‐ They may include videos, sounds, and pictures.
Beside these positive characteristics, online surveys carry also some potential drawbacks,
such as the possibility of imprecise and hasty answers, or having people who respond several
times or who ask a friend to complete it.
The survey first included a structured question that asked to participants select their
appropriate age category. This was followed by four similarly-‐structured questions.
Each of them contained an image representing the product that the question referred to.
These were structured, multiple choice questions, consisting of four different promotional
frames options and a non-‐purchase option.
The formulation of the questions was the same for each of these, and asked which of the
decision. Equally also the order in which the different promotional frames were listed was
the same for all the four questions, but not the frame of the monetary saving related
because this changes according to the full price.
In order to capture only how the different promotional frames were perceived by
interviewees, the monetary saving offered by the four promotions was the same for each
product. In other words, each of the four promotions permits to save the same amount of
money, they only differ in how they are framed. All the deals were on a mathematical base
semantic
59
-‐price information and monetary value
of the deal. The base of this argument is a simple economic principle, which sustains that
consumers, while choosing among different deals, would try to minimize their effort and the
cost of the purchase (Diamond, 1992).
The saving has been calculated on the full price of each product, so it may differ from one
Interviewees were also provided with a fifth option, representing the decision to not buy
the product, regardless of the discount. This option was included in order to escape a
possible error. Some persons indeed could be completely non-‐interested in purchasing the
presented product and, in this case, an answer about which promotion influence their more,
would be given at random and could distort results.
Each participants was allowed to answer only once to the survey and was obliged to
answer all the questions.
Having closed-‐ended question guarantees, from the researcher point of view, an ease of
coding and analysing data, and from participants point of view an ease of answering that
provides subsequently more spontaneity. A possible error that has been taken into
consideration while creating the survey was to frame correctly the questions in order not to
have misunderstanding and not to induce people towards one the answers because this
could menace the reliability of data.
The instructions provided at the beginning of the survey, described a purchase context in
which interviewees should imagine to be, while completing the survey. This short
calculator handy and this should discourage them to make precise calculations and let more
space to spontaneous answers. The aim is indeed to evaluate the perception that consumers
have toward four different promotional frames and this would be damaged whether precise
mathematical counts were done.

60
IV. RESULTS
In this section, the results collected by the submission of the survey are analyzed and
discussed.
The survey website (Qualtrics.com) used to collect data gave the possibility to access the
rough data, thanks to this it was possible to have a wider understanding of the collected
data and to explore whether relationships exist between the three variables considered.
In table 7 the observed frequencies for both the age categories that have taken part to the
survey and split up in the two product categories are presented in a contingency table.
Table 7: Observed frequencies for both samples
PRODUCTS
LUXURY NON-‐LUXURY
DIOR YSL CLARINS CLINIQUE TOTAL
< 35 Years
old
% off 22 15 20 15 72
7 6 5 10 28
coupon 6 3 9 9 27
price pack 9 15 12 14 50
none 6 11 4 2 23
DIOR YSL CLARINS CLINIQUE TOTAL
> 50 Years old
% off 32 31 35 37 135
13 9 9 4 35
coupon 1 0 1 3 5
price pack 1 1 1 4 7
none 3 9 4 2 18
The table is divided in two parts: the part above shows the data collected from the younger
target, while in the part below the data collected from the elder one are presented. Each cell
indicates the absolute frequency, thus how many times a particular promotion has been
chosen according to each product (e.g. 22 younger participants declare to be more likely to
be influenced by percentage-‐off promotion when buying Dior product). The rows sum
rticular promotional
frame has been indicated by interviewees as the preferred promotion while purchasing one

61
particular product. These numbers may already show a particular trend about which
promotional frame is more likely to influence each target.
The vertical sum for each column gives the same result, thus 50. This appears obvious
because each participant was asked to make one choice for each product, for this reason
therefore the vertical sum must be 50.
The aim of the research carried out in this thesis was to study how two variables (age
frames. In other words, this research aimed to identify whether a relationship exists
between age, product category and promotion effectiveness, meaning with this the efficacy
of a sales promotion in influencing the purchase process of consumers till the point of
inducing them to buy.
The statistical area adapt to make general statements about a population based on
information collected from a sample of data is the inference.
According with the objectives of the current research the chi-‐square method has been
applied. This method is considered to be particularly useful when the aim is to determine
whether there is a relationship between two nominal/categorical variables. In the case this
relationship does not exist, the two variables would be considered as independent or
unrelated. Moreover this method enables the researcher to measure how likely is the
possibility that an observed relationship has occurred by chance and that actually the two
variables are unrelated. According with the chi-‐square analysis two elements should be
calculated to determine whether there is evidence of a relationship between the two
observed categorical variables, and thus whether the statistic is interesting:
-‐ 2
-‐ Degrees of freedom (df) : = 1 1
Where 2 is the chi-‐square value of the observed distribution, is the number of columns,
and the number of rows or levels of the second variable.
The first element is calculated using this formula (1), which computes how the pattern of
observed frequencies differs from the pattern of expected frequencies:
(1) 2 = ( )2
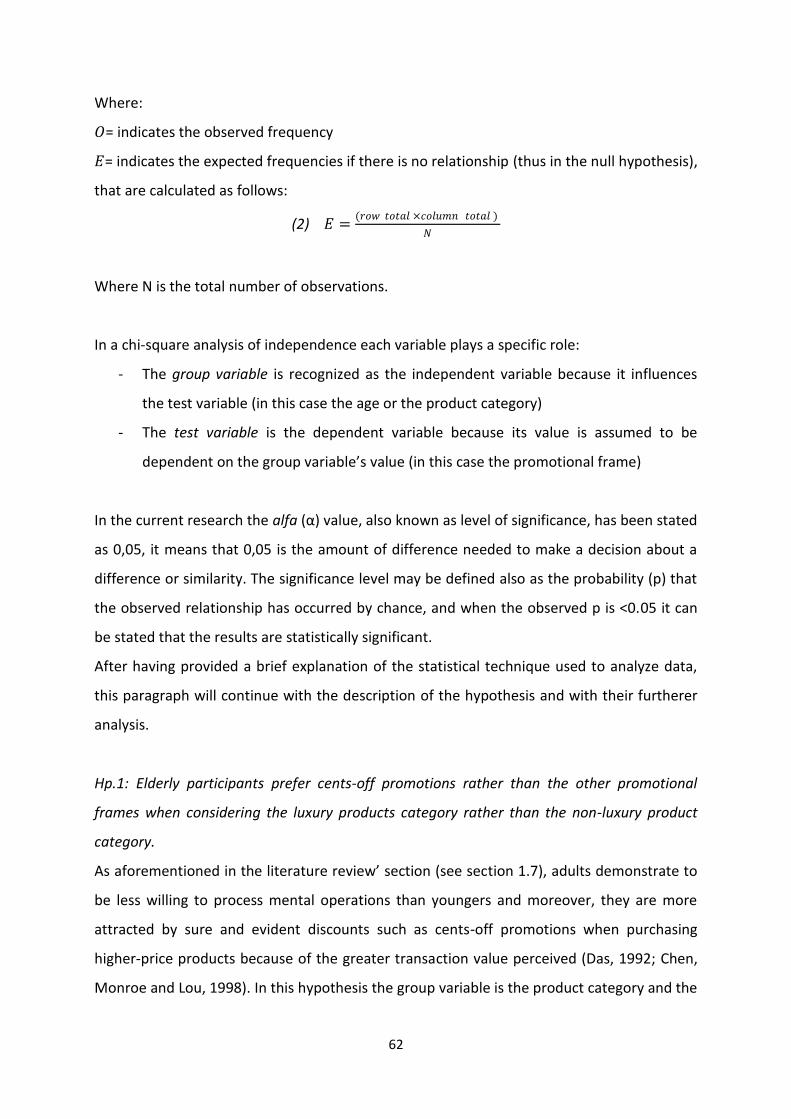
62
Where: = indicates the observed frequency
= indicates the expected frequencies if there is no relationship (thus in the null hypothesis),
that are calculated as follows:
(2) = ( × )
Where N is the total number of observations.
In a chi-‐square analysis of independence each variable plays a specific role:
-‐ The group variable is recognized as the independent variable because it influences
the test variable (in this case the age or the product category)
-‐ The test variable is the dependent variable because its value is assumed to be
In the current research the alfa
as 0,05, it means that 0,05 is the amount of difference needed to make a decision about a
difference or similarity. The significance level may be defined also as the probability (p) that
the observed relationship has occurred by chance, and when the observed p is <0.05 it can
be stated that the results are statistically significant.
After having provided a brief explanation of the statistical technique used to analyze data,
this paragraph will continue with the description of the hypothesis and with their furtherer
analysis.
Hp.1: Elderly participants prefer cents-‐off promotions rather than the other promotional
frames when considering the luxury products category rather than the non-‐luxury product
category.
tion 1.7), adults demonstrate to
be less willing to process mental operations than youngers and moreover, they are more
attracted by sure and evident discounts such as cents-‐off promotions when purchasing
higher-‐price products because of the greater transaction value perceived (Das, 1992; Chen,
Monroe and Lou, 1998). In this hypothesis the group variable is the product category and the
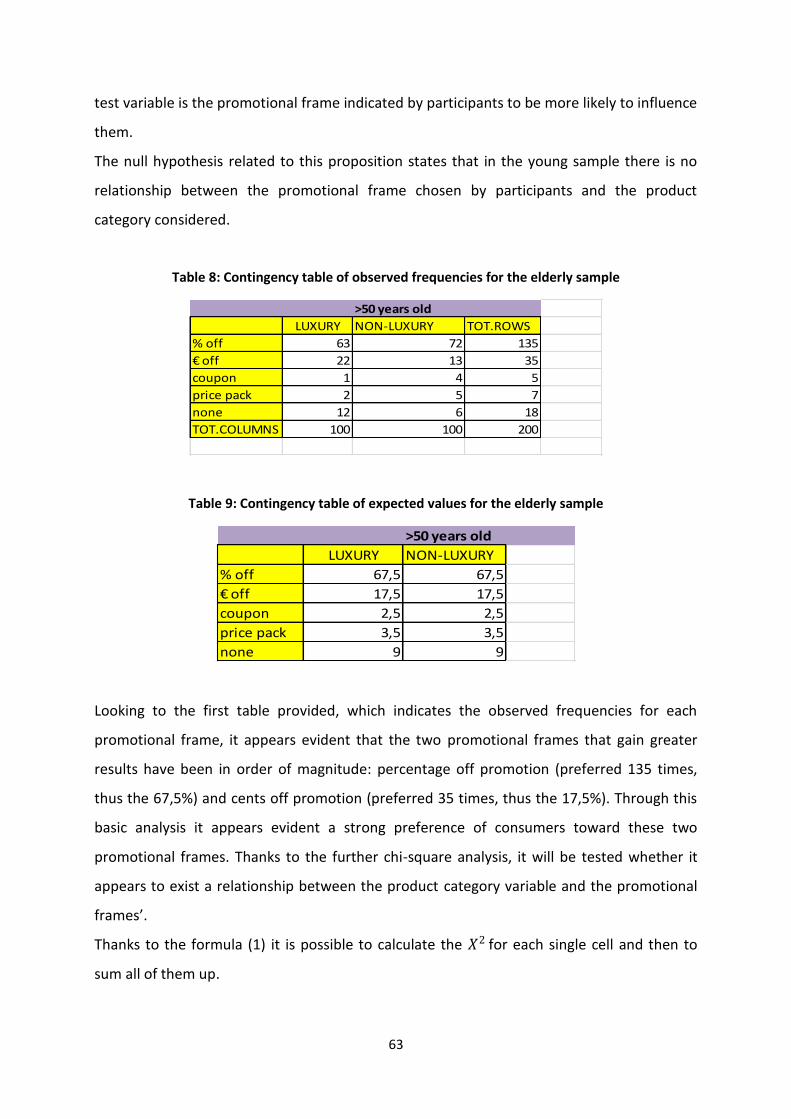
63
test variable is the promotional frame indicated by participants to be more likely to influence
them.
The null hypothesis related to this proposition states that in the young sample there is no
relationship between the promotional frame chosen by participants and the product
category considered.
Table 8: Contingency table of observed frequencies for the elderly sample
>50 years oldLUXURY NON-‐LUXURY TOT.ROWS
% off 63 72 13522 13 35
coupon 1 4 5price pack 2 5 7none 12 6 18TOT.COLUMNS 100 100 200
Table 9: Contingency table of expected values for the elderly sample
>50 years oldLUXURY NON-‐LUXURY
% off 67,5 67,517,5 17,5
coupon 2,5 2,5price pack 3,5 3,5none 9 9
Looking to the first table provided, which indicates the observed frequencies for each
promotional frame, it appears evident that the two promotional frames that gain greater
results have been in order of magnitude: percentage off promotion (preferred 135 times,
thus the 67,5%) and cents off promotion (preferred 35 times, thus the 17,5%). Through this
basic analysis it appears evident a strong preference of consumers toward these two
promotional frames. Thanks to the further chi-‐square analysis, it will be tested whether it
appears to exist a relationship between the product category variable and the promotional
Thanks to the formula (1) it is possible to calculate the 2 for each single cell and then to
sum all of them up.

64
The table below shows all the values which should be considered to test whether a
relationship appear to be existent or not in the elder sample between these two variables:
promotional frames and product category, in other words whether the null hypothesis
should be rejected or not.
chi-‐square 8alfa 0,05df 4
critical value 9,49
Belonging to the precedent analysis the hypothesis 1 should be rejected because the chi-‐
square value is smaller than the critical value of the chi-‐square distribution with appropriate
the 0,05 level. The conclusion that the two variables appear to be independent means that:
in the observed sample, the classification of a case into a particular category of the group
variable has no effect on the probability that the case will fall into any specific category of
the test variable.
The two figures below show graphically how the observed frequencies of the elderly target
of participants have been distributed among the different promotional frames available in
relation with the category of product.
Figure 2: Observed frequencies of promotional frames for each product
0
10
20
30
40
DIOR YSL CLARINS CLINIQUE
Observed frequencies of the elderly target for each product
% off
off
coupon
price pack
none

65
Figure 3: Observed frequencies of promotional frames for both the product categories
Hp.2: Young participants appear to be more likely to be influenced by percentage-‐off
promotions rather than the other promotional frames when considering the luxury products
category as opposite to the non-‐luxury products category.
more willing to process mental operations that may lead to information of more elaborate
encoding and, at the same time, they are more likely to be influenced by percentage
promotions when purchasing higher-‐price products (Kausler and Klein, 1978; Chen, Monroe
and Lou, 1998). The null hypothesis here states that there is no relationship between the
promotional frame chosen by young participants and the product category considered.
Table 10: Contingency table of observed frequencies for the young sample
<35 years oldLUXURY NON-‐LUXURY TOT.ROWS
% off 37 35 7213 15 28
coupon 9 18 27price pack 24 26 50none 17 6 23TOT.COLUMNS 100 100 200
0
20
40
60
80
% off off coupon price pack none
Observed frequencies of the elderly target for product category
LUXURY
NON-‐LUXURY

66
Table 11: Contingency table of expected values for the young sample
<35 years oldLUXURY NON-‐LUXURY
% off 36 3614 14
coupon 13,5 13,5price pack 25 25none 11,5 11,5
Looking at the first of the two tables provided, it appears evident that the young sample is
more attracted by percentage-‐off promotional frame, it was therefore chosen 72 times out
of 200, thus the 36%. The second promotional frame that appear to be more likely to
responses.
This short analysis may lead to a partial conclusion about the existence or not of a
relationship; a further chi-‐square analysis enable to measure statistically the presence of this
relationship. The formula (1) it is applied to calculate the 2 for each single cell and then to
sum all of them up, in order to verify whether, in the observed sample, a relationship
appears to exist or not between the promotional frames (test variable) and the product
category (group variable), in other words whether the null hypothesis should be rejected or
not.
chi-‐square 8,54alfa 0,05df 4
critical value 9,49
The null hypothesis related with the hypothesis 2, stated that no relationship exists between
the promotional frame chosen by participants and the product category. Belonging to the
previous analysis the null hypothesis should be accepted because the chi-‐square value is
smaller than the critical value of the chi-‐square distribution with appropriate degrees of
the 0,05 level.

67
The two figures below (Figure 4 and 5) show graphically how the observed frequencies of
the young sample are distributed among the different promotional frames presented, in the
first figure according with the two product categories, and in the second according to each
single product.
Figure 4: Observed frequencies of the young target for both product categories
Figure 5: Observed frequencies of the young target for each product
Hp.3: Both the age categories of interviewees prefer cents-‐off promotions rather than other
promotional frames whether asked to purchase luxury products rather than non-‐luxury
products.
Previous studies mentioned in the literature review section (see section 1.7) lead to the
proposition belonging to which it appears to exist a relationship between the preference of
one particular promotional frame, cents-‐off, and the product category. Even if the monetary
saving is equivalent on an economic basis, consumers will be more likely to prefer cents-‐off
0
10
20
30
40
50
60
70
80
% off off coupon price pack none
LUXURY
NON-‐LUXURY
0
5
10
15
20
25
30
35
40
DIOR YSL CLARINS CLINIQUE
% off
off
coupon
price pack
none

68
promotions for high-‐price products (Das, 1992). The null hypothesis related to Hp.3 states
that no relationship exists between the product category and the chosen promotional frame.
Table 12: Contingency table of observed frequencies for both samples
% OFF COUPONS PRICE PACKS NONE TOT.ROWSLUXURY 100 35 10 26 29 200NON-‐LUXURY 107 28 22 31 12 200TOT.COLUMNS 207 63 32 57 41 400
Table 13: Contingency table of expected value for both samples
% OFF COUPONS PRICE PACKS NONELUXURY 103,5 31,5 16 28,5 20,5
NON-‐LUXURY 103,5 31,5 16 28,5 20,5
Actually the hypothesis is not really supported by observed frequencies. Looking at the first
table indeed the percentage-‐off promotion in the luxury product category appears to gain
the greatest result, 100 answers out of 200, which means the 50%. On the contrary, the
cents-‐off promotion received only the 17,5% of the total possible answers, which is however
the second greatest result. The chi-‐square analysis will provide a more deep analysis about
the existence of a relationship between product category and promotional frame.
chi-‐square 13alfa 0,05df 4
critical value 9,49
In this case the chi-‐square value is superior to the critical value of the chi-‐square distribution,
this results allows to affirm that it appears to exist a relationship in the observed sample
between the promotional frame chosen and the relative product category considered. The
null hypothesis of no association can be rejected, and this indicates that the relationship
appears to be statistically significant at the 0,05 level in the observed sample.
69
After having proved the existence of a relationship between these two variables in this
specific sample, further step may be the calculation of the phi coefficient in order to
determine the strength of this relationship. The phi coefficient should be calculated as
follows:
-‐ If df = 1: = 2/
-‐ = 2/ ( 1) (3)
Where:
2= chi square value
= total number of observations
k= number of rows or columns, whichever is smaller
that the association is not very strong, since this index can range from 0 to 1.
Knowing that a relationship exists between these two variables, it might be moreover
interesting to understand which cells caused the greatest difference between the expected
and the observed values and therefore induced the relationship to be statistically significant.
This knowledge may help meaningfully the data interpretation.
difference between the observed and the expected values. These results should highlight
which among the five possible options played a more important role in determining the
existence of a relationship. These values have been then standardized in the second table so
that they do not depend anymore on the size of the relative cell. The values highlighted with
the green color represent the cells that had the greatest impact on the relationship,
more than the other options the relationship between the two variables.

70
Table 14: Residuals between observed and expected frequencies
% OFF COUPONS PRICE PACKS NONELUXURY -‐3,5 -‐3,5 -‐6 -‐2,5 8,5NON-‐LUXURY 3,5 3,5 6 2,5 -‐8,5
Table 15: Standardized residuals between observed and expected frequencies
% OFF COUPONS PRICE PACKS NONELUXURY -‐0,70043 0,960822 -‐2,211629 -‐0,71518 2,802462NON-‐LUXURY 0,700429 -‐0,96082 2,211629 0,71518 -‐2,80246
Hp.4 Elderly participants rather than young participants prefer cents-‐off promotions rather
than other promotional frames for both the products categories, luxury and non-‐luxury.
This hypothesis tests whether a relationship exists between the age category and the
promotional frame that participants are more likely to be influenced by. Elderly consumers
therefore appear to be more sensitive to evident and immediate promotions rather than
other kind of sales promotions (Hulicka and Weiss, 1965; Kausler and Klein 1978). The null
hypothesis, in the opposite, expects that there is no relationship between age and the
promotional frame chosen.
Table 16: Contingency table of observed frequencies for both product categories
% off coupon price pack none TOT.ROWS<35 years old 72 28 27 50 23 200>50 years old 135 35 5 7 18 200TOT.COLUMNS 207 63 32 57 41 400
Table 17: Contingency table of expected value for both product categories
% off coupon price pack none<35 years old 103,5 31,5 16 28,5 20,5>50 years old 103,5 31,5 16 28,5 20,5
The table with the observed frequencies shows a strong preference of the elderly sample
toward the percentage off promotion (67,5%) and the cents-‐off promotion (17,5%). These
two promotional frames cover the 85% of the total frequencies, it suggests therefore that

71
there is a strong preference of the elderly sample toward these promotions, on the contrary
the younger sample presents only the 50% of their total frequencies towards the two same
promotions. The chi-‐square analysis will test the statistical significance of the observed
association.
chi-‐square 68,13alfa 0,05df 4
critical value 9,49
The chi-‐square value is greater than the critical value and this allows to reject the null
hypothesis stating that it appears to exist a relationship between the age and the
promotional frame indicated by interviewees as more likely to influence their purchases. The
= 0,41
This value allow to affirm that the association between the two variable is strong.
To better explore which of the promotional frames play a more important role in this
association, in the tables below the differences between the observed and the expected
values have been calculated. This knowledge will lead to a deeper interpretation of the
association between age categories and promotional frames.
Table 18: Residuals between observed and expected frequencies
% off coupon price pack none<35 years old -‐31,5 -‐3,5 11 21,5 2,5>50 years old 31,5 3,5 -‐11 -‐21,5 -‐2,5
Table 19: Standardized residuals between observed and expected frequencies
% off coupon price packnone<35 years old -‐6,3 -‐0,96 4,05 6,15 0,82>50 years old 6,3 0,96 -‐4,05 -‐6,15 -‐0,82

72
In the figure below a graphic representation of the observed frequencies is provided in order
to make differences on sales promotion preferences more visible as split up for each age
category.
Figure 6: Observed frequencies split up for the two age categories
Hp.5 In purchasing luxury products, young participants rather than elderly participants
appear to be more likely to be influenced by percentage-‐off promotions.
This hypothesis aim to verify whether a relation exists between the age variable (group
variable) and the promotional frame chosen (test variable). As aforementioned in the
literature review (see section 1.7) young participants appear to be more willing to process
mental operations and to be more attracted by their results (Hulicka and Weiss, 1965;
Kausler and Klein 1978). The null hypothesis states that no relationship exists between the
age and the preference toward a specific promotional frame.
Table 20: Contingency table of observed frequencies for both age categories in purchasing luxury
products
% OFF COUPONS PRICE PACKS NONE TOT.ROWS<35 years old 37 13 9 24 17 100>50 years old 63 22 1 2 12 100TOT.COLUMNS 100 35 10 26 29 200
0
20
40
60
80
100
120
140
160
% off off coupon price pack none
<35 years old
>50 years old

73
Table : Contingency table of expected frequencies for both age categories in purchasing luxury
products
% OFF COUPONS PRICE PACKS NONE<35 years old 50 17,5 5 13 14,5>50 years old 50 17,5 5 13 14,5
Analyzing the data provided in the first table, it appears clear that the young sample, as
opposite to the elderly sample does not show a great attitude toward percentage-‐off
promotions (37%) while purchasing a luxury product. On the other side the elderly sample
show a greater tendency toward this promotional frame, thus the 63%. Unlike the elderly
sample, young participants present a more equal distribution of their frequencies among the
different promotional frame. The chi-‐square analysis will enable to have a statistical prof of
whether the relation between these two variables exists or not.
The results from the chi-‐square analysis suggest that a relationship exists between age and
the promotional frame people appear to be more likely to be influenced by, when
th of
this relationship, highlights a strong association between the two variables.
= 0,42
Table 22: Residuals between observed and expected frequencies
% OFF COUPONS PRICE PACKS NONE<35 years old -‐13 -‐4,5 4 11 2,5>50 years old 13 4,5 -‐4 -‐11 -‐2,5
chi-‐square 34,95alfa 0,05df 4
critical value 9,49

74
Table 23: Standardized residuals between observed and expected frequencies
% OFF COUPONS PRICE PACKS NONE<35 years old -‐3,68 -‐1,67 2,6 4,63 1>50 years old 3,68 1,67 -‐2,6 -‐4,63 -‐1
The calculation of the residuals, the differences between the observed values and the
expected ones is presented in the two tables above, in the first in absolute terms and in the
second after the standardization of data. It appears therefore that percentage-‐off and
coupons are the cells which are more responsible of the association between the two
variables. The meaning and the implications of this result will be better explained in the next
section.
Hp.6 When purchasing non-‐luxury products, young participant rather than elderly
participants appear to be more likely to be influenced by coupons promotions.
Young participants are less sensitive than elderly participant in percentage-‐off promotions
especially when these are applied on non-‐luxury products. The following analysis aim to test
whether a relationship exists between age and promotional frames when purchasing non-‐
luxury products. Belonging to the null hypothesis the age variable does not influence the
typology of promotional frame participant admit to be more likely to be influenced by. As
aforementioned in the literature review coupons have severally proved to be particularly
attractive toward young consumers (Chen, Monroe and Lou, 1998).
Table 24: Observed frequencies summing up both product categories
% OFF COUPONS PRICE PACKS NONE TOT.ROWS<35 years old 35 15 18 26 6 100>50 years old 72 13 4 5 6 100TOT.COLUMNS 107 28 22 31 12 200
Table 3: Expected values summing up both product categories
% OFF COUPONS PRICE PACKS NONE<35 years old 53,5 14 11 15,5 6>50 years old 53,5 14 11 15,5 6

75
As it appears clear in some of the previous hypothesis, preferences of the elderly sample
focused mainly on percentage-‐off promotions, while those of the younger sample are more
equally distributed among different options of promotional frames. While for elderly
participants percentage-‐off promotions covers the 72% of their total preferences, for the
younger sample this promotional frames acquired only the 35%, a percentage that appears
to be really close to the one of coupons (18%) and price packs (26%)
chi-‐square 36,07alfa 0,05df 4
critical value 9,49
The chi-‐square analysis tested that the relationship between age and promotional frames
appears to be statistically significant at a 0,05 level while purchasing luxury products, and
moreover belonging to
= 0,42
Table 26: Residuals between observed and expected values
% OFF COUPONSPRICE PACKS NONE<35 years old -‐18,5 1 7 10,5 0>50 years old 18,5 -‐1 -‐7 -‐10,5 0
Table 27: Standardized residuals between observed and expected values
% OFF COUPONS PRICE PACKS NONE<35 years old -‐5,25 0,41 3,16 4,1 0>50 years old 5,25 -‐0,41 -‐3,16 -‐4,1 0
From the analysis of the residual, both in absolute and standardized terms, the cells which
have contributed more to the aforementioned association are highlighted in green. A
reflection upon the role of these three promotional frame swill be further provided in the
next section in order to better explain how the evidence of this association may be exploited
concretely.

76
V. DISCUSSION AND MANAGERIAL IMPLICATIONS
After having statistically analysed the collected data using the chi-‐square technique, in this
section the results achieved will be interpreted in order to draw some conclusions and some
managerial implications. These may be really useful for a practical application and
exploitation of the relationship between the variables which have been taken into
consideration.
The first two hypothesis tested whether a relationship exists between the product category
and the promotional frame consumers declare to be more likely to be influenced by. The
first hypothesis concentrated on the elderly sample while the second focused on the young
sample. The chi-‐square analysis of both the contingency tables provided the same result: it
appears not to exist a relationship between these two variables in both the samples. It
suggests therefore not to base the choice of which promotion to use on the product
category of the item the sales promotion is applied to. In other word, the product category
does not seems to influence the way consumers (elderly, hp.1 and young, hp.2) perceived
the transaction value of a certain promotion.
The observed frequencies appear to support the statistical results. The data collected from
the elderly sample show indeed that in both the product categories (luxury and non-‐luxury)
the 85% of the total preferences is given to the percentage-‐off and cents-‐off promotions, so
non-‐luxury products. Despite the fact that these two first hypothesis do not appear to be
verified in the observed samples, another important conclusion may be drawn from the data
of the elderly sample: independently from the category of the product to which it is applied,
older consumers appear to be more sensible and more likely to be influenced by evident
monetary savings such as percentage-‐off and money-‐off. This awareness may induce
marketers to exploit more these two sales promotional frames when targeting an elderly
objective: influence their purchase process.
On the contrary, in the young sample there is not the same evidence. Preferences are
allocated not only in the first two promotional frames, percentage-‐off and cents-‐off (50%)
but a significant percentage (25%) is allocated on price packs. This tendency may be of great
77
interest for marketers and may be better explored in further researches in order to
understand whether it was an isolated characteristic of the observed sample or whether it
may be generalized to the young population.
The third hypothesis tested the same variables but in a different sample. In this case the
results achieved by each sample (young and elderly) have been combined and the chi-‐square
analysis has been applied. The relationship between the product category and the
promotional frame appears in this sample to exist (13>9,49) and to be significant at the 0,05
level. As in the previous discussion, the percentage-‐off promotion received the greatest
amount of preferences among the others in both the product categories (51,75%). Even if
to look at the cells which have contributed more to the existence of this relationship. From
the analysis of the residuals, thus the differences between observed and expected values,
present the biggest difference from the expected values. In the non-‐luxury product category
coupons achieved a significant amount of preferences and this observation may lead to
some interesting information, to be better explored in further researches. For what concerns
the objectives of this research it is enough to say that in a population which includes both
young and elderly participants the product category of the promoted item influence the way
consumers perceive different promotional frames. In particular the sensibility to coupons
appears to differ meaningfully whether these are applied to luxury or non-‐luxury products
these are applied to non-‐luxury products.
This deduction may induce marketers to reflect upon which sales promotional frames would
reach better results when applied to a non-‐luxury or a luxury product. If on one side the
preference for percentage-‐off has already been proved man times, the attractiveness that
coupons exert when applied to non-‐luxury products is something new that may be source of
inspiration for marketers while applying a sales promotion campaign on non-‐luxury
products.
The fourth hypothesis tested whether a relationship exists between the age category and
the promotional frame to which participants declare to be more sensitive. Here the two
78
products categories are not considered and from the results it appears to exist a relationship
(68,13>9,49) between the age and the way consumers perceive sales promotions in the
observed sample. Elderly participants demonstrate a really strong attitude toward
percentage-‐off and cents-‐off promotions, greater than the one showed by youngers. The
Percentage-‐off promotions, coupons and price packs appear to be the cells that played a
more important role in creating this association. A part from percentage-‐off promotions,
which already demonstrated to have a particular positive impact on consumers
independently from the age, a reflection on coupons and price packs may be useful for
marketers in the real application. The younger target indeed showed a significant attitude
toward these two promotions, much bigger of the one showed by the elderly sample. This
attitude of young consumers toward coupons should be more explored and may be a useful
knowledge for marketers. They could indeed better address a sales promotion to a specific
target, in this case the younger one, and by the way improve the effectiveness of the sales
promotional campaign.
The fifth hypothesis tested whether a relationship exists between age and the preferred
promotional frame when purchasing luxury products. A first observation based on the
analysis of the observed frequencies highlights that it appears to exist a difference between
the way young and elderly participants allocated their preferences when purchasing luxury
products. The elderly sample indeed showed a greater tendency toward percentage-‐off
promotion rather than the younger sample, and moreover from the chi-‐square analysis it
appears to exists a relationship between age and the perception of promotional frames
when purchasing higher-‐price products. Percentage-‐off promotions and price packs appear
to play an important role in this association. Indeed the way these are perceived by
consumers changes a lot according to the age category of participants, and this evidence
may be of great importance both for marketers and for researchers in further studies. While
planning a sales promotional campaign on luxury products, the use of price packs to address
the younger target and percentage-‐off promotions when targeting elderly consumers may
improve the effectiveness of the total campaign. Marketers should in other words take into
account the age variable when planning sales promotions on luxury products, because this
uptake may improve significantly the effectiveness of the campaign in the whole.

79
Finally the sixth hypothesis tested whether a relationship exists between age and the
promotional frames perception when people are buying non-‐luxury products. The results
achieved in this analysis were quite interesting. A part from percentage promotions, which
their age, coupons and price packs appear to play a great influence on the young target
when purchasing non-‐luxury products and this knowledge may serve as point of reflection
for marketers. The previous hypothesis also highlighted this positive attitude of younger
consumers toward coupons and price packs, therefore it may be concluded that when
addressing a younger target the use of coupons and price packs may have a great impact
both when the promotions are applied to a higher or lower priced products.
In conclusion age and products categories were found to be responsible factors of
differences in customers' perceptions when facing promotional frames which were equal on
an economical basis. Practical implications of the aforementioned outcomes involve in
particular two areas of marketing. On one hand, the possibility of segmenting customers
according to the research results and on the other, to target pricing schemes specific to
these segments. The combination of these two actions would potentially improve
customers' deals perception and influence their intentions to purchase until the point of
inducing them to buy the promoted product.

80
V. LIMITATIONS OF THE RESEARCH
While analysing the results achieved by the research conducted in this thesis, it is important
to take into consideration some factors which might have occurred in its different phases
and which have been in some way involved in the results generation.
Some of the limitations, that will be described in this section, are related with the sample,
others with how the survey was conducted and others with the external context.
In the following list, the principal limitations will be recalled and briefly described:
The characteristics of the sample are extremely important in generating results and whether
underestimated may conduct to a wrong interpretation of them. The sample of the current
research was composed only buy women, of different age and nationalities. These three
demographic characteristics whether modified may lead to different results and different
conclusions. For example, carrying out the same survey but addressing only women
belonging to a specific nationality may generate different results. The choice of including in
the survey women from different countries was based on previous studies (Kwok & Uncles,
2002), which proved that this variable does not affect how they perceive promotions, but
even accepting this statement the possibility of any influence cannot be totally excluded;
Fake purchase context
The context is which interviewees were demanded to answer was not a real purchase
context, meaning with this a perfumery or a cosmetic shop. Even if the short introduction at
the beginning of the questionnaire had the aim of projecting interviewees in a real context,
it must be taken into con
shopping context, all the external factors that surround consumers play a very important
role and could sometimes even change their purchase process. The impossibility of
recreating a shop environment in an online survey may be a factor that influence
Subjective product involvement

81
The choice of which products should be included in the survey was not an easy matter. The
attitude that each person has toward a specific product is really subjective and personal, and
therefore difficult to detach. In order to limit this problem a pre-‐test (see section 5) has been
conducted. The aim of the pre-‐test was indeed to identify four products that were clearly
recognized as luxury or non-‐luxury by a large sample of people, and avoid in this way the risk
-‐test
ge
sample of consumers, some of them have a particular attitude toward the products object of
the survey;
Quantitative research design
Also the way the survey has been structured plays an important roles in generating results.
The quantitative research, as it is defined, presents a lack in the general description of the
responses. Moreover, the choice of using closed-‐ended questions, even if it involves several
advantages, entails also a sort of inflexibility. These factors reduce the possibility of
generalizing the results and of identifying wider trends or phenomenon;
Assumption at the base of the chi-‐square analysis
One of the assumption at the bases of the chi-‐square analysis states that it should not be
conducted when the expected frequencies in any of the cells of the contingency table is less
than five. Whether this case is presented a correction factor should be applied. In the case of
the current research this happened in the first hypothesis but no correction factor has been
applied because this matter is still a controverted subject among researchers. Anyway this
fact may have limited in some way the research and should therefore be taken into
consideration.

82
VI. FURTHER RESEARCHES
The research conducted in this thesis focuses on the relationship between some different
promotion typologies and two other variables: the age of the consumers and the typology of
the product the promotion is applied to, in order to det
Discovering the most effective patterns enable marketers to increase the total effectiveness
of the sales promotion campaign implemented.
As aforementioned, the context is really important and may deeply influence the way
consumers perceive marketing activities. In this circle people appear to be influenced by
economic, social and environmental events and, equally the context and marketing decisions
s. A proof of this deep relation is the
noteworthy switch from the overuse of advertising toward sales promotions. In this case,
new tendencies.
Nowadays the sales promotion system is well developed and new problems are arising. With
the pass of the years various typologies of sales promotions have been framed and the direct
consequence of this is that now it results really difficult to choose among them.
A sales promotion campaign is anyway a cost for the company that plan it and more
effective it is, more profitable it is for the company. From here the necessity of identify and
analyse whether relationships occur between sales promotional frames and other particular
variables, which might be related to: consumers, products, external environment etc. The
more these relationships are known, the more it will be possible for marketers to increase
the effectiveness of sales promotions activities, this is the reason why further researches
might be of great importance.
Further researches may thus continue having as objective to investigate the strength,
whether it exists, of relationships between other unexplored variables.
It might be of particular interest indeed to better explore the relationship between the
effectiveness of a certain promotion applied to some particular product categories. Knowing
that consumers are more likely to be influenced in their purchases by a cents-‐off promotion
rather than a sweepstake or a coupon, might be not enough. Indeed the perception of a
sales promotion might change according to the life-‐cycle of the product which it is related
to, or to the level of quality attributed to that brand or to the private or non-‐private nature
83
of the label etc. The knowledge of these patterns might considerably simplify the choice to
marketers.
Moreover, it might be interesting as well to determine whether some environmental factors
or stimuli related with the context of purchase, play a significant role in the perception of
different promotional frames. And whether this relation exists, both marketers and retailers
may take advantage if it adapting the promotion implementation to the context. Haans and
Gijsbrechts (2011) studied whether a relation exists between the store size and the sales
promotions results. Their outcomes proved that for each of the promotions applied, the
percentage of increase of sales volume was lower in larger stores.
Finally, going on concentrating on some consumer variables and specifically exploring how
demographical characteristics, such as age, gender, nationality, level of study, level of
employment etc. influence the way these people perceive different promotional frames,
might always be an interesting field to improve the effectiveness of sales promotions.

84
VII. BIBLIOGRAPHY
Ambler, T. (1996). The financial times guide to marketing: from advertising to zen. London: Pitman publishing;
Blattberg, R. C., Briesh, R. and Fox, E.J. (1995). How promotions work. Source: Marketing Science; Part 2 of 2, Vol. 14 Issue 3, pG122, 11p;
Blattberg, R. C. and Neslin, S.A. (1989). Sales Promotion: The Long and the Short of It. Source: Marketing Letters; Vol. 1 Issue 1, p81-‐97, 17p;
Blattberg, R. C. and Neslin, S. A. (1990). Sales promotion: concepts, methods and strategies. New Jersey: Prentice Hall;
Brassington, F. and Pettitt, S. (2006). Principles of marketing. Enhanced Media Edition;
Campbell, L. and Diamond, W. D.(1990). Framing and sales promotion: the characteristics of a good deal?. Source: Journal of Consumer Marketing; Vol. 7 Issue 4, p25, 7p;
Chandon, P., Wansik, B. and Gilles, L. (2000). A benefit congruency framework of sales promotion effectiveness, Forthcoming Journal of marketing;
Chen, S., Monroe, K. B. and Lou, Y. (1988). The Effects of Framing Price Promotion Messages on Consumers' Perceptions and Purchase Intentions. Source: Journal of Retailing; Vol. 74 Issue 3, p353-‐372, 20p;
Das, P. R. (1992). Semantic cues and buyer evaluation of promotion communication. In R. P. Leone & V. Kumar (Eds.), Enhancing knowledge development in marketing, {Vol. 3, pp. 12-‐17). Chicago: American Marketing Association;
Del Vecchio, D., Krishnan, H. S. and Smith, D. C. (2007). Cents or Percent? The Effects of Promotion Framing on Price Expectations and Choice. Source: Journal of Marketing, Vol. 71 Issue 3, p158-‐170, 13p;
Diamond, W. D. and Sanyal, A. (1990). The effect of framing on the choice of supermarket coupons. Advances in consumer research (Vol. 17, pp. 494-‐500). Provo, UT: Association for Consumer Research;
Diamond, W. D. and Johnson, R. R (1990). The framing of sales promotions: an approach to classification, in Advances in Consumer Research Volume 17, eds. Marvin E. Goldberg, Gerald Gorn, and Richard W. Pollay, Provo, UT : Association for Consumer Research, Pages: 494-‐500;
Diamond, W. D. (1992). Just What is a 'Dollar's Worth'? Consumer Reactions to Price Discounts vs. Extra Product Promotions. Journal of Retailing, Vol. 68 Issue 3, p254, 17p;

85
Folkes, V. and Wheat, R. D. (1995). Consumers' price perceptions of promoted products. Source: Journal of Retailing; Vol. 71 Issue 3, p317, 12p;
Gamliel, E. and Herstein, R. (2011). To save or to lose: does framing price promotion affect Source: Journal of consumer marketing, Issue 2;
Global Insight, (2007). A Study of the European Cosmetics Industry. Prepared for: European Commission, Directorate General for Enterprise and Industry;
Haans, H. and Gijsbrechts, E. (2011). -‐deal-‐fits-‐effectiveness in smaller versus larger supermarkets. Source: Journal of retailing;
Hardesty, D. M. and Bearden, W. O. (2003). Consumer evaluations of different promotion types and price presentations: the moderating role of promotional benefit level. Journal of retailing;
Hulicka, I. M. and Weiss, R. (1965). Age Differences in Retention as a Function of Learning, Journal of Consulting Psychology, 125-‐9;
Janiszewski, C. and Cunha, J. M. (2004). The Influence of Price Discount Framing on the Evaluation of a Product Bundle. Source: Journal of Consumer Research, Vol. 30 Issue 4, p534-‐546, 13p;
Kausler, D. H. and Kleim, D. M., (1978). Age Differences in Processing Relevant Versus Irrelevant Stimuli in Multiple Item Recognition Leaming, Journal of Gerontology, 33, 87.-‐93;
Kotler, P. (1988). Marketing management: analysis, planning, implementation and control. New Jersey: Prentice Hall;
Kotler, P. and Armstrong, G. (2009). Principles of marketing. New Jersey: Prentice Hall;
Kwok, S. and Uncles, M. (2002). Sales Promotion Effectiveness: The Impact of Culture at an Ethnic-‐Group Level, School of Marketing Working Paper, University of New South Wales;
Li, S., Sun, Y. & Wang, Y. (2007). 50% Off or Buy One Get One Free? Frame Preference as a Function of Consumable Nature in Dairy Products. Source: The Journal of Social Psychology; 413 421;
Malhotra, N. K. and Birks, D. F. (2007). Marketing research: An applied approach. Harlow, United Kingdom: FT Prentice Hall;
Monroe, K. B. (1973). Buyers' Subjective Perceptions of Price. Source: Journal of Marketing Research; Vol. 10 Issue 1, p70-‐80, 11p;
Munger,J. L. and Grewal, D. (2001). The effects of alternative price promotional methods on , Journal of Product & Brand
Management, Vol. 10 Issue: 3, pp.185 197;
86
Pandelaere, M. and Bries, B. (2011). How to Make a 29% Increase Look Bigger: Numerosity Effects in Option Comparisons. Universiteit Gent, Faculteit Economie en Bedrijfskunde;
Read, D. (2002). Choices, values and frames. Source: Journal of Behavioural Decision Making; Vol. 15 Issue 5, p469-‐473, 5p;
14. Neslin and Scott Sales promotion, Cambridge MA;
Shimp, T. A. (2003). Advertising, promotion & supplemental aspects of integrated marketing communications. The Dryden press;
Sicard, M. C. (2003). Luxe, mensonges & marketing. Mais que font les marques de luxe ?. Pearson Education France, Paris ;
Sinha, I. and Smith, M. F. (2000). Consumers' Preferences of Promotional Framing of Price. Source: Psychology & Marketing; Vol. 17 Issue 3, p257-‐275, 19p;
Sonal, K. and Preeta, V. (2003). An Exploratory Study of Sales Promotion Activities in Toilet Soap Category: An Insight into Consumer and Retailer Perceptions. Indian institute of management working paper;
Thaler, R. (1985). Mental accounting and consumer choice. Marketing Science, Vol. 4, 199-‐214;
Tversky, A. and Kahneman D. (1981). The framing of decisions and the psychology of choice. Science magazine Vol. 211 no. 4481 pp. 453-‐458;
Tversky, A., Sattath, S. and Slovic, P. (1988). Contingent weighting in judgment and choice. Psychological Review, Vol 95(3), 371-‐384;
Underhill, P. (2007). La science du shopping. . Pearson Education France, Paris ;
Viswanathan, M. and Childers , T. L. (1996). Processing of Numerical and Verbal Product Information. Source: Journal of Consumer Psychology (Lawrence Erlbaum Associates); Vol. 5 Issue 4, p359, 27p;
XERFI-‐ études, www.xerficanal.com;
Yeshin, T. (2006). Sales Promotion. London: Thomson Learning;
Zeithaml, V. A. (1988). Consumer Perceptions of Price, Quality, and Value: A Means-‐End Model and Synthesis of Evidence, The Journal of Marketing.

87
VIII. ANNEXES
ANNEXE 1: CONSUMERS ONLINE SURVEY
Sales promotions in cosmetic products-‐Online survey
Q1. To which of this three age categories do you belong?
under 35 from 36 to 49 over 50
WHICH OF THE PRESENTED PROMOTIONS WOULD BE MOST LIKELY TO INFLUENCE YOUR DECISION TO PURCHASE THE FOLLOWING ITEMS?
Imagine that you become aware of th t have a calculator handy!
Q4. Purchasing Dior -‐ Eau de toilette Full price: Price:
15% discount chase 20% discount with the purchase of two products Would not purchase this item regardless of the cost
Q5. Purchasing Yves Saint Laurent -‐ Red lipstick Full price:
15% discount 20% discount with the purchase of two products Would not purchase this item regardless of the cost
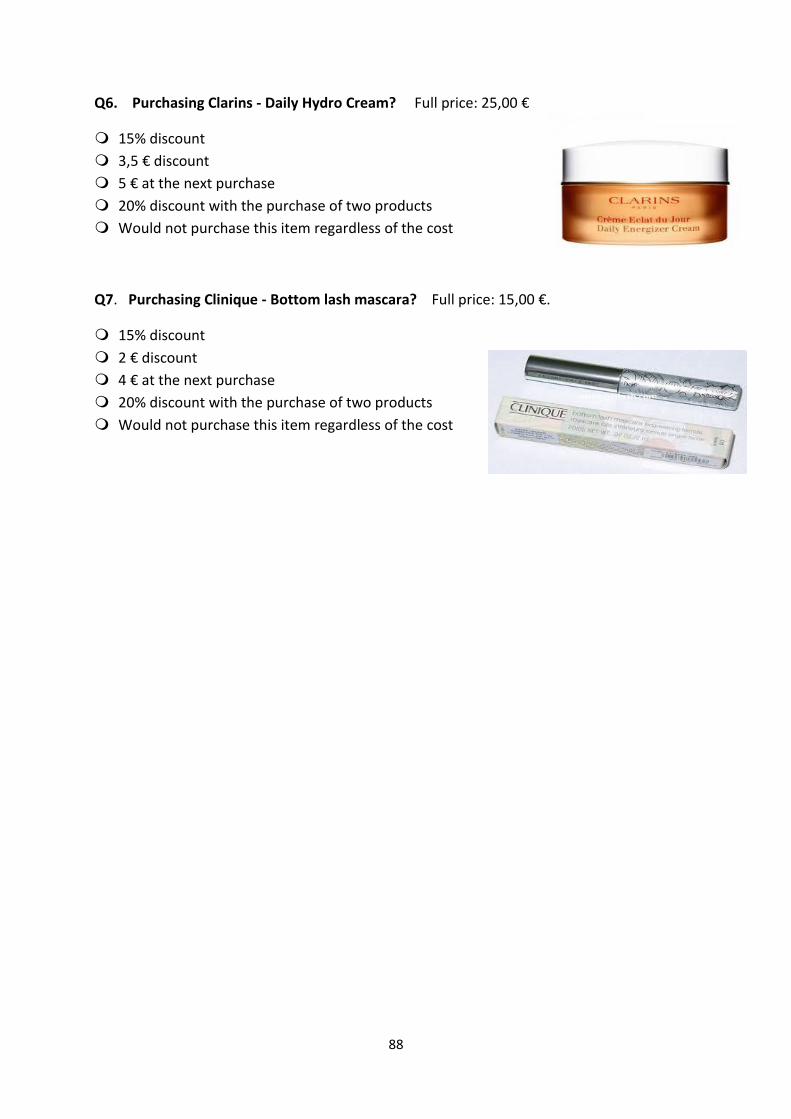
88
Q6. Purchasing Clarins -‐ Daily Hydro Cream?
15% discount 20% discount with the purchase of two products Would not purchase this item regardless of the cost
Q7. Purchasing Clinique -‐ Bottom lash mascara?
15% discount 20% discount with the purchase of two products Would not purchase this item regardless of the cost

89
ANNEXE 2: INDEX OF TABLES, FIGURES AND PICTURES
INDEX OF TABLES:
Table 1: Responsible factors of the switch from advertising to sales promotions 5
Table 2 Specific Sales Promotion Tools 10
Table 3: Summary of the main characteristics of consumer promotions 21
Table 4: Summary of strengths and weaknesses of sales promotions 28
Table 5 50
Table 6: Results of the pre-‐test 53
Table 7: Observed frequencies for both samples 60
Table 8: Contingency table of observed frequencies for the elderly sample 63
Table 9: Contingency table of expected frequencies for the elderly sample 63
Table 10: Contingency table of observed frequencies for the young sample 65
Table 11: Contingency table of expected frequencies for the young sample 66
Table 12: Contingency table of observed frequencies for both samples 68
Table 13: Contingency table of expected value for both samples 68
Table 14: Residuals between observed and expected frequencies 70
Table 15: Standardized residuals between observed and expected frequencies 70
Table 16: Contingency table of observed frequencies for both product categories 70
Table 17: Contingency table of expected value for both product categories 70
Table 18: Residuals between observed and expected frequencies 71
Table 19: Standardized residuals between observed and expected frequencies 71
Table 20: Contingency table of observed frequencies for both age categories in purchasing luxury products 72
Table 21: Contingency table of expected frequencies for both age categories in purchasing luxury products 73

90
Table 22: Residuals between observed and expected frequencies 73
Table 23: Standardized residuals between observed and expected frequencies 74
Table 24: Observed frequencies summing up both product categories 74
Table 25: Expected values summing up both product categories 74
Table 26: Residuals between observed and expected values 75
Table 27: Standardized residuals between observed and expected values 75
INDEX OF FIGURES:
Figure 1: Age composition of the sample 56
Figure 2: Observed frequencies of promotional frames for each product 64
Figure 3: Observed frequencies of promotional frames for both the product categories 65
Figure 4: Observed frequencies of the young target for both product categories 67
Figure 5: Observed frequencies of the young target for each product 67
Figure 6: Observed frequencies split up for the two age categories 72
INDEX OF PICTURES:
Picture 1: Luxury products selected from the pre-‐test 54
Picture 2: Non-‐luxury products selected from the pre-‐test 54

91
Je, soussigné(e), -joint, ce qui signifie que je suis le seul
auteur de toutes les phrases dont le texte est composé. Toute phrase ayant un autre auteur que moi a été mise entre guillemets, avec indication explicite de sa source. Je suis conscient(e)
ESCP Europe.
-même.
Fait à Paris le 9 Mai 2012

92
Affidavit
CAROLINA CONTEhonor that I have not plagiarized the paper enclosed, which means that I am the only author of all the sentences this text is composed of. Any sentence from a different author than me was written in quotation marks, with explicit indication of its source. I am aware that by contravening to the present rule, I break the recognised academic principles and I expose myself to the sanctions the disciplinary committee will decide on.
I also confirm this work has never been submitted during studies prior to ESCP Europe.
If this work has been written during studies conducted in parallel, I must precise it.
The remarks written in those pages only commit me.
Paris, 9/05/2012