How to Catch Huge Market Moves -...
207
Transcript of How to Catch Huge Market Moves -...


HowtoCatchHugeMarket
Moves

byLRThomas
http://10xroitradingsystem.comhttp://10xroitradingsystem.com/the-
ebooks

AllRightsReserved.Nopartofthispublicationmaybereproducedinanyformorbyanymeans,includingscanning,photocopying,orotherwisewithoutpriorwritten

permissionofthecopyrightholder.CopyrightLRThomas©2014OtherBooksWrittenbyL.R.ThomasMarketRhythms
The10XROITradingSystem

TheTradeAroundYourJobSystemTheHighROIScalpingSystem
TheHighROITradingEndofDaySystemPyramidYourTrades
toProfitsControlYourInner
Trader

OvercomeYourFearinTrading
HowtoStopOver-Trading

TableofContents
1.WhyYouShouldGoFortheHugeMoves2.WhyShouldYouListentoMe3.UsingCompoundingandPyramidingwithHugeMovesforQuantumGrowth4.ExampleOne
...EUR/CADTradeMultipleEntries5.ExampleTwo..AnotherEUR/CADTradeMultipleEntries6.ExampleThree...AnotherEUR/CADTradeMultipleEntries7.ExampleFour...EUR/JPYMultipleEntries8.ExampleFive..GoldMultipleEntries9.ExampleSix..Day
TradingExamplesontheEUR/USD10.CatchHugeMovesWithAScalpEntry11.Conclusion12.Resources
WhyYouShouldGoFortheHuge
MovesIfyoudoanysortofresearchabouttrading,theconsensusseemstobethatalotoftheprofessionaltradersfollowthe80/20rulewhenitcometotheirprofitabletrades.Thatis,mostoftheirtradesareeitherlosersorsmalltomediumsizedwinnersanditisthebig
monstertradesthatmakeupforthemandaddthenecessaryprofits.Thisbookisallabouthowtofocusonandspendyourtimecatchingthebigmovesintheforexmarketorindeedanyothersuitablemarket.Ifyoulikenittofishing,nolongerwillyouspendyourtimewithyournetcastwidetakingeveryspratormackerel.No,youaregoingafterthebigkahunaoffish,theswordfishorAlaskasalmon.Fishyanalogiesaside,themessage
isthatyougetwhatyoufocuson.Ifyouarefocusingoncatchingeverylittlemovethemarketmakesthenyouwillgetthosetypeofresults,smalluncertainrewardswithnobigpaydaystomakeupforthelosses.Howeverifyouonlyfocusongettingthebigrewards,youwillstillhavelossesbutyouwillknowthatyouwillbeperfectlyplacedtotakeadvantageofthebigmoveswhentheycome.Inordertounderstandthe
examplespresentedthroughoutthisbookyouneedtohaveabasicunderstandingoftechnicalanalysis,howeverthetechniquesareverysimpleandeasytounderstandastheyarebasedonusingmultipletimeframescombinedwithchartpatternsandsupportandresistance.

WhyShouldYouListentoMe
WellthetruthisyoushouldonlylistentomeifyourinnervoiceconfirmswhatIamsaying.Therearealotofmixedmessagesinthetradingarenaanditiseasytobecomeconfusedandhopfromsystemtosystem.IknowwhereofIspeak
becauseIhavebeentradingnowfornineyearsandhavetakenhundredsofcourses.IntheendhoweverIhadtolistentowhatcommonsensewastellingme.Whatmakesthemostsense?fightingitouteverydayforafewpointshereandthereandmissingthebigmovesbecauseIwasunabletofocusenoughtocatchitintime?
Orputtingeverythingelseasideanddecidingtoonlyspendmytimeoncatchingtradesthatofferedthebestopportunitiestoprofitinthemarket.TheanswerwasobvioustomeandifthatmessageresonateswithyouthenthismaybethemostimportanttradingbookyoueverreadandIdon'tsaythatlightly!
Inthisdayandageofhundredsofthousandsofsourcesofinformationallfightingforourattentionitiseasytogetdistracted.Howeverintradingifyouwanttosucceedyouhavetopickatradingmethodologythatsuitsyouandmakessensefromamathematicalstandpoint.AsyoureadthoughthisbookIleaveituptoyoutodecide
ifwhatIamsayingmakessense,andifitdoesthenmakethedecisiontofocusonlyoncatchingmovesthatareworthitinordertofulfilyourdreamofmakingitasaprofitabletrader.
UsingCompoundingandPyramidingwithHugeMovesforQuantumGrowth
Anotherreasonthatisimportanttogoforthebigmoves,isthatinordertoreallybuildyouraccountyoumaywanttouseacompoundingtypeofmoneymanagementand/orpyramidingtechniquestomultiplyyourprofits.
(Detailsofthesetechniquescanbefoundinmyotherbooksintheresourcesection)Inordertousepyramidinginyourtradingyouneednicelongrunssoyoucanhavespacebetweenyourtradestobuildupyourprofitsandreduceyourriskbeforeyouaddtothetrade.LikewiseifyouareusingadvancedmoneymanagementtechniquesyougetthemostbangforyourbuckifyouhaveaveryhighROI,(ReturnonInvestment).Naturally
youwanttocombinethesefactorswithashighawinrateaspossible.Nowwhileyoucan'tensureahighwinratethereisonefactorwhichhelpsalotandthatistrademomentum.Ifyouaretakingatradeandyouareusingthehourlychartforentrybutyouhavethemomentumofthehighertimeframesbehindyou,thenitisalotmorelikelythatyourtradewillactuallymovetoitstakeprofit.Ifyoucancombinethemomentumwithusingtradingtechniquesthat
allowyoutoreallynarrowdownyourstoplossareatofindthehighestprobability,lowestriskentriesthenthatreallyisasgoodasitgetsintrading,thatistherealtradingholygrail!Thesetechniquescanbeusedinanymarketbuttheyarebestusedinmyopinionina24hourmarket,suchasForex,Gold,Indicesetc.Thereasonisthatyoudon'twanttoendurebiggapsinyourtrading,particularlywhenyouareusinghighleverage.
Itisalsoimportanttonotethattheterm‘bigmove’isdifferentdependingonwhattimeframeyouarefocusingyourtradingon.Apositiontraderwillcallabigmove5000pointsormore,anendofdaytraderanythingfrom500to1000points,aswingtrader200to500pointsandadaytrader70to200points.Iamgoingtoshowyouhowtolookforthesetypeofmovessothisbookisapplicablewhatevertimeframeyoutrade.Sowhatisthisbookabout?This
bookwillshowyouhowtopredictandenterthebigmoves.MyexamplesarefromtheForexandGoldmarkets,howeveryoucanapplythesetechniquestoanymarketthatofferscleantechnicalpatterns.Thekeymessageofthisbookhoweveristhatyouneedtoabandonthetypeoftradingwhereyouwaitfortradeseverydayasifyouwerewaitingforabusandinsteadyoutakeaviewthatyouaregoingtostalktradesasifyouwereabiggamehunter.Youturn
intoastrategictraderwhereyourentirefocusisonfindingthehighestrewardtrades.Thereasonthisisimportantbecauseyousimplycan'tdoitallintrading.Inordertobesuccessfulatsomepointyouaregoingtohavetomakeachoice.Ifyouarenotcutouttobeascalperwhoentersandexitsthemarketmultipletimesduringtheday,(andmostpeoplearen’t)thenthisbookisapplicabletoyou.Solet’sgetonwithsometradeexamplessoyoucanseeexactlywhatImean.


ExampleOne...EUR/CADTradeMultipleEntries
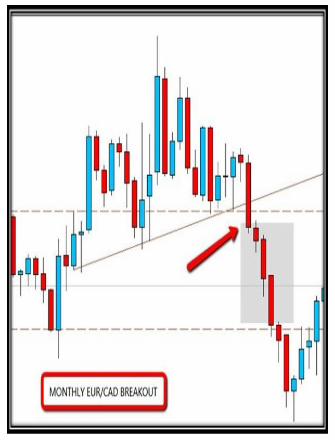
IntheimageaboveyouseeamonthlybreakoutontheEUR/CADpair.ThismovetookplacebetweenJanuaryandMay2010.Thebreakisacombinationbetweenamonthlytrendlinebreakandbreakofmonthlysupport.Thegreyedoutareaistheareathatwillhaveahugeamountofmomentumduetothebreakout.Thereasonisthatthehigherthetimeframeyougothebiggerandstrongerthemove.Sohowdoyoucapturethismomentum?

Theansweristousethelowertimeframestofindsafepointsofentry.Seethenextcharts.

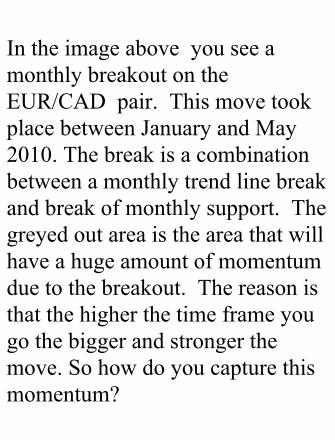
Inthechartabovethegreyedareashowswherewewouldbelookingforshortentries.ThisisadailychartontheEur/Cad.Wearedroppingdowntothedailycharttolookforpatternsandareasofsupportorresistancetohelpnarrowdownsomesafeareastoenter.

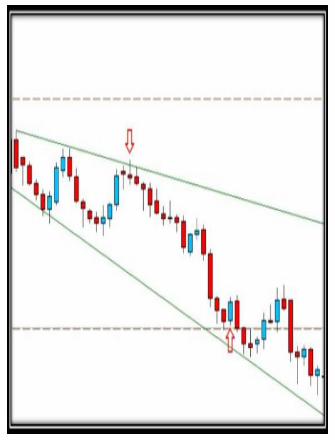
AboveisthesamecharthoweverIhavenowputintheupperandlowerbrowndashedlineofthemonthlybreakoutlineandsupportlevel.Youalsoseethatthedailycharthadformedadownwardslopingchannelbetweenthetwo.Thedownarrowshowsaclassicsidewaysdojicandlesentrypatternatthethirdbounceoftheupperchanneltrendlineandthetakeprofitwaseasilyhitatthelowerchanneltrendlinewhichalsocoincidedwiththelowerdashed
brownlineofthemonthlysupportlevel.Theentrycandlesfellonthe26thorthe27thofJanuary2010.Thestoplosswouldhavebeenabovethepincandlejustunderthedownarrow.Inthiswayyoucanseehowamonthlychartcanbeusedtodeterminemomentumandanendofdaycharttopickyourlowestriskandhighestrewardspotforentry.Inthissituationthechoicewouldbetotakeprofitsattheoppositesideofthedailychannelorthebrowndashed
monthlysupportlevel.Thetrickistousethesetimeframestogetherwithchartpatternscombinedwithcandlepatternswithinthemonthlysupportandresistance.
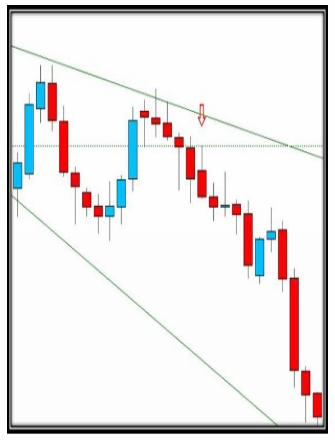
Therewerefurtherentriesintothismove(seenextchart),inthischartyoucanseeagreendottedlinemarkedbythedownarrowthatformsanentryfora10XROIPush-Pulltradeonthe1stofFebruary2010.(The10XROITradingSystembookisinreferencesectionattheendofthebook.)HereisalinktoavideothatexplainsthePush-Pullentry.http://10xroitradingsystem.com/pushpull
Theideasbehindthistypeoftradeistodropdowntothehourlychartandreallyfinetuneyourentryusinghourlytechnicalanalysis,trendlinebounces,andbreaksofhourlysupportforentries.Yourexithoweverwouldremainthesameasonthepreviouschart.ThisishowwecapturethebigmovesandgetahighROIintothebargain.Wewouldswitchbacktotheendofdaycharttomonitorthemoveuntilthetakeprofit.

ExampleTwo..Another
EUR/CADTradeMultipleEntries
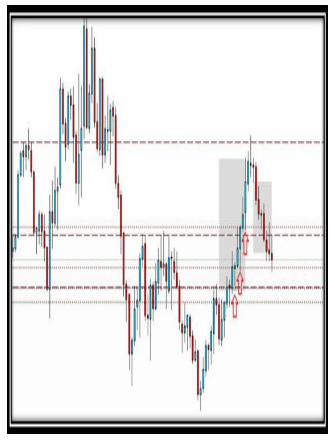
HereisanotherexampleofhowtocatchahugemovestillusingtheEUR/CADpair.Youcanseethattherewasastrongmonthlyresistancezonewhichwasbrokeninastrongmoveupbetween
November2013andMarch2014.Thepricethenformedahugedojipincandleandreversedoffthehigherbrowndashedmonthlyresistancelinebackdowntopreviousmonthlybrokenresistancezonenowturnedsupport.ThedownmovetookplacebetweenMarch2014toSeptember2014.Thetwoshadedareasbothupandthendownofferhugemoveopportunities.Againwearetakingadvantageofthemonthly
momentumandlookingforentriesusingthelowertimeframes.

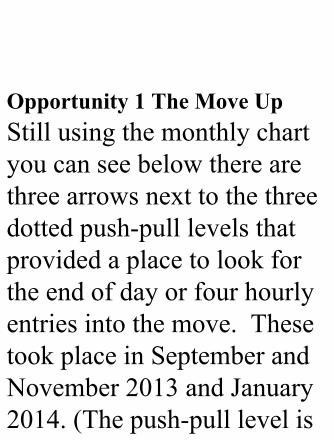
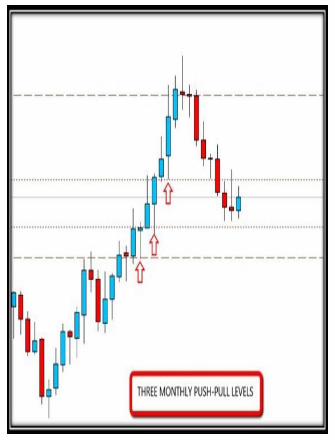
Opportunity1TheMoveUpStillusingthemonthlychartyoucanseebelowtherearethreearrowsnexttothethreedottedpush-pulllevelsthatprovidedaplacetolookfortheendofdayorfourhourlyentriesintothemove.ThesetookplaceinSeptemberandNovember2013andJanuary2014.(Thepush-pulllevelis
describedinmybookthe10XROItradingsystemintheresourcesectionoranexplanationcanbefoundonthisvideohttp://10xroitradingsystem.com/pushpull


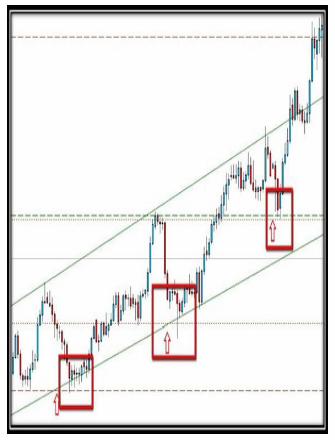
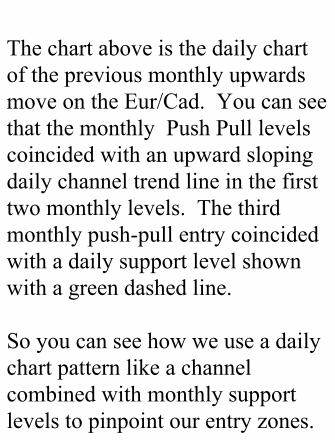
ThechartaboveisthedailychartofthepreviousmonthlyupwardsmoveontheEur/Cad.YoucanseethatthemonthlyPushPulllevelscoincidedwithanupwardslopingdailychanneltrendlineinthefirsttwomonthlylevels.Thethirdmonthlypush-pullentrycoincidedwithadailysupportlevelshownwithagreendashedline.Soyoucanseehowweuseadailychartpatternlikeachannelcombinedwithmonthlysupportlevelstopinpointourentryzones.
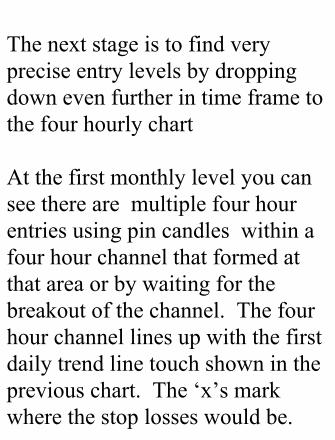
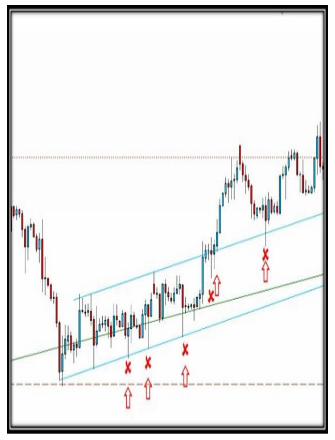
ThenextstageistofindverypreciseentrylevelsbydroppingdownevenfurtherintimeframetothefourhourlychartAtthefirstmonthlylevelyoucanseetherearemultiplefourhourentriesusingpincandleswithinafourhourchannelthatformedatthatareaorbywaitingforthebreakoutofthechannel.Thefourhourchannellinesupwiththefirstdailytrendlinetouchshowninthepreviouschart.The‘x’smarkwherethestoplosseswouldbe.

(seenextchart).


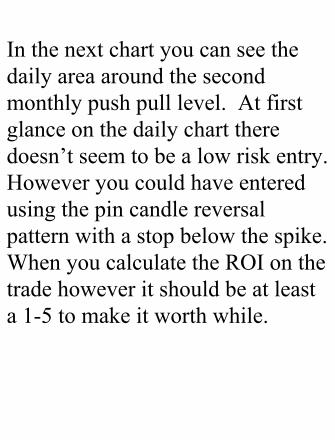
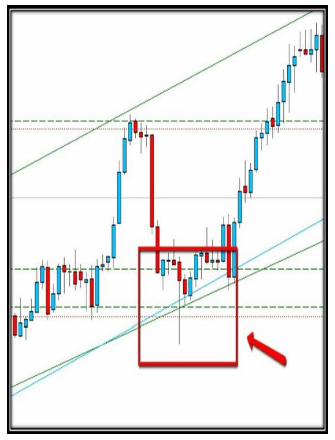
Inthenextchartyoucanseethedailyareaaroundthesecondmonthlypushpulllevel.Atfirstglanceonthedailycharttheredoesn’tseemtobealowriskentry.Howeveryoucouldhaveenteredusingthepincandlereversalpatternwithastopbelowthespike.WhenyoucalculatetheROIonthetradehoweveritshouldbeatleasta1-5tomakeitworthwhile.

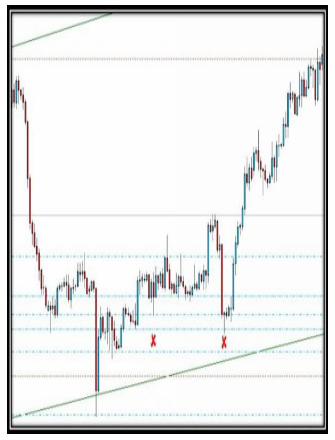
Howeveronthenextchartyoucanseethatwhenyoudropdowntothefourhourchart,youcanseefourhourlysupportandresistancelevelscombinedwithpincandlesthatprovidedsomegoodlowriskentries.Hereisatip,whenyouplaceyourstopslookforthenearestlevelofmicrosupportbelowaprevioussupport.Thiscanhelpprotectyoufromstophuntingasyoucanseeinthenextchart.Thedoubledashed
anddottedbluelinesrepresentmicrosupport,thedashedanddottedbluelinesrepresentfourhourlysupportlevelsandthegreendashedlinesrepresentdailysupport.

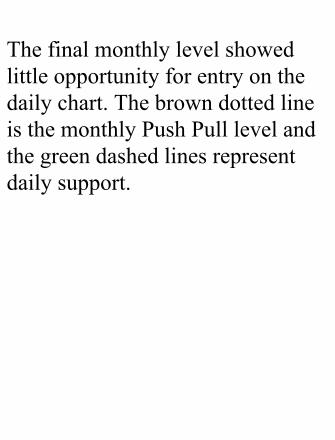
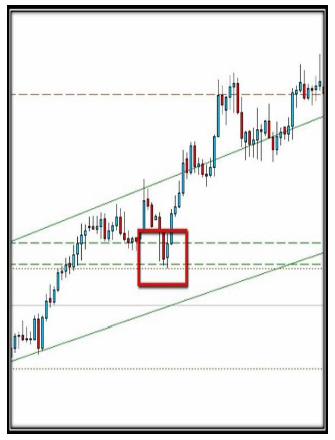
Thefinalmonthlylevelshowedlittleopportunityforentryonthedailychart.ThebrowndottedlineisthemonthlyPushPulllevelandthegreendashedlinesrepresentdailysupport.

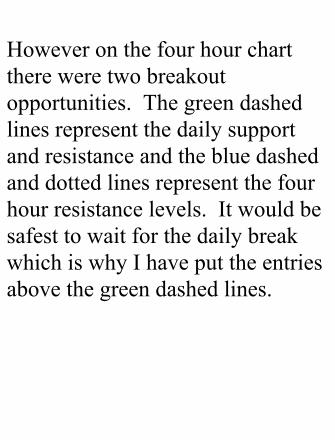
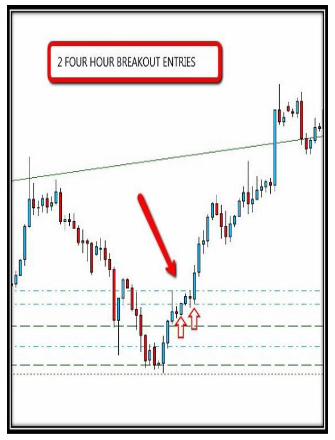
Howeveronthefourhourchartthereweretwobreakoutopportunities.Thegreendashedlinesrepresentthedailysupportandresistanceandthebluedashedanddottedlinesrepresentthefourhourresistancelevels.ItwouldbesafesttowaitforthedailybreakwhichiswhyIhaveputtheentriesabovethegreendashedlines.

ExampleThree...AnotherEUR/CADTradeMultipleEntries
TheEur/CadReversalMove
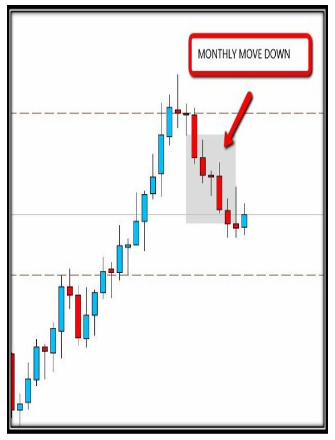
Wearenowgoingtolookathowtoenterthemonthlyreversalintotheshortsideofthepreviousupmove.

Wecanseeonthedailychartbelowthattherearegoodspotsatathegreendailychanneltrendlineandpullbackstopreviousdailysupportlevelstolookforentries.
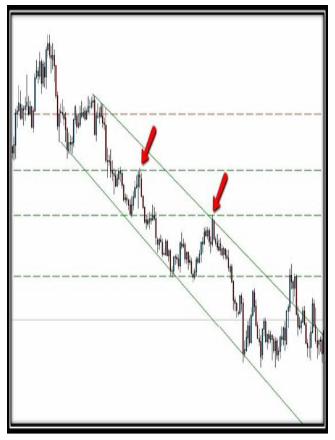

Howeverwhenwegodowntothefour hour chartwe can really finetuneourentries.Herearethefirsttwopotentialfourhour entries at the pull back todaily support now turnedresistance, the first trade wouldonly haveworked as a short termswingtrade.However the second entry couldhavebeenheldforthewholemovedown. The green dashed lines are
daily support and resistance andthe blue dotted and dashed linesare the four hour support andresistancelevels.The stop losses should go abovethe previous blue four hourresistancelevel.
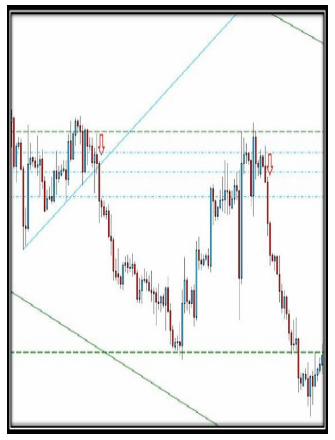

Thethirddailychanneltrendlinecoincideswithapreviousdailyresistancelevelmakingthereversalevenmoreprobable.Therewasanentryonthedailychartattherailwaytrackscandlepatternwithastopabove.Entryisontheclosedredreversalcandle.(Itwasn’taperfectcandlepatternbutitreversedwithenoughstrengthtoconfirmthechangeinmomentum.
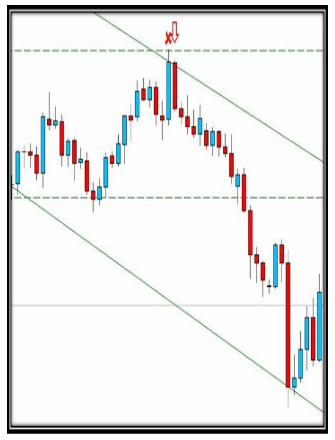

Howeverwhenyoudropdowntothefourhourchartyouseeaclearerentryonthefirstbreakoffourhoursupport.Thedownarrowshowsthefourhourentryandthestopgoesabovethepreviousmicroresistanceofthetwopreviousfourhourcandleswhichformedtwolittlesidewaysdojis.

ExampleFour...EUR/JPYMultipleEntries
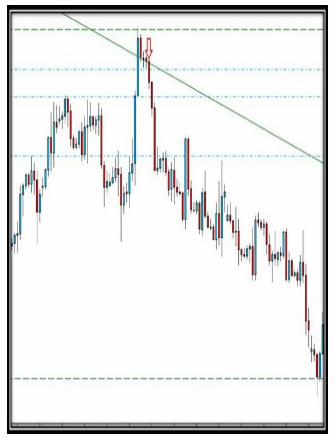
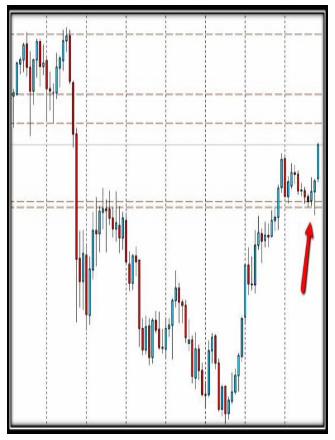
Onthechartbelowwecanseehowpricehasbouncedoffastrongareaofmonthlysupport.

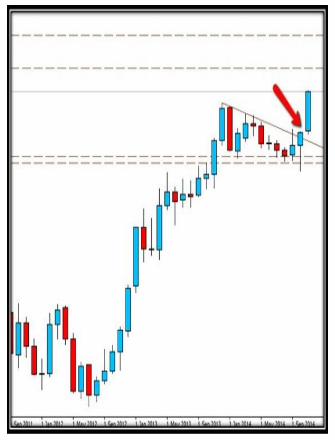
Whenwelookmorecloselywecanseethatpricehasalsobrokenupthroughamonthlytriangle.

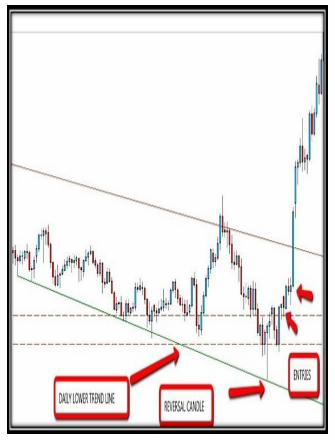
Sotogetagoodentryintothemonthlymomentumwedropdowntothedailychartwherewecanseethattherewasagreendailylowerchanneltrendlineformedatthebrowndashedmonthlysupportlevelandpricebouncedoffitwithahugereversalpincandleconfirmingtheupwardmove.
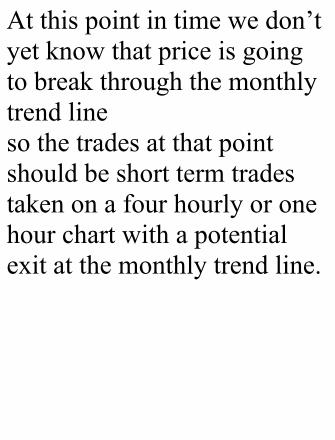
Atthispointintimewedon’tyetknowthatpriceisgoingtobreakthroughthemonthlytrendlinesothetradesatthatpointshouldbeshorttermtradestakenonafourhourlyoronehourchartwithapotentialexitatthemonthlytrendline.

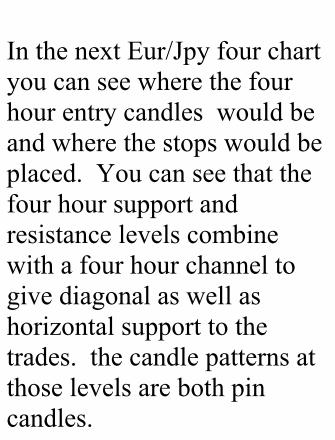
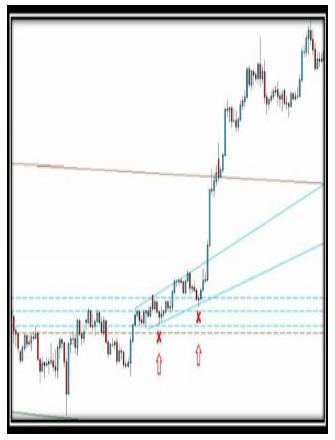
InthenextEur/Jpyfourchartyoucanseewherethefourhourentrycandleswouldbeandwherethestopswouldbeplaced.Youcanseethatthefourhoursupportandresistancelevelscombinewithafourhourchanneltogivediagonalaswellashorizontalsupporttothetrades.thecandlepatternsatthoselevelsarebothpincandles.


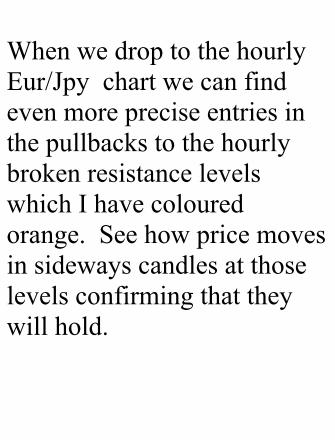
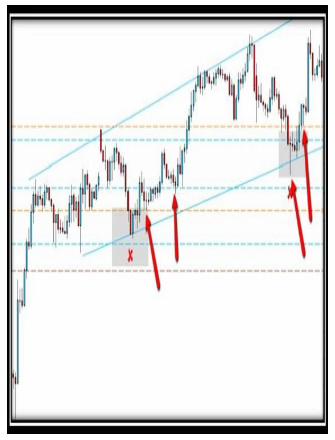
WhenwedroptothehourlyEur/JpychartwecanfindevenmorepreciseentriesinthepullbackstothehourlybrokenresistancelevelswhichIhavecolouredorange.Seehowpricemovesinsidewayscandlesatthoselevelsconfirmingthattheywillhold.

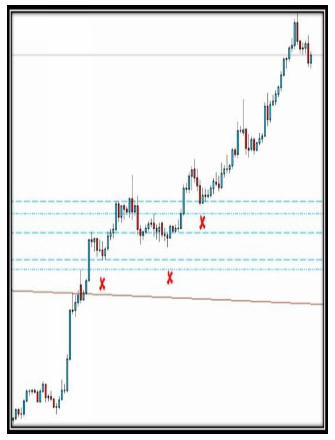
BreakoutoftheEur/JpyMonthlyTrendlineInordertofindanentryinthishighmomentummoveafterthemonthlytrendlinebreakweneedtodroptothefourhourlychartsowecanfindentriesintothemoveafterthemonthlytrendlinebreak.Thebluedashedlinesaresupportlevelsandthebluedoubledottedlinesare

microsupportwhereIhaveplacedstoplosses.

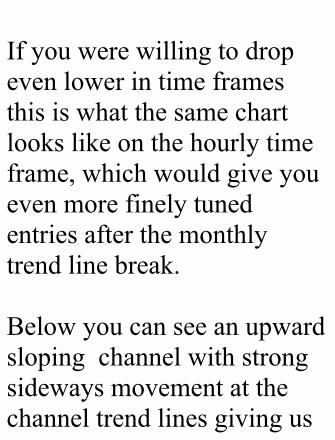
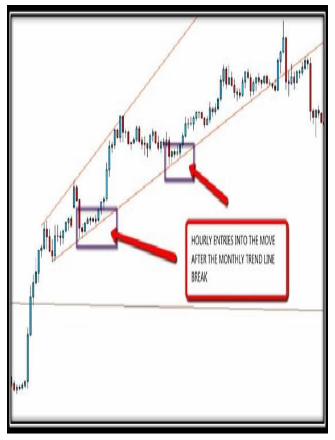
Ifyouwerewillingtodropevenlowerintimeframesthisiswhatthesamechartlookslikeonthehourlytimeframe,whichwouldgiveyouevenmorefinelytunedentriesafterthemonthlytrendlinebreak.Belowyoucanseeanupwardslopingchannelwithstrongsidewaysmovementatthechanneltrendlinesgivingus

alowriskareatoplaceatinystop!

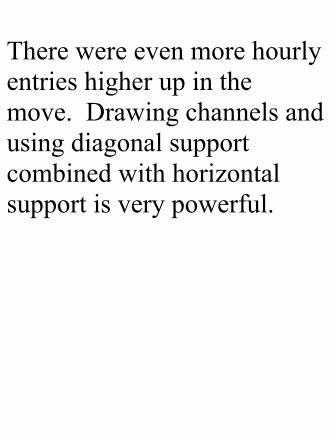
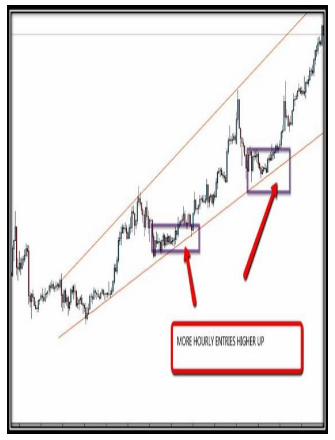
Therewereevenmorehourlyentrieshigherupinthemove.Drawingchannelsandusingdiagonalsupportcombinedwithhorizontalsupportisverypowerful.

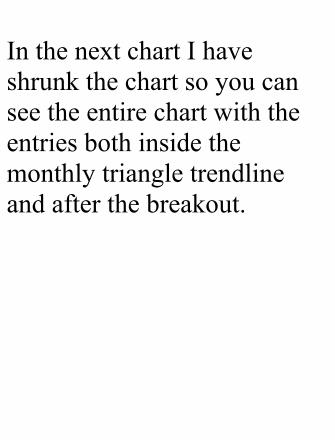
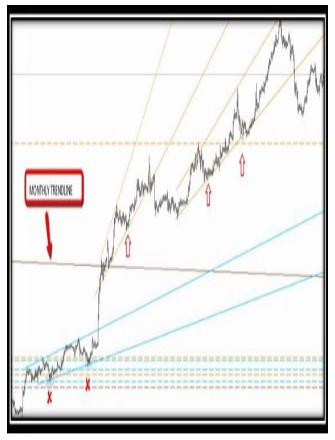
InthenextchartIhaveshrunkthechartsoyoucanseetheentirechartwiththeentriesbothinsidethemonthlytriangletrendlineandafterthebreakout.

ExampleFive..GoldMultipleEntries
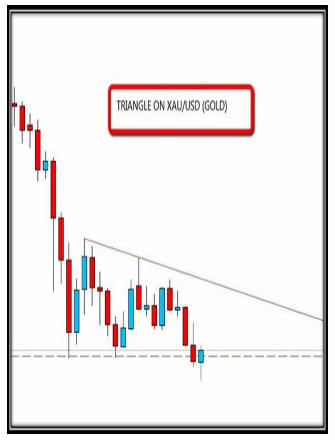
InthechartbelowyoucanseetherewasamonthlytriangleontheXAU/USDchartorGoldasitisknown,(althoughitisreallyGoldversustheDollar).

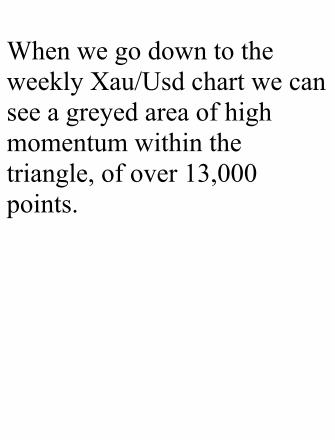
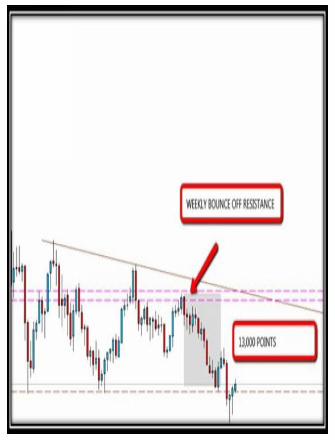
WhenwegodowntotheweeklyXau/Usdchartwecanseeagreyedareaofhighmomentumwithinthetriangle,ofover13,000points.

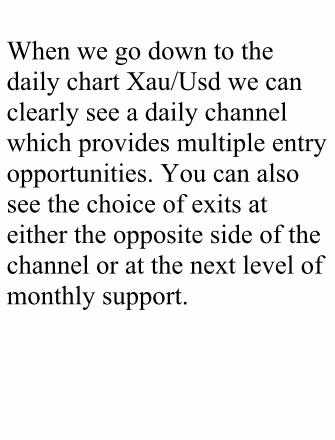
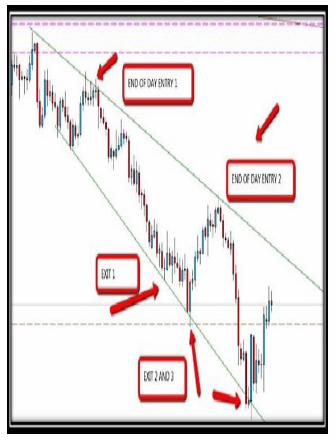
WhenwegodowntothedailychartXau/Usdwecanclearlyseeadailychannelwhichprovidesmultipleentryopportunities.Youcanalsoseethechoiceofexitsateithertheoppositesideofthechanneloratthenextlevelofmonthlysupport.

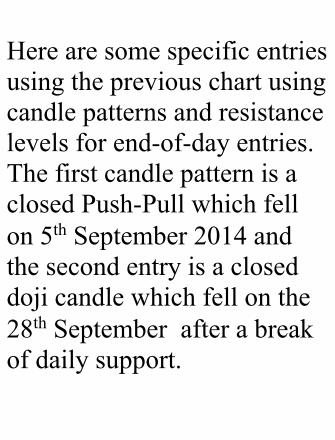
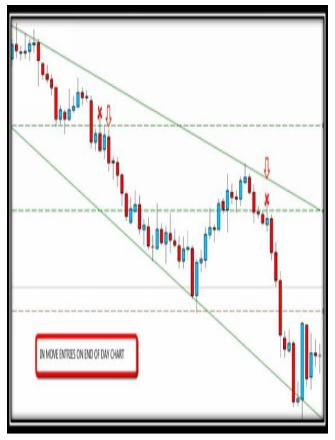
Herearesomespecificentriesusingthepreviouschartusingcandlepatternsandresistancelevelsforend-of-dayentries.ThefirstcandlepatternisaclosedPush-Pullwhichfellon5thSeptember2014andthesecondentryisacloseddojicandlewhichfellonthe28thSeptemberafterabreakofdailysupport.

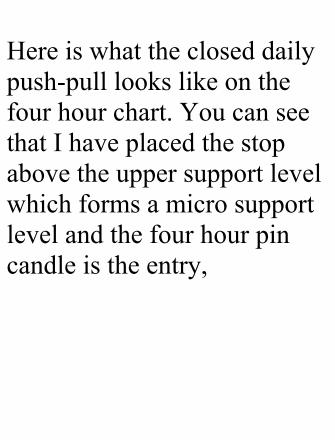
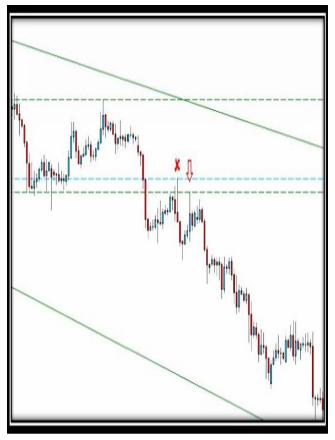
Hereiswhatthecloseddailypush-pulllookslikeonthefourhourchart.YoucanseethatIhaveplacedthestopabovetheuppersupportlevelwhichformsamicrosupportlevelandthefourhourpincandleistheentry,

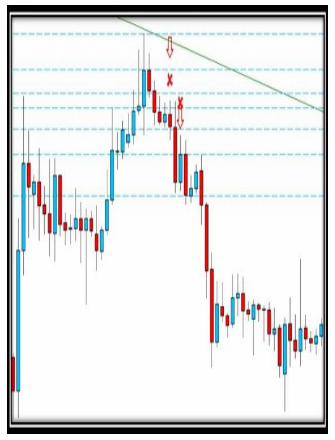
Theseconddailybounceonthechanneltrendlinelookedlikethisonthisnextfourhourchart.Youcanseethatthecandleformedsupportlevelsthenbrokethem.Theentriesaremarkedwiththestoplossesaboveapreviousresistancelevel.

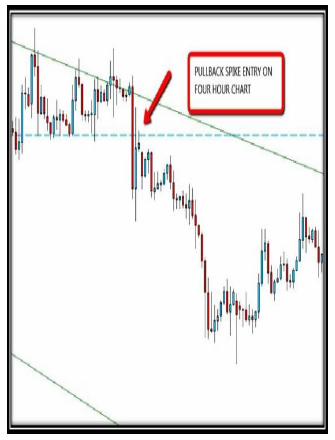
Whenyoudroptothefourhourversionofthepreviouschartyoucanseetheclosedpushpullareaisactuallyafourhourdojicandlewhichclosesatthepreviousfourhourresistance.Youcouldenterusingthefourhourcandlewithastopaboveapreviousresistancelevel.

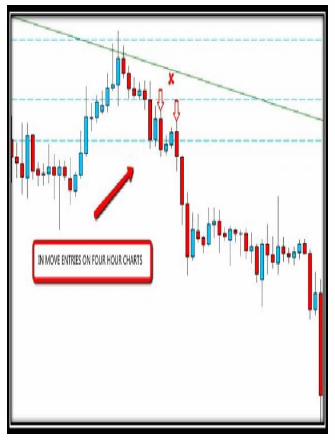
Hereisasecondopportunityonthefourhourchartswheretheseconddailyentrywasattheupperchanneltrendlineusingfourhourbreaksofsupporttogetanentry.

InTradeManagementHereishowyouwouldhavemanagedthesetwotradesusingtrailingstopsonthefourhourchart.NoticethatIhaveusedacombinationofpullbackstoprevioussupportlevelsandreversalcandlepatternssuchaspincandlesandsidewaysdojistoplacethestoplosses.Theseareareasthatpriceshouldnotreturntounless
thereisachangeofdirection.TradeOneontheXau/Usd
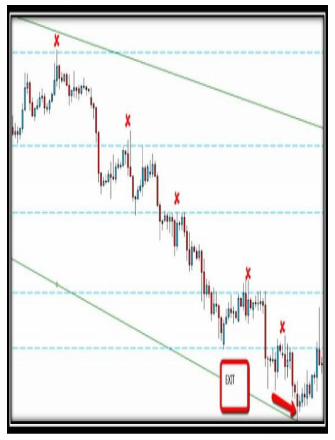

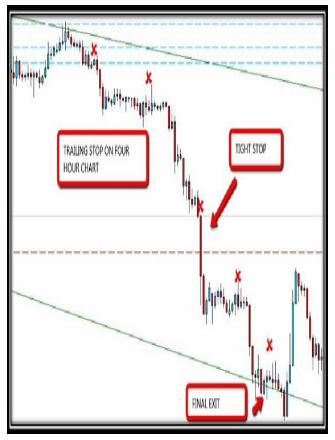
Trade2ontheXau/UsdOnthesecondXau/Usdbounceoffthechanneltrendlineyoucanseehowtotrail
thestopusingthefourhourcharts.Ihavetightenedthestopnearthemonthlysupportbecauseifyouwantedtoholdthetradeuntiltheoppositesideofthedailychannelyouneedtobeawarethatpricecouldreverseatastrongmonthlysupportlevel.Howeverinthiscaseyoucanseeitwentstraightthroughandthefinalexitwouldhavebeenattheoppositesideofthetrendline.


ExampleSix..DayTradingExampleson
theEUR/USD
Whenwearegoingtospendourtimedaytrading,wewillgenerallylooktotakeprofitswithinthesameday.Wewanttogetabigprofitofbetween70-200pointsandso
westillwanthighmomentummoves.Inordertodecidewhatcurrencypairtofocusonitiswisetostartoffwithamonthlychart.SeethemomentumopportunityontheEUR/USDchartbelow.
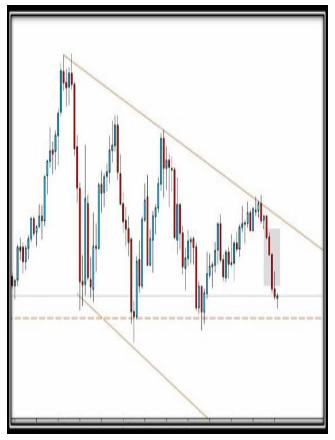

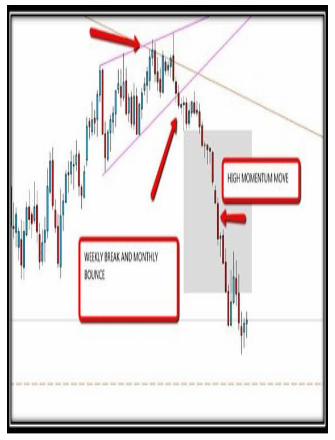
Wecanseeitevenmoreclearlywhenwedroptotheweeklychart.Herewecanseepricebouncedoffthemonthlytrendlineandalsobrokeanupwardslopingweeklychannel(weeklytrendlinesarepink.monthlytrendlinesarebrown).Themovefallsbetweenthe20thJuly2014untilthe28thofSeptember2014.


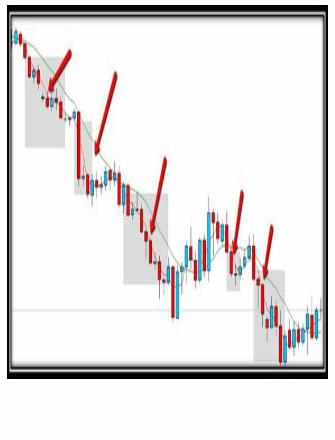
InmytradingIusetwomovingaveragestovisuallyseemomentum.InthenextchartyoucanseeIusea3simplethreeperiodmovingaverage(red)andasimpletenperiod(green)fortheslowermovingaverage.Theareaswherepriceismovingsofastthatpriceisexceedingtheredmovingaverageandnottouchingthe
greenslowermovingaverageshowsmethoseareaswherethereishighdailymomentum.
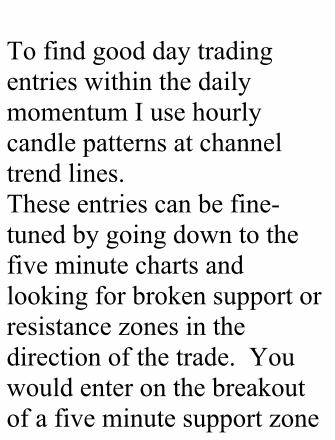
TofindgooddaytradingentrieswithinthedailymomentumIusehourlycandlepatternsatchanneltrendlines.Theseentriescanbefine-tunedbygoingdowntothefiveminutechartsandlookingforbrokensupportorresistancezonesinthedirectionofthetrade.Youwouldenteronthebreakoutofafiveminutesupportzone
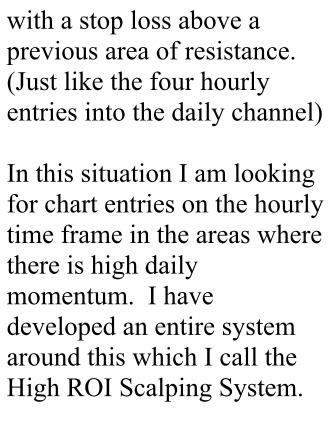
withastoplossaboveapreviousareaofresistance.(Justlikethefourhourlyentriesintothedailychannel)InthissituationIamlookingforchartentriesonthehourlytimeframeintheareaswherethereishighdailymomentum.IhavedevelopedanentiresystemaroundthiswhichIcalltheHighROIScalpingSystem.

.
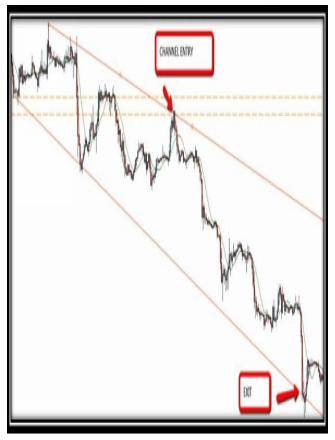

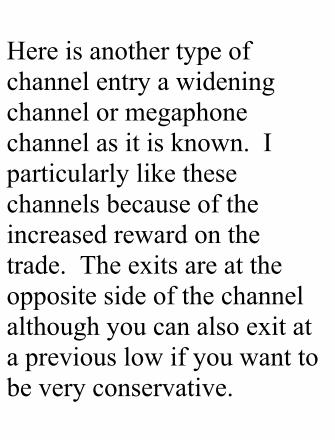
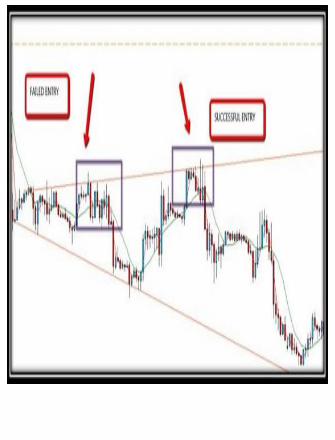
Hereisanothertypeofchannelentryawideningchannelormegaphonechannelasitisknown.Iparticularlylikethesechannelsbecauseoftheincreasedrewardonthetrade.Theexitsareattheoppositesideofthechannelalthoughyoucanalsoexitatapreviouslowifyouwanttobeveryconservative.
Thefirstentryonthe26thSeptemberwouldhavefailedanditwouldnothavebeenwisetotakeatradewithsuchasmallreward.Howeverthesecondentryonthe28thwouldhavebeenasuccessfulandasyoucanseewiththewideningmegaphonechannelthesecondtradeofferedamuchhigherreward.Channelsallowyoutoknow
inadvancewhatyourrewardisgoingtobewhichmakesiteasytoknowifitisatradeyoushouldtakeornot.
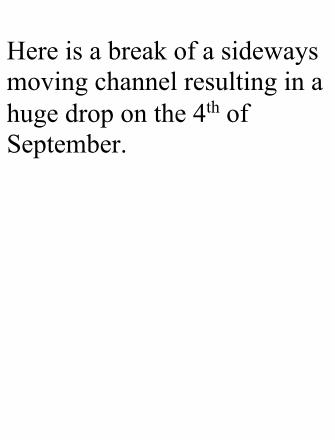
Hereisabreakofasidewaysmovingchannelresultinginahugedroponthe4thofSeptember.
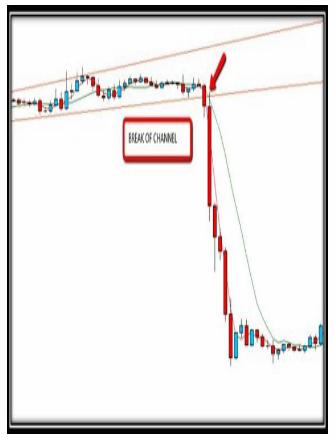

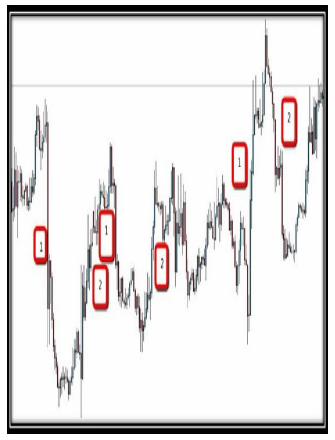
CatchHugeMovesWithAScalpEntryForactivedaytraderswhoaredrawntoscalpingfortheamountofopportunitiesbutarefedupwithonlygettingasmallprofit,therearestillhugemovestobehadusingthehourlychartsandthefiveminutechartsintandem.Ilookforaparticularchart
patternwhichisaparabolicreversalpattern.Withinthatreversalthereisusuallyanopportunitytoenterthetradewithatinystop.WhatIlikeaboutthismoveisthattheexitisstraightforward,thebeginningoftheparabolicmoveontheoppositeside.oragoodROIifitmakessensetoexitearlier.Alsotherisktorewardisverylargebecause
wearelookingforatinystop.Herearesomeexamplesbelow.Side1istheverticalmoveupordown,side2isthereversalwherewewouldbelookingforafiveminuteentry.

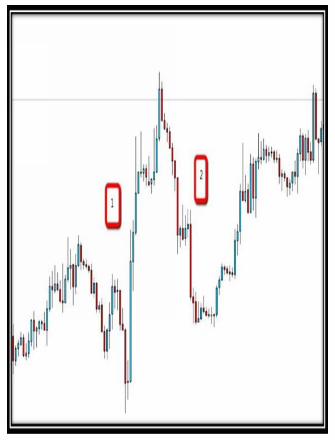
Hereiscloseupofatypicalhourlyparabolicreversalpattern.Seetheverticalriseuponthehourlychartfollowedbythestrongreversal.Wearelookingforverticaldirectionalmoves,ideallywithasidewaysmoveatthehighorlowfollowedbyabreakofsupportifshortorresistanceiflong,Wearelookingforanentryinthereversalside2.Agoodentry
tolookoutforaswellasanhourlybreakofsupportisanhourlypush-pullsetupduringthemove.Youcanthenenterusingthefiveminutechart.

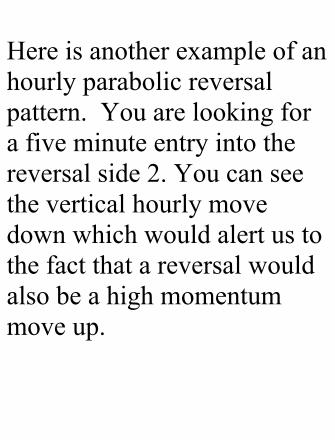
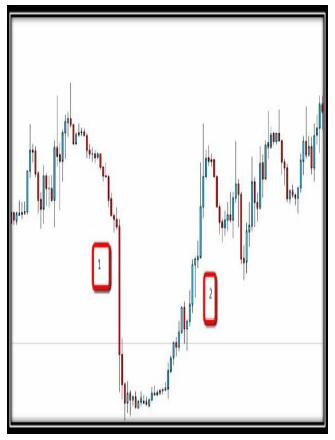
Hereisanotherexampleofanhourlyparabolicreversalpattern.Youarelookingforafiveminuteentryintothereversalside2.Youcanseetheverticalhourlymovedownwhichwouldalertustothefactthatareversalwouldalsobeahighmomentummoveup.

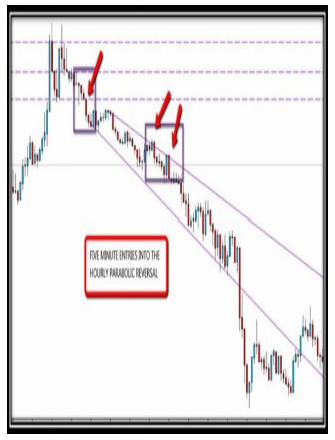
Hereisanexampleofhowtofinetuneanentryusingthefiveminutechart,usingbreaksofsupportandtrendlinebounces.

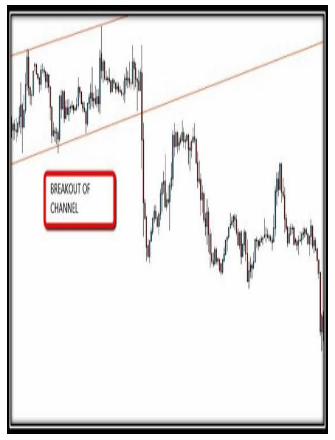
Theseparabolicmovesworkalot,butnotalways,hereisafailedparabolicexample.
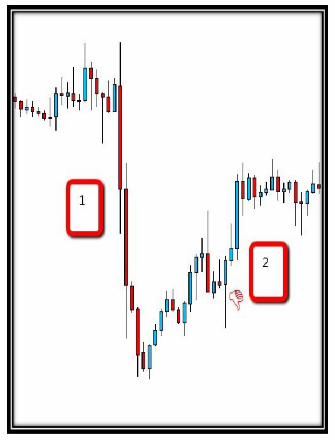

Lookatthecontext...Howeverwhenyoulookatthecontextofthisreversalmoveyoucanseeitformedpartofthepullbacktoapreviouslybrokentrendlineandwasnotagoodcontext.Thisiswhyitissoimportanttolookatthecontextofthesemovestodecideontheirprobability.Youcanfindlotsofvideosonmyblogwhich
explainhowtoanalysethecontextofatrade.

TheContextofaTrade
Atradeisnothappeninginisolation,justlikeinthepreviousexamplethepotentialparabolicreversalalsohappenedtoformthepullbacktoapreviouslybrokentrendlineandthemomentumwasopposingthemove.Putinthehighertimeframe
supportandresistancelevels,patterntrendlinesandtakingintoaccountthetimeofday.(youwanttotradeneartheopenoftheAsian,European,LondonorNewYorkopentogetmaximummomentum.)Takethesefactorsintoaccountwhendecidingifanhourlytradeisworthtaking,ifthereareconflictingsignalsthenjustleaveit.Youwanttoseealltheducksinarow
beforetakingatrade,orasitisbetterknownyouarelookingforaconfluenceofevents.
Conclusion
Ihopeyouhavefoundthisbookausefulintroductionintohowtousethehighertimeframestofindwherethepotentialhugemovesareformingandthenthelowertimeframestopinpointyourentries.
Theothergreatadvantagetousingthismethodologyisthatitcanprotectyoufromgettingintosub-standardtradesonthelowertimeframes.Iwelcomereviewsfrommyreaderssoifyouhavefoundthisbookausefulguide,justemailmethelinkwithyourreviewandasathankyouIwillsendyouthefullcolourPDFversionofthisbookor

anyotherofmyeBooksasathankyou.Ifyouhaveanyquestionyouarewelcometoemailmeatlrthomasauthor@gmail.cmAlltheBestandGoodTradingL.R.Thomas

Resources
ThereisavideocourseentitledHowtoCatchtheHugemarketmovesinForexforonly$13!whichgoesintomoredepth.Youcanreadthereviewsherehttp://10xroitradingsystem.com/bookoffer
YoucangetthePDFversionofthisbookhere(textandimagesonthesamepage)http://payhip.com/b/lBbJYoucanfindalotofvideosandinformationonmybloghttp://10xroitradingsystem.comPush-Pullexplainedhttp://10xroitradingsystem.com/pushpullHerearemyotherbooks

http://10XROITradingSystem.com/[email protected]


![[fx365group.info][Trading] forex scalping](https://static.fdocuments.in/doc/165x107/546eec21b4af9fa0268b4812/fx365groupinfotrading-forex-scalping.jpg)