How the Economic Crisis in Iceland Affects the … · The European Institute of Retailing and...
25
The European Institute of Retailing and Services Studies Recent Advances in Retailing and Service Science July 2-5, 2010 How the Economic Crisis in Iceland Affects the Image of the Retail Banks Authors: Thorhallur Gudlaugsson, University of Iceland ([email protected] ) School of Business, Gimli v/Saemundargata, 101 Reykjavik, Iceland Fridrik Eysteinsson, University of Iceland ([email protected] ) School of Business, Gimli v/Saemundargata, 101 Reykjavik, Iceland
Transcript of How the Economic Crisis in Iceland Affects the … · The European Institute of Retailing and...
The European Institute of Retailing and Services Studies
Recent Advances in Retailing and Service Science
July 2-5, 2010
How the Economic Crisis in Iceland Affects the
Image of the Retail Banks
Authors:
Thorhallur Gudlaugsson, University of Iceland ([email protected])
School of Business, Gimli v/Saemundargata, 101 Reykjavik, Iceland
Fridrik Eysteinsson, University of Iceland ([email protected])
School of Business, Gimli v/Saemundargata, 101 Reykjavik, Iceland

1
ABSTRACT
This paper focuses on one aspect of the banking crisis in Iceland in the fall of 2008, namely
its effect on the image of the Icelandic banks. The research question is, „What effect does a
banking crisis have on the image of banks?“ How image forms is discussed in general and
how marketing has evolved into directing its offers towards well defined target markets and
its emphasis on establishing relationships with members of those target markets. The image
of individual banks compared to others is evaluated as well as the development of average
scores for the image attributes for individual banks and the industruy as a whole.
The research is based on the methodology of perceptual mapping and is explained
thoroughly in the paper. It is based on three surveys among students at the University of
Iceland done in April 2008, February 2009 and April 2009. The results of the surveys before
and after the banking crisis are compared and inferences drawn. The results of earlier
surveys are used for comparison. Surveys of this kind have been done in Iceland since 2004.
The main result is that the image of Landsbankinn seems to have deteriorated the most
after the banking crisis. The bank is now more connected to corruption than before but
preceding the crisis it was strongly associated with attributes such as trust and corporate
social responsibility. The banking crisis does not only seem to have damaged certain brands
but also the image of the banking sector as a whole. The average attribute scores for positive
attributes are considerably lower for all the banks. At the same time the score for corruption
is higher. Corruption seems to be the attribute most associated with the Icelandic banking
sector after the banking crisis.

2
INTRODUCTION
In the fall of 2008 Icelanders experienced the worst banking crisis in the history of the
republic. In a matter of days three of the country´s biggest commercial banks became
insolvent and were nationalized. The consequences have been titanic and are felt far outside
Iceland because the banks had considerable operations abroad.
This paper focuses on one aspect of the banking crisis in Iceland, namely its effect on
the image of the Icelandic banks. Did it change and if so, how? This is an interesting
question because a bank´s image influences both whether consumers start doing business
with it and how loyal they are. It is difficult to think of a single factor that might influence
the image of banks more then a banking crisis.
Before answering the research question, „What effect does a banking crisis have on the
image of banks?“ there is a general discussion about how the image of organizations or their
goods or services forms in the minds of consumers. Marketing has evolved into directing its
offers towards well defined target markets and its emphasis on establishing relationships with
members of those target markets. The building of consumer-based brand equity (CBBE) is
key here.
CBBE has two sources, brand awareness and brand image – the strong, positive and
unique associations it has in the target markets´ minds. It is important to remember that the
organization´s intended positioning doesn´t necessarily correspond with its brand´s image and
also that image forms whether marketing played a role in its formation or not.
Perceptual maps, as a tool to measure image, will be discussed and also research that
has been done on the image of banks in general and its correlation to consumer loyalty and
profitability in particular. Finally the results of research on the image of Icelandic retail banks
both before and after the banking crisis will be reported.

3
1 TARGET MARKETING AND CONSUMER-BASED BRAND
EQUITY
Organizations are constantly pursuing new opportunities to serve their customers better. It is
difficult for them to serve everybody in a market and it is therefore likely that they will, to a
greater extent, use market segmentation (Kotler, Armstrong, Saunders and Wong, 2001,
Kumar, 2004; Chaston, 2001; Walker, Boyd, Mullins and Larreche, 2003; West, Ford and
Ibrahim, 2006). The process is sometimes called target marketing. It is intended to improve
marketing performance since it can be very difficult for an organization to try to cater to the
whole market. Consumers are many, they are dispersed and they have different needs and
wants. This means that it is possible to cater to their needs in different ways. That is done by
deploying the marketing mix variables - product, price, place and promotion differently. The
question managers of organizations have to answer is how to fulfill the needs and wants of
consumer better but at the same time increasing revenues and profits.
The target marketing concept can be subdivided into segmentation, targeting and
positioning. Managers of organizations who intend to fulfill the needs and wants of
everybody in a market, usually realize that it is impossible to do (Kotler, 1994). Instead they
therefore try to identify the most attractive target markets.
Mass marketing involves the production of one product which is marketed in almost the
same way to all the consumers in a market (Dowling, Lilian and Thomas, 2000). The
rationale is that this is both simple and inexpensive. Some organizations have been successful
using this approach but it is more often a waste of time and money (Kotler, Armstrong,
Saunders and Wong, 2001). If an organization´s efforts are directed towards consumers who
are not very interested or not interested at all in the product or service the efforts are wasted.
Over the years marketing´s approach has evolved towards directing the organization´s offers
towards well defined target markets. The emphasis has been on forming and sustaining
relationships with members of those groups (Hollensen, 2003).
A market can be segmented using various variables. Often demographic variables are
used, such as age, gender, income, education, nationality or religion. There is increased
emphasis on using psychographic segmentation variables (Solomon, Bamossy og Askegaard,
2002). It is also common to analyze the lifestyles of individuals and form target markets
based on that analysis. It is important to keep in mind that there is no one right way to select
segmentation variables or approaches. What matters most, when choosing the method, is the
objective of the segmentation and its relationship to the organization‘s strategy (Dickson and

4
Ginter, 1987; Jackson, 2007; John and Smithee, 1999; Wind, 1981). In this regard it does not
seem to matter which strategy the organization is following (Matsuno and Mentzer, 2000;
Sarkar, Echambadi and Harrison, 2001) nor whether the organization is in the private or
public sector (Hunt, 1976; Karande, Shankarmaesh and Rao, 1999; Kotler and Levy, 1969).
The aim of market segmentation is to divide current and prospective customers into
segments that respond differently to the deployment of one or more of the marketing mix
variables (McDaniel and Gates, 1999). By applying the variables differently it is possible to
get more revenues then when applying them in the same way. How many segments to pursue
depends, in the end, on the benefits compared to the costs.
Targeting is about evaluating different market segments and choosing the one(s) the
organization wants to target. Cravens (1994) points out that organizations usually only
appeal to certain segments in a market, irrespective of how many it tries to appeal to. The
organization´s marketing mix only appeals to certain segments irrespective of whether the
market is segmented consciously or not. It is possible to only target one segment but the
segments can be as many as the individuals in the market. The more segments, the easier it
should be to fulfill the needs and wants of the individuals within them ceteris paribus. More
target markets should therefore lead to more revenues. On the other hand the more target
markets there are the higher the costs of catering to them will be. A golden middle therefore
has to be found. In short, the increase in revenue from adding the last target group has to
outweigh the additional costs incurred.
Positioning is the third step in the target marketing process. The concept was coined by
the advertising specialists Al Ries and Jack Trout (2001). By positioning we mean the image
that an organization wants the target market to have of its brand compared to the competitors´
brands. Four kinds of decisions have to be made (Keller, 2008). First of all, as has been
mentioned already, the organization has to make a decision on the brand´s target market.
Secondly, the nature of the competition has to be established. Thirdly, a decision has to be
made concerning the brand´s points-of-difference. And lastly it has to decide which
associations it needs to share with its good or service category or the competitors´ brands, i.e.
points-of parity. The positioning has to ensure that the brand is chosen (Keller, Sternthal and
Tybout, 2002) because of its differentiation (strong, positive, and unique associations) in the
minds of the target market. The positioning should give the target market a reason to buy the
brand. At the same time the positioning has to prevent competitors´ brands from being
chosen. This is done by ensuring that the brand also has other strong and positive
associations it shares with the competitors´ brands. By doing that the target market does not
5
have a reason not to buy the brand and it is not possible for the competitors´ brands to
differentiate themselves.
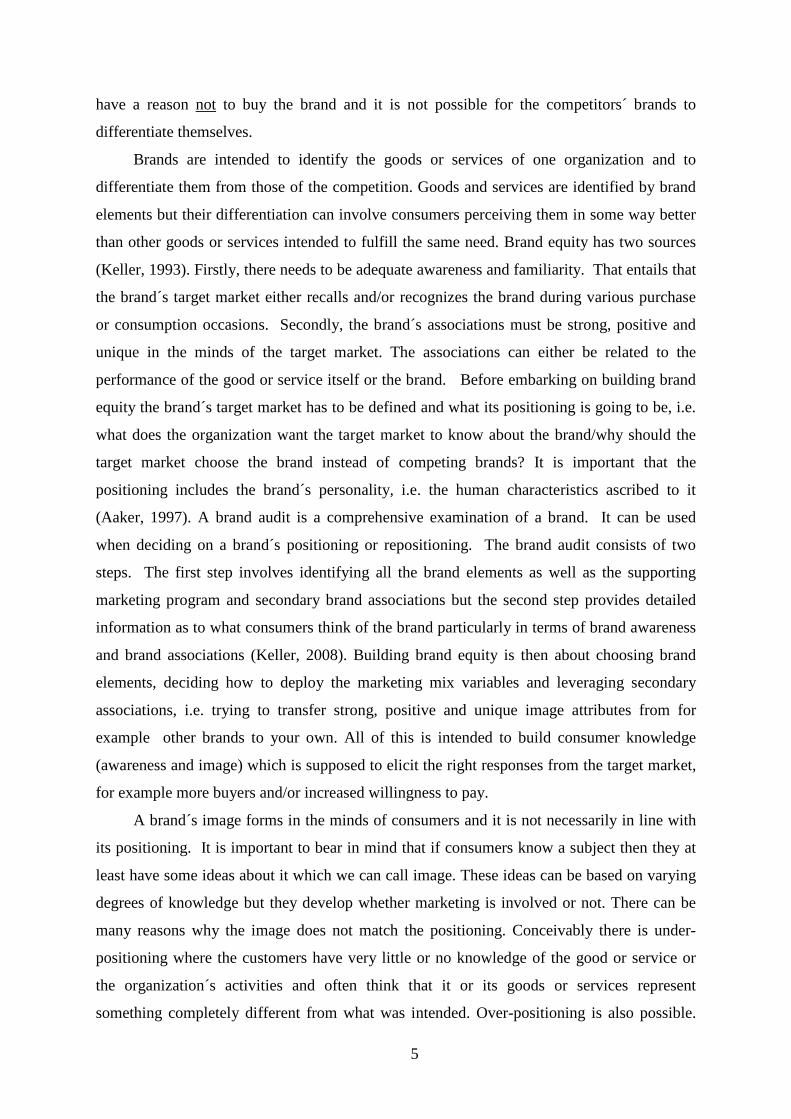
Brands are intended to identify the goods or services of one organization and to
differentiate them from those of the competition. Goods and services are identified by brand
elements but their differentiation can involve consumers perceiving them in some way better
than other goods or services intended to fulfill the same need. Brand equity has two sources
(Keller, 1993). Firstly, there needs to be adequate awareness and familiarity. That entails that
the brand´s target market either recalls and/or recognizes the brand during various purchase
or consumption occasions. Secondly, the brand´s associations must be strong, positive and
unique in the minds of the target market. The associations can either be related to the
performance of the good or service itself or the brand. Before embarking on building brand
equity the brand´s target market has to be defined and what its positioning is going to be, i.e.
what does the organization want the target market to know about the brand/why should the
target market choose the brand instead of competing brands? It is important that the
positioning includes the brand´s personality, i.e. the human characteristics ascribed to it
(Aaker, 1997). A brand audit is a comprehensive examination of a brand. It can be used
when deciding on a brand´s positioning or repositioning. The brand audit consists of two
steps. The first step involves identifying all the brand elements as well as the supporting
marketing program and secondary brand associations but the second step provides detailed
information as to what consumers think of the brand particularly in terms of brand awareness
and brand associations (Keller, 2008). Building brand equity is then about choosing brand
elements, deciding how to deploy the marketing mix variables and leveraging secondary
associations, i.e. trying to transfer strong, positive and unique image attributes from for
example other brands to your own. All of this is intended to build consumer knowledge
(awareness and image) which is supposed to elicit the right responses from the target market,
for example more buyers and/or increased willingness to pay.
A brand´s image forms in the minds of consumers and it is not necessarily in line with
its positioning. It is important to bear in mind that if consumers know a subject then they at
least have some ideas about it which we can call image. These ideas can be based on varying
degrees of knowledge but they develop whether marketing is involved or not. There can be
many reasons why the image does not match the positioning. Conceivably there is under-
positioning where the customers have very little or no knowledge of the good or service or
the organization´s activities and often think that it or its goods or services represent
something completely different from what was intended. Over-positioning is also possible.

6
Then the customers have too narrow a view of the organization, its goods or its services. The
positioning can also be vague or confusing. When awareness of the brand has been created
and strong, positive and unique associations established then purchase intent goes up, the
number of consumers increases, consumption frequency goes up, the purchase amount
increases and/or a higher price can be charged for the good or service. The ultimate objective
is to increase consumer loyalty both behaviourally and attitudinally. All this can be
measured. By doing that the orgainzation can, for example, find out whether the brand suffers
from some awareness or image problems (see for example Lehmann, Keller and Farley,
2008).
7
2 THE USE OF PERCEPTUAL MAPS TO MEASURE IMAGE
One of the more sophisticated research methods used in marketing is perceptual mapping. It
shows how goods in a market are perceived on certain attributes and which goods are
competitors seen from the customers´ point of view. Perceptual maps therefore give a strong
indication of a good´s image and how they can be positioned to improve performance. The
maps, therefore, can be of great help when marketing related decisions have to be made
(Festervand, 2000; Festervand, 2002; Kara, Kaynak and Kucukemiroglu, 1996; Stanton and
Lowenhar, 1977). Perceptual maps clearly show how the market is divided and indicate how
it might be segmented into smaller and more homogeneous segments.
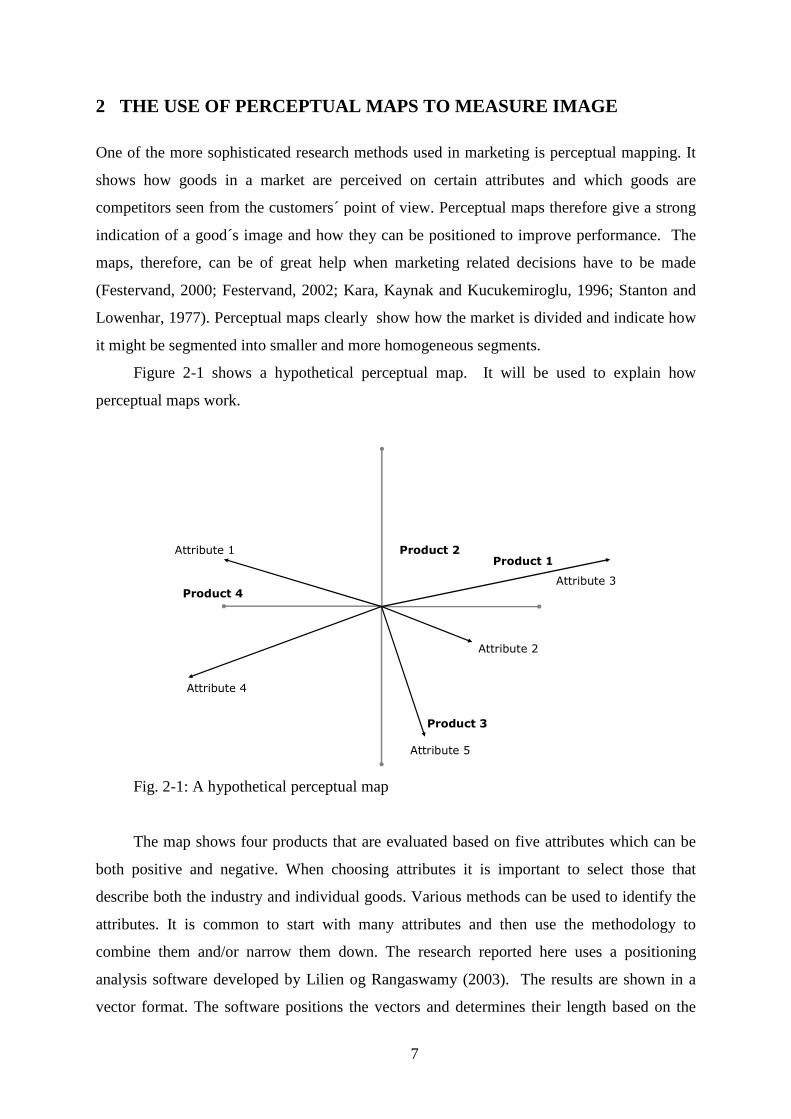
Figure 2-1 shows a hypothetical perceptual map. It will be used to explain how
perceptual maps work.
Product 1
Product 4
Product 2
Product 3
Attribute 1
Attribute 2
Attribute 4
Attribute 5
Attribute 3
Fig. 2-1: A hypothetical perceptual map
The map shows four products that are evaluated based on five attributes which can be
both positive and negative. When choosing attributes it is important to select those that
describe both the industry and individual goods. Various methods can be used to identify the
attributes. It is common to start with many attributes and then use the methodology to
combine them and/or narrow them down. The research reported here uses a positioning
analysis software developed by Lilien og Rangaswamy (2003). The results are shown in a
vector format. The software positions the vectors and determines their length based on the

8
average scores for each good´s attributes. Many similar methods exist (Gwin, 2003; Sharp
and Romaniuk, 2000; Bijmolt and Wedel, 1999; Sinclair and Stalling, 1990; Kohli and
Leuthesser, 1993; Shugan, 2004).
The length of the vectors indicates how well or decisively the attributes can distinguish
between the products. A long vector indicates that the attribute is decisive in consumers´
minds. The further the product is from the center of the map the more decisive is its
differentiation based on that attribute. It is important to keep in mind that the vectors are read
in both directions from the center of the map even though only one of the vectors is shown
(Lilien og Rangaswamy, 2003). We can for example see that product 1 is less connected to
attribute 4 than the other products. The size of the angle between the vectors also gives
important information. A narrow angle indicates that the attributes are closely related since
the correlation between them is high.
The respondents in the survey, to be discussed in chapter 4, evaluated the various
attributes of the brands of Icelandic banks and savings & loans. A nine point scale was uses.
In Table 2-1 a typical response format is shown. Respondents evaluated all the banks´ brands
on the basis of the same attributes. The comparision between brands is therefore relative.
Table 2-1: A typical response format for an image attribute Is Modern!
Applies very
badlyApplies very vell
Landsbankinn 1 2 3 4 5 6 7 8 9Glitnir 1 2 3 4 5 6 7 8 9
Kaupthing 1 2 3 4 5 6 7 8 9BYR 1 2 3 4 5 6 7 8 9
SPRON 1 2 3 4 5 6 7 8 9Sparisjodir 1 2 3 4 5 6 7 8 9
The respondents evaluated the different brands based on whether they felt the attributes
in question described the brands very well or very badly or somewhere between.

9
3 THE IMAGE OF BANKS
As mentioned before, organizations always have an image of some kind in the minds of
individuals who know of them. The image can differentiate one organization from another
and can affect the behaviour of individuals towards it and thereby its success. For banks,
which first and foremost market intangible products and services, image is of still greater
importance because its importance increases as the degree of intangibility of what are being
marketed increases (Brady, Bourdeau and Heskel, 2005). In addition the products and
services of banks are usually considered homogenous and easy for the competition to imitate.
This makes image even more important for their differentation.
The image of banks affects costumer loyalty (see for example Cengiz, Ayyildiz and Er,
2007 and Cohen, Gan, Yong and Chong, 2007) but it can either be related to the attributes of
the products or the brands (Chen, Chang and Chang, 2005 and O‘Loughlin and Szmigin,
2005). It is debated in the literature however, whether image has a direct effect on loyality or
an indirect effect, for example, through perceived quality or satisfaction. Image can also play
a part in whether a customer starts doing business with a bank (Bravo, Montaner and Pina,
2009). The image of banks can therefore, at least, have an effect on their revenues. In the
most comprehensive research ever done on the relationship between image and profitability
of banks a positive and significant correlation was established (Ohnemus, 2009).
To the best of the authors´ knowledge no research has been published in peer-reviewed
scholarly journals on the image of banks following a banking crisis even though such
research must have been done, at least by the banks themselves. It is very likely that the
Icelandic banks did such surveys in the aftermath of the banking crisis in October 2008. At
least two of them have come to the conclusion that their image is so bad that they have had to
change their names. Glitnir changed its name to Islandsbanki (Bank of Iceland) in February
2009 and Kaupthing changed its name to Arion banki in November the same year. A name
change has on the other hand not been planned for Landsbanki (Þorbjörn Þórðarson, 2009).

10
4 THE IMAGE OF BANKS IN THE AFTERMATH OF A BANKING
CRISIS
In this chapter the findings from a study on the image of the Icelandic retail banks both
before and after the banking crisis in the fall of 2008 will be reported. The methodology will
be discusses and how the data was analysed. Finally conclusions will be drawn.
4.1 METHODOLOGY
The research´s findings are based on three surveys. The participants were students at the
University of Iceland. The surveys were web-based. A convenience sample was used and
the findings are therefore only generalizable to the sample. They indicate, however, that the
sample is fairly representative of the student population in terms of gender and field of study.
The authors therefore believe that the findings are a good indication of university students´
attitudes. In addition the market share of the banks among the university students is in line
with their market share in general. That and the general debate that has been going on in the
media indicate that the findings, to a large extent, are in line with the sentiments of the
general public.
The surveys were done in April 2008 (n=514), February 2009 (n=573) and April 2009
(n=566). They are a part of an ongoing research that has been going on since 2004
(Gudlaugsson, 2008). In all the surveys the same or similar sets of attributes have been used.
The attributes were identified in an extensive exploratory study in 2004. It involved
interviews with the banks´ customers, their management and personnel, a thorough review of
their websites and an analysis of their general media coverage. All the surveys are structured
in the same way. In the first part participants are asked to evaluate the banks based on a set
of attributes. In the second part participants are asked a couple of general questions, for
example which of the banks they did most of their business with and whether it was likely
that they would switch banks within the next six months. Finally the last part of the surveys
contained demographic variables.
This research only uses data from the first part of the surveys, i.e. the attributes part,
and only the attributes used in all the three surveys. That makes the comparison easier. The
attributes are; „Supports good causes“, „Progressive“, „Modern“, „Corruption“, „Old-
fashioned“, „Personal service“, „Social responsibility“, and „Trust“. The participants

11
evaluated each bank on each attribute using a nine point scale, where 1 = applies very badly
to this bank and 9= applies very well to this bank.
4.2 DATA ANALYSIS
All the data from the surveys were analysed in the same way. To arrive at the banks´ relative
image the perceptual mapping software designed by Lilian and Rangaswamy (2003) was
used. The methodology was described in chapter three. Each attribute´s average score for
each of the bank is calculated and the results shown in a perceptual map. The map does,
however, not show the trends in the average attribute scores neither for individual banks nor
for the banking sector as a whole. To show the trends average scores were calculated
separately and compared between surveys.
4.3 RESULTS
In this chapter the findings of the research will be detailed. Each survey is discussed
separately and the perceptual maps interpreted. Then conclusions are drawn and the research
question, „What is the effect of a banking crisis on the image of banks“, answered.
Fig. 4-1 shows the results for the attributes part of the first survey. The findings are
typical of the findings from earlier surveys which have, as mentioned before, been done
regularly since 2004 (Gudlaugsson, 2008). The perceptual map shows the attributes as
vectors which should be read in both directions. The representation in Fig. 4-1 indicates that
the findings are robust since the attributes „Modern“ and „Old-fashioned“ have opposite
directions. The reason both of these attributes are included is first and foremost to check the
robustness of the findings but not to get any additional information.
As can be seen in Fig. 4-1 the savings & loans; Sparisjoðurinn, Spron and Byr, are all
grouped together in the SW part of the map. Sparisjoðurinn is farthest from the center but Byr
is closest to it. This indicates that the position of Sparisjoðurinn is more distinct in the target
markets´ minds than the position of Byr. The savings&loans are most closely connected to
the attribute, „Old-fashioned“, but least connected to the attributes „Progressive“, „Modern“,
and „Corruption“.
Kaupthing is located in the SE part of the map. Judging from its distance from the
center and from other banks its position in the minds of the target market seems relatively
distinct and clear. This is the bank most closely connected to the attribute „Corruption“, but it

12
is also connected to the attributes „Modern“, and „Progressive“. Kaupthing is neither
perceived to offer „Personal service“, nor show „Social responsibility“.
Glitnir is located in the NE part of the map. Its position close to the center indicates that
its positioning is not very decisive. It is most closely connected to the attribute „Progressive“
but also connected to attributes such as „Modern“, „Corruption“ and „Supports good causes.“
Support good causes
Trust
Personal service
Social responsibility
Progressive
Modern
Old-fashioned
Corruption
Image of banks and savings banksApril 2008, 17/4-2/5 (n=514)
Fig. 4-1: The image of retail banks in April 2008
The position of Landsbankinn seems to be both strong and distinct. The bank is
situated in the NW part of the map and is far from its center. That indicates that the
participants in the survey have a clear image of the bank. Landsbankinn is the bank most
closely connected to the attributes „Trust“, „Supports good causes“, and is „Socially
responsible“. It has a very positive image since the attributes it is strongly connected to are in
themselves positive. To reiterate, this perceptual map is typical of the maps for the previous
years (Gudlaugsson, 2008). The conclusion therefore is that in April 2008, and in previous
years since 2004, the brand Landsbankinn had a strong, positive and unique image in the
banking sector in Iceland.
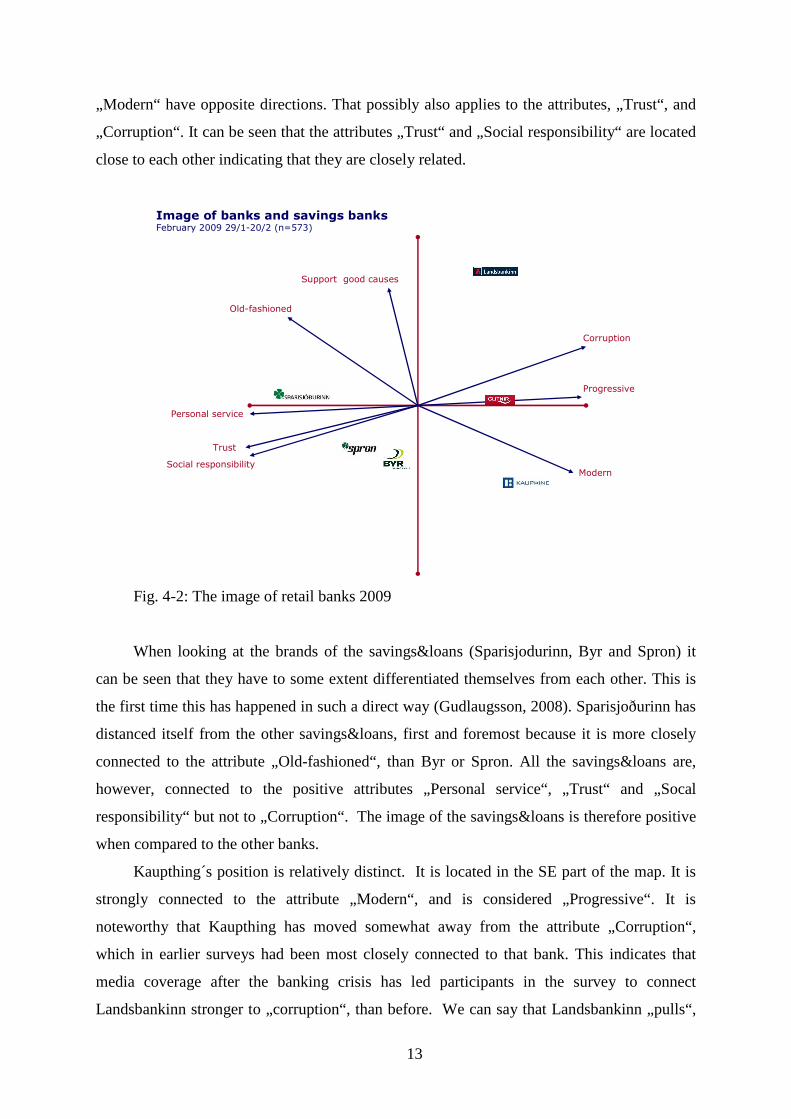
Fig. 4-2 shows the results for the attributes part of the survey done in February 2009, or
four months aftert he banking crisis. As before, the map shows the attributes as vectors. The
representation indicates that the findings are robust since the attributes „Old-fashioned“ and
13
„Modern“ have opposite directions. That possibly also applies to the attributes, „Trust“, and
„Corruption“. It can be seen that the attributes „Trust“ and „Social responsibility“ are located
close to each other indicating that they are closely related.
Image of banks and savings banksFebruary 2009 29/1-20/2 (n=573)
Support good causes
Trust
Personal service
Social responsibility
Progressive
Modern
Old-fashioned
Corruption
Fig. 4-2: The image of retail banks 2009
When looking at the brands of the savings&loans (Sparisjodurinn, Byr and Spron) it
can be seen that they have to some extent differentiated themselves from each other. This is
the first time this has happened in such a direct way (Gudlaugsson, 2008). Sparisjoðurinn has
distanced itself from the other savings&loans, first and foremost because it is more closely
connected to the attribute „Old-fashioned“, than Byr or Spron. All the savings&loans are,
however, connected to the positive attributes „Personal service“, „Trust“ and „Socal
responsibility“ but not to „Corruption“. The image of the savings&loans is therefore positive
when compared to the other banks.
Kaupthing´s position is relatively distinct. It is located in the SE part of the map. It is
strongly connected to the attribute „Modern“, and is considered „Progressive“. It is
noteworthy that Kaupthing has moved somewhat away from the attribute „Corruption“,
which in earlier surveys had been most closely connected to that bank. This indicates that
media coverage after the banking crisis has led participants in the survey to connect
Landsbankinn stronger to „corruption“, than before. We can say that Landsbankinn „pulls“,

14
the attribute „Corruption“, away from Kaupthing. Kaupthing is not perceived as offering
„Personal service“, it lacks „Trust“, and is not connected to „Socal responsibility“.
Glitnir, like before, is close to the center of the map which indicates that its image is not
very clear in the target markets´ minds. The bank is most closely connected to the attributes
„Progressive“ and „Corruption“ but least to the attributes „Personal service“, „Trust“ and
„Social responsibility“.
Landsbankinn shows the most change in its position from earlier surveys. The bank
moves away from positive attributes, which it was closely related to earlier, to the negative
attribute „Corruption“. It is pretty clear that the media coverage, after the banking crisis, has
greatly affected the bank´s image. Landsbankinn now has a decisively weak image instead of
a decisively strong one. The bank seems to have lost all trustworthyness and is not connected
to „Social responsibility“, and „Trust“ which had been its hallmarks.
In Fig. 4-3 the results for the attributes part of the survey done in April 2009 is shown.
The representation indicates that the findings are robust since the attributes „Old-fashioned“
and „Modern“ have opposite directions. The same possibly applies to the attributes
„Corruption“, and „Social responsibility“.
Image of banks and savings banksApril 2009 7/4-17/4 (n=566)
Support good causes
Trust
Personal service
Social responsibility
Progressive
ModernOld-fashioned
Corruption
Fig. 4-3: The image of retail banks in April 2009

15
The savings&loans differentiate themselves from each other just like in the February
survey but even more decisively. Sparisjodurinn is closely connected to the attribute „Social
responsibility“, but is considered „Old-fashioned“. Spron has moved somewhat away from
the positive attributes „Social responsibility“, „Trust“ and „Personal service“ which indicates
that its image has gotten weaker. Spron was declared bankcrupt at the time of the data
collection. Byr is located close to the center of the map which indicates that it has an unclear
position in the target markets´ minds. Still it is in the positive part of the map and is
connected to the attributes “Trust“, „Personal service“, „Social responsibility“ and „Supports
good causes“ but is considered „Old-fashioned.“
Kaupthing is located in the NE part of the map and is strongly connected to the
opposite attributes of „Trust“, and „Personal service“. The bank is located on the
„Corruption“, part of the map and is not considered likely to „Support good causes“. Still
Kaupthing is perceived to be „Modern“, and „Progressive.“
Islandsbanki, which changed its name from Glitnir after the survey was done in
February, is located close to the center of the map like before, which indicates that the target
market has an unclear image of the bank. It is most connected to the attributes „Progressive“,
„Corruption“ and „Modern“ and least to the attributes „Trust“, „Personal service“ and „Social
responsibility“. The position of Islandsbanki is therefore much the same as the position of
Glitnir was before.
Landsbankinn is situated in the SE part of the map. It is closely connected to the
attribute „Supports good causes“ but has moved away from the positive attributes it was
closely connected to before, i.d. „Trust“, „Social responsibility“ and „Personal service“
towards the attributes, „Progressive“, „Corruption“ and „Modern.“
Fig. 4-4 shows a composite of the findings of the last two surveys (February and April
2009). They are compared to the typical findings of earlier surveys (Gudlaugsson, 2008).

16
Image of banks and savings banksFebruary og April 2009 (n=1.139)
Support good causes
Trust
Personal service
Socialresponsibility
Progressive
Modern
Old-fashioned
Corruption
Fig. 4-4: Composite findings and a comparison with earlier surveys
The results show that Sparisjodurinn has a similar position before and after the banking
crisis. If anything it is more distinctive in the sense that its location is farther away from the
center than before. The bank is still connected to attributes such as, „Personal service“,
„Social responsibility“, „Trust“ and „Old-fashioned.“ Sparisjodurinn therefore seems to have
gained the position that Landsbankinn had before. The location of Byr and Spron has not
changed much but it is more closely connected to the attribute „Trust“, then the attribute
„Corruption“.
Glitnir/Islandsbanki is almost in the same position after the banking crisis. It is
connected to attributes such as, „Progressive“ and „Modern“ but as before the attribute
„Corruption“ is close by. Kaupthing´s position is also similar to what it was before the crisis
but is slightly further away from the attribute „Corruption“. The reason seems first and
foremost to be that Landsbankinn is „pushing“, Kaupthing away from that attribute.
The position of Landsbankinn has changed a lot. This is the bank that had the best
image in earlier surveys and was usually connected to attributes such as „Personal service“,
„Trust“ and „Social responsibility“. After the banking crisis its image is completely different
and much worse. The bank has now moved away from those positive attributes and is now
much more connected to the attribute „Corruption“. Landsbankinn is like before connected to
the attribute „Old-fashioned“. Before the banking crisis Landsbankinn was the bank with the

17
best or strongest image. Now it has the worst one. The conclusion is therefore that the brand
Landsbankinn is the brand that has suffered the most damage in the aftermath of the banking
crisis. The bank has not changed its name like Glitnir. The bank´s management seems to
follow the strategy of rebuilding the Landsbanki brand instead of trying to build a new one. It
has to be kept in mind though that the future ownership of the bank is unclear and it may be
the case that its current management is awaiting a decision on that matter before decisions are
made concerning the brand itself. But whatever the decision it seems clear that the banking
crisis has greatly damaged Landsbankinn as a brand and in light of the fact that it takes a long
time to build or rebuild an image a lot of work seems to be in store for the management of the
bank and its empolyees in general if they want to recapture their earlier position.
The image of brands can be compared using perceptual maps. The map shows how the
positions of the banks have changed relative to other banks. On the other hand it does not
show how the average scores for individual attributes have changed. That comparison is
shown in Table 4-1.
Table 4-1: Average scores from three surveys April 2008, n = 514
LB Glitnir Kaupthing BYR Spron Spar AverageSupport good causes 7,6 7,2 6,3 6,2 6,2 6,1 6,6Trust 7,7 6,7 6,3 6,4 6,4 6,6 6,7Personal service 6,9 6,7 6,0 6,7 6,8 6,8 6,6Social responsibility 6,4 6,0 5,4 5,9 5,9 5,9 5,9Progressive 7,2 7,8 8,1 6,7 6,2 5,9 7,0Modern 7,2 8,1 8,2 7,2 6,8 6,3 7,3Old-fashioned 5,3 3,8 3,7 4,7 5,3 5,9 4,8Corruption 5,7 6,2 6,9 5,2 5,3 5,0 5,7
LB Glitnir Kaupthing Byr Spron Spar AverageSupport good causes 5,7 5,2 4,7 5,3 5,0 5,2 5,2Trust 3,2 3,0 2,9 4,9 4,8 5,3 4,0Personal service 4,9 4,7 4,5 5,4 5,4 5,7 5,1Social responsibility 2,8 2,7 2,5 4,1 3,9 4,2 3,4Progressive 5,2 5,3 5,5 5,1 4,7 4,6 5,1Modern 5,7 6,2 6,3 6,0 5,5 5,3 5,8Old-fashioned 5,4 4,4 4,3 4,6 5,2 5,6 4,9Corruption 8,5 8,6 8,7 6,1 6,2 5,6 7,3
LB ÍB Kaupthing Byr Spron Spar AverageSupport good causes 6,0 5,6 5,1 5,7 5,2 5,3 5,5Trust 3,6 3,7 3,1 4,2 3,7 4,3 3,8Personal service 5,1 5,2 4,7 5,4 5,2 5,6 5,2Social responsibility 3,3 3,4 3,1 3,9 3,8 4,1 3,6Progressive 5,1 5,3 5,3 5,0 4,6 4,6 5,0Modern 5,6 6,0 6,1 5,9 5,3 5,2 5,7Old-fashioned 5,7 4,9 4,8 5,0 5,4 5,9 5,3Corruption 8,7 8,4 8,8 7,4 7,4 6,7 7,9
February 2009, n = 573
April 2009, n = 566
Table 4-1 shows the results of the three surveys. The average scores have been
converted to a 10 point scale to make the interpretation and comparison easier. The table
shows that Landsbankinn´s (LB) average score for „Corruption“, has increased the most or
from 5,7 to 8,5 in February 2009 and 8,7 in April 2009. At the same time the average score
18
for „Corruption“ in general has increased from 5,7 to 7,3 in February 2009 to 7,9 in April
2009. Still Kaupthing is the bank that gets the highest average score for corruption. When
looking at trust it can be seen that the average score is much lower for the banking sector as a
whole. Still no bank has been as hard hit as Landsbankinn. In 2008 Landsbankinn was the
bank getting the highest average score for trust or 7,7. In February 2009 it got an average
score of 3,2 and 3,6 in April 2009. This information supports the main claim that the brand
Landsbankinn has been damaged the most in the aftermath of the banking crisis, first and
foremost because of its strong position before the crisis.
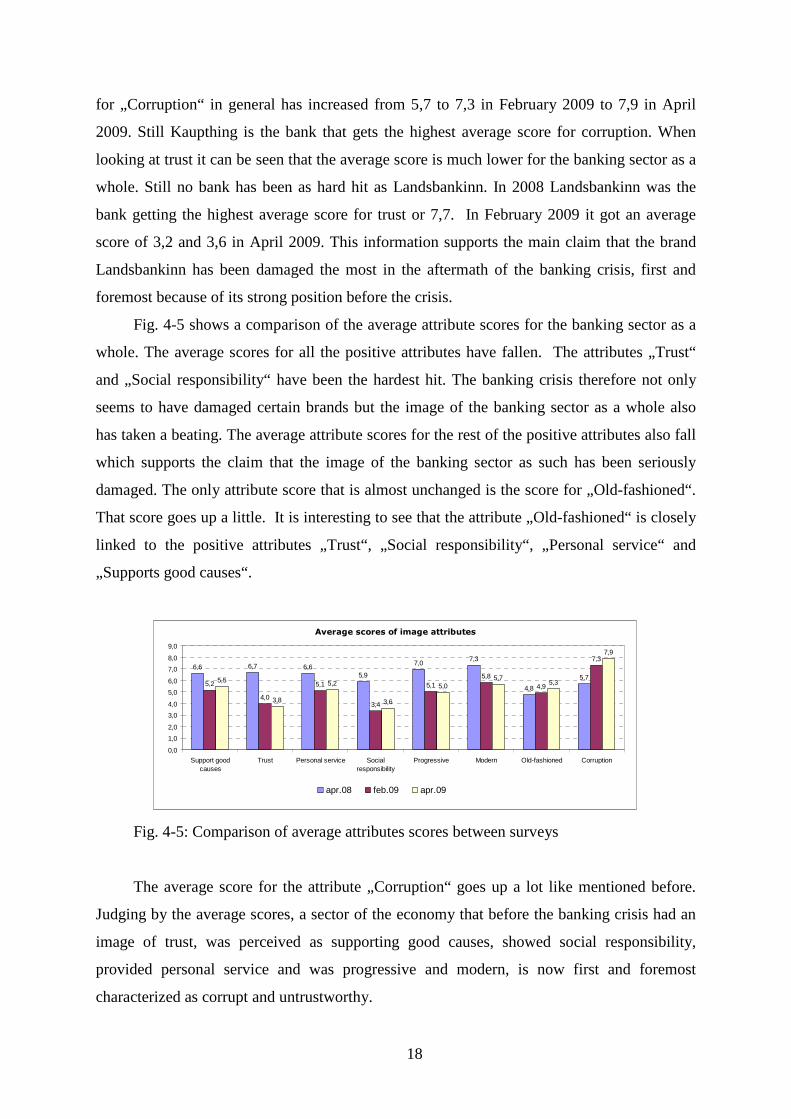
Fig. 4-5 shows a comparison of the average attribute scores for the banking sector as a
whole. The average scores for all the positive attributes have fallen. The attributes „Trust“
and „Social responsibility“ have been the hardest hit. The banking crisis therefore not only
seems to have damaged certain brands but the image of the banking sector as a whole also
has taken a beating. The average attribute scores for the rest of the positive attributes also fall
which supports the claim that the image of the banking sector as such has been seriously
damaged. The only attribute score that is almost unchanged is the score for „Old-fashioned“.
That score goes up a little. It is interesting to see that the attribute „Old-fashioned“ is closely
linked to the positive attributes „Trust“, „Social responsibility“, „Personal service“ and
„Supports good causes“.
Average scores of image attributes
6,6 6,7 6,65,9
7,07,3
4,8
5,75,2
4,0
5,1
3,4
5,15,8
4,9
7,3
5,5
3,8
5,2
3,6
5,05,7
5,3
7,9
0,0
1,0
2,0
3,0
4,0
5,0
6,0
7,0
8,0
9,0
Support goodcauses
Trust Personal service Socialresponsibility
Progressive Modern Old-fashioned Corruption
apr.08 feb.09 apr.09
Fig. 4-5: Comparison of average attributes scores between surveys
The average score for the attribute „Corruption“ goes up a lot like mentioned before.
Judging by the average scores, a sector of the economy that before the banking crisis had an
image of trust, was perceived as supporting good causes, showed social responsibility,
provided personal service and was progressive and modern, is now first and foremost
characterized as corrupt and untrustworthy.
19
5 DISCUSSION
The research question put forth at the beginning of this paper was, „Wwhat effect does a
banking crisis have on the image of banks?“ The results indicate that the image of
Landsbankinn has been the most affected. Consumers, who previously had the perception that
the bank was trustworthy and showed social responsibility, now seem to most strongly
associated with corruption. It is very likely that the banking crisis, and the media coverage in
its aftermath, has caused this shift in perception.
The findings also indicate that consumers connect Kaupthing less to corruption then
before the banking crisis. It is more likely though that the reason is not that consumers think
Kaupthing is less corrupt than before but that the explanation has more to do with the
perceptual mapping methodology used were a change in Landsbankinn´s position can have an
effect on Kaupthings relative position.
Islandsbanki (formerly Glitnir) has almost the same relative position it had before the
banking crisis. The same can be said of the position of the savings&loans except that their
differentation is a bit clearer than before because they are farther from the center of the
perceptual map. The brand Sparisjodurinn seems to now have the same enviable position that
Landsbankinn had before the crisis.
It has to be kept in mind that at the time of the surveys in February and April 2009 the
Icelandic government had taken over the three big banks (Glitni, now Islandsbanki,
Kaupthing and Landsbankinn). On the other hand Spron had not been declared bankcrupt.
That happened after the surveys were done. A reasonable assumption would be that the image
of Spron and the other savings and loans has changed following media coverage of their
affairs.
Aside from the effect of the banking crisis on the image of individual banks and
savnings&loans the effect on the image of the banking sector as a whole has been profound.
The positive attributes which were previously connected to the banks get a much lower
average score now. The attributes „Trust“, and „Social responsibility“ are especially hard hit.
The attribute „Corruption“, gets a much higher average score on the other hand.
The research reported here only focuses on one of the issues connected to the banking
crisis, i.e. the image of the banks. In the same surveys data on customer loyalty was also
gathered. How customer loyalty was affected as a result of the change in the banks´ image is
a topic for a different paper. It would also be interesting to examine the effects of the banks
rebranding efforts on their image both in the short and long run.

20
Finally it will be interesting to see whether the banking sector has started to regain
some of its lost trust. A new survey will be done in February 2010. Its findings (and taking
into account what the banks have done since the crisis) could give indications concerning
how organizations in industries that experience a crisis like the banking sector in Iceland (or
have a bad image in general) can improve its image, individually and/or collectively.

21
6 REFERENCES
Aaker, J. (1997). Dimensions of brand personality. Journal of Marketing Research, 34, 347-
357.
Bijmolt, T. and Wedel, M. (1999). A Comparison of Multidimensional Scaling Methods for
Perceptual Mapping. Journal of Marketing Research, 36, 277-285.
Brady, M. K, Bourdeau, B. L. and Heskel, J. (2005). The importance of brand cues in
intangible service industries: an application ot investment services. Journal of Services
Marketing, 19(6/7), 401-410.
Bravo, R., Montaner, T. and Pina, J. M. (2009). The role of bank image for customers versus
non-customers. Internatinal Journal of Bank Marketing, 27(4), 315-334.
Cengiz, E., Ayyildiz, H. and Er, B. (2007). Effects of image and advertising efficiency on
customer loyalty and antecedents of loyalty: Turkish banks sample. Banks and Bank
Systems, 2(1), 56-78.
Chen, T. Y., Chang, P. L. and Chang, H. S. (2005). Price, brand cues, and banking customer
value. International Journal of Bank Marketing, 23(2/3), 273-292.
Chaston, I. (2001). E-marketing strategy. England: McGraw-Hill.
Cravens, D. W. (1994). Strategic marketing. Illinos: Richard D. Irwin, Inc.
Cohen, D., Gan, C., Yong, H . H. A. and Chong, E. (2007). Customer retention by banks in
New Zealand. Banks and Bank Systems, 2(1), 40 – 55.
Dickson, P. R. and Ginter, J. L. (1987). Market segmentation, product differentiation, and
marketing strategy. Journal of Marketing, 51, 1-10.
Dowling, G., Lilien, G., and Thomas, R. (2000). Harvesting customer value: understanding
and applying the STP process. Recieved 11. May 2005 from www.marketingiq.com.
Festervand, T.A. (2000). A Note on the Development Advatages of the Southern States:
Perceptual Mapping as a Guide to Development Marketing and Policy. Economic
Development Quarterly, 14, 292-297.
Festervand, T.A. (2002). U.S. Foreign Direct Investment: Industrial Executives’ Perception
of Emerging Central American Countries as FDI Destinations. IJCM, 12, 72-86.

22
Gwin, C.F. (2003). Product Attributes Model: A Tool for Evaluating Brand Positioning.
Journal of Marketing Theory and Practice, 11, 30-42.
Hollensen, S. (2003). Marketing management, a relationship approach. London: Harlow;
Person Education.
Hunt, S. (1976). The nature and scope of marketing. Journal of Marketing, 40, 17-28.
Jackson, S. E. (2007). Using strategic segmantaion to prioritize growth opportunities.
Corporate Finance Review, 11, 11-22.
John, F. and Smithee, A. (1999). Strategic marketing and the resource based view of the
firm. Academy of Marketing Science Review, 1-22.
Kara, A., Kaynak, E. and Kucukemiroglu, O. (1996). Positioning of Fas-Food Outlets in Two
Regions of North America: A Comparative Study Using Correspndence Analysis. Journal
of Professional Service Marketing, 14, 99-119.
Karande, K., Shankarmahesh, M. N. and Rao, C. P. (1999). Marketing to public- and private
– sector companies in emerging countries: A study of Indian purchasing managers.
Journal of International Marketing, 7, 64-83.
Keller, K. L. (2008). Strategic brand management. Upper Saddle River: Pearson Prentice
Hall.
Keller, K. L. (1993). Conceptualizing, measuring, and managing customer-based brand
equity. Journal of Marketing, 57, 1-29.
Keller, K. L., Sternthal, B. and Tybout, A. (2002). Three questions you need to ask about
your brand. Harvard Business Review, 80, 80-86.
Kohli, C.S. and Leuthesser, L. (1993). Product Positioning: A comparison of Perceptual
Mapping Techniques. The Journal of Product and Brand Management, 2, 10-20.
Kotler, P. and Levy, S. J. (1969). Broadening the concept of marketing. Journal of
Marketing, 33, 10-15.
Kotler, P., Armstrong, G., Saunders, J. and Wong, V. (2001). Principles of marketing. Essex:
Pearson Education.
Kotler, Philip. (1994). Marketing management. New Jersey: Prentice-Hall.

23
Kumar, N. (2004). Marketing as strategy, understanding the CEO´s agenda for driving
growth and innovation. Boston: Harvard Business School Press.
Lehmann, D. R., Keller, K. L. and Farley, J. U. (2008). The structure of survey-based brand
metrics. Journal of International Marketing, 16 (4), 29-56.
Lilien, G. and Rangaswamy, A. (2003). Marketing Engineering, Computer Assisted
Marketing Analysis and Planning. New Jersey: Prentice Hall.
Matsuno, K. and Mentzer, J. T. (2000). The effect of strategy type on the market orientation-
performance relationship. Journal of Marketing, 64, 1-16.
McDaniel, C. and Gates, R. (1999). Contemporary marketing research. Ohio: South-Western
College Publishing.
Ohnemus, L. (2009). Is branding creating shareholder wealth for banks? International
Journal of Bank Marketing, 27(3), 186-201.
O´Loughlin, D. and Szmigin, I. (2005). Customer perspectives on the role and importance in
Irish retail financial services. International Journal of Bank Marketing, 23(1), 8-27.
Ries, A. and Trout, J. (2001). Positioning: The battle for your mind. New York: McGraw-
Hill.
Sarkar, M. B., Echambadi, R. and Harrison, J. S. (2001). Alliance entrepreneurship and firm
market performance. Strategic Management Journal, 22, 701-711.
Sharp, B. and Romaniuk, J. (2000). Using known patterns in image data to determine brand
positioning. International Journal of Market Research, 42, 219-230.
Shugan, S.M. (2004). The Impact of Advancing Technology on Marketing and Academic
Research. Marketing Science, 23, 469-475.
Sinclair, S.A. and Stalling, E.C. (1990). Perceptual Mapping; A Tool for Industrial
Marketing; A Case Study. The Journal of Business & Industrial Marketing, 5, 55-66.
Solomon, M., Bamossy, G. and Askegaard, S. (2002). Consumer behaviour, a European
perspective. Essex: Pearson Education.
Stanton, J.L. and Lowenhar, J.A. (1977). Perceptual Mapping of Consumer Products and
Television Shows. Journal of Advertising, 6, 16-22.

24
Walker, O. C., Boyd, H. W., Mullins, J. and Larreche, J. C. (2003). Marketing strategy, a
decision-focused approach. New York: Oxford University Press.
West, D., Ford, J. and Ibrahim, E. (2006). Strategic marketing, creating competitive
advantage. New York: Oxford University Press.
Wind, Y. J. (1981). Marketing-oriented planning models. Í R. L. Schultz og A. A. Zoltners
(ritstjórar), Marketing Decision Models (pp. 270-250). Amsterdam: Elsevier.
Þorbjörn Þórðarson. (2009, september). Landsbankinn hleypur ekki frá fortíð sinni (in
Icelandic). Morgunblaðið, viðskipti/atvinnulíf, pp. 2.
Gudlaugsson, T. (2008). Ímynd banka og sparisjóða (in Icelandic). Í Ingjaldur Hannibalsson
(ritstjóri). Rannsóknir í félagsvísindum IX, (pp 601-613).