How Rural Minnesota Communities Access and Use Broadband
12
How Rural Minnesota Communities Access and Use Broadband: Minnesota Intelligent Rural Communities Report ¦ ¦ Jack M. Geller, Ph.D. The EDA Center University of Minnesota, Crookston A report commissioned by the Blandin Foundation to support the work of the Minnesota Intelligent Rural Communities Coalition and Funded by the American Recovery and Reinvestment Act
Transcript of How Rural Minnesota Communities Access and Use Broadband

How Rural Minnesota Communities Access and Use Broadband: Minnesota Intelligent
Rural Communities Report
¦
¦
Jack M. Geller, Ph.D.
The EDA Center
University of Minnesota, Crookston
A report commissioned by the Blandin Foundation to support the
work of the Minnesota Intelligent Rural Communities Coalition and
Funded by the American Recovery and Reinvestment Act
Table of Contents
Table of Contents ¦ ................................................................................................................................................ ¦ 1 ¦
Introduction ¦ ........................................................................................................................................................ ¦ 2 ¦
Methodology ¦ ...................................................................................................................................................... ¦ 3 ¦
Baseline Findings ¦ ................................................................................................................................................ ¦ 4 ¦
A Closer Look at the Digitally Distant ¦ .................................................................................................................. ¦ 8 ¦
V. Observations and Conclusions ¦ .......................................................................................................................... ¦ 9 ¦
HOW RURAL MINNESOTA COMMUNITIES ACCESS AND USE BROADBAND: MINNESOTA INTELLIGENT RURAL COMMUNITIES BASELINE REPORT ¦ 1 ¦
¦ ¦
Introduction
¦ 2 ¦
¦ ¦
Looking back several years from now, it may turn out that 2010 will be noted as a turning point for broadband
deployment, adoption and utilization throughout rural Minnesota. Due to the passage of the federal American
Recovery and Reinvestment Act (ARRA), more than $7 billion dollars were appropriated nationwide to support the
deployment, access and adoption of broadband technology; much of it targeted toward rural America. It is a level of
technology investment that can best be described as unprecedented; and to date here in Minnesota, municipalities,
counties, nonprofit organizations and state agencies have been working together with local and regional broadband
providers to secure more than $400 million of these funds.
While a majority of these investments are targeted for the deployment of last mile and middle mile fiber infrastructure,
several of the funded projects are oriented toward increasing the access, use and adoption of broadband technology.
One such project administered by Blandin Foundation is titled Minnesota Intelligent Rural Communities (MIRC). MIRC
is $6.3 million project comprised of more than 19 statewide partners and 11 demonstration communities throughout
rural Minnesota. Over the next 30 months the goal of the project is to help create technologically and economically-
vital rural communities, competing and thriving in the broadband economy, with sustainable broadband adoption, job
growth, and wealth creation.
The strategies to achieve this goal will draw on Intelligent Community Indicators and an array of broadband demand
development approaches including education, training, technical assistance and barrier removal. Targeted populations
are rural Minnesota residents who are unemployed and seeking employment, small main street businesses that have
not yet adopted modern Internet-based technologies, county governments working together to implement technology
plans, as well as 11 “demonstration communities” where local leadership has recognized broadband as a critical
infrastructure in the global economy.
Specifically, the MIRC project will:
Enhance public access at state workforce centers with increased access to training and new online learning
opportunities
Generate a sustainable community response for helping businesses use the Internet more effectively.
Deliver e-entrepreneurship / training and technical support to small businesses in critical industries for rural
Minnesota
Support community broadband initiatives in community technology planning; reducing the ‘digital divide’;
and creating a ‘culture of use’
Support communities and critical institutions in the promotion and implementation of high-value broadband
applications in health care, education, government and business
As part of the overall reporting and evaluation strategy, MIRC partners collaborated with the EDA Center at the
University of Minnesota, Crookston to conduct the project’s evaluation over its lifespan. Given that a central goal of
MIRC is to increase the adoption of broadband technology throughout rural Minnesota, a key measure in its evaluation
is the observed growth in broadband subscriptions throughout rural Minnesota. To accomplish that goal we conducted
this baseline study of broadband adoption both statewide, as well as in the 11 demonstration communities identified
in the project. This will be the baseline from which broadband growth is observed.
...................... ¦
...................... ¦
...................... ¦
...................... ¦
...................... ¦
HOW RURAL MINNESOTA COMMUNITIES ACCESS AND USE BROADBAND: MINNESOTA INTELLIGENT RURAL COMMUNITIES BASELINE REPORT ¦ 3 ¦
Methodology¦ ¦
Data for the statewide study was conducted through telephone interviews among 911 households across rural
Minnesota. The sample was stratified based upon degree of rurality, categorizing rural counties as being (1) adjacent
to a metro county; (2) non-adjacent; or (3) remote rural. The data were collected by the St. Peter-based Center for
Rural Policy & Development from May through July 2010. The statistical margin of error is + 4 percent. And lastly,
given the recent interest in understanding the impact of excluding “cell phone only” users from telephone polling, it
is noteworthy to mention that all calls made as a part of this survey were made to landline telephone numbers (more
about this later).
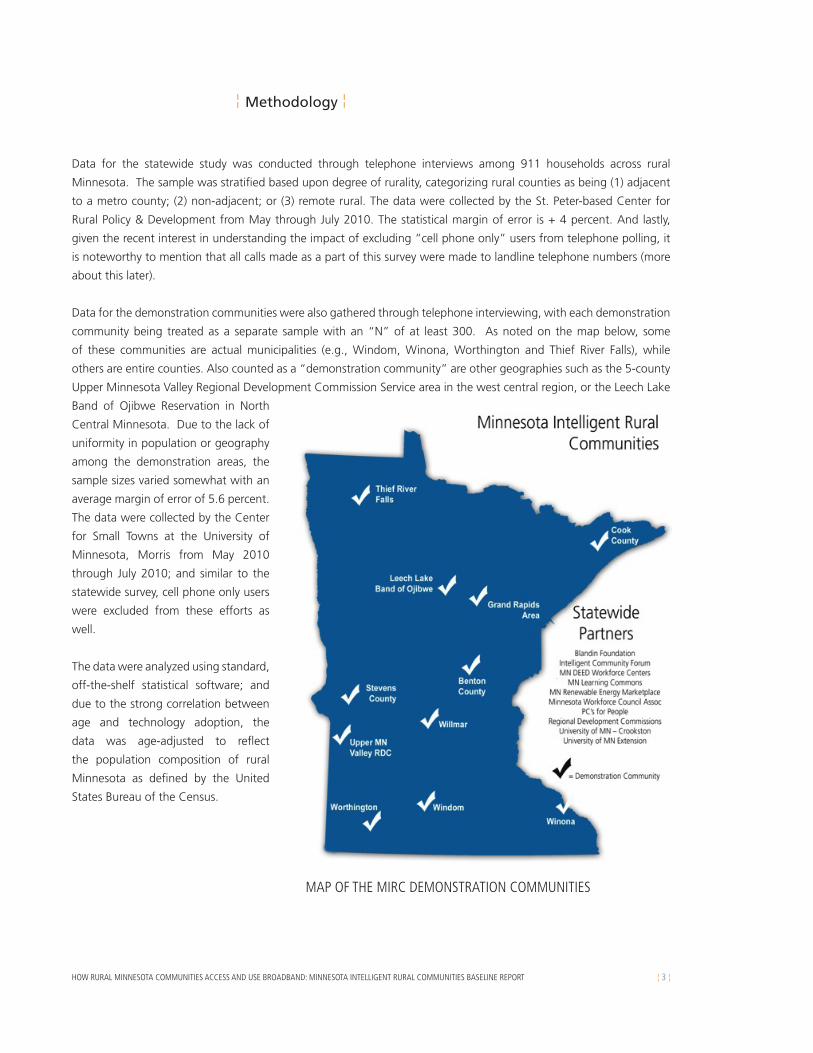
Data for the demonstration communities were also gathered through telephone interviewing, with each demonstration
community being treated as a separate sample with an “N” of at least 300. As noted on the map below, some
of these communities are actual municipalities (e.g., Windom, Winona, Worthington and Thief River Falls), while
others are entire counties. Also counted as a “demonstration community” are other geographies such as the 5-county
Upper Minnesota Valley Regional Development Commission Service area in the west central region, or the Leech Lake
Band of Ojibwe Reservation in North
Central Minnesota. Due to the lack of
uniformity in population or geography
among the demonstration areas, the
sample sizes varied somewhat with an
average margin of error of 5.6 percent.
The data were collected by the Center
for Small Towns at the University of
Minnesota, Morris from May 2010
through July 2010; and similar to the
statewide survey, cell phone only users
were excluded from these efforts as
well.
The data were analyzed using standard,
off-the-shelf statistical software; and
due to the strong correlation between
age and technology adoption, the
data was age-adjusted to reflect
the population composition of rural
Minnesota as defined by the United
States Bureau of the Census.
MAP OF THE MIRC DEMONSTRATION COMMUNITIES

Baseline Findings
¦ 4 ¦
¦ ¦
The three key parameters measured to establish a broadband baseline across rural Minnesota are: (1) Home ownership
of a working computer; (2) Internet connectivity in the household; and (3) Purchase of a broadband subscription.
Fortunately, these three key measures have been regularly assessed since 2001 by the Center for Rural Policy and
Development. Accordingly, the 2010 data collected helps not only establish a baseline for the MIRC project, but also
helps us understand the important statewide trends for these key measures across all of rural Minnesota.
The chart below provides the estimated rates for computer ownership, Internet connectivity and broadband adoption
from 2001-2010. As one can see, the blue line, which represents the adoption of computers in the home, shows
virtually no substantive growth since 2007; suggesting a plateau in the adoption curve, leaving approximately one in
four rural households without a working computer. This is a significant problem, as the home computer is still the
primary appliance by which rural residents connect to the Internet.
The second red line represents
the adoption curve for Internet
connectivity in rural Minnesota
households. Not surprisingly,
it nicely parallels the adoption
curve for computer ownership.
However, if one looks close
they can see that in 2001 76
percent of home computers
were connected to the
Internet, but now in 2010, 95
percent of all home computers
are connected to the Internet.
Clearly, while there are a wide
variety of reasons why rural
residents purchase a home
computer, in 2010 connecting
to the Internet is undoubtedly
one of them.
The third green line represents the adoption curve for broadband adoption, and here you can see the dramatic
growth trend since 2001. Today, 64 percent of all rural households have a broadband connection while 6 percent
still maintain a dial-up Internet connection. Ironically in 2001 only 6 percent of rural households had a broadband
connection and now a decade later that same percent are still maintaining a dial-up connection.
As in all parts of the U.S. there are a variety of reasons for this dramatic growth in broadband; however one of the
primary reasons lies with the deployment patterns among rural cable and telephone providers. Unlike other parts
of the country that are disproportionately dependent upon large national cable and telephone carriers, Minnesota
has a multitude of smaller private, public and cooperative providers. Further, many of these smaller “home grown”
companies actually deployed broadband technology to their rural customers before some of the larger national carriers
PERCENT OF HOUSEHOLD ADOPTION 2001-2010
80
¦ BROADBAND ¦ ¦ INTERNET ¦
70
60
50
40
30
20
10
02001 2002 2003 2004 2005 2006 2007 2010
6 1015
21
27
40
52
64
46 46
57 56 54
59
68 7060 59
6563 62
66
73 74
¦ COMPUTER ¦

HOW RURAL MINNESOTA COMMUNITIES ACCESS AND USE BROADBAND: MINNESOTA INTELLIGENT RURAL COMMUNITIES BASELINE REPORT ¦ 5 ¦
deployed similar technology to more populated suburban and exurban areas. Other reasons for the strong adoption
rate includes the price competitiveness of the product as providers rushed to bundle their broadband services with
video and voice products; the movement by commercial and governmental concerns to push more services online; and
the strong advocacy and policy positions on broadband by local, regional and state groups and foundations.
However, it also must be cautioned that due to the stagnant growth of home computers throughout rural Minnesota,
it is clear that we will soon see a dramatic slowing of broadband growth as we reach full adoption among all those
residents that maintain a home computer. Unfortunately, this may still leave one in four rural households completely
“offline.”
The Demonstration Communities
The table below compares the baseline rates for the 11 MIRC communities to the statewide rates noted above.
ADOPTION PATTERNS IN MIRC DEMONSTRATION COMMUNITIES
¦ COMMUNITY ¦
Benton County 74.2% 70.6% 66.3% 4.3% Cook County 83.3% 74.8% 50.2% 24.6% Itasca County 72.9% 68.2% 63.3% 4.9% Kandiyohi County 74.0% 66.5% 64.0% 2.5% Leech Lake Band 66.9% 57.4% 48.8% 8.6% Stevens County 73.9% 68.1% 64.4% 3.7% Thief River Falls 71.1% 67.0% 59.4% 7.6% Windom 69.8% 66.4% 62.7% 3.7% Winona 80.2% 76.0% 69.2% 6.8% Worthington 61.3% 56.0% 53.9% 2.1% Upper MN Valley 67.5% 60.2% 57.6% 2.6%
Rural MN Statewide 74.3% 70% 64% 6%
¦ COMPUTEROWNERSHIP ¦
¦ INTERNETCONNECTIVITY ¦
¦ BROADBANDADOPTION ¦
¦ DIAL-UPADOPTION ¦
As one can see, the adoption patterns in the demonstration communities track closely to the statewide averages for
rural Minnesota; however, there clearly are some deviations that are noteworthy. First, it appears that the areas in
southwest Minnesota (Windom, Worthington & Upper MN Valley) have somewhat lower adoption rates than other
areas of rural Minnesota. Second, the remarkably high percentage of dial-up connections in Cook County suggests
that this is a region with unique broadband access problems. And finally, it should be noted that the community of
Winona, being a somewhat larger community with multiple universities, likely has a profile more similar to a metro
community than a rural community.

¦ 6 ¦
INTERNET CONNECTION TYPE
Don’t know ¦ .5% ¦
Other ¦ 13.6% ¦
DSL ¦ 47% ¦
Cable Modem ¦ 30.3% ¦
Dial-up ¦ 8.7% ¦
The graph on the left documents how rural
Minnesota residents who are online actually
connect to the Internet. Here we see that DSL
technology maintains a greater market share over
cable modem connections in rural areas. This may
likely be due to the geographic reach of DSL into
the rural countryside, whereas cable connections
typically end at or near the municipal boundaries.
Further, notice that 8.7% of those households
online still maintain a dial-up connection, and 13.6 percent report connecting through a fixed wireless, satellite, or
some other technology.
Dial-up users were also specifically
asked why they have yet to switch
to a broadband connection. And as
you can see from the graph on the
right the overwhelming response was
that broadband is still too expensive
(61%). Slightly over 20 percent
reported that broadband was simply
not available where they lived, while 15 percent reported that they simply did not connect to the Internet often
enough to justify the added expense of a broadband connection. Also interesting is that only 3.5 percent of current
dial-up users reported the reason why they have not purchased a home broadband connection is due to their use of
a broadband connection elsewhere, such as at work, at the public library, or at a friend’s or relative’s house. Such a
low percentage suggests that these dial-up users are not accommodating broadband into other facets of their life and
are not likely to switch without an external environmental change, e.g., a significant price reduction or a broadband
deployment into regions that are currently unserved. Previous research by the Center for Rural Policy and Development
and the Pew Center for the Internet and American Life has consistently documented strong correlations between the
demographic and socio-economic variables of Age and Income with technology adoption. Specifically, these past
studies have identified that elderly residents, along with those who are of lower-incomes are significantly less likely to
adopt and utilize digital technologies than younger or more affluent cohorts.
The following graphs examine the relationship between Age and Income in this regard.
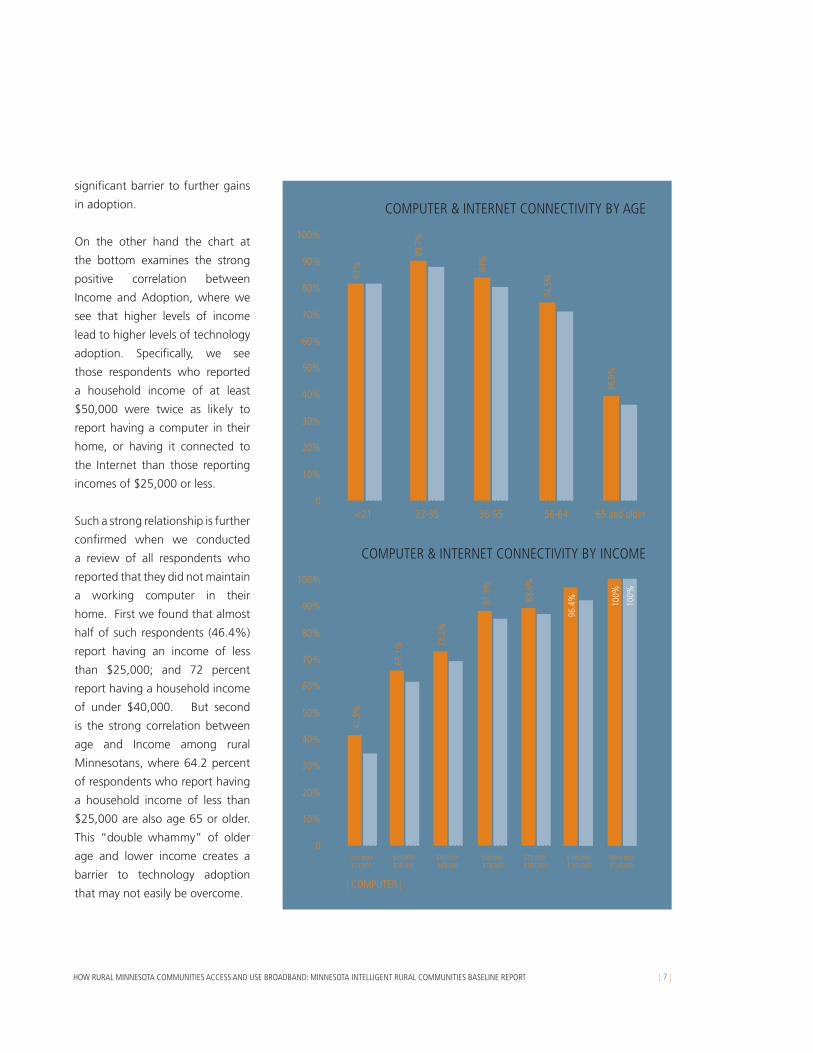
As one can see on the chart on top of the next page, the relationship between Age and technology adoption is both
obvious and inverse (i.e., higher levels of age lead to lower levels of adoption). Similar to what was observed in past
studies, here we see that the adoption rate for those who report their age to be 65 or older tend to adopt these
technologies at a rate that is barely one-half of the rate reported by all other age cohorts, with the exception of those
56-64 years of age. While past studies have also suggested that such correlations are also found in more metropolitan
regions, the reality is that in many rural Minnesota communities, elderly residents comprise a disproportionately high
percentage of the population. This of course, leads to creating a drag on rural Minnesota adoption rates and creates a
WHY DIAL-UP USERS HAVE NOT SWITCHED
Too expensive ¦ 60% ¦
Use BB elsewhere ¦ 3.5% ¦
Little use ¦ 15.10% ¦
Not available ¦ 20.5% ¦
HOW RURAL MINNESOTA COMMUNITIES ACCESS AND USE BROADBAND: MINNESOTA INTELLIGENT RURAL COMMUNITIES BASELINE REPORT ¦ 7 ¦
significant barrier to further gains
in adoption.
On the other hand the chart at
the bottom examines the strong
positive correlation between
Income and Adoption, where we
see that higher levels of income
lead to higher levels of technology
adoption. Specifically, we see
those respondents who reported
a household income of at least
$50,000 were twice as likely to
report having a computer in their
home, or having it connected to
the Internet than those reporting
incomes of $25,000 or less.
Such a strong relationship is further
confirmed when we conducted
a review of all respondents who
reported that they did not maintain
a working computer in their
home. First we found that almost
half of such respondents (46.4%)
report having an income of less
than $25,000; and 72 percent
report having a household income
of under $40,000. But second
is the strong correlation between
age and Income among rural
Minnesotans, where 64.2 percent
of respondents who report having
a household income of less than
$25,000 are also age 65 or older.
This “double whammy” of older
age and lower income creates a
barrier to technology adoption
that may not easily be overcome.
COMPUTER & INTERNET CONNECTIVITY BY AGE
80%
70%
60%
50%
40%
30%
20%
10%
0<21 22-35 36-55 56-64 65 and older
90%
100%
83%
83%
89.7
%
86%
84%
80%
74.5
%
70.8
%
38.9
%
36.3
%
COMPUTER & INTERNET CONNECTIVITY BY INCOME
80%
¦ COMPUTER ¦ ¦ INTERNET ¦
70%
60%
50%
40%
30%
20%
10%
0Less than $25,000
90%
100%
42.5
%
34.6
%
65.1
%
61.6
%
73.2
%
69.5
%
87.3
%
84.8
% 88.6
%
86.4
%
96.4
%
92.8
%
100%
100%
$25,000-$39,000
$40,000-$49,000
$50,000-$74,000
$75,000-$100,000
$100,000-$150,000
More than $150,000

¦ 8 ¦
A Closer Look at the Digitally Distant¦ ¦
As noted earlier, the primary goal of MIRC is to increase the adoption and utilization of broadband technology
throughout rural Minnesota. And while the current adoption rates are impressive compared to rural areas in other
states, it is clear that the growth is slowing as broadband adoption inches closer to the rate of overall computer
adoption. Accordingly, the ability to significantly increase broadband growth will lie in the ability to reach those rural
residents who are currently the most digitally distant.
Everett Rogers, in his 1962 book titled Diffusion of Innovations called those who were the last and most difficult
holdouts to adopt a new technology “Laggards.” The term is certainly not meant to be derogatory, but rather
reflective of those who often choose to never adopt the technology, or would only adopt it with significant assistance
or structural change. Rogers suggests that “the point of reference for the laggard is the past.” Accordingly, “the
resistance to innovations on the part of the laggard may be entirely rational from the laggards’ point of view as their
resources are limited and so they must be relatively certain that a new idea will not fail before they can afford to adopt
it.” With that in mind, this brief section examines the characteristics of those respondents who are the most digitally
distant.
As discussed earlier, the primary reason why these respondents reported that they did not have a computer in their
home was simply that they did not need one (43.4%). Approximately 10 percent elaborated, saying that they did not
know how to use a computer; 8 percent reported that computers were too expensive; 22 percent reported that they
were too old for a computer; and 7 percent noted that they had access to a computer elsewhere. Of that group 4.8
percent noted that they had used a computer before at the library. But with the exception of this very small latter
group, this appears to be a population of non-adopters.
An interesting discussion has more recently emerged among those who study technology adoption around the idea
that access to the Internet is becoming less and less dependent upon the computer. Specifically, some have suggested
that similar to trends in Asia and Europe, new cellular “smartphones” are becoming a common way to digitally connect
without the use of a bulky computer. Accordingly, this digitally distant group was asked if they owned a cell phone;
and surprisingly, 55.3 percent of these non-adopters reported that indeed they did.
This discovery led to a variety of other questions regarding the use of their cellular device. Specifically, it was found that
only 6.4 percent of non-adopters ever sent a text message with their cell phone; only 1 percent ever sent or received an
email; and only 1 percent ever connected to the Internet with their cell phone. As a result it is reasonable to conclude
that the rural residents who have failed to maintain a computer in their home are not displacing the computer with
their smartphones to connect to the Internet.
Demographically, as noted earlier, almost 70 percent of non-adopters report being 65 years of age or older; 91 percent
of them live in a household of 2 or fewer people; 94 percent report having no school-age children living in their
household; and 46 percent report a household income under $25,000.
Clearly, the strategy of simply waiting for this group to adopt digital technology assuming that they are simply late
adopters has many flaws. Accordingly, MIRC is designed to work both statewide with media campaigns and public
information, as well as on the ground, with extensive training and technical assistance to both rural residents and
businesses. The baseline findings from this study seem to suggest that this strategy is sound.

HOW RURAL MINNESOTA COMMUNITIES ACCESS AND USE BROADBAND: MINNESOTA INTELLIGENT RURAL COMMUNITIES BASELINE REPORT ¦ 9 ¦
Observations and Conclusions¦ ¦
The purpose of this MIRC study was to establish a baseline for technology and broadband adoption for rural Minnesota,
and specifically for the 11 MIRC demonstration communities. As the statewide study allowed us to analyze the data
within a multi-year framework dating back to 2001, it is instructive to see the overall growth in broadband technology.
Starting from a low of 6 percent of all rural households to today’s adoption rate of 64 percent, it is clear to say that
broadband is now the predominant method by which rural Minnesotans connect to the Internet. Subsequently, within
Rogers’ framework of technology adoption, the time for innovators and early adopters has passed; and with a current
rate of 64 percent we are moving into the stage for late adopters. Simply put, broadband today is a rather mainstream
technology.
While it was not too long ago that availability of broadband was a primary concern, today access to a broadband
service provider in rural Minnesota is more available than ever. Data from this baseline study suggests that while
approximately 15 percent of respondents report having only one or no broadband providers locally, approximately half
of all respondents report having at least two local broadband providers. Such findings are further verified by Connect
MinnesotaSM , whose GIS mapping of broadband suggests that only 6 percent of Minnesota homes have no access
to a single broadband provider. So while it is reasonable to conclude that competition among providers is limited in
rural Minnesota, it is increasing.
Data from the 11 demonstration communities generally fall in line with the findings from the statewide study
throughout rural Minnesota with a few exceptions. Most notable was the paradox of reporting a higher than average
adoption of home computers and a significantly higher reliance on a dial-up connections in Cook County, MN. We
interpret this finding to mean that this is an area of the state where due to the unique geography and topography of
the county, availability of broadband is a particular challenge (further complicated by the fact that many residents are
seasonal). However, it is pleasing to note that recently it has been announced that Cook County has been awarded
funding through the ARRA to construct a fiber-to-the-premise network throughout the county.
Another demonstration community of particular note is the Leech Lake Band of Ojibwe. Due to the higher than
average rates of poverty in the community, the rate of landline telephone adoption cannot be assumed to be equal
to all of the other demonstration communities. And as a result, collecting data from only those with landline phones
suggest that we are only reaching residents who are less likely to be in poverty. In fact, during the data collection,
we exhausted all working telephone numbers assigned to Leech Lake members. Accordingly, the sample size is
approximately half in size of the other communities (140), and due to the socio-economic influence on the adoption
of landline phones, we do not have as much confidence in the findings in this community as we have in the others.
In spite of these unique challenges and circumstances, it is fair to conclude that overall, the data from the demonstration
communities appears to verify the findings from the statewide study and the statewide study reciprocally verifies the
community data. Further, the data provides us with a good baseline to track the future growth in the adoption of
home computers, Internet connectivity and broadband subscriptions.
The baseline data also suggests that due to the demographic and socio-economic characteristics of many rural
communities (and especially the more remote rural communities), the challenges to initiate further significant growth
in broadband subscriptions will be substantial. First as noted above, with 64 percent of all rural households already
adopting broadband, rural Minnesota is already moving into the secondary or tertiary stages of the adoption curve.

¦ 10 ¦
This by itself suggests further growth of this technology will be slowed as the remaining numbers to adopt get
smaller and smaller. Second, there are unique challenges in targeting adoption strategies to a population that is
disproportionately older and poorer. Yet many of those remaining non-adopters in rural Minnesota are increasingly
found with these characteristics.
On the other hand, there are several factors, both internal and external to MIRC that will clearly help in this regard.
First is the significant investment that is being made with the ARRA funds across rural Minnesota. Whether it is an
infrastructure project that will soon begin to deploy fiber in the ground, or the activities of all the MIRC partners
across the state; such activity creates visibility, attention in the local media and provides local residents an opportunity
to once again put broadband awareness back on the “front burner” in their respective communities. Second, with a
specific focus on older citizens, the unemployed, training, access and hands on technical assistance, the MIRC activities
themselves appear to be targeting the needs of these remaining non-adopters. And lastly, as advances in tele-health
applications, e-commerce, e-learning and e-government applications continue to emerge, the current population of
“laggards” (Rogers, 1962) will increasingly find relevance and advantage in these innovations. And as Rogers suggests,
once these residents interpret the advantages to an innovation to be significant, the probability of adoption increases.
Equally important, as noted at the beginning of this report one of the most significant barriers to broadband adoption
in many rural areas is actually the adoption of home computers. For many reasons the adoption rate of computers will
create a ceiling and barrier to broadband growth. The inclusion of strategies to increase the growth in home computer
ownership will be a key factor in advancing broadband growth strategies. Subsequently, it is noteworthy to mention
that the inclusion of PCs for People as one of the MIRC partners, whose specific strategy is to target lower-income
residents and provide them with a refurbished computer and sufficient training to become both broadband adopters
and full participants in the digital age.
Over the next 24 months the MIRC partners, as well as residents of the 11 demonstration communities will be engaged
in a substantial effort to educate, train, promote and assist rural residents and small businesses in their adoption and
enhanced utilization of broadband technology. As noted above, this initial research effort was designed to establish a
baseline from which growth can be tracked. Over the project’s timeframe, we will issue periodic reports of progress,
as well as a final report in 2012 evaluating the project’s results.

2010 COPYRIGHT. BLANDIN FOUNDATION BROADBAND INITIATIVE
¦ CONTACT ¦
Blandin Foundation
100 North Pokegama Avenue
Grand Rapids, MN 55744
218 326 0523
blandinfoundation.org
MINNESOTA INTELLIGENT RURAL COMMUNITIES, A PROJECT ADMINISTERED BY BLANDIN FOUNDATION