How Resilient Are Mortgage Backed Securities to ...
37
How Resilient Are Mortgage Backed Securities to Collateralized Debt Obligation Market Disruptions? JOSEPH R. MASON† JOSHUA ROSNER †† The mortgage-backed securities (MBS) market has experienced significant changes over the past couple of years. Non-agency (“private label”) securities, which are not guaranteed by the government or the government sponsored enterprises, now account for the majority of MBS issued. In this report, we review the rise of collateralized debt obligations (CDOs), the relaxation of lending standards, and the implementation of loan mitigation practices. We analyze whether these structural changes have created an environment of understated risk to investors of MBS. We also measure the efficacy of ratings agencies when it comes to assessing market risk rather than credit risk. Our findings imply that even investment grade rated CDOs will experience significant losses if home prices depreciate. We conclude by providing several policy implications of our findings. I. STRUCTURAL CHANGES IN THE U.S. LENDING AND SECURITIZATION SYSTEM............ 1 A. Fundamental Changes in Origination and Servicing .......................................... 4 1. Down-Payment Requirements....................................................................... 5 2. Cash-Out Refinancing and Home Equity Loans ........................................... 5 3. Private Mortgage Insurance ......................................................................... 7 4. Appraisal Process ......................................................................................... 9 5. Underwriting Standards ............................................................................... 9 6. Investor-Share Speculation ......................................................................... 10 7. Loss Mitigation ........................................................................................... 12 8. Subprime Markets ....................................................................................... 14 B. The Complexity of Securitization ....................................................................... 16 1. Mortgages and Mortgage-backed Securities Are Complex and Difficult to Value ....................................................................................................... 16 a. Mortgage Pools Are Difficult to Value ................................................ 16 b. Additional Complexity Makes MBS Even More Difficult to Value ...... 19 2. CDOs Add Complexity to MBS and Other Constituent Credit Instruments ................................................................................................. 23 II. THE LINK FROM MORTGAGES TO MORTGAGE-BACKED SECURITIES TO COLLATERALIZED DEBT OBLIGATIONS ..................................................................... 28 A. By Investing Heavily in Junior MBS and ABS Tranches, CDOs Provide a Substantial Base for the Leverage in Today’s Securitization Market ................ 28 B. Evidence for Hidden Risks: CDO Ratings Changes Follow Changes for Constituent CDO Collateral .............................................................................. 29 C. Links Between Mortgage Markets, MBS, and CDO Funding and the Housing Sector and Economic Growth.............................................................. 33 III. POLICY IMPLICATIONS ............................................................................................... 36 BIBLIOGRAPHY ................................................................................................................. 37 NOTE: This is a preliminary version of a forthcoming paper, as presented at Hudson Institute, February 15, 2007. For citation, please contact the authors at [email protected] and [email protected] . † Associate Professor of Finance and LeBow Research Fellow, Drexel University LeBow College of Business, Senior Fellow at the Wharton School, and Visiting Scholar, Federal Deposit Insurance Corporation. †† Managing Director, Graham Fisher & Co.
Transcript of How Resilient Are Mortgage Backed Securities to ...

How Resilient Are Mortgage Backed Securities to Collateralized Debt Obligation Market Disruptions?
JOSEPH R. MASON†JOSHUA ROSNER †† The mortgage-backed securities (MBS) market has experienced significant changes over the past couple of years. Non-agency (“private label”) securities, which are not guaranteed by the government or the government sponsored enterprises, now account for the majority of MBS issued. In this report, we review the rise of collateralized debt obligations (CDOs), the relaxation of lending standards, and the implementation of loan mitigation practices. We analyze whether these structural changes have created an environment of understated risk to investors of MBS. We also measure the efficacy of ratings agencies when it comes to assessing market risk rather than credit risk. Our findings imply that even investment grade rated CDOs will experience significant losses if home prices depreciate. We conclude by providing several policy implications of our findings. I. STRUCTURAL CHANGES IN THE U.S. LENDING AND SECURITIZATION SYSTEM............ 1
A. Fundamental Changes in Origination and Servicing .......................................... 4 1. Down-Payment Requirements....................................................................... 5 2. Cash-Out Refinancing and Home Equity Loans ........................................... 5 3. Private Mortgage Insurance......................................................................... 7 4. Appraisal Process......................................................................................... 9 5. Underwriting Standards ............................................................................... 9 6. Investor-Share Speculation......................................................................... 10 7. Loss Mitigation ........................................................................................... 12 8. Subprime Markets....................................................................................... 14
B. The Complexity of Securitization ....................................................................... 16 1. Mortgages and Mortgage-backed Securities Are Complex and Difficult
to Value....................................................................................................... 16 a. Mortgage Pools Are Difficult to Value ................................................ 16 b. Additional Complexity Makes MBS Even More Difficult to Value ...... 19
2. CDOs Add Complexity to MBS and Other Constituent Credit Instruments ................................................................................................. 23
II. THE LINK FROM MORTGAGES TO MORTGAGE-BACKED SECURITIES TO COLLATERALIZED DEBT OBLIGATIONS ..................................................................... 28 A. By Investing Heavily in Junior MBS and ABS Tranches, CDOs Provide a
Substantial Base for the Leverage in Today’s Securitization Market ................ 28 B. Evidence for Hidden Risks: CDO Ratings Changes Follow Changes for
Constituent CDO Collateral .............................................................................. 29 C. Links Between Mortgage Markets, MBS, and CDO Funding and the
Housing Sector and Economic Growth.............................................................. 33 III. POLICY IMPLICATIONS ............................................................................................... 36 BIBLIOGRAPHY ................................................................................................................. 37
NOTE: This is a preliminary version of a forthcoming paper, as presented at
Hudson Institute, February 15, 2007. For citation, please contact the authors at [email protected] and [email protected].
† Associate Professor of Finance and LeBow Research Fellow, Drexel University
LeBow College of Business, Senior Fellow at the Wharton School, and Visiting Scholar, Federal Deposit Insurance Corporation.
†† Managing Director, Graham Fisher & Co.

2 Joshua Rosner & Joseph R. Mason
Executive Summary
The mortgage-backed securities (MBS) market has experienced significant
changes over the past couple of years. Non-agency (“private label”) securities, which are not guaranteed by the government or the government sponsored enterprises, now account for the majority of MBS issued. This report reviews the rise of collateralized debt obligations (CDOs), the relaxation of lending standards, the implementation of loan mitigation practices and whether these structural changes have created an environment of understated risk to investors of MBS. The authors go on to measure the efficacy of ratings agencies when it comes to assessing market risk rather than credit risk. They determine that even investment grade rated CDOs will experience significant losses if home prices depreciate, leading to broader imbalances in the U.S. economy that, if left unchecked, could lead to prolonged economic difficulties.
Key Points from the Paper
• MBS are currently the most mature and complex of consumer structured finance products. The biggest obstacle that the authors identify is lack of transparency. Structural changes in the residential mortgage lending industry including reductions in down-payment requirements, relaxed underwriting standards, the movement to automated valuation and underwriting systems largely went unnoticed by MBS investors until only recently. This report explains that those changes went unnoticed largely because of the existing complexity and valuation difficulties underlying today’s MBS markets.
• The subprime lending industry has grown significantly since the mid 1990s. The industry has gone from representing less than 5 percent of all originations to 20 percent. On a dollar volume basis they have gone from $35 billion in 1994 to $625 billion in 2005.
• 2005 and 2006 saw massive deteriorations in subprime mortgage performance, particularly in “non-traditional” hybrid, interest-only, and negative-amortization loans. The percentage of subprime mortgages packaged into bonds and delinquent by 90 days or more, in foreclosure, or already turned into seized properties increased to 10 percent by 2006, the worst levels in nearly a decade.
• This poor performance in the subprime market and the recent revelation of “hidden risks” calls into question the capabilities of lenders, securitizers, and investors to reliably estimate peak charge-off rates. An analysis of subprime spreads suggests that investors may not fully appreciate these risks. Despite the recent performance of subprime loans, investors do not appear to demand higher returns for investing in riskier assets tied to the US mortgage market,
• Perhaps of greater concern is the reputational risk posed to the U.S. capital markets—markets that have historically been viewed as among the most

February 2007 Collateralized Debt Obligations 3
transparent, efficient, and well regulated in the world. The economic value of mortgage securitization and the risk transfer value of CDO issuance support their further use. However, there should be significant resources allocated to building the regulatory framework surrounding their structuring, issuance, ratings, sales, and valuation. This report finds that efforts to provide transparency to these new product areas can foster stability while maintaining liquidity to the underlying collateral sectors and supporting further meaningful financial innovation and capital deepening.
• Significant increases in public access to performance reports, CDO and MBS product standardization, and CDO and MBS securities ownership registration can help decrease the existing over-reliance on ratings agency inputs to rate and ultimately value the securities and reducing the valuation errors inherent in “marked-to-model” (rather than marked-to-market) portfolios. Overall, however, the U.S. economy needs an efficient public CDO market that allows transparent open-market repricing of market risk and outside research into new securities and funding arrangements. U.S. homeowners and consumers deserve stable and efficient funding to support their pursuit of the American dream.

4 Joshua Rosner & Joseph R. Mason
I. STRUCTURAL CHANGES IN THE U.S. LENDING AND SECURITIZATION SYSTEM
The reduction in mortgage rates and unemployment rates during the 1990s played a significant role in the growth of the housing sector. But interest rates and unemployment rates were not the only factors behind the rapid growth in home ownership. Changes in government policies, structural changes in mortgage origination and servicing, the unprecedented growth of securitization markets, particularly among private-label mortgage-backed securities (MBS), and demand for mortgage-related structured-finance products injected much needed liquidity into the mortgage finance industry.
FIGURE 1: U.S. HOME OWNERSHIP 1965-2006
62%
63%
64%
65%
66%
67%
68%
69%
70%
Source: Bureau of Census
As Figure 1 shows, these changes increased homeownership rates from 64 percent in the late 1980s to 69 percent by 2005. Below we review several fundamental changes relating to the structure of the U.S. lending and securitization system. Next, we explain how those fundamental changes to origination and servicing create difficulty in secondary mortgage markets.
A. Fundamental Changes in Origination and Servicing
Reductions in down-payment requirements, relaxed underwriting standards,
the movement to automated valuation and underwriting systems, and the ability of lenders to move loans off of their balance sheet into the capital markets decoupled the traditional links between regional economics and housing market performance. Similarly, an industry effort to mitigate bad loans, rather than having them pre-pay or foreclose, has altered the historic relationship between
1965
Q1
1967
Q1
1969
Q1
1971
Q1
1973
Q1
1975
Q1
1977
Q1
1979
Q1
1981
Q1
1983
Q1
1985
Q1
1987
Q1
1989
Q1
1991
Q1
1993
Q1
1995
Q1
1997
Q1
1999
Q1
2001
Q1
2003
Q1
2005
Q1

February 2007 Collateralized Debt Obligations 5 default and foreclosure rates. Although these changes posed minimal increases in risk during a rapidly appreciating and low-interest-rate housing environment, their risks may materialize under an environment with stagnant valuations and increasing interest rates.
1. Down-Payment Requirements
Historically, homebuyers were expected to put a significant amount of money down as payment for a home, usually 20 percent of the home’s value. Down payments assured lenders that buyers had enough of a personal investment in the property to repay the debt and maintain the asset. In prior housing cycles, given the high expense of extracting home equity and the infrequency of material declines in interest rates, home equity was considered a “forced savings plan”—the principal payments were retained as equity in what used to be a relatively illiquid asset. As refinancing became easier, and as competition and technology reduced refinancing costs, home equity no longer served that role. Instead, home ownership has become merely another manageable asset in one’s portfolio.
The traditional requirement that homebuyers make significant down payments was functionally eliminated in the 1990s. According to the Census Bureau, since 1999, more than 5 percent of all residential mortgages have been originated with no equity or had negative home-equity. This pattern has persisted despite the strong appreciation in home values until the middle of this decade, which should have increased available cash for down payments for repeat buyers. Eliminating down-payment barriers has created a homeownership option for Americans who previously were forced to rent due to savings or credit issues. Moreover, Doms and Krainer (2006) show that, during this cycle, changes in underwriting standards allowed reductions in down payment requirements from 20 percent to 0 percent in many products.
Several academics have empirically demonstrated the connection between low down-payment requirements and higher default probabilities. Von Furstenberg (1969) found that home equity at the time of origination was the most important predictor of default risk. In particular, he showed that when loan-to-value (LTV) ratios are raised from 90 to 97 percent, default rates for new homes increase sevenfold. Deng (1996) finds that with zero down payment loans, households have cumulative default rates are about twice as high as those whose mortgages require ten percent down assuming home prices appreciate at 10 percent annually and the unemployment rate is 8 percent; assuming house price levels are constant, these loans would have cumulative default rates about four times as high as those whose mortgages require ten percent down. Clauretie (1990) finds that the relationship between the LTV ratio, which is a function of the down-payment requirement, and both the default and loss rates is “crucial to explaining the impact of the loan-to-value ratio on mortgage risk.” He finds that both the default rate and the loss rates are significantly positively related to the LTV ratio and that the loss rate accounts for between 13 and 20 percent of total loan-to-value impact.
2. Cash-Out Refinancing and Home Equity Loans During the housing boom of the 1990s, strong home-price appreciation eased

6 Joshua Rosner & Joseph R. Mason the economic strains on the weakest buyers and declining interest rates allowed them to extract that appreciation through cash-out refinancing. According to Federal Reserve data, on a seasonally adjusted basis, total mortgage equity withdrawal increased from $289 billion to over $900 billion between 2000 and 2005. If home prices decline, then those borrowers may quickly find that they owe more money than the house is worth.
As interest rates declined, homeowners cashed out equity from their homes. According to Freddie Mac data, as a result of cashing out” in the first half of 2006, 87 percent of their refinanced loans resulted in loans that were at least 5% larger. Brady, Canner and Mak (2000) estimate that 47 percent of homeowners had refinanced their homes at least once by 1999. This activity was in stark contrast to the 8 percent who had refinanced at least once by 1977. According to data provided by the Mortgage Banker’s Association and Federal Housing Finance Board, the dollar volume of mortgage refinancing in the 1990s ($3.37 trillion) exceeded the dollar volume of all mortgage originations in the 1980s ($2.93 trillion). The two figures below demonstrate the shift in borrower behavior during the late 1990s.
FIGURE 2: HOME EQUITY EXTRACTED AND AVAILABLE FOR EXTRACTION
1995-2005
0
200
400
600
800
1000
1200
1400
1995 1996 1997 1998 1999 2000 2001 2002 2003 2004 2005Year
$B
illio
ns
Home Equity Cashed out at Refi ($Billions)
Home Equity Loans ($Billions)
Home Equity Cashed Out at Refi and Home EquityLoans ($Billion)
Source: Joint Center for Housing Studies of Harvard University (2006).

February 2007 Collateralized Debt Obligations 7
FIGURE 3: REFINANCING BEHAVIOR 1995-2005
0
10
20
30
40
50
60
70
80
90
1995 1996 1997 1998 1999 2000 2001 2002 2003 2004 2005Year
% o
f R
efi
nan
cin
gs
% Refinancing Resulting in 5%or Higher Loan Amount
% Refinancing Resulting inLower Loan Amount
Sources: Joint Center for Housing Studies of Harvard University (2006).
As Figure 2 shows, home equity extraction, through cash-out refinancing, increased from just under $14 billion in 1995 to almost $245 billion by 2005. During that period cash available for ready extraction through home equity lines of credit has increased from $332 billion to over $1 trillion. During the same period, total refinance originations increased from roughly $250 billion to nearly $2.8 trillion in 2003, declining to $1.4 trillion in 2005. Figure 3 shows that by 2005, over 70 percent of all refinancing activity resulted in a five percent or higher loan amount. The comparable figure for 2003 was less than 40 percent.
According to a 2006 report by Harvard’s Joint Center for Housing Studies, in 2003, cashed-out equity represented 4 percent of the dollar value of all refinancing. By 2004, it represented 22 percent, and by 2005, equity extraction through cash-out refinancing increased to 23 percent of the dollar value of refinancing activity. Homeowners have grown used to spending gains that only exist on paper. If prices stagnate or fall, then borrowers may quickly find that they owe more money than the house is worth.
3. Private Mortgage Insurance Private mortgage insurance (PMI) is a method by which non-federally
guaranteed (FHA or VA) homebuyers can, with monthly insurance premium payments, forgo the standard 20 percent down-payment requirements. As the government insures the FHA or VA lender on FHA or VA in the event of default, PMI protects the lender if a conventional borrower defaults. To be considered for PMI, a homebuyer must make a down payment of 3 to 5 percent of a home’s value. In the conventional market, the government-sponsored entities (GSEs),
8 Joshua Rosner & Joseph R. Mason recognizing the “near certainty of losses on most foreclosures,” have required PMI on mortgages with loan-to-value (LTV) ratios that exceed 80 percent.
The insurance generally covers the top 20 to 30 percent of the potential claim amount of the loan or the portion of the loan that exceeds 70 percent of the value of the property. With the decline of down payments, the PMI companies likely expected strong profits. But borrowers have been able to use subprime loans (discussed in more detail below), and silent-second mortgages to avoid PMI expenses. The effect of such strategies has been to increase lender risk. A 2006 study by Standard & Poor’s (S&P) analyzed nearly 640,000 piggyback first-lien mortgages in bond pools. S&P discovered that first-lien mortgages connected with piggyback loans are 43 percent more likely to go into default than stand-alone first mortgages of comparable size. The default rate increases to 50 percent for borrowers with a FICO credit score of 660 or less.
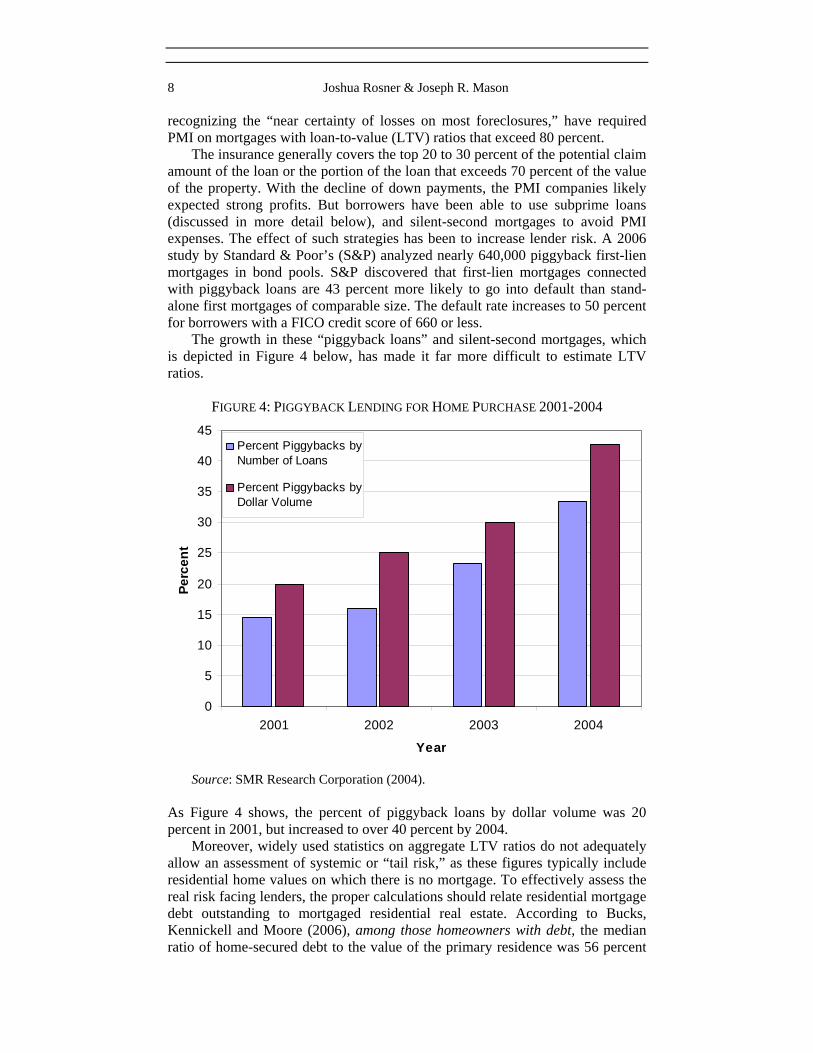
The growth in these “piggyback loans” and silent-second mortgages, which is depicted in Figure 4 below, has made it far more difficult to estimate LTV ratios.
FIGURE 4: PIGGYBACK LENDING FOR HOME PURCHASE 2001-2004
0
5
10
15
20
25
30
35
40
45
2001 2002 2003 2004
Year
Perc
ent
Percent Piggybacks byNumber of Loans
Percent Piggybacks byDollar Volume
Source: SMR Research Corporation (2004).
As Figure 4 shows, the percent of piggyback loans by dollar volume was 20 percent in 2001, but increased to over 40 percent by 2004.
Moreover, widely used statistics on aggregate LTV ratios do not adequately allow an assessment of systemic or “tail risk,” as these figures typically include residential home values on which there is no mortgage. To effectively assess the real risk facing lenders, the proper calculations should relate residential mortgage debt outstanding to mortgaged residential real estate. According to Bucks, Kennickell and Moore (2006), among those homeowners with debt, the median ratio of home-secured debt to the value of the primary residence was 56 percent

February 2007 Collateralized Debt Obligations 9
between 2003 and 2005. By contrast, the aggregate ratio of home-secured debt to home values for all homeowners was roughly 35 percent.
4. Appraisal Process The appraisal and appraised value of the home is arguably the most
important element of the home-loan origination process. Historically, appraisal values were based on a number of factors, and were not defined solely as the price that a buyer was willing to pay. The appraisal was a six-step process that included: (1) definition of the problem; (2) preliminary survey and appraisal plan; (3) data collection and analysis; (4) application of the three approaches to value, (5) reconciliation of value indications; and (6) final estimate of defined value. In an effort to increase efficiency and reduce costs, the lending industry has significantly increased reliance on automated value models.1 The movement away from traditional appraisals has been cited by rating agencies as a potential risk.2
The traditional practice of randomly assigned appraisers chosen from organized blind pools has also been largely abandoned. With the elimination of the objectivity from the blind pools, the process became less impartial. Today, appraisers are selected by agents and brokers with a strong interest in seeing the property change hands.
Moreover, given the way a mortgage broker is compensated, he or she has an incentive to increase the appraised value of the home, thereby allowing the homeowner to extract more equity from the home. The appraisal industry has repeatedly and routinely complained of pressures to “hit the bid.” Those who are unwilling to succumb to these pressures face the risk of lost business. Over-appraisal distorts value and undermines the integrity of the loan even before it is originated. It also reduces the ability of servicers to estimate default rates and losses in a declining real estate markets. According to a 2005 report from the Federal Bureau of Investigation, mortgage fraud has become nearly a billion dollar industry, and nearly 80 percent of the frauds are perpetrated with involvement of industry participants.
5. Underwriting Standards
Consistent with the growing use of automated valuations, the lending industry has also embraced automated underwriting (AU) models. The modeling
1. See, e.g., Debra Cope, ACB 13th Annual Real Estate Lending Report (2006). 2. See, e.g., FitchRatings, Mortgages: Principles and Interest, May 2004, available
at http://www.aaro.net/pdf/Reading%20Room/FitchReport.pdf (“Fitch is concerned that, under certain weakening housing conditions, any valuation method other than a full appraisal is likely to overestimate property value. As it relates to automated valuation models (AVMs), Fitch believes that the risk of property overvaluation is particularly great in declining markets. In Fitch’s opinion, such risk is paramount when alternative valuation methods are employed because of the time lag in the underlying data collection process. Nonfull appraisal techniques, such as AVMs, rely on public data that is ordinarily several months old. In rising markets, AVMs depend on housing price data that is slightly lower than current market conditions. However, in declining markets, the AVM may overestimate property values given current market conditions.”).

10 Joshua Rosner & Joseph R. Mason
of underwriting has been touted as a major innovation, allowing borrowers who would previously not have been approved for loans to be approved. Lenders claimed that although AU models approved credit-poor applicants who otherwise would not have been approved, the models did so in a manner that allegedly increased the underwriting standards and more accurately assessed default probability. AU system originations, which were non-existent until the late 1990s, are now common.
The AU models dramatically changed the traditional process of origination as well as the traditional documentation requirements. For borrowers with “good credit,” the AU software appears to tolerate higher debt-to-income levels than did traditional underwriting. Second, where manually underwritten loans typically required three months of bank statements and paycheck stubs, there are often no such limitations on borrowers under the AU models.3 Third, using the AU models, lenders now frequently approve loans in which the monthly mortgage debt service expense exceeds more than 50 percent of the borrowers monthly income. In fact, with the use of “exploding ARMs” and other hybrid loan products at the time of resetting, the initial debt-to-servicing ratio can increase to 95 percent or more.4 Historically, a borrower’s total mortgage payment (including principal, interest, taxes and insurance) was not to exceed 28 percent of monthly gross income and total debt load was not to exceed 36 percent of monthly gross income. Fourth, the AU models may inadvertently facilitate fraudulent behavior in lending.5
Perhaps most importantly, the AU models have supported the move to riskier and more aggressive loan products and the reduction in underwriting standards. Bies (2003) explains that widespread misuse of these models, either through incorrect modeling or problems with data integrity, can lead to a “systemic asset-quality problem.” Bies also explains that, although the AU models have been touted for greater efficiency during the upswing in the housing markets, their effectiveness has yet to be tested in a slowing economy. In fact, the systems appear to have been stress-tested using only a limited number and breadth of economic scenarios.
6. Investor-Share Speculation
3. See, e.g., Fannie Mae Urges Lenders To Explain Rejection, Realty Times,
available at http://realtytimes.com/rtcpages/20000117_fannie.htm. According to Franklin Raines, former Chairman of Fannie Mae, the AU system “allowed [Fannie Mae] to finance loans with down payments as low as 3 percent, and expand our purchase of these loans by almost 40 times during the 1990s.”
4. See, e.g,. Testimony of Michael D. Calhoun, President, Center for Responsible Lending Before the Senate Committee on Banking, Housing and Urban Affairs Subcommittee on Housing and Transportation and Subcommittee on Economic Policy Hearing on Calculated Risk: Assessing Non-Traditional Mortgage Products, Sept. 20, 2006, available at http://www.responsiblelending.org/pdfs/Testimony-Calhoun092006.pdf.
5. See, e.g., Inman News, Real Estate Fraud: The Housing Industry’s White-Collar Epidemic, June 2003, available at http://www.inman.com/Member/reports/fraud/mort6841n11.pdf (explaining that lenders who rely too heavily on scores produced by AU systems could “pave the way for more loan fraud if they fail to verify the integrity of the data input into the systems”).

February 2007 Collateralized Debt Obligations 11
The massive liquidity injected by the securitization markets and the demand for mortgage-related structured-finance has driven unprecedented investor-share speculation in the U.S. housing market. Lured by the expectations of strong investment returns, buyers have purchased second homes and investment properties in unprecedented numbers.
FIGURE 5A: INVESTMENT HOMES SHARE OF TOTAL HOMES PURCHASED
2005
Vacation Home,
12.20%
Investment Home, 27.70%Primary
Residence, 60.10%
2004
Vacation Home,
13.00%
Investment Home, 23%
Primary Residence,
64%
Source: National Association of Realtors
Figure 5A likely overstates the actual percent of vacation homes and understates the number of investor purchases as it is generally easier to get approved for a second home than an investment property. LoanPerformance data for the prime market only appear to corroborate this finding.

12 Joshua Rosner & Joseph R. Mason
FIGURE 5B: PRIME MARKET INVESTOR SHARES
0
2
4
6
8
10
12
14
16
18
1999 2000 2001 2002 2003 2004 2005
Second-Home ShareInvestor Share
Source: Harvard’s Joint Center for Housing Studies (2006)
Most of these properties are likely to be concentrated in rapidly appreciating markets. As appreciation rates slow, buyers who used non-traditional mortgage products to finance purchases will come under increasing stress due to repricing risk and an inability to access pent-up equity. Although those borrowers may defer listing the property in hopes of a stabilization of prices, there is a real risk that this “phantom inventory” can quickly come to market, creating additional downward pressure on home prices. It is unclear if this phenomenon has, in combination with lenders pulling back from originating activity, caused total housing inventories to rise from 3.7 months of supply in January of 2005 to 6.8 months of supply in December 2006.6
7. Loss Mitigation Foreclosure was historically viewed as a constructive economic event—that
is, it reallocated assets from weak hands to stronger hands. As a result of the enormous losses that lenders sustained in real-estate-owned (REO) portfolios during the late 1980s, the mortgage industry embarked on a program of loss mitigation strategies to keep “owners” in their homes. Because lenders typically lost between 30 and 60 percent of the outstanding mortgage balance on a foreclosed home, they determined that it was good business practice and, they argued, good social policy to keep the owners in their home.
In the mid-1990s, Fannie, Freddie and HUD began directing lenders and servicers to assist borrowers in retaining their homes through the application of
6. Total Existing Home Sales, National Association of Realtors, available at
www.realtor.org.

February 2007 Collateralized Debt Obligations 13
special forbearance, deed-in-lieu, partial claims, loan modifications, or pre-foreclosure sales. By 2004, even though a 2002 HUD Internal Audit Report found significant weaknesses in their Loss Mitigation Program,7 HUD required that FHA servicers apply loss mitigation strategies or suffer significant treble damages. Since the late 1990s, Fannie and Freddie paid servicers fees for working out the loans, and servicers had added incentives to reach accommodations through their annual bonus compensation,8 which was based on default and foreclosure rates. As a result, many properties that would have been foreclosed a decade ago are not currently moved to foreclosure. While little data exists on mitigation rates in the subprime market, the GSEs have, in the past several years, routinely claimed workout ratios that exceed 50 percent. Given that subprime servicers have implemented some of the most aggressive approaches to servicing delinquent loans,9 it would be surprising if their workout ratios have not kept pace with the agencies.
Loan modifications generally involve an agreement between the buyer and lender to add the delinquency back to the principal balance and re-amortize the loan over an extended loan term. Once that agreement is in place, the loan is considered current. Typically, the loan is removed from the pool and replaced with a like asset. If the loan remains current for the next twelve months, then it can generally be re-pooled. It is not clear whether the loan is re-scored after the initial default or retains its original credit score. Previous studies by Ambrose and Capone (2000) and by Metz and Capone (2003) suggest that within the first two years of mitigation, the risk of re-default on modified loans may be as high as 25 percent. While these numbers are based on FHA loan performance, a lack of publicly available data prevents similar analysis of agency or private-label loans.
While the industry and HUD have frequently stated the social benefits and business savings of loss mitigation,10 scant data exists to analyze the ultimate effectiveness of these programs. The application of these programs appears to differ from company to company further obscuring the ability to analyze. As a result of these changes the historical value of traditional delinquency and default data series may significantly understate risks. Moreover, there is little loan level information about mitigation efforts with which investors can gauge their risks. The rolling over of non-performing loans is commonly cited as one of the
7. See HUD Audit Report 2002-DE-0001, available at
http://www.hud.gov/oig/ig280001.pdf (explaining that “servicers are approving borrowers for loss mitigation when, based on the servicer’s expertise and past experience with delinquent borrowers, the workout is unlikely to succeed. These actions are delaying the foreclosure process, increasing the cost of foreclosure, and subsidizing borrowers who don’t pay their mortgages for extended periods of time.”).
8. See Graham Fisher, Home Without Equity is Just a Rental with Debt, available at http://www.areuea.org/conferences/pdf/MidyearAbstracts2002.pdf.
9. See, e.g., Mark Wiranowski, Sustaining Home Ownership Through Education and Counseling, Oct. 2003, available at http://www.jchs.harvard.edu/publications/homeownership/w03-7_wiranowski.pdf.
10. See, e.g., Policy Lab, Analyzing Elements of Leading Default-Intervention Programs, June 2005, available at http://www.policylabconsulting.com/ documents/FMF_2005614%20-%20Collins_Paper3_DefaultModels_5_05.pdf

14 Joshua Rosner & Joseph R. Mason
primary causes of the Savings and Loan crisis and considered to create greater systemic risk.11
8. Subprime Markets The subprime lending industry has grown significantly since the mid 1990s.
The industry has gone from representing less than 5 percent of all originations to 20 percent.12 On a dollar volume basis they have gone from $35 billion in 1994 to $625 billion in 2005.13 The movement to non-traditional mortgages goes well beyond just the subprime market. Interest-only mortgages have seen similarly stellar growth rates. According to LoanPerformance data, almost one third of originations in 2004 and 2005 were interest-only loans.14 A significant share of the increase in homeownership shown in Figure 1 has come from the democratization of mortgage credit that allowed weaker buyers to purchase homes with less financial wherewithal.
The growth of the subprime market has been largely driven by (1) increased investor appetite for mortgage-backed products, which have increased conforming securitization rates from 60 percent in 2000 to 82 percent in 2005 and non-conforming securitization rates from 35 to 60 percent over that same period;15 (2) increased access to securitizations by non-depository lenders; and (3) lenders’ desire to move these loans off of their balance sheets. Given the competitive environment in lending, the increased ease of borrower refinancing and increased use of securitization, the focus of some lenders has shifted from assessing the ability of borrowers to repay both principal and interest during the life of the loan to a greater emphasis on the repayment of interest.16 With an increased focus on reducing prepayments and on repayment of interest, lenders have allowed borrowers to carry significantly higher leverage. For example, 38 percent of all subprime mortgage originations in 2006 were for 100 percent of the value of the home.17 The non-prime market also fostered the massive growth in low documentation and no documentation loans, sometimes referred to as “liar loans.” According to industry data, almost 45 percent of recent subprime loans
11. See, e.g., Margery Waxman, A Legal Framework For Systemic Bank
Restructuring, The World Bank, June 1998, available at http://siteresources.worldbank.org/INTLAWJUSTICE/Resources/BankRestructuring.pdf.
12. See Joint Center for Housing Studies of Harvard University, State of the Nation’s Housing 2006; Robert Avery, Kenneth Brevoort & Glenn Canner, Higher-Priced Home Lending and the 2005 HMDA Data, FEDERAL RESERVE BULLETIN (2006).
13. Joint Center for Housing Studies of Harvard University, State of the Nation’s Housing 2006.
14. Id. at 17. 15. See, e.g., Clayton, Corporate Overview, June 28, available at
http://library.corporate-ir.net/library/19/195/195083/items/205999/WMBlairConference062806.pdf.
16. See, e.g., Federal Reserve Board, Press Release, Federal Financial Regulatory Agencies Propose Guidance on Nontraditional Mortgage Products, Dec. 20, 2005, available at http://www.federalreserve.gov/BoardDocs/Press/bcreg/2005/20051220/ default.htm).
17. See, e.g, Ben Kage, When the U.S. housing bubble bursts, it will not burst gently, NEWSTARGET.COM, Jan. 22, 2007, available at http://www.newstarget.com/z021469.html.

February 2007 Collateralized Debt Obligations 15
are no or low documentation loans. Even in the relatively healthy housing environment of 2002, subprime loans
were delinquent more than five times the rate of conventional loans and were ten times more likely to enter the foreclosure process.18 While lenders typically charge significantly higher interest rates to subprime borrowers, these rates are still based on models that have not been tested in a full real-estate cycle. Even as strong home price appreciation eased the economic strains on the weakest buyers over the past several years, and as declining interest rates allowed homeowners to extract that appreciation through cash out refinancing, this cycle appears to have come to an end. On a going-forward basis, subprime borrowers will be less able (relative to their peers) to take advantage of refinancing opportunities in the absence of strong appreciation rates.
During 2005 and 2006, there were massive deteriorations in subprime mortgage performance, especially in the latest vintages of these loans. The later vintages contained a significantly higher proportion of “non-traditional” hybrid, interest-only, and negative-amortization loans than their earlier counterparts. The percentage of subprime mortgages packaged into bonds and delinquent by 90 days or more, in foreclosure, or already turned into seized properties increased to 10 percent by 2006, the worst levels in nearly a decade.19
This poor performance in the subprime market calls into question the capabilities of lenders, securitizers, and investors to reliably estimate peak charge-off rates. An analysis of subprime spreads suggests that investors may not fully appreciate these risks. Despite the recent performance of subprime loans, investors do not appear to demand higher returns for investing in riskier assets tied to the US mortgage market, as reflected by the spreads in Figure 6.
18. See, e.g., Michelle A. Danis & Anthony Pennington-Cross, The Delinquency of
Subprime Mortgages, Working Paper 2005-022A, Mar. 2005, available at http://research.stlouisfed.org/wp/2005/2005-022.pdf.
19. See, e.g., Jody Shenn, Subprime Loan Defaults Pass 2001 Peak, Friedman Says, BLOOMBERG.COM, Feb. 2, 2007, available at http://www.bloomberg.com/apps/news?pid=20601087&sid=awXBoS.M0ZRE&refer=home.

16 Joshua Rosner & Joseph R. Mason FIGURE 6: FIVE YEAR BBB- FLOATING HOME EQUITY SPREAD TO ONE-MONTH
0
100
200
300
400
500
600
700
800
900
1/7/
2003
3/7/
2003
5/7/
2003
7/7/
2003
9/7/
2003
11/7
/200
3
1/7/
2004
3/7/
2004
5/7/
2004
7/7/
2004
9/7/
2004
11/7
/200
4
1/7/
2005
3/7/
2005
5/7/
2005
7/7/
2005
9/7/
2005
11/7
/200
5
1/7/
2006
3/7/
2006
5/7/
2006
7/7/
2006
9/7/
2006
11/7
/200
6
1/7/
2007
As Figure 6 shows, the five-year spread to one-month LIBOR has remained stubbornly constant (between 200 and 300 basis points) during the deterioration of the subprime market. B. The Complexity of Securitization
The fundamental changes to origination and servicing described in the
previous section create difficulty in secondary mortgage markets. Mortgage markets are markets in which mortgage-backed securities (MBS) are created and sold to fund new mortgage originations. The MBS created in mortgage markets already pose a variety of challenges to valuation over other financial instruments. Fundamental changes in origination and servicing practices change the timing and predictability of the cash flows that make mortgages valuable. When those changes occur unpredictably over time or across issuers, thereby affecting the cash flows of some unknown number of mortgages, MBS become even more difficult to value. Hence, changes in origination and servicing practices, along with the existing complexity of MBS, results in greater opacity in the MBS market. Next, we demonstrate that the increased risk in MBS valuation is magnified by increasing concentration of CDO investments in lower-tranche MBS investments. The additional complexity of CDOs, along with the CDO market’s willingness to move out of collateral types at a moment’s notice, poses additional risks to socially and economically important consumer mortgage lending.
1. Mortgages and Mortgage-backed Securities Are Complex and Difficult
to Value
a. Mortgage Pools Are Difficult to Value MBS, like other fixed-income financial instruments, are valued as the present
discounted value of expected cash flows. Like most fixed-income investments,

February 2007 Collateralized Debt Obligations 17
MBS are affected by default risk.20 MBS, however, are substantially affected by prepayment risk—that is, the risk that the borrower will unexpectedly pay off the loan early. While a great deal is known about measuring borrower default risk, relatively little is known about measuring borrower prepayment risk. Where default risk is more a function of credit risk, prepayment risk is more a function of market risk; the levels of interest rates, the shape of the yield curve, volatility, seasonality and market competition to name a few. Hence, prepayment risk creates substantial difficulty in estimating the value of an MBS as a function of expected cash flows relative to other financial instruments.
Default risk measurement, using consumer credit scoring models like the FICO scores estimated by FairIsaac, is a relatively well-developed and mature industry (though its application to those mortgage originations of recent borrowers with limited credit history is cyclically untested and there is little empirical information with which to assess its performance in a stressed environment). Consumer loans and mortgages assess default risk by examining borrower FICO scores of individual customers prior to approving a loan. FICO scores are accepted by financial firms and their regulators as valid and meaningful indicators or default risk. MBS prospectuses routinely report the FICO score distribution of the loans backing the proposed MBS to show expected loss levels within the pool of loans.
While default risk is important, the realization of prepayment risk is far more prevalent. Calomiris and Mason (2007) demonstrate a default rate of just under 4.3 percent in the 4.2 million FHA loans underwritten from 1996 to 2002. By contrast, the prepayment rate in that period was 67 percent. Figure 7 shows prepayment and default rates for the Calomiris and Mason sample. It is immediately apparent that prepayment risk is an entirely different order of magnitude than default risk.
20. Default risk is the risk that a borrower will not repay, on time and in full, all
principal and interest as promised in the financial instrument.

18 Joshua Rosner & Joseph R. Mason
FIGURE 7: PREPAYMENT AND DEFAULT RATES AS A FUNCTION OF MORTGAGE DURATION
0
1
2
3
4
5
6
0 21 42 63 84 105
126
147
168
189
210
231
252
273
294
315
336
357
Months
Perc
ent o
f Loa
ns
PrepayDefault
Source: Calomiris and Mason (2007).
One can be tempted to dismiss prepayment risk by rationalizing that defaults
can saddle investors with real losses, whereas investors receive full principal and interest payments in prepayment. The real problem, however, is that while investors receive interest payments in prepayment, those interest payments end when they are most valuable—that is, when interest rates on competing investments are low, a classic manifestation of re-investment risk. Thus, prepayment risk, in tandem with textbook interest rate risk, creates a double-edged sword. If interest rates in the economy rise, then the value of the mortgage pool declines (standard interest rate risk). But if interest rates in the economy fall, then mortgage borrowers prepay as they refinance (prepayment risk). Hence, if interest rates move either way the mortgage investor loses. Calomiris and Mason (2007) estimate that prepayment losses in their sample of 4.2 million FHA loans (equal to interest for the remaining expected life of the mortgage accrued at the difference between the rate on the prepaid mortgage and rates available at prepayment) amount to just over $576 million while interest losses due to defaults amount to only about $12 million.21
The problem with prepayment risk is that, unlike default risk, there is no industry standard to measuring prepayment risk. Public Security Association (PSA) models attempt to correct for prepayment risk but do not estimate it directly. Prepayment risk corrections affect the probable maturity of the bonds
21. None of this is meant to suggest that default risk is not as important as
prepayment risk. Total default losses (including losses on selling the home as collateral) in the Calomiris and Mason sample amount to $ 4 billion. Prepayment risk, however, is costly and prevalent.

February 2007 Collateralized Debt Obligations 19 that MBS investors buy. When MBS investors purchase MBS securities, they are not only inferring default risk of mortgages in the pool, but also inferring some probable maturity of their investments as well.
Those inferences about MBS maturity are based on ad hoc corrections, not predictive prepayment models. The problem with formal modeling is that unlike default risk, which is inversely related to economic performance in a straightforward fashion, the double-edged sword relationship of interest rate risk and prepayment risk creates a non-linear estimation environment. Calomiris and Mason (2007) address the problem by estimating two separate components of prepayment risk: one associated with prepayments related to falling interest rates, and another associated with prepayments related to other outside circumstances (like job transfers).
Calomiris and Mason (2007) call these two separate components of prepayment risk “endogenous” and “exogenous” prepayments. Exogenous prepayments are predicted as a function of attributes of the borrower and his or her local community. Importantly, exogenous prepayments are initially estimated on prepayments that occur in rising interest rate scenarios, in which we propose that borrowers are not merely responding to refinancing their existing mortgage in an advantageous interest rate environment. Coefficients from the exogenous prepayments model are used to compute an exogenous prepayment “score” (EPS). The EPS is then included in a second-stage model of endogenous prepayments, which uses interest rate movement direction and volatility to estimate endogenous prepayments as a function of borrowers’ option to prepay. While Calomiris and Mason compute a number of variants on the model, the results of the basic second-stage model are included in Table 1. No matter which variant is estimated, EPS is always positive and statistically significant in the second-stage models, indicating the difference in the exogenous and endogenous prepayment decisions.
TABLE 1: REGRESSION RESULTS (DEPENDENT VARIABLE IS PREPAYMENTS)
Parameter DF Estimate Std. Error
Pr > ChiSq
Intercept 1 -51.0834 0.1388 < .0001 EPS Score 1 0.5294 0.0010 < .0001 % Change in Mtg. Rates 1 -3.1048 0.0225 < .0001 Standard Deviation of % Change in Mtg. Rates 1 2236.297 5.5339 < .0001 Source: Calomiris and Mason (2007)
The main point of this section is to show that the most basic steps in valuing MBS are inherently difficult. Some elements of valuation, like measuring default risk, are clear-cut and utilize well-developed industry-standard modeling procedures. Other elements of valuation, like measuring prepayment risk, are not well-understood. While there are existing industry standards for correcting for prepayment risk, there are not the types of well-developed models for prepayment risk such as there are for default risk. Hence, even the most basic mortgage is difficult to value.
b. Additional Complexity Makes MBS Even More Difficult to Value

20 Joshua Rosner & Joseph R. Mason
MBS are complex structured finance securities built upon difficult-to-value collateral. The complexity of structured finance products is meant to smooth out some of the difficulties inherent in mortgage pool valuation to sell a range of securities with different risk-return qualities to investors who value those specific qualities (and tend to care less about other attendant valuation difficulties). The inherent complexity of MBS, coupled with fundamental changes to underwriting and servicing standards, can mask adverse changes to mortgage pool performance and pose risk to MBS investors and therefore risk to funding for socially and economically important consumer mortgage originations.
Structured finance products increase in complexity as the statistical predictability of collateral performance becomes more established. As investors become familiar with underlying collateral performance, asset-backed securities (ABS) can incorporate a variety of complex tranches and other features.
FIGURE 8: TRANCHES ISSUED IN EUROPEAN SECURITIZATIONS 1987-2003
Source: Firla-Cuchra and Jenkinson (2005)
Figure 8, which is reproduced from Firla-Cuchra and Jenkinson (2005), shows how structured finance products have increased in complexity over time. The first private asset-backed security was an MBS issued by Bank of America in 1977, consisting of a simple pass-through structure—that is, one tranche. As the industry matured and investors became more comfortable predicting mortgage performance, MBS became substantially more complex.

February 2007 Collateralized Debt Obligations 21 TABLE 2: ISSUES WITH THE GIVEN NUMBER OF TRANCHES AS A PERCENTAGE OF
ALL ISSUES PER TYPE (MEAN NUMBER OF TRANCHES PER ISSUE) Tranches per
issue RMBS EQUIP CARDS AUTO OTHER
1 20.5% 24.4% 58.1% 27.8% 53.8% 2 26.5% 41.5% 17.6% 55.7% 25.5% 3 19.6% 14.6% 20.3% 13.9% 9.0% 4 13.4% 12.2% 2.7% 1.3% 6.9% 5 10.2% 7.3% 1.4% 1.3% 2.1% 6 3.9% 1.4% 7 2.0% 1.4% 8 0.8% 9 0.2%
10+ 2.9% Total issues 596 41 74 79 145
Note: Classification by type is according to the European classification of securitizations: ‘RMBS’ are residential mortgage-backed securities; ‘Equip’ are securitizations of equipment assets; ‘Cards’ are credit-card securitizations; ‘Auto’ are securitizations of auto-loans. Source: Firla-Cuchra and Jenkinson (2005)
Table 2, also from Firla-Cuchra and Jenkinson (2005), shows that the other collateral types that began to be securitized well after mortgages are far less complex. The first non-mortgage securitization was equipment leases, followed by credit cards and auto loans, and more recently, home equity, lease finance, manufactured housing, student loans, and synthetic structures. All of those types of collateral illustrate tranching structures that are measurably simpler than those for MBS.
Structured finance became more complex as underwriting technology became more efficient. Two examples of this are the movement from standalone trusts to master trusts and the de-linking of tranches through issuance trusts. Standalone trusts are simple and efficient for individual securitizations, but woefully inefficient for repeated securitizations. The reason that standalone trusts are inefficient for repeated securitizations is that each time an issuer wants to sell more loans, it must create a new legal trust structure to house the loan pool and issue the notes backed by that pool. Establishing an identical new trust structure each time a new pool of loans is sold (roughly four times a year) repeatedly incurs substantial fixed legal and administrative costs. Hence, a means by which a firm could establish a “shelf registration” system for securitized assets contributed a great deal of efficiency to the practice of securitization. By the late 1990s, therefore, most assets were being securitized in master trust structures.
Issuance trusts relieved the need to sell the entire structure of tranches at the same time. In the past, the entire series of tranches had to be sold at once to ensure that the lower-tier (junior) tranches provided the desired credit support for the higher-tier (more senior) tranches. The problem is that widened credit spreads resulting from adverse market shocks could (and did, during the 1998 Russian bond default), occasionally shut down issuers’ ability to securitize assets at their regular funding cycle. Those events led to legal developments that allowed lower-tier tranches to be sold any time prior to higher-tier tranches as long as higher-tier tranche maturities remained within those of the lower-tier securities. Relieved of the constraint to sell all tranches of securities in the same market

22 Joshua Rosner & Joseph R. Mason environment, issuers could take advantage of favorable market conditions to provide certainty to their regular funding cycle.
FIGURE 9: EXAMPLES OF ACTUAL MBS FUNDING STRUCTURES
Source: ABSnet
MBS are currently the most mature and complex of consumer structured
finance products. Figure 9 shows some representative MBS structures. The examples show that MBS routinely contain many tranches of securities. Furthermore, those tranches include even more sophisticated features to deal with prepayment and other inherent risks, including complex and difficult-to-value securities like interest-only and principal-only strips, sequential pay securities, and planned amortization class bonds.
In summary, MBS are complex securities that are difficult to value. Furthermore, MBS are built on the backs of pools of mortgages, which themselves are complex and difficult to value. Fundamental changes to underwriting and servicing standards are not easily identifiable in the inherent complexity of mortgages and MBS, posing risk to funding for socially and economically important consumer mortgage originations. Below we demonstrate that the increased risk is magnified by increasing concentration of CDO investments in lower-tranche MBS investments.

February 2007 Collateralized Debt Obligations 23
2. CDOs Add Complexity to MBS and Other Constituent Credit Instruments CDOs aggregate existing securities, which themselves are difficult to value.
Furthermore, the term CDO comprises a set of very different types of structured finance arrangements, from cash flow CDOs to synthetics. Favored collateral types for all those arrangements can and sometimes do change rapidly over time. Those features create the potential for high volatility in sectors that rely principally upon CDOs for funding.
FIGURE 10: BASIC CDO SECURITY STRUCTURE
Source: JP MORGAN, CDO HANDBOOK 5 (2001). While CDOs differ in construction by type of collateral and purpose, most
begin with structures similar to MBS and ABS. JP Morgan’s CDO Handbook (2001) illustrates typical CDO tranche structure composed of some fixed and floating A and B tranches supported by underlying C, D, and equity tranches. The top (A) tranches are typically rated triple- or double-A, the next tier tranches (B) are rated single-A, the next (C) triple-B, then double-B, with the equity typically not rated.

24 Joshua Rosner & Joseph R. Mason
FIGURE 11: TYPICAL TRANCHE SIZES AND COUPON RATES
Tranche Percent of Capital
Structure Rating Coupon Class A 77.5 AAA LIBOR + 26 Class B 9 A LIBOR + 75 Class C 2.75 BBB LIBOR + 180 Class D 2.75 BB LIBOR + 475 Preferred Shares 8 NR Residual Cash Flow Source: Lucas, Goodman and Fabozzi (2005)
CDO funding structures, like MBS and ABS, attempt to issue fund
themselves with as many AAA-rated securities as they can sell given the inherent risk in the underlying collateral. CDOs attempt to issue as much class A securities as possible because those provide the deal with the cheapest funding. Figure 11 illustrates that typically about 77 percent of the securities in the structure are class A securities and rated AAA, typically paying coupons about LIBOR plus 26 bps. About 9 percent of the structure is class B securities, rated A and paying about LIBOR plus 75 bps. The typical 2.75 percent of class C securities are rated BBB and pay about LIBOR plus 180 bps. The riskiest rated bonds, the class D securities, typically comprise about 2.75 percent of the structure, are rated BB, and pay coupons of about LIBOR plus 475 bps. Equity, typically about 8 percent of the structure, is unrated and receives the residual cash flow from the deal.
FIGURE 12: EXAMPLES OF ACTUAL CDO FUNDING STRUCTURES
Source: Bennett and Mason (forthcoming 2007)
Figure 12 shows that actual CDO tranche structures, however, can radically
differ from those norms. All the CDOs included are re-securitizations (also called structured finance CDOs). While most structures look similar to that illustrated in

February 2007 Collateralized Debt Obligations 25
JP Morgan’s CDO Handbook, some, including those illustrated in columns 3 and 8 are radically different.
The different funding structures reflect how CDOs fundamentally differ from MBS and ABS. In particular, CDOs are different from MBS in at least six different ways. First, whereas MBS and ABS are supported by static or brain-dead pools of underlying assets, CDO pools are managed. Hence, the composition of the asset portfolio can change dramatically through the duration of the CDO transaction. Second, CDO transactions close before the pool of underlying assets is fully formed. This aspect may be a benefit or a drawback. Beneficially, the manager may be able to include in the pool greater diversity of collateral across industry, credit, and vintage. As a drawback, however, investors cannot be sure the manager will act as intended upon investment. Third, CDOs are quite heterogeneous with respect to granularity. Some CDOs may contain as little as twenty underlying assets, while others may contain several hundred. Note, however, that even several hundred underlying assets is still a relatively small number compared to the hundreds of thousands of accounts underlying MBS and ABS pools. Furthermore, several hundred underlying assets from the same sector, i.e., RMBS, does not add true diversification to the pool, leading many in the industry to question the relevance of the traditionally calculations of “diversity scores” in contemporary CDOs.22 Because of the lack of diversification, traditional actuarial loss methods applied to ABS and MBS pools are not properly applicable to CDO pools. Fourth, CDOs may illustrate more ratings volatility than ABS or MBS due to ratings migration on the underlying collateral or manager trading. Fifth, while the heterogeneity of CDO asset pools adds some degree of diversification to pool performance that is not possible in ABS or MBS, it may also increase opacity to investors. Last, since the CDO market is still growing, secondary market trading is still limited. The development of secondary market trading has been further hampered by the immense heterogeneity across CDO underwriters, collateral managers, and asset types.23
As a result of those differences, CDOs fund portfolios of collateral using a set of tranched securities, like ABS and MBS, but using even more complex and esoteric securities than ABS and MBS. The previous section pointed out that our current understanding of market development is that securities and structures underlying different collateral types evolve as investors become more familiar with underlying collateral performance, particularly the predictability of that performance. Hence, the increased complexity of CDO structures and securities is not obviously rational in light of the opacity and heterogeneity of collateral in CDO pools.
CDOs, like MBS, use securities like interest-only and principal-only strips to address the different risks that those two sets of cash flows pose to investors. Interest-only securities promise payment only while the loans are outstanding. Once the loan exits the pool, whether through prepayment or default, interest
22. See, e.g., Frank Partnoy, How and Why Credit Rating Agencies Are Not Like
Other Gatekeepers, in FINANCIAL GATEKEEPERS: CAN THEY PROTECT INVESTORS?, (Yasuyuki Fuchita & Robert E. Litan, eds. Brookings 2006).
23. See, e.g., S&P Global Cash Flow and Synthetic CDO Criteria, Mar. 21, 2002, at 13-14.

26 Joshua Rosner & Joseph R. Mason
payment ends. Hence, there is great risk of non-payment in interest-only strips. Principal-only strips return investors’ funds, but timing is the issue. Whether the loan prepays or defaults (after which the collateral is sold), the investor usually eventually recovers principal in full. Hence there is little risk of non-payment in principal-only securities (although timing is still an issue).
CDOs also, however, routinely issue controversial features like Payment in Kind (PIK) terms, in order to back up promised cash flows. A PIK term stipulates that, in the event that investors cannot be paid current month interest they are promised an increase in the par value of the bond to be repaid at maturity, i.e., an IOU in payment for an IOU. Recent deals have not offered interest on the PIK feature, but sometimes offer greater PIK than the coupon foregone. Nonetheless, PIK-able securities are inherently difficult to value, and attempting to adjust for the lack of interest on the PIK component by making the PIK greater than the foregone coupon just makes cash flow modeling of downstream tranches even more difficult to ascertain with any degree of accuracy.24
The growing investor acceptance of CDO structures has been supported by rating agencies willingness to rate these assets. Unlike other assets that rating agencies rate, these assets are subject to considerable market risk, a risk which rating agencies do not claim to be able to effectively rate. Recognizing these issues, in May of 2005 former Fed Chairman Greenspan warned that “the credit risk profile of CDO tranches poses challenges to even the most sophisticated market participants” and warned investors “not to rely solely on rating-agency assessments of credit risk.”
Because many buyers of senior CDOs can only hold investment grade assets they may continue to hold deteriorating and increasingly illiquid assets as long as their ratings have not been downgraded. Because the market is OTC, investors may incorrectly value these assets in their portfolio and be forced to recognize large mark to market losses in a fast moving, liquidating market. As a case in point, Janet Tavakoli points out that the blindness of rating agencies to super-senior tranches can result in 2 different AAA tranches with different attributes.25
24. See, e.g., S&P CDO Spotlight: Update to General Cash Flow Analytics Criteria
for CDO Securitizations, Oct. 16, 2006. 25. Janet Tavakoli, GARP Risk Review Issue 22, January/February 2005 (“If
everything else remained the same, but 2% of the portfolio defaulted, slightly more than two percent of the first AAA tranche would not be deemed AAA. The AAA of the second CDO presents a different picture, because 40% of the formerly AAA tranche would no longer be deemed AAA.”).

February 2007 Collateralized Debt Obligations 27
FIGURE 13: ANNUAL CASH CDO ISSUANCE
0
50
100
150
200
250
300
350
400
450
500
1987 1989 1991 1993 1995 1997 1999 2001 2003 2005
Source: Lucas, Goodman, and Fabozzi (2006)
The problem with all those controversial and esoteric securities used to fund
CDOs is that the CDO sector has grown immensely in a short period of time. Figure 13 illustrates that annual issuance of CDOs has grown from nearly zero in 1995 to over $500 billion in 2006. In fact, CDO issuance is growing so fast that new issuance in 2006 amounted to approximately the total of the three preceding years summed together.
Figure 13 also shows the risk of relying on CDO markets for funding growth of underlying collateral underwriting. Figure 13 shows that CDO issuance dropped off dramatically from 1998 to 2002, exceeding 1997 levels again only in 2003. That drop-off arose from a combination of economic conditions along with unforeseen difficulties in the corporate loan an bond markets and manufactured housing, aircraft lease, franchise business loan, and 12-b1 mutual fund fee structured finance sectors that accounted for a significant component of CDO investments at the time. CDOs have since moved out of those sectors, and into RMBS and commercial mortgage-backed securities (CMBS).
Recent analysis estimates that nearly 40 percent of total CDO collateral is RMBS. Moody’s CDO Asset Exposure Report for October 2006 revealed that 39.52 percent of the collateral within the 678 deals covered by Moody’s consists of RMBS, just over 70 percent of that in subprime and home equity loans and the other 30 percent in prime first-lien loans.
The next section illustrates how elements of mortgage, MBS, and CDO complexity together pose social and economic risks to consumer credit availability and funding.

28 Joshua Rosner & Joseph R. Mason
II. THE LINK FROM MORTGAGES TO MORTGAGE-BACKED SECURITIES TO COLLATERALIZED DEBT OBLIGATIONS
A. By Investing Heavily in Junior MBS and ABS Tranches, CDOs Provide a Substantial Base for the Leverage in Today’s Securitization Market The FDIC reports that 81 percent of the $249 billion of CDO collateral pools
issued in 2005, or $200 billion, was made up of residential mortgage products. (FDIC Outlook, Fall 2006) Moody’s CDO Asset Exposure Report for October 2006 reveals that 39.5 percent of the collateral within the 678 deals covered by Moody’s consists of RMBS, just over 70 percent of that in subprime and home equity loans and the other 30 percent in prime first-lien loans. Hence, CDOs hold a lot of RMBS.
Moody’s CDO Asset Exposure Report for October 2006 reveals that 70 percent of collateral in the pools underlying the 2005 resecuritization CDO vintage was below AAA-rated, and the largest ratings cohort, at 40 percent, was Baa. About 10 percent of the 2005 vintage collateral pool was rated below Baa. Overall, about 75 percent of collateral in the pools underlying resecuritization CDOs was below AAA-rated, the largest cohort being, again, Baa at 42 percent. About 16 percent of collateral was rated below Baa. Table 3, from Moody’s, shows that overall weighted average rating factor (WARF) for the top collateral types for the resecuritizations is 225, which equates to about a Moody’s Baa1 rating.
TABLE 3: TOP COLLATERAL TYPES IN RESECURITIZATION CDOS, 2005
(ALL VINTAGES)
Source: Moody’s CDO Asset Exposure Report, October 2006
Given the above observations, it is reasonable to infer that about 70 percent
of the $200 billion, or about $140 billion, in MBS purchased by CDOs issued in 2005 is below AAA. As we demonstrated earlier, only some 10 percent or so of a typical MBS financing structure is made up of lower-tier (junior) securities. Those lower-tier (junior) tranches to provide the desired credit support for the higher-tier (more senior) tranches. In other words, the entire MBS structure above the lower-tier (junior) tranche cannot be sold until those lower-tier (junior) tranches are sold.
Because the 90 percent of higher-tier (senior) securities in an MBS cannot be sold without selling the 10 percent or so of lower-tier (junior) securities first, even a small decline in CDO funding of mezzanine MBS investments relative to the total MBS market can have a large effect on MBS funding, and therefore consumer mortgage funding.

February 2007 Collateralized Debt Obligations 29
SIFMA estimates that about $1,326 billion was issued in private RMBS in 2005. If 10 percent of that is lower-tier (junior) securities, then about $133 billion in lower-tier securities supported the rest of the $1,193 billion.
Hence, the CDO market purchased more mezzanine MBS in 2005 as was actually issued that year. Furthermore, and crucially, the relatively small amount of MBS purchased by the CDO market provided support for the rest of the $1,193 billion issued in private RMBS during the entire year of 2005. The point, therefore, is that the CDO market adds liquidity to MBS and ABS markets in a highly leveraged fashion by funding lower-tranche MBS securities. According to Lucas, Goodman, and Fabozzi, however, that liquidity is very fragile:
The CDO market is opportunistic in the way it drops collateral types that are out of favor with investors and picks up collateral types that are in favor with investors. The best example of this is the switch out of poor-performing high-yield bonds and into well-performing highyield loans between 2001 and 2003. Also, certain types of ABS present in SF CDOs from 1999 through 2001 disappeared from later vintages: manufactured housing loans, aircraft leases, franchise business loans, and 12b-1 mutual fund fees. All of these assets had horrible performance in older SF CDOs. In their place, SF CDOs have recently focused more on RMBS and CMBS.26
Hence the degree of leverage inherent in CDO funding, along with the potential for high volatility in that funding, introduces the potential for public policy issues.
B. Evidence for Hidden Risks: CDO Ratings Changes Follow Changes for
Constituent CDO Collateral The main problem we have described is that the MBS market is built upon
the statistical predictability of mortgage performance. The CDO market then builds upon that foundation to provide additional liquidity. As the performance of mortgages shifts due to fundamental changes in origination and servicing practices, investors may be surprised to find the mortgage claim they purchased is based on a pool of loans with very different statistical performance properties than previously experienced or expected. Preliminary evidence for this view lies in the relationship between ratings changes in CDO markets and underlying ABS and MBS markets.
Previous work on the relationship between RMBS and CDO has focused on the effects of subprime RMBS concentrations on the CDOs. In August 2006, Fitch Structured Finance published a special report on “U.S. Subprime RMBS in Structured Finance CDOs.” That report pointed out a number of the structural issues covered in Section A of the present report and gave some thought to possible implications for CDOs.
In the period of time that has followed the Fitch report the structural changes described in Section A have become manifest. In November 2006, the Markit Group reported that there was an interest shortfall on two bonds underlying Markit’s ABX-HE 06-1 BBB and BBB- indices of RMBS performance. More
26. Lucas, Goodman and Fabozzi (2006) at 5.

30 Joshua Rosner & Joseph R. Mason
recently, the Wall Street Journal reported on January 27 that the ABX-HE 06-2 index had dropped 10% over the last six months, reflecting heightened default risk in the sector. Hence, the mortgage defaults that began occurring six or more months ago have become evident in investor pricing of MBS instruments.
The consensus view seems to be that faced with slowing demand and shrinking profit margins, subprime lenders tried to maintain volume as the housing market was faltering in late 2005 and 2006 by making riskier loans. Those risks are manifesting themselves in even lower profits, demonstrated by a number of exits from the industry and significantly higher loan loss provisioning for those that remain.27
Given recent events, we now know the defaults are in the mortgage pools and it is only a matter of time before they accumulate to levels that will threaten rated mezzanine RMBS. Given the high proportion of CDO investments in mezzanine RMBS, the questions therefore become: (1) when will the defaults hit CDO returns and (2) what will be the effect when CDO investors react, as they did with previous sectoral difficulties, by divesting the sector and moving on to new forms of collateral?
We can infer when the defaults will hit CDO performance by reviewing the lessons already learned from the NERA report in 2003. The NERA report analyzed the effects of “notching” in the ratings industry. “Notching refers to the industry practice whereby one agency adjusts ratings of structured finance collateral from other agencies for the stated reasons of (1) bringing them in line with ratings it believes it would have assigned to the collateral and (2) adjusting for uncertainty and perceived differences in monitoring practices,” (Carron, et al, p. 1). The study came about at a time when ratings agencies were increasingly asked to rate collateralized debt obligations with underlying collateral pools that include structured finance securities rated only by other rating agencies.
The NERA report is important for understanding present conditions in CDO markets because it points out the need for one ratings agency to do substantial additional research before integrating ratings of another agency that relate, say, to underlying collateral in a CDO. First, the outside rating change must be adjusted to be comparable with the CDO’s ratings agency. Then, the CDO’s ratings agency needs to analyze the CDO’s cash flow implications of the change in the single underlying collateral instrument. Last, the CDO’s ratings agency needs to decide whether to take action on the CDO itself. All those steps take additional time when the structures of the securities of concern are more complex.
In footnotes to their Collateralized Debt Obligations Indices and CDO Asset Exposure Report, Moody’s notes that it can take anywhere from three to seven weeks to normally incorporate another ratings agency’s change into their own CDO ratings. Hence, it would be expected that CDO ratings changes considerably lag RMBS and ABS ratings changes due to opacity between markets.
27. See, e.g., Carrick Mollenkamp, In Home-Lending Push, Banks Misjudged Risk:
HSBC Borrowers Fall Behind on Payments; Hiring More Collectors, WALL STREET JOURNAL, Feb. 8, 2007, at A1.

February 2007 Collateralized Debt Obligations 31
FIGURE 14: THREE-MONTH MOVING AVERAGE NUMBER OF CDO, RMBS, AND ABS RATINGS CHANGES
0
50
100
150
200
250
Jan-
00
Apr
-00
Jul-0
0
Oct
-00
Jan-
01
Apr
-01
Jul-0
1
Oct
-01
Jan-
02
Apr
-02
Jul-0
2
Oct
-02
Jan-
03
Apr
-03
Jul-0
3
Oct
-03
Jan-
04
Apr
-04
Jul-0
4
Oct
-04
Jan-
05
Apr
-05
Jul-0
5
Oct
-05
Jan-
06
Apr
-06
Jul-0
6
Oct
-06
Month
Num
ber
of R
atin
gs C
hang
esCDO ChangesRMBS DOWNGRADESABS DOWNGRADES
Figure 14 graphically illustrates that CDO downgrades follow ABS
downgrades after the fallout in ABS in 2001-2003. Before 2003, CDOs experienced significant difficulties with ABS and lagged ratings changes. Those difficulties led to the NERA study discussed above. Figure 14 shows that in the periods that followed, the lagged relationships became much more systematic. Those results can also be shown through statistical VAR analysis of the relationship between ABS and CDO downgrades

32 Joshua Rosner & Joseph R. Mason
TABLE 4: RESULTS OF VAR ANALYSIS OF THE RELATIONSHIP BETWEEN ABS AND CDO DOWNGRADES FROM JANUARY 2005 TO DECEMBER 2006
Dependant Variable: CDO CDO(-1) 0.024350
[ 0.23856] CDO(-2) -0.047252
[-0.45778] CDO(-3) -0.024940
[-0.19261] CDO(-4) -0.027687
[-0.20357] CDO(-5) -0.051774
[-0.39481] ABS(-1) 0.100261
[ 1.35114] ABS(2) 0.109789
[ 1.47095] ABS(-3) 0.179819
[ 2.47077] ABS(-4) 0.116152
[ 1.57518] ABS(-5) 0.234360
[ 3.25081] C 1.391791 [ 1.31038]
Note: ( ) represents lag length; [ ] provides the t-statistics; CDO is the depended variable; C is constant.
Table 4 shows the coefficients of the statistical VAR analysis of the
relationship between ABS and CDO downgrades, weekly, from January 2005 to December 2006. The coefficient results in Table 4 clearly indicate that CDO downgrades follow ABS downgrades in the aggregate.
FIGURE 15: IMPULSE RESPONSE FUNCTION OF THE RESPONSE OF CDO TO
SHOCKS IN ABS WITH (+) OR (–) 2 STANDARD DEVIATIONS
Figure 15 shows the impulse-response function generated by the VAR, which demonstrates a long-lasting and significant positive correlation between ABS and CDO downgrades. At 12 weeks, ABS downgrades explain about 23% of CDO downgrades in the aggregate.

February 2007 Collateralized Debt Obligations 33
As yet, there are not enough RMBS downgrades to manifest a similar effect, but the lags between ABS and CDO downgrades suggest a similar lag in defaults will result with respect to current RMBS pool difficulties. CDOs invested heavily in manufactured housing, aircraft lease, franchise business loan, and 12-b1 mutual fund fee ABS prior to 2003. CDOs with heavy exposure to those collateral classes took a beating when collateral underperformance and fraud revealed heavy losses in the pools and, subsequently, a great many defaults on ABS in those sectors. As Lucas, Goodman and Fabozzi (2006) note, CDOs moved out of those sectors following the defaults.
More importantly for our purposes, however, is the fact that the collateral sectors that caused difficulties for CDOs in 2003 shrunk considerably afterward. The manufactured housing, aircraft lease, franchise business loan, and 12-b1 mutual fund fee ABS sectors are significantly smaller than they were when CDOs were pouring in during 1999-2001. We argue that the shrinkage in those sectors arose from decreased funding by the CDO markets.
We therefore maintain that the shrinkage in RMBS sector is likely to arise from decreased funding by the CDO markets as defaults accumulate. Of course, mortgage markets are socially and economically more important than manufactured housing, aircraft leases, franchise business loans, and 12-b1 mutual fund fees. Decreased funding for RMBS could set off a downward spiral in credit availability that can deprive individuals of home ownership and substantially hurt the U.S. economy.
As described in detail in section II.A, the CDO market adds liquidity to the RMBS market in a highly leveraged fashion by funding lower-tranche MBS securities, and the experience of the ABS markets in the early 2000s illustrates that the liquidity provided by CDOs is very fragile. Hence, we turn to analyzing just how sensitive mortgage markets are to CDO funding.
C. Links Between Mortgage Markets, MBS, and CDO Funding and the Housing
Sector and Economic Growth The sections above established that MBS defaults can be expected to result in
a significant decline in CDO funding for mezzanine MBS tranches and, ultimately, a significant decline in funding for residential mortgages. Decreased funding for residential mortgages can be expected to affect housing starts an home purchases, which affect the construction and building and home products industries, which are key to economic performance. Reduced economic performance further exacerbates defaults, leading to a feedback mechanism that can produce a prolonged slump in US economic performance. Horndahl and Upper (2006) reported that:
The rapid cooldown of the US housing market seemed to have little impact on most US mortgage-backed security (MBS) spreads. This was so despite a steady increase in the proportion of mortgage loans to non-prime borrowers in the underlying collateral of such securities. However, a somewhat different picture emerged from the pricing of ABX.HE, a recently introduced group of synthetic indices of US home equity asset-backed securities (ABSs). The ABX.HE indices replicate cash flows of tranches of US subprime home equity securitisations. In the past three months, the prices of the lowest-rated ABX indices fell considerably,

34 Joshua Rosner & Joseph R. Mason
suggesting a heightened perception of risk associated with home loans to borrowers with blemished credit histories.28
Figure 16 shows that MBS markets are beginning to illustrate the effects of high defaults in the mortgage pools that have made recent headlines.
FIGURE 16: CDO ISSUANCE AND U.S. HOME EQUITY ABS INDICES
Source: BIS Quarterly Review, Dec. 2006
MBS issuance becomes more expensive, perhaps prohibitively so, as spreads
continue to widen as illustrated at the end of 2006. As prices on the ABX.HE index trend down, bond yields trend higher as investors demand more return as they realize the increased risks associated with MBS investments. Note that beginning about August 2006, BBB- to AA spreads began widening, pausing only briefly about October. That spread is generally referred to as the price of risk
D’Amato (2005) shows that the price of risk rises with increased defaults, lower housing starts, decreased payrolls, poor economic performance, and lower CDO issuance. D’Amato’s results are reproduced in Table 5.
28. Peter Horndahl & Christian Upper, Overview: Markets Anticipate an Orderly
Slowdown, BIS QUARTERLY REVIEW, Dec. 2006.

February 2007 Collateralized Debt Obligations 35
TABLE 5: CDO RISK PREMIUMS AND CREDIT SPREADS AND MACROECONOMIC PERFORMANCE
Source: D’Amato (2005) In summary, the structural changes witnessed in mortgage markets have
interacted with complex MBS and highly CDO volatile funding structures to place the U.S. housing market at risk. Equally as important, however, is that housing market weaknesses feed back through financial markets to further weaken financial instruments backing today’s CDOs. D’Amato shows that decreased housing starts that will result from lower liquidity in the MBS sector will further weaken credit spreads and depress CDO and MBS issuance. This feedback mechanism can create imbalances in the U.S. economy that, if left unchecked, could lead to prolonged economic difficulties.

36 Joshua Rosner & Joseph R. Mason
III. POLICY IMPLICATIONS
The potential for prolonged economic difficulties that also interfere with home ownership in the United States raise significant public policy concerns. Already we are witnessing restructurings and layoffs at top financial institutions. More importantly, however, is the need to provide stable funding sources for economic growth. The biggest obstacle that we have identified is lack of transparency. The structural changes noted in Part I.A largely went unnoticed by MBS investors until only recently. We explain that those changes went unnoticed largely because of the existing complexity and valuation difficulties underlying today’s MBS markets.
High yields in MBS in the past several years led to a massive infusion of CDO “hot money” into the MBS sector in an environment similar to that of the thrift crisis of the late 1980s. Like the thrift crisis and its aftermath, therefore, recent events not only threaten these institutions, but also threaten the U.S. consumer and taxpayer as well.
Perhaps of greater concern is the reputational risk posed to the U.S. capital markets—markets that have historically been viewed as among the most transparent, efficient, and well regulated in the world. The economic value of mortgage securitization and the risk transfer value of CDO issuance support their further use. However, there should be significant resources allocated to building the regulatory framework surrounding their structuring, issuance, ratings, sales, and valuation. We believe that efforts to provide transparency to these new product areas can foster stability while maintaining liquidity to the underlying collateral sectors and supporting further meaningful financial innovation and capital deepening.
At present, even financial regulators are hampered by the opacity of over-the-counter CDO and MBS markets, where only “qualified investors” may peruse the deal documents and performance reports. Currently none of the bank regulatory agencies (OCC, Federal Reserve, or FDIC) are deemed “qualified investors.” Even after that designation, however, those regulators must receive permission from each issuer to view their deal performance data and prospectus’ in order to monitor the sector.
Significant increases in public access to performance reports, CDO and MBS product standardization, and CDO and MBS securities ownership registration can help decrease the existing over-reliance on ratings agency inputs to rate and ultimately value the securities and reducing the valuation errors inherent in “marked-to-model” (rather than marked-to-market) portfolios. SEC Regulation AB was a (late) start for ABS and MBS. Overall, however, the U.S. economy needs an efficient public CDO market that allows transparent open-market repricing of market risk and outside research into new securities and funding arrangements. U.S. homeowners and consumers deserve stable and efficient funding to support their pursuit of the American dream.

February 2007 Collateralized Debt Obligations 37
BIBLIOGRAPHY
Bennett, Rosalind, and Mason, Joseph. “CDO Composition and Performance.” Working Paper, 2007.
Calomiris, Charles and Mason, Joseph. “Endogenous and Exogenous
Mortgage Prepayments in an Optimal Stopping Framework.” Working Paper, 2007.
Carron, Andrew; Dhrymes, Phoebus J.; and Beloreshki, Tsvetan N. Credit
Ratings for Structured Products: A Review of Analytical Methodologies, Credit Assessment Accuracy, and Issuer Selectivity among the Credit Rating Agencies. NERA Economic Consulting, November 6, 2003.
D Amato, Jeffery. “Risk Aversion and Risk Premia in the CDS Market.” BIS
Quarterly Review, December 2005. FDIC Outlook, Fall 2006 Firla-Cuchra, Maciej, and Jenkinson, Tim. “Why are Seucitization Issues
Tranched?” Oxford University Working Paper March 2005. Hagerty, James R. and Hudson, Michael, “Mortgage-Default Risks Rattle
Bond Investors,” Wall Street Journal, January 27, 2007, p. B4. JP Morgan, CDO Handbook, May 29, 2001. Lucas, Douglas L., Goodman, Laurie S., and Fabozzi, Frank J. Collateralized
Debt Obligations: Structures and Analysis, 2nd Ed. Hoboken, NJ: Wiley, 2006. Mollencamp, Carrick, “In Home-Lending Push, Banks Misjudged Risk:
HSBC Borrowers Fall Behind on Payments; Hiring More Collectors,” Wall Street Journal, February 8, 2007, p. A1.
Moody’s, CDO Asset Exposure Report, October 2006. Moody’s, Collateralized Debt Obligations Indices, October 2006 S&P CDO Spotlight: Update to General Cash Flow Analytics Criteria for
CDO Securitizations, October 16, 2006. S&P Global Cash Flow and Synthetic CDO Criteria, March 21, 2002.