How Polar is Ice? · solvent polarity increases E T ... (solvent) - 30.7)/32.4 E T ... (1994)....
37
UV-Vis spektrometrie Ústav chemie a RECETOX, MU Brno 2016, Dominik Heger, http://hegerd.sci.muni.cz/
Transcript of How Polar is Ice? · solvent polarity increases E T ... (solvent) - 30.7)/32.4 E T ... (1994)....

UV-Vis spektrometrie
Ústav chemie a RECETOX, MUBrno 2016, Dominik Heger, http://hegerd.sci.muni.cz/

Sluneční světlo

3
What is UV-VIS spectroscopy measuring?
Electronic transitions.
l / nm
185 - 200 Vacuum-UV
200 – 380 Near-UV (quartz)
380 – 780 Visible
Eint = Eel + Evib + Erot D E = h n
4
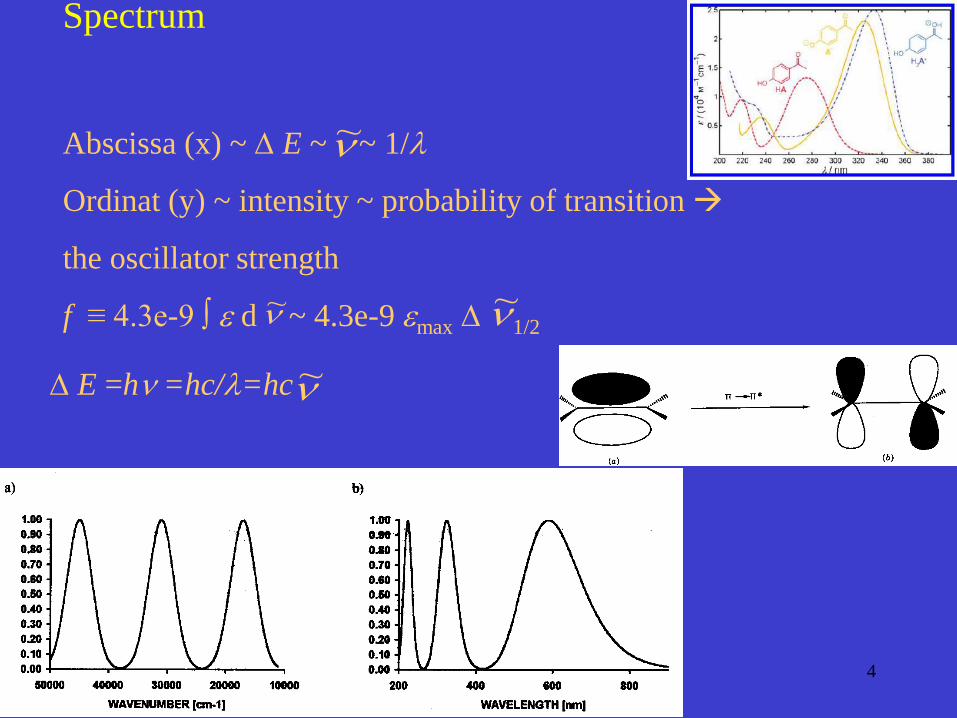
Spectrum
Abscissa (x) ~ D E ~ ~ 1/l
Ordinat (y) ~ intensity ~ probability of transition
the oscillator strength
f ≡ 4.3e-9 ∫ e d ~ 4.3e-9 emax D 1/2n~
D E =hn =hc/l=hc
n~
n~
n~
5
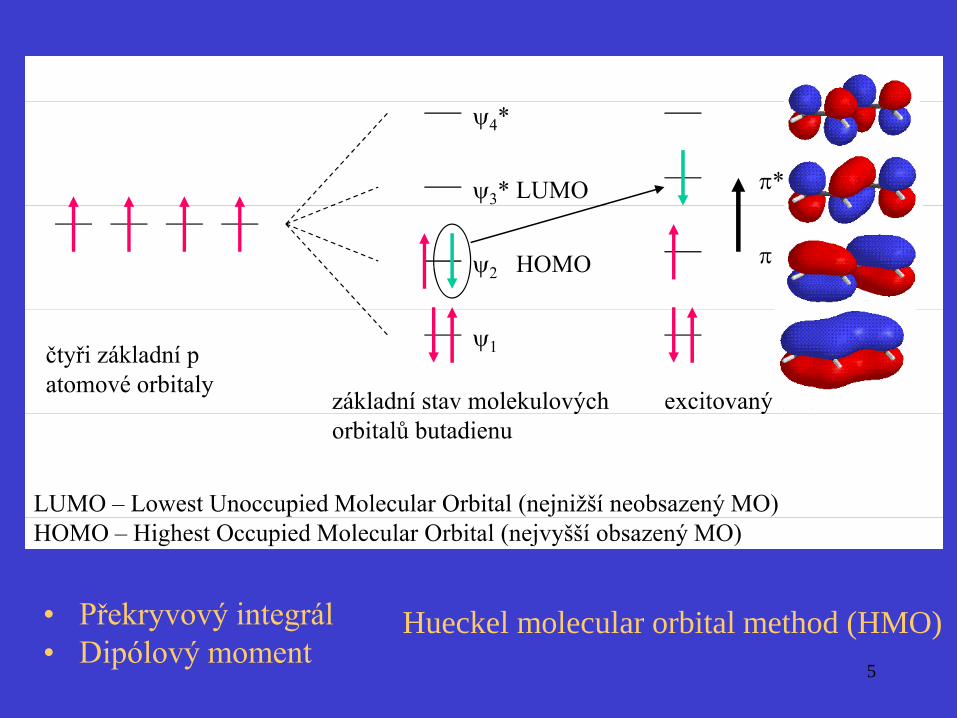
• Překryvový integrál
• Dipólový momentHueckel molecular orbital method (HMO)

Elektronová spektroskopie
6
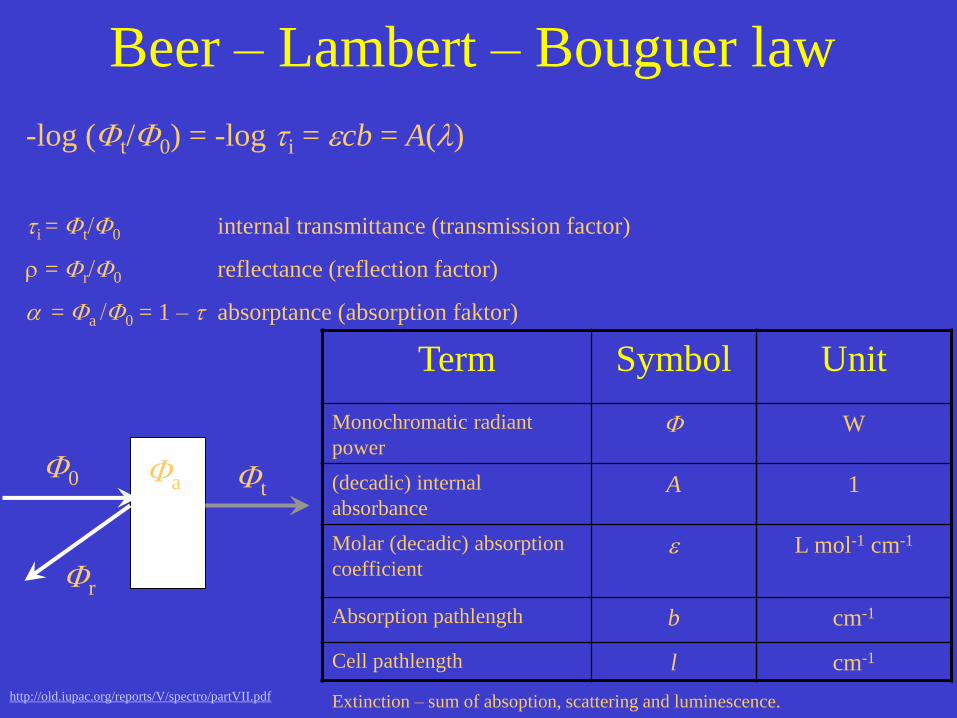
Beer – Lambert – Bouguer law
-log (Ft/F0) = -log ti = ecb = A(l)
ti = Ft/F0 internal transmittance (transmission factor)
= Fr/F0 reflectance (reflection factor)
a = Fa /F0 = 1 – t absorptance (absorption faktor)
F0 Fa
Fr
Ft
Term Symbol Unit
Monochromatic radiant
powerF W
(decadic) internal
absorbanceA 1
Molar (decadic) absorption
coefficiente L mol-1 cm-1
Absorption pathlength b cm-1
Cell pathlength l cm-1
http://old.iupac.org/reports/V/spectro/partVII.pdf Extinction – sum of absoption, scattering and luminescence.

Beer – Lambert – Bouguer law
8
0.000 0.015 0.030 0.045 0.060 0.075 0.090
0.0
0.1
0.2
0.3
0.4
0.5
0.6
0.7
0.8
0.9
1.0
Calibration Curve of Fe2+
A 5
10
nm
Fe2+ (mM)
Equation y = a + b*x
Weight No Weighting
Residual Sum of Squares
5.95001E-4
Adj. R-Square 0.99971
Value Standard Error
A 510nm Intercept 6.40621E-4 0.00143
A 510nm Slope 10809.93043 35.86739

9
Beer – Lambert – Bouguer law
limitations
• Chemical reasons – chemical equilibria (acid-base reaction,
self-association, complexation, thermal reaction,
photochemical reaction, inhomogenous samples)
• Physical reasons – thermochromism, saturation effects –
depletion of the ground state, incident radiation must be
parallel

Jak funguje spektrometr?

11
Single beam UV – VIS spectrophotometer
with diod array detector

12
Single beam UV – VIS spectrophotometer

13
Double beam UV – VIS spectrophotometer

14
Double beam, double monochromators
UV – VIS spectrophotometer

15
UV – VIS spectrophotometer
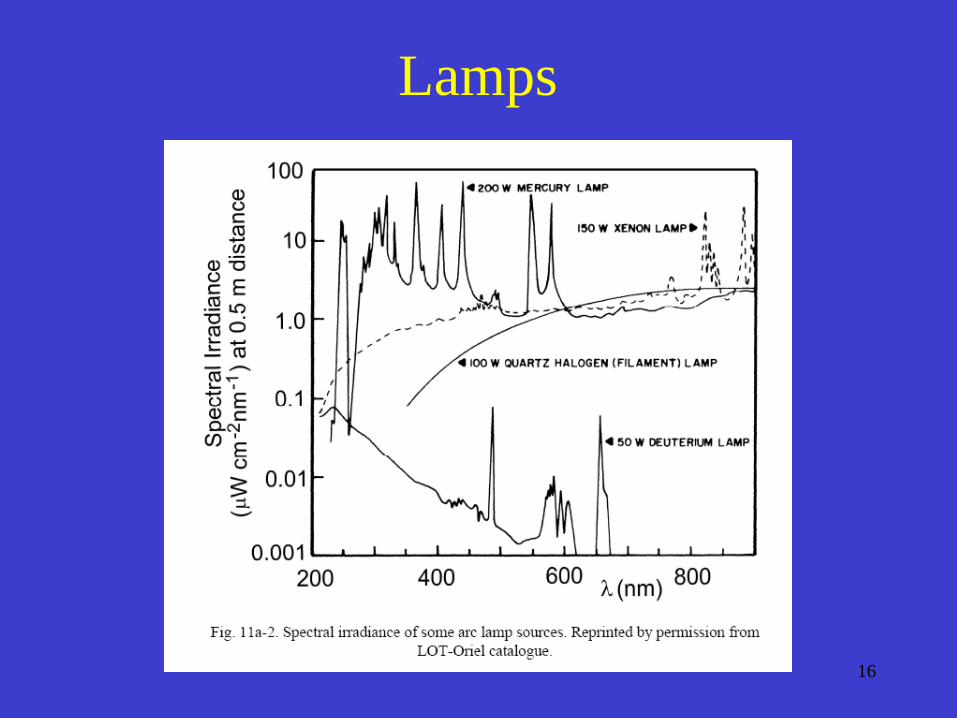
Light source
• Continuum × spectral-line source
• W-halogen lamp <330; 1200) nm
• D2 lamp <UV; 330> nm
• Xe arc lamp <190; 1000> nm
Spectrometer
• Single beam × double beam
• Sequential ×simultaneous
Cuvettes
• shape
• volume
•material
•use of matched cells
Detectors
• photo-emisive detectors (evacuated phototubes,
photomultiplier...)
• semiconuctive detectors (photodiods; detectors with a
spacial resolution– CCD –charge-coupled device)
http://www.hellmaoptik.com/en/kuevetten/
16
Lamps

Methyl-Naftalen
17
A t
0.001 0.998
0.010 0.977
0.046 0.900
0.100 0.794
0.430 0.370
0.500 0.316
1.000 0.100
1.500 0.032
2.000 0.010
3.000 0.001
4.0000 0.0001
-log (Ft/F0) = -log ti = ecb = A(l)

18
Franck-Condon Principle; Vertical excitation

Franck-Condon Principle
19
220 230 240 250 260 270
0.0
0.2
0.4
A
~n / (m–1
)
4.6 4.4 4.2 4.0 3.8
Benzene in hexane
l / nm
0-0 band
Hot band

20
Absorption bands of
organic molecules
Type of
transition
emax
n p* (R) < 100
p p* (K) > 10 000
(B –
benzenoid)
~ 500
(E -
ethylenic)
2000 – 14 000
Effects
hyperchromic
hypochromic
Shifts
hypsochromicbathochromic

21

22

23C8785_Photophysical_spectroscopic_methods
UV-VIS-NIR spekrum vody
24
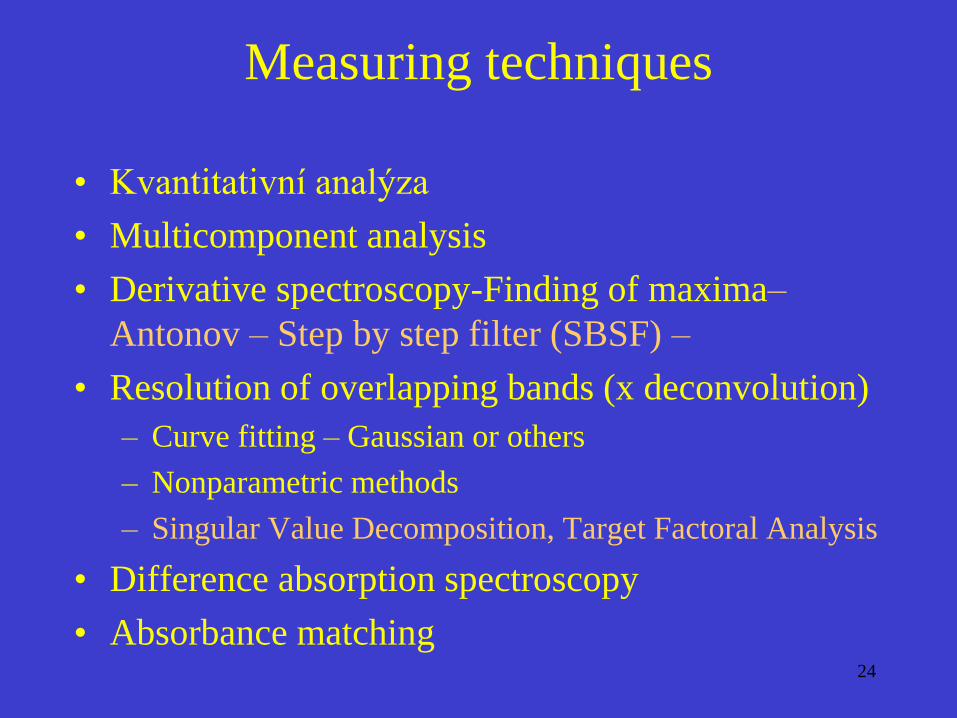
Measuring techniques
• Kvantitativní analýza
• Multicomponent analysis
• Derivative spectroscopy-Finding of maxima–
Antonov – Step by step filter (SBSF) –
• Resolution of overlapping bands (x deconvolution)
– Curve fitting – Gaussian or others
– Nonparametric methods
– Singular Value Decomposition, Target Factoral Analysis
• Difference absorption spectroscopy
• Absorbance matching

25
Derivative spectroscopie
Antony J. Owen: Uses of Derivative Spectroscopy, Agilent
Technologies, 1995

Application of derivative
spectroscopy to benzene
26
27
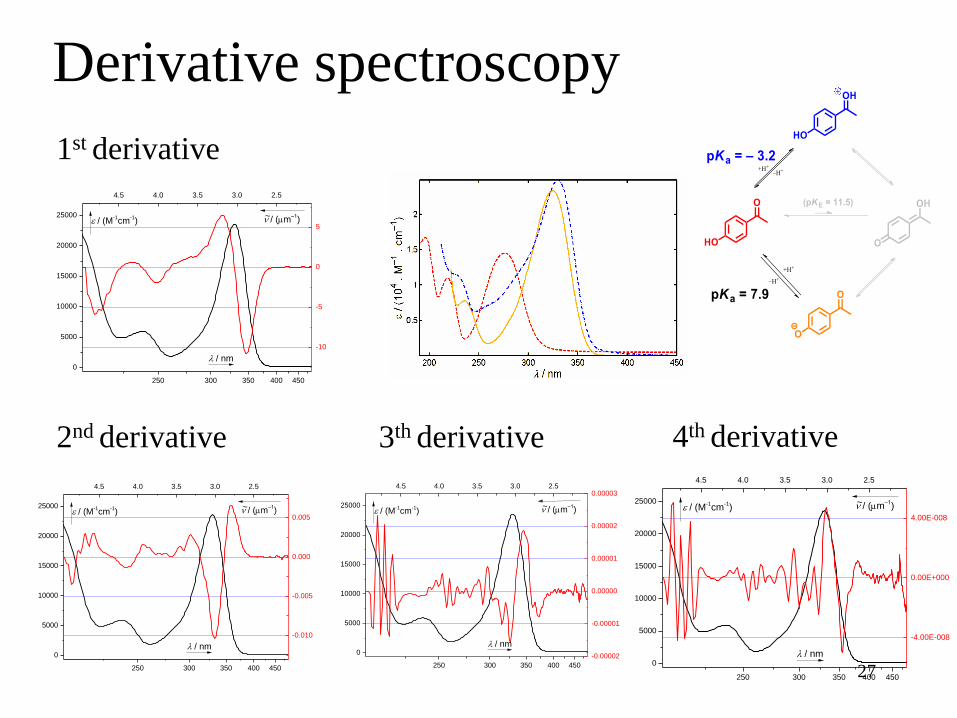
Derivative spectroscopy
1st derivative
2nd derivative 3th derivative 4th derivative
250 300 350 400 450
0
5000
10000
15000
20000
25000
l / nm
-10
-5
0
5
~n / (m–1
)
4.5 4.0 3.5 3.0 2.5
e / (M-1cm
-1)
250 300 350 400 450
0
5000
10000
15000
20000
25000
l / nm
-0.010
-0.005
0.000
0.005
~n / (m–1
)
4.5 4.0 3.5 3.0 2.5
e / (M-1cm
-1)
250 300 350 400 450
0
5000
10000
15000
20000
25000
l / nm
-0.00002
-0.00001
0.00000
0.00001
0.00002
0.00003
~n / (m–1
)
4.5 4.0 3.5 3.0 2.5
e / (M-1cm
-1)
250 300 350 400 450
0
5000
10000
15000
20000
25000
l / nm
-4.00E-008
0.00E+000
4.00E-008
~n / (m–1
)
4.5 4.0 3.5 3.0 2.5
e / (M-1cm
-1)

28

Photochromism
29
pH titration – o-nitrophenol
30
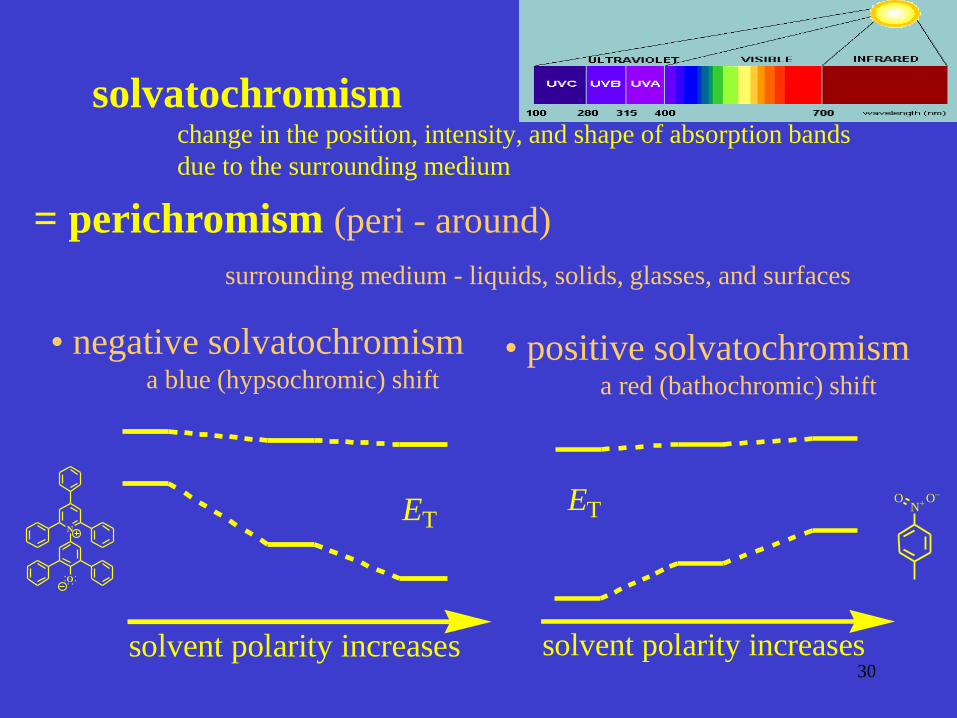
solvatochromismchange in the position, intensity, and shape of absorption bands
due to the surrounding medium
N
O
= perichromism (peri - around)
surrounding medium - liquids, solids, glasses, and surfaces
• negative solvatochromisma blue (hypsochromic) shift
• positive solvatochromism a red (bathochromic) shift
solvent polarity increases
ET
solvent polarity increases
ET N+O–O
31
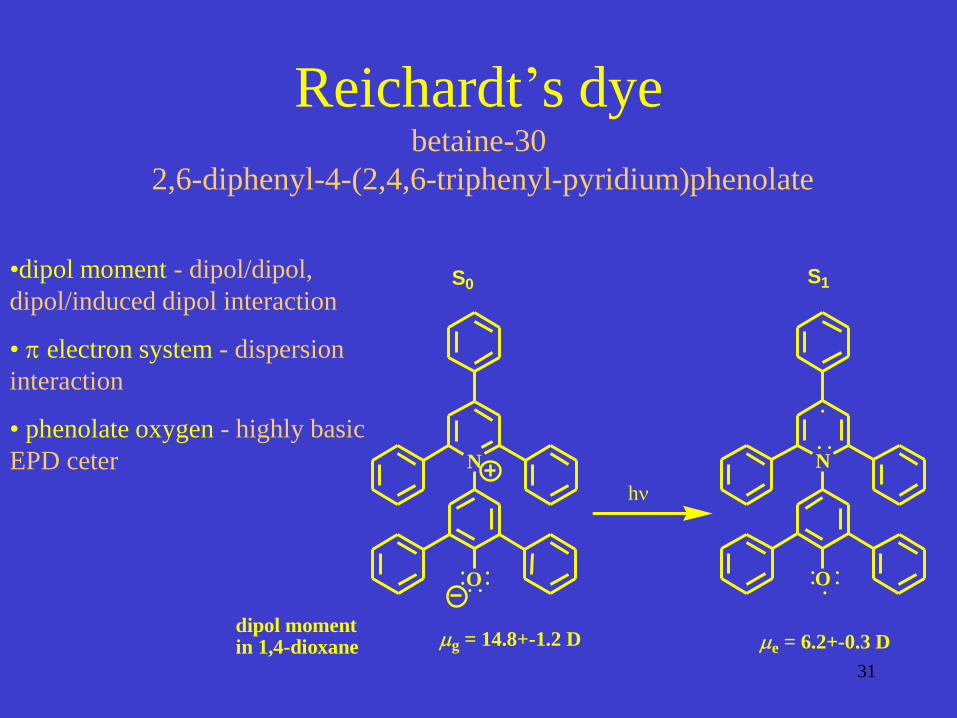
Reichardt’s dyebetaine-30
2,6-diphenyl-4-(2,4,6-triphenyl-pyridium)phenolate
N
O
N
O
hn
S0 S1
dipol momentin 1,4-dioxane g = 14.8+-1.2 D e = 6.2+-0.3 D
•dipol moment - dipol/dipol,
dipol/induced dipol interaction
• p electron system - dispersion
interaction
• phenolate oxygen - highly basic
EPD ceter

32
ET(30) and ETN
scale of solvent polarity
ET - molar electronic transition energy
[ET] = kcal/mol
[ETN] = 1
ET(30) = hc maxNA = (2.8591 E -3)( max / cm-1)
=28591/(lmax / nm)
ETN = (ET(solvent)-ET(TMS))/(ET(water)-ET(TMS))
= (ET(solvent) - 30.7)/32.4
ETN (TMS) = 0.000 ET
N (H2O) = 1.000
TMS = Tetramethylsilane
n~n~
Látka ETN
n-hexan 0.009
Dichlor
methan
0.309
EtOH 0.608
Voda 1

33
Literature
• http://old.iupac.org/reports/V/spectro/partVII.pdf
• Silverstein R. M. et all: Spectrometric indentification of organic compounds, John Wiley & Sons, inc.
• Reichardt, C. (1994). "Solvatochromic Dyes as Solvent Polarity Indicators." Chemical Reviews 94(8): 2319-2358.
• http://www.hellmaoptik.com/en/kuevetten/
• http://www.orgchm.bas.bg/~lantonov/
• UV-vis spectra– Heinz-Helmut Perkampus: UV-VIS Atlas of Organic Compounds
– science-softCon "UV/Vis+ Spectra Data Base" (UV/Vis+ PhotochemistryDatabase) 7th Edition (2010); ISBN 978-3-00-030970-0
– http://webbook.nist.gov/chemistry/name-ser.html
• UV-vis diffuse reflectance– Francis M. Mirabella: Modern Techniques in Applied Molecular
Spectroscopy

34
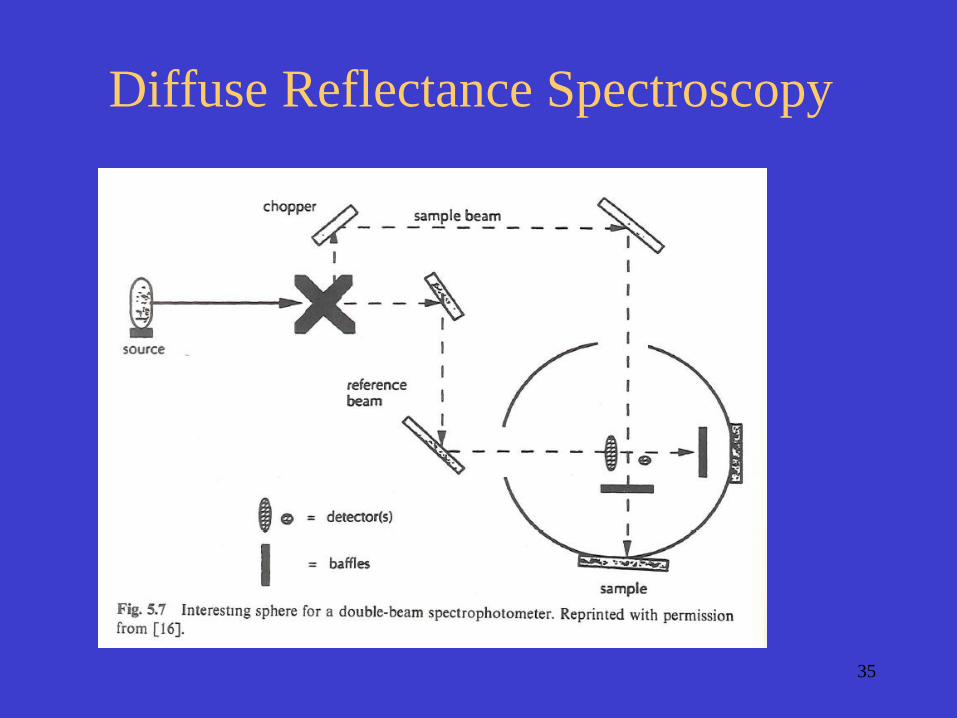
Diffuse Reflectance Spectroscopy
Diffuse (volume) reflection – phenomenon resulting
from the reflection, refraction, diffraction and
absorption
MgO
BaSO4
PTFE –
polytetrafluoret
hylene = halon
= Spectralon
35
Diffuse Reflectance Spectroscopy

36
Diffuse Reflectance Spectroscopy

37
Diffuse Reflectance Spectroscopy
Harrick - Praying Mantis