HOW OBESITY POLICIES ARE FAILING IN AMERICA€¦ · 5 O besity is one of the most serious health...
144
ISSUE REPORT AUGUST 2008 PREVENTING EPIDEMICS. PROTECTING PEOPLE. 2008 F as in Fat: HOW OBESITY POLICIES ARE FAILING IN AMERICA
Transcript of HOW OBESITY POLICIES ARE FAILING IN AMERICA€¦ · 5 O besity is one of the most serious health...
ISSUE REPORT
AUGUST 2008
PREVENTING EPIDEMICS.PROTECTING PEOPLE.
2008F as in Fat: HOW OBESITY POLICIES ARE FAILING IN AMERICA
TFAH BOARD OF DIRECTORS
Lowell Weicker, Jr.PresidentFormer 3-term U.S. Senator and Governor of Connecticut
Cynthia M. Harris, PhD, DABTVice PresidentDirector and Associate ProfessorInstitute of Public Health, Florida A & M University
Margaret A. Hamburg, MDSecretarySenior ScientistNuclear Threat Initiative (NTI)
Patricia Baumann, MS, JDTreasurerPresident and CEOBauman Foundation
Gail Christopher, DNVice President for HealthWK Kellogg Foundation
John W. Everets
David Fleming, MDDirector of Public HealthSeattle King County, Washington
Robert T. Harris, MDFormer Chief Medical Officer and Senior Vice President for HealthcareBlueCross BlueShield of North Carolina
Alonzo Plough, MA, MPH, PhDVice President of Program, Planning and EvaluationThe California Endowment
Theodore SpencerProject ManagerNatural Resources Defense Council
REPORT AUTHORS
Jeffrey Levi, PhD. Executive DirectorTrust for America’s HealthandAssociate Professor in the Department of Health PolicyThe George Washington University School of PublicHealth and Health Services
Serena Vinter, MHSLead Author and Senior Research AssociateTrust for America’s Health
Rebecca St. Laurent, JDHealth Policy Research AssistantTrust for America’s Health
Laura M. Segal, MADirector of Public AffairsTrust for America’s Health
PEER REVIEWERSTFAH thanks the reviewers for their time, expertise, and insights.The opinions expressed in this report do not necessarily representthe views of these individuals or their organizations.
Marcus Plescia, M.D. Chief, Chronic Disease and Injury SectionNorth Carolina Division of Public Health
David P. Hoffman, M.Ed.Director, Bureau of Chronic Disease ServicesNew York State Department of Health
Michael Eriksen, Sc.D.Director and ProfessorInstitute of Public Health, Georgia State University
TRUST FOR AMERICA’S HEALTH IS A NON-PROFIT, NON-PARTISAN ORGANIZATION DEDICATED TO SAVING
LIVES BY PROTECTING THE HEALTH OF EVERY COMMUNITY AND WORKING TO MAKE DISEASE PREVENTION
A NATIONAL PRIORITY.
The Robert Wood Johnson Foundation focuses on the pressing health and health care issues facing our country. As thenation’s largest philanthropy devoted exclusively to improving the health and health care of all Americans, the Foundation
works with a diverse group of organizations and individuals to identify solutions and achieve comprehensive, meaningful andtimely change. For more than 35 years the Foundation has brought experience, commitment, and a rigorous, balanced
approach to the problems that affect the health and health care of those it serves. Helping Americans lead healthier livesand get the care they need-the Foundation expects to make a difference in our lifetime.
For more information, visit www.rwjf.org.
3
TABLE OF CONTENTSIntroduction . . . . . . . . . . . . . . . . . . . . . . . . . . . . . . . . . . . . . . . . . . . . . . . . . . . . . .5
SECTION 1: Obesity Rates and Related Trends . . . . . . . . . . . . . . . . . . . . . . . . . . . . . . . . . . .9A. Adult Obesity and Overweight Rates . . . . . . . . . . . . . . . . . . . . . . . . . . . . . . . . .9B. Childhood and Youth Obesity and Overweight Rates . . . . . . . . . . . . . . . . . . .14C. Physical Inactivity in Adults . . . . . . . . . . . . . . . . . . . . . . . . . . . . . . . . . . . . . . . .18D. Diabetes and Hypertension . . . . . . . . . . . . . . . . . . . . . . . . . . . . . . . . . . . . . . .19E. Obesity and Poverty . . . . . . . . . . . . . . . . . . . . . . . . . . . . . . . . . . . . . . . . . . . . .20
SECTION 2: Fast Facts About Obesity . . . . . . . . . . . . . . . . . . . . . . . . . . . . . . . . . . . . . . . . .23A. What’s Behind the Obesity Epidemic? . . . . . . . . . . . . . . . . . . . . . . . . . . . . . . .23B. Obesity’s Impact on Health . . . . . . . . . . . . . . . . . . . . . . . . . . . . . . . . . . . . . . .25C. Obesity and Physical Inactivity . . . . . . . . . . . . . . . . . . . . . . . . . . . . . . . . . . . . .27D. Weight Bias and Quality of Life . . . . . . . . . . . . . . . . . . . . . . . . . . . . . . . . . . . .29E. Nutrition: The Other Side of the Energy Balance . . . . . . . . . . . . . . . . . . . . . .30F. Economic Costs of Obesity . . . . . . . . . . . . . . . . . . . . . . . . . . . . . . . . . . . . . . . .34G. The High Price of Food . . . . . . . . . . . . . . . . . . . . . . . . . . . . . . . . . . . . . . . . . .35
SECTION 3: State Responsibilities and Policies . . . . . . . . . . . . . . . . . . . . . . . . . . . . . . . . . .37A. State Obesity Plans . . . . . . . . . . . . . . . . . . . . . . . . . . . . . . . . . . . . . . . . . . . . . .37B. Survey of Chronic Disease Directors and Directors of Health Promotion and Education . . . . . . . . . . . . . . . . . . . . . . . . . . . . . . . . . . . . . .40C. State Obesity-Related Legislation . . . . . . . . . . . . . . . . . . . . . . . . . . . . . . . . . . .42D. Qualitative Evaluation of State Obesity-Related Legislation . . . . . . . . . . . . . . .56
SECTION 4: Federal Responsibilities and Policies . . . . . . . . . . . . . . . . . . . . . . . . . . . . . . . .71A. Overhaul of the WIC Food Packages . . . . . . . . . . . . . . . . . . . . . . . . . . . . . . . .71B. 2008 Farm Bill . . . . . . . . . . . . . . . . . . . . . . . . . . . . . . . . . . . . . . . . . . . . . . . . . .72C. Reauthorization of the Child Nutrition and Special Supplemental
Nutrition Program for Women, Infants, and Children (WIC) Act . . . . . . . . . .74D. Reauthorization of No Child Left Behind . . . . . . . . . . . . . . . . . . . . . . . . . . . . .76E. Reauthorization of the State Children’s Health Insurance Program (SCHIP) Act . .76F. Reauthorization of the Safe, Accountable, Flexible, Efficient Transportation
Equity Act: A Legacy for Users (SAFETEA-LU) . . . . . . . . . . . . . . . . . . . . . . . .77G. Other Obesity Related Legislation Before Congress . . . . . . . . . . . . . . . . . . . .77H. Funding For CDC Obesity Grants . . . . . . . . . . . . . . . . . . . . . . . . . . . . . . . . . .80
SECTION 5: A National Strategy to Combat Obesity . . . . . . . . . . . . . . . . . . . . . . . . . . . .83A. Federal Government . . . . . . . . . . . . . . . . . . . . . . . . . . . . . . . . . . . . . . . . . . . .86B. State Government . . . . . . . . . . . . . . . . . . . . . . . . . . . . . . . . . . . . . . . . . . . . . . .93C. Local Government . . . . . . . . . . . . . . . . . . . . . . . . . . . . . . . . . . . . . . . . . . . . . .95D. Community and Faith-Based Organizations . . . . . . . . . . . . . . . . . . . . . . . . . . .99E. Schools . . . . . . . . . . . . . . . . . . . . . . . . . . . . . . . . . . . . . . . . . . . . . . . . . . . . . .100F. Families and Individuals . . . . . . . . . . . . . . . . . . . . . . . . . . . . . . . . . . . . . . . . . .103G. Employers . . . . . . . . . . . . . . . . . . . . . . . . . . . . . . . . . . . . . . . . . . . . . . . . . . . .104H. Insurance Companies . . . . . . . . . . . . . . . . . . . . . . . . . . . . . . . . . . . . . . . . . . .106I. Food and Beverage Industries . . . . . . . . . . . . . . . . . . . . . . . . . . . . . . . . . . . . .107J. Agribusiness and Farmers . . . . . . . . . . . . . . . . . . . . . . . . . . . . . . . . . . . . . . . .109K. Role for Increased Research and Evaluation . . . . . . . . . . . . . . . . . . . . . . . . . .110L. Special Issues . . . . . . . . . . . . . . . . . . . . . . . . . . . . . . . . . . . . . . . . . . . . . . . . . .111
Appendix A: Methodology for Obesity and Other Rates Using BRFSS . . . . . . . . . . . . . . . .116
Appendix B: Methodology for State Obesity Plan Review . . . . . . . . . . . . . . . . . . . . . . . . . . . .118
Appendix C: Overview of Federal Programs That Impact Obesity . . . . . . . . . . . . . . . . . . . .119
References . . . . . . . . . . . . . . . . . . . . . . . . . . . . . . . . . . . . . . . . . . . . . . . . . . . . .128

5
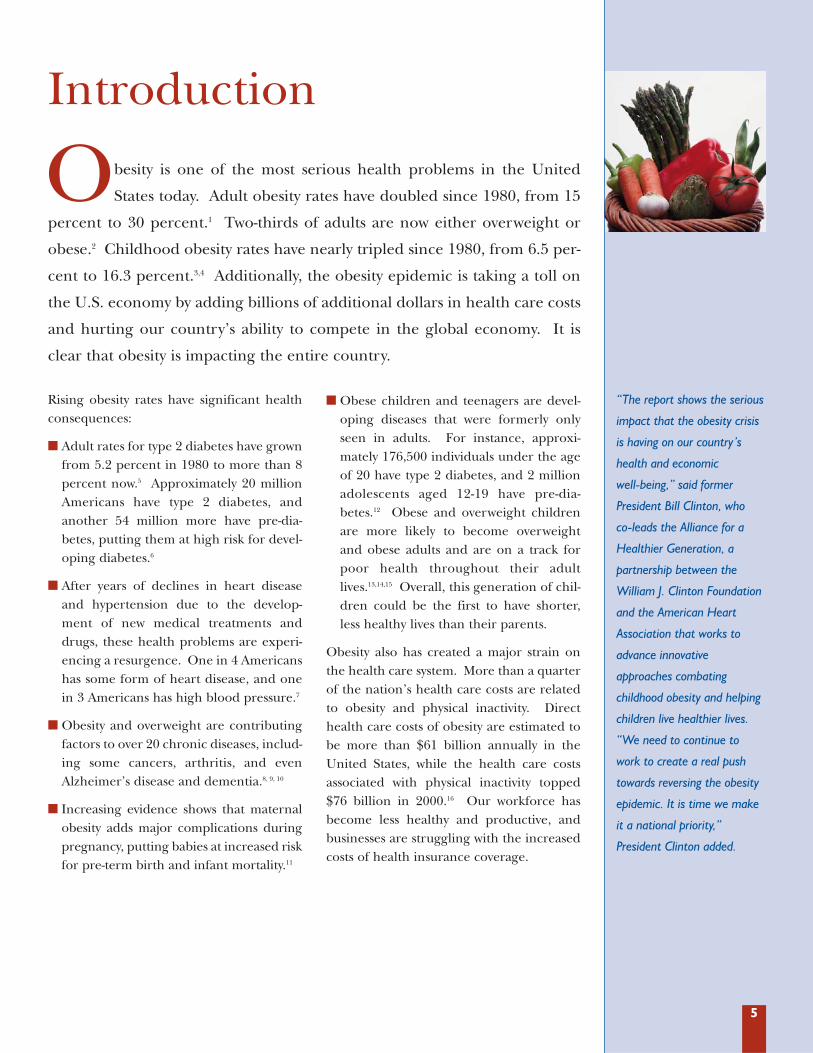
Obesity is one of the most serious health problems in the United
States today. Adult obesity rates have doubled since 1980, from 15
percent to 30 percent.1 Two-thirds of adults are now either overweight or
obese.2 Childhood obesity rates have nearly tripled since 1980, from 6.5 per-
cent to 16.3 percent.3,4 Additionally, the obesity epidemic is taking a toll on
the U.S. economy by adding billions of additional dollars in health care costs
and hurting our country’s ability to compete in the global economy. It is
clear that obesity is impacting the entire country.
Introduction
Rising obesity rates have significant healthconsequences:
� Adult rates for type 2 diabetes have grownfrom 5.2 percent in 1980 to more than 8percent now.5 Approximately 20 millionAmericans have type 2 diabetes, andanother 54 million more have pre-dia-betes, putting them at high risk for devel-oping diabetes.6
� After years of declines in heart diseaseand hypertension due to the develop-ment of new medical treatments anddrugs, these health problems are experi-encing a resurgence. One in 4 Americanshas some form of heart disease, and onein 3 Americans has high blood pressure.7
� Obesity and overweight are contributingfactors to over 20 chronic diseases, includ-ing some cancers, arthritis, and evenAlzheimer’s disease and dementia.8, 9, 10
� Increasing evidence shows that maternalobesity adds major complications duringpregnancy, putting babies at increased riskfor pre-term birth and infant mortality.11
� Obese children and teenagers are devel-oping diseases that were formerly onlyseen in adults. For instance, approxi-mately 176,500 individuals under the ageof 20 have type 2 diabetes, and 2 millionadolescents aged 12-19 have pre-dia-betes.12 Obese and overweight childrenare more likely to become overweightand obese adults and are on a track forpoor health throughout their adultlives.13,14,15 Overall, this generation of chil-dren could be the first to have shorter,less healthy lives than their parents.
Obesity also has created a major strain onthe health care system. More than a quarterof the nation’s health care costs are relatedto obesity and physical inactivity. Directhealth care costs of obesity are estimated tobe more than $61 billion annually in theUnited States, while the health care costsassociated with physical inactivity topped$76 billion in 2000.16 Our workforce hasbecome less healthy and productive, andbusinesses are struggling with the increasedcosts of health insurance coverage.
“The report shows the serious
impact that the obesity crisis
is having on our country’s
health and economic
well-being,” said former
President Bill Clinton, who
co-leads the Alliance for a
Healthier Generation, a
partnership between the
William J. Clinton Foundation
and the American Heart
Association that works to
advance innovative
approaches combating
childhood obesity and helping
children live healthier lives.
“We need to continue to
work to create a real push
towards reversing the obesity
epidemic. It is time we make
it a national priority,”
President Clinton added.
6
This is the fifth annual edition of F as in Fat:How Obesity Policies Are Failing in America,which tracks trends in obesity-related ratesand policies. This report finds that muchprogress has been made during the past 5years in bringing attention to the obesityproblem and in better understanding thereasons for the rise in obesity rates. In addi-tion, many communities and states havebeen taking action with promising programsto make physical activity and good nutritionmore accessible to more Americans.
However, this report also concludes thatuntil these promising programs are widelyadopted and there is a steady stream offunding to sustain them, only limitedprogress will be made. Overall, our countryis failing to address the obesity epidemic inproportion to the threat that it poses.America’s future depends on the health ofour children, but we’re failing them by nottreating the obesity epidemic with theurgency it deserves.
In the past year, there has been one reasonfor cautious optimism. According to the lat-est data from the U.S. Centers for DiseaseControl and Prevention’s National Healthand Nutrition Examination Survey(NHANES), after years of increases, child-hood and adolescent obesity rates remainedlevel between 2003-2004 and 2005-2006.17 Itis too early to determine if this is a result ofobesity-prevention programs, but it doesprovide encouragement.
The trends for adults continue to be evenmore complicated. This year’s F as in Fat:How Obesity Policies Are Failing in Americaanalysis finds that adult obesity rates climbedin 37 states. Rates did not decline in any
state. Experts estimate that if we keep on thecurrent course, 75 percent of Americans willbe overweight or obese by 2015.18
Many experts believe that America has beenslow to take action to deal with obesitybecause it has traditionally been seen as anissue of personal responsibility. In this viewindividuals make decisions about what to eatand how active to be, and they should bearthe burden and blame alone if they makeunhealthy choices.
But it is clear now that, while personalresponsibility is an important part of theequation, there are many factors beyondindividual control that have contributed tothe rising obesity rates. Some of the mostsignificant factors include the high cost ofhealthy foods, the location of grocery stores,access to safe places to exercise, and theavailability of preventive health care servic-es. We need to find ways to make healthychoices easy choices. And just as smokinghas become less culturally acceptable, weneed to shift cultural norms away fromunhealthy values like oversized portions, thepopularization of foods with minimumnutritional quality, and the overuse of TVand video games, which encourage physicalinactivity.
Addressing the obesity crisis must be ashared responsibility. This report concludeswith a recommendation to create aNational St rategy to Combat O besit y thatwill involve individuals and families, com-munities, schools, employers, businesses,insurers, and government to find ways toaddress the epidemic. This strategy setsnational goals, starting with a goal of revers-ing the trend of childhood obesity by 2015.
F AS IN FAT 2008
7
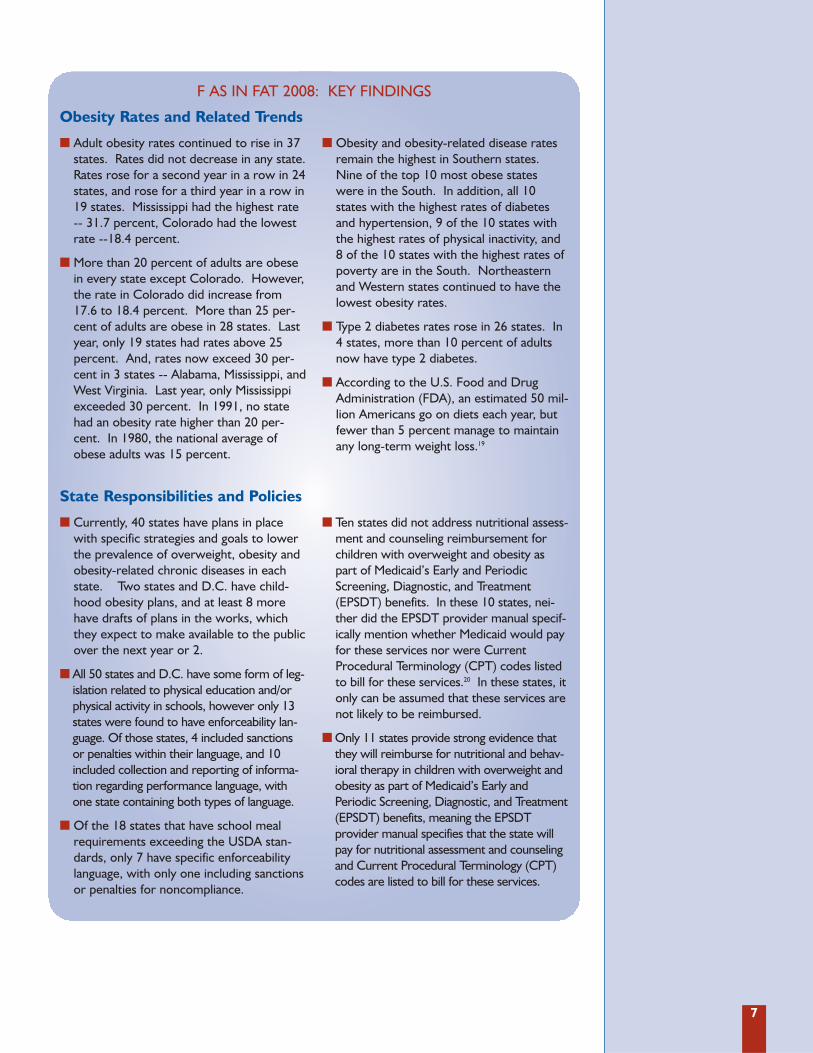
� Adult obesity rates continued to rise in 37states. Rates did not decrease in any state.Rates rose for a second year in a row in 24states, and rose for a third year in a row in19 states. Mississippi had the highest rate-- 31.7 percent, Colorado had the lowestrate --18.4 percent.
� More than 20 percent of adults are obesein every state except Colorado. However,the rate in Colorado did increase from17.6 to 18.4 percent. More than 25 per-cent of adults are obese in 28 states. Lastyear, only 19 states had rates above 25percent. And, rates now exceed 30 per-cent in 3 states -- Alabama, Mississippi, andWest Virginia. Last year, only Mississippiexceeded 30 percent. In 1991, no statehad an obesity rate higher than 20 per-cent. In 1980, the national average ofobese adults was 15 percent.
� Obesity and obesity-related disease ratesremain the highest in Southern states.Nine of the top 10 most obese stateswere in the South. In addition, all 10states with the highest rates of diabetesand hypertension, 9 of the 10 states withthe highest rates of physical inactivity, and8 of the 10 states with the highest rates ofpoverty are in the South. Northeasternand Western states continued to have thelowest obesity rates.
� Type 2 diabetes rates rose in 26 states. In4 states, more than 10 percent of adultsnow have type 2 diabetes.
� According to the U.S. Food and DrugAdministration (FDA), an estimated 50 mil-lion Americans go on diets each year, butfewer than 5 percent manage to maintainany long-term weight loss.19
Obesity Rates and Related Trends
� Currently, 40 states have plans in placewith specific strategies and goals to lowerthe prevalence of overweight, obesity andobesity-related chronic diseases in eachstate. Two states and D.C. have child-hood obesity plans, and at least 8 morehave drafts of plans in the works, whichthey expect to make available to the publicover the next year or 2.
� All 50 states and D.C. have some form of leg-islation related to physical education and/orphysical activity in schools, however only 13states were found to have enforceability lan-guage. Of those states, 4 included sanctionsor penalties within their language, and 10included collection and reporting of informa-tion regarding performance language, withone state containing both types of language.
� Of the 18 states that have school mealrequirements exceeding the USDA stan-dards, only 7 have specific enforceabilitylanguage, with only one including sanctionsor penalties for noncompliance.
� Ten states did not address nutritional assess-ment and counseling reimbursement forchildren with overweight and obesity aspart of Medicaid’s Early and PeriodicScreening, Diagnostic, and Treatment(EPSDT) benefits. In these 10 states, nei-ther did the EPSDT provider manual specif-ically mention whether Medicaid would payfor these services nor were CurrentProcedural Terminology (CPT) codes listedto bill for these services.20 In these states, itonly can be assumed that these services arenot likely to be reimbursed.
� Only 11 states provide strong evidence thatthey will reimburse for nutritional and behav-ioral therapy in children with overweight andobesity as part of Medicaid’s Early andPeriodic Screening, Diagnostic, and Treatment(EPSDT) benefits, meaning the EPSDTprovider manual specifies that the state willpay for nutritional assessment and counselingand Current Procedural Terminology (CPT)codes are listed to bill for these services.
State Responsibilities and Policies
F AS IN FAT 2008: KEY FINDINGS
8
� Only 2 states’ Medicaid manuals providedguideline references for treatment of obe-sity in adults.
� Twenty-six states explicitly cover nutritionalassessment and consultation for obese adultsunder Medicaid, while 20 explicitly do not.
� Drug therapy to treat obesity is theleast frequently covered and discussedtreatment category in Medicaid; only 10states cover it while 33 make no men-tion of it within their provider manuals.
� Bariatric surgery is covered by 45 stateMedicaid plans.
� On the group insurance market, 35 statesexpressly allow “health status” or “obesity”to be used as a factor for rate adjustments in
the small group market. The majority used“health status” as an adjustment factor.
� Only 9 states prohibit the use of healthstatus or obesity as a factor for rateadjustments in the small group market.These states used community oradjusted community rating.
� Only 5 states provide for coverage ofone or more treatments for obesity inboth the small group and individualinsurance markets. The vast majority ofstates do not provide any coverage ofobesity related treatments and the fewthat do cover only those treatments formorbid obesity do so as long as individu-als adhere to the caveats imposed in thecoverage requirement.
F AS IN FAT 2008: KEY FINDINGS
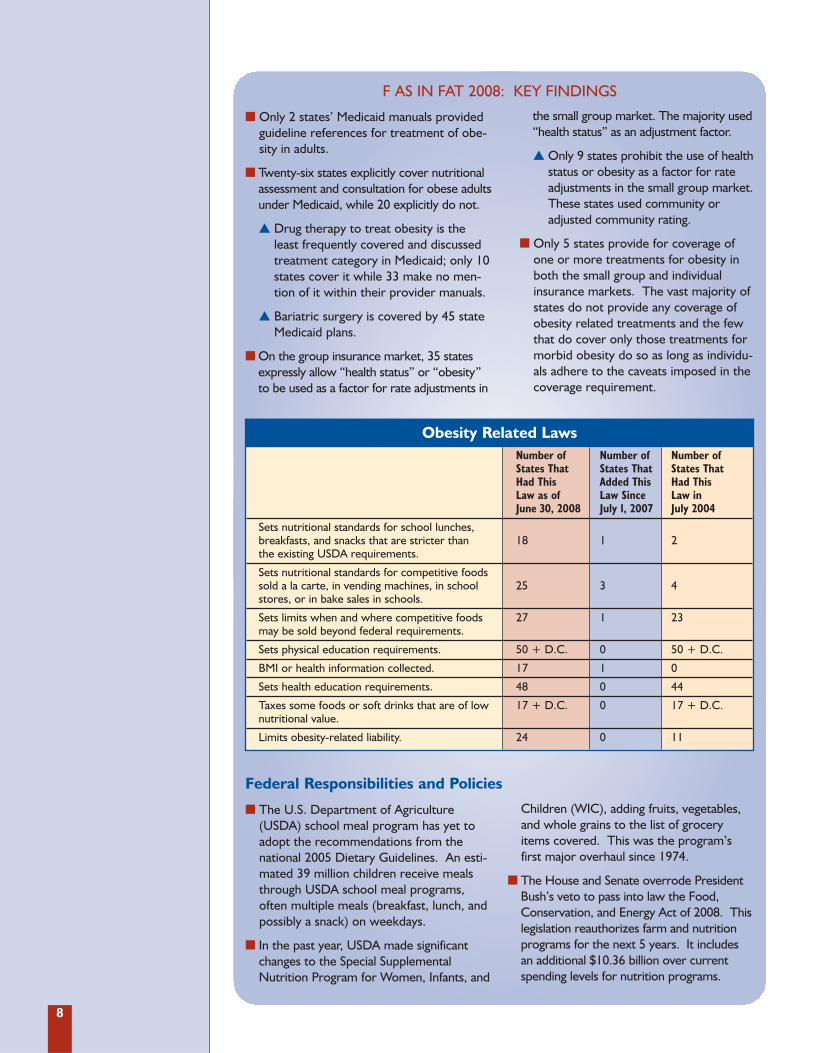
� The U.S. Department of Agriculture(USDA) school meal program has yet toadopt the recommendations from thenational 2005 Dietary Guidelines. An esti-mated 39 million children receive mealsthrough USDA school meal programs,often multiple meals (breakfast, lunch, andpossibly a snack) on weekdays.
� In the past year, USDA made significantchanges to the Special SupplementalNutrition Program for Women, Infants, and
Children (WIC), adding fruits, vegetables,and whole grains to the list of groceryitems covered. This was the program’sfirst major overhaul since 1974.
� The House and Senate overrode PresidentBush’s veto to pass into law the Food,Conservation, and Energy Act of 2008. Thislegislation reauthorizes farm and nutritionprograms for the next 5 years. It includesan additional $10.36 billion over currentspending levels for nutrition programs.
Federal Responsibilities and Policies
Obesity Related LawsNumber of Number of Number of States That States That States That Had This Added This Had This Law as of Law Since Law in June 30, 2008 July 1, 2007 July 2004
Sets nutritional standards for school lunches, breakfasts, and snacks that are stricter than 18 1 2the existing USDA requirements.
Sets nutritional standards for competitive foods sold a la carte, in vending machines, in school 25 3 4stores, or in bake sales in schools.
Sets limits when and where competitive foods 27 1 23may be sold beyond federal requirements.
Sets physical education requirements. 50 + D.C. 0 50 + D.C.
BMI or health information collected. 17 1 0
Sets health education requirements. 48 0 44
Taxes some foods or soft drinks that are of low 17 + D.C. 0 17 + D.C.nutritional value.
Limits obesity-related liability. 24 0 11
9
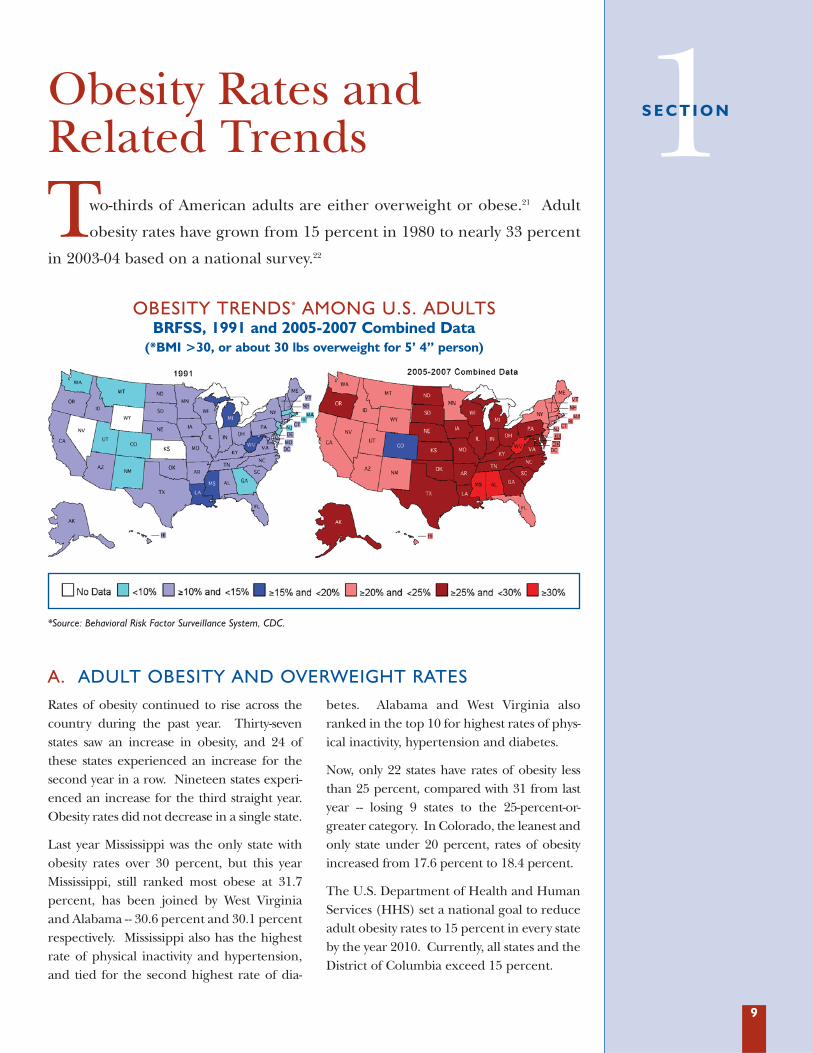
Two-thirds of American adults are either overweight or obese.21 Adult
obesity rates have grown from 15 percent in 1980 to nearly 33 percent
in 2003-04 based on a national survey.22
Obesity Rates andRelated Trends 1S E C T I O N
Rates of obesity continued to rise across thecountry during the past year. Thirty-sevenstates saw an increase in obesity, and 24 ofthese states experienced an increase for thesecond year in a row. Nineteen states experi-enced an increase for the third straight year.Obesity rates did not decrease in a single state.
Last year Mississippi was the only state withobesity rates over 30 percent, but this yearMississippi, still ranked most obese at 31.7percent, has been joined by West Virginiaand Alabama -- 30.6 percent and 30.1 percentrespectively. Mississippi also has the highestrate of physical inactivity and hypertension,and tied for the second highest rate of dia-
betes. Alabama and West Virginia alsoranked in the top 10 for highest rates of phys-ical inactivity, hypertension and diabetes.
Now, only 22 states have rates of obesity lessthan 25 percent, compared with 31 from lastyear -- losing 9 states to the 25-percent-or-greater category. In Colorado, the leanest andonly state under 20 percent, rates of obesityincreased from 17.6 percent to 18.4 percent.
The U.S. Department of Health and HumanServices (HHS) set a national goal to reduceadult obesity rates to 15 percent in every stateby the year 2010. Currently, all states and theDistrict of Columbia exceed 15 percent.
A. ADULT OBESITY AND OVERWEIGHT RATES
OBESITY TRENDS* AMONG U.S. ADULTSBRFSS, 1991 and 2005-2007 Combined Data
(*BMI >30, or about 30 lbs overweight for 5’ 4” person)
*Source: Behavioral Risk Factor Surveillance System, CDC.
10
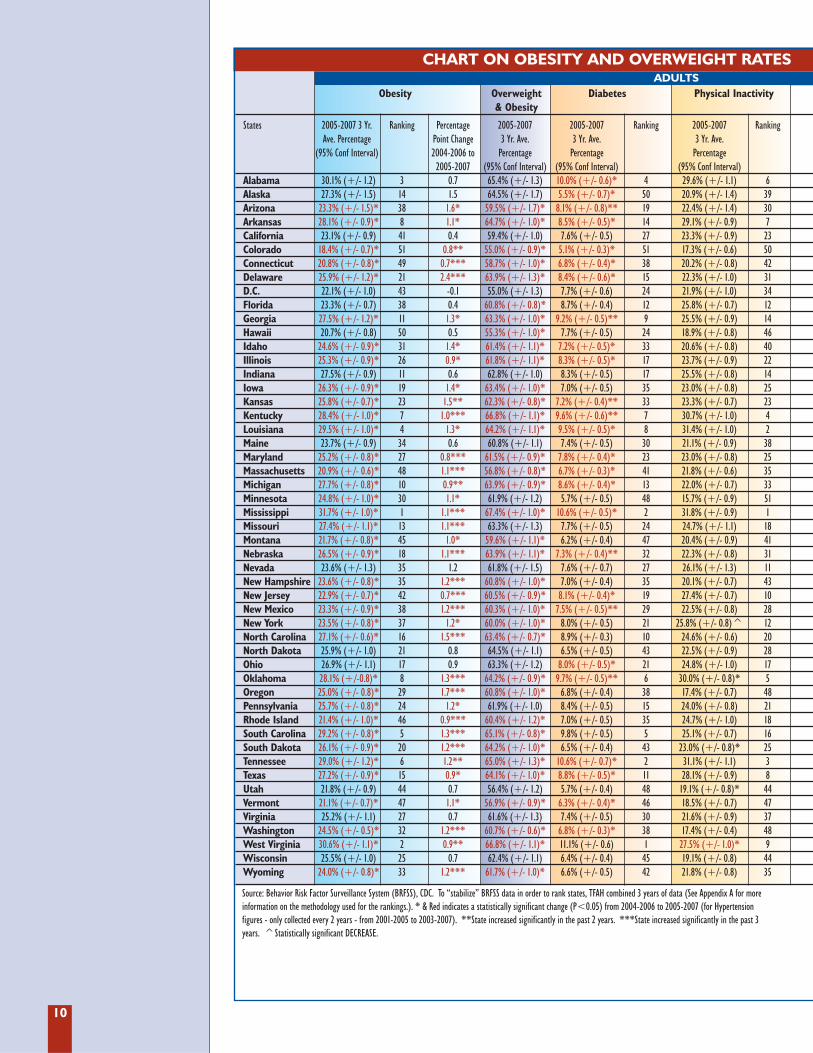
CHART ON OBESITY AND OVERWEIGHT RATES
Obesity Overweight Diabetes Physical Inactivity& Obesity
States 2005-2007 3 Yr. Ranking Percentage 2005-2007 2005-2007 Ranking 2005-2007 Ranking Ave. Percentage Point Change 3 Yr. Ave. 3 Yr. Ave. 3 Yr. Ave.
(95% Conf Interval) 2004-2006 to Percentage Percentage Percentage 2005-2007 (95% Conf Interval) (95% Conf Interval) (95% Conf Interval)
Alabama 30.1% (+/- 1.2) 3 0.7 65.4% (+/- 1.3) 10.0% (+/- 0.6)* 4 29.6% (+/- 1.1) 6Alaska 27.3% (+/- 1.5) 14 1.5 64.5% (+/- 1.7) 5.5% (+/- 0.7)* 50 20.9% (+/- 1.4) 39Arizona 23.3% (+/- 1.5)* 38 1.6* 59.5% (+/- 1.7)* 8.1% (+/- 0.8)** 19 22.4% (+/- 1.4) 30Arkansas 28.1% (+/- 0.9)* 8 1.1* 64.7% (+/- 1.0)* 8.5% (+/- 0.5)* 14 29.1% (+/- 0.9) 7California 23.1% (+/- 0.9) 41 0.4 59.4% (+/- 1.0) 7.6% (+/- 0.5) 27 23.3% (+/- 0.9) 23Colorado 18.4% (+/- 0.7)* 51 0.8** 55.0% (+/- 0.9)* 5.1% (+/- 0.3)* 51 17.3% (+/- 0.6) 50Connecticut 20.8% (+/- 0.8)* 49 0.7*** 58.7% (+/- 1.0)* 6.8% (+/- 0.4)* 38 20.2% (+/- 0.8) 42Delaware 25.9% (+/- 1.2)* 21 2.4*** 63.9% (+/- 1.3)* 8.4% (+/- 0.6)* 15 22.3% (+/- 1.0) 31D.C. 22.1% (+/- 1.0) 43 -0.1 55.0% (+/- 1.3) 7.7% (+/- 0.6) 24 21.9% (+/- 1.0) 34Florida 23.3% (+/- 0.7) 38 0.4 60.8% (+/- 0.8)* 8.7% (+/- 0.4) 12 25.8% (+/- 0.7) 12Georgia 27.5% (+/- 1.2)* 11 1.3* 63.3% (+/- 1.0)* 9.2% (+/- 0.5)** 9 25.5% (+/- 0.9) 14Hawaii 20.7% (+/- 0.8) 50 0.5 55.3% (+/- 1.0)* 7.7% (+/- 0.5) 24 18.9% (+/- 0.8) 46Idaho 24.6% (+/- 0.9)* 31 1.4* 61.4% (+/- 1.1)* 7.2% (+/- 0.5)* 33 20.6% (+/- 0.8) 40Illinois 25.3% (+/- 0.9)* 26 0.9* 61.8% (+/- 1.1)* 8.3% (+/- 0.5)* 17 23.7% (+/- 0.9) 22Indiana 27.5% (+/- 0.9) 11 0.6 62.8% (+/- 1.0) 8.3% (+/- 0.5) 17 25.5% (+/- 0.8) 14Iowa 26.3% (+/- 0.9)* 19 1.4* 63.4% (+/- 1.0)* 7.0% (+/- 0.5) 35 23.0% (+/- 0.8) 25Kansas 25.8% (+/- 0.7)* 23 1.5** 62.3% (+/- 0.8)* 7.2% (+/- 0.4)** 33 23.3% (+/- 0.7) 23Kentucky 28.4% (+/- 1.0)* 7 1.0*** 66.8% (+/- 1.1)* 9.6% (+/- 0.6)** 7 30.7% (+/- 1.0) 4Louisiana 29.5% (+/- 1.0)* 4 1.3* 64.2% (+/- 1.1)* 9.5% (+/- 0.5)* 8 31.4% (+/- 1.0) 2Maine 23.7% (+/- 0.9) 34 0.6 60.8% (+/- 1.1) 7.4% (+/- 0.5) 30 21.1% (+/- 0.9) 38Maryland 25.2% (+/- 0.8)* 27 0.8*** 61.5% (+/- 0.9)* 7.8% (+/- 0.4)* 23 23.0% (+/- 0.8) 25Massachusetts 20.9% (+/- 0.6)* 48 1.1*** 56.8% (+/- 0.8)* 6.7% (+/- 0.3)* 41 21.8% (+/- 0.6) 35Michigan 27.7% (+/- 0.8)* 10 0.9** 63.9% (+/- 0.9)* 8.6% (+/- 0.4)* 13 22.0% (+/- 0.7) 33Minnesota 24.8% (+/- 1.0)* 30 1.1* 61.9% (+/- 1.2) 5.7% (+/- 0.5) 48 15.7% (+/- 0.9) 51Mississippi 31.7% (+/- 1.0)* 1 1.1*** 67.4% (+/- 1.0)* 10.6% (+/- 0.5)* 2 31.8% (+/- 0.9) 1Missouri 27.4% (+/- 1.1)* 13 1.1*** 63.3% (+/- 1.3) 7.7% (+/- 0.5) 24 24.7% (+/- 1.1) 18Montana 21.7% (+/- 0.8)* 45 1.0* 59.6% (+/- 1.1)* 6.2% (+/- 0.4) 47 20.4% (+/- 0.9) 41Nebraska 26.5% (+/- 0.9)* 18 1.1*** 63.9% (+/- 1.1)* 7.3% (+/- 0.4)** 32 22.3% (+/- 0.8) 31Nevada 23.6% (+/- 1.3) 35 1.2 61.8% (+/- 1.5) 7.6% (+/- 0.7) 27 26.1% (+/- 1.3) 11New Hampshire 23.6% (+/- 0.8)* 35 1.2*** 60.8% (+/- 1.0)* 7.0% (+/- 0.4) 35 20.1% (+/- 0.7) 43New Jersey 22.9% (+/- 0.7)* 42 0.7*** 60.5% (+/- 0.9)* 8.1% (+/- 0.4)* 19 27.4% (+/- 0.7) 10New Mexico 23.3% (+/- 0.9)* 38 1.2*** 60.3% (+/- 1.0)* 7.5% (+/- 0.5)** 29 22.5% (+/- 0.8) 28New York 23.5% (+/- 0.8)* 37 1.2* 60.0% (+/- 1.0)* 8.0% (+/- 0.5) 21 25.8% (+/- 0.8)^ 12North Carolina 27.1% (+/- 0.6)* 16 1.5*** 63.4% (+/- 0.7)* 8.9% (+/- 0.3) 10 24.6% (+/- 0.6) 20North Dakota 25.9% (+/- 1.0) 21 0.8 64.5% (+/- 1.1) 6.5% (+/- 0.5) 43 22.5% (+/- 0.9) 28Ohio 26.9% (+/- 1.1) 17 0.9 63.3% (+/- 1.2) 8.0% (+/- 0.5)* 21 24.8% (+/- 1.0) 17Oklahoma 28.1% (+/-0.8)* 8 1.3*** 64.2% (+/- 0.9)* 9.7% (+/- 0.5)** 6 30.0% (+/- 0.8)* 5Oregon 25.0% (+/- 0.8)* 29 1.7*** 60.8% (+/- 1.0)* 6.8% (+/- 0.4) 38 17.4% (+/- 0.7) 48Pennsylvania 25.7% (+/- 0.8)* 24 1.2* 61.9% (+/- 1.0) 8.4% (+/- 0.5) 15 24.0% (+/- 0.8) 21Rhode Island 21.4% (+/- 1.0)* 46 0.9*** 60.4% (+/- 1.2)* 7.0% (+/- 0.5) 35 24.7% (+/- 1.0) 18South Carolina 29.2% (+/- 0.8)* 5 1.3*** 65.1% (+/- 0.8)* 9.8% (+/- 0.5) 5 25.1% (+/- 0.7) 16South Dakota 26.1% (+/- 0.9)* 20 1.2*** 64.2% (+/- 1.0)* 6.5% (+/- 0.4) 43 23.0% (+/- 0.8)* 25Tennessee 29.0% (+/- 1.2)* 6 1.2** 65.0% (+/- 1.3)* 10.6% (+/- 0.7)* 2 31.1% (+/- 1.1) 3Texas 27.2% (+/- 0.9)* 15 0.9* 64.1% (+/- 1.0)* 8.8% (+/- 0.5)* 11 28.1% (+/- 0.9) 8Utah 21.8% (+/- 0.9) 44 0.7 56.4% (+/- 1.2) 5.7% (+/- 0.4) 48 19.1% (+/- 0.8)* 44Vermont 21.1% (+/- 0.7)* 47 1.1* 56.9% (+/- 0.9)* 6.3% (+/- 0.4)* 46 18.5% (+/- 0.7) 47Virginia 25.2% (+/- 1.1) 27 0.7 61.6% (+/- 1.3) 7.4% (+/- 0.5) 30 21.6% (+/- 0.9) 37Washington 24.5% (+/- 0.5)* 32 1.2*** 60.7% (+/- 0.6)* 6.8% (+/- 0.3)* 38 17.4% (+/- 0.4) 48West Virginia 30.6% (+/- 1.1)* 2 0.9** 66.8% (+/- 1.1)* 11.1% (+/- 0.6) 1 27.5% (+/- 1.0)* 9Wisconsin 25.5% (+/- 1.0) 25 0.7 62.4% (+/- 1.1) 6.4% (+/- 0.4) 45 19.1% (+/- 0.8) 44Wyoming 24.0% (+/- 0.8)* 33 1.2*** 61.7% (+/- 1.0)* 6.6% (+/- 0.5) 42 21.8% (+/- 0.8) 35
ADULTS
Source: Behavior Risk Factor Surveillance System (BRFSS), CDC. To “stabilize” BRFSS data in order to rank states, TFAH combined 3 years of data (See Appendix A for moreinformation on the methodology used for the rankings.). * & Red indicates a statistically significant change (P<0.05) from 2004-2006 to 2005-2007 (for Hypertensionfigures - only collected every 2 years - from 2001-2005 to 2003-2007). **State increased significantly in the past 2 years. ***State increased significantly in the past 3years. ^Statistically significant DECREASE.
11
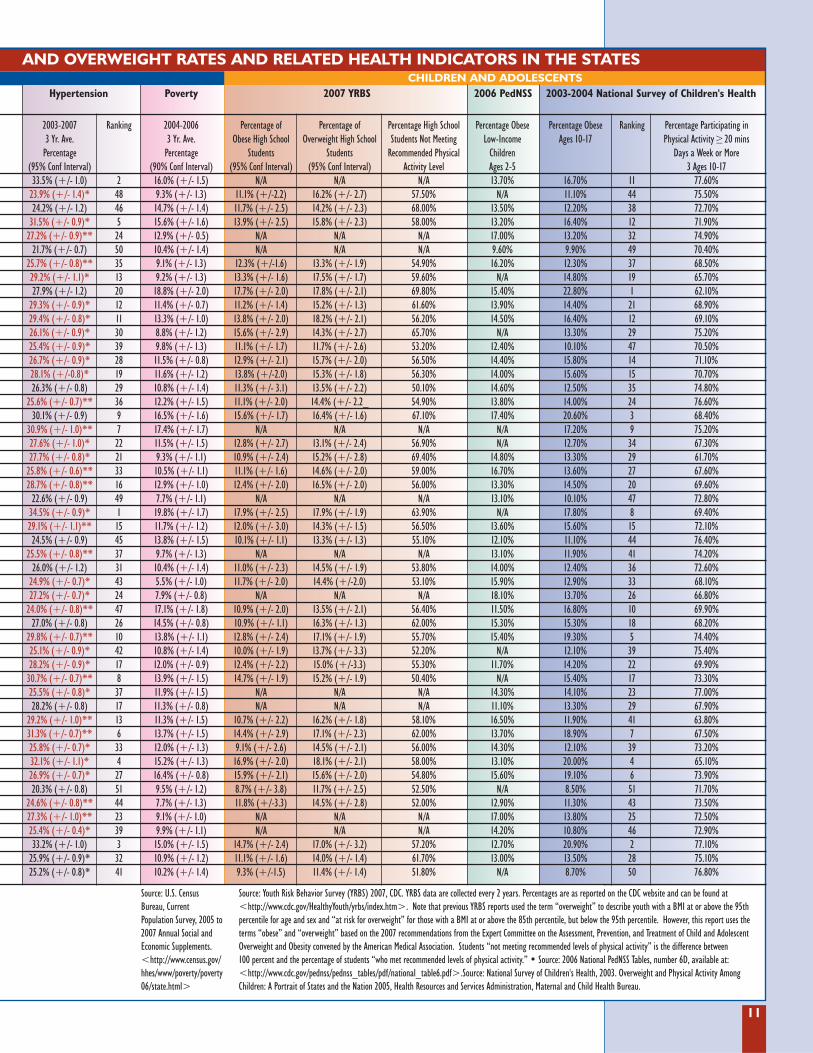
AND OVERWEIGHT RATES AND RELATED HEALTH INDICATORS IN THE STATES
Hypertension Poverty 2007 YRBS 2006 PedNSS 2003-2004 National Survey of Children's Health
2003-2007 Ranking 2004-2006 Percentage of Percentage of Percentage High School Percentage Obese Percentage Obese Ranking Percentage Participating in 3 Yr. Ave. 3 Yr. Ave. Obese High School Overweight High School Students Not Meeting Low-Income Ages 10-17 Physical Activity ≥ 20 mins
Percentage Percentage Students Students Recommended Physical Children Days a Week or More (95% Conf Interval) (90% Conf Interval) (95% Conf Interval) (95% Conf Interval) Activity Level Ages 2-5 3 Ages 10-17 33.5% (+/- 1.0) 2 16.0% (+/- 1.5) N/A N/A N/A 13.70% 16.70% 11 77.60%
23.9% (+/- 1.4)* 48 9.3% (+/- 1.3) 11.1% (+/-2.2) 16.2% (+/- 2.7) 57.50% N/A 11.10% 44 75.50%24.2% (+/- 1.2) 46 14.7% (+/- 1.4) 11.7% (+/- 2.5) 14.2% (+/- 2.3) 68.00% 13.50% 12.20% 38 72.70%
31.5% (+/- 0.9)* 5 15.6% (+/- 1.6) 13.9% (+/- 2.5) 15.8% (+/- 2.3) 58.00% 13.20% 16.40% 12 71.90%27.2% (+/- 0.9)** 24 12.9% (+/- 0.5) N/A N/A N/A 17.00% 13.20% 32 74.90%
21.7% (+/- 0.7) 50 10.4% (+/- 1.4) N/A N/A N/A 9.60% 9.90% 49 70.40%25.7% (+/- 0.8)** 35 9.1% (+/- 1.3) 12.3% (+/-1.6) 13.3% (+/- 1.9) 54.90% 16.20% 12.30% 37 68.50%29.2% (+/- 1.1)* 13 9.2% (+/- 1.3) 13.3% (+/- 1.6) 17.5% (+/- 1.7) 59.60% N/A 14.80% 19 65.70%27.9% (+/- 1.2) 20 18.8% (+/- 2.0) 17.7% (+/- 2.0) 17.8% (+/- 2.1) 69.80% 15.40% 22.80% 1 62.10%
29.3% (+/- 0.9)* 12 11.4% (+/- 0.7) 11.2% (+/- 1.4) 15.2% (+/- 1.3) 61.60% 13.90% 14.40% 21 68.90%29.4% (+/- 0.8)* 11 13.3% (+/- 1.0) 13.8% (+/- 2.0) 18.2% (+/- 2.1) 56.20% 14.50% 16.40% 12 69.10%26.1% (+/- 0.9)* 30 8.8% (+/- 1.2) 15.6% (+/- 2.9) 14.3% (+/- 2.7) 65.70% N/A 13.30% 29 75.20%25.4% (+/- 0.9)* 39 9.8% (+/- 1.3) 11.1% (+/- 1.7) 11.7% (+/- 2.6) 53.20% 12.40% 10.10% 47 70.50%26.7% (+/- 0.9)* 28 11.5% (+/- 0.8) 12.9% (+/- 2.1) 15.7% (+/- 2.0) 56.50% 14.40% 15.80% 14 71.10%28.1% (+/-0.8)* 19 11.6% (+/- 1.2) 13.8% (+/-2.0) 15.3% (+/- 1.8) 56.30% 14.00% 15.60% 15 70.70%26.3% (+/- 0.8) 29 10.8% (+/- 1.4) 11.3% (+/- 3.1) 13.5% (+/- 2.2) 50.10% 14.60% 12.50% 35 74.80%
25.6% (+/- 0.7)** 36 12.2% (+/- 1.5) 11.1% (+/- 2.0) 14.4% (+/- 2.2_ 54.90% 13.80% 14.00% 24 76.60%30.1% (+/- 0.9) 9 16.5% (+/- 1.6) 15.6% (+/- 1.7) 16.4% (+/- 1.6) 67.10% 17.40% 20.60% 3 68.40%
30.9% (+/- 1.0)** 7 17.4% (+/- 1.7) N/A N/A N/A N/A 17.20% 9 75.20%27.6% (+/- 1.0)* 22 11.5% (+/- 1.5) 12.8% (+/- 2.7) 13.1% (+/- 2.4) 56.90% N/A 12.70% 34 67.30%27.7% (+/- 0.8)* 21 9.3% (+/- 1.1) 10.9% (+/- 2.4) 15.2% (+/- 2.8) 69.40% 14.80% 13.30% 29 61.70%
25.8% (+/- 0.6)** 33 10.5% (+/- 1.1) 11.1% (+/- 1.6) 14.6% (+/- 2.0) 59.00% 16.70% 13.60% 27 67.60%28.7% (+/- 0.8)** 16 12.9% (+/- 1.0) 12.4% (+/- 2.0) 16.5% (+/- 2.0) 56.00% 13.30% 14.50% 20 69.60%
22.6% (+/- 0.9) 49 7.7% (+/- 1.1) N/A N/A N/A 13.10% 10.10% 47 72.80%34.5% (+/- 0.9)* 1 19.8% (+/- 1.7) 17.9% (+/- 2.5) 17.9% (+/- 1.9) 63.90% N/A 17.80% 8 69.40%29.1% (+/- 1.1)** 15 11.7% (+/- 1.2) 12.0% (+/- 3.0) 14.3% (+/- 1.5) 56.50% 13.60% 15.60% 15 72.10%24.5% (+/- 0.9) 45 13.8% (+/- 1.5) 10.1% (+/- 1.1) 13.3% (+/- 1.3) 55.10% 12.10% 11.10% 44 76.40%
25.5% (+/- 0.8)** 37 9.7% (+/- 1.3) N/A N/A N/A 13.10% 11.90% 41 74.20%26.0% (+/- 1.2) 31 10.4% (+/- 1.4) 11.0% (+/- 2.3) 14.5% (+/- 1.9) 53.80% 14.00% 12.40% 36 72.60%
24.9% (+/- 0.7)* 43 5.5% (+/- 1.0) 11.7% (+/- 2.0) 14.4% (+/-2.0) 53.10% 15.90% 12.90% 33 68.10%27.2% (+/- 0.7)* 24 7.9% (+/- 0.8) N/A N/A N/A 18.10% 13.70% 26 66.80%
24.0% (+/- 0.8)** 47 17.1% (+/- 1.8) 10.9% (+/- 2.0) 13.5% (+/- 2.1) 56.40% 11.50% 16.80% 10 69.90%27.0% (+/- 0.8) 26 14.5% (+/- 0.8) 10.9% (+/- 1.1) 16.3% (+/- 1.3) 62.00% 15.30% 15.30% 18 68.20%
29.8% (+/- 0.7)** 10 13.8% (+/- 1.1) 12.8% (+/- 2.4) 17.1% (+/- 1.9) 55.70% 15.40% 19.30% 5 74.40%25.1% (+/- 0.9)* 42 10.8% (+/- 1.4) 10.0% (+/- 1.9) 13.7% (+/- 3.3) 52.20% N/A 12.10% 39 75.40%28.2% (+/- 0.9)* 17 12.0% (+/- 0.9) 12.4% (+/- 2.2) 15.0% (+/-3.3) 55.30% 11.70% 14.20% 22 69.90%
30.7% (+/- 0.7)** 8 13.9% (+/- 1.5) 14.7% (+/- 1.9) 15.2% (+/- 1.9) 50.40% N/A 15.40% 17 73.30%25.5% (+/- 0.8)* 37 11.9% (+/- 1.5) N/A N/A N/A 14.30% 14.10% 23 77.00%28.2% (+/- 0.8) 17 11.3% (+/- 0.8) N/A N/A N/A 11.10% 13.30% 29 67.90%
29.2% (+/- 1.0)** 13 11.3% (+/- 1.5) 10.7% (+/- 2.2) 16.2% (+/- 1.8) 58.10% 16.50% 11.90% 41 63.80%31.3% (+/- 0.7)** 6 13.7% (+/- 1.5) 14.4% (+/- 2.9) 17.1% (+/- 2.3) 62.00% 13.70% 18.90% 7 67.50%25.8% (+/- 0.7)* 33 12.0% (+/- 1.3) 9.1% (+/- 2.6) 14.5% (+/- 2.1) 56.00% 14.30% 12.10% 39 73.20%32.1% (+/- 1.1)* 4 15.2% (+/- 1.3) 16.9% (+/- 2.0) 18.1% (+/- 2.1) 58.00% 13.10% 20.00% 4 65.10%26.9% (+/- 0.7)* 27 16.4% (+/- 0.8) 15.9% (+/- 2.1) 15.6% (+/- 2.0) 54.80% 15.60% 19.10% 6 73.90%20.3% (+/- 0.8) 51 9.5% (+/- 1.2) 8.7% (+/- 3.8) 11.7% (+/- 2.5) 52.50% N/A 8.50% 51 71.70%
24.6% (+/- 0.8)** 44 7.7% (+/- 1.3) 11.8% (+/-3.3) 14.5% (+/- 2.8) 52.00% 12.90% 11.30% 43 73.50%27.3% (+/- 1.0)** 23 9.1% (+/- 1.0) N/A N/A N/A 17.00% 13.80% 25 72.50%25.4% (+/- 0.4)* 39 9.9% (+/- 1.1) N/A N/A N/A 14.20% 10.80% 46 72.90%33.2% (+/- 1.0) 3 15.0% (+/- 1.5) 14.7% (+/- 2.4) 17.0% (+/- 3.2) 57.20% 12.70% 20.90% 2 77.10%
25.9% (+/- 0.9)* 32 10.9% (+/- 1.2) 11.1% (+/- 1.6) 14.0% (+/- 1.4) 61.70% 13.00% 13.50% 28 75.10%25.2% (+/- 0.8)* 41 10.2% (+/- 1.4) 9.3% (+/-1.5) 11.4% (+/- 1.4) 51.80% N/A 8.70% 50 76.80%
CHILDREN AND ADOLESCENTS
Source: U.S. CensusBureau, CurrentPopulation Survey, 2005 to2007 Annual Social andEconomic Supplements.<http://www.census.gov/hhes/www/poverty/poverty06/state.html>
Source: Youth Risk Behavior Survey (YRBS) 2007, CDC. YRBS data are collected every 2 years. Percentages are as reported on the CDC website and can be found at<http://www.cdc.gov/HealthyYouth/yrbs/index.htm>. Note that previous YRBS reports used the term “overweight” to describe youth with a BMI at or above the 95thpercentile for age and sex and “at risk for overweight” for those with a BMI at or above the 85th percentile, but below the 95th percentile. However, this report uses theterms “obese” and “overweight” based on the 2007 recommendations from the Expert Committee on the Assessment, Prevention, and Treatment of Child and AdolescentOverweight and Obesity convened by the American Medical Association. Students “not meeting recommended levels of physical activity” is the difference between 100 percent and the percentage of students “who met recommended levels of physical activity.” • Source: 2006 National PedNSS Tables, number 6D, available at:<http://www.cdc.gov/pednss/pednss_tables/pdf/national_table6.pdf>.Source: National Survey of Children's Health, 2003. Overweight and Physical Activity AmongChildren: A Portrait of States and the Nation 2005, Health Resources and Services Administration, Maternal and Child Health Bureau.
12
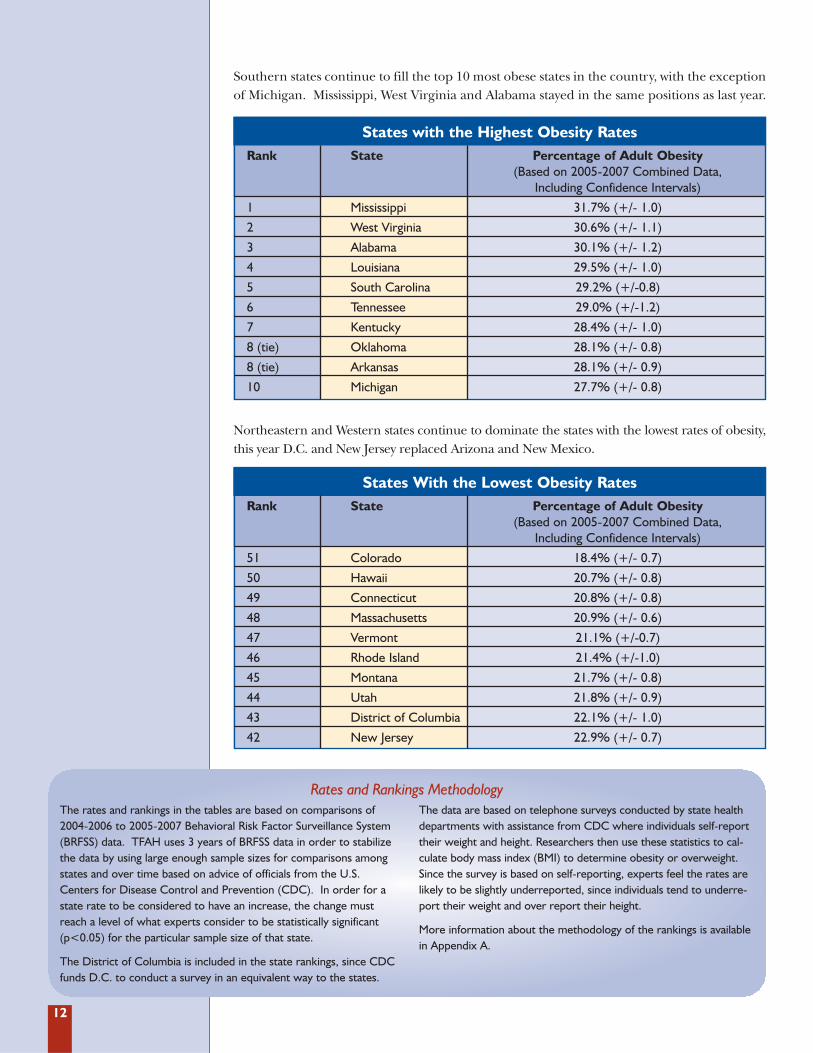
Southern states continue to fill the top 10 most obese states in the country, with the exceptionof Michigan. Mississippi, West Virginia and Alabama stayed in the same positions as last year.
States with the Highest Obesity RatesRank State Percentage of Adult Obesity
(Based on 2005-2007 Combined Data, Including Confidence Intervals)
1 Mississippi 31.7% (+/- 1.0)
2 West Virginia 30.6% (+/- 1.1)
3 Alabama 30.1% (+/- 1.2)
4 Louisiana 29.5% (+/- 1.0)
5 South Carolina 29.2% (+/-0.8)
6 Tennessee 29.0% (+/-1.2)
7 Kentucky 28.4% (+/- 1.0)
8 (tie) Oklahoma 28.1% (+/- 0.8)
8 (tie) Arkansas 28.1% (+/- 0.9)
10 Michigan 27.7% (+/- 0.8)
Northeastern and Western states continue to dominate the states with the lowest rates of obesity,this year D.C. and New Jersey replaced Arizona and New Mexico.
States With the Lowest Obesity RatesRank State Percentage of Adult Obesity
(Based on 2005-2007 Combined Data, Including Confidence Intervals)
51 Colorado 18.4% (+/- 0.7)
50 Hawaii 20.7% (+/- 0.8)
49 Connecticut 20.8% (+/- 0.8)
48 Massachusetts 20.9% (+/- 0.6)
47 Vermont 21.1% (+/-0.7)
46 Rhode Island 21.4% (+/-1.0)
45 Montana 21.7% (+/- 0.8)
44 Utah 21.8% (+/- 0.9)
43 District of Columbia 22.1% (+/- 1.0)
42 New Jersey 22.9% (+/- 0.7)
The rates and rankings in the tables are based on comparisons of2004-2006 to 2005-2007 Behavioral Risk Factor Surveillance System(BRFSS) data. TFAH uses 3 years of BRFSS data in order to stabilizethe data by using large enough sample sizes for comparisons amongstates and over time based on advice of officials from the U.S.Centers for Disease Control and Prevention (CDC). In order for astate rate to be considered to have an increase, the change mustreach a level of what experts consider to be statistically significant(p<0.05) for the particular sample size of that state.
The District of Columbia is included in the state rankings, since CDCfunds D.C. to conduct a survey in an equivalent way to the states.
The data are based on telephone surveys conducted by state healthdepartments with assistance from CDC where individuals self-reporttheir weight and height. Researchers then use these statistics to cal-culate body mass index (BMI) to determine obesity or overweight.Since the survey is based on self-reporting, experts feel the rates arelikely to be slightly underreported, since individuals tend to underre-port their weight and over report their height.
More information about the methodology of the rankings is availablein Appendix A.
Rates and Rankings Methodology
13
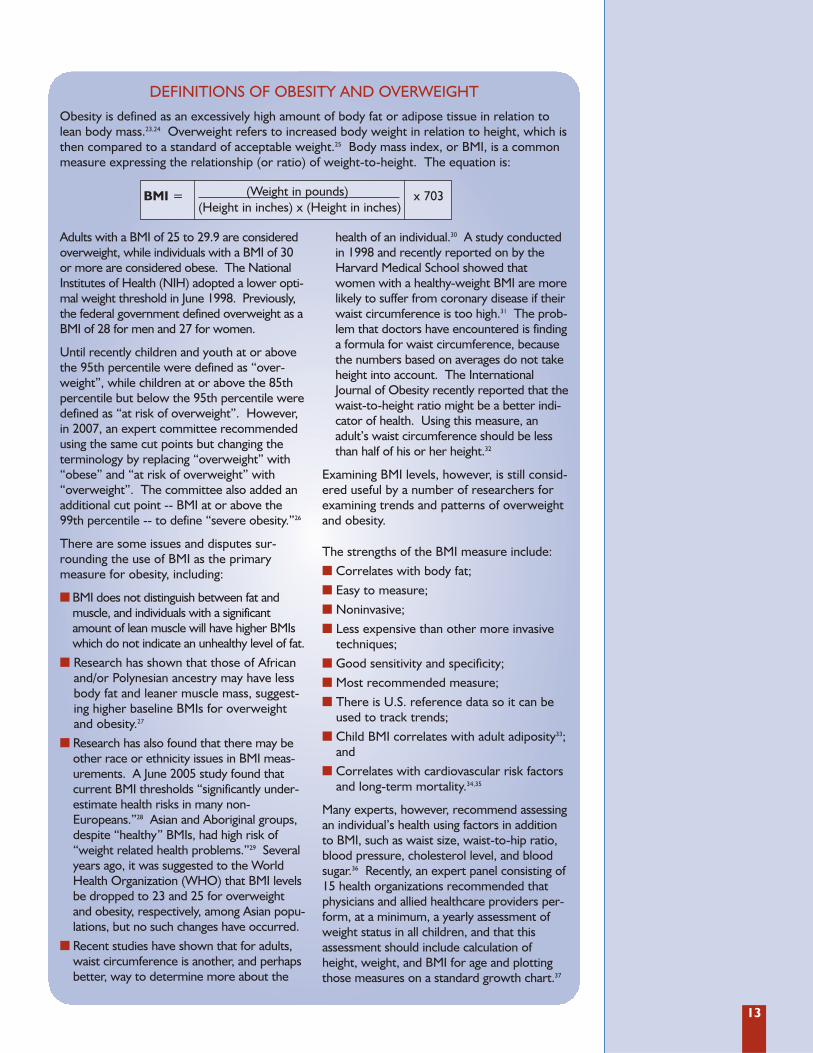
DEFINITIONS OF OBESITY AND OVERWEIGHT Obesity is defined as an excessively high amount of body fat or adipose tissue in relation tolean body mass.23,24 Overweight refers to increased body weight in relation to height, which isthen compared to a standard of acceptable weight.25 Body mass index, or BMI, is a commonmeasure expressing the relationship (or ratio) of weight-to-height. The equation is:
BMI = (Weight in pounds) x 703(Height in inches) x (Height in inches)
Adults with a BMI of 25 to 29.9 are consideredoverweight, while individuals with a BMI of 30or more are considered obese. The NationalInstitutes of Health (NIH) adopted a lower opti-mal weight threshold in June 1998. Previously,the federal government defined overweight as aBMI of 28 for men and 27 for women.
Until recently children and youth at or abovethe 95th percentile were defined as “over-weight”, while children at or above the 85thpercentile but below the 95th percentile weredefined as “at risk of overweight”. However,in 2007, an expert committee recommendedusing the same cut points but changing theterminology by replacing “overweight” with“obese” and “at risk of overweight” with“overweight”. The committee also added anadditional cut point -- BMI at or above the99th percentile -- to define “severe obesity.”26
There are some issues and disputes sur-rounding the use of BMI as the primarymeasure for obesity, including:
� BMI does not distinguish between fat andmuscle, and individuals with a significantamount of lean muscle will have higher BMIswhich do not indicate an unhealthy level of fat.
� Research has shown that those of Africanand/or Polynesian ancestry may have lessbody fat and leaner muscle mass, suggest-ing higher baseline BMIs for overweightand obesity.27
� Research has also found that there may beother race or ethnicity issues in BMI meas-urements. A June 2005 study found thatcurrent BMI thresholds “significantly under-estimate health risks in many non-Europeans.”28 Asian and Aboriginal groups,despite “healthy” BMIs, had high risk of“weight related health problems.”29 Severalyears ago, it was suggested to the WorldHealth Organization (WHO) that BMI levelsbe dropped to 23 and 25 for overweightand obesity, respectively, among Asian popu-lations, but no such changes have occurred.
� Recent studies have shown that for adults,waist circumference is another, and perhapsbetter, way to determine more about the
health of an individual.30 A study conductedin 1998 and recently reported on by theHarvard Medical School showed thatwomen with a healthy-weight BMI are morelikely to suffer from coronary disease if theirwaist circumference is too high.31 The prob-lem that doctors have encountered is findinga formula for waist circumference, becausethe numbers based on averages do not takeheight into account. The InternationalJournal of Obesity recently reported that thewaist-to-height ratio might be a better indi-cator of health. Using this measure, anadult’s waist circumference should be lessthan half of his or her height.32
Examining BMI levels, however, is still consid-ered useful by a number of researchers forexamining trends and patterns of overweightand obesity.
The strengths of the BMI measure include:� Correlates with body fat;� Easy to measure;� Noninvasive;� Less expensive than other more invasive
techniques;� Good sensitivity and specificity;� Most recommended measure;� There is U.S. reference data so it can be
used to track trends;� Child BMI correlates with adult adiposity33;
and � Correlates with cardiovascular risk factors
and long-term mortality.34,35
Many experts, however, recommend assessingan individual’s health using factors in additionto BMI, such as waist size, waist-to-hip ratio,blood pressure, cholesterol level, and bloodsugar.36 Recently, an expert panel consisting of15 health organizations recommended thatphysicians and allied healthcare providers per-form, at a minimum, a yearly assessment ofweight status in all children, and that thisassessment should include calculation ofheight, weight, and BMI for age and plottingthose measures on a standard growth chart.37
14
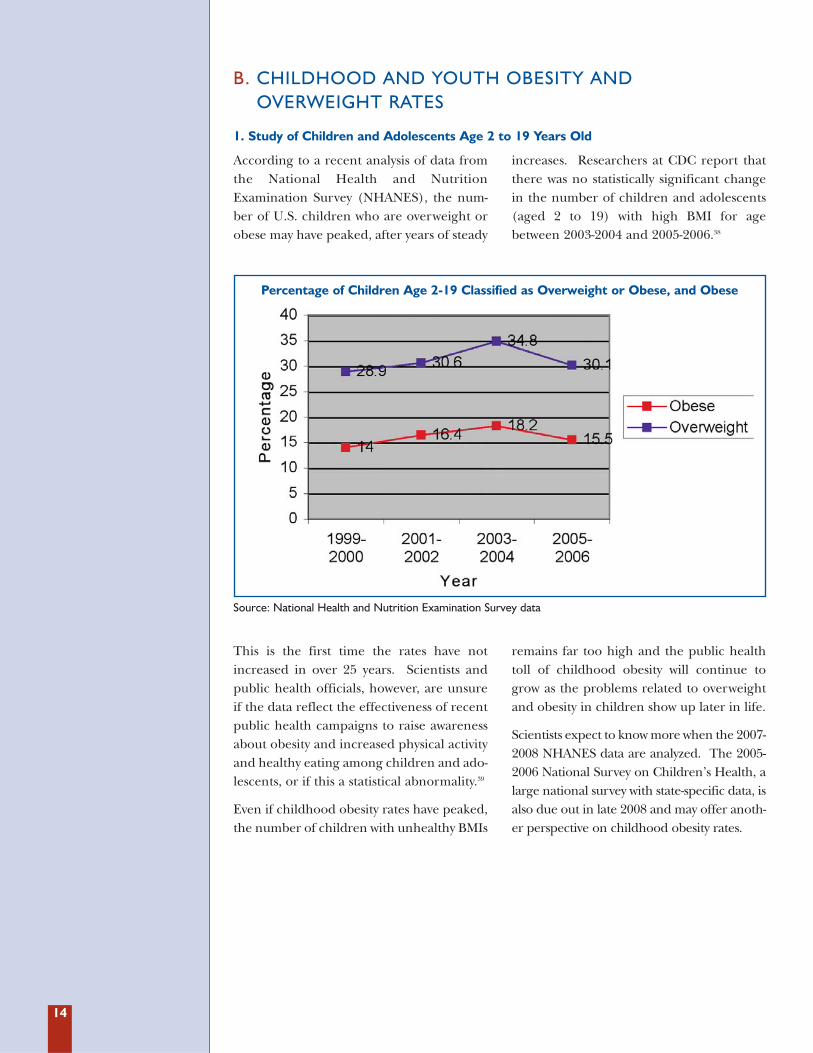
According to a recent analysis of data fromthe National Health and NutritionExamination Survey (NHANES), the num-ber of U.S. children who are overweight orobese may have peaked, after years of steady
increases. Researchers at CDC report thatthere was no statistically significant changein the number of children and adolescents(aged 2 to 19) with high BMI for agebetween 2003-2004 and 2005-2006.38
1. Study of Children and Adolescents Age 2 to 19 Years Old
This is the first time the rates have notincreased in over 25 years. Scientists andpublic health officials, however, are unsureif the data reflect the effectiveness of recentpublic health campaigns to raise awarenessabout obesity and increased physical activityand healthy eating among children and ado-lescents, or if this a statistical abnormality.39
Even if childhood obesity rates have peaked,the number of children with unhealthy BMIs
remains far too high and the public healthtoll of childhood obesity will continue togrow as the problems related to overweightand obesity in children show up later in life.
Scientists expect to know more when the 2007-2008 NHANES data are analyzed. The 2005-2006 National Survey on Children’s Health, alarge national survey with state-specific data, isalso due out in late 2008 and may offer anoth-er perspective on childhood obesity rates.
B. CHILDHOOD AND YOUTH OBESITY AND OVERWEIGHT RATES
Percentage of Children Age 2-19 Classified as Overweight or Obese, and Obese
Source: National Health and Nutrition Examination Survey data
15
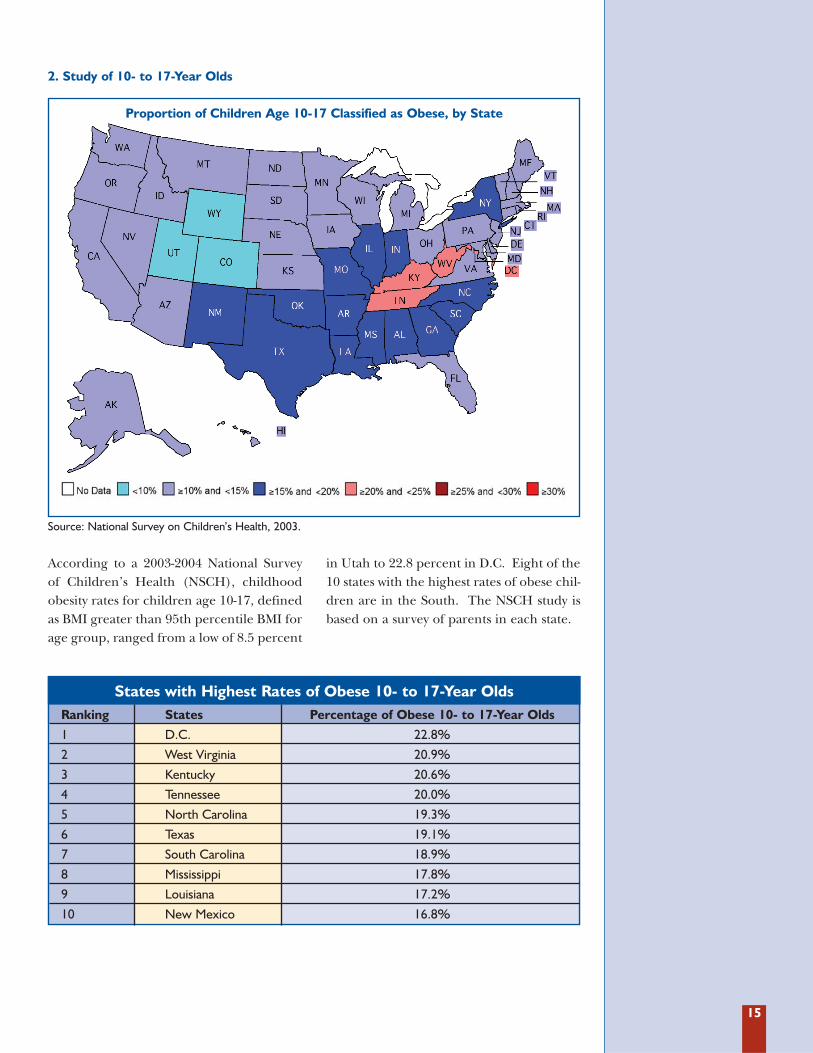
According to a 2003-2004 National Surveyof Children’s Health (NSCH), childhoodobesity rates for children age 10-17, definedas BMI greater than 95th percentile BMI forage group, ranged from a low of 8.5 percent
in Utah to 22.8 percent in D.C. Eight of the10 states with the highest rates of obese chil-dren are in the South. The NSCH study isbased on a survey of parents in each state.
2. Study of 10- to 17-Year Olds
States with Highest Rates of Obese 10- to 17-Year OldsRanking States Percentage of Obese 10- to 17-Year Olds
1 D.C. 22.8%
2 West Virginia 20.9%
3 Kentucky 20.6%
4 Tennessee 20.0%
5 North Carolina 19.3%
6 Texas 19.1%
7 South Carolina 18.9%
8 Mississippi 17.8%
9 Louisiana 17.2%
10 New Mexico 16.8%
Proportion of Children Age 10-17 Classified as Obese, by State
Source: National Survey on Children’s Health, 2003.
16
Six of the states with the lowest rates of obese 10- to 17-year olds are in the West.
3. Survey of High School StudentsAccording to the 2007 national Youth RiskBehavior Survey (YRBS), a survey of U.S.high school students, 13 percent of studentsare obese and 15.8 percent of students areoverweight.41 Although these numbers werevirtually unchanged since the 2005 nationalYRBS, the latest biennial survey did reveal anupward trend from 1999 to 2007 in the preva-lence of students nationwide who were obese(10.7 percent to 13.0 percent) and who wereoverweight (14.4 percent to 15.8 percent).
In 2007, YRBS data from 39 states indicatedthat obesity rates among high school stu-dents ranged from a low of 8.7 percent inUtah to a high of 17.9 percent in Mississippi,with a median obesity rate of 12 percent.Overweight rates among high school stu-dents ranged from a low of 11.4 percent inWyoming to a high of 18.2 percent inGeorgia, with a median overweight rate of15.0 percent. Thirty-nine states and D.C.participated in the survey
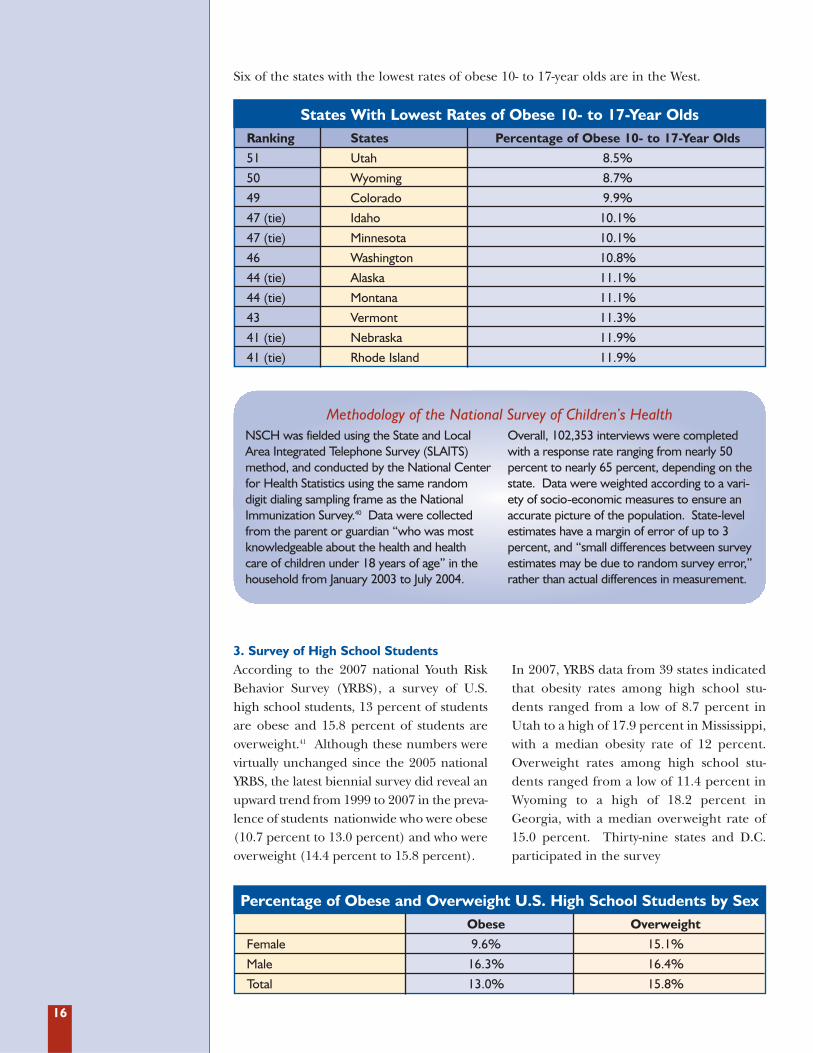
Percentage of Obese and Overweight U.S. High School Students by SexObese Overweight
Female 9.6% 15.1%
Male 16.3% 16.4%
Total 13.0% 15.8%
States With Lowest Rates of Obese 10- to 17-Year OldsRanking States Percentage of Obese 10- to 17-Year Olds
51 Utah 8.5%
50 Wyoming 8.7%
49 Colorado 9.9%
47 (tie) Idaho 10.1%
47 (tie) Minnesota 10.1%
46 Washington 10.8%
44 (tie) Alaska 11.1%
44 (tie) Montana 11.1%
43 Vermont 11.3%
41 (tie) Nebraska 11.9%
41 (tie) Rhode Island 11.9%
Methodology of the National Survey of Children’s HealthNSCH was fielded using the State and LocalArea Integrated Telephone Survey (SLAITS)method, and conducted by the National Centerfor Health Statistics using the same randomdigit dialing sampling frame as the NationalImmunization Survey.40 Data were collectedfrom the parent or guardian “who was mostknowledgeable about the health and healthcare of children under 18 years of age” in thehousehold from January 2003 to July 2004.
Overall, 102,353 interviews were completedwith a response rate ranging from nearly 50percent to nearly 65 percent, depending on thestate. Data were weighted according to a vari-ety of socio-economic measures to ensure anaccurate picture of the population. State-levelestimates have a margin of error of up to 3percent, and “small differences between surveyestimates may be due to random survey error,”rather than actual differences in measurement.
17
*Note: Non-Hispanic
4. Study of Low-Income Children Aged 2-5A survey of low-income children aged 2-5called the Pediatric Nutrition SurveillanceSurvey (PedNSS) found that 14.8 percent of
these children are obese and 16.4 percentare overweight.42 Forty states and D.C. par-ticipated in the survey.
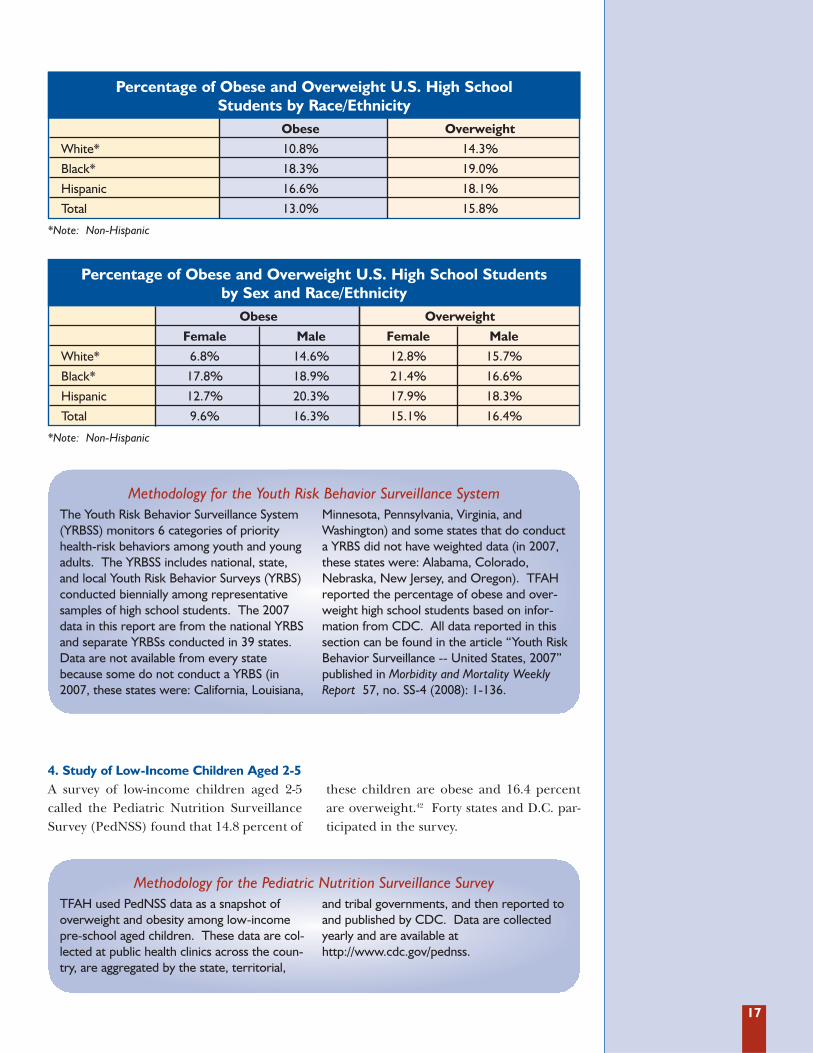
Percentage of Obese and Overweight U.S. High School Students by Race/Ethnicity
Obese Overweight
White* 10.8% 14.3%
Black* 18.3% 19.0%
Hispanic 16.6% 18.1%
Total 13.0% 15.8%
*Note: Non-Hispanic
Percentage of Obese and Overweight U.S. High School Students by Sex and Race/Ethnicity
Obese Overweight
Female Male Female Male
White* 6.8% 14.6% 12.8% 15.7%
Black* 17.8% 18.9% 21.4% 16.6%
Hispanic 12.7% 20.3% 17.9% 18.3%
Total 9.6% 16.3% 15.1% 16.4%
Methodology for the Youth Risk Behavior Surveillance SystemThe Youth Risk Behavior Surveillance System(YRBSS) monitors 6 categories of priorityhealth-risk behaviors among youth and youngadults. The YRBSS includes national, state,and local Youth Risk Behavior Surveys (YRBS)conducted biennially among representativesamples of high school students. The 2007data in this report are from the national YRBSand separate YRBSs conducted in 39 states.Data are not available from every statebecause some do not conduct a YRBS (in2007, these states were: California, Louisiana,
Minnesota, Pennsylvania, Virginia, andWashington) and some states that do conducta YRBS did not have weighted data (in 2007,these states were: Alabama, Colorado,Nebraska, New Jersey, and Oregon). TFAHreported the percentage of obese and over-weight high school students based on infor-mation from CDC. All data reported in thissection can be found in the article “Youth RiskBehavior Surveillance -- United States, 2007”published in Morbidity and Mortality WeeklyReport 57, no. SS-4 (2008): 1-136.
Methodology for the Pediatric Nutrition Surveillance SurveyTFAH used PedNSS data as a snapshot ofoverweight and obesity among low-incomepre-school aged children. These data are col-lected at public health clinics across the coun-try, are aggregated by the state, territorial,
and tribal governments, and then reported toand published by CDC. Data are collectedyearly and are available athttp://www.cdc.gov/pednss.
18
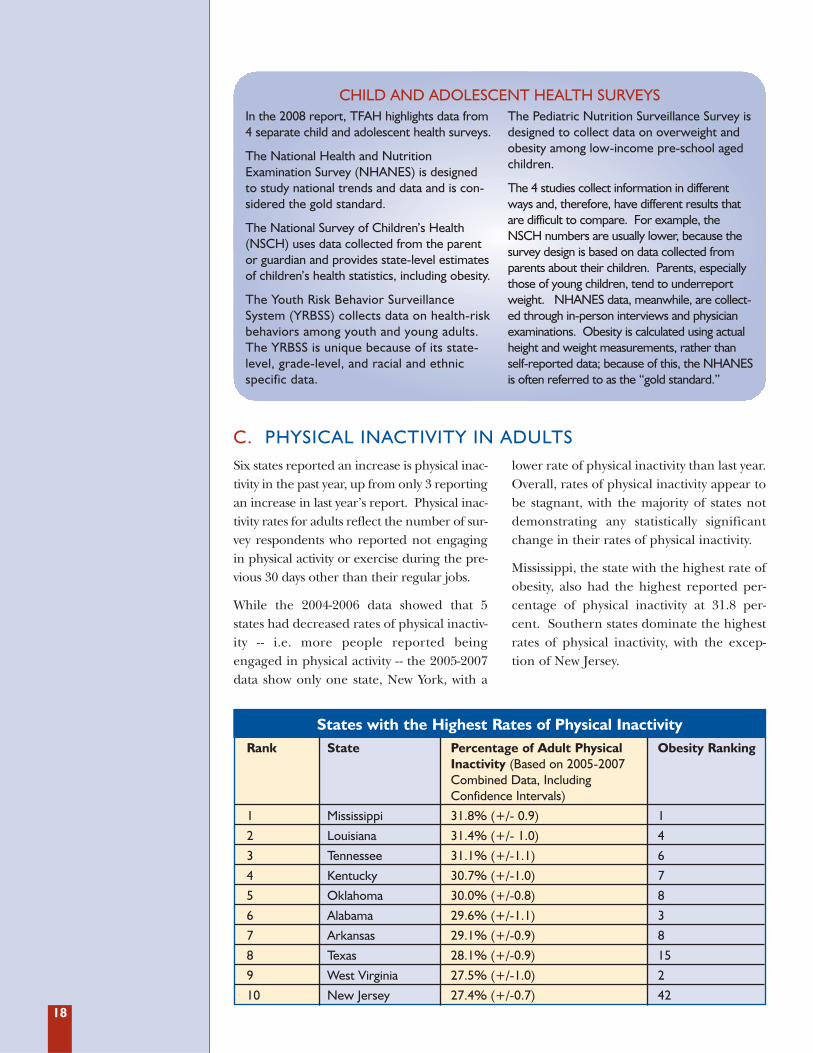
States with the Highest Rates of Physical Inactivity Rank State Percentage of Adult Physical Obesity Ranking
Inactivity (Based on 2005-2007 Combined Data, Including Confidence Intervals)
1 Mississippi 31.8% (+/- 0.9) 1
2 Louisiana 31.4% (+/- 1.0) 4
3 Tennessee 31.1% (+/-1.1) 6
4 Kentucky 30.7% (+/-1.0) 7
5 Oklahoma 30.0% (+/-0.8) 8
6 Alabama 29.6% (+/-1.1) 3
7 Arkansas 29.1% (+/-0.9) 8
8 Texas 28.1% (+/-0.9) 15
9 West Virginia 27.5% (+/-1.0) 2
10 New Jersey 27.4% (+/-0.7) 42
CHILD AND ADOLESCENT HEALTH SURVEYSIn the 2008 report, TFAH highlights data from4 separate child and adolescent health surveys.
The National Health and NutritionExamination Survey (NHANES) is designedto study national trends and data and is con-sidered the gold standard.
The National Survey of Children’s Health(NSCH) uses data collected from the parentor guardian and provides state-level estimatesof children’s health statistics, including obesity.
The Youth Risk Behavior SurveillanceSystem (YRBSS) collects data on health-riskbehaviors among youth and young adults.The YRBSS is unique because of its state-level, grade-level, and racial and ethnicspecific data.
The Pediatric Nutrition Surveillance Survey isdesigned to collect data on overweight andobesity among low-income pre-school agedchildren.
The 4 studies collect information in differentways and, therefore, have different results thatare difficult to compare. For example, theNSCH numbers are usually lower, because thesurvey design is based on data collected fromparents about their children. Parents, especiallythose of young children, tend to underreportweight. NHANES data, meanwhile, are collect-ed through in-person interviews and physicianexaminations. Obesity is calculated using actualheight and weight measurements, rather thanself-reported data; because of this, the NHANESis often referred to as the “gold standard.”
Six states reported an increase is physical inac-tivity in the past year, up from only 3 reportingan increase in last year’s report. Physical inac-tivity rates for adults reflect the number of sur-vey respondents who reported not engagingin physical activity or exercise during the pre-vious 30 days other than their regular jobs.
While the 2004-2006 data showed that 5states had decreased rates of physical inactiv-ity -- i.e. more people reported beingengaged in physical activity -- the 2005-2007data show only one state, New York, with a
lower rate of physical inactivity than last year.Overall, rates of physical inactivity appear tobe stagnant, with the majority of states notdemonstrating any statistically significantchange in their rates of physical inactivity.
Mississippi, the state with the highest rate ofobesity, also had the highest reported per-centage of physical inactivity at 31.8 per-cent. Southern states dominate the highestrates of physical inactivity, with the excep-tion of New Jersey.
C. PHYSICAL INACTIVITY IN ADULTS
19
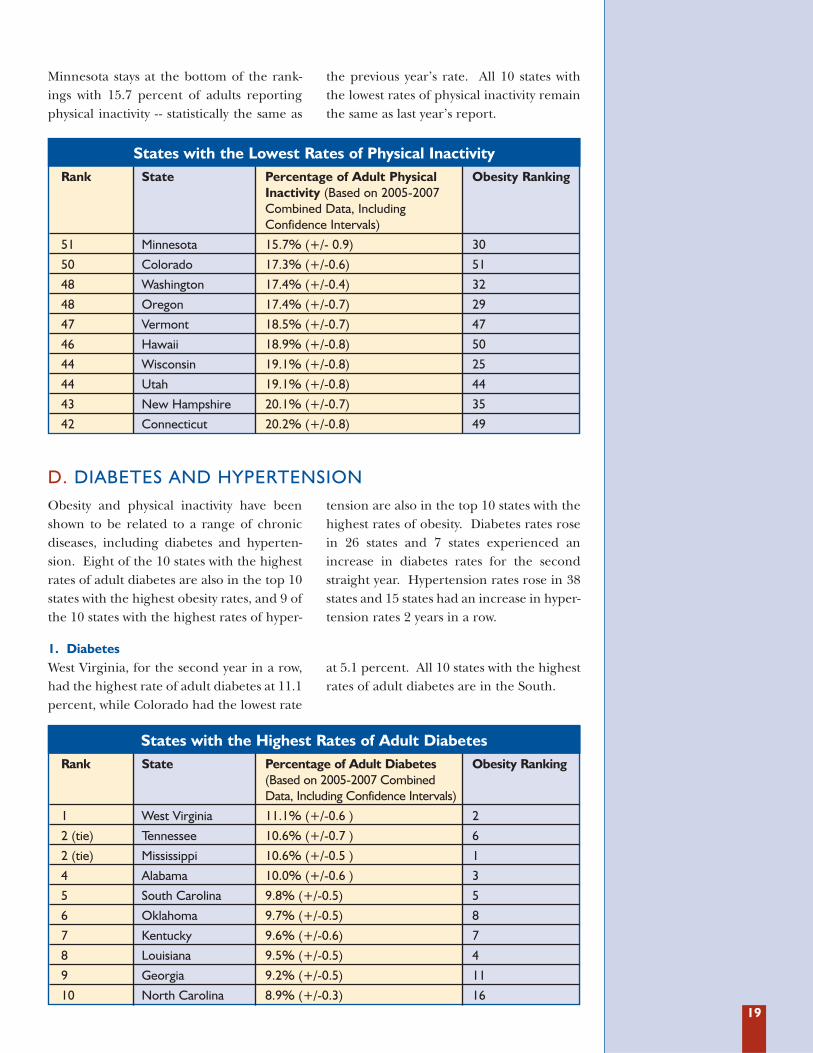
Minnesota stays at the bottom of the rank-ings with 15.7 percent of adults reportingphysical inactivity - - statistically the same as
the previous year’s rate. All 10 states withthe lowest rates of physical inactivity remainthe same as last year’s report.
States with the Lowest Rates of Physical Inactivity Rank State Percentage of Adult Physical Obesity Ranking
Inactivity (Based on 2005-2007 Combined Data, Including Confidence Intervals)
51 Minnesota 15.7% (+/- 0.9) 30
50 Colorado 17.3% (+/-0.6) 51
48 Washington 17.4% (+/-0.4) 32
48 Oregon 17.4% (+/-0.7) 29
47 Vermont 18.5% (+/-0.7) 47
46 Hawaii 18.9% (+/-0.8) 50
44 Wisconsin 19.1% (+/-0.8) 25
44 Utah 19.1% (+/-0.8) 44
43 New Hampshire 20.1% (+/-0.7) 35
42 Connecticut 20.2% (+/-0.8) 49
States with the Highest Rates of Adult Diabetes Rank State Percentage of Adult Diabetes Obesity Ranking
(Based on 2005-2007 Combined Data, Including Confidence Intervals)
1 West Virginia 11.1% (+/-0.6 ) 2
2 (tie) Tennessee 10.6% (+/-0.7 ) 6
2 (tie) Mississippi 10.6% (+/-0.5 ) 1
4 Alabama 10.0% (+/-0.6 ) 3
5 South Carolina 9.8% (+/-0.5) 5
6 Oklahoma 9.7% (+/-0.5) 8
7 Kentucky 9.6% (+/-0.6) 7
8 Louisiana 9.5% (+/-0.5) 4
9 Georgia 9.2% (+/-0.5) 11
10 North Carolina 8.9% (+/-0.3) 16
Obesity and physical inactivity have beenshown to be related to a range of chronicdiseases, including diabetes and hyperten-sion. Eight of the 10 states with the highestrates of adult diabetes are also in the top 10states with the highest obesity rates, and 9 ofthe 10 states with the highest rates of hyper-
tension are also in the top 10 states with thehighest rates of obesity. Diabetes rates rosein 26 states and 7 states experienced anincrease in diabetes rates for the secondstraight year. Hypertension rates rose in 38states and 15 states had an increase in hyper-tension rates 2 years in a row.
D. DIABETES AND HYPERTENSION
1. DiabetesWest Virginia, for the second year in a row,had the highest rate of adult diabetes at 11.1percent, while Colorado had the lowest rate
at 5.1 percent. All 10 states with the highestrates of adult diabetes are in the South.
20
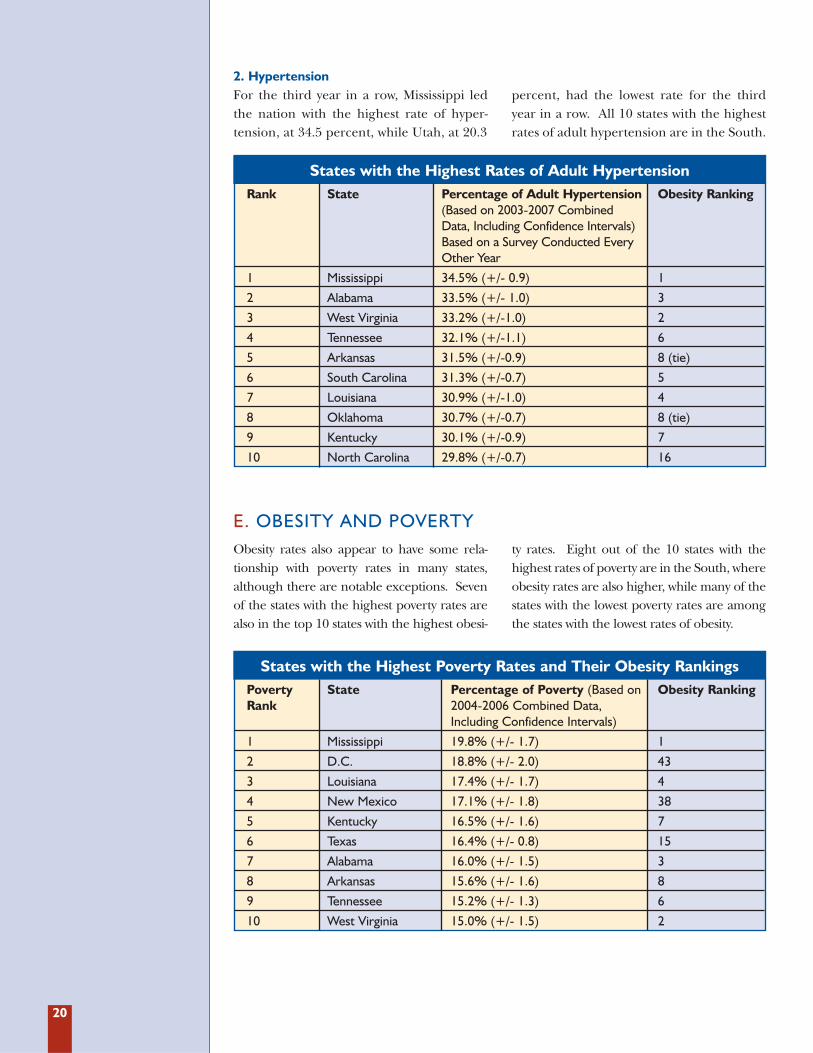
States with the Highest Poverty Rates and Their Obesity Rankings Poverty State Percentage of Poverty (Based on Obesity RankingRank 2004-2006 Combined Data,
Including Confidence Intervals)
1 Mississippi 19.8% (+/- 1.7) 1
2 D.C. 18.8% (+/- 2.0) 43
3 Louisiana 17.4% (+/- 1.7) 4
4 New Mexico 17.1% (+/- 1.8) 38
5 Kentucky 16.5% (+/- 1.6) 7
6 Texas 16.4% (+/- 0.8) 15
7 Alabama 16.0% (+/- 1.5) 3
8 Arkansas 15.6% (+/- 1.6) 8
9 Tennessee 15.2% (+/- 1.3) 6
10 West Virginia 15.0% (+/- 1.5) 2
2. HypertensionFor the third year in a row, Mississippi ledthe nation with the highest rate of hyper-tension, at 34.5 percent, while Utah, at 20.3
percent, had the lowest rate for the thirdyear in a row. All 10 states with the highestrates of adult hypertension are in the South.
States with the Highest Rates of Adult Hypertension Rank State Percentage of Adult Hypertension Obesity Ranking
(Based on 2003-2007 Combined Data, Including Confidence Intervals) Based on a Survey Conducted Every Other Year
1 Mississippi 34.5% (+/- 0.9) 1
2 Alabama 33.5% (+/- 1.0) 3
3 West Virginia 33.2% (+/-1.0) 2
4 Tennessee 32.1% (+/-1.1) 6
5 Arkansas 31.5% (+/-0.9) 8 (tie)
6 South Carolina 31.3% (+/-0.7) 5
7 Louisiana 30.9% (+/-1.0) 4
8 Oklahoma 30.7% (+/-0.7) 8 (tie)
9 Kentucky 30.1% (+/-0.9) 7
10 North Carolina 29.8% (+/-0.7) 16
Obesity rates also appear to have some rela-tionship with poverty rates in many states,although there are notable exceptions. Sevenof the states with the highest poverty rates arealso in the top 10 states with the highest obesi-
ty rates. Eight out of the 10 states with thehighest rates of poverty are in the South, whereobesity rates are also higher, while many of thestates with the lowest poverty rates are amongthe states with the lowest rates of obesity.
E. OBESITY AND POVERTY
21
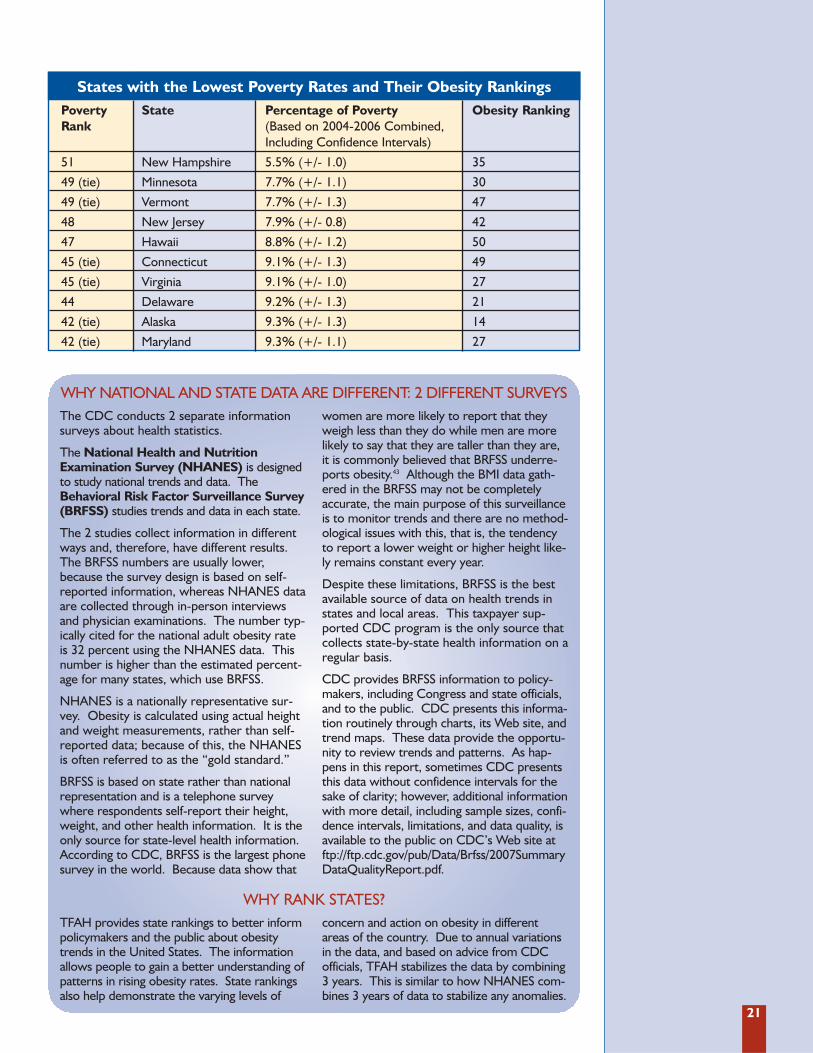
States with the Lowest Poverty Rates and Their Obesity RankingsPoverty State Percentage of Poverty Obesity RankingRank (Based on 2004-2006 Combined,
Including Confidence Intervals)
51 New Hampshire 5.5% (+/- 1.0) 35
49 (tie) Minnesota 7.7% (+/- 1.1) 30
49 (tie) Vermont 7.7% (+/- 1.3) 47
48 New Jersey 7.9% (+/- 0.8) 42
47 Hawaii 8.8% (+/- 1.2) 50
45 (tie) Connecticut 9.1% (+/- 1.3) 49
45 (tie) Virginia 9.1% (+/- 1.0) 27
44 Delaware 9.2% (+/- 1.3) 21
42 (tie) Alaska 9.3% (+/- 1.3) 14
42 (tie) Maryland 9.3% (+/- 1.1) 27
WHY NATIONAL AND STATE DATA ARE DIFFERENT: 2 DIFFERENT SURVEYSThe CDC conducts 2 separate informationsurveys about health statistics.
The National Health and NutritionExamination Survey (NHANES) is designedto study national trends and data. TheBehavioral Risk Factor Surveillance Survey(BRFSS) studies trends and data in each state.
The 2 studies collect information in differentways and, therefore, have different results.The BRFSS numbers are usually lower,because the survey design is based on self-reported information, whereas NHANES dataare collected through in-person interviewsand physician examinations. The number typ-ically cited for the national adult obesity rateis 32 percent using the NHANES data. Thisnumber is higher than the estimated percent-age for many states, which use BRFSS.
NHANES is a nationally representative sur-vey. Obesity is calculated using actual heightand weight measurements, rather than self-reported data; because of this, the NHANESis often referred to as the “gold standard.”
BRFSS is based on state rather than nationalrepresentation and is a telephone surveywhere respondents self-report their height,weight, and other health information. It is theonly source for state-level health information.According to CDC, BRFSS is the largest phonesurvey in the world. Because data show that
women are more likely to report that theyweigh less than they do while men are morelikely to say that they are taller than they are,it is commonly believed that BRFSS underre-ports obesity.43 Although the BMI data gath-ered in the BRFSS may not be completelyaccurate, the main purpose of this surveillanceis to monitor trends and there are no method-ological issues with this, that is, the tendencyto report a lower weight or higher height like-ly remains constant every year.
Despite these limitations, BRFSS is the bestavailable source of data on health trends instates and local areas. This taxpayer sup-ported CDC program is the only source thatcollects state-by-state health information on aregular basis.
CDC provides BRFSS information to policy-makers, including Congress and state officials,and to the public. CDC presents this informa-tion routinely through charts, its Web site, andtrend maps. These data provide the opportu-nity to review trends and patterns. As hap-pens in this report, sometimes CDC presentsthis data without confidence intervals for thesake of clarity; however, additional informationwith more detail, including sample sizes, confi-dence intervals, limitations, and data quality, isavailable to the public on CDC’s Web site atftp://ftp.cdc.gov/pub/Data/Brfss/2007SummaryDataQualityReport.pdf.
WHY RANK STATES?TFAH provides state rankings to better informpolicymakers and the public about obesitytrends in the United States. The informationallows people to gain a better understanding ofpatterns in rising obesity rates. State rankingsalso help demonstrate the varying levels of
concern and action on obesity in differentareas of the country. Due to annual variationsin the data, and based on advice from CDCofficials, TFAH stabilizes the data by combining3 years. This is similar to how NHANES com-bines 3 years of data to stabilize any anomalies.

23
Fast Facts About Obesity 2S E C T I O N
A. WHAT’S BEHIND THE OBESITY EPIDEMIC?
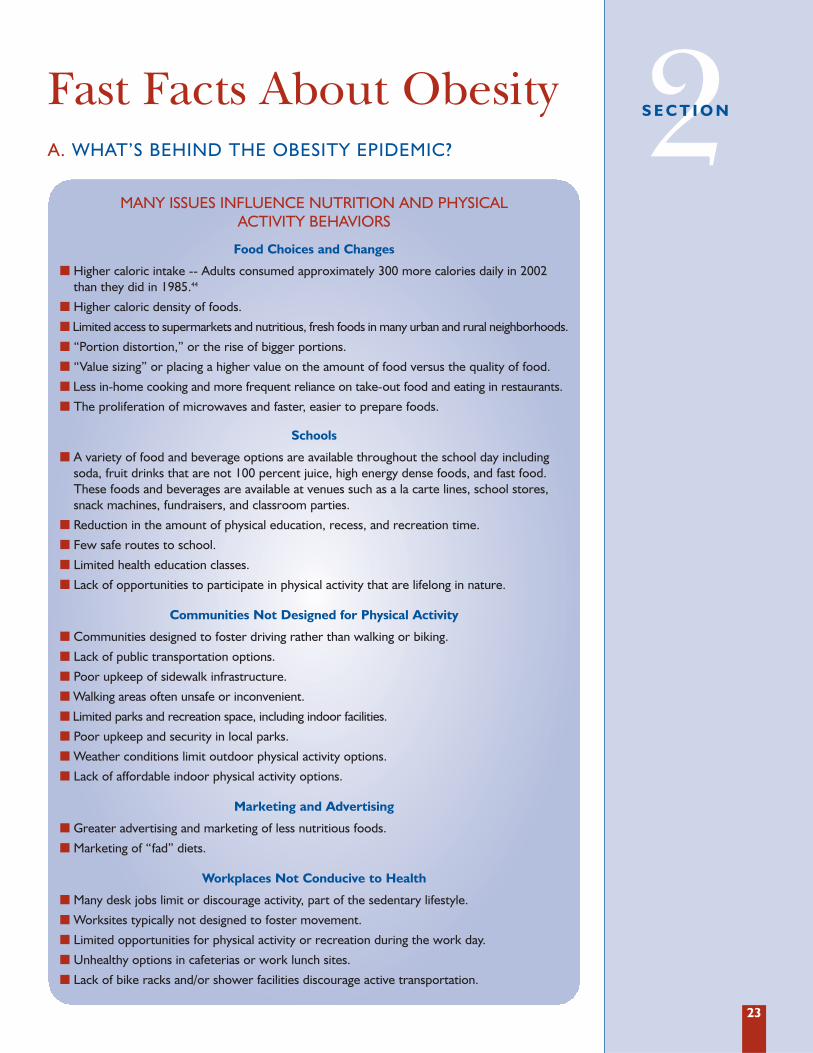
MANY ISSUES INFLUENCE NUTRITION AND PHYSICAL ACTIVITY BEHAVIORS
� Higher caloric intake -- Adults consumed approximately 300 more calories daily in 2002than they did in 1985.44
� Higher caloric density of foods.
� Limited access to supermarkets and nutritious, fresh foods in many urban and rural neighborhoods.
� “Portion distortion,” or the rise of bigger portions.
� “Value sizing” or placing a higher value on the amount of food versus the quality of food.
� Less in-home cooking and more frequent reliance on take-out food and eating in restaurants.
� The proliferation of microwaves and faster, easier to prepare foods.
Food Choices and Changes
� A variety of food and beverage options are available throughout the school day includingsoda, fruit drinks that are not 100 percent juice, high energy dense foods, and fast food.These foods and beverages are available at venues such as a la carte lines, school stores,snack machines, fundraisers, and classroom parties.
� Reduction in the amount of physical education, recess, and recreation time.
� Few safe routes to school.
� Limited health education classes.
� Lack of opportunities to participate in physical activity that are lifelong in nature.
Schools
� Communities designed to foster driving rather than walking or biking.
� Lack of public transportation options.
� Poor upkeep of sidewalk infrastructure.
� Walking areas often unsafe or inconvenient.
� Limited parks and recreation space, including indoor facilities.
� Poor upkeep and security in local parks.
� Weather conditions limit outdoor physical activity options.
� Lack of affordable indoor physical activity options.
Communities Not Designed for Physical Activity
� Greater advertising and marketing of less nutritious foods.
� Marketing of “fad” diets.
Marketing and Advertising
� Many desk jobs limit or discourage activity, part of the sedentary lifestyle.
� Worksites typically not designed to foster movement.
� Limited opportunities for physical activity or recreation during the work day.
� Unhealthy options in cafeterias or work lunch sites.
� Lack of bike racks and/or shower facilities discourage active transportation.
Workplaces Not Conducive to Health
24
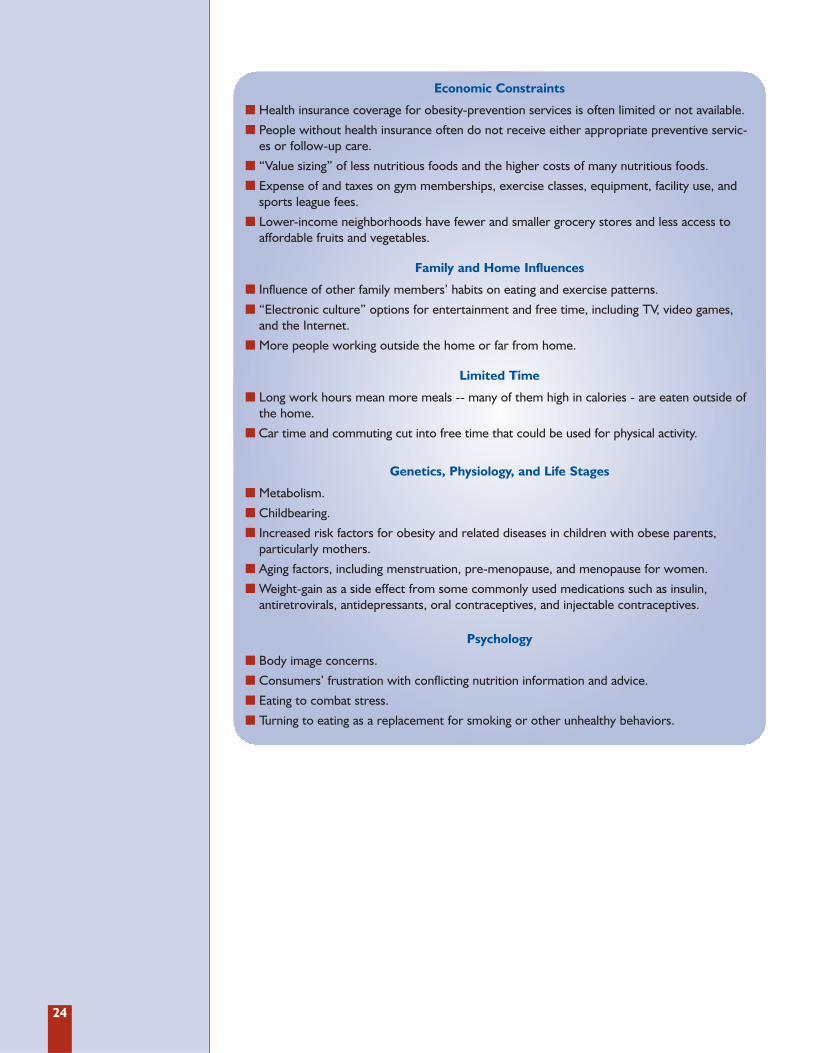
� Health insurance coverage for obesity-prevention services is often limited or not available.
� People without health insurance often do not receive either appropriate preventive servic-es or follow-up care.
� “Value sizing” of less nutritious foods and the higher costs of many nutritious foods.
� Expense of and taxes on gym memberships, exercise classes, equipment, facility use, andsports league fees.
� Lower-income neighborhoods have fewer and smaller grocery stores and less access toaffordable fruits and vegetables.
Economic Constraints
� Metabolism.
� Childbearing.
� Increased risk factors for obesity and related diseases in children with obese parents, particularly mothers.
� Aging factors, including menstruation, pre-menopause, and menopause for women.
� Weight-gain as a side effect from some commonly used medications such as insulin, antiretrovirals, antidepressants, oral contraceptives, and injectable contraceptives.
Genetics, Physiology, and Life Stages
� Body image concerns.
� Consumers’ frustration with conflicting nutrition information and advice.
� Eating to combat stress.
� Turning to eating as a replacement for smoking or other unhealthy behaviors.
Psychology
� Influence of other family members’ habits on eating and exercise patterns.
� “Electronic culture” options for entertainment and free time, including TV, video games,and the Internet.
� More people working outside the home or far from home.
Family and Home Influences
� Long work hours mean more meals -- many of them high in calories - are eaten outside ofthe home.
� Car time and commuting cut into free time that could be used for physical activity.
Limited Time
25
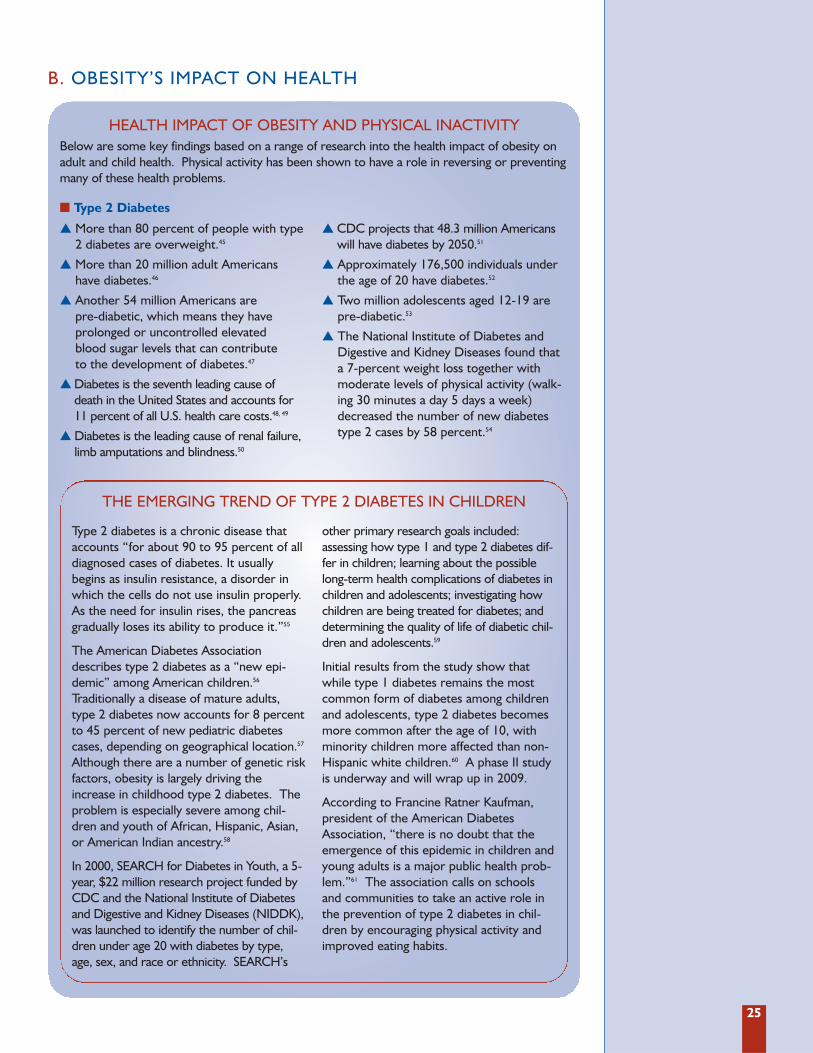
HEALTH IMPACT OF OBESITY AND PHYSICAL INACTIVITY
� More than 80 percent of people with type2 diabetes are overweight.45
� More than 20 million adult Americanshave diabetes.46
� Another 54 million Americans are pre-diabetic, which means they have prolonged or uncontrolled elevated blood sugar levels that can contribute to the development of diabetes.47
� Diabetes is the seventh leading cause ofdeath in the United States and accounts for11 percent of all U.S. health care costs.48, 49
� Diabetes is the leading cause of renal failure,limb amputations and blindness.50
� CDC projects that 48.3 million Americanswill have diabetes by 2050.51
� Approximately 176,500 individuals underthe age of 20 have diabetes.52
� Two million adolescents aged 12-19 arepre-diabetic.53
� The National Institute of Diabetes andDigestive and Kidney Diseases found thata 7-percent weight loss together withmoderate levels of physical activity (walk-ing 30 minutes a day 5 days a week)decreased the number of new diabetestype 2 cases by 58 percent.54
THE EMERGING TREND OF TYPE 2 DIABETES IN CHILDREN
Type 2 diabetes is a chronic disease thataccounts “for about 90 to 95 percent of alldiagnosed cases of diabetes. It usuallybegins as insulin resistance, a disorder inwhich the cells do not use insulin properly.As the need for insulin rises, the pancreasgradually loses its ability to produce it.”55
The American Diabetes Associationdescribes type 2 diabetes as a “new epi-demic” among American children.56
Traditionally a disease of mature adults,type 2 diabetes now accounts for 8 percentto 45 percent of new pediatric diabetescases, depending on geographical location.57
Although there are a number of genetic riskfactors, obesity is largely driving theincrease in childhood type 2 diabetes. Theproblem is especially severe among chil-dren and youth of African, Hispanic, Asian,or American Indian ancestry.58
In 2000, SEARCH for Diabetes in Youth, a 5-year, $22 million research project funded byCDC and the National Institute of Diabetesand Digestive and Kidney Diseases (NIDDK),was launched to identify the number of chil-dren under age 20 with diabetes by type,age, sex, and race or ethnicity. SEARCH’s
other primary research goals included:assessing how type 1 and type 2 diabetes dif-fer in children; learning about the possiblelong-term health complications of diabetes inchildren and adolescents; investigating howchildren are being treated for diabetes; anddetermining the quality of life of diabetic chil-dren and adolescents.59
Initial results from the study show thatwhile type 1 diabetes remains the mostcommon form of diabetes among childrenand adolescents, type 2 diabetes becomesmore common after the age of 10, withminority children more affected than non-Hispanic white children.60 A phase II studyis underway and will wrap up in 2009.
According to Francine Ratner Kaufman,president of the American DiabetesAssociation, “there is no doubt that theemergence of this epidemic in children andyoung adults is a major public health prob-lem.”61 The association calls on schoolsand communities to take an active role inthe prevention of type 2 diabetes in chil-dren by encouraging physical activity andimproved eating habits.
� Type 2 Diabetes
Below are some key findings based on a range of research into the health impact of obesity onadult and child health. Physical activity has been shown to have a role in reversing or preventingmany of these health problems.
B. OBESITY’S IMPACT ON HEALTH
26
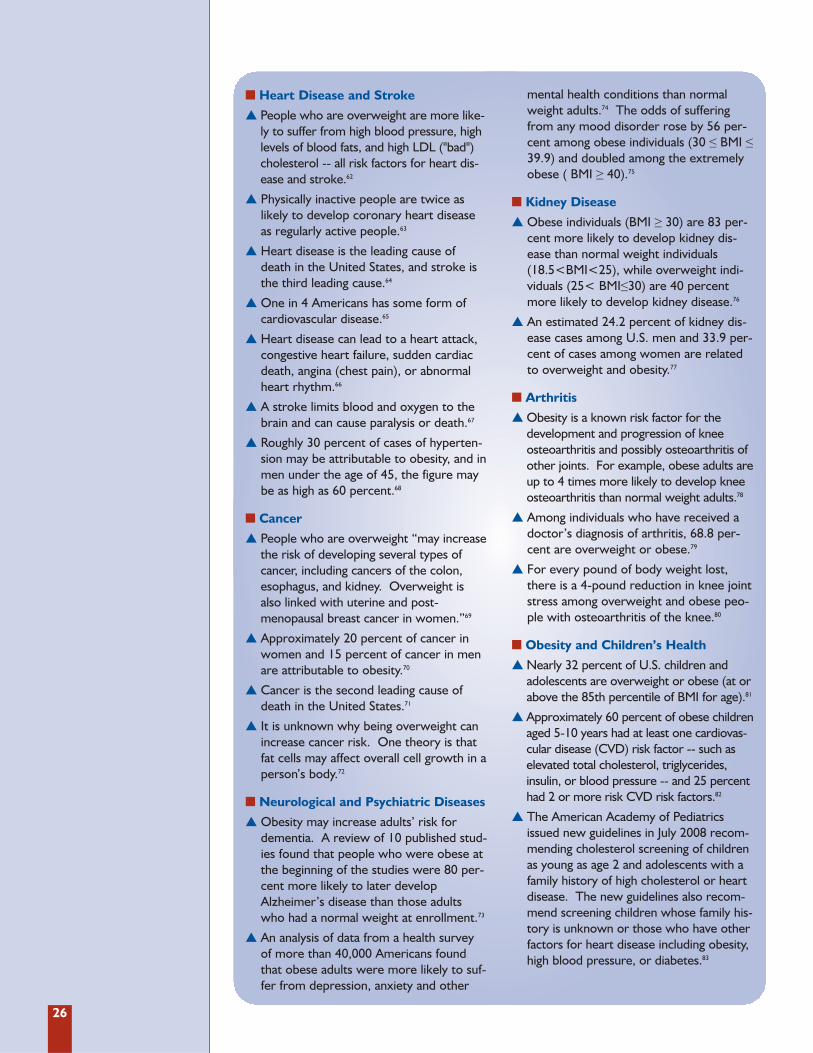
� Heart Disease and Stroke
� People who are overweight are more like-ly to suffer from high blood pressure, highlevels of blood fats, and high LDL ("bad")cholesterol -- all risk factors for heart dis-ease and stroke.62
� Physically inactive people are twice aslikely to develop coronary heart diseaseas regularly active people.63
� Heart disease is the leading cause ofdeath in the United States, and stroke isthe third leading cause.64
� One in 4 Americans has some form ofcardiovascular disease.65
� Heart disease can lead to a heart attack,congestive heart failure, sudden cardiacdeath, angina (chest pain), or abnormalheart rhythm.66
� A stroke limits blood and oxygen to thebrain and can cause paralysis or death.67
� Roughly 30 percent of cases of hyperten-sion may be attributable to obesity, and inmen under the age of 45, the figure maybe as high as 60 percent.68
� Cancer
� People who are overweight “may increasethe risk of developing several types ofcancer, including cancers of the colon,esophagus, and kidney. Overweight isalso linked with uterine and post-menopausal breast cancer in women.”69
� Approximately 20 percent of cancer inwomen and 15 percent of cancer in menare attributable to obesity.70
� Cancer is the second leading cause ofdeath in the United States.71
� It is unknown why being overweight canincrease cancer risk. One theory is thatfat cells may affect overall cell growth in aperson’s body.72
� Neurological and Psychiatric Diseases
� Obesity may increase adults’ risk fordementia. A review of 10 published stud-ies found that people who were obese atthe beginning of the studies were 80 per-cent more likely to later developAlzheimer’s disease than those adultswho had a normal weight at enrollment.73
� An analysis of data from a health surveyof more than 40,000 Americans foundthat obese adults were more likely to suf-fer from depression, anxiety and other
mental health conditions than normalweight adults.74 The odds of sufferingfrom any mood disorder rose by 56 per-cent among obese individuals (30 ≤ BMI ≤39.9) and doubled among the extremelyobese ( BMI ≥ 40).75
� Kidney Disease
� Obese individuals (BMI ≥ 30) are 83 per-cent more likely to develop kidney dis-ease than normal weight individuals(18.5<BMI<25), while overweight indi-viduals (25< BMI≤30) are 40 percentmore likely to develop kidney disease.76
� An estimated 24.2 percent of kidney dis-ease cases among U.S. men and 33.9 per-cent of cases among women are relatedto overweight and obesity.77
� Arthritis
� Obesity is a known risk factor for thedevelopment and progression of kneeosteoarthritis and possibly osteoarthritis ofother joints. For example, obese adults areup to 4 times more likely to develop kneeosteoarthritis than normal weight adults.78
� Among individuals who have received adoctor’s diagnosis of arthritis, 68.8 per-cent are overweight or obese.79
� For every pound of body weight lost,there is a 4-pound reduction in knee jointstress among overweight and obese peo-ple with osteoarthritis of the knee.80
� Obesity and Children’s Health
� Nearly 32 percent of U.S. children andadolescents are overweight or obese (at orabove the 85th percentile of BMI for age).81
� Approximately 60 percent of obese childrenaged 5-10 years had at least one cardiovas-cular disease (CVD) risk factor -- such aselevated total cholesterol, triglycerides,insulin, or blood pressure -- and 25 percenthad 2 or more risk CVD risk factors.82
� The American Academy of Pediatricsissued new guidelines in July 2008 recom-mending cholesterol screening of childrenas young as age 2 and adolescents with afamily history of high cholesterol or heartdisease. The new guidelines also recom-mend screening children whose family his-tory is unknown or those who have otherfactors for heart disease including obesity,high blood pressure, or diabetes.83
27
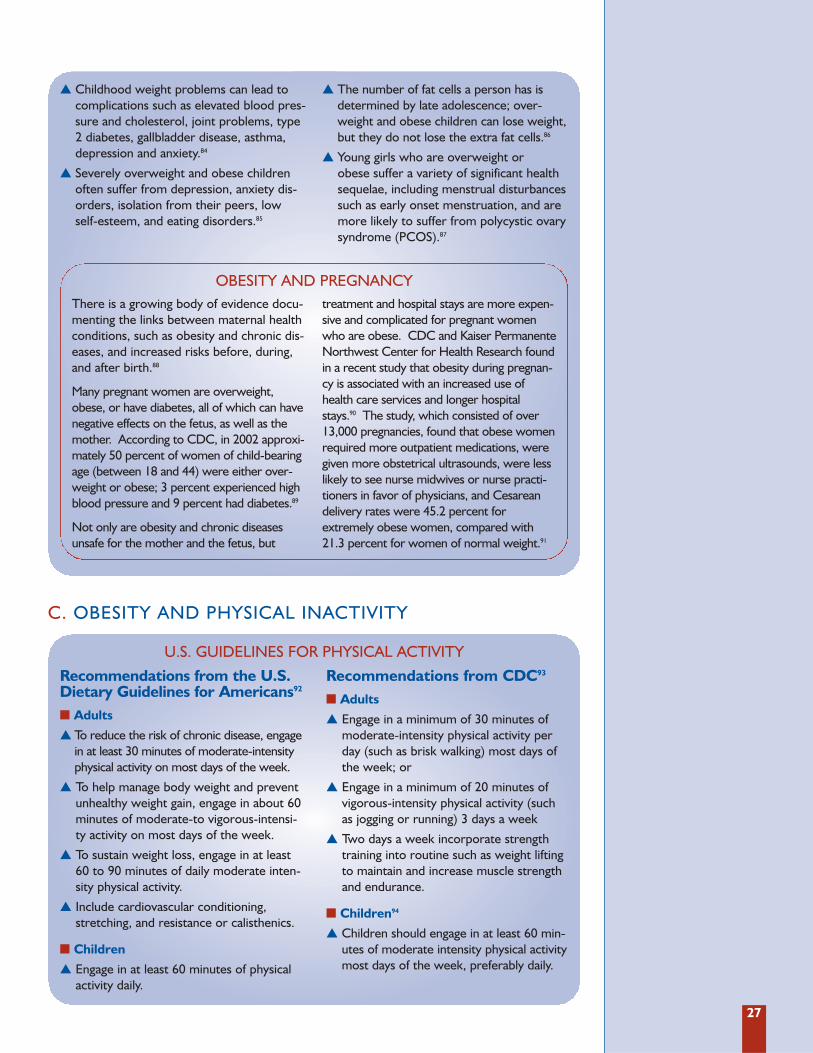
Recommendations from the U.S.Dietary Guidelines for Americans92
� Adults
� To reduce the risk of chronic disease, engagein at least 30 minutes of moderate-intensityphysical activity on most days of the week.
� To help manage body weight and preventunhealthy weight gain, engage in about 60minutes of moderate-to vigorous-intensi-ty activity on most days of the week.
� To sustain weight loss, engage in at least60 to 90 minutes of daily moderate inten-sity physical activity.
� Include cardiovascular conditioning,stretching, and resistance or calisthenics.
� Children
� Engage in at least 60 minutes of physicalactivity daily.
Recommendations from CDC93
� Adults
� Engage in a minimum of 30 minutes ofmoderate-intensity physical activity perday (such as brisk walking) most days ofthe week; or
� Engage in a minimum of 20 minutes ofvigorous-intensity physical activity (suchas jogging or running) 3 days a week
� Two days a week incorporate strengthtraining into routine such as weight liftingto maintain and increase muscle strengthand endurance.
� Children94
� Children should engage in at least 60 min-utes of moderate intensity physical activitymost days of the week, preferably daily.
U.S. GUIDELINES FOR PHYSICAL ACTIVITY
� Childhood weight problems can lead tocomplications such as elevated blood pres-sure and cholesterol, joint problems, type2 diabetes, gallbladder disease, asthma,depression and anxiety.84
� Severely overweight and obese childrenoften suffer from depression, anxiety dis-orders, isolation from their peers, lowself-esteem, and eating disorders.85
� The number of fat cells a person has isdetermined by late adolescence; over-weight and obese children can lose weight,but they do not lose the extra fat cells.86
� Young girls who are overweight or obese suffer a variety of significant health sequelae, including menstrual disturbancessuch as early onset menstruation, and aremore likely to suffer from polycystic ovarysyndrome (PCOS).87
There is a growing body of evidence docu-menting the links between maternal healthconditions, such as obesity and chronic dis-eases, and increased risks before, during,and after birth.88
Many pregnant women are overweight,obese, or have diabetes, all of which can havenegative effects on the fetus, as well as themother. According to CDC, in 2002 approxi-mately 50 percent of women of child-bearingage (between 18 and 44) were either over-weight or obese; 3 percent experienced highblood pressure and 9 percent had diabetes.89
Not only are obesity and chronic diseasesunsafe for the mother and the fetus, but
treatment and hospital stays are more expen-sive and complicated for pregnant womenwho are obese. CDC and Kaiser PermanenteNorthwest Center for Health Research foundin a recent study that obesity during pregnan-cy is associated with an increased use ofhealth care services and longer hospitalstays.90 The study, which consisted of over13,000 pregnancies, found that obese womenrequired more outpatient medications, weregiven more obstetrical ultrasounds, were lesslikely to see nurse midwives or nurse practi-tioners in favor of physicians, and Cesareandelivery rates were 45.2 percent forextremely obese women, compared with21.3 percent for women of normal weight.91
C. OBESITY AND PHYSICAL INACTIVITY
OBESITY AND PREGNANCY
28
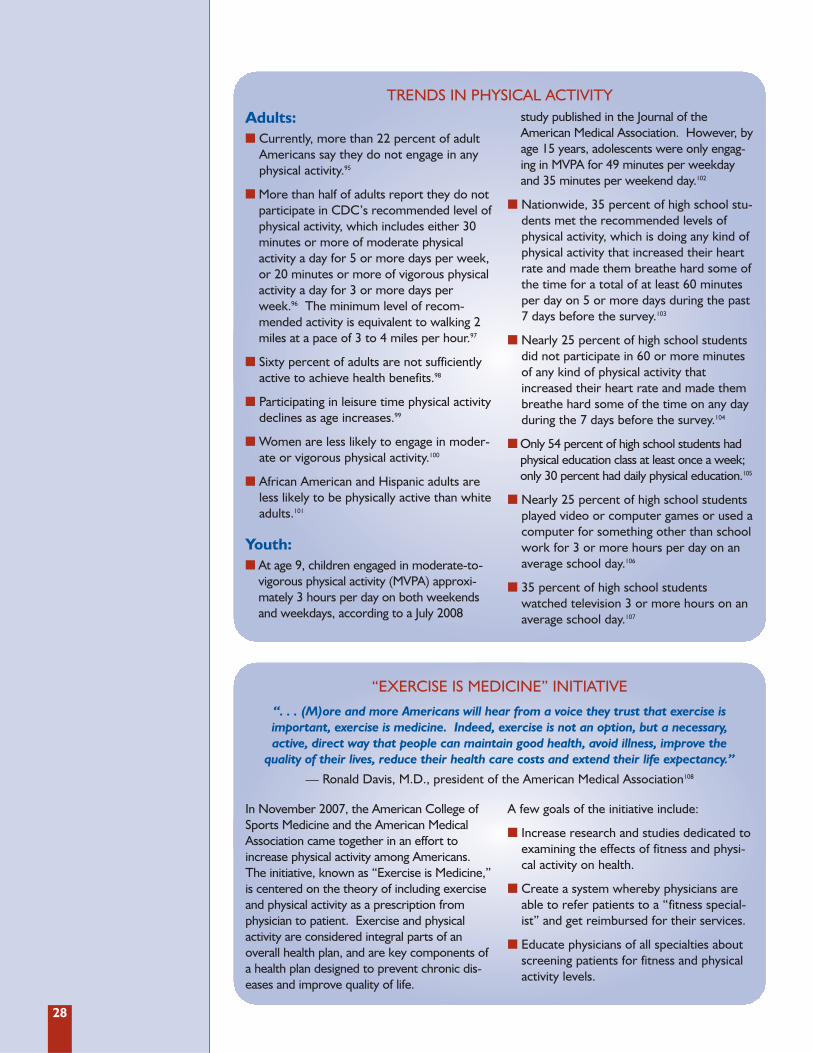
Adults: � Currently, more than 22 percent of adult
Americans say they do not engage in anyphysical activity.95
� More than half of adults report they do notparticipate in CDC’s recommended level ofphysical activity, which includes either 30minutes or more of moderate physicalactivity a day for 5 or more days per week,or 20 minutes or more of vigorous physicalactivity a day for 3 or more days perweek.96 The minimum level of recom-mended activity is equivalent to walking 2miles at a pace of 3 to 4 miles per hour.97
� Sixty percent of adults are not sufficientlyactive to achieve health benefits.98
� Participating in leisure time physical activitydeclines as age increases.99
� Women are less likely to engage in moder-ate or vigorous physical activity.100
� African American and Hispanic adults areless likely to be physically active than whiteadults.101
Youth:� At age 9, children engaged in moderate-to-
vigorous physical activity (MVPA) approxi-mately 3 hours per day on both weekendsand weekdays, according to a July 2008
study published in the Journal of theAmerican Medical Association. However, byage 15 years, adolescents were only engag-ing in MVPA for 49 minutes per weekdayand 35 minutes per weekend day.102
� Nationwide, 35 percent of high school stu-dents met the recommended levels ofphysical activity, which is doing any kind ofphysical activity that increased their heartrate and made them breathe hard some ofthe time for a total of at least 60 minutesper day on 5 or more days during the past7 days before the survey.103
� Nearly 25 percent of high school studentsdid not participate in 60 or more minutesof any kind of physical activity thatincreased their heart rate and made thembreathe hard some of the time on any dayduring the 7 days before the survey.104
� Only 54 percent of high school students hadphysical education class at least once a week;only 30 percent had daily physical education.105
� Nearly 25 percent of high school studentsplayed video or computer games or used acomputer for something other than schoolwork for 3 or more hours per day on anaverage school day.106
� 35 percent of high school studentswatched television 3 or more hours on anaverage school day.107
TRENDS IN PHYSICAL ACTIVITY
In November 2007, the American College ofSports Medicine and the American MedicalAssociation came together in an effort toincrease physical activity among Americans.The initiative, known as “Exercise is Medicine,”is centered on the theory of including exerciseand physical activity as a prescription fromphysician to patient. Exercise and physicalactivity are considered integral parts of anoverall health plan, and are key components ofa health plan designed to prevent chronic dis-eases and improve quality of life.
A few goals of the initiative include:
� Increase research and studies dedicated toexamining the effects of fitness and physi-cal activity on health.
� Create a system whereby physicians areable to refer patients to a “fitness special-ist” and get reimbursed for their services.
� Educate physicians of all specialties aboutscreening patients for fitness and physicalactivity levels.
“EXERCISE IS MEDICINE” INITIATIVE
“. . . (M)ore and more Americans will hear from a voice they trust that exercise is important, exercise is medicine. Indeed, exercise is not an option, but a necessary,active, direct way that people can maintain good health, avoid illness, improve the
quality of their lives, reduce their health care costs and extend their life expectancy.”
— Ronald Davis, M.D., president of the American Medical Association108
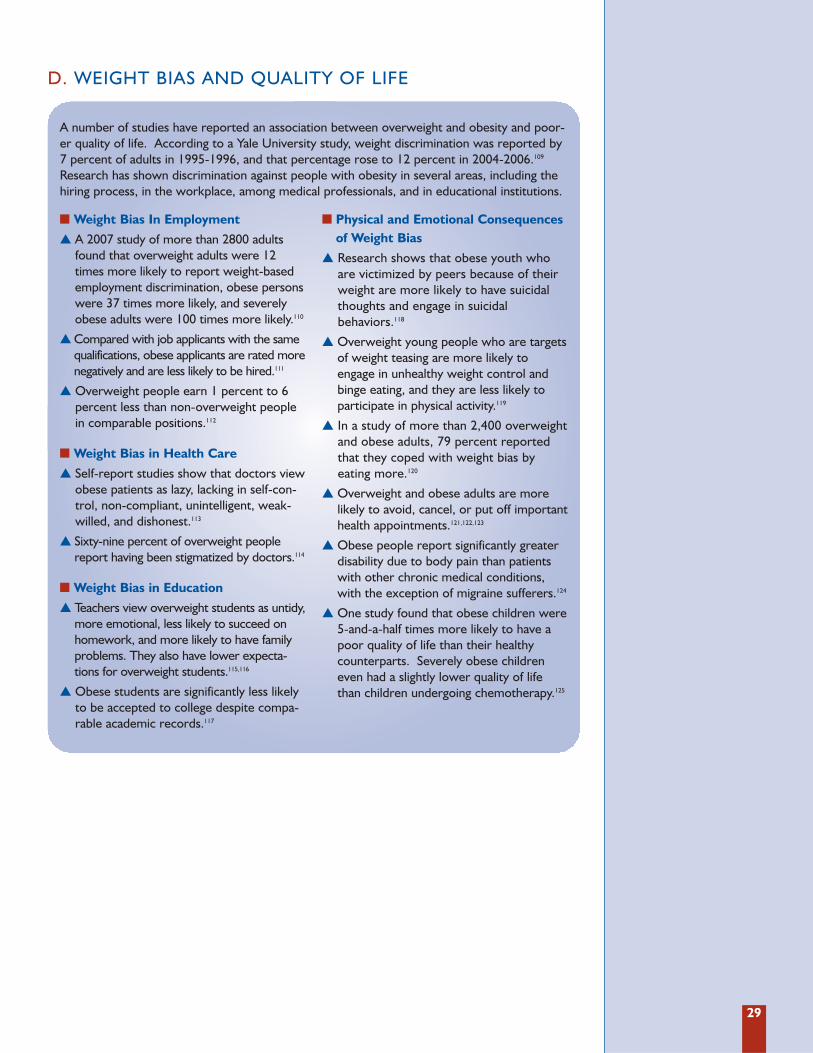
29
� Weight Bias In Employment
� A 2007 study of more than 2800 adultsfound that overweight adults were 12times more likely to report weight-basedemployment discrimination, obese personswere 37 times more likely, and severelyobese adults were 100 times more likely.110
� Compared with job applicants with the samequalifications, obese applicants are rated morenegatively and are less likely to be hired.111
� Overweight people earn 1 percent to 6percent less than non-overweight peoplein comparable positions.112
� Weight Bias in Health Care
� Self-report studies show that doctors viewobese patients as lazy, lacking in self-con-trol, non-compliant, unintelligent, weak-willed, and dishonest.113
� Sixty-nine percent of overweight peoplereport having been stigmatized by doctors.114
� Weight Bias in Education
� Teachers view overweight students as untidy,more emotional, less likely to succeed onhomework, and more likely to have familyproblems. They also have lower expecta-tions for overweight students.115,116
� Obese students are significantly less likelyto be accepted to college despite compa-rable academic records.117
� Physical and Emotional Consequencesof Weight Bias
� Research shows that obese youth whoare victimized by peers because of theirweight are more likely to have suicidalthoughts and engage in suicidalbehaviors.118
� Overweight young people who are targetsof weight teasing are more likely toengage in unhealthy weight control andbinge eating, and they are less likely toparticipate in physical activity.119
� In a study of more than 2,400 overweightand obese adults, 79 percent reportedthat they coped with weight bias by eating more.120
� Overweight and obese adults are morelikely to avoid, cancel, or put off importanthealth appointments.121,122,123
� Obese people report significantly greaterdisability due to body pain than patientswith other chronic medical conditions,with the exception of migraine sufferers.124
� One study found that obese children were5-and-a-half times more likely to have apoor quality of life than their healthycounterparts. Severely obese childreneven had a slightly lower quality of lifethan children undergoing chemotherapy.125
D. WEIGHT BIAS AND QUALITY OF LIFE
A number of studies have reported an association between overweight and obesity and poor-er quality of life. According to a Yale University study, weight discrimination was reported by7 percent of adults in 1995-1996, and that percentage rose to 12 percent in 2004-2006.109
Research has shown discrimination against people with obesity in several areas, including thehiring process, in the workplace, among medical professionals, and in educational institutions.

30
� Key Recommendations
� Consume a variety of nutrient-dense foodsand beverages within and among the basicfood groups while picking foods that limitthe intake of saturated and trans fats, cho-lesterol, added sugars, salt, and alcohol.
� Eat more dark green vegetables, orangevegetables, legumes, fruits, whole grains,and low-fat milk and milk products.
� Eat less refined grains, total fats, addedsugars, and calories.
� Specific Recommendations forAdults
� Consume 2 cups of fruit and 2 1/2 cups of vegetables per day for a 2,000-calorieintake.
� Consume 3 or more ounce-equivalents ofwhole-grain products per day. At least half ofgrain intake should come from whole grains.
� Consume 3 cups per day of fat-free orlow-fat milk or milk products.
� Increase dietary intake of calcium, potassium,fiber, magnesium, and vitamins A, C, and E.
� Specific Recommendations forChildren and Adolescents
� At least half of grains consumed should bewhole-grain. Children 2 to 8 years oldshould consume 2 cups per day of fat-freeor low-fat milk or milk products and chil-dren 9 and up should drink 3 cups per day.
� Increase dietary intake of calcium, potassi-um, fiber, magnesium, and vitamin E.
DIETARY NUTRITION GUIDELINES FOR AMERICANS126
E. NUTRITION: THE OTHER SIDE OF THE ENERGY BALANCE
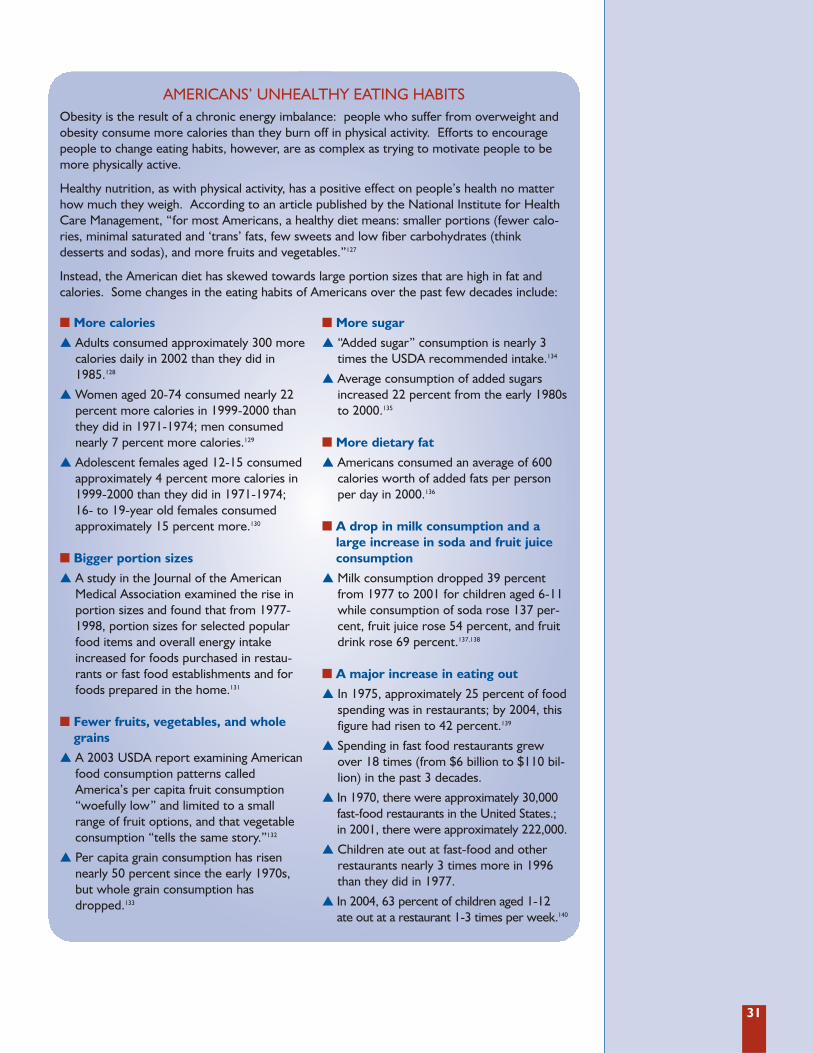
31
� More calories
� Adults consumed approximately 300 morecalories daily in 2002 than they did in1985.128
� Women aged 20-74 consumed nearly 22percent more calories in 1999-2000 thanthey did in 1971-1974; men consumednearly 7 percent more calories.129
� Adolescent females aged 12-15 consumedapproximately 4 percent more calories in1999-2000 than they did in 1971-1974;16- to 19-year old females consumedapproximately 15 percent more.130
� Bigger portion sizes
� A study in the Journal of the AmericanMedical Association examined the rise inportion sizes and found that from 1977-1998, portion sizes for selected popularfood items and overall energy intakeincreased for foods purchased in restau-rants or fast food establishments and forfoods prepared in the home.131
� Fewer fruits, vegetables, and wholegrains
� A 2003 USDA report examining Americanfood consumption patterns calledAmerica’s per capita fruit consumption“woefully low” and limited to a smallrange of fruit options, and that vegetableconsumption “tells the same story.”132
� Per capita grain consumption has risennearly 50 percent since the early 1970s,but whole grain consumption hasdropped.133
� More sugar
� “Added sugar” consumption is nearly 3times the USDA recommended intake.134
� Average consumption of added sugarsincreased 22 percent from the early 1980sto 2000.135
� More dietary fat
� Americans consumed an average of 600calories worth of added fats per personper day in 2000.136
� A drop in milk consumption and alarge increase in soda and fruit juiceconsumption
� Milk consumption dropped 39 percentfrom 1977 to 2001 for children aged 6-11while consumption of soda rose 137 per-cent, fruit juice rose 54 percent, and fruitdrink rose 69 percent.137,138
� A major increase in eating out
� In 1975, approximately 25 percent of foodspending was in restaurants; by 2004, thisfigure had risen to 42 percent.139
� Spending in fast food restaurants grewover 18 times (from $6 billion to $110 bil-lion) in the past 3 decades.
� In 1970, there were approximately 30,000fast-food restaurants in the United States.;in 2001, there were approximately 222,000.
� Children ate out at fast-food and otherrestaurants nearly 3 times more in 1996than they did in 1977.
� In 2004, 63 percent of children aged 1-12ate out at a restaurant 1-3 times per week.140
Obesity is the result of a chronic energy imbalance: people who suffer from overweight andobesity consume more calories than they burn off in physical activity. Efforts to encouragepeople to change eating habits, however, are as complex as trying to motivate people to bemore physically active.
Healthy nutrition, as with physical activity, has a positive effect on people’s health no matterhow much they weigh. According to an article published by the National Institute for HealthCare Management, “for most Americans, a healthy diet means: smaller portions (fewer calo-ries, minimal saturated and ‘trans’ fats, few sweets and low fiber carbohydrates (thinkdesserts and sodas), and more fruits and vegetables.”127
Instead, the American diet has skewed towards large portion sizes that are high in fat andcalories. Some changes in the eating habits of Americans over the past few decades include:
AMERICANS’ UNHEALTHY EATING HABITS
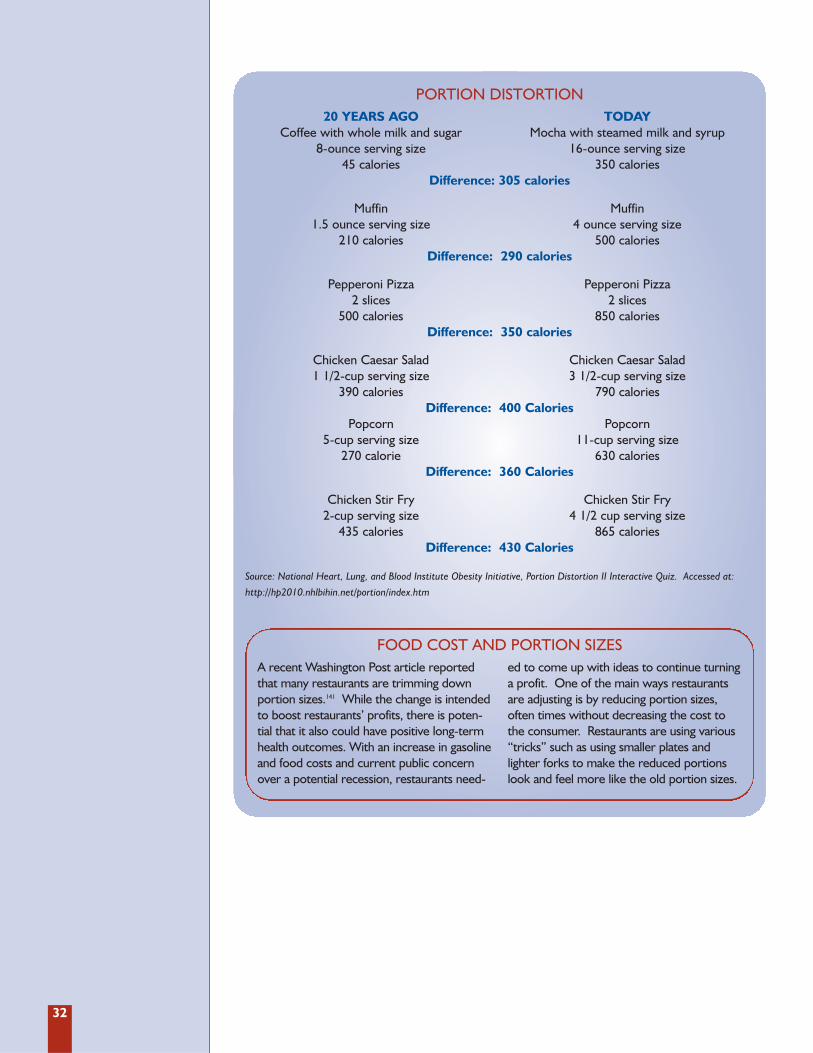
32
20 YEARS AGO TODAYCoffee with whole milk and sugar Mocha with steamed milk and syrup
8-ounce serving size 16-ounce serving size45 calories 350 calories
Difference: 305 calories
Muffin Muffin1.5 ounce serving size 4 ounce serving size
210 calories 500 caloriesDifference: 290 calories
Pepperoni Pizza Pepperoni Pizza 2 slices 2 slices
500 calories 850 caloriesDifference: 350 calories
Chicken Caesar Salad Chicken Caesar Salad1 1/2-cup serving size 3 1/2-cup serving size
390 calories 790 caloriesDifference: 400 Calories
Popcorn Popcorn5-cup serving size 11-cup serving size
270 calorie 630 caloriesDifference: 360 Calories
Chicken Stir Fry Chicken Stir Fry2-cup serving size 4 1/2 cup serving size
435 calories 865 caloriesDifference: 430 Calories
Source: National Heart, Lung, and Blood Institute Obesity Initiative, Portion Distortion II Interactive Quiz. Accessed at:
http://hp2010.nhlbihin.net/portion/index.htm
PORTION DISTORTION
A recent Washington Post article reportedthat many restaurants are trimming downportion sizes.141 While the change is intendedto boost restaurants’ profits, there is poten-tial that it also could have positive long-termhealth outcomes. With an increase in gasolineand food costs and current public concernover a potential recession, restaurants need-
ed to come up with ideas to continue turninga profit. One of the main ways restaurantsare adjusting is by reducing portion sizes,often times without decreasing the cost tothe consumer. Restaurants are using various“tricks” such as using smaller plates andlighter forks to make the reduced portionslook and feel more like the old portion sizes.
FOOD COST AND PORTION SIZES

33
In the mid-1960s David Wallerstein managed achain of movie theaters in Texas and was con-stantly trying to find a way to increase profits.Wallerstein tried different ways -- 2-for-1 pop-corn sales and other food and beverage combi-nations -- but nothing worked. He eventuallyrealized that customers were reluctant to buy 2of anything because that would appear glutton-ous.142 Then he decided to rethink portion sizes.
Wallerstein took his theory to Ray Kroc, thefounder of McDonalds, and persuaded him toserve bigger portions. After setting up videosurveillance and watching customers, Krocsaw that although customers were reluctantto order seconds, they were happy to keepeating. The result: Supersizing.143 Wallersteinmay have been one of the first to explore theeconomics of portion sizes, but he certainlywasn’t the only one to benefit. In the 1970s,a Coca-Cola representative tried to sell theidea of 32-ounce cups to 7-Eleven. AlthoughDennis Potts, a midlevel manager of 7-Elevenat the time, thought people would never buy
them, he gave the idea a try -- thus creatingthe still successful Big Gulp.144
Fast-food and restaurant customers havecome to associate huge quantities of foodwith value, a combination that leads to anincrease in caloric consumption per individual.A study at Pennsylvania State University foundthat consumers who were given a 50-percentlarger pasta dish ate 43 percent more thanthose given a smaller portion.145 Anotherstudy reports that Americans are eating morecalories per day than they did in the 1970s.146
Some companies, such as McDonald’s andWendy’s, have eliminated their “Supersize”and “Biggie” menus after criticism and negativepublicity.147 But the question remains whetherdropping these menus choices affected any realchange in the industry. A study by a professorand dietician at New York University foundthat Wendy’s original “Biggie” drink, containing32 ounces, has been renamed simply as amedium. A large now contains 42 ounces.148
THE ART OF SUPERSIZING
34
F. ECONOMIC COSTS OF OBESITY
HEALTH CARE COSTS� The total cost of obesity and physical
inactivity in 2000 was estimated to be$117 billion.149
� Obesity-related annual costs for childrenmore than tripled between 1979 and 1999.150
� A 2008 study reported that obese employ-ees cost private employers approximately$45 billion a year as a result of medicalexpenses and excessive absenteeism.151
� Obesity has been linked to a 36 percentincrease in healthcare spending, which ispresently more than smoking or drinking.152
� Higher health care costs for obese andsedentary workers signal poorer overallhealth among these individuals. And givenpoorer health, lower worker productivityand increased absenteeism are more likelyamong obese and physically inactiveemployees.
Lower Worker Productivity andIncreased Absenteeism
� Researchers found that obese workers had183.63 lost workdays per 100 full-timeemployees, compared to normal weightworkers who had 14.19 lost workdays per100 full-time employees.153
� As people’s BMI increases so do the num-ber of sick days, medical claims and healthcare costs.154
� A 2004 study concluded that excessiveweight and physical inactivity negativelyimpact the quality of work performed, thequantity of work performed and overalljob performance among obese, sedentaryindividuals.155
Higher Workers’ Compensation Claims
� A number of studies have shown obeseworkers have higher workers’ compensationclaims.156, 157, 158, 159, 160, 161
� A 2007 study found that excessive weightgain among employees is related to higheramounts of workers’ compensation claims.162
Obese workers had on average 11.65 claimsper 100 full-time employees, compared tonormal weight employees who had 5.8claims per 100-full time employees.163
� The cost of obese employee workers’ com-pensation claims were also significantly high-er. Obese employees had $51,091 in med-ical claims costs per 100 full-time employ-ees, compared to only $7,503 in medicalclaims costs for normal weight workers.And obese workers had $59,178 in indemni-ty claims costs per 100 full-time employees,compared to only $5,396 in indemnityclaims costs for normal weight employees.164
Occupational Health and Safety Costs
� The number of severely obese (BMI ≥40) patients quadrupled between 1986and 2000 from one in 200 to one in 50.The number of super-obese (BMI ≥ 50)patients grew by a factor of 5, from onein 2,000 to one in 400.165 Emergencyresponders and health care providersface unique challenges in transporting andtreating the heaviest patients.
� A typical ambulance outfitted with equip-ment and 2 emergency medical technicians(EMTs) that can transport a 400-poundpatient costs $70,000. A specially outfit-ted bariatric ambulance that can transportpatients weighing up to 1,000 poundscosts $110,000.166
� A standard hospital bed can hold 500pounds and costs $1,000. A bariatric hos-pital bed that can hold up to 1,000 poundscosts $4,000.167
� Nearly one in 2 emergency medical tech-nicians sustained a back injury while per-forming EMS duties. Most blamed liftingextremely obese patients.168
35
USDA is predicting that food prices will rise4.5 percent during 2008 due to a world-widegrain shortage, high energy costs, and a weakU.S. dollar. Rising food prices are likely to havea negative impact on Americans’ eating habits,according to Carol Tucker Foreman, directorof the Consumer Federation of America. Shesays middle- and low-income families may besimultaneously pushed towards hunger andobesity. “They will be hard pressed to buyfresh fruits and vegetables as prices rise.Instead, they will look to the cheapest foodswhich aren’t necessarily the healthiest.”169
There is little doubt that increases in the priceof dairy goods, grains, and fresh fruits and veg-etables will lead consumers to scale back oncostlier, healthy food.170 A 2007 study byresearchers at the University of Washingtonfound that unhealthy, high-calorie foods cost anaverage of $1.76 per 1,000 calories, while low-calorie, nutritious foods cost $18.16 per 1,000calories.171 The study also found that unhealthy,high-calorie foods are not only the least expen-sive, but also most resistant to inflation.172 AsUniversity of Washington epidemiologist AdamDrewnowksi, one of the study’s co-authors,told The Philadelphia Inquirer, “fruits, vegeta-bles, and fish are becoming luxury goods com-pletely out of reach of many people.Consumption of cheap food will only grow.”173
Already, rising food costs have promptedchanges at food banks and charities, govern-ment social assistance programs, and schools.
Food BanksThe U.S. economic downturn has forced moreAmericans to seek food assistance. A top offi-cial at America’s Second Harvest, the nation’sleading hunger-relief charity, told TheWashington Post that requests for food assis-tance from April 2007 to April 2008 are up 30percent.174 The increased demand for foodassistance comes at a time when food contribu-tions from farmers and grocery chains havedeclined. Farmers are both able to exportmore of their goods and sell certain cash crops,such as corn and soybeans to domestic renew-able energy producers. Meanwhile, grocerychains have strengthened their inventory man-agement leading to fewer surplus goods.175 Thepressure has gotten so bad that some charitiesare asking state and local governments for help.
Federal Food Assistance ProgramsAccording to the Congressional Budget Office,double-digit growth in federal food and nutri-
tion programs, such as the SupplementalNutrition Assistance Program (SNAP) (formerlythe Food Stamp Program) and Women, Infantsand Children (WIC) will continue through 2008as a result of rising unemployment.176 Thenumber of Americans receiving food stamps isprojected to grow from 26.5 million in 2007 to27.8 million in 2008.177 Although food stampsprovide needy Americans with a safety net,critics contend the program hasn’t kept up withinflation, meaning that recipients are able tobuy fewer foods with their benefits.
WIC is also facing rising demand coupled withincreasing prices for food good. WIC providesfederal grants to states for supplemental foods,health care referrals, and nutrition educationfor low-income pregnant, breastfeeding, andnon-breastfeeding postpartum women, and toinfants and children up to age 5 who are foundto be at nutritional risk.178 Unlike the foodstamps program, WIC is not an entitlementand Congress would have to approve anincrease in appropriations to avoid denying aidto low-income mothers and children.
School Lunch Programs Schools across the country are also dealingwith rising food prices. The cost of staplefoods including, milk, grains, produce andmeat have risen over 23 percent.179 TheMiami-Dade County Public School Systemsaw the price of milk rise an additional $4.5million in the 2007-2008 school year alone.180
Rising food prices have come at a time whenschools are also being asked to preparehealthier, lower-fat meals to help stem thetide of childhood obesity. In many cases,schools are being forced to cut back on moreexpensive foods such as whole-grain breadsand fresh fruits and vegetables.181 Accordingto Kenneth Hecht, executive director ofCalifornia Food Policy Advocates, a publicpolicy organization dedicated to improvingthe health of low-income Californians, schoolsare forced to cut back on the healthier, morecostly items because school boards do notwant to lose money. “This insistence thatfood service stay in the black means that rev-enues must be high,” he told the Committeeon Education and Labor of the U.S. House ofRepresentatives, which held hearings on thesubject in March 2008.182 Without an increasein state or federal funding, he said schools willbe forced to choose less healthy, less expen-sive foods that they can sell for a profit, suchas sugary drinks or potato chips.
G. THE HIGH PRICE OF FOOD

37
Over the past decade, the majority of statesand D.C., have added overweight and obesi-ty to their list of important issues toaddress.183 As a result, a growing number ofstates have published state plans that focuson physical activity and healthy nutrition.Currently, 41 states have plans in place withspecific strategies and goals to lower theprevalence of overweight, obesity and obesi-ty-related chronic diseases in each state.Virginia and D.C. have childhood obesityplans, and at least 7 more have drafts ofplans in the works, which they expect tomake available to the public over the nextyear or 2. (See Appendix B: Methodologyfor State Obesity Plan Review.)
Each state has a unique plan, but many pro-grams contain similar goals and means toachieve those goals. One objective commonto almost every state is the urgency to getpeople involved on all levels; this is known asthe Social-Ecological Model. This model aimsto affect behavioral change by engaging all
levels of influence -- individual, interperson-al, organizational, community, and publicpolicy.184 Many of the plans draw on guidancefrom CDC to use policy and environmentalchanges to target 6 specific behaviors:
� Physical activity.
� Fruit and vegetable intake.
� Breastfeeding.
� Consumption of sugar-sweetened beverages.
� Intake of high energy density foods.
� Television viewing.
Some states focus exclusively, or to a largeextent, on childhood obesity. Generally, stateshave goals to improve childhood healththrough decreasing the amount of time chil-dren spend in front of the TV and other elec-tronic entertainment devices, increasing phys-ical activities available to all children, usingpublic schools to implement physical activity
Each state identifies goals and strategies forimproving the health of its citizens. Statesare undertaking a wide range of efforts toaddress the obesity crisis. Since 2003, TFAHhas been reviewing these state policies. Forthis year’s report, TFAH produced a supple-ment to F as in Fat: How Obesity Policies AreFailing in America entitled, Obesity-RelatedLegislative Action in States, which providesgreater detail about specific legislation. Thesupplement is available on TFAH’s Web site,www.healthyamericans.org.
This section provides an overview and updateto previous years’ analyses and includes:
A. State Obesity Plans.
B. Survey of State Chronic Disease Directorsand Directors of Health Promotion andEducation.
C. State Obesity-Related Legislation.
D. Qualitative Evaluation of State Obesity-Related Legislation.
State Responsibilitiesand Policies 3S E C T I O N
In this section, TFAH examines trends in state legislative actions and poli-
cies aimed at obesity reduction. This overview is intended to help inform
and begin an evaluation of whether these efforts are having a positive impact.
A. STATE OBESITY PLANS
38
and healthy nutrition programs, and encour-aging communities to help raise healthierchildren through local involvement.
While some states have more general goalsof decreasing the percentage of overweightpeople in their state, others have set outvery specific goals. Utah, for instance,expects that by 2010 the percentage of chil-dren in that state who report being over-weight by 10 percent or more will decreasefrom 12.3 percent to 10.8 percent.185
Developing a plan to address the problem ofoverweight and obesity is an important step inthe process of implementing change, but it iscertainly not the only step. In order to turn aplan into action, the state must secure theappropriate funding. Unfortunately, a major-ity of the state plans do not address the issueof funding, or only briefly mention the needto secure funding. Many of the plans refer tothe need to secure resources for implementa-tion or suggest that local organizations applyfor mini-grants, but beyond that there is nomention of how the plan will become a reali-ty. Fewer than 10 states include details regard-ing strategies for funding. New Mexico is oneof the few that includes a detailed descriptionof how it intends to fund the plan by linkingeach objective to a funding source.
It is also important to include a system ofmeasurement to determine what the statehas accomplished, and to ensure that thestate continues to work toward the plan’sgoals. The majority of states have a surveil-lance and evaluation section within theirplans to ensure that programs are moni-tored, and the programs correlate with thegoals of the plan. One of the best ways tomonitor and evaluate a plan is through pilotprograms, which many of the states havealready instituted or intend to institute.
While all the plans suggest programs andactivities to improve health and nutrition,20 of the plans include current rates of over-weight or obesity within the state and also atarget percentage that should be reached bya certain time. For example, one objectiveof the Arkansas plan is to increase the per-centage of children and adults who have ahealthy BMI. For adults, the goal is to gofrom 38 percent in 2003 to 42.1 percent in2010, and for children the goal is to go from60 percent to 65 percent.186
Publishing a nutrition and physical activity planis just the first step of many that a state musttake. Implementation and follow-through arethe next, and most important, steps.
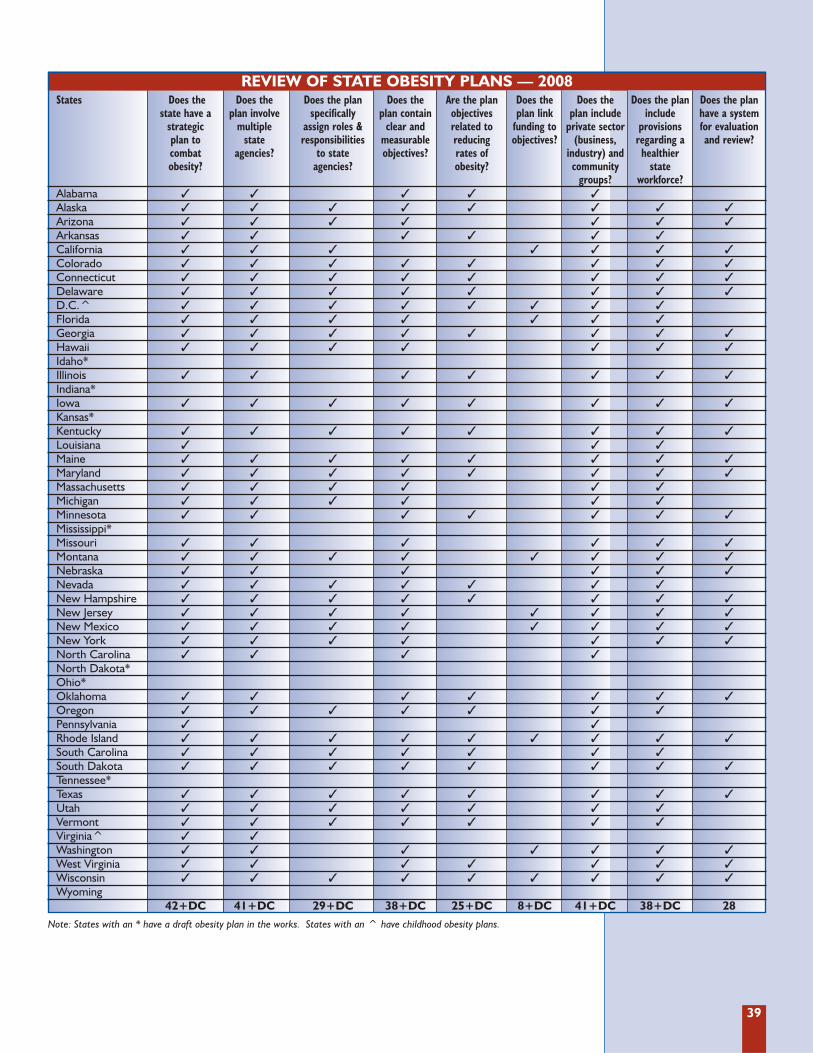
39
REVIEW OF STATE OBESITY PLANS — 2008States Does the Does the Does the plan Does the Are the plan Does the Does the Does the plan Does the plan
state have a plan involve specifically plan contain objectives plan link plan include include have a system strategic multiple assign roles & clear and related to funding to private sector provisions for evaluation plan to state responsibilities measurable reducing objectives? (business, regarding a and review?combat agencies? to state objectives? rates of industry) and healthier obesity? agencies? obesity? community state
groups? workforce?Alabama � � � � �Alaska � � � � � � � �Arizona � � � � � � �Arkansas � � � � � �California � � � � � � �Colorado � � � � � � � �Connecticut � � � � � � � �Delaware � � � � � � � �D.C.^ � � � � � � � �Florida � � � � � � �Georgia � � � � � � � �Hawaii � � � � � � �Idaho*Illinois � � � � � � �Indiana*Iowa � � � � � � � �Kansas*Kentucky � � � � � � � �Louisiana � � �Maine � � � � � � � �Maryland � � � � � � � �Massachusetts � � � � � �Michigan � � � � � �Minnesota � � � � � � �Mississippi*Missouri � � � � � �Montana � � � � � � � �Nebraska � � � � � �Nevada � � � � � � �New Hampshire � � � � � � � �New Jersey � � � � � � � �New Mexico � � � � � � � �New York � � � � � � �North Carolina � � � �North Dakota*Ohio*Oklahoma � � � � � � �Oregon � � � � � � �Pennsylvania � �Rhode Island � � � � � � � � �South Carolina � � � � � � �South Dakota � � � � � � � �Tennessee*Texas � � � � � � � �Utah � � � � � � �Vermont � � � � � � �Virginia^ � �Washington � � � � � � �West Virginia � � � � � � �Wisconsin � � � � � � � � �Wyoming
42+DC 41+DC 29+DC 38+DC 25+DC 8+DC 41+DC 38+DC 28
Note: States with an * have a draft obesity plan in the works. States with an ^ have childhood obesity plans.
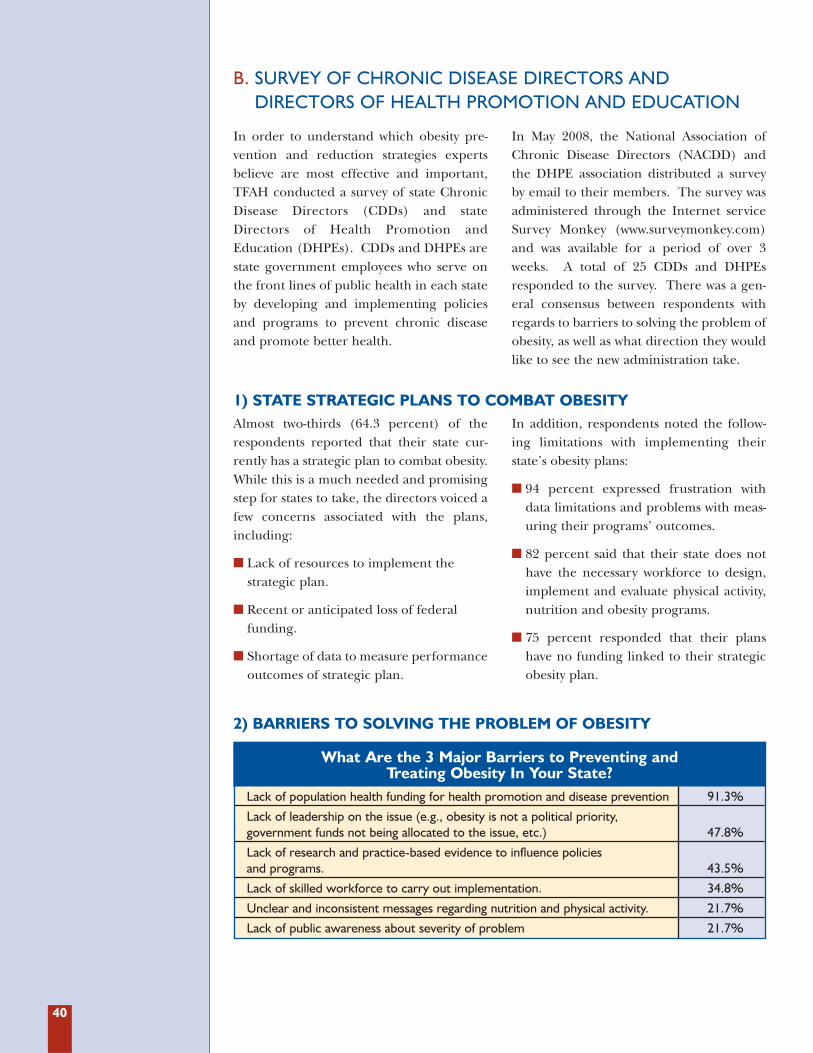
40
In order to understand which obesity pre-vention and reduction strategies expertsbelieve are most effective and important,TFAH conducted a survey of state ChronicDisease Directors (CDDs) and stateDirectors of Health Promotion andEducation (DHPEs). CDDs and DHPEs arestate government employees who serve onthe front lines of public health in each stateby developing and implementing policiesand programs to prevent chronic diseaseand promote better health.
In May 2008, the National Association ofChronic Disease Directors (NACDD) andthe DHPE association distributed a surveyby email to their members. The survey wasadministered through the Internet serviceSurvey Monkey (www.surveymonkey.com)and was available for a period of over 3weeks. A total of 25 CDDs and DHPEsresponded to the survey. There was a gen-eral consensus between respondents withregards to barriers to solving the problem ofobesity, as well as what direction they wouldlike to see the new administration take.
Almost two-thirds (64.3 percent) of therespondents reported that their state cur-rently has a strategic plan to combat obesity.While this is a much needed and promisingstep for states to take, the directors voiced afew concerns associated with the plans,including:
� Lack of resources to implement thestrategic plan.
� Recent or anticipated loss of federalfunding.
� Shortage of data to measure performanceoutcomes of strategic plan.
In addition, respondents noted the follow-ing limitations with implementing theirstate’s obesity plans:
� 94 percent expressed frustration withdata limitations and problems with meas-uring their programs’ outcomes.
� 82 percent said that their state does nothave the necessary workforce to design,implement and evaluate physical activity,nutrition and obesity programs.
� 75 percent responded that their planshave no funding linked to their strategicobesity plan.
B. SURVEY OF CHRONIC DISEASE DIRECTORS AND DIRECTORS OF HEALTH PROMOTION AND EDUCATION
1) STATE STRATEGIC PLANS TO COMBAT OBESITY
2) BARRIERS TO SOLVING THE PROBLEM OF OBESITY
What Are the 3 Major Barriers to Preventing and Treating Obesity In Your State?
Lack of population health funding for health promotion and disease prevention 91.3%
Lack of leadership on the issue (e.g., obesity is not a political priority, government funds not being allocated to the issue, etc.) 47.8%
Lack of research and practice-based evidence to influence policies and programs. 43.5%
Lack of skilled workforce to carry out implementation. 34.8%
Unclear and inconsistent messages regarding nutrition and physical activity. 21.7%
Lack of public awareness about severity of problem 21.7%
41
The CDDs and DHPEs reported the top 3 bar-riers to treating obesity in each state included:
� Lack of funding for health promotionand disease prevention.
� Lack of leadership.
� Lack of research and practice-based evi-dence to influence policies and programs.
Respondents also expressed concern aboutlack of insurance coverage for obesity treat-ments, such as nutrition counseling.
The 2008 presidential election presents aunique opportunity for public health officialsto communicate their priorities to the nextadministration. TFAH asked the CDDs andDHPEs for their recommendations for thenext administration regarding one impor-tant action the federal government shouldtake to address adult and childhood obesity.
Overall many of the directors had similarideas. The top 3 recommendations foradults included:
� Funding for all states to address obesity.
� Strengthen worksite wellness programs.
� Work on environmental changes, specifi-cally improving the built environment.
In addition to funding, CDDs and DHPEswould like to see more evidence-basedresearch that shows the most effective strate-gies for obesity reduction. Nearly half of therespondents said that more research isneeded on individual and community-levelinterventions, including policy changes.
Respondents identified 2 actions as crucialfor childhood obesity:
� Increase physical activity opportunities,specifically during the school day.
� Improve nutrition in schools, homes, com-munities, and in advertisements directedat children.
3) SUGGESTED PRIORITIES FOR THE NEXT ADMINISTRATION
TFAH asked CDDs and DHPEs what theirtop research question would be if they coulddetermine the National Institute of Health’s(NIH) research agenda for obesity. Again,many of the respondents emphasized theneed for more evidence-based strategies forpreventing and treating obesity. In particu-lar, respondents wanted NIH to focus on thefollowing questions:
� How can people maintain weight loss?Other than gastric surgery, what are themost effective treatments for obesity?Given our very limited resources, can weidentify the candidates for treatment thatwill have the best chance for success?
� How do we translate research into practice?Instead of focusing on clinical approachesto fighting obesity, researchers need to look
at community, worksite and school-basedapproaches.
� Do physical activity/physical educationrequirements and high nutrition stan-dards help students perform better in theclassroom? If there is a connectionbetween healthier school environmentsand students’ academic performance thiscould bring together public health advo-cates and education advocates.
� What are the most effective ways to moti-vate and encourage people to leadhealthy, active lives? What communica-tion messages work?
� Is there evidence -- both in terms ofimproved health and a return on invest-ment -- to support coverage of preventionservices in benefits plans?
4) FOCUS OF NIH OBESITY PREVENTION RESEARCH AGENDA

42
Since 2003, TFAH has tracked state obesity-related legislation in the following cate-gories: school nutrition, physical education,physical activity, and height and weightmeasurements; tax policies; and litigation.This section provides an updated summary
state obesity-related legislation enactedbetween July 1, 2007 and June 30, 2008.
Additional details about the legislation canbe found in the supplement to F as in Fat:How Obesity Policies Are Failing in America onTFAH’s Web site.
C. STATE OBESITY-RELATED LEGISLATION
School-based programs have been shown tohave the potential to yield positive results inpreventing and reducing obesity.187 Childrenspend large amounts of time at school and inbefore- and after-school programs, oftenconsuming as many as 2 meals and snacks inthese settings.
The more than 14,000 school districts in theUnited States have primary jurisdiction forsetting local school policies. States canestablish policies or pass legislation thataffect schools, but the school districts typi-
cally have discretion in deciding if they willfollow them, a principle known as local con-trol. States often try to create incentives forfollowing policies, such as attaching compli-ance rules to state funding.
Emerging school-based efforts have focusedon improving the quality of food sold inschools, limiting sales of less nutritious foods,improving physical education and healtheducation, and encouraging increased physi-cal activity either within the school day orthrough extracurricular activities.
1) SCHOOL-FOCUSED OBESITY LEGISLATION
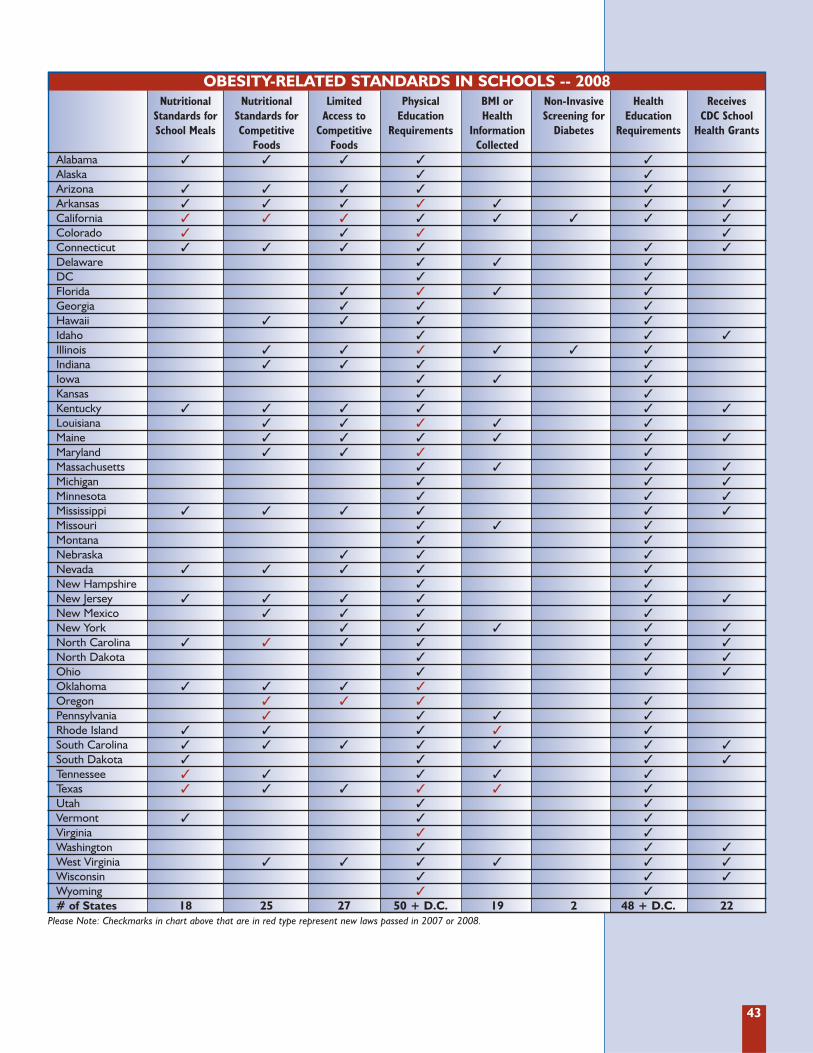
43
OBESITY-RELATED STANDARDS IN SCHOOLS -- 2008Nutritional Nutritional Limited Physical BMI or Non-Invasive Health Receives
Standards for Standards for Access to Education Health Screening for Education CDC School School Meals Competitive Competitive Requirements Information Diabetes Requirements Health Grants
Foods Foods CollectedAlabama � � � � �
Alaska � �
Arizona � � � � � �
Arkansas � � � � � � �
California � � � � � � � �
Colorado � � � �
Connecticut � � � � � �
Delaware � � �
DC � �
Florida � � � �
Georgia � � �
Hawaii � � � �
Idaho � � �
Illinois � � � � � �
Indiana � � � �
Iowa � � �
Kansas � �
Kentucky � � � � � �
Louisiana � � � � �
Maine � � � � � �
Maryland � � � �
Massachusetts � � � �
Michigan � � �
Minnesota � � �
Mississippi � � � � � �
Missouri � � �
Montana � �
Nebraska � � �
Nevada � � � � �
New Hampshire � �
New Jersey � � � � � �
New Mexico � � � �
New York � � � � �
North Carolina � � � � � �
North Dakota � � �
Ohio � � �
Oklahoma � � � �
Oregon � � � �
Pennsylvania � � � �
Rhode Island � � � � �
South Carolina � � � � � � �
South Dakota � � � �
Tennessee � � � � �
Texas � � � � � �
Utah � �
Vermont � � �
Virginia � �
Washington � � �
West Virginia � � � � � �
Wisconsin � � �
Wyoming � �
# of States 18 25 27 50 + D.C. 19 2 48 + D.C. 22Please Note: Checkmarks in chart above that are in red type represent new laws passed in 2007 or 2008.
44
� Eighteen states set nutritional stan-dards for school lunches, breakfasts,and snacks that are stricter thanexisting USDA requirements --Alabama, Arizona, Arkansas, California,Colorado, Connecticut, Kentucky,Mississippi, Nevada, New Jersey, NorthCarolina, Oklahoma, Rhode Island, SouthCarolina, South Dakota, Tennessee, Texasand Vermont.
States that implemented new regulationsbetween July 1, 2007, and June 30, 2008,include:
� California required as a condition toreceiving funds from special grants for childnutrition in schools, commencing in 2007-2008 fiscal year, school districts and schoolsshall be in compliance with USDA guidelinesor the menu planning options of ShapingHealth as Partners in Education developedby the state (SHAPE California network)(SB 80 related bill) and prohibited from sell-
ing or serving any food item that has in anyway been deep fried, par fried, or flash friedor sell or serve a food item containing artifi-cial trans fat (SB 132).
� Colorado established the Child NutritionSchool Lunch Protection Program toensure that each student in a Coloradopublic school has access to a healthy lunchat school. One objective includes increas-ing students’ consumption of whole grains,fruits and vegetables, vitamins, calcium,protein, fiber, and iron; and reduce theconsumption of sodium, cholesterol, sugarand calories (SB08-123).
� Tennessee required each local schoolboard to submit to the commissioner aplan to require that availability of localagriculture products (SB 3341).
� Texas established a mandatory reportrelating to reducing the amount of trans fatin schools (HB 4062).
School meal nutrition standards do notreflect current nutrition science and, unfor-tunately, are unlikely to be updated forabout 3 years. Since 1994, the RichardRussell National School Lunch Act hasrequired the school lunches to meet theDietary Guidelines for Americans (DGAs).In 2004, the Child Nutrition and WICReauthorization Act of 2004 (P.L. 108-265)required the U.S. Secretary of Agricultureto issue school nutrition guidelines thatwould ensure that American schoolchildrenconsume foods recommended in the mostrecent DGAs. However, USDA has issuedno proposed regulations in the 3 yearssince the release of the 2005 DGAs.188
Instead, after deliberating internally forthose years, USDA was unable to come toa consensus and contracted with theInstitute of Medicine (IOM) to convene a
panel of experts on child nutrition. In late2009, the IOM Committee on NutritionStandards for School Lunch and BreakfastPrograms is expected to provide USDAwith recommendations for updating theschool meal programs’ nutrition require-ments. Once USDA receives the IOM rec-ommendations, agency officials will thenseek to incorporate them into formalUSDA guidance, which is expected to beissued some time in 2010. A final rule willtake even longer to be issued. This turn ofevents effectively postpones the update ofschool meal nutrition standards by 5 yearsbeyond when they were due. Given thefact that school meal nutrition standardslack standards for sodium, trans fat, andwhole grains, and that the fruit and veg-etable content is too low, this delay is ofconsiderable public health concern.
SCHOOL LUNCHES
SCHOOL MEAL NUTRITION GUIDELINES
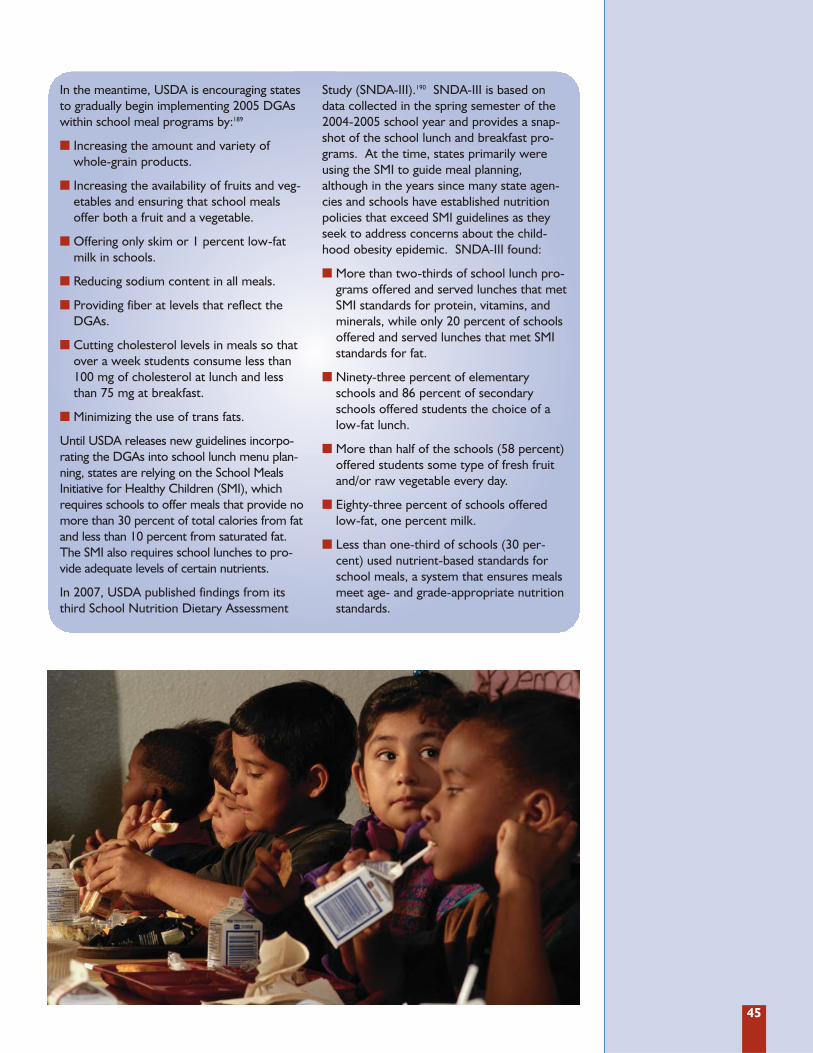
45
In the meantime, USDA is encouraging statesto gradually begin implementing 2005 DGAswithin school meal programs by:189
� Increasing the amount and variety ofwhole-grain products.
� Increasing the availability of fruits and veg-etables and ensuring that school mealsoffer both a fruit and a vegetable.
� Offering only skim or 1 percent low-fatmilk in schools.
� Reducing sodium content in all meals.
� Providing fiber at levels that reflect theDGAs.
� Cutting cholesterol levels in meals so thatover a week students consume less than100 mg of cholesterol at lunch and lessthan 75 mg at breakfast.
� Minimizing the use of trans fats.
Until USDA releases new guidelines incorpo-rating the DGAs into school lunch menu plan-ning, states are relying on the School MealsInitiative for Healthy Children (SMI), whichrequires schools to offer meals that provide nomore than 30 percent of total calories from fatand less than 10 percent from saturated fat.The SMI also requires school lunches to pro-vide adequate levels of certain nutrients.
In 2007, USDA published findings from itsthird School Nutrition Dietary Assessment
Study (SNDA-III).190 SNDA-III is based ondata collected in the spring semester of the2004-2005 school year and provides a snap-shot of the school lunch and breakfast pro-grams. At the time, states primarily wereusing the SMI to guide meal planning,although in the years since many state agen-cies and schools have established nutritionpolicies that exceed SMI guidelines as theyseek to address concerns about the child-hood obesity epidemic. SNDA-III found:
� More than two-thirds of school lunch pro-grams offered and served lunches that metSMI standards for protein, vitamins, andminerals, while only 20 percent of schoolsoffered and served lunches that met SMIstandards for fat.
� Ninety-three percent of elementaryschools and 86 percent of secondaryschools offered students the choice of alow-fat lunch.
� More than half of the schools (58 percent)offered students some type of fresh fruitand/or raw vegetable every day.
� Eighty-three percent of schools offeredlow-fat, one percent milk.
� Less than one-third of schools (30 per-cent) used nutrient-based standards forschool meals, a system that ensures mealsmeet age- and grade-appropriate nutritionstandards.
46
Competitive foods are defined as foods soldat the same time as National School LunchProgram foods are available.191 These foodsare sold in vending machines, a la carte lines,and school stores.
� Twenty-five states have nutritional stan-dards for competitive foods sold alacarte, in vending machines, in schoolstores, or in school bake sales -- Alabama,Arizona, Arkansas, California, Connecticut,Hawaii, Illinois, Indiana, Kentucky, Louisiana,Maine, Maryland, Mississippi, Nevada, NewJersey, New Mexico, North Carolina,Oklahoma, Oregon, Pennsylvania, RhodeIsland, South Carolina, Tennessee, Texas, andWest Virginia.
States that implemented new regulationsbetween July 1, 2007, and June 30, 2008,include:
� California Commencing July 1, 2009,schools or school district are prohibited,through a vending machine or school foodservice establishment during school hoursand up to 1/2 hour before and after schoolhours, from making available to elementaryor middle school pupils a food containingartificial trans fat and would prohibit the useof artificial trans fat in the preparation of afood item served to those pupils (SB 490).
� North Carolina sets forth a wellness pilotfor state employees as well as directs theBoard of Education to establish statewidenutrition standards for school meals, a lacarte foods and beverages, and items servedin the After School Snack Program adminis-tered by the Department of PublicInstruction and child nutrition programs oflocal school administrative units. The nutri-tion standards will promote gradual changesto increase fruits and vegetables, increasewhole grain products, and decrease foodshigh in total fat, trans fat, saturated fat, andsugar. To start in elementary schools fol-lowed by middle and high schools (HB1473).
� Oregon provides restrictions on the nutri-tional content and caloric load of certain foodsand beverages sold in schools during specifiedtimes of school operation (HB 2650).
� Pennsylvania directs the Department ofEducation to establish a School NutritionIncentive Program. The program shall pro-vide a supplemental school lunch and break-fast reimbursement to any school in a local
education agency that has adopted andimplemented the Pennsylvania Departmentof Education’s Nutrition Standards forCompetitive Foods.192 The standards applyto food, snacks, and beverages sold a lacarte, in vending machines, at fundraisers, atschool stores, and those served in classroomparties and holiday celebrations. (H.B. 842).
� Twenty-seven states limit when andwhere competitive foods may be soldbeyond federal requirements -- Alabama,Arizona, Arkansas, California, Colorado,Connecticut, Florida, Georgia, Hawaii,Illinois, Indiana, Kentucky, Louisiana, Maine,Maryland, Mississippi, Nebraska, Nevada,New Jersey, New Mexico, New York,North Carolina, Oklahoma, Oregon, SouthCarolina, Texas, and West Virginia.
States that implemented new regulationsbetween July 1, 2007, and June 30, 2008,include:
� California law mandates that as of July 1,2009, schools or school district are prohibited,through a vending machine or school foodservice establishment during school hours andup to 1/2 hour before and after school hours,from making available to elementary or mid-dle school pupils a food containing artificialtrans fat and would prohibit the use of artificialtrans fat in the preparation of a food itemserved to those pupils (SB 490).
� Oregon law requires that all food and bev-erage items sold in public K-12 grade schoolsmust at minimum meet nutrition standards.Those standards apply to food and beverageitems sold in a school at all times during theregular or extended school day when theactivities in the school are primarily underthe control of the school district board. Thisincludes, but is not limited to, the timebefore or after classes are in session and thetime when the school is being used for activi-ties such as clubs, yearbook, band or choirpractice, student government, dramarehearsals or child care programs. The stan-dards required by this section do not applyto food and beverage items sold in a schoolat times when the school is being used forschool-related events or nonschool-relatedevents for which parents and other adultsare a significant part of an audience or areselling food or beverage items before, duringor after the event, such as a sporting eventor another interscholastic activity, a play or aband or choir concert (HB 2650).
COMPETITIVE FOODS
47
Competitive foods are defined as foods sold at the sametime as National School Lunch Program foods are available.193
These foods are sold in vending machines, a la carte lines,and school stores. Although competitive foods sometimesinclude fruits and vegetables, more often than not they arehigh in fat, sugar, and salt, which increases the likelihood ofover-consumption of calories and unhealthy weight gain.194
According to USDA’s School Nutrition Dietary AssessmentStudy III (SNDA-III), the prevalence of competitive foods iswidespread. Approximately one-third of elementary schoolsand close to two-thirds of middle and high schools had foodsor beverages other than milk for sale through vendingmachines, a la carte, and/or school stores during the lunchperiod.195 Vending machines, which are often stocked withchips, candy, and cookies, were available to students in morethan 80 percent of middle schools and 97 percent of highschools.196 A separate study published in the journal Pediatricsfound that food items sold a la carte were found in 71 percentof elementary schools, 92 percent of middle schools, and 93percent of high schools. Of these schools, almost 80 percentprovided unhealthy food items in their a la carte options.197
In addition to the diet-related health risks, USDA has highlight-ed a number of other concerns related to competitive foods198:
� Impact on school meal programs: The increase incompetitive food sales and accompanying decrease in stu-dent participation in the National School Lunch Programhave implications for the overall viability of the program.Declining participation results in decreased cash and com-modity support from USDA for school meals. The reduc-tion in federal funds may also contribute to less intereston the part of schools in maintaining quality school mealprograms that meet set nutritional standards, undermin-ing the substantial federal investment in programs to pro-vide healthy meals to children.
� Stigmatization of school meal programs: USDA hasexpressed concern that the National School LunchProgram is often viewed as just for low-income childrenrather than being available to all children. Often, affluentchildren spend their lunch money on items from vendingmachines and a la carte lines; these foods and beveragestend to be more expensive than the school meal.
� A mixed message: When children are taught in theclassroom about good nutrition but are surrounded byvending machines, snack bars, school stores, and a lacarte foods of poor nutritional quality, they receive themessage that good nutrition does not actually matter andis therefore not important.199
Despite the low nutritional value of competitive foods, manyschools sell these products to gain much needed revenue.A 2005 report by the U.S. Government Accountability
Office (GAO) found that 9 out of every 10 public schools inthe United States offered competitive foods to their stu-dents, and almost 30 percent of public high schools earnedmore than $125,000 from competitive food sales.200
A 2007 review of school nutrition policies regarding com-petitive foods by the Center for Science in the PublicInterest (CSPI) found that while states have been strength-ening their school nutrition policies over the past 10 years,“results show that the changes occurring at the state level,while positive, are fragmented, incremental, and not hap-pening quickly enough to reach all schools in a timelyway.”201 The report noted that while USDA sets detailednutrition standards for federally subsidized school lunches,USDA’s policy for competitive foods is “woefully out ofdate.” In fact, although USDA can regulate the quality andkinds of food sold in school cafeterias during lunch hours, itdoes not have the authority to regulate foods sold eitheroutside of the cafeteria or outside of meal times, such asfood sold in school stores, vending machines, fundraisers,etc. Congress would need to pass a law to allow USDA toset nutrient standards for items sold outside of the cafeteriain schools. However, USDA has full authority to update itsnutrition standards for foods sold in the cafeteria outside ofschool meals (e.g., through the a la carte line), and sinceUSDA has not updated this standard since 1979 it isextremely out of date from a nutrition science perspective.
A 2007 IOM report, Nutrition Standards for Foods inSchools, does provides nutrition standards for competitivefoods, both those sold in vending machines and in the cafete-ria a la carte lines. The report states that while federal schoolmeal programs should be the primary source of foods andbeverages at schools, if competitive foods are available, theyshould “consist of nutritious fruits, vegetables, whole grains,and nonfat or low-fat milk and dairy products.”202
Proceeds from competitive food sales are often used to payfor special activities or items not covered by the school’sbudget. As a result, there have been a number of challengeswhen local schools or parent-teacher associations havesought to make sure only healthy foods are sold in schools.The biggest challenge results from the fear of decreasedrevenue from competitive foods sold a la carte, in vendingmachines, and in school stores creating a financial hardshipfor the school.203
A 2008 review of the literature, however, found that schooldistricts’ fears about lost revenues due to changes in com-petitive food offerings were unfounded. In fact, in someschools, there was increased student participation in theschool lunch program -- both from students paying full pricefor meals and from students receiving free or partially subsi-dized meals -- which may have compensated for any rev-enue losses in snack sales.204
CONCERNS ABOUT COMPETITIVE FOODS IN SCHOOLS
48
The 2005 IOM report Preventing ChildhoodObesity: Health in the Balance recommend-ed that state and local education authoritiesand schools should ensure that all childrenand youth participate in a minimum of 30minutes of moderate to vigorous physicalactivity during the school day.205
� Every state has some form of require-ments for physical education for students,however, these requirements are often limitedor not enforced and many of the programsare inadequate with respect to quality.
States that implemented new regulationsbetween July 1, 2007, and June 30, 2008,include:
� Arkansas added K-6th grade physical activ-ity set at a) 60 minutes per week of physicaleducation and b) 90 minutes of physicalactivity per week, which may include dailyrecess and/or physical education instruction.Grades 5-8 requires 60 minutes of physicaleducation with no added requirement forphysical activity; and for 9-12 grades, 1/2unit of physical education is required forgraduation (HB1039).
� California clarified that a pupil may begranted exemption from courses in physi-cal education if the pupil has met at least 5of the 6 standards of the physical perform-ance test (SB 602).
� Colorado included the addition of schooldistrict wellness programs (HB 08-1224).
� Florida mandated 30 minutes of physicaleducation per day for grades 6-8 (changedfrom encouraged). Each district board shallprovide 150 minutes of physical educationeach week for students in grades K-5 (SB608). Also updated the contents of a schooldistrict’s written physical education policy toadd details concerning the benefits of physi-cal education, and the availability of one-on-one counseling concerning such benefits.Provides for the conduction of at least 30consecutive minutes of physical educationfor students in K-6 and requires a one classperiod per day of physical education for onesemester for students in grades 6 through 8.Also provides waivers (SB 610).
� Illinois law provided that an approvedwaiver or modification to a physical educa-tion mandate remain in effect for no longerthan two school years. The waiver can berenewed, but no more than twice. The
new provision will require school systemsto periodically review the waivers put intoplace, as opposed to allowing them to con-tinue without review (HB 1839).
� Louisiana implemented the position of ahealth and physical education coordinator bythe Department of Education (Act No.180).
� Maryland established a task force on studentphysical fitness in State Public Schools (SB955). Also now requires county boards ofeducation to ensure that students with disabili-ties have opportunities in specified physicaleducation and athletic programs (HB 1411).
� Oklahoma increased P.E. requirement inelementary schools from 60 minutes to120 minutes each week, beginning with2008-2009 school year (SB 1186).
� Oregon every public school student inkindergarten through grade 8 shall participatein physical education for the entire schoolyear. Students in kindergarten through grade5 shall participate in physical education for atleast 150 minutes during each school week.Students in grades 6 through 8 shall partici-pate in physical education for at least 225minutes during each school week (HB 3141).
� Texas students below sixth grade arerequired to participate in moderate or vigor-ous daily physical activity for at least 30 min-utes throughout the school year as part ofthe district’s physical education curriculum orthrough structured activity during recess.Beginning with the 2008-09 school year, stu-dents in grades 6 through 8 will be requiredto participate in daily physical activity for atleast 30 minutes for at least four semestersduring those grade levels (SB 530).
� Virginia required local school boards to pro-vide a physical fitness program with a goal of150 minutes per week for all students (HB242).
� West Virginia implemented a wellnesspolicy that states that school and districtprocesses should include a focus on devel-oping ethical and responsible character,personal dispositions that promote person-al wellness through planned daily physicalactivity and healthy eating habits consistentwith high nutritional guidelines (SB 595).
� Only 2 states -- Colorado andOklahoma -- do not require schools toprovide health education.
PHYSICAL EDUCATION AND HEALTH EDUCATION IN SCHOOLS

49
A 2008 study by researchers at the Johns HopkinsBloomberg School of Public Health found that high schoolstudents who participate in physical education 5 days a weekare 28 percent less likely to become overweight as adults.206
The Institute of Medicine, the U.S. Department of Healthand Human Services, and the American Academy ofPediatrics all recommend that students in all grade levelsengage in daily physical education.207,208,209 The reality, howev-er, is that only 54 percent of high school students attendedPE classes in an average week when they were in school andonly 30 percent attended P.E. classes daily. In addition, par-ticipation in P.E. class declines as students grow older,although the reason for the decline is more likely related toschool curriculum requirements.210,211 According to the 2006School Health Policies and Programs study212:
� 2 percent of high schools required P.E. daily for entireyear;
� 7 percent of high schools required P.E. daily for half ayear;
� 3 percent of high schools required P.E. for 3 days perweek for entire year; and
� 9 percent of high schools required P.E. for 3 days perweek for half a year.
The National Association for Sport and Physical Education(NASPE) recommends that schools provide 150 minutes ofinstruction of physical education for elementary school chil-dren, and 225 minutes for middle and high school studentsper week for the entire school year.213
PHYSICAL EDUCATION AND ADULT BMI
The positive effects of physical activity on brain function arewell documented with a number of studies showing thataerobic activity improves cognition and performance.214
Moderate and vigorous exercise increases the flow of bloodto the brain, which has a stimulating effect.215 Researchersspeculate that this in turn makes schoolchildren more likelyto pay attention in class during the school day than childrenwho do not get any physical activity.216 And, in fact, there isa growing body of evidence that suggests physical activity isrelated to academic achievement.217
Of 14 published studies investigating the link between par-ticipation in physical activity and academic performance, 11found that regular participation in physical activity is associ-ated with improved academic performance.218
The following are some highlights from recent research onphysical activity, physical education, and academic performance:
� A 2008 study by researchers at CDC found that higherlevels of physical education in school were associatedwith an academic benefit among girls.219 There was, how-ever, no association between the 2 for boys. Similarresults were reported in a 1996 study of French-speakingCanadian schoolchildren.220 Some have suggested thatschoolgirls are less physically active than schoolboys andthus are more affected by the increase in physical activity.
� A 2007 study found that children who performed well on2 measures of physical fitness tended to score higher onstate reading and math exams, regardless of gender orsocioeconomic status.221
� A 2006 study analyzed data from nearly 12,000 teens acrossthe United States to examine the relationship between phys-ical activity and academic performance. Adolescents whoreported either participating in school activities such as P.E.and team sports, or playing sports with their parents, were20 percent more likely than those teens who did not engagein physical activity to earn an “A” in math or English.222
There is also ample evidence that daily physical educationdoes not adversely affect academic performance. Manyschool systems have eliminated P.E. or severely curtailed itsoffering to focus on core academic subjects that students aretested on as part of the No Child Left Behind Act; this isbased on the assumption that sacrificing P.E. will give studentsand teachers more time to prepare for standardized tests andthereby boost the schools’ scores on those tests. But in fact,a number of studies show that students who spend time inP.E. or other school-based physical activities increased ormaintained their grades and scores on standardized tests eventhough they received less classroom time.223 A 2006 study ofsixth graders found that students enrolled in P.E. had similargrades and standardized test scores as students who werenot enrolled in P.E., despite receiving nearly an hour less ofdaily classroom instruction on core academic subjects.224
The fact that investigators have concluded that, at the veryleast, extra time spent in P.E. does not hurt academicachievement is significant. Researchers are hopeful that thisfinding may persuade some school districts that reinstatingP.E. classes need not come at the expense of their pupils’academic performance.
PHYSICAL EDUCATION AND ACADEMIC ACHIEVEMENT
50
� Seventeen states have passed Body Mass Index (BMI)screening requirements in schools OR legislationrequiring weight-related assessments other than BMI.
� States with BMI screening requirements: Arkansas,California, Florida, Illinois, Maine, Missouri, New York,Pennsylvania, Tennessee, and West Virginia.
� States with weight-related screening requirements:Delaware, Iowa, Louisiana, Massachusetts, Rhode Island,South Carolina, and Texas.
States that implemented new restrictions between July 1,2007 and June 30, 2008 include:
� New York passed new legislation that addresses BMIassessment through health certificates in schools as directedby Commissioner of Health. Parents may refuse to beincluded in the survey. Each school district shall provide
commissioner of Health with any information for purposesof an obesity report (SB2108).
� Rhode Island enacted a new law that establishes thestate’s healthy weight pilot program to be implemented inseveral cities and towns. The program will incorporate acombination of physical activity and nutrition plans that aimto encourage healthy weight and weight management inchildren. Funding for the program will come from federalgrants, funds allocated to the state for the purpose of com-bating obesity and other sources deemed appropriate bythe legislature (HB 5900).
� Texas passed new legislation that says school districts mustassess the physical fitness levels of all students in grades 3through 12 (SB 530).
� Two states have enacted legislation requiring screeningstudents for risk of type 2 diabetes -- California and Illinois.
STUDENT HEALTH SCREENINGS
The Coronary Artery Risk Detection in AppalachianCommunities (CARDIAC) Project was launched 10 years agoin an effort to combat high levels of cardiovascular diseasethat afflict West Virginians -- adults and children -- in largenumbers. The school-based prevention program started outin 3 counties in West Virginia and has since expanded to all ofthe state’s 55 counties. In addition to providing healthscreenings to elementary school children across the state, theCARDIAC Project mails a comprehensive health report to thechildren’s families. The detailed report not only containsinformation on how to interpret the screening results, but
includes nutrition and physical activity recommendations forchildren and families.225
According to recent data from the project, the intervention isworking. In the 2006-2007 school year, 27.7 percent of fifthgraders were obese based on BMI screening. That numberdropped to 25.8 percent in the 2007-2008 school year.226 Childrenin other grades experienced declines in overweight and obesity aswell, with the percentage of obese kindergartners falling from 20percent to 17 percent. Among second-graders, the percentage ofoverweight students dropped from 19 percent to 15 percent.227
WEST VIRGINIA’S CARDIAC PROJECT
A May 2008 article in Pediatrics, reported the results of aschool-based intervention at 5 elementary schools in inner-cityPhiladelphia. The School Nutrition Policy Initiative focused onthe prevention of overweight and obesity among children ingrades 4 though 6 over a 2-year period. The program includ-ed 5 components: School self-assessment; nutrition education;nutrition policy; social marketing; and parent outreach.228
The school self-assessment looked at environmental issues andfocused on developing an action plan for change. Among therecommendations: Limit the use of food as a reward; limit theuse of unhealthy food for fundraising (e.g., bake sales); promoteactive recess; and serve breakfast in classrooms. School staffreceived approximately 10 hours of training in nutrition educa-tion in order to enable them to provide 50 hours of food andnutrition education per school year. School food service pro-grams removed all sodas, sugary drinks, and snacks that did not
meet the Dietary Guidelines for Americans. The program usedsocial marketing to increase the consumption of healthy foodsand promote active lifestyles. Finally, the program included afamily outreach component to encourage parents and studentsto purchase healthy snacks, limit TV viewing and be more active.
At the start of the program, about 40 percent of the 1,349 stu-dents in grades 4 through 6 were overweight or obese. Overthe course of the 2-year program, there was a 50 percentreduction in the number of children who became overweight.In the control schools, 15 percent of the children became over-weight compared to 7.5 percent in the intervention schools.There were no differences observed in the number of childrenwho were obese. This, coupled with the fact that 7.5 percentof students in the intervention schools still became overweightsuggests that stronger programs may be needed.
PHILADELPHIA’S SCHOOL-BASED OBESITY PREVENTION INTERVENTION
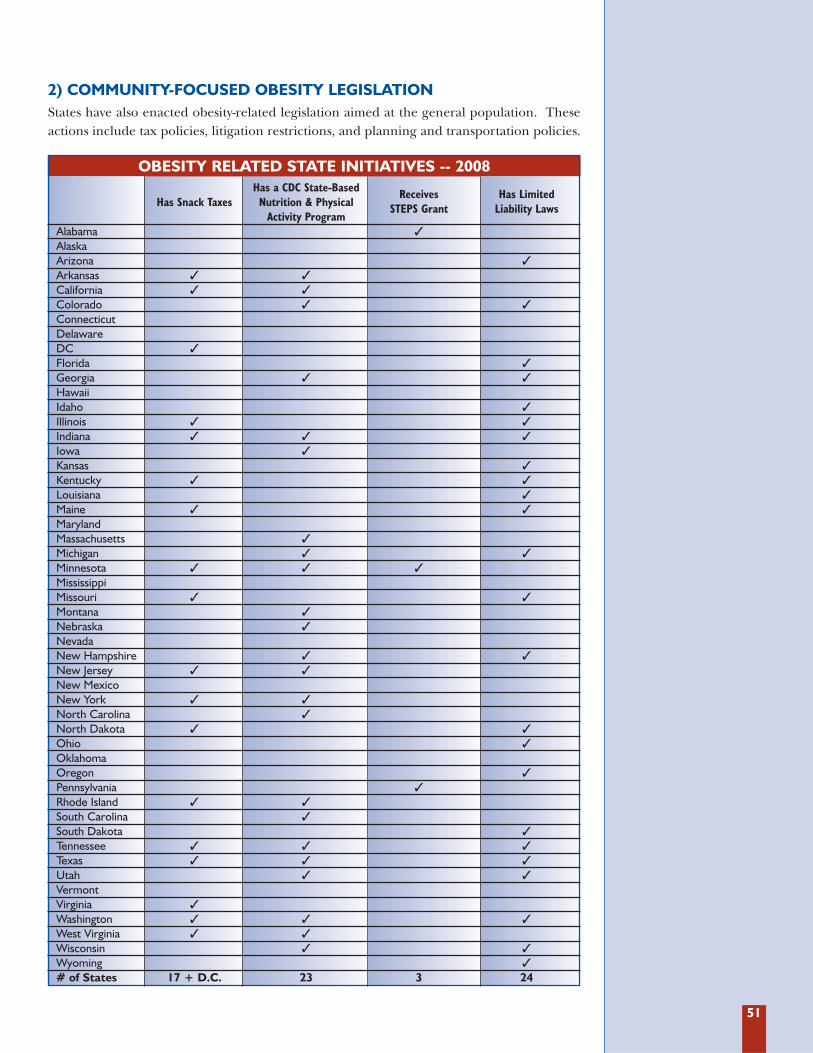
51
States have also enacted obesity-related legislation aimed at the general population. Theseactions include tax policies, litigation restrictions, and planning and transportation policies.
2) COMMUNITY-FOCUSED OBESITY LEGISLATION
OBESITY RELATED STATE INITIATIVES -- 2008Has a CDC State-Based Receives Has Limited
Has Snack Taxes Nutrition & Physical STEPS Grant Liability LawsActivity Program
Alabama �
AlaskaArizona �
Arkansas � �
California � �
Colorado � �
ConnecticutDelawareDC �
Florida �
Georgia � �
HawaiiIdaho �
Illinois � �
Indiana � � �
Iowa �
Kansas �
Kentucky � �
Louisiana �
Maine � �
MarylandMassachusetts �
Michigan � �
Minnesota � � �
MississippiMissouri � �
Montana �
Nebraska �
NevadaNew Hampshire � �
New Jersey � �
New MexicoNew York � �
North Carolina �
North Dakota � �
Ohio �
OklahomaOregon �
Pennsylvania �
Rhode Island � �
South Carolina �
South Dakota �
Tennessee � � �
Texas � � �
Utah � �
VermontVirginia �
Washington � � �
West Virginia � �
Wisconsin � �
Wyoming �
# of States 17 + D.C. 23 3 24
52
One way many states have tried to mitigatethe obesity epidemic is by taxing junk foodsin an attempt to reduce people’s consump-tion of these products.
Seventeen states and D.C. currently havelaws that tax foods of low nutritionalvalue:229 Arkansas, California, D.C., Illinois,Indiana, Kentucky, Maine, Minnesota, Missouri,New Jersey, New York, North Dakota, RhodeIsland, Tennessee, Texas, Virginia, Washington,and West Virginia.
These taxes, also known as “Twinkie Taxes,”and “fat taxes,” are highly controversial.While proponents of the taxes argue that a taxon junk food could be used to fund a healthyeating and nutrition information campaign,opponents cite several problems.230 First, ashealth economist Eric A. Finkelstein notes,these taxes penalize the poor “because peopleon lower incomes spend a higher proportionof their income on food, [therefore] this typeof tax is largely regressive in nature.”231 Inaddition, the amount of taxes levied on junkfoods is so small that it is unlikely to serve as adeterrent to people. Finally, many states thathave passed a version of a snack tax do not
always use the revenues to combat obesity.Instead, snack tax revenues are used to fund awide variety of state activities.
Despite these problems, a growing numberof Americans support the idea of taxingunhealthy foods as a means to combat obesi-ty and promote healthy nutrition. Accordingto researchers at Yale University’s RuddCenter for Food Policy and Obesity, thenumber of Americans who support taxingunhealthy foods to subsidize healthy foodshas risen from 33 percent in 2001 to 40 per-cent in 2003 and 54 percent in 2004.232
Researchers at Yale University report thatnational junk food taxes could generate over$1.8 billion per year from the following items:
� A 1-cent per 12-ounce soft drink taxwould generate $1.5 billion per year.
� A 1-cent per pound of candy tax wouldgenerate $70 million per year.
� The proposed potato chip tax would gen-erate $54 million per year.
� Proposed taxes on other snack foods, fats andoils would generate $190 million per year.233
In addition to looking at imposing a snacktax on unhealthy foods, the MississippiHealth Advocacy Program, has argued thatstates such as Mississippi, which have exist-ing grocery taxes for all food items, shouldremove the tax on healthy foods.234
Mississippi is currently one of 5 states thattaxes foods purchased for home consump-tion. The group argues that eliminatingthe 7 percent sales tax on healthy foods,while maintaining the tax on junk foodswould achieve 2 goals. First, it wouldmake healthy foods -- which studies have
shown are 10 times as expensive asunhealthy, high-calorie foods -- moreaffordable.235 Second, by eliminating thetax only on healthy foods, the state ofMississippi would continue to receive rev-enues from the purchase of unhealthyfoods. The main challenge facing legisla-tors and policy makers who may want toconsider this approach is how to define“healthy foods.” The Mississippi HealthAdvocacy Program recommends conveninga panel of nutritionists and dieticians todefine healthy foods.
SNACK TAXES
ELIMINATING TAXES ON HEALTHY FOODS
53
Many states have responded to the obesityepidemic by passing laws that prevent individ-uals from suing restaurants, manufacturers,and marketers for contributing to unhealthyweight and related health problems. Theselaws that limit liability are fairly controversial,and have been prompted by fears of obesitylawsuits similar to tobacco lawsuits. However,they are one of the most visible obesity-relat-ed policies to emerge in recent years.
Twenty-four states have passed obesityliability laws: Arizona, Colorado, Florida,Georgia, Idaho, Illinois, Indiana, Louisiana,Kansas, Kentucky, Maine, Michigan, Missouri,New Hampshire, North Dakota, Ohio,Oregon, South Dakota, Texas, Tennessee,Utah, Washington, Wisconsin and Wyoming.
Proponents of these bills argue that the central issue is “common sense and personalresponsibility.”244 Passage of these bill indicatesa level of support for the view that obesity isan individual health issue. Supporters alsoendorse a 2004 White House statement that“food manufacturers and sellers should not beheld liable for injury because of a person’sconsumption of legal, unadulterated food anda person’s weight gain or obesity.”245
Opponents of limited liability laws supportthe position that “it’s impossible for con-sumers to exercise personal responsibilitywhen businesses are concealing importantinformation about their products,” such asthe number of calories in restaurant food orthe lack of consistency in food labeling.246
LEGISLATION TO LIMIT OBESITY LIABILITY
Instead of mandated menu labeling, some stateshave chosen to focus on voluntary menu labelingprograms. In Arizona, the Department ofHealth Services launched the Smart ChoiceProgram after the legislature rejected a bill thatwould have required restaurants to post nutri-tional information on menus. Under the SmartChoice Program the state works with participat-ing restaurants to evaluate and, if necessary,modify menu items to meet specific nutrition cri-teria. A main dish, for example, should have thefollowing: A minimum of 2 servings of beans,whole grains, fruits, or vegetables; no more than700 calories; no more than 30 percent of totalcalories from fat; no more than 15 percent oftotal calories from saturated fat; no more than0.5 percent of trans fat; and no more than 1,500
milligrams of sodium.242 To date, Subway,McDonald’s, Outback Steakhouse, and Macayo’sMexican Kitchen have signed onto the program.
Critics of these voluntary programs highlight anumber of problems. First, many restaurantschoose not to participate in these programs.Second, the nutrition information is not easilyaccessible. Instead of posting the calorie and fatcounts on the menu, most restaurants choose toprint up brochures which may be hard to find, orthey post the information on the Internet. Whilehaving the information available online is useful, itdoes not help the customer who is waiting toplace an order in the restaurant. Finally, thenutrition information in these brochures can bedifficult for the average consumer to use.243
Voluntary Efforts
Menu labeling -- the posting of nutrition infor-mation on menus and menu boards -- is a poli-cy that more states and localities are consider-ing each year. Supporters of nutrition labelingat fast-food and chain restaurants, includingthe American Medical Association, want label-ing that is easy to understand and whichincludes the total calories, fat, saturated fat,trans fat and sodium content of menu items.236
Seventeen states and Puerto Rico, as well asnumerous local governments, introduced legis-lation either in 2007 or 2008 to require restau-rants to post nutrition information alongsidetheir menu items.237,238 The states that consid-
ered menu labeling legislation include: Arizona,California, Connecticut, D.C. Hawaii, Illinois,Iowa, Kentucky, Maine, Massachusetts,Michigan, New Jersey, New Mexico, NewYork, Pennsylvania, Tennessee, Vermont andWashington.239 In California, menu-labeling leg-islation passed both chambers of the state leg-islature but was vetoed by Gov. ArnoldSchwarzenegger (R) on Oct. 14, 2007.240
Supporters are considering reintroducing amenu-labeling bill in 2008. At the local level,Seattle, New York City and San Francisco havemenu-labeling provisions in place; 5 otherlocalities have legislation pending.241
MENU LABELING
54
Sprawl describes spread-out areas where homes may be iso-lated from schools, the workplace, and other frequent destina-tions. As a result, people “who live in these areas may find thatdriving is the most convenient way to get everything done, andthey are less likely to have easy opportunities to walk, bicycle,or take transit as part of their daily routine.”248
Green spaces describe open, undeveloped recreationalspaces that are accessible to the public and maintained by
the government. Green spaces provide communities withopportunities for recreation and physical activity by provid-ing areas for walking, biking, and other sports.249
Brownfields are former commercial and industrial sites, manyof which are abandoned or contaminated with hazardous sub-stances or pollutants. Often, these locations provide no usablespace for the surrounding area and remain as decaying eye-sores, environmental health threats, and indicators of blight.
Health officials and elected leaders are increasingly aware of theimportance that communities have on the health of their resi-dents. At the federal level, Senator Barack Obama (D-IL) andRepresentative Hilda Solis (D-CA) have introduced legislationthat would require the CDC director to develop guidance forthe assessment of potential health effects of land use, housing,
and transportation policy and plans.247 However, the bulk of thistype of legislative action has been at the state and local level.
TFAH’s F as in Fat: How Obesity Policies Are Failing in America2005 report included a state-by-state review of green space,brownfields, and sprawl initiatives (available online atwww.healthyamericans.org).
Physical inactivity, coupled with unhealthy eating habits, is amajor driver of the current obesity epidemic. More than halfof the U.S. adult population does not meet the recommendeddaily physical activity guidelines, while a quarter of U.S. adultsreport being completely inactive.250 (See Section 2: Fast Factsfor recommended daily physical activity guidelines.)
One major obstacle to physical activity is concern about safe-ty. For example, the number of children walking to and fromschool has declined dramatically over the past 40 years, from48 percent of students in 1969 to 16 percent of students in2001.251 Parents frequently list traffic safety concerns as a topreason that their children do not walk or bike to school.252
Governments and communities that address traffic safety con-cerns can promote healthier living. For instance, a 2003 studyfound that 43 percent of people with safe places to walk within10 minutes of home met recommended activity levels; amongthose without safe places to walk just 27 percent met the rec-ommendation.253 An Australian study found that residents are 65percent more likely to walk in a neighborhood with sidewalks.254
A review by the National Conference of State Legislaturesidentified 5 state policy options that are most effective atencouraging biking and walking:
1. Incorporating sidewalks and bike lanes into community design.
2. Providing funding for biking and walking in highway projects.
3. Establishing safe routes to school.
4. Fostering traffic-calming measures (e.g., any transporta-tion design that is used to slow traffic).
5. Creating incentives for mixed-use development.255
The National Complete Streets Coalition is focusing on thefirst 2 policy options by working with state, county andcity governments to incorporate features that promoteregular walking, cycling and transit use into just aboutevery street. To date, more than 75 states, counties,regional governments and cities have complete streetspolicies, according to the Coalition. A complete streetspolicy enables all users -- pedestrians, bicyclists, motorists,and bus riders of all ages and abilities -- to safely movealong and across a complete street.
While the bulk of the 2-year old coalition’s efforts havefocused on state and local governments, the coalition has alsopushed for federal action on the issue. In March 2008, Sens.Tom Harkin (D-IA) and Thomas Carper (D-DE) introducedthe Complete Streets Act (S.2686). In May 2008, Rep.Doris Matsui (D-CA) introduced the Safe and CompleteStreets Act of 2008 in the House (H.R. 5951). The billsensure that “all users of the transportation system, includingpedestrians, bicyclists, and transit users as well as children,older individuals, and individuals with disabilities, are able totravel safely and conveniently on streets and highways.”256
Two members of the National Complete StreetsCoalition are the National Center for Safe Routes toSchool and Smart Growth America. Safe Routes toSchool focuses specifically on encouraging and enablingmore children to walk or bike to school, while SmartGrowth America deals with issues related to communityplanning, including land use, mixed-use development, andopen-space preservation.
LAND USE, URBAN PLANNING AND TRANSPORTATION POLICIES
COMPLETE STREETS INITIATIVES
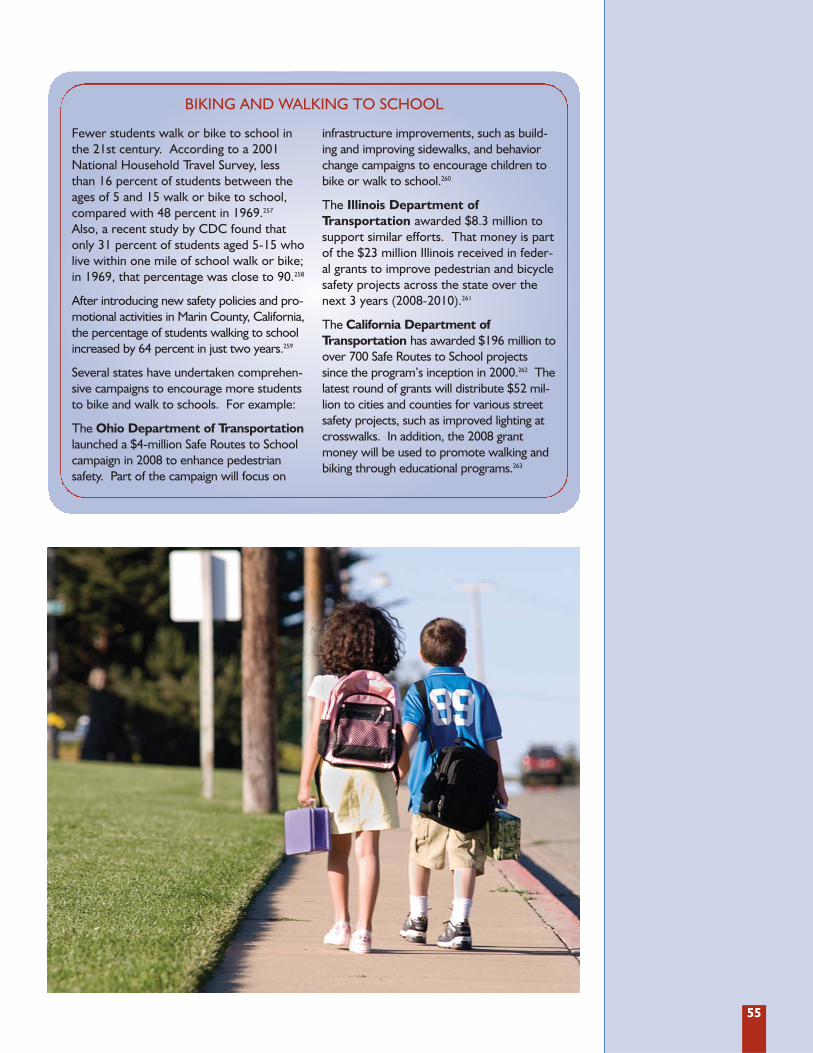
55
Fewer students walk or bike to school inthe 21st century. According to a 2001National Household Travel Survey, lessthan 16 percent of students between theages of 5 and 15 walk or bike to school,compared with 48 percent in 1969.257
Also, a recent study by CDC found thatonly 31 percent of students aged 5-15 wholive within one mile of school walk or bike;in 1969, that percentage was close to 90.258
After introducing new safety policies and pro-motional activities in Marin County, California,the percentage of students walking to schoolincreased by 64 percent in just two years.259
Several states have undertaken comprehen-sive campaigns to encourage more studentsto bike and walk to schools. For example:
The Ohio Department of Transportationlaunched a $4-million Safe Routes to Schoolcampaign in 2008 to enhance pedestriansafety. Part of the campaign will focus on
infrastructure improvements, such as build-ing and improving sidewalks, and behaviorchange campaigns to encourage children tobike or walk to school.260
The Illinois Department ofTransportation awarded $8.3 million tosupport similar efforts. That money is partof the $23 million Illinois received in feder-al grants to improve pedestrian and bicyclesafety projects across the state over thenext 3 years (2008-2010).261
The California Department ofTransportation has awarded $196 million toover 700 Safe Routes to School projectssince the program’s inception in 2000.262 Thelatest round of grants will distribute $52 mil-lion to cities and counties for various streetsafety projects, such as improved lighting atcrosswalks. In addition, the 2008 grantmoney will be used to promote walking andbiking through educational programs.263
BIKING AND WALKING TO SCHOOL
56
All 50 states and D.C. mandate physical edu-cation in schools as part of the public schoolcurriculum (although participation is notalways mandatory). However, withoutenforcement mechanisms there is no way tomake sure schools are following the rules.Likewise, 18 states currently have require-ments for school meals that exceed the nutri-tion standards set by USDA. In this analysisresearchers examined all state legislation relat-ing to physical activity/education and nutri-tion in the schools of each state, and evaluatedwhether or not there is express enforceabilitylanguage within that legislation.
Although all states have some form of legisla-tion related to physical education and/orphysical activity in schools, the majority donot have specific enforceability language.Thirteen states were found to have enforce-ability language. Of those states, 4 includedsanctions or penalties within their language,and 10 included collection and reporting ofinformation regarding performance lan-guage, with one state containing both typesof language. Of the 18 states that have schoolmeal requirements exceeding the USDAstandards, only 7 have specific enforceabilitylanguage, with only 2 including sanctions orpenalties for noncompliance.
1) PHYSICAL ACTIVITY AND NUTRITION STANDARDS IN SCHOOLS
As part of this year’s report, TFAH partneredwith the STOP Obesity Alliance and the GeorgeWashington University School of Public Healthand Health Services’ Department of HealthPolicy to conduct a qualitative review of statelaws that are related to the prevention or treat-ment of obesity. The review focused on laws in2 major domains: nutrition and physical activitystandards in schools and insurance coveragefor obesity-related treatments. Within these 2major domains, the assessment measured lawsagainst 4 factors:
� Objective standards: The extent to which statelaws either adopt (or specify the adoptionof) objective standards related to obesityprevention or treatment intervention.264
� Statewideness: Whether the standards thatare adopted or contemplated in a statelaw are expected to be applicable on astatewide basis or whether local jurisdic-
tions/entities are given the discretion todepart from such standards.
� Enforcement mechanism: Whether the lawprovides for some type of public enforce-ment mechanism (sanction, incentive, pub-lication of results, private enforcement).
� Data collection. Whether the law requiresstates to collect data on the performanceof affected public and private entities.(Covered entities may be local units ofgovernment, employers, or other publicor private entities.)
The research team defined “objective stan-dards” as federal or national standards thathave achieved either:
� National recognition as a widely used orrecommended standard, or
� Status as a formal legal standard.
D. QUALITATIVE EVALUATION OF STATE OBESITY-RELATEDLEGISLATION
Staff from TFAH:Rebecca St. Laurent, JD
Faculty and Staff from the George Washington University School ofPublic Health and Health Services’ Department of Health Policy:
Nancy Lopez, JD MPH Jennifer Sheer, MPH Jennifer Lee, MD
Laura Cohen Sara Rosenbaum, JD
QUALITATIVE ANALYSIS RESEARCH TEAM
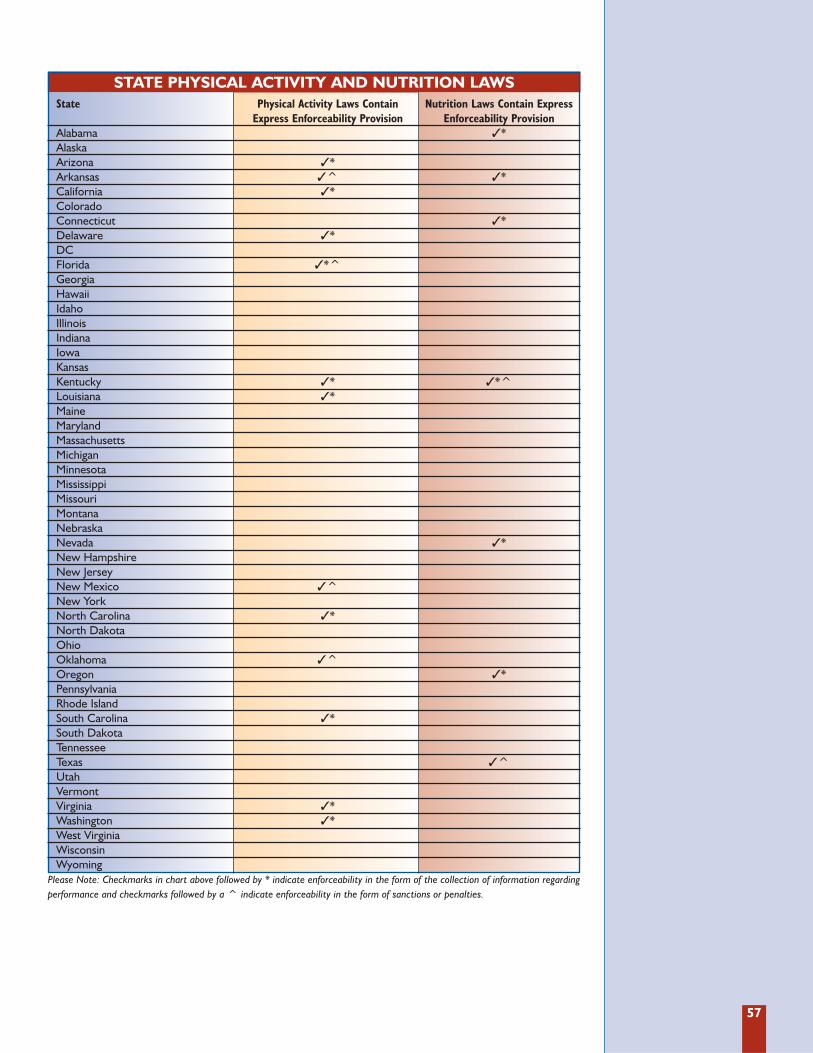
57
STATE PHYSICAL ACTIVITY AND NUTRITION LAWS State Physical Activity Laws Contain Nutrition Laws Contain Express
Express Enforceability Provision Enforceability ProvisionAlabama �*AlaskaArizona �*Arkansas �^ �*California �*ColoradoConnecticut �*Delaware �*DCFlorida �*^GeorgiaHawaiiIdahoIllinoisIndianaIowaKansasKentucky �* �*^Louisiana �*MaineMarylandMassachusettsMichiganMinnesotaMississippiMissouriMontanaNebraskaNevada �*New HampshireNew JerseyNew Mexico �^New YorkNorth Carolina �*North DakotaOhioOklahoma �^Oregon �*PennsylvaniaRhode IslandSouth Carolina �*South DakotaTennesseeTexas �^UtahVermontVirginia �*Washington �*West VirginiaWisconsinWyoming
Please Note: Checkmarks in chart above followed by * indicate enforceability in the form of the collection of information regardingperformance and checkmarks followed by a ^ indicate enforceability in the form of sanctions or penalties.
58
Over the past 5 years, the insurance industry’sview of obesity and obesity-related healthproblems has undergone a dramatic change.
When insurers first recognized obesity as asubstantial health risk, procedures such asbariatric surgery became available withinsome private insurance plans.265 However,even with evidence showing that nutritionalcounseling can help obese patients loseweight and that prevention and treatmentof obesity work best when provided by amultidisciplinary team of health care work-ers, most insurance policies did not includecoding for obesity counseling.266,267 The fail-ure to provide coding means that clinicianswho want to offer obesity treatments andpreventive services have no way of billing forthese services. If health care workers areunable to be reimbursed for their services,they are highly unlikely to offer these obesi-ty-related services to their patients.
In recent years, however, that has begun tochange. In late 2004 Blue Cross and BlueShield of North Carolina (BCBSNC)announced that it would begin offering cov-erage for obesity.268 The coverage includes
nutrition counseling, reimbursement for vis-its to the doctor, as well as access to 2 pre-scription weight-loss drugs.269 BCBSNC alsostarted including registered dieticians in itsnetwork of providers. All those covered byBCBSNC can receive up to 6 nutrition visitsper year.270 Highmark, which is a Pittsburgh-based insurance company, has also begun toreimburse pediatricians for obesity counsel-ing.271 The statistics to date show that obesityrelated visits have increased by 23 percent.272
Another change occurred in February 2006when the Centers for Medicare andMedicaid Services (CMS) released its newpolicy that includes national coverage forbariatric surgery.273 The new policy extendsbariatric surgery to all Medicare recipientswith a body mass index of 35 or higher withat least one co-morbidity related to obesity.274
Given the recent developments in insurancecoverage of obesity-related treatments,researchers examined each state’s coverage in 3areas: Medicaid Early and Periodic Screening,Diagnostic, and Treatment (EPSDT), Medicaidadult obesity coverage and payment for eligiblepersons, and state insurance laws.
2) INSURANCE BENEFITS FOR OBESITY-RELATED TREATMENT
Medicaid requires participating states to coverEarly and Periodic Screening, Diagnostic, andTreatment (EPSDT) benefits for all eligiblechildren under age 21, even if such services arenot available under the state’s Medicaid plan tothe rest of the Medicaid population. EPSDTbenefits include comprehensive periodic andas-needed assessments of children’s health anddevelopment beginning at birth and continu-ing to age 21. The examinations encompass awide range of procedures, including a devel-opmental assessment, a nutritional assessment,and anticipatory guidance. For children iden-tified with a physical, developmental, or men-tal health condition, states must arrange for allmedically necessary treatments falling withinfederally covered service classes, even if suchtreatments or service classes are not availablefor individuals ages 21 and older.
In covering health treatments for children,states are expected to adhere to standards ofmedical necessity that reflect accepted pedi-atric standards of care.
In 2005 the American Medical Association, incollaboration with the Health Resources andServices Administration and CDC, convenedan expert committee to provide updatedpractical guidance to practitioners on how toprevent, assess, and treat child and adolescentoverweight and obesity.275 The committee putforth guidance based on their appraisal of theliterature and their collective clinical experi-ence. These recommendations, published inDecember 2007, represent the consensus ofexperts based on the best available informa-tion at the time and have been well-receivedby the provider community.
a) Medicaid Early and Periodic Screening, Diagnostic, and Treatment (EPSDT)
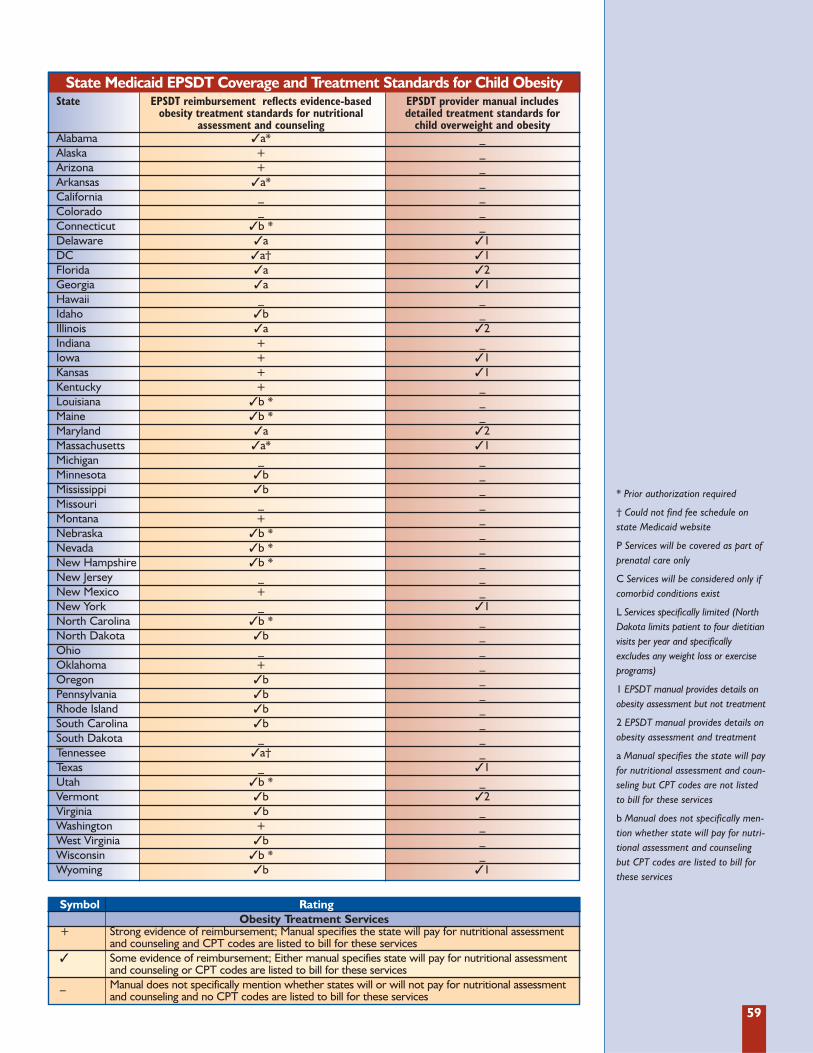
59
State Medicaid EPSDT Coverage and Treatment Standards for Child ObesityState EPSDT reimbursement reflects evidence-based EPSDT provider manual includes
obesity treatment standards for nutritional detailed treatment standards for assessment and counseling child overweight and obesity
Alabama �a* _Alaska + _Arizona + _Arkansas �a* _California _ _Colorado _ _Connecticut �b * _Delaware �a �1DC �a† �1Florida �a �2Georgia �a �1Hawaii _ _Idaho �b _Illinois �a �2Indiana + _Iowa + �1Kansas + �1Kentucky + _Louisiana �b * _Maine �b * _Maryland �a �2Massachusetts �a* �1Michigan _ _Minnesota �b _Mississippi �b _Missouri _ _Montana + _Nebraska �b * _Nevada �b * _New Hampshire �b * _New Jersey _ _New Mexico + _New York _ �1North Carolina �b * _North Dakota �b _Ohio _ _Oklahoma + _Oregon �b _Pennsylvania �b _Rhode Island �b _South Carolina �b _South Dakota _ _Tennessee �a† _Texas _ �1Utah �b * _Vermont �b �2Virginia �b _Washington + _West Virginia �b _Wisconsin �b * _Wyoming �b �1
Symbol RatingObesity Treatment Services
+ Strong evidence of reimbursement; Manual specifies the state will pay for nutritional assessmentand counseling and CPT codes are listed to bill for these services
� Some evidence of reimbursement; Either manual specifies state will pay for nutritional assessmentand counseling or CPT codes are listed to bill for these services
_ Manual does not specifically mention whether states will or will not pay for nutritional assessmentand counseling and no CPT codes are listed to bill for these services
* Prior authorization required
† Could not find fee schedule onstate Medicaid website
P Services will be covered as part ofprenatal care only
C Services will be considered only ifcomorbid conditions exist
L Services specifically limited (NorthDakota limits patient to four dietitianvisits per year and specificallyexcludes any weight loss or exerciseprograms)
1 EPSDT manual provides details onobesity assessment but not treatment
2 EPSDT manual provides details onobesity assessment and treatment
a Manual specifies the state will payfor nutritional assessment and coun-seling but CPT codes are not listedto bill for these services
b Manual does not specifically men-tion whether state will pay for nutri-tional assessment and counselingbut CPT codes are listed to bill forthese services
60
Based on each state’s published Medicaidmanuals and fee schedules, researchersfound 10 states that failed to address nutri-tional assessment and counseling reimburse-ment at all in their published materials. Inthese states, neither the provider manualspecifically mentioned whether Medicaidwould pay for these services nor were CPTcodes listed to bill for these services. In thesestates, it only can be assumed that these serv-ices are not likely to be reimbursed.
The majority of states (29 and D.C.) providedsome but not conclusive evidence that theywill reimburse for nutritional assessment andcounseling. In general, these states eitherprovided generalized and nonspecific guid-ance regarding treatment for childhood con-ditions without listing reimbursement levelsfor related billing codes or they providedbilling codes without any specific languagedirecting providers to use these codes fornutritional assessment and treatment in thetreatment of obesity.
Researchers found that currently only 11states provide strong evidence that they willreimburse for nutritional and behavioral
therapy in children with overweight andobesity. These states not only provide guid-ance in their provider manuals and regula-tions for the coverage of these services butalso provide reimbursement amounts intheir fee schedules for related billing codes.
For those states that listed medical nutri-tion codes in their fee schedules, the reim-bursement rate for a 15 minute individualassessment by a dietitian ranged from $9.91to $32.21.
Twelve states require prior authorization forservices that are not normally covered byMedicaid.
Four states set forth detailed treatment stan-dards for childhood obesity in their EPSDTprovider manuals. Nine states incorporateddetails on how to assess or screen for childobesity in their EPSDT manuals, but did notinclude guidelines on how to treat obesity.Some manuals included links to screeningtools and guidelines and some states hadchild obesity treatment information avail-able elsewhere on their website (i.e. publichealth departments) but not in theirprovider manuals.
In 2004, the U.S. Department of Health andHuman Services (HHS) removed languagefrom the Medicare Coverage Issues Manualthat stated obesity was not an illness.276 Thispolicy change opened the door for the treat-ment under federal health care programs ofobesity as an illness or condition in its ownright. The change also sets an importantprecedent for private insurers and employ-er-sponsored health benefit plans, becauseof Medicare’s influence over health carefinancing policy generally.
Medicaid is the largest of all public healthbenefit programs, covering over 58 millionpeople in 2005.277 Medicaid beneficiariesare low income or medically impoverished,and many Medicaid eligibility categoriesare, in contrast to private health insurance,designed to assure coverage for persons with
serious and chronic health conditions. As aresult, the prevalence of elevated healthrisks and serious illness is significantly high-er among the Medicaid population.
State Medicaid programs have broad discre-tion over coverage and payment for services.Medicaid specifies certain broad serviceclasses as required services; these includephysician services, inpatient services, andservices of federally qualified health centersand rural health clinics, and several otherservice classes. However, not all procedureswithin required services classes must be cov-ered. Moreover, many service classes suchas prescribed drugs, preventive services fur-nished by health professionals, and otherrelevant service classes are not required butremain optional with states. Most statescover most classes of optional services to at
b) Medicaid Adult Obesity Coverage

61
least some degree. All states cover prescrip-tion drugs to an extensive degree.
The review of state Medicaid coverage andpayment practices focused on 2 items:
� The depth of guidance provided by theprovider manual (i.e. was treatment
merely mentioned, or were specific treat-ment guidelines mentioned).
� The type of treatments covered and/or paidfor (nutritional assessment/counseling,pharmacological therapy, and surgery).
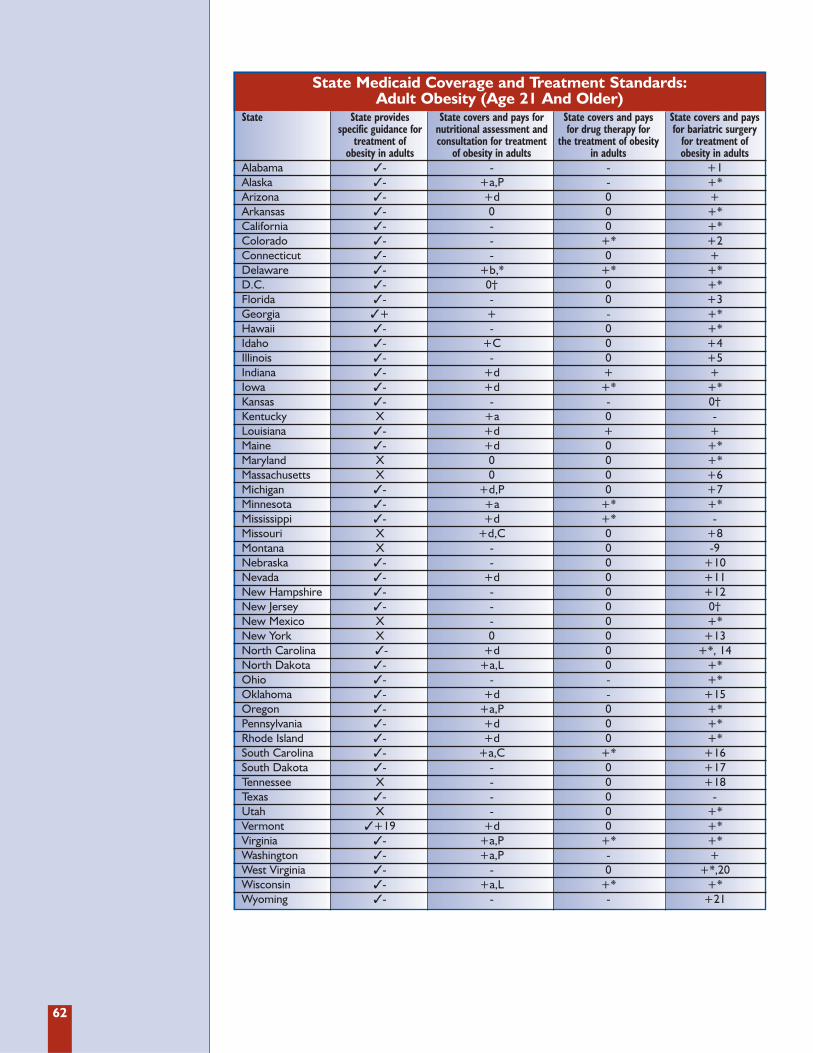
62
State Medicaid Coverage and Treatment Standards: Adult Obesity (Age 21 And Older)
State State provides State covers and pays for State covers and pays State covers and pays specific guidance for nutritional assessment and for drug therapy for for bariatric surgery
treatment of consultation for treatment the treatment of obesity for treatment of obesity in adults of obesity in adults in adults obesity in adults
Alabama �- - - +1 Alaska �- +a,P - +* Arizona �- +d 0 +Arkansas �- 0 0 +* California �- - 0 +* Colorado �- - +* +2Connecticut �- - 0 +Delaware �- +b,* +* +*D.C. �- 0† 0 +* Florida �- - 0 +3 Georgia �+ + - +*Hawaii �- - 0 +* Idaho �- +C 0 +4 Illinois �- - 0 +5 Indiana �- +d + + Iowa �- +d +* +* Kansas �- - - 0†Kentucky X +a 0 -Louisiana �- +d + +Maine �- +d 0 +* Maryland X 0 0 +*Massachusetts X 0 0 +6Michigan �- +d,P 0 +7 Minnesota �- +a +* +* Mississippi �- +d +* -Missouri X +d,C 0 +8Montana X - 0 -9Nebraska �- - 0 +10 Nevada �- +d 0 +11 New Hampshire �- - 0 +12New Jersey �- - 0 0†New Mexico X - 0 +*New York X 0 0 +13North Carolina �- +d 0 +*, 14North Dakota �- +a,L 0 +* Ohio �- - - +* Oklahoma �- +d - +15Oregon �- +a,P 0 +* Pennsylvania �- +d 0 +* Rhode Island �- +d 0 +* South Carolina �- +a,C +* +16 South Dakota �- - 0 +17Tennessee X - 0 +18Texas �- - 0 -Utah X - 0 +*Vermont �+19 +d 0 +*Virginia �- +a,P +* +*Washington �- +a,P - +West Virginia �- - 0 +*,20Wisconsin �- +a,L +* +*Wyoming �- - - +21
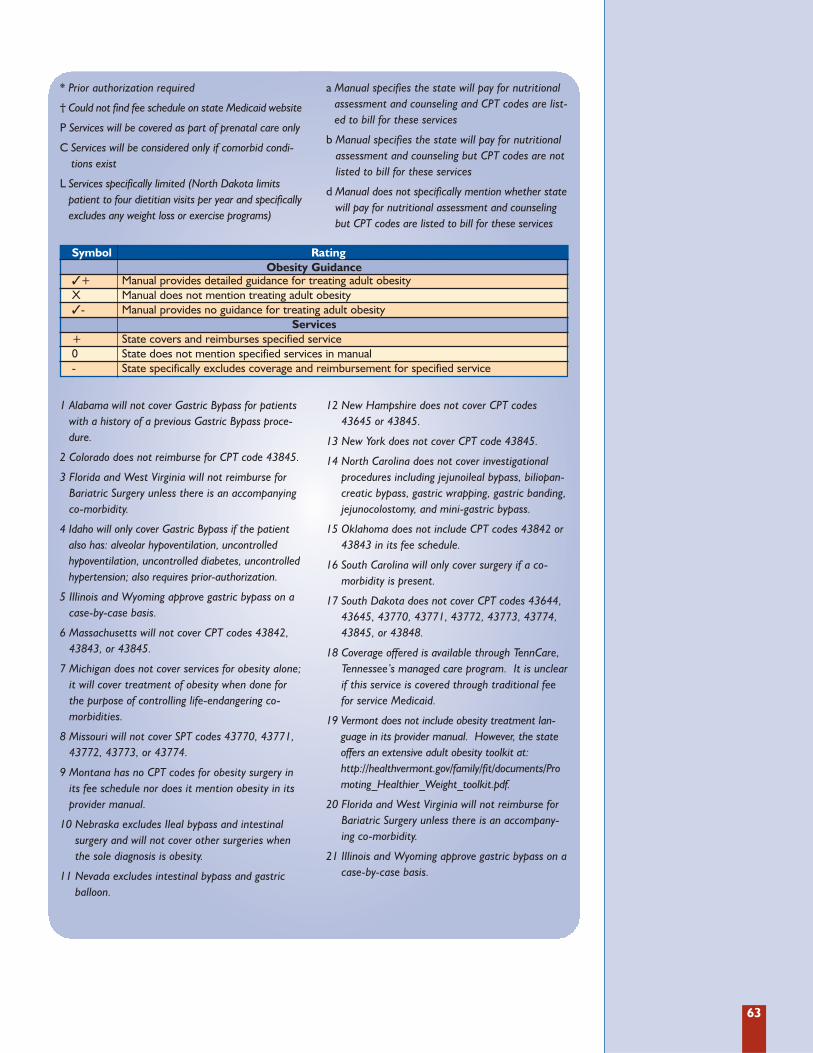
63
1 Alabama will not cover Gastric Bypass for patientswith a history of a previous Gastric Bypass proce-dure.
2 Colorado does not reimburse for CPT code 43845.
3 Florida and West Virginia will not reimburse forBariatric Surgery unless there is an accompanyingco-morbidity.
4 Idaho will only cover Gastric Bypass if the patientalso has: alveolar hypoventilation, uncontrolledhypoventilation, uncontrolled diabetes, uncontrolledhypertension; also requires prior-authorization.
5 Illinois and Wyoming approve gastric bypass on acase-by-case basis.
6 Massachusetts will not cover CPT codes 43842,43843, or 43845.
7 Michigan does not cover services for obesity alone;it will cover treatment of obesity when done forthe purpose of controlling life-endangering co-morbidities.
8 Missouri will not cover SPT codes 43770, 43771,43772, 43773, or 43774.
9 Montana has no CPT codes for obesity surgery inits fee schedule nor does it mention obesity in itsprovider manual.
10 Nebraska excludes Ileal bypass and intestinalsurgery and will not cover other surgeries whenthe sole diagnosis is obesity.
11 Nevada excludes intestinal bypass and gastricballoon.
12 New Hampshire does not cover CPT codes43645 or 43845.
13 New York does not cover CPT code 43845.
14 North Carolina does not cover investigationalprocedures including jejunoileal bypass, biliopan-creatic bypass, gastric wrapping, gastric banding,jejunocolostomy, and mini-gastric bypass.
15 Oklahoma does not include CPT codes 43842 or43843 in its fee schedule.
16 South Carolina will only cover surgery if a co-morbidity is present.
17 South Dakota does not cover CPT codes 43644,43645, 43770, 43771, 43772, 43773, 43774,43845, or 43848.
18 Coverage offered is available through TennCare,Tennessee’s managed care program. It is unclearif this service is covered through traditional feefor service Medicaid.
19 Vermont does not include obesity treatment lan-guage in its provider manual. However, the stateoffers an extensive adult obesity toolkit at:http://healthvermont.gov/family/fit/documents/Promoting_Healthier_Weight_toolkit.pdf.
20 Florida and West Virginia will not reimburse forBariatric Surgery unless there is an accompany-ing co-morbidity.
21 Illinois and Wyoming approve gastric bypass on acase-by-case basis.
* Prior authorization required
† Could not find fee schedule on state Medicaid website
P Services will be covered as part of prenatal care only
C Services will be considered only if comorbid condi-tions exist
L Services specifically limited (North Dakota limitspatient to four dietitian visits per year and specificallyexcludes any weight loss or exercise programs)
a Manual specifies the state will pay for nutritionalassessment and counseling and CPT codes are list-ed to bill for these services
b Manual specifies the state will pay for nutritionalassessment and counseling but CPT codes are notlisted to bill for these services
d Manual does not specifically mention whether statewill pay for nutritional assessment and counselingbut CPT codes are listed to bill for these services
Symbol RatingObesity Guidance
�+ Manual provides detailed guidance for treating adult obesityX Manual does not mention treating adult obesity�- Manual provides no guidance for treating adult obesity
Services+ State covers and reimburses specified service0 State does not mention specified services in manual- State specifically excludes coverage and reimbursement for specified service
64
Specific guidelines were rarely referred to inthe Medicaid provider manuals. Only 2 statemanuals provided guideline references.Georgia referenced the Food Pyramid. WhileVermont made no mention of obesity withinits provider manual, it did offer an extensivetoolkit for adult obesity on its website.
Excluding the few states that made no men-tion of obesity (9 states), most provider man-uals (40 states) referred to it only in regard tocoverage issues, rather than diagnostic ortreatment guidance. Nebraska and SouthCarolina explicitly state in their provider man-uals that obesity is not an illness.
Medicaid Manual References to Obesity Treatment in Adults
All 50 states and D.C. explicitly cover at leastone treatment category. Eight states(Delaware, Indiana, Iowa, Louisiana,Minnesota, South Carolina, Virginia, andWisconsin) cover all 3 treatment categories.
Nutritional Assessment and ConsultationTwenty-six states explicitly cover nutritionalassessment and consultation while 20 explicit-ly do not.
Drug TherapyDrug therapy is the least frequently coveredand discussed treatment category; only 10states cover it while 33 make no mention ofit within their provider manuals.
Bariatric SurgeryBariatric surgery was the most frequently cov-ered treatment (45 states); it is also the leastlikely to be explicitly not covered (2 states).
Many state Medicaid programs do not offeradults a full range of treatment options. Theprovider manuals suggest (and even outrightstate) that obesity is not an illness or disease inand of itself, suggesting that few states are yetfollowing Medicare’s lead. Treatment is oftensubject to many limitations and may not evenbe offered if a patient is not suffering fromadditional illnesses that are negatively impact-ed by obesity. What is most significant aboutthese results is the large amount of silenceexhibited by the states in regard to the 3 typesof obesity treatment considered here.
State Medicaid Coverage and Payment
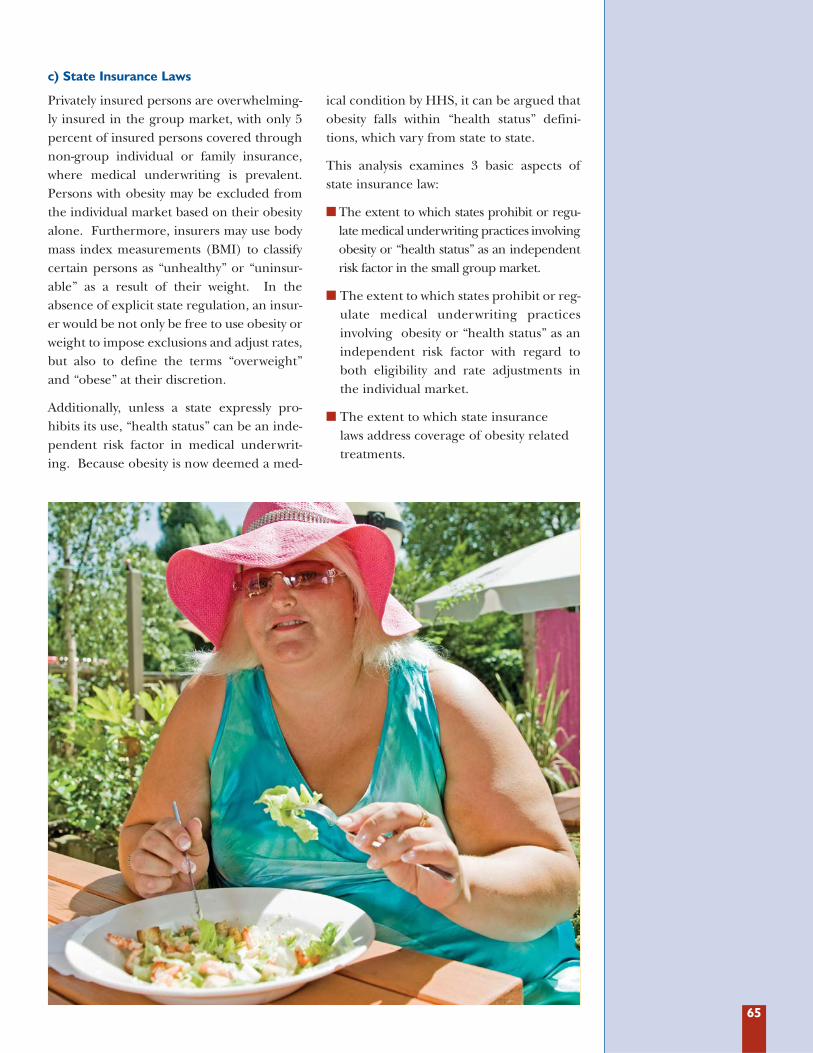
65
Privately insured persons are overwhelming-ly insured in the group market, with only 5percent of insured persons covered throughnon-group individual or family insurance,where medical underwriting is prevalent.Persons with obesity may be excluded fromthe individual market based on their obesityalone. Furthermore, insurers may use bodymass index measurements (BMI) to classifycertain persons as “unhealthy” or “uninsur-able” as a result of their weight. In theabsence of explicit state regulation, an insur-er would be not only be free to use obesity orweight to impose exclusions and adjust rates,but also to define the terms “overweight”and “obese” at their discretion.
Additionally, unless a state expressly pro-hibits its use, “health status” can be an inde-pendent risk factor in medical underwrit-ing. Because obesity is now deemed a med-
ical condition by HHS, it can be argued thatobesity falls within “health status” defini-tions, which vary from state to state.
This analysis examines 3 basic aspects ofstate insurance law:
� The extent to which states prohibit or regu-late medical underwriting practices involvingobesity or “health status” as an independentrisk factor in the small group market.
� The extent to which states prohibit or reg-ulate medical underwriting practicesinvolving obesity or “health status” as anindependent risk factor with regard toboth eligibility and rate adjustments inthe individual market.
� The extent to which state insurance laws address coverage of obesity relatedtreatments.
c) State Insurance Laws
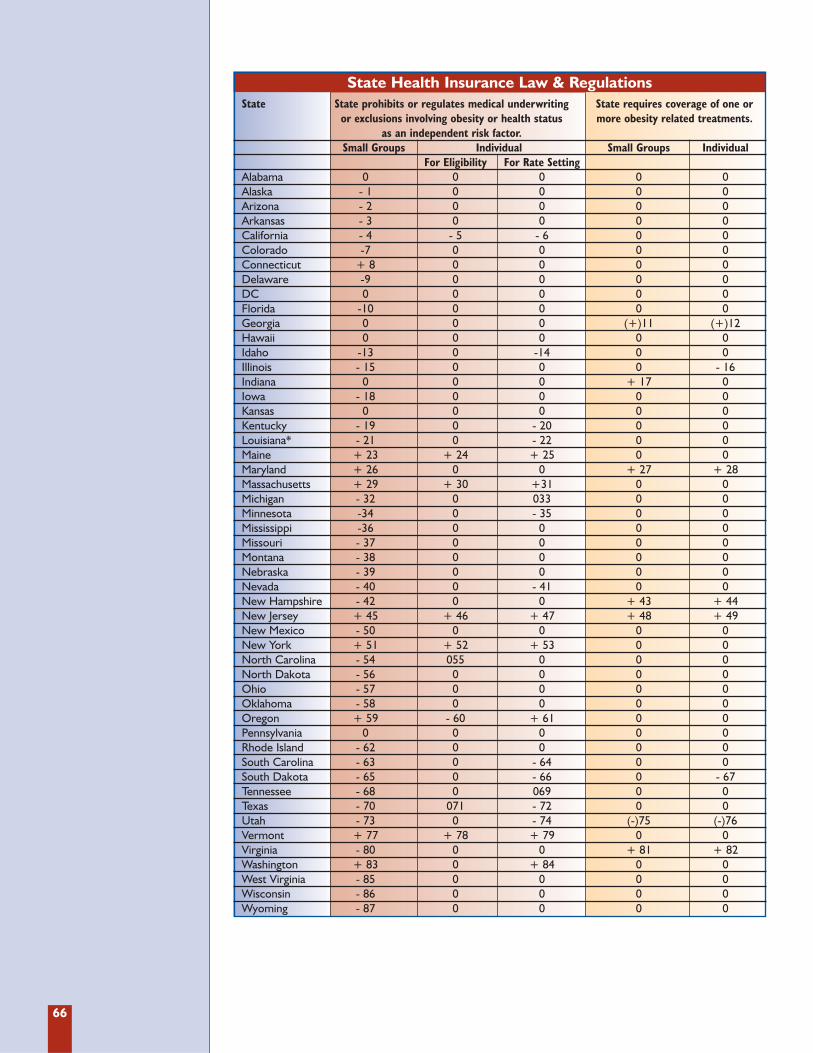
66
State Health Insurance Law & RegulationsState State prohibits or regulates medical underwriting State requires coverage of one or
or exclusions involving obesity or health status more obesity related treatments.as an independent risk factor.
Small Groups Individual Small Groups IndividualFor Eligibility For Rate Setting
Alabama 0 0 0 0 0Alaska - 1 0 0 0 0Arizona - 2 0 0 0 0Arkansas - 3 0 0 0 0California - 4 - 5 - 6 0 0Colorado -7 0 0 0 0Connecticut + 8 0 0 0 0Delaware -9 0 0 0 0DC 0 0 0 0 0Florida -10 0 0 0 0Georgia 0 0 0 (+)11 (+)12Hawaii 0 0 0 0 0Idaho -13 0 -14 0 0Illinois - 15 0 0 0 - 16Indiana 0 0 0 + 17 0Iowa - 18 0 0 0 0Kansas 0 0 0 0 0Kentucky - 19 0 - 20 0 0Louisiana* - 21 0 - 22 0 0Maine + 23 + 24 + 25 0 0Maryland + 26 0 0 + 27 + 28Massachusetts + 29 + 30 +31 0 0Michigan - 32 0 033 0 0Minnesota -34 0 - 35 0 0Mississippi -36 0 0 0 0Missouri - 37 0 0 0 0Montana - 38 0 0 0 0Nebraska - 39 0 0 0 0Nevada - 40 0 - 41 0 0New Hampshire - 42 0 0 + 43 + 44New Jersey + 45 + 46 + 47 + 48 + 49New Mexico - 50 0 0 0 0New York + 51 + 52 + 53 0 0North Carolina - 54 055 0 0 0North Dakota - 56 0 0 0 0Ohio - 57 0 0 0 0Oklahoma - 58 0 0 0 0Oregon + 59 - 60 + 61 0 0Pennsylvania 0 0 0 0 0Rhode Island - 62 0 0 0 0South Carolina - 63 0 - 64 0 0South Dakota - 65 0 - 66 0 - 67Tennessee - 68 0 069 0 0Texas - 70 071 - 72 0 0Utah - 73 0 - 74 (-)75 (-)76Vermont + 77 + 78 + 79 0 0Virginia - 80 0 0 + 81 + 82Washington + 83 0 + 84 0 0West Virginia - 85 0 0 0 0Wisconsin - 86 0 0 0 0Wyoming - 87 0 0 0 0
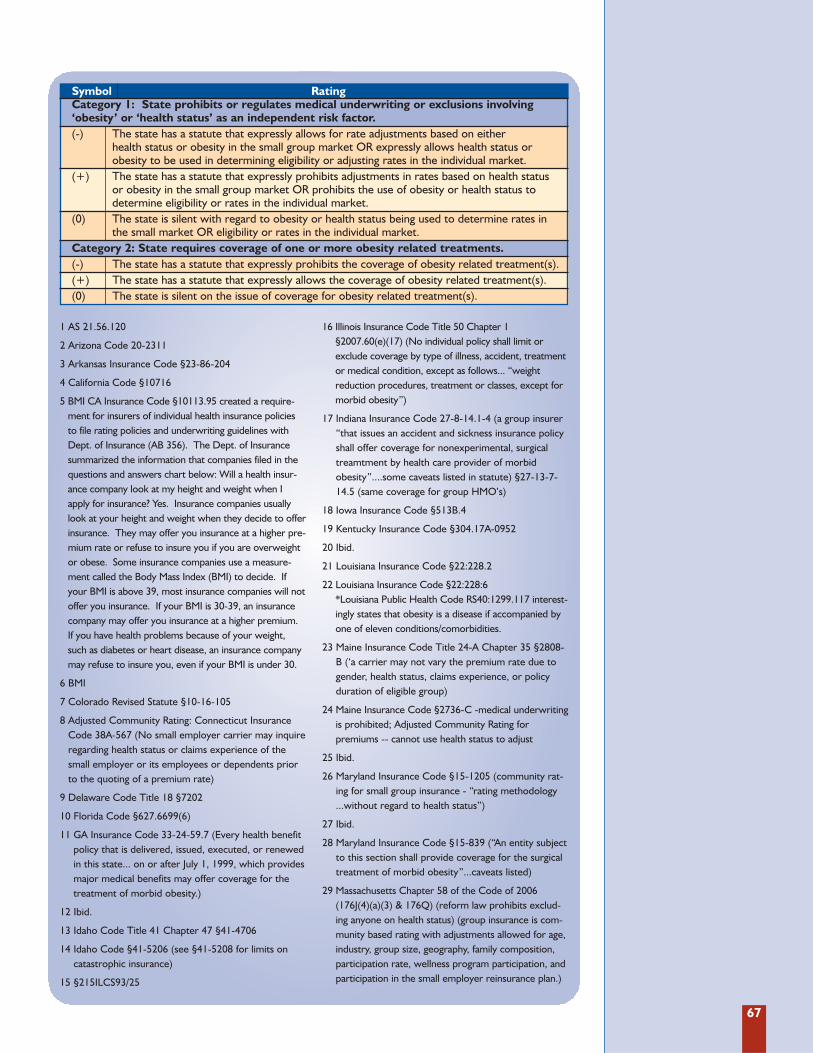
67
1 AS 21.56.120
2 Arizona Code 20-2311
3 Arkansas Insurance Code §23-86-204
4 California Code §10716
5 BMI CA Insurance Code §10113.95 created a require-ment for insurers of individual health insurance policiesto file rating policies and underwriting guidelines withDept. of Insurance (AB 356). The Dept. of Insurancesummarized the information that companies filed in thequestions and answers chart below: Will a health insur-ance company look at my height and weight when Iapply for insurance? Yes. Insurance companies usuallylook at your height and weight when they decide to offerinsurance. They may offer you insurance at a higher pre-mium rate or refuse to insure you if you are overweightor obese. Some insurance companies use a measure-ment called the Body Mass Index (BMI) to decide. Ifyour BMI is above 39, most insurance companies will notoffer you insurance. If your BMI is 30-39, an insurancecompany may offer you insurance at a higher premium.If you have health problems because of your weight,such as diabetes or heart disease, an insurance companymay refuse to insure you, even if your BMI is under 30.
6 BMI
7 Colorado Revised Statute §10-16-105
8 Adjusted Community Rating: Connecticut InsuranceCode 38A-567 (No small employer carrier may inquireregarding health status or claims experience of thesmall employer or its employees or dependents priorto the quoting of a premium rate)
9 Delaware Code Title 18 §7202
10 Florida Code §627.6699(6)
11 GA Insurance Code 33-24-59.7 (Every health benefitpolicy that is delivered, issued, executed, or renewedin this state... on or after July 1, 1999, which providesmajor medical benefits may offer coverage for thetreatment of morbid obesity.)
12 Ibid.
13 Idaho Code Title 41 Chapter 47 §41-4706
14 Idaho Code §41-5206 (see §41-5208 for limits oncatastrophic insurance)
15 §215ILCS93/25
16 Illinois Insurance Code Title 50 Chapter 1§2007.60(e)(17) (No individual policy shall limit orexclude coverage by type of illness, accident, treatmentor medical condition, except as follows... “weightreduction procedures, treatment or classes, except formorbid obesity”)
17 Indiana Insurance Code 27-8-14.1-4 (a group insurer“that issues an accident and sickness insurance policyshall offer coverage for nonexperimental, surgicaltreamtment by health care provider of morbid obesity”....some caveats listed in statute) §27-13-7-14.5 (same coverage for group HMO’s)
18 Iowa Insurance Code §513B.4
19 Kentucky Insurance Code §304.17A-0952
20 Ibid.
21 Louisiana Insurance Code §22:228.2
22 Louisiana Insurance Code §22:228:6*Louisiana Public Health Code RS40:1299.117 interest-ingly states that obesity is a disease if accompanied byone of eleven conditions/comorbidities.
23 Maine Insurance Code Title 24-A Chapter 35 §2808-B (‘a carrier may not vary the premium rate due togender, health status, claims experience, or policyduration of eligible group)
24 Maine Insurance Code §2736-C -medical underwritingis prohibited; Adjusted Community Rating for premiums -- cannot use health status to adjust
25 Ibid.
26 Maryland Insurance Code §15-1205 (community rat-ing for small group insurance - “rating methodology...without regard to health status”)
27 Ibid.
28 Maryland Insurance Code §15-839 (“An entity subjectto this section shall provide coverage for the surgicaltreatment of morbid obesity”...caveats listed)
29 Massachusetts Chapter 58 of the Code of 2006(176J(4)(a)(3) & 176Q) (reform law prohibits exclud-ing anyone on health status) (group insurance is com-munity based rating with adjustments allowed for age,industry, group size, geography, family composition,participation rate, wellness program participation, andparticipation in the small employer reinsurance plan.)
Symbol RatingCategory 1: State prohibits or regulates medical underwriting or exclusions involving ‘obesity’ or ‘health status’ as an independent risk factor.(-) The state has a statute that expressly allows for rate adjustments based on either
health status or obesity in the small group market OR expressly allows health status or obesity to be used in determining eligibility or adjusting rates in the individual market.
(+) The state has a statute that expressly prohibits adjustments in rates based on health status or obesity in the small group market OR prohibits the use of obesity or health status todetermine eligibility or rates in the individual market.
(0) The state is silent with regard to obesity or health status being used to determine rates in the small market OR eligibility or rates in the individual market.
Category 2: State requires coverage of one or more obesity related treatments.(-) The state has a statute that expressly prohibits the coverage of obesity related treatment(s).(+) The state has a statute that expressly allows the coverage of obesity related treatment(s).(0) The state is silent on the issue of coverage for obesity related treatment(s).
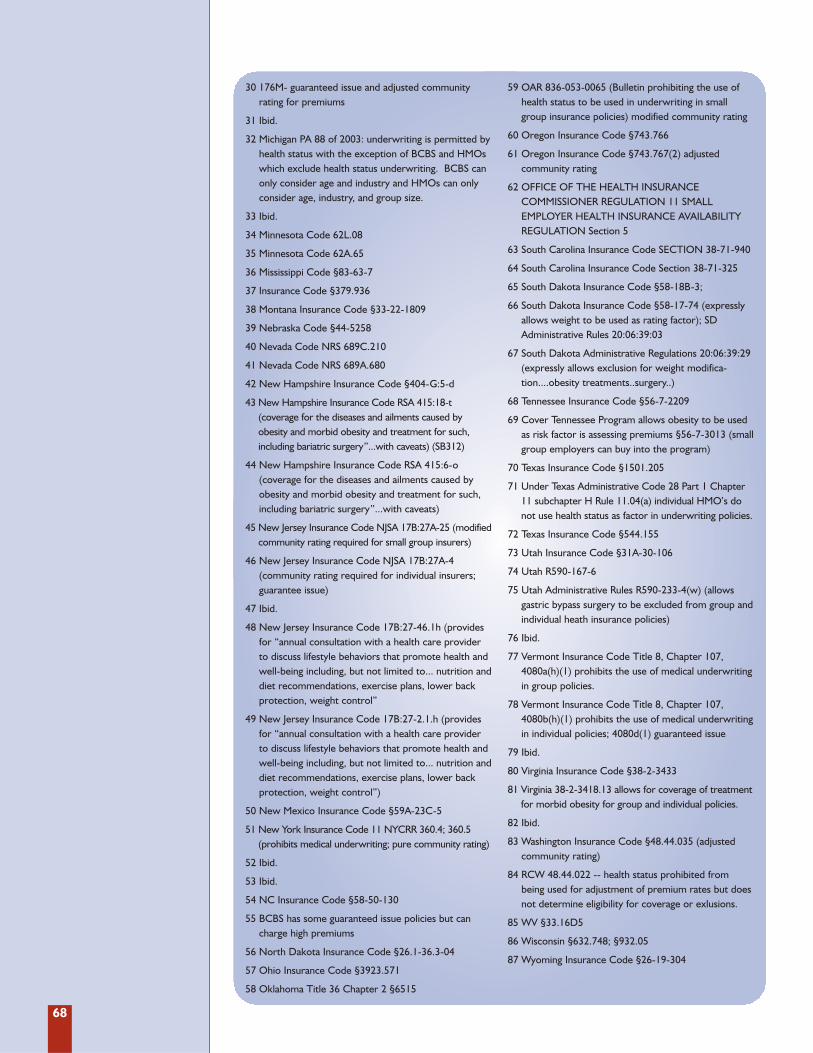
68
30 176M- guaranteed issue and adjusted community rating for premiums
31 Ibid.
32 Michigan PA 88 of 2003: underwriting is permitted byhealth status with the exception of BCBS and HMOswhich exclude health status underwriting. BCBS canonly consider age and industry and HMOs can onlyconsider age, industry, and group size.
33 Ibid.
34 Minnesota Code 62L.08
35 Minnesota Code 62A.65
36 Mississippi Code §83-63-7
37 Insurance Code §379.936
38 Montana Insurance Code §33-22-1809
39 Nebraska Code §44-5258
40 Nevada Code NRS 689C.210
41 Nevada Code NRS 689A.680
42 New Hampshire Insurance Code §404-G:5-d
43 New Hampshire Insurance Code RSA 415:18-t (coverage for the diseases and ailments caused by obesity and morbid obesity and treatment for such,including bariatric surgery”...with caveats) (SB312)
44 New Hampshire Insurance Code RSA 415:6-o (coverage for the diseases and ailments caused byobesity and morbid obesity and treatment for such,including bariatric surgery”...with caveats)
45 New Jersey Insurance Code NJSA 17B:27A-25 (modifiedcommunity rating required for small group insurers)
46 New Jersey Insurance Code NJSA 17B:27A-4 (community rating required for individual insurers;guarantee issue)
47 Ibid.
48 New Jersey Insurance Code 17B:27-46.1h (providesfor “annual consultation with a health care providerto discuss lifestyle behaviors that promote health andwell-being including, but not limited to... nutrition anddiet recommendations, exercise plans, lower backprotection, weight control”
49 New Jersey Insurance Code 17B:27-2.1.h (providesfor “annual consultation with a health care providerto discuss lifestyle behaviors that promote health andwell-being including, but not limited to... nutrition anddiet recommendations, exercise plans, lower backprotection, weight control”)
50 New Mexico Insurance Code §59A-23C-5
51 New York Insurance Code 11 NYCRR 360.4; 360.5(prohibits medical underwriting; pure community rating)
52 Ibid.
53 Ibid.
54 NC Insurance Code §58-50-130
55 BCBS has some guaranteed issue policies but cancharge high premiums
56 North Dakota Insurance Code §26.1-36.3-04
57 Ohio Insurance Code §3923.571
58 Oklahoma Title 36 Chapter 2 §6515
59 OAR 836-053-0065 (Bulletin prohibiting the use ofhealth status to be used in underwriting in smallgroup insurance policies) modified community rating
60 Oregon Insurance Code §743.766
61 Oregon Insurance Code §743.767(2) adjusted community rating
62 OFFICE OF THE HEALTH INSURANCE COMMISSIONER REGULATION 11 SMALLEMPLOYER HEALTH INSURANCE AVAILABILITYREGULATION Section 5
63 South Carolina Insurance Code SECTION 38-71-940
64 South Carolina Insurance Code Section 38-71-325
65 South Dakota Insurance Code §58-18B-3;
66 South Dakota Insurance Code §58-17-74 (expresslyallows weight to be used as rating factor); SDAdministrative Rules 20:06:39:03
67 South Dakota Administrative Regulations 20:06:39:29(expressly allows exclusion for weight modifica-tion....obesity treatments..surgery..)
68 Tennessee Insurance Code §56-7-2209
69 Cover Tennessee Program allows obesity to be usedas risk factor is assessing premiums §56-7-3013 (smallgroup employers can buy into the program)
70 Texas Insurance Code §1501.205
71 Under Texas Administrative Code 28 Part 1 Chapter11 subchapter H Rule 11.04(a) individual HMO’s donot use health status as factor in underwriting policies.
72 Texas Insurance Code §544.155
73 Utah Insurance Code §31A-30-106
74 Utah R590-167-6
75 Utah Administrative Rules R590-233-4(w) (allowsgastric bypass surgery to be excluded from group andindividual heath insurance policies)
76 Ibid.
77 Vermont Insurance Code Title 8, Chapter 107,4080a(h)(1) prohibits the use of medical underwritingin group policies.
78 Vermont Insurance Code Title 8, Chapter 107,4080b(h)(1) prohibits the use of medical underwritingin individual policies; 4080d(1) guaranteed issue
79 Ibid.
80 Virginia Insurance Code §38-2-3433
81 Virginia 38-2-3418.13 allows for coverage of treatmentfor morbid obesity for group and individual policies.
82 Ibid.
83 Washington Insurance Code §48.44.035 (adjustedcommunity rating)
84 RCW 48.44.022 -- health status prohibited frombeing used for adjustment of premium rates but doesnot determine eligibility for coverage or exlusions.
85 WV §33.16D5
86 Wisconsin §632.748; §932.05
87 Wyoming Insurance Code §26-19-304
69
Medical Underwriting or ExclusionsEssentially insurers have the liberty to useobesity or health status as a risk factor todeny coverage and exclude treatments,unless otherwise prohibited by state law.On the group market, 35 states expresslyallow health status or obesity to be used as afactor for rate adjustments in the smallgroup market. The majority used “healthstatus” as an adjustment factor. Only 9 statesprohibit the use of health status or obesity asa factor for rate adjustments in the smallgroup market. These states used communi-ty or adjusted community rating.
Five states prohibit the use of health status orobesity as a factor to determine eligibility inthe individual market. These states are Maine,Massachusetts, New Jersey, New York andVermont. Meanwhile, 7 states prohibit the useof health status or obesity as a factor to deter-mine rates in the individual market -- Maine,Massachusetts, New Jersey, New York, Oregon,Vermont, and Washington.
For the individual market, 2 states expresslyallow the use of health status or obesity as afactor to determine eligibility in the individ-ual market -- Oregon (through mandatoryuse of standardized health form) andCalifornia (through mandatory filing ofinsurers’ rates based on BMI). Ten statesallow the use of health status or obesity as a
factor to determine rates in the individualmarket. South Dakota is the only state toexpressly state that “weight” can be used as arating factor; the other 9 states allow “healthstatus” to be used as a rating factor.
Mandated Coverage for One or MoreObesity-Related TreatmentThe vast majority of states do not mandateany coverage of obesity related treatmentsand the few that do cover only those treat-ments for morbid obesity as long as individ-uals adhere to the caveats imposed in thecoverage requirement. Only 5 states pro-vide for coverage of one or more treatmentsfor obesity for both the small group andindividual insurance markets: Georgia,Maryland, New Hampshire, New Jersey, andVirginia. Indiana provides for coverage ofsurgical treatment of morbid obesity forgroups only, while Illinois and South Dakotaexpressly exclude coverage for obesity relat-ed treatments in the individual market only.Utah is the only state that expressly excludesgastric bypass surgery from coverage in bothmarkets.
Although obesity itself is being treated morelike a disease with drugs, surgery, andbehavior therapy in various combinations,the health insurance system has still largelyignored the problem.

71
In December 2007, USDA made significantchanges to the Special Supplemental NutritionProgram for Women, Infants, and Children(WIC) adding fruits, vegetables, and wholegrains to the list of grocery items covered. Thiswas the program’s first major overhaul since1974.278 A 2005 report by the IOM had calledfor similar action on the grounds that “the pro-posed changes to the WIC food packages holdpotential for improving the nutrition andhealth of the nation’s low-income pregnantwomen, new mothers, infants, and young chil-dren.”279 USDA based its recommendations onthose in the 2005 IOM report.
Under the old regulations, WIC participantswere able to purchase the following items:� Iron-fortified infant formulas� Milk� Cereal (infant and adult)� Juice� Eggs� Cheese� Dried legumes or peanut butter� Tuna� Carrots
The new WIC list of approved foods con-tains all the old items plus:280
� Fruits (fresh, frozen, dried or canned)� Vegetables (fresh, frozen, dried or canned)� Whole wheat bread or other whole grains� Soy-beverage & tofu� Light tuna� Salmon� Sardines� Mackerel� Canned legumes� Infant foods
The new food list incorporates a diversegroup of foods in order to appeal to partici-pants from various cultural backgrounds.281
According to the National WIC Association,these changes will not only impact thehealth of mothers and children enrolled inthe program, but others in the communitywho shop at WIC-authorized grocery storesas these retail outlets will now be required tocarry this variety of fresh, healthy food.282
The changes to WIC also include incentivesto promote breastfeeding among low-
A. Overhaul of the WIC Food Packages.
B. 2008 Farm Bill.
C. Reauthorization of the Child Nutrition Act.
D. Reauthorization of the No Child LeftBehind Act.
E. Reauthorization of the State Children’sHealth Insurance Program (SCHIP).
F. Reauthorization of the Safe, Accountable,Flexible, Efficient Transportation EquityAct: A Legacy for Users (SAFETEA-LU).
G. Other Obesity Related Legislation beforeCongress.
H. Funding for CDC Obesity Grants.
There are a variety of initiatives to promote physical activity and healthy
nutrition at the federal level. This section includes a discussion of fed-
eral obesity-related policies and legislation, including major bills that were up
for reauthorization in 2008 or that are due to be considered in 2009.
A. OVERHAUL OF THE WIC FOOD PACKAGES
Federal Responsibilitiesand Policies 4S E C T I O N
72
income women, who have lower rates ofbreastfeeding according to CDC.283
Research indicates that formula-fed chil-dren have higher risks of ear and respirato-ry infections, obesity, diabetes, and cancer.284
The WIC program aims to more vigorouslypromote and support breastfeeding byincreasing the amount of fruit and veg-
etable vouchers women who breastfeedreceive, while providing less formula to par-tially breastfed infants.
States have until Oct. 1, 2009, to implementthe new WIC regulations, but many havemoved to implement them ahead of thedeadline.
In June, the House and Senate both passed theFood, Conservation, and Energy Act of 2008(P.L. 110-246). The legislation reauthorizesfarm and nutrition programs for the next 5years. It includes an additional $10.36 billionover current spending levels for nutrition pro-grams. The president vetoed the bill, but theHouse and Senate overrode the veto. Below isa summary of some of the key nutrition provi-sions in the bill:
Food Stamps� Renames the Food Stamp Program the
“Supplemental Nutrition AssistanceProgram” (SNAP).
� Raises and indexes the standard deduc-tion and increases the minimum monthlybenefit for food stamp recipients.
� Indexes the asset limit to keep pace withinflation and excludes the value of retire-ment and education savings accountsfrom counting towards the asset limit.
� Requires the Secretary of Agriculture tocarry out pilot projects to develop and testmethods of using the SNAP to improve thedietary and health status of households eli-gible for or participating in the SNAP andto reduce overweight, obesity and associat-ed co-morbidities in the United States;requires that the secretary not use morethan $20 million in mandatory funding tocarry out a point-of-purchase pilot pro-gram to encourage households participat-ing in the SNAP to purchase fruits, vegeta-bles or other healthy foods.
B. 2008 FARM BILL
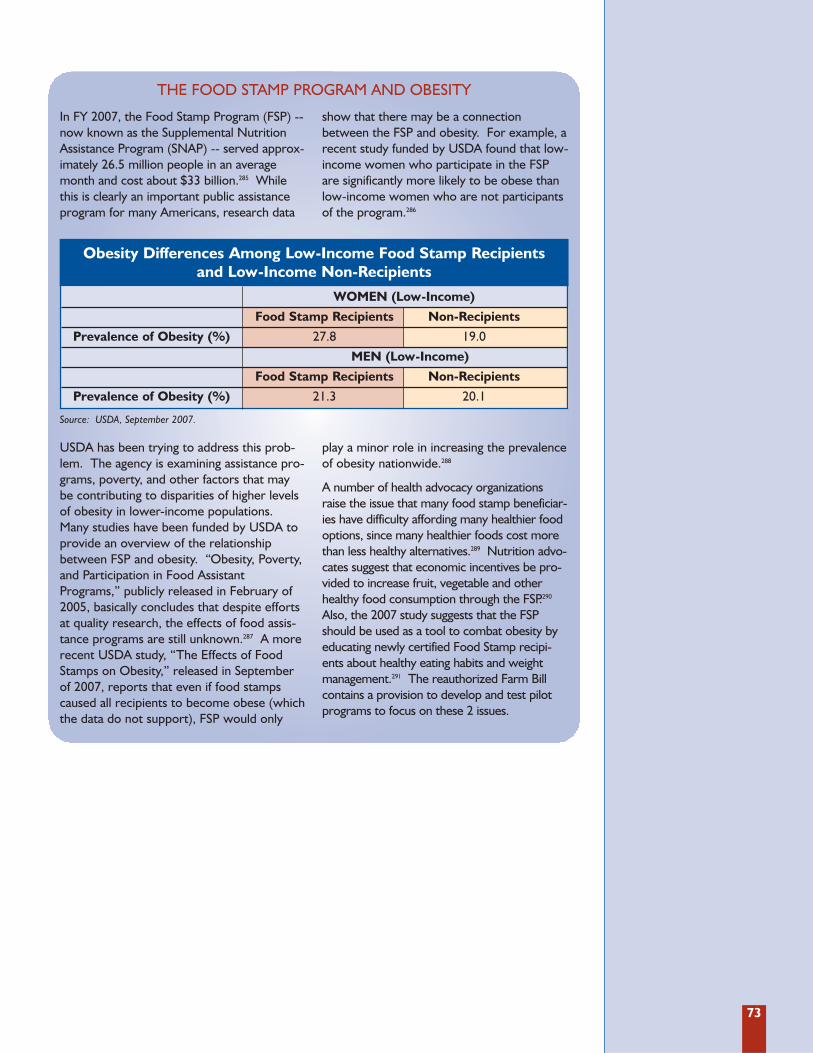
73
In FY 2007, the Food Stamp Program (FSP) --now known as the Supplemental NutritionAssistance Program (SNAP) -- served approx-imately 26.5 million people in an averagemonth and cost about $33 billion.285 Whilethis is clearly an important public assistanceprogram for many Americans, research data
show that there may be a connectionbetween the FSP and obesity. For example, arecent study funded by USDA found that low-income women who participate in the FSPare significantly more likely to be obese thanlow-income women who are not participantsof the program.286
USDA has been trying to address this prob-lem. The agency is examining assistance pro-grams, poverty, and other factors that maybe contributing to disparities of higher levelsof obesity in lower-income populations.Many studies have been funded by USDA toprovide an overview of the relationshipbetween FSP and obesity. “Obesity, Poverty,and Participation in Food AssistantPrograms,” publicly released in February of2005, basically concludes that despite effortsat quality research, the effects of food assis-tance programs are still unknown.287 A morerecent USDA study, “The Effects of FoodStamps on Obesity,” released in Septemberof 2007, reports that even if food stampscaused all recipients to become obese (whichthe data do not support), FSP would only
play a minor role in increasing the prevalenceof obesity nationwide.288
A number of health advocacy organizationsraise the issue that many food stamp beneficiar-ies have difficulty affording many healthier foodoptions, since many healthier foods cost morethan less healthy alternatives.289 Nutrition advo-cates suggest that economic incentives be pro-vided to increase fruit, vegetable and otherhealthy food consumption through the FSP.290
Also, the 2007 study suggests that the FSPshould be used as a tool to combat obesity byeducating newly certified Food Stamp recipi-ents about healthy eating habits and weightmanagement.291 The reauthorized Farm Billcontains a provision to develop and test pilotprograms to focus on these 2 issues.
THE FOOD STAMP PROGRAM AND OBESITY
Obesity Differences Among Low-Income Food Stamp Recipients and Low-Income Non-Recipients
WOMEN (Low-Income)
Food Stamp Recipients Non-Recipients
Prevalence of Obesity (%) 27.8 19.0
MEN (Low-Income)
Food Stamp Recipients Non-Recipients
Prevalence of Obesity (%) 21.3 20.1
Source: USDA, September 2007.
74
Seniors� Reauthorizes the Commodity Supplemental
Food Program, which provides nutritiousfood boxes primarily to low-income seniors.
� Provides $20.6 million in mandatory fund-ing each year for the Senior Farmers’Market Nutrition Program, which providesseniors with vouchers to buy fresh produceat farmers’ markets, roadside stands, andother community-supported programs.
Children� Provides for a nationwide expansion of
the Fresh Fruit and Vegetable Program,which provides free fresh fruits and veg-etables to be served as snacks to school-children; requires state agencies to reachout to schools with significant numbers ofchildren eligible for free or reduced-pricemeals to inform them of their eligibilityfor the program; and authorizes mandato-ry funding of $40 million for the programin 2008, $65 million in 2009, $101 millionin 2010, $150 million in 2011, and $150million indexed for inflation in 2012.
� Requires the Secretary of Agriculture tocarry out a nationally representative sur-vey of the foods purchased by schoolauthorities participating in the schoollunch program and provides $3 million tocarry out the survey.
� Directs the Secretary to purchase freshfruits and vegetables to be served for lunchin schools and service institutions and pro-vides $50 million a year for the acquisitions.
Communities� Provides $5 million of mandatory funding
each year for Community Food Projects,which are community-based projects thatrequire a one-time contribution of feder-al assistance to become self-sustainingand are designed to meet the food needsof low-income individuals and to increasethe self-reliance of communities in pro-viding for food needs.
� Creates the Healthy Urban FoodEnterprise Development Center toincrease access to healthy, affordablefoods, including locally produced agricul-tural products, to underserved communi-ties, and provides mandatory funding of$1 million per year for the Center.
� Increases funding by $1.256 billion forthe Emergency Food Assistance Program,which provides commodities to help stockfood banks.
� Devotes additional mandatory funding tothe Farmers’ Market Promotion Program(FMPP), which provides grants to helppromote farmers’ markets, roadsidestands and other direct producer-to-con-sumer marketing opportunities, and stip-ulates that some of the funding for theFMPP must be used to support the use ofelectronic benefits transfers for federalnutrition programs at farmers’ markets.
The School Lunch and Breakfast Programsand Special Supplemental NutritionProgram for WIC will be up for reauthoriza-tion in 2009. The legislation covers virtual-ly all federal child nutrition and special sup-plemental nutrition programs, includingthe following:
� National School Lunch Program.
� National School Breakfast Program.
� Summer Food Service Program.
� Child and Adult Care Food Program.
� WIC Program.
C. REAUTHORIZATION OF THE CHILD NUTRITION ANDSPECIAL SUPPLEMENTAL NUTRITION PROGRAM FORWOMEN, INFANTS, AND CHILDREN (WIC) ACT
75
These programs are administered byUSDA’s Food and Nutrition Service in coor-dination with state education, health, socialservice, and agriculture agencies. There are3 main goals of these federal child nutritionprograms: 1) improve children’s nutrition,2) increase lower-income children’s accessto nutritious meals and snacks, and 3) helpsupport the agricultural economy.292
An estimated 39 million children and 2 mil-lion lower-income pregnant/postpartumwomen are served by these programs.293
A number of dietary factors are contributingto increased levels of childhood and adult obe-sity in America, ranging from higher caloricdensity of foods to limited access to nutritiousfresh foods in many areas to outdated nutri-tion standards for foods sold at schools.Currently, the typical American diet does notinclude enough fruits and vegetables.
� Only one in 5 Americans consumes therecommended amount of fruit each day.294
� Children under the age of 18 generallyconsume 50 percent or less of the recom-mended levels of fruits and vegetables.295
Consumer and industry economics also con-tribute to the country’s obesity problem.
� Low-income families consume fewerfruits and vegetables than higher-incomefamilies.296
� People in low-income areas often paymore for nutritious foods such as freshfruits and vegetables.297,298
� The costs of fruits and vegetables haveincreased 40 percent since 1985, while thecosts of fats and sugars have declined.299,300
There are a number of nutrition provisionsassociated with the reauthorization of feder-al programs. Advocates argue that these canbe an important vehicle to improve federalchild nutrition programs and help combatthe obesity epidemic.
A 2006 report by the Congressional ResearchService highlighted some key nutrition provi-sions authorized under the 2004 version of the
Child Nutrition and Special SupplementalNutrition Program for Women, Infants, andChildren (WIC) Act (P.L. 108-265).301 Theyinclude:
� Requiring local education agencies (i.e.school districts) which participate inschool meal programs to establish schoolwellness policies that include goals fornutrition education and physical activity,nutrition guidelines for foods availableduring the school day, and a plan to meas-ure implementation.
� Authorizing grants to states to implementTeamNutrition Networks that supportnutrition education through the promo-tion of active lifestyles, pilot projects, datagathering, and other activities. The Actauthorized grants to entities with expert-ise in health education programs for indi-viduals with limited English proficiency toenhance obesity prevention; authorizedtechnical assistance and grants to improvethe quality of school meals; and author-ized grants to local educational agenciesto create healthy school environments.
� Making permanent the fresh fruit andvegetable snack program in schools.
� Increasing the limit on the federal shareof benefits from $20 to $30 per partici-pant per year for the WIC Farmers’Market Nutrition Program, which pro-vides vouchers to WIC recipients to pur-chase fruit and vegetables at farmers’markets. It also enabled states to expandthe definition of “farmers’ markets” toinclude road side stands.
� Authorizing funding for USDA to encour-age schools to purchase locally producedfoods. It also authorized USDA to pro-vide competitive matching grants andtechnical assistance for projects thatimprove access to local foods throughfarm-to-cafeteria activities, procurementfrom small and medium-sized farms, sup-port for garden programs, and farm-based nutrition education projects.
76
The Elementary and Secondary EducationAct, widely known as the No Child LeftBehind Act (NCLB), was due for reautho-rization in 2007, but Congress still has notreauthorized it. Parts of the legislation couldinfluence how physical education and physi-cal activity are included within the school day.
According to the National Coalition forPromoting Physical Activity (NCPPA), stud-ies demonstrate that physical education andphysical activity programs have positiveeffects on students’ academic achievement,including increased concentration,improved mathematics, reading, and writ-ing test scores, and also reduced disruptivebehavior.302 (See Section 3: State Responsibilitiesand Policies for a further discussion of physicalactivity and academic performance.)
One of the major pieces of legislationaddressing physical activity in schools, thatmay be offered as an amendment to NCLB, is
the Fitness Integrated with Teaching (FIT)Kids Act of 2007 (S. 2173/H.R. 3257). Thelegislation was introduced by Senator TomHarkin (D-IA) and Representatives Ron Kind(D-WI), Zach Wamp (R-TN) and Jay Inslee(D-WA), and includes reforms that could beincluded in the reauthorization of NCLB.Specifically, the FIT Kids Act would: requirestate and local educational agency reportcards to include information on schoolhealth and physical education programs;include the promotion of active lifestyles ineducational grant programs; support profes-sional development for teachers and princi-pals to promote healthy habits and participa-tion in physical activity; and fund a study bythe National Academy of Sciences to assessthe impact of health and physical activity onstudent achievement and find ways to makeand measure improvements to health andphysical education in schools.
D. REAUTHORIZATION OF NO CHILD LEFT BEHIND
The State Children’s Health InsuranceProgram (SCHIP) is designed to help statesinsure more low-income children who are noteligible for Medicaid. The program was upfor reauthorization in 2007, but Congress andthe president could not reach agreement ona long-term reauthorization. As a result, thepresident signed a short-term extension ofthe program, until March of 2009. When theprogram is revisited, Congress may again con-sider taking steps to further address the child-hood obesity crisis by including a healthinsurance-style benefit for obesity-relatedservices to children enrolled in the program.
Most private insurance plans do not pro-vide coverage for obesity-related services;
thus, these benefits may not be part of the“benchmark” plans from which SCHIP cov-erage is developed. In order to moreeffectively address rising childhood obesityrates, basic anti-obesity benefits could beprovided for SCHIP beneficiaries. There isprecedent for this sort of coverage asMedicare covers medical nutrition therapyfor beneficiaries with diabetes or renal dis-ease. But the Medicare benefit, which isaimed at adults familiar with medicaladvice, counseling, and treatment, may notbe adequate for children covered bySCHIP. (See Section 3: State Responsibilitiesand Policies for a more detailed analysis of obe-sity-related insurance coverage.)
E. REAUTHORIZATION OF THE STATE CHILDREN’SHEALTH INSURANCE PROGRAM (SCHIP) ACT
77
G. OTHER OBESITY RELATED LEGISLATION BEFORE CONGRESS
The Safe, Accountable, Flexible, EfficientTransportation Equity Act: A Legacy for Users(SAFETEA-LU) will be reauthorized in 2009.The legislation has been an important vehicleto improve federal programs that supportactive transportation (travel by bike, foot, orother non-motorized means), safe streets, andpublic transportation. Researchers partiallyattribute the decline in physical activity tohow we commute to and from work.Therefore, a coalition of smart growthactivists and physical activity proponents arelooking at ways to use federal transportationprograms to boost physical activity and helpcombat the obesity epidemic.
This coalition of advocates point to the following facts:
� Non-leisure time physical activity hasdecreased substantially in the past 20 to30 years due to increasing mechanizationat work and in the home.303 “Non-leisure
time physical activity” is defined as energyspent in a normal day outside of sports,exercise and recreation. This includesmanual labor on the job, walking and bik-ing to work, and household chores.304
� A majority of U.S. adults (20-74 years old)walk less than 2 to 3 hours per week andaccumulate less than 5,000 steps perday.305 U.S. physical activity guidelines callfor adults to walk 10,000 steps daily.
� The automobile has significantly reducedphysical activity by its frequent use forshort trips for shopping, going to thecleaners, and other errands, and takingchildren to school.306 In fact, a nationalsurvey found that bike lanes were avail-able for less than 5 percent of bicycletrips, and more than one-quarter ofpedestrian trips take place on roads withneither sidewalks nor shoulders.307
F. REAUTHORIZATION OF THE SAFE, ACCOUNTABLE,FLEXIBLE, EFFICIENT TRANSPORTATION EQUITY ACT: A LEGACY FOR USERS (SAFETEA-LU)
LEGISLATION SPONSORSNutrition & Physical Activity
Federal Obesity Prevention Act of 2008, S. 3321 Sen. Tom Harkin (D-IA) This bill would amend the Public Health Service Act to provide coordinated leadership in Sen. Christopher Dodd (D-CT)Federal efforts to prevent and reduce overweight and obesity and to promote sound health Sen. Jeff Bingaman (D-NM)and nutrition among Americans, and for other purposes. The legislation requires the Sen. Edward Kennedy (D-MA)secretary of HHS to establish a Federal Task Force on Obesity to: (1) establish a Sen. Barbara Mikulski (D-MD)government-wide strategy for preventing and reducing overweight and obesity that includes defining clear roles, responsibilities, and accountability for all agencies of the Federal Government; (2) coordinate effective interagency coordination and priorities for action among Federal agencies, including short-term and long-term goals for childhood and adult obesity rates; and (3) implement and evaluate the effectiveness of such strategy.
Healthy Lifestyles and Prevention America Act, S. 1342/H.R. 2633 Sen. Tom Harkin (D-IA) This comprehensive legislation requires the secretary of HHS to convene a task force on Rep. Tom Udall (D-NM)childhood obesity; allows a wellness program credit for employers; requires certain restaurants and vending machines to provide nutritional information about each food offered; provides for the development of a tool to measure community barriers to participating in physical activity and provides for grants to plan model communities of play; and provides for healthy school nutrition environment incentive grants.
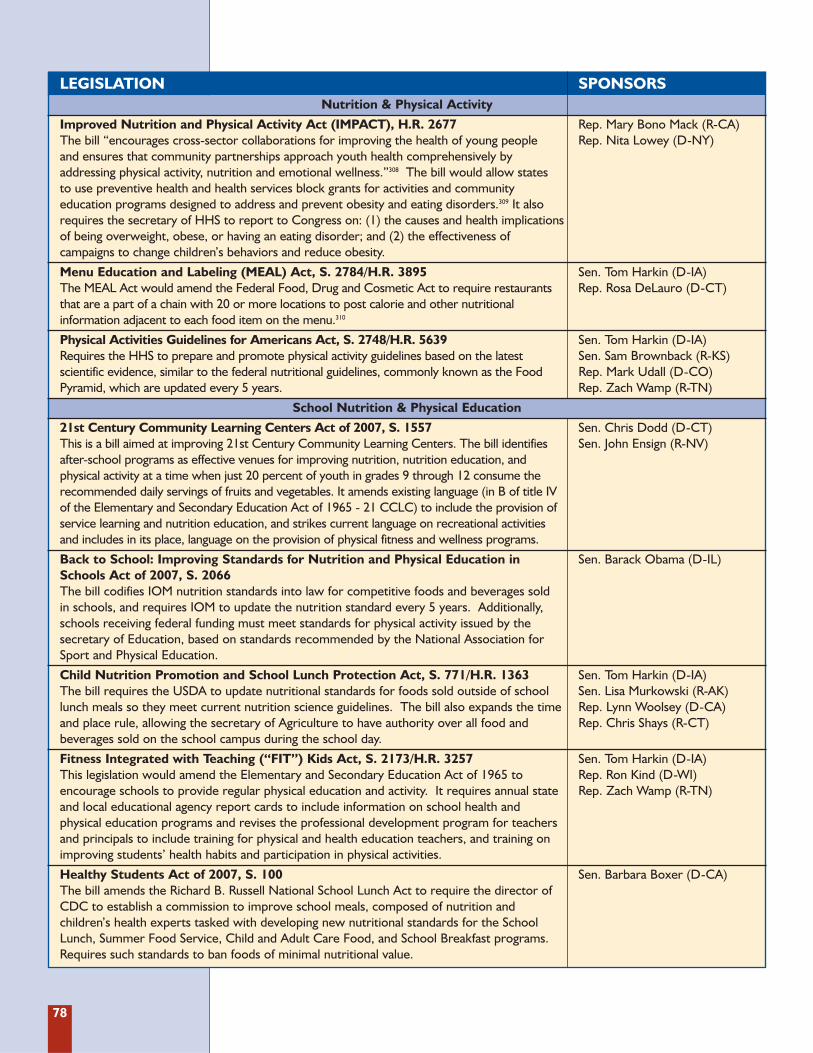
78
LEGISLATION SPONSORSNutrition & Physical Activity
Improved Nutrition and Physical Activity Act (IMPACT), H.R. 2677 Rep. Mary Bono Mack (R-CA)The bill “encourages cross-sector collaborations for improving the health of young people Rep. Nita Lowey (D-NY) and ensures that community partnerships approach youth health comprehensively by addressing physical activity, nutrition and emotional wellness.”308 The bill would allow states to use preventive health and health services block grants for activities and community education programs designed to address and prevent obesity and eating disorders.309 It also requires the secretary of HHS to report to Congress on: (1) the causes and health implications of being overweight, obese, or having an eating disorder; and (2) the effectiveness of campaigns to change children’s behaviors and reduce obesity.
Menu Education and Labeling (MEAL) Act, S. 2784/H.R. 3895 Sen. Tom Harkin (D-IA) The MEAL Act would amend the Federal Food, Drug and Cosmetic Act to require restaurants Rep. Rosa DeLauro (D-CT) that are a part of a chain with 20 or more locations to post calorie and other nutritional information adjacent to each food item on the menu.310
Physical Activities Guidelines for Americans Act, S. 2748/H.R. 5639 Sen. Tom Harkin (D-IA)Requires the HHS to prepare and promote physical activity guidelines based on the latest Sen. Sam Brownback (R-KS)scientific evidence, similar to the federal nutritional guidelines, commonly known as the Food Rep. Mark Udall (D-CO)Pyramid, which are updated every 5 years. Rep. Zach Wamp (R-TN)
School Nutrition & Physical Education
21st Century Community Learning Centers Act of 2007, S. 1557 Sen. Chris Dodd (D-CT)This is a bill aimed at improving 21st Century Community Learning Centers. The bill identifies Sen. John Ensign (R-NV)after-school programs as effective venues for improving nutrition, nutrition education, and physical activity at a time when just 20 percent of youth in grades 9 through 12 consume the recommended daily servings of fruits and vegetables. It amends existing language (in B of title IV of the Elementary and Secondary Education Act of 1965 - 21 CCLC) to include the provision of service learning and nutrition education, and strikes current language on recreational activities and includes in its place, language on the provision of physical fitness and wellness programs.
Back to School: Improving Standards for Nutrition and Physical Education in Sen. Barack Obama (D-IL)Schools Act of 2007, S. 2066The bill codifies IOM nutrition standards into law for competitive foods and beverages sold in schools, and requires IOM to update the nutrition standard every 5 years. Additionally, schools receiving federal funding must meet standards for physical activity issued by the secretary of Education, based on standards recommended by the National Association for Sport and Physical Education.
Child Nutrition Promotion and School Lunch Protection Act, S. 771/H.R. 1363 Sen. Tom Harkin (D-IA)The bill requires the USDA to update nutritional standards for foods sold outside of school Sen. Lisa Murkowski (R-AK)lunch meals so they meet current nutrition science guidelines. The bill also expands the time Rep. Lynn Woolsey (D-CA)and place rule, allowing the secretary of Agriculture to have authority over all food and Rep. Chris Shays (R-CT)beverages sold on the school campus during the school day.
Fitness Integrated with Teaching (“FIT”) Kids Act, S. 2173/H.R. 3257 Sen. Tom Harkin (D-IA) This legislation would amend the Elementary and Secondary Education Act of 1965 to Rep. Ron Kind (D-WI) encourage schools to provide regular physical education and activity. It requires annual state Rep. Zach Wamp (R-TN)and local educational agency report cards to include information on school health and physical education programs and revises the professional development program for teachers and principals to include training for physical and health education teachers, and training on improving students’ health habits and participation in physical activities.
Healthy Students Act of 2007, S. 100 Sen. Barbara Boxer (D-CA)The bill amends the Richard B. Russell National School Lunch Act to require the director of CDC to establish a commission to improve school meals, composed of nutrition and children’s health experts tasked with developing new nutritional standards for the School Lunch, Summer Food Service, Child and Adult Care Food, and School Breakfast programs. Requires such standards to ban foods of minimal nutritional value.
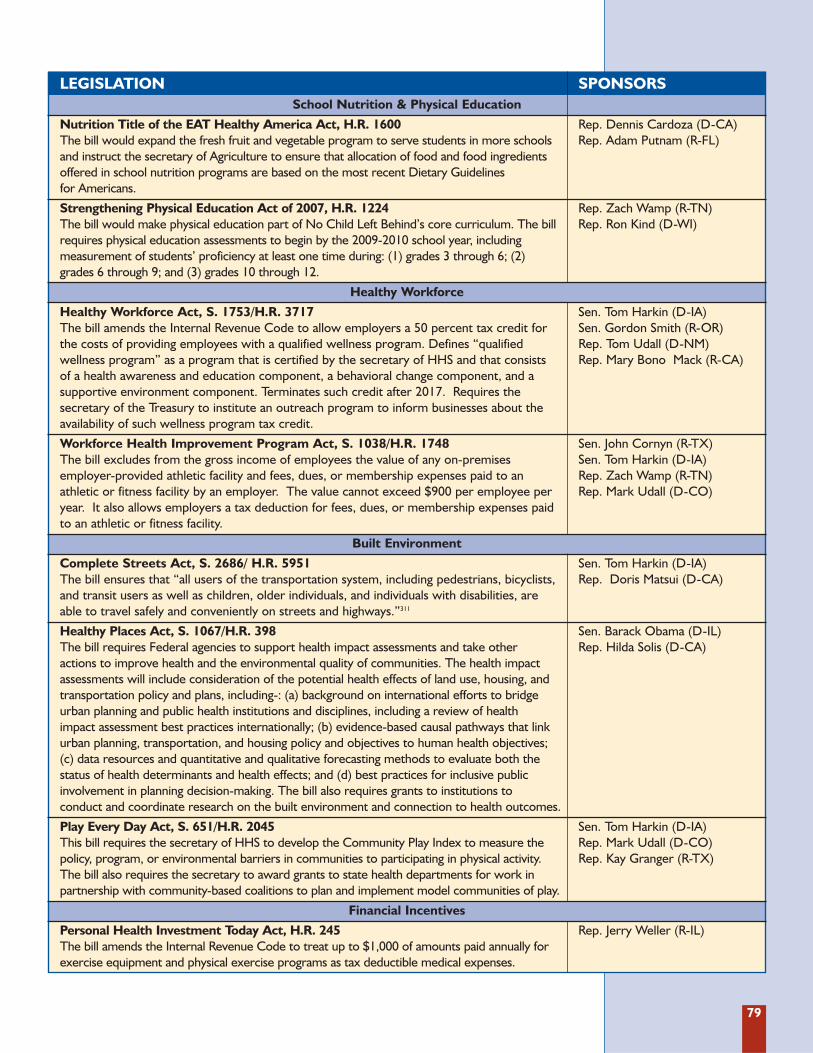
79
LEGISLATION SPONSORSSchool Nutrition & Physical Education
Nutrition Title of the EAT Healthy America Act, H.R. 1600 Rep. Dennis Cardoza (D-CA)The bill would expand the fresh fruit and vegetable program to serve students in more schools Rep. Adam Putnam (R-FL)and instruct the secretary of Agriculture to ensure that allocation of food and food ingredients offered in school nutrition programs are based on the most recent Dietary Guidelines for Americans.
Strengthening Physical Education Act of 2007, H.R. 1224 Rep. Zach Wamp (R-TN)The bill would make physical education part of No Child Left Behind’s core curriculum. The bill Rep. Ron Kind (D-WI)requires physical education assessments to begin by the 2009-2010 school year, including measurement of students’ proficiency at least one time during: (1) grades 3 through 6; (2) grades 6 through 9; and (3) grades 10 through 12.
Healthy Workforce
Healthy Workforce Act, S. 1753/H.R. 3717 Sen. Tom Harkin (D-IA)The bill amends the Internal Revenue Code to allow employers a 50 percent tax credit for Sen. Gordon Smith (R-OR)the costs of providing employees with a qualified wellness program. Defines “qualified Rep. Tom Udall (D-NM) wellness program” as a program that is certified by the secretary of HHS and that consists Rep. Mary Bono Mack (R-CA)of a health awareness and education component, a behavioral change component, and a supportive environment component. Terminates such credit after 2017. Requires the secretary of the Treasury to institute an outreach program to inform businesses about the availability of such wellness program tax credit.
Workforce Health Improvement Program Act, S. 1038/H.R. 1748 Sen. John Cornyn (R-TX) The bill excludes from the gross income of employees the value of any on-premises Sen. Tom Harkin (D-IA)employer-provided athletic facility and fees, dues, or membership expenses paid to an Rep. Zach Wamp (R-TN)athletic or fitness facility by an employer. The value cannot exceed $900 per employee per Rep. Mark Udall (D-CO)year. It also allows employers a tax deduction for fees, dues, or membership expenses paid to an athletic or fitness facility.
Built Environment
Complete Streets Act, S. 2686/ H.R. 5951 Sen. Tom Harkin (D-IA) The bill ensures that “all users of the transportation system, including pedestrians, bicyclists, Rep. Doris Matsui (D-CA)and transit users as well as children, older individuals, and individuals with disabilities, are able to travel safely and conveniently on streets and highways.”311
Healthy Places Act, S. 1067/H.R. 398 Sen. Barack Obama (D-IL)The bill requires Federal agencies to support health impact assessments and take other Rep. Hilda Solis (D-CA)actions to improve health and the environmental quality of communities. The health impact assessments will include consideration of the potential health effects of land use, housing, and transportation policy and plans, including-: (a) background on international efforts to bridge urban planning and public health institutions and disciplines, including a review of health impact assessment best practices internationally; (b) evidence-based causal pathways that link urban planning, transportation, and housing policy and objectives to human health objectives; (c) data resources and quantitative and qualitative forecasting methods to evaluate both the status of health determinants and health effects; and (d) best practices for inclusive public involvement in planning decision-making. The bill also requires grants to institutions to conduct and coordinate research on the built environment and connection to health outcomes.
Play Every Day Act, S. 651/H.R. 2045 Sen. Tom Harkin (D-IA)This bill requires the secretary of HHS to develop the Community Play Index to measure the Rep. Mark Udall (D-CO)policy, program, or environmental barriers in communities to participating in physical activity. Rep. Kay Granger (R-TX)The bill also requires the secretary to award grants to state health departments for work in partnership with community-based coalitions to plan and implement model communities of play.
Financial Incentives
Personal Health Investment Today Act, H.R. 245 Rep. Jerry Weller (R-IL)The bill amends the Internal Revenue Code to treat up to $1,000 of amounts paid annually for exercise equipment and physical exercise programs as tax deductible medical expenses.
80
The proposed budget from the administra-tion for FY 2009 flat-funds or cuts a numberof cooperative agreement grant programsthat focus on obesity prevention and healthpromotion at CDC, including the Divisionof Nutrition, Physical Activity, and Obesity,the Division of Adolescent and SchoolHealth, and the Division of Adult andCommunity Health.312
� Division of Nutrition, Physical Activity,and Obesity (DNPAO): Through itsNutrition and Physical Activity Programto Prevent Obesity and Other ChronicDiseases, the DNPAO funds programsthat use various nutrition and physicalactivity intervention strategies to addressobesity and other chronic diseases.313
States that are awarded DNPAO grantsare required to create, implement andmonitor a nutrition, physical activity andobesity state plan; monitor the prevalenceof overweight, obesity, nutrition qualityand physical activity levels; and monitorthe impact of their program in changingoverweight and obesity related behaviors,including evaluating progress and effec-tiveness of their annual work plan. Underthe new 5-year grant cycle that began inJune 2008, 23 states received funding, 5fewer than the previous grant cycle.
� Division of Adolescent and School Health(DASH): As part of its mission to preventthe most serious health risk behaviorsamong children, adolescents and youngadults, DASH currently provides fundingfor state and territorial education agenciesand tribal governments to help school dis-tricts and schools implement aCoordinated School Health Program(CSHP), and, through this approach,increase effectiveness of policies, pro-grams, and practices to promote physicalactivity, nutrition, and tobacco-use preven-tion (PANT) among students.314 Schoolhealth programs encompass health andphysical education, school meals, healthservices, and healthy school environments.
The Coordinated School Health Programis currently available to only 22 states andone tribal government due to limitedfunds. Twenty states, the District ofColumbia, 4 tribes and 3 territories wereapproved but unfunded in the latest grantcycle, beginning on March 1, 2008.
� Division of Adult and CommunityHealth (DACH): DACH is charged withproviding crosscutting chronic diseaseand health promotion expertise andsupport to CDC’s National Center forChronic Disease Prevention and HealthPromotion. It oversees 2 crucial pro-grams in the fight to prevent and treatobesity: the Steps Program and thePioneering Healthier Communitiesprogram.
� The Steps Program funds communitiesacross the country to show how local ini-tiatives can reduce the burden of chron-ic diseases such as obesity, diabetes, andasthma by encouraging people to bemore physically active, eat a healthydiet, and not use tobacco.315 Steps pro-grams have demonstrated progress inreducing obesity in community-basedinterventions; reducing chronic diseaserisk factors and health care costs inworkplaces; creating healthier schoolenvironments including the provisionof nutritious foods and physical activityenhancements; and reducing A1c levelsamong diabetes patients. The Admin -istration has proposed cutting the Stepsprogram by $9.6 million in FY 2009,which represents a 60% reduction forthe program over the last 2 years.
� The Pioneering Healthier Communitiesprogram, a partnership with CDC andthe YMCA of the USA, addresses physi-cal inactivity, poor nutrition, obesity andrelated chronic diseases in communitiesacross our nation. Pioneering HealthierCommunities convenes action teams ofcommunity leaders that assess local
H. FUNDING FOR CDC OBESITY GRANTS
81
needs and determine a local strategy forchanges in schools, worksites, food dis-tribution, the built environment, andthe community environment. CDC pro-vides limited funds to support commu-nity planning and implementation; con-sultation is provided throughout theplanning and implementation of local
plans. Pioneering Healthier Commun -ities impacts 20 new communities eachyear; over 60 communities have beenreached since FY 2005. The Admin -istration has proposed zeroing out thePioneering Healthier Communities program in FY 2009.
FY 2009 Presidential Appropriations Request for CDC Programs and Divisions316
Division/Program FY 2008 President’s Difference in FY 2009 Funding Proposal (FY09-FY08)
Division of Nutrition, Physical $42,191,000 $42,018,000 -$173,000Activity and Obesity (DNPAO)
Division of Adolescent School $54,323,000* $53,612,000* -$711,000Health
Steps to a Healthier U.S. $25,158,000 $15,541,000 -$9,617,000
Pioneering Healthier $2,900,000 $0 -$2,900,000Communities
Source: CDC Financial Management Office
*Note: This includes funds for HIV programs. DASH’s Coordinated School Health Program, which deals specifically with
nutrition and physical activity, was funded at $13,609,000 in FY 2008. The President’s FY 2009 budget proposal recom-
mended $13,553,000 for the program.

83
Individuals are suffering major health conse-quences, and it is costing the economy bil-lions of dollars in health care and lost pro-ductivity. We are failing America’s childrenby allowing them to develop health problemslike type 2 diabetes and heart disease that willharm them for their entire lives. As a nation,we cannot have a healthy economy if we donot have a healthy workforce. As jobs gooverseas to countries with cheaper healthcare, the obesity epidemic is threatening ourability to compete in the global economy.
The question is what can we do about it?
It is not the role of government to regu-late how people eat or how much theyshould exercise.
It is the role of government to remove theobstacles that get in the way of individualsmaking healthy choices.
It is important to challenge Americans to takeresponsibility to be as healthy as they can be.
Millions of Americans have been trying to takepersonal responsibility. As a nation, we spendmore than $35 billion a year on weight-lossproducts and services. Yet, many Americansreport that they struggle with paying the high-er costs of nutritious foods and the stresses ofworking and taking care of their householdsand families, which leave little time for prepar-ing healthy meals and physical activity.
Clearly a strategy of personal responsibili-ty alone is not working. People do notmake health-related or lifestyle decisionsin vacuums.
Many of the forces that have contributed toour national weight gain are deeplyingrained in our culture, such as an increasein prepared foods and eating in restaurants,and the greater distances people havebetween home, work, schools, and shoppingareas that lead to an increased need for carsand motorized transportation to get around.
Obesity is a genuine health crisis in this country. With approximate-
ly 23 million children overweight or obese, this could be the first
generation to lead sicker, shorter lives than their parents. In the past 2
decades, adult obesity rates have climbed from 15 percent to 30 percent.318
Now, two-thirds of adults are obese or overweight.
A National Strategy ToCombat ObesityINTRODUCTION
5S E C T I O N
ALTHOUGH THE GENERAL PUBLIC HAS BECOME INCREASINGLY AWARE OF THE
PERSONAL HEALTH CONSEQUENCES OF OBESITY, WHAT MAY NOT YET BE GENERALLY
APPARENT IS THE PUBLIC HEALTH NATURE OF THE OBESITY EPIDEMIC AND THE
CONSEQUENT NEED FOR POPULATION-BASED APPROACHES TO ADDRESS IT.317
— THE INSTITUTE OF MEDICINE (IOM)
“”
84
Change will not be easy. It is the role andresponsibility of government, businesses,and communities to help individuals dealwith the forces that are beyond their con-trol. In fact, communities across the coun-try have started taking action to try toaddress the crisis. Many states are improv-ing the quality of school lunches; some stateand local governments are increasing safeand clean parks; and farmers markets areopening in some low-income communities.But this is only a start.
For significant change to happen, combat-ing obesity must become a national priority.The country’s health and economic well-being require that we take action. Our lead-ers need to take the obesity problem seri-ously and make a real commitment to help-ing the country become healthier.
Over the past 8 years IOM, HHS and theSurgeon General’s Office have all issuedreports on the obesity epidemic in theUnited States.319,320,321,322 The reports haveset goals and objectives and included rec-ommendations for federal, state, and localgovernment, community groups, business-es, schools, families, and individuals tohelp meet them. Despite these high-levelcalls to action, there is little evidence ofany national framework to respond to theobesity epidemic.
TFAH calls on the country’s leaders to createa National Strategy to Combat Obesity . Thisneeds to be a comprehensive, realistic planthat involves every agency of the federal gov-ernment, state and local governments, busi-nesses, communities, schools, families, andindividuals. It must outline clear roles andresponsibilities and demand accountability.Our leaders should challenge the entirenation to take responsibility and do their partto help improve our nation’s health.
As a primary goal, the National St rategy toCombat O besit y should aim to reduce thechildhood obesity epidemic by 2015.
A turnaround will not happen overnight.The same way research has shown we cannot
realistically expect people to individuallylose significant amounts of weight in a shortperiod of time and sustain that weight loss,we must avoid approaching the nationalstrategy as if it were the policy equivalent ofa fad diet. This is about finding ways toimprove the health of the country for thelong term.
The good news is that even small changescan make a big impact.
� For individuals, a 5 to 10 percent reduc-tion in total weight can lead to positivehealth benefits, such as reducing the riskfor type 2 diabetes.323 Individual goalsshould focus on research-based solu-tions, which show health benefits fromincreasing physical activity and improv-ing the nutritional value of the foods weeat. Weight-loss goals should focus onrealistic, incremental changes and sup-port strategies for helping sustainlifestyle changes.
� An increase in physical activity, even with-out any accompanying weight loss, canmean significant health improvementsfor many individuals. A physically activelifestyle plays an important role in pre-venting many chronic diseases, includingcoronary heart disease, hypertension,and type 2 diabetes.324,325,326,327
� For the country, community efforts toreduce obesity and increase physical activ-ity can have a significant health and mon-etary return on investment.
A National St rategy to Combat O besit ymust include:
A. Federal government, involving presiden-tial and Congressional leadership, everyCabinet department, adequate funding,and clear performance measures.
B. State government.
C. Local government.
D. Community and faith-based organizations.
E. Schools.
85
F. Families and individuals.
G. Employers.
H. Insurers.
I. Food and beverage industries.
J. Agribusiness and farmers.
K. Health researchers and evaluators.
TFAH has also identified some special topics(Section L) that must receive increased atten-tion as part of a National Strategy, includingracial and ethnic disparities, rural childhoodobesity, and mental health, stress and obesity.
The components of the National St rategyto Combat O besit y are based on the evi-dence cited throughout this report.
TFAH calls upon the next president to makeobesity prevention and control a priority ofhis administration. Within the first 3 monthsof taking office, the president should con-vene a sub-cabinet working group to addressthe issue. In the past, health officials oftenhave been called on to develop solutions inisolation. There are many factors, however,that are beyond the ability of health officialsto influence by themselves. In addition, theramifications of the obesity crisis impact thenation’s economy and global standing. Anew model must address obesity across everysector of the government. The NationalStrategy for Pandemic Influenza Planningprovides a strong example for how this typeof effort can be undertaken. With leadershipand goals identified by health agencies andexperts, every cabinet agency has takencharge of developing and implementing poli-cies and programs in their jurisdiction thatall contribute to our nation’s preparednessfor a pandemic flu outbreak.
To help outline how different agenciesimpact obesity and why a federal govern-ment approach is necessary, TFAH hasconducted a review of federal governmentprograms and policies (See Appendix C:Overview of Federal Programs ThatImpact Obesity).
A Nat ional St rat egy t o Combat O bes it ywill work best with strong leadership fromthe president and Congress, goals andstrategies outlined by health experts, andcoordination of all of the differentCabinet agencies to leverage all of the gov-ernment’s resources. Therefore, the sub-cabinet working group will consult regu-larly with an Obesity Prevention AdvisoryBoard made up of representatives fromstate and local government, schools, com-munity and religious groups, business,including the food and beverage industryand farmers, insurance companies, andresearchers and scientists.
SUCCESS “MAY TAKE SEVERAL YEARS OR DECADES AND REQUIRE THE SUSTAINED
AND COORDINATED IMPLEMENTATION OF A COMPREHENSIVE AND INTEGRATED
SPECTRUM OF STRATEGIES AND ACTIONS TO PRODUCE THE NECESSARY CHANGE IN A
VARIETY OF OUTCOMES -- INCLUDING STRUCTURAL, INSTITUTIONAL, SYSTEMIC,
ENVIRONMENTAL, BEHAVIORAL, AND HEALTH OUTCOMES.328
— INSTITUTE OF MEDICINE (IOM)
“
”
GETTING STARTED
86
The federal government has the unique abilityto set priorities and bring together state andlocal governments, the private sector, and com-munities to work towards solutions. The feder-al government has the leadership position to beable to develop and set goals for implementinga National Strategy to Combat Obesity .
In addition, the federal government caninstitute policies and programs that giveAmericans the tools they need to make iteasier to engage in the recommendedlevels of physical activity and choosehealthy foods.
As the leader of the country, the president hasthe most important role to play in theNational Strategy to Combat Obesity .
� Acknowledge That Obesity is a NationalPriority
� The president must take responsibility forensuring the future health of the country.The president must lead the movement tomake the United States a country thatencourages and fosters healthy living bysupporting policies that remove the obsta-cles that get in the way of individuals mak-ing healthy choices.
� Ensure Sufficient Funding to Implementand Evaluate Obesity Policies
� If the U.S. is serious about reversing theobesity trend, the president and Congress
need to work together to put substantialresources behind the National Strategy toCombat Obesity . This requires an honestassessment from all federal governmentdepartments and agencies regarding theirresponsibilities under the plan and theresources they will need to fully implementand evaluate their programs. Fundingmust also come from state and local gov-ernments to address this shared responsi-bility. The funding must include an invest-ment to increase both scientific research todevelop effective, wide-scale public healthsolutions and to provide communities withthe capacities and resources needed tomake changes. The federal governmentneeds to make a serious national commit-ment to this public health crisis.
FIRST AND FOREMOST THE GOVERNMENT PROVIDES LEADERSHIP, WHICH IT
DEMONSTRATES BY MAKING THE RESPONSE TO THE OBESITY EPIDEMIC AN URGENT
PUBLIC HEALTH PRIORITY AND COORDINATING THE PUBLIC- AND
PRIVATE-SECTOR RESPONSE.329
JUST AS IT HAS DONE WITH AUTOMOBILE AND HIGHWAY SAFETY INITIATIVES,
EFFORTS TO CURB YOUTH SMOKING, AND CURRENT EFFORTS TO DEFEND AGAINST
POTENTIAL BIOTERRORIST THREATS, THE FEDERAL GOVERNMENT SHOULD SET FORTH
OBESITY PREVENTION AS A NATIONAL HEALTH PRIORITY - ONE THAT IS ACTED UPON
THROUGH EXTENSIVE AND SUSTAINED FUNDING AND A LONG-TERM COMMITMENT
OF RESOURCES.330
— INSTITUTE OF MEDICINE (IOM)
“
”
A. FEDERAL GOVERNMENT
1. Presidential and White House Leadership
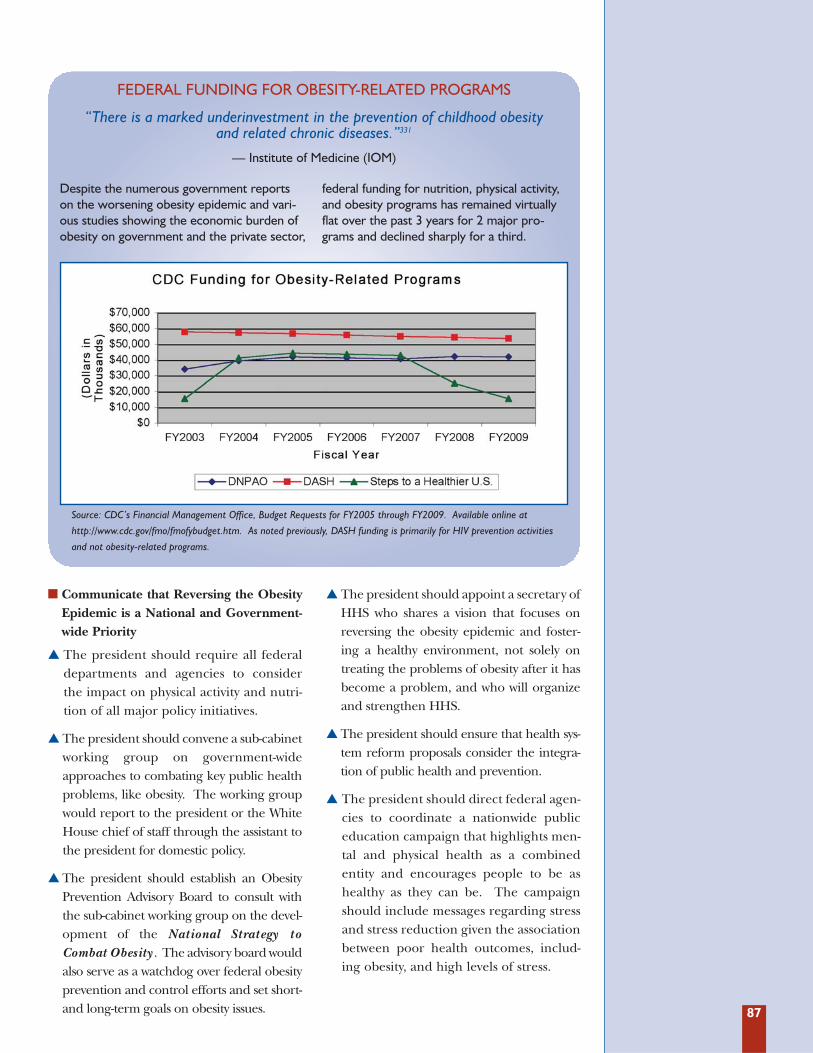
87
� Communicate that Reversing the ObesityEpidemic is a National and Government-wide Priority
� The president should require all federaldepartments and agencies to considerthe impact on physical activity and nutri-tion of all major policy initiatives.
� The president should convene a sub-cabinetworking group on government-wideapproaches to combating key public healthproblems, like obesity. The working groupwould report to the president or the WhiteHouse chief of staff through the assistant tothe president for domestic policy.
� The president should establish an ObesityPre vention Advisory Board to consult withthe sub-cabinet working group on the devel-opment of the National Strategy toCombat Obesity . The advisory board wouldalso serve as a watchdog over federal obesityprevention and control efforts and set short-and long-term goals on obesity issues.
� The president should appoint a secretary ofHHS who shares a vision that focuses onreversing the obesity epidemic and foster-ing a healthy environment, not solely ontreating the problems of obesity after it hasbecome a problem, and who will organizeand strengthen HHS.
� The president should ensure that health sys-tem reform proposals consider the integra-tion of public health and prevention.
� The president should direct federal agen-cies to coordinate a nationwide publiceducation campaign that highlights men-tal and physical health as a combinedentity and encourages people to be ashealthy as they can be. The campaignshould include messages regarding stressand stress reduction given the associationbetween poor health outcomes, includ-ing obesity, and high levels of stress.
“There is a marked underinvestment in the prevention of childhood obesityand related chronic diseases.”331
— Institute of Medicine (IOM)
Source: CDC’s Financial Management Office, Budget Requests for FY2005 through FY2009. Available online at
http://www.cdc.gov/fmo/fmofybudget.htm. As noted previously, DASH funding is primarily for HIV prevention activities
and not obesity-related programs.
Despite the numerous government reportson the worsening obesity epidemic and vari-ous studies showing the economic burden ofobesity on government and the private sector,
federal funding for nutrition, physical activity,and obesity programs has remained virtuallyflat over the past 3 years for 2 major pro-grams and declined sharply for a third.
FEDERAL FUNDING FOR OBESITY-RELATED PROGRAMS
88
Addressing obesity should not be viewed asthe sole responsibility of HHS. Instead, it issomething in which all federal agenciesshould participate. In fact, while HHSshoulders a large burden of the costs of obe-sity-related treatments and illness as borneby Medicare and Medicaid, the agency is justone of many federal agencies with an impor-tant role to play in the obesity fight.
Instead, much of the implementation of cur-rent obesity and physical activity initiativesoccurs in other cabinet departments, such asthe U.S. Departments of Agriculture,Education, Housing, Interior, andTransportation. (See Appendix C: Overview ofFederal Programs That Impact Obesity.)
HHS, however, plays an essential role in pro-viding technical and policy leadership onobesity as a health issue, and fundingresearch into effective interventions.
TFAH recommends the following actions toimprove cross-government collaboration:
� Federal Government Review
� With the president’s support and encour-agement, federal agencies should under-take a detailed review of their programs andbudgets and examine how they impactphysical activity, nutrition, and obesity.
Upon the completion of such a review, eachagency should propose ways it can partici-pate in and implement aspects of theNational Strategy to Combat Obesity .
� Designate High-Level Officials in EachDepartment to Address Obesity
� The president should order the designa-tion of an official in each cabinet depart-ment who focuses on obesity-related poli-cies. The official would work within eachdepartment to examine the implicationsof policies and activities -- from agricul-ture to transportation -- on obesity.
� Health Impact Assessments
� The president should require that feder-al departments and agencies evaluateand report on the health impact, particu-larly the impact on physical activity andnutrition, of new domestic policies, pro-grams, and annual budgets. ManyEuropean jurisdictions employ similarprocesses and several U.S. localities, suchas Seattle-King County in WashingtonState, Tri-County in Michigan, HennepinCounty in Minnesota, Riverside Countyand San Francisco in California, haverecently adopted this approach.
OBESITY PREVENTION IS A CROSS-CUTTING ISSUE THAT DOES NOT NATURALLY
FALL UNDER THE PURVIEW OF ANY ONE FEDERAL DEPARTMENT.332
— THE INSTITUTE OF MEDICINE (IOM)
“ ”
2. Obesity-Prevention as a Priority Across All Cabinet Departments
The U.S. Department of Housing and UrbanDevelopment’s (HUD’s) Moving toOpportunity (MTO) program provided thou-sands of poor adults and children an opportu-nity to use HUD vouchers to move out ofpublic housing in high poverty neighborhoodsto lower poverty neighborhoods. The 10-year demonstration project ran from 1992-2002. A HUD evaluation examined the
impact of the move on a number of variables,including obesity on the assumption that“moves to low-poverty neighborhoods mayreduce obesity through several mechanisms:lower incidence of depression and stress;behavioral changes (like exercise); and differ-ent social norms about eating habits.”333 Theevaluation found that obesity rates fell amongadults and children in the MTO program.334
THE IMPACT OF NEIGHBORHOODS ON OBESITY
89
� Worksite Wellness for Federal Employees
� The president should establish a pro-gram that can assist federal employees inachieving healthy lifestyles as well as fos-
ter public health awareness amongemployees. This approach will serve as animportant model for the private sector.
TFAH recommends the following federal-level actions to prevent and control obesity.The following recommendations should notbe seen as a comprehensive list of federalpolicy actions, but a starting point for gov-ernment action. At all times, federal poli-
cies should be viewed as setting a floor foraction to combat obesity and not a ceiling,meaning that state and local governmentsshould be empowered to take more dramat-ic action when possible.
A 1992 IOM report “Body Composition andPhysical Performance: Applications for theMilitary Services” noted that “obesity is associ-ated with being unfit and ‘un-soldierly.’”335
Military recruiters dismiss volunteers basedsolely on height and weight before enteringthe service on the presumption that they arenot physically fit enough to enlist, train, andserve. Perhaps unsurprisingly, the obesity epi-demic that is affecting the general U.S. popula-tion is also posing problems for the U.S. mili-tary. Among new military recruits the per-centage of overweight and obesity among 18-year old civilian applicants increased from 25.6percent in 1993 to 33.9 percent in 2006.336
The problem is not limited to new recruits.According to a U.S. military spokeswoman, 16percent of active duty personnel are obese.337
Some branches of the military are more affectedthan others. For instance, the U.S. Navy reportsthat 62 percent of its members are overweightand 17 percent are obese, while the U.S. AirForce reports that 55 percent of airmen areoverweight and nearly 12 percent are obese.338
Service members who exceed height-weightguidelines for their branch of the military are
often discharged. In fact, every yearbetween 3,000 and 5,000 enlisted membersare forced to leave the military for beingoverweight.339 A 1995 Defense Departmentstudy estimated the average cost of recruit-ing and training a replacement enlisted mem-ber to be $40,283, or $56,782 in 2008 infla-tion-adjusted dollars.340,341 This costs theDepartment of Defense between $170 mil-lion and $284 million a year and does notinclude additional obesity-related medicalexpenses. A separate 2007 study estimatedthat the U.S. military healthcare system, TRI-CARE, spends $1.1 billion annually to treatoverweight- and obesity-related diseases.342
To combat the growing obesity problemamong U.S. servicemen and women, each ofthe armed services has developed programsto promote fitness and health: the Army hasWeigh to Stay; the Navy and Marine Corpshave ShipShape; the Air Force has Fit toFight. These programs use nutrition and fit-ness counseling to move military personneland their families toward healthier foodchoices, exercise habits, and lifestyles.
OVERWEIGHT AND OBESITY IN THE MILITARY
90
Nutrition Policy� USDA should issue revised school nutri-
tion guidelines that ensure that Americanschoolchildren are consuming foods rec-ommended in the most recent DietaryGuidelines for Americans (DGAs).Although it has been 3 years since therelease of the 2005 DGAs, USDA has beenunable to develop new guidelines. If thecurrent timetable holds, new guidelinesare not expected until 2010 at the earliest.
Physical Education & Activity Policies� The U.S. Department of Education, in
collaboration with HHS and thePresident’s Council on Physical Fitness,should set national standards for physicaleducation and physical activity in schools.Given the growing body of evidence link-
ing physical activity with academic per-formance there is an added incentive tomandate physical activity.
� The administration and Congress shouldreview the Department of Education’s 21stCentury Community Learning Centers andconsider an expansion of their mission toinclude physical activity, health, nutritioncounseling, and nutrition activities.
� The administration and Congress shouldreview the Department of Education’s CarolM. White Physical Education Program, andconsider an expansion of the federal grantprogram so that more local educationalagencies and organizations can participateand work to initiate, expand, and improvephysical education programs for students.
3. Federal Government and Schools
� Be Model Employers
� Government agencies should set anexample for private businesses andorganizations by placing a priority onemployees’ health and assure compre-hensive benefits for obesity within theFederal Employee Health Benefit Plan.
� Incentivize the Private Sector to ProvideWellness Programs
� Federal, state, and local governmentsshould find ways to incentivize or encour-age employers to provide workplace
wellness programs and preventive care coverage to their employees.
� Update and Increase Obesity-RelatedCoverage
� Medicare, Medicaid, and SCHIP shouldupdate and increase obesity-related cover-age and reimbursement for preventiveservices (e.g. nutrition counseling andphysical activity programming) and set anexample for private insurers. (See Section 3:State Responsibilities and Policies for a detailedlegal analysis of current state insurance policies.)
4. Federal Government and Business
In an effort to get adults to be more active,the President’s Council on Physical Fitnessand Sports introduced the adult fitness test inMay of 2008. According to Melissa Johnson,the executive director of the council, “whatwe are trying to do is inspire and motivateAmericans to move their bodies more.”343
The test includes 3 basic components ofhealth: aerobic fitness, muscular strengthand flexibility. Each component contains a
test to assess overall health: a one-mile walkor 1.5-mile run to gauge cardiovascular fit-ness, one minute of half sit-ups and push-upsto failure to determine strength, and the sit-and-reach exercise to measure flexibility.344
Individuals are encouraged to visit the adult fit-ness test website at www.adultfitnesstest.orgto learn more about the test as well as recordresults and receive an evaluation.
THE PRESIDENT’S CHALLENGE ADULT FITNESS TEST
91
� Work with Industry to Limit Advertisingto Children
� The Federal Trade Commission (FTC),Department of Commerce, and HHSshould convene a national summit offood, beverage, and confectionery com-panies to discuss voluntary restrictions onmarketing and advertising of unhealthfulfoods to children and youth. Thesemeasures would apply to television andradio advertising and newer media,including internet, video gaming, DVDs,and other non-traditional means ofadvertising. If voluntary measures do notgo far enough, the federal governmentshould pursue regulatory action to limitadvertising and marketing as was donewith the tobacco manufacturers.
� The Department of Education should banall marketing and advertising of unhealthyfoods in schools. This includes:
• Advertising on Channel One, a newsand public affairs content provider tomany high schools and middle schools,
• Product sales, through vending machines,soft drink “pouring rights” agreements,branded fast food, and fundraisers;
• Indirect advertising, such as corporate-sponsored educational programs, sportssponsorships, and incentive programsusing contests and coupons.
� Work with Industry on Portion Size andLabeling
� FTC, the Food and Drug Administration(FDA), USDA, Department of Commerce,and other relevant federal agencies shouldwork with industry and retail outlets to devel-op clear and useful nutrition labeling and toensure that packaged foods and mealsreflect the recommended portion sizes.Retail food outlets in particular are routinelyselling meals that are 2 to 3 times larger thanwhat food labels list as a serving.345
� Require Retail Food Outlets to ProvideMenu Labeling
� FDA, USDA, Department of Commerce,and other relevant federal agenciesshould work with retail food outlets toprovide better and more readily accessi-ble information about the nutritionalcontent of their products. If voluntaryagreements do not work, regulatoryapproaches should be considered.
� Remove Barriers to Breastfeeding
� HHS should work with hospitals and healthcare providers and food industry represen-tatives to broker a voluntary agreement tohalt free infant formula distribution at hos-pitals to encourage breastfeeding. An eval-uation of the voluntary ban should guidefuture decisions to continue the voluntaryban, and perhaps, make it binding.
5. Federal Government and the Food and Beverage Industries
92
� Examine Subsidies for Growing Fruitsand Vegetables
� Congress and the administration shouldevaluate farm policy and eliminate barri-ers to the domestic production of fruitsand vegetables. A major barrier to theirproduction is the government subsidiesfor corn, wheat, soybeans, rice, and cot-ton which range from $10 billion to $25billion a year.
� Support Small Farmers and Local FoodSystems
� USDA should support farmers markets,farm-to-school, urban gardens, and otherprograms that bring fresh, locally grownfood into communities, especially thosethat are underserved by major grocerystores. By providing consumers withgreater choice the government can helpcreate demand for locally grown freshproduce and incentivize the return ofsmall farms to this market.
� Incentivize Healthy Food Consumption
� According to USDA’s Economic ResearchService the cost of fresh fruit and vegeta-bles rose 40 percent between 1985 and2000, while the cost of high-fructose corn
syrup and vegetable oils declined. USDAshould study the factors behind this dis-crepancy and offer policy solutions tomake it economically viable forAmericans to buy fresh produce. Policysolutions include the following:
• Funding and technical advice for city res-idents interested in planting and tendingurban fruit and vegetable gardens.
• Financial and logistical support forfarmers markets.
• Re-directing commodities subsidies tofruit and vegetable growers.
� Revise School and GovernmentProcurement Policies
� USDA should reexamine its child nutri-tion programs and ensure that theyencourage the consumption of healthyfoods, including the recommended dailyamount of fruits, vegetables, and wholegrains. By setting higher nutritional stan-dards, or expanding food assistance pack-ages to include more produce (as wasdone with WIC), USDA can increase thedemand for fresh fruits and vegetablesand ensure a market for farmers who produce these goods.
6. Federal Government and Agriculture
� Strengthen Primary Data CollectionSystems
� Researchers and public health practition-ers need better data. A strong nationalsurveillance system is crucial to assessAmericans’ health. The federal govern-ment must renew and deepen its invest-ment in the National Center for HealthStatistics, specifically in the NationalHealth and Nutrition ExaminationSurvey (NHANES), the National Surveyon Children’s Health, the Behavior RiskFactor Surveillance System, and others.
� Researchers need better data on chil-dren, particularly children in the 5 to 14-years age group. They need to know what
is going on in their environments. As the2007 IOM report on childhood obesitynotes, “surveillance is particularly lackingregarding the environmental and institu-tional changes that are being implement-ed with the goal of promoting healthfuleating and regular physical activity.”346
� Fund Community-Level Research andEvaluation
� According to the IOM report “Progress inPreventing Childhood Obesity”, “the gapbetween the opportunity for evaluationsand the capacity to conduct evaluations atthe local level appears to be a significantimpediment to the identification andwidespread adoption of effective child-
7. Federal Government and Research
93
hood obesity prevention programs.”347 Toaddress the lack of local-level programevaluation, TFAH echoes IOM’s recom-mendations, which include the following:
• Local program managers should receivefunding specifically to carry out pro-gram evaluations in partnership withcolleges, universities, or other commu-nity groups with expertise.
• Government agencies and researchinstitutions should offer technical assis-tance to local community groups.
• Government agencies and local govern-ment/community groups should com-municate frequently about on-the-ground success stories.
In the campaign to stop and prevent obesity,the role of the state government is similar inmany ways to the role of the federal govern-ment. States should provide top-level leader-ship on this issue and devote more resources-- both financial and manpower -- towardscombating the problem. States, however, arecloser to the action on the ground and candirect focused efforts towards the problem.
Development of the National St rategy toCombat O besit y should occur with stateand local input, reflecting the sharedresponsibility of all jurisdictions for thehealth of Americans. In parallel with thedevelopment of the national strategy, statesshould:
� Develop State-Specific Obesity Plans
� Using best practices put forth by CDC andbased on the most up-to-date scientific evi-dence, states should develop their ownplans to combat obesity using policy andenvironmental changes. These state-levelplans should be tailored to meet individualstates’ needs and use culturally competentstrategies to engage various communitieswithin the state. These plans should:involve multiple state agencies; assign spe-cific roles and responsibilities to state agen-cies; contain clear and measurable objec-
tives, including objectives that are related toreducing obesity rates; link state funding toobjectives; include private sector and com-munity groups; contain provisions for ahealthier state workforce; and incorporatea system for evaluation and review. (SeeSection 3: State Responsibilities and Policies for adiscussion of current state obesity plans.)
� Evaluate Their Roles and DelegateResponsibilities Among State Agencies
� Similar to the federal review and with thesupport of each state’s governor, stateagencies should undertake a review oftheir programs and examine how theyimpact physical activity, nutrition, and obe-sity. Upon the completion of such a review,each agency should propose ways they canparticipate in and implement aspects oftheir state’s strategic obesity plan.
� Dedicate State Revenues to Implementingthe National Strategy to Combat Obesity
� The National Strategy to Combat Obesitywill also require states to contribute to fund-ing obesity prevention efforts. Federal andstate governments should undertake anassessment to determine how much eachstate should be required to contribute inorder to qualify for federal funds. Different
B. STATE GOVERNMENT
OF COURSE, PERSONAL RESPONSIBILITY IS A CRUCIAL PART OF ANY SOLUTION,
BUT GOVERNMENT AND GOVERNORS ALSO HAVE AN IMPORTANT ROLE.348
— NATIONAL GOVERNORS ASSOCIATION (NGA)
“ ”
94
states have different needs. Some stateshave a higher burden of obesity and obesi-ty-related diseases, and therefore, a higherlevel of investment may be needed toachieve goals for improving the health ofpeople in those states. An investment bystates will also show a commitment by thestate government to improving health. Asthe 2007 IOM report on childhood obesitynoted, “the overall capacity to address child-hood obesity is not enhanced when increas-es in federal funding are responded to bydecreases at the state level. A sustainedeffort that includes adequate planning andcooperation is needed among governmen-tal agencies and departments and otherstakeholder groups at these levels to effec-tively work together.”349
� State Government Employee WellnessEfforts
� State and local governments are employersas well as providers of governance and pub-lic service. Many governors have beguninitiatives to provide workplace wellnessand preventive health care services, includ-ing: premium discounts, subsidies for fitness clubs and activities, disease manage-ment programs, and information to stateemployees, such as nutrition, physical activity, and obesity counseling. All statesshould offer these programs and shouldalso provide these models to private businesses to expand these opportunitiesto private employees as well.
� State and local government should alsoassure that their state employee healthinsurance plans cover appropriate obesi-ty-related services.
� Update and Increase Obesity-RelatedCoverage
� State Medicaid and SCHIP programsshould update and increase obesity-relat-ed coverage and reimbursement for pre-ventive services (e.g. nutrition counselingand physical activity programming) andset an example for private insurers.
� States should also assess their insuranceregulations to assure equitable access tohealth insurance for those who are obeseor overweight and to assure adequate cov-erage for treatment and services directlyrelated to obesity. (See Section 3: StateResponsibilities and Policies for a detailed legalanalysis of current state insurance policies.)
� Leverage Power as Food Purchaser
� The state public sector purchases foodacross a range of institutions, including ingovernment cafeterias, schools, and prisons.The government should leverage its poweras a food purchaser to require a greateremphasis on nutritional value as a priority inthe bidding process for these contracts.
� Create Healthy Schools
� The state departments of health and edu-cation should work together to implementa coordinated school health program tocreate a healthy school environment.
� Evaluate Current Snack Tax and LiabilityLimitation Policies
� States should devote time and resourcesto developing evaluation standards tomonitor the effectiveness of both types ofcontroversial initiatives.
The National Governor’s Association (NGA)has made obesity prevention a priority since2002 even establishing a bi-partisan taskforce ofgovernors to provide leadership on this issue.NGA focuses on promoting a culture of well-ness to improve Americans’ health and thusincrease our global competitiveness and lowerhealth care costs. NGA’s report CreatingHealthy States: Actions for Governors encour-
ages governors to focus their efforts in 3 areas:communities, worksites, and schools.350
The report highlights best practices from var-ious states around the nation in order to fos-ter the exchange of ideas and success storiesamong governors and state officials. By high-lighting what works, NGA hopes to encour-age more state action to promote wellness.
THE NATIONAL GOVERNOR’S ASSOCIATION HEALTHY STATES PROGRAM
95
Local government and community groupsoften have the strongest direct impact on peo-ple’s health, and the National Strategy toCombat Obesity must rely on these groups toimplement programs and make positivechanges to the built environment. This willrequire strong leadership from local healthofficials and the ability of these officials tocommunicate the importance of physicalactivity and nutrition to their communities.
Experts should evaluate how local govern-ments can or should help fund wellness, obe-sity, and physical activity programs. For manylocal programs, relying on the local propertytax base, for instance, can lead to exacerbat-ing pre-existing disparities among neighbor-hoods. As with many social issues, the lowest-income areas are the hardest hit by obesityand obesity-related health problems.
Local government can act -- and act decisive-ly -- in the area of the built environment and
retail food regulations. The environmentthat surrounds people has a large effect onindividual choices, including the following:
� A 2003 study found that suburban sprawl islinked to health. Not only are people inmore sprawling communities likely to have ahigher BMI, but they are also at increasedrisk of suffering from hypertension or highblood pressure. Based on the findings of thestudy, people in the most sprawling areas arelikely to weigh 6 pounds more than those inthe most compact communities.352
� A 2008 study found that people who livenear an abundance of fast food restaurantsand convenience stores are significantlymore likely to suffer from obesity and dia-betes when compared to people livingnear grocery stores and famers’ markets.353
Americans are interested in and support theidea of healthy communities. One study
The Healthy Kids, Healthy America programawards states funding for childhood obesityprevention programs and statewide scans, orreviews, of existing efforts. As of April 2008,15 states have been awarded up to $110,000to fund their childhood obesity preventionprograms. Of that sum, up to $100,000 can beused to fund proposals to prevent childhoodobesity through environmental and policy
change, and up to $10,000 can be used toconduct a statewide scan of current effortswithin their state to prevent childhood obesity.
The 2008 recipients are: Indiana, Kentucky,Louisiana, Michigan, Minnesota, Mississippi,New Mexico, New York, Rhode Island,South Dakota, Tennessee, Utah, Virginia,West Virginia, and Wisconsin.
NGA’S HEALTHY KIDS, HEALTHY AMERICA INITIATIVE
LOCAL GOVERNMENT PLAYS A COMPLEMENTARY ROLE TO STATE AND FEDERAL
OBESITY PREVENTION EFFORTS. IN PARTICULAR, LOCAL PUBLIC HEALTH DEPARTMENTS
ARE INVOLVED IN PROVIDING LEADERSHIP FOR THE HORIZONTAL INTEGRATION OF
INTERVENTIONS, COMMUNICATIONS, AND FUNDING REQUIREMENTS, AS WELL AS
DEVELOPING ADEQUATE INFRASTRUCTURE FOR POLICIES AND PROGRAMS TO BE
IMPLEMENTED AND EVALUATED AT LOCAL LEVELS.351
— INSTITUTE OF MEDICINE (IOM)
“
”
C. LOCAL GOVERNMENT
96
found that 90 percent of U.S. adults supportusing local government funds for walking andjogging trails, recreation centers, and bicyclepaths.354 Another study reported that 55 per-cent of Americans would like to walk moreand drive less, and 52 percent would like tobicycle more.355 It appears that the demand isthere for communities to invest in buildingbike paths and walking and running trails.
Local government plays a key role in chang-ing the built environment so that it fostershealthy eating and healthy lifestyles. Fromissues related to zoning and public trans-portation, to funding for community-basedprograms, local officials lead the way.
As part of the National St rategy to CombatO besit y , local governments should:
� Provide Improved Access to HealthyFoods in Low-Income Areas
� Healthy food access is a demonstratedproblem in many low-income communi-ties. Communities should encourage thedevelopment of and provide public spacefor locally-operated produce markets andfarmers’ markets. Also, through the use ofincentives, communities should encouragesupermarkets and food shopping vendorsto locate in lower-income neighborhoodsand offer healthier food alternatives.
� Use Zoning Laws to Change FoodEnvironment
� Zoning laws can be used to encouragehealthy food providers to locate to under-served neighborhoods; local governmentcan also implement zoning laws to limitfast-food restaurants or keep a certainratio of fast food restaurants to grocersand farmers’ markets.
� Encourage “Mixed Use” Areas
� Communities and states should examineand update zoning and land-use laws toallow for more “mixed use” commercialand residential communities, so peoplecan have more opportunities to walk orbike to retail centers and to work.
� Examine Health Impact of New Building
� Communities should require “HealthImpact Assessments” for proposed land-useand building projects, which will help com-munities and policy makers understandthe possible resulting changes to people’shealth, including access to recreationalspace and to food shopping. These can bebased on the “Environmental ImpactAssessment” model.
� Building Design Codes
� Encourage new building design that is stair-friendly and offers other spaces that facilitateactivity in commercial and public buildings.
� Encourage Greenspace Developmentand Build More Sidewalks
� Prioritize and incentivize increasedgreenspace development through thecollaboration of public health and trans-portation entities in states. Communitiesshould also place greater emphasis onbuilding well-lit sidewalks and paths, par-ticularly in new developments andaround highways, to make it possible forpeople to walk safely.
� Encourage Transportation Fund Use forMass Transit and Alternatives to Highways
� Communities should insist that states andcounties require alternative proposals beexamined when new highway initiatives areproposed. New development should alsobe required to include pedestrian-friendlycomponents, such as sidewalks, whichencourage interconnectivity of communi-ties and opportunities for activity. Stateand federal transportation dollars shouldbe considered for mass transit, sidewalk,and mixed use opportunities rather thanbe focused on highway construction.
� Modernize New School-Site ConstructionRequirements
� Local governments should review andupdate old acreage requirements for newschool construction that required largespaces for construction, but have endedup resulting in the building of schools in
97
remote locations that students can oftenonly access by bus rather than by walkingor biking. Flexible standards for schoolsite construction would allow communi-ties to build schools closer to existinghomes and commercial regions insteadof in remote areas.
� Revitalize Walk-able Neighborhoods
� Many cities and towns have downtownareas that were at one time vibrant eco-nomic centers, but have since lost eco-
nomic investment. Many of these centershave the necessary attributes to makethem walk-able and bike-able communi-ties. Local governments should invest inrevitalizing old downtowns and occupy-ing vacant buildings and lots.
� Require Menu Labeling
� Local governments should require restau-rants to provide consumers with nutritioninformation on in-store menus and menuboards for the most popular items.
In 2008, the Los Angeles County Departmentof Public Health conducted a health impactassessment of menu labeling. County healthofficials were interested in determining theeffect of menu labeling on the obesity epi-demic. Researchers used the conservativeassumption that nutrition labeling wouldresult in 10 percent of chain restaurant cus-tomers ordering reduced calorie meals, with
an average reduction of 100 calories permeal, no increase in other food consumption,and no increase in physical activity. Based onthis assumption the researchers found thatmenu labeling would prevent nearly 40 per-cent of the estimated 6.75 million poundsthat Los Angeles County residents age 5 andolder gain in weight each year.356
HEALTH IMPACT ASSESSMENT OF MENU LABELING
New York, NY -- In January 2008, NewYork City’s Board of Health issued a regula-tion requiring all restaurants that operate atleast 15 separate outlets to post caloriecounts on their menus and menu boards.The new regulation will affect about 10 per-cent of all New York City restaurants.357
New York City had passed similar legislationin 2006 but a U.S. district judge rejected themeasure on grounds that it violated federalfood-labeling laws. Although the StateRestaurant Association continues to chal-lenge the regulation in court, on May 5,2008 the City Health Department startedissuing citations to chain restaurants thatwere not in compliance. Fines will not beassessed until July.358 Similar legislation hasbeen enacted in San Francisco andSeattle/King County, Washington, and isunder consideration by 21 other state andlocal governments.359
Seattle, WA -- Active Seattle, a partnershipunder Active Living by Design, is one ofmany cities seeking to create walk-ableneighborhoods.360 Seattle chose 5 communi-ties to implement the design. Some pro-gram accomplishments include:
� Implementation of a Safe Routes toSchool program at 2 elementary schools.
� Completion of 10 walking audits in proj-ect area neighborhoods as part of theassessment process.
� Generation of over $494,000 in grants andcontributions for Safe Routes to Schools.
� Advocating successfully for $875,000 inspending for sidewalks and stairways inthe mayor’s budget, and generated anaddition $1.8 million supplemental fundingfor sidewalks and crossings.
EXAMPLES OF LOCAL GOVERNMENT OBESITY-RELATED POLICY FIXES
98
Residents in low-income and minority neigh-borhoods are less likely to have access tofresh fruits and vegetables than people wholive in higher-income and predominantlywhite neighborhoods.361 Large supermar-kets, which have a better selection of freshproduce and other healthy foods, such aswhole grains and lean proteins, tend to bemissing from low-income and minority com-munities across the United States.
According to The Food Trust, a Philadelphia-based organization whose mission is toensure that everyone has access to afford-able, nutritious food, the so-called “‘grocerygap’ existing today in many urban areasresulted from the confluence of complexsocial, economic and public policy factors.”362
When middle class whites left big cities inthe 1960’s and 1970’s for the suburbs, thelarge supermarkets often followed, attractedby larger, less expensive commercial tractsof land, business-friendly zoning, and lesscrime.363 In the place of supermarkets, low-income and minority neighborhoods haveseen an influx of small grocers, conveniencestores and fast food restaurants.364 Theseretail food outlets are less likely to sell freshproduce and other healthy food options.
Researchers suggest the lack of healthy freshfoods coupled with the glut of unhealthyfood choices contributes to the high rates ofobesity, diabetes, hypertension, and cardio-vascular disease among low-income andminority populations.365 To counter thesenegative effects, a number of organizations,such as the Food Trust, are working withlocal officials to increase consumers’ accessto fresh produce and healthier food options.
Pennsylvania -- The Philadelphia-basedFood Trust was instrumental in launching thePennsylvania Fresh Food Financing Initiative(FFFI), a first of its kind program in theUnited States that uses state and privatefunds to bring supermarkets carrying a vari-ety of healthy food into underserved low-income, minority neighborhoods in anattempt to improve eating habits and overallhealth. As of January 2008, the FFFI hadcommitted $38.9 million in grants and loansto 50 stores across the state, ranging in size
from 900 to 69,000 square feet. These proj-ects are expected to bring 3,723 jobs and1.2 million square feet of fresh food retail tocommunities across Pennsylvania.366
New York, NY -- New York City has lostone-third of its supermarkets over the past6 years severely limiting lower-income resi-dents’ access to fresh, healthy foods.367 Inearly 2008, the City Council voted in favorof a measure designed to increase the num-ber of fruit and vegetable carts in under-served neighborhoods.368 The measure willput up to 1,000 produce vendors on thestreets in 43 different police precincts. Thebill was opposed by members of a smallergrocers’ association on the grounds thatthese push cart vendors would take businessaway from them while not actually increas-ing demand. City officials justified the meas-ure by citing a 2006 New York City healthdepartment survey that found that just 20percent to 40 percent of smaller grocers, orbodegas, carried apples, oranges andbananas, while fewer than 6 percent stockedleafy green vegetables.
New Orleans, LA -- In 2007, the NewOrleans Food Policy Advisory Committeepublished a 24-page report detailing the chal-lenges faced by many residents of southernLouisiana after Hurricanes Katrina and Rita.According to the report, the storms drasti-cally reduced the number of food retailersserving the public at a time when there wasalready a deficit of these outlets.369
Currently, there are only 15 supermarkets inNew Orleans, a city where public trans-portation is still unreliable and one-quarter ofresidents don’t have cars.370 The Committeemade a number of recommendations for cityand state officials to remedy the problem,including the provision of grants and loans tosmall grocers and supermarkets. Largesupermarkets, however, are wary of openingshop in New Orleans due in part to the dev-astation wrought by the 2005 hurricanes andthe lack of a local distribution network.According to one supermarket manager, it isa 14-hour round trip to his nearest distribu-tor; few supermarkets are willing to paythose kinds of transportation costs.371
THE GROCERY GAP
99
Although prevailing U.S. public opinion isthat obesity is an individual’s problem, thereality of the epidemic is that it is often acommunity’s problem. Communities areaffected when there are no easily accessiblegrocery stores nearby. Communities areaffected when crime and violence preventchildren, youth, and adults from engagingin outdoor physical activities.Communities are affected when unemploy-ment rates are high and access to healthcare is limited. Thus, community-basedand faith-based organizations have animportant role to play in the Nat ionalSt rat egy t o Combat O bes it y .
Community and faith-based organizationscan also help public health and local gov-ernment officials tailor messages to theirmembers, particularly when interventionsare needed to address disparities in obesityand physical activity among racial and eth-nic groups.
As part of the National St rategy to CombatO besit y , community and faith-based organ-izations should:
� Incorporate Obesity PreventionMessages into Events
� Community and faith-based groupsshould reach out to their members usingculturally-competent messages promot-ing healthy nutrition and physical activity.
� Provide Opportunities for Safe andSupervised Activity for Children
� Community and faith-based groups shoulddevelop and support organizations andfacilities that allow children to participatein safe physical activity programs.
� Provide No- or Low-Cost Physical ActivityOpportunities and Nutrition Counseling
� Community and faith-based groupsshould support no- and low-cost venuesfor children and adults to participate inphysical activity. They can do so by main-taining parks and recreation centers andoffering the use of their own facilities toother community groups that provide no-or low-cost physical activity programs.
� Offer Healthy Food at Community Events
� Community and faith-based groupsshould provide nutritious food at eventsto help people foster and maintainhealthy eating habits.
BY STEPPING OUTSIDE THE TRADITIONAL VIEW OF OBESITY AS A MEDICAL
PROBLEM, WE MAY MORE FUNDAMENTALLY FOCUS ON THE MANY INSTITUTIONS,
ORGANIZATIONS, AND GROUPS IN A COMMUNITY THAT HAVE SIGNIFICANT ROLES TO
PLAY IN MAKING THE LOCAL ENVIRONMENT MORE CONDUCIVE TO HEALTHFUL
EATING AND PHYSICAL ACTIVITY.372
-- THE INSTITUTE OF MEDICINE
“
”
D. COMMUNITY AND FAITH-BASED ORGANIZATIONS
100
Children spend a significant amount oftime in school and consume one-fifth toone-half of their meals there.375 Teachersand school administrators should use thistime to instill healthy habits in children tocounter the unhealthy messages childrenreceive outside of school. As researchersfrom Yale University and New YorkUniversity have noted:
The default conditions for children promoteunhealthy eating and physical inactivity.
Factors such as large portions, high consumptionof soft drinks and high-calorie fast foods, lowcosts for high-calorie foods and higher costs forfruits and vegetables, limited access to healthyfoods for the poor, and massive marketing cam-paigns targeting children are linked to poor diet,high risk for excess weight gain, and in somecases diseases such as diabetes.376
It is therefore fundamental for schools toincorporate strategies to improve the quali-ty of nutrition and physical activity they pro-
Community and faith-based organizationsare instrumental in implementing successfulinterventions. Different racial and ethnicgroups do not all have the same experiencesand priorities, and public health officials musttake these divergent backgrounds intoaccount when creating interventions inorder to achieve the health goals.
Project Dulce - San Diego, CaliforniaProject Dulce is a program based in SanDiego County that provides outreach, edu-cation, screening, diagnosis, and clinical careto patients with both type 1 and type 2 dia-betes. The program is aimed at low-income, underinsured or uninsured Latinoadults. Project Dulce works because it tar-gets the barriers that affect this population --specifically the language barrier betweenpatient and physician. The program involvesmedical assistants who are bilingual, and fea-tures bilingual health education courses.Project Dulce also trains community healthworkers, or promotoras de salud, to raiseawareness about diabetes among the low-
income, Spanish-speaking population.Incorporating this bilingual aspect into theprogram increases the comprehension andcomfort of participants, thereby improvingthe health of participants.
PATHWAYS - Arizona, New Mexico,and South DakotaPATHWAYS is a program for students ingrades 3-5 at schools in Native Americancommunities that promotes healthy eatingand increased physical activity. The PATH-WAYS program involves Native Americanleaders in the planning process in order toengage their communities and earn theirtrust, while also developing culturally-acceptable interventions. Classroom materi-als for the children include stories and activi-ties based on fictional Native American chil-dren. Although the program did not yieldany statistically significant reductions in stu-dents’ percentage of body fat, it did affecttheir knowledge, attitudes, and behaviorregarding healthy eating and physical activity.
EXAMPLES OF SUCCESSFUL CULTURALLY- APPROPRIATE INTERVENTIONS
Source: The Partnership to Fight Chronic Disease. 373
E. SCHOOLS
SCHOOLS CAN PLAY AN IMPORTANT PART IN A NATIONAL EFFORT TO PREVENT
CHILDHOOD OBESITY. MORE THAN 95 PERCENT OF AMERICAN YOUTH AGED 5 TO 17 ARE
ENROLLED IN SCHOOL, AND NO OTHER INSTITUTION HAS AS MUCH CONTINUOUS AND
INTENSIVE CONTACT WITH CHILDREN DURING THEIR FIRST 2 DECADES OF LIFE.374
— MARY STORY, DIRECTOR OF THE ROBERT WOOD JOHNSON FOUNDATION’S HEALTHY EATING
RESEARCH PROGRAM.
“”
101
vide for students. In order for schools to getstudents to be “as fit as they can be,” theymust: offer healthy food options, increasethe amount of daily physical activity
required, and limit and/or improve thenutritional value of “competitive” foods.
As part of the National St rategy to CombatO besit y , schools should:
� Adopt Higher Nutrition Standards ThanUSDA
� Some states have taken the lead in settingrequirements that are higher thanUSDA’s minimum requirements for foodserved in school. Instead of focusing ondelivering minimum nutrition standards,schools and school districts should con-centrate on setting high nutrition stan-dards for the foods served to studentsthat allow them to eat for better health.These standards should be extended tocover “competitive” foods as well as thosesold during the regular meal program.
� Ban Sugar Sweetened Drinks
� Schools should enact the guidelines setforth in the 2007 IOM report “NutritionStandards for Foods in Schools: Leadingthe Way toward Healthier Youth” and onlyoffer so-called “Tier 1” beverages for saleduring school hours. Tier 1 beveragesinclude water without flavoring, additivesor carbonation; one percent and non-fatmilk; and 100 percent fruit juice. Highschools may choose to allow the sale of“Tier 2” beverages which are defined asnon-caffeinated, non-fortified beverageswith less than 5 calories per portion.
� Provide Free Drinking Water
� Make sure students have access to free,clean drinking water in the cafeteria andgym to encourage water consumption inthe place of sugary drinks.
� Revise Food Contract Policies andPriorities to Focus on Maximum Nutrition
� Contracts for school food suppliers andproviders should be reviewed to focus oncompeting to provide maximum nutri-tion standards to students.
� Evaluate Alternative Fundraising Optionsthat Do Not Involve Providing Food ofMinimum Nutrition Value to Students
� Currently many schools, school districts,and after-school activities rely on revenuefrom vending machines and other foodsales. Jurisdictions should conduct cost-ben-efit analyses of these funds, factoring in theimpact and cost to children’s health.Communities must be better informed thatwhile revenue from “competitive foods” mayseem like an effective fundraising mecha-nism, it also directly results in a reduction offederal funds to the school lunch program.Communities should prioritize findingother revenue streams to support programsor offer more healthful items for sale.
� Provide Professional Development toSchool Food-Services Staff
� Require those who manage school nutri-tion programs to have appropriate aca-demic preparation and certification; and,ensure that those who manage schoolnutrition programs receive regular pro-fessional development on key nutritionprogram topics and strategies.
School Nutrition Recommendations
School Health Screening Recommendations
� Evaluate and Refine BMI Initiatives
� School BMI screening programs should beevaluated for effectiveness for reducingand controlling obesity. Schools in whichBMI data is collected should establish
clear and consistent evaluation standardsto ensure that its intended outcomes andany potential unintended consequencescan be measured and monitored.
102
� BMI measurement programs should becoordinated with a safe and supportiveschool environment for students of allbody sizes and a comprehensive set of sci-ence-based strategies to promote physicalactivity and healthy eating.377
� BMI measurement programs should adhereto safeguards, as detailed by CDC’s Divisionof Adolescent and School Health to reducethe risk of potentially harming students.378
These safeguards include the following:
• Introduce the program to school staffand community members and obtainparental consent.
• Train staff in administering the program(ideally, implementation will be led by a
highly qualified staff member, such asthe school nurse).
• Establish safeguards to protect studentprivacy.
• Obtain and use accurate equipment.
• Accurately calculate and interpret the data.
• Develop efficient data collection procedures.
• Avoid using BMI results to evaluate student or teacher performance.
• Ensure parents receive a clear and respect-ful explanation of the BMI screeningresults and appropriate follow-up actions.
• Resources are available for safe andeffective follow-up.
Physical Activity Recommendations for Schools
� Ensure Physical Activity Is a Part ofStudents’ Daily Lives
� All K-12 students should receive dailyphysical education. School officialsshould eliminate barriers to physical edu-cation, such as the lack of quality teach-ers, insufficient time, and lack of profes-sional development for P.E. teachers.
� Schools should require and P.E. teachersshould be trained to not only increase theamount of time students spend in physicaleducation classes but ensure that enoughtime is actually being spent in moderate-to-vigorous physical activity during P.E. class.
� Schools should provide other physicalactivity throughout the school day thatreinforces what is taught in physical edu-cation, and provide students the oppor-tunity to apply skills and conceptslearned in P.E. Other physical activityopportunities include after-school physi-cal activity clubs, walk-to-school pro-grams, classroom breaks, and recess.
� Make It Easier for Students to ActivelyCommute to School
� Schools and communities should ensurethat their built environments enable stu-dents to walk or bike to school. By work-
ing with city or county planning and trans-portation officials, schools can establishsafe routes to schools by establishing ormaintaining well-marked crosswalks andsidewalks and securing adequate numbersof crossing guards around the school. Theneed for physical activity should be incor-porated into all planning for building newschools or remodeling existing schools.
� Establish Joint Use Agreements withCommunity and Faith-Based Organizations
� Schools should encourage activity through-out the day and ensure that facilities andspace for students provide options for phys-ical activity before and after school as wellas between classes. Joint use agreementsthat include liability protection for bothschool districts and community and faith-based groups are one way to encouragethese groups to run before- and/or after-school programs for children and adoles-cents in un-used school space.
� Improve Nutrition and Health-Promotion Education
� Greater efforts should be made to edu-cate students about ways to maintaingood nutrition and exercise regimensand how this impacts their health.
103
Personal responsibility is a major factor in obe-sity. Individuals choose between the ham-burger and French fries or the turkey burgerand side salad. Parents choose to buy low-sugar cereals instead of the high-sugar optionsadvertised on the television. Families decideto take a bike ride together instead of sitting athome watching television. Although govern-ment is limited in what it can do to model in-home behaviors, IOM notes that “parents andfamilies can respond to policy changes and ini-tiatives implemented in other settings.”380 Forexample, if communities improve bike trailsor add lighting to walking paths, parents andchildren can engage in more physical activityin a safer environment. In addition, publiceducation campaigns by federal, state, andlocal governments, which are sometimesundertaken in partnership with private sectorpartners, help provide people with informa-tion to help them with the choices they make.
As part of the National St rategy to CombatO besit y , families and individuals should:
� Factor Health Concerns into TheirEating and Exercise Choices
� Research has found that even small changesin diet and physical activity can yield bigresults toward reducing people’s risk forhealth problems, ranging from diabetes toheart disease. Everyone should regularlyengage in some form of physical activity.
Individuals should also adapt eating patternstoward healthier selections and limit theirintake of foods with minimal nutritionalvalue. People should also learn about andtake advantage of resources designed to helpthem stay healthy. If they are unsatisfied withthe support they receive, they should maketheir opinions known to their local, state,and federal government officials.
� Be Concerned about Obesity and Inactivityas Health Risks to Their Family Members
� By encouraging family members to makehealthy choices, people may help decreasethe number of health problems their lovedones face. Particularly, by helping childrenstay active and maintain nutritious eatinghabits, families may help them avoid poten-tial life-long diseases. Families also haveleverage as consumers. They should direct-ly communicate with the food, beverage,and marketing industries and use their pur-chasing power to encourage product devel-opment and offerings that match the inter-est they may have for alternative choices.
� Encourage Mothers to Breastfeed TheirInfants and Toddlers
� Research has found that breast-fed infantsgain less weight and stay leaner than theirformula-fed counterparts, as well as show-ing lower rates of chronic diseases.
F. FAMILIES AND INDIVIDUALS
FAMILIES IN THE UNITED STATES CURRENTLY FACE MANY POTENTIAL OPPORTUNITIES
AND CHALLENGES THAT INFLUENCE THE EFFORTS OF HOUSEHOLD MEMBERS TO ENGAGE
IN HEALTHY BEHAVIORS. THE CHALLENGES INCLUDE THE STRESSES AND PRESSURES OF
DAILY LIVING, ALONG WITH ECONOMIC AND TIME CONSTRAINTS THAT MAKE HEALTHFUL
EATING AND DAILY PHYSICAL ACTIVITY DIFFICULT FOR MANY FAMILIES TO ACHIEVE.379
— INSTITUTE OF MEDICINE (IOM)
“
”
104
The National St rategy to Combat O besit yshould call for government and private sec-tor employers to make certain that everyworking American has access to a workplacewellness program.
Sixty-six percent of the U.S. workforce pop-ulation is overweight.382 The economic con-sequences of this are reflected in lost work-er productivity and higher health insurancepremiums.
The negative health consequences of inac-tivity and poor nutrition are leading to a lessproductive U.S. workforce and exponential-ly driving up health care costs. It is in theeconomic interest of every employer andthe nation as a whole to put a greateremphasis on keeping the workforce healthyand providing preventive care.
Employers have the ability to influence theiremployees through nutrition and fitness pro-grams, contests, and incentives. A healthyworkforce equals a more productive work-force, where both employers and employeescan benefit from improved health.
As part of the National St rategy to CombatO besit y , employers should:
� Offer Wellness and Disease PreventionPrograms and Benefits
� Offer employees programs and healthbenefits that help them stay healthy,including nutrition, physical activity, andobesity counseling, subsidizing healthclub memberships, and providing insur-ance discounts for preventive services.Investing in the health of employees notonly improves productivity but also cutsdown on absenteeism. A national forum
should be established for employers toshare best practices in worksite wellnessand to foster connections between small-er employers to promote economies ofscale to offer wellness benefits.
� Provide Opportunities for Employees toBe Active during the Day
� For example, businesses should maintainclean, well-lit stairwells to encourage employ-ees to take the stairs. Businesses should alsofocus on providing healthy food options invending machines and in cafeterias.
� Replace Smoke Breaks with Fitness Breaks
� Employees should be encouraged toengage in physical activity on their lunchhours and breaks. Employers have longallowed smokers to step outside for 10minutes or so throughout the day for acigarette break. Employees shouldinstead be offered “walking breaks,”whereby they can leave their desks for 10minutes or so to walk around the office.
� Advocate for the Health InsuranceIndustry to Develop Coding andPayment Mechanisms for ObesityPrevention Services
� Generally physicians do not receive enoughsupport, resources, or reimbursement frominsurance companies to prescribe preven-tive care for patients with chronic diseases.Employers should work with insurancecompanies to ensure that plans cover nutri-tion counseling, weight loss and manage-ment programs, and similar complementa-ry services to decrease obesity and preventthe development of more chronic diseases.
G. EMPLOYERS
WHAT WE DO KNOW NOW IS THAT OBESITY AND OVERWEIGHT ARE
CONTRIBUTING ABOUT 27 PERCENT TO THE INCREASE IN PREMIUMS THAT ARE PAID
BY PRIVATE EMPLOYERS.381
— CHRISTINE FERGUSON, FORMER MASSACHUSETTS HEALTH COMMISSIONER AND DIRECTOR
OF THE STOP OBESITY ALLIANCE.
“”
105
� Provide Opportunities for FemaleEmployees to Pump Breast Milk
� A 2007 IOM report on childhood obesitynoted that “more widespread availabilityof convenient and private rooms for
pumping breast milk at a worksite couldpotentially facilitate mothers’ continuedbreastfeeding of their infants for the rec-ommended 4 to 6 months.”383
The benefits of breastfeeding for infants andmothers are well documented. According tothe American Academy of Pediatrics a breast-fed infant is 21 percent less likely to die in thefirst year than one who is not breast-fed, andbreast milk helps protect babies against a longlist of infectious and chronic diseases, includ-ing diabetes, obesity and asthma.384 Formothers, the benefits include a lower risk ofbreast and ovarian cancer as well as protec-tion against weight gain.385 This strong evi-dence base led the U.S. government toinclude breastfeeding goals in the “HealthyPeople 2010” report. The report set out 2main breastfeeding goals:
� To increase the proportion of motherswho breastfeed their babies in the imme-diate postpartum period from 64 percentto 75 percent.
� To increase the proportion of motherswho breastfeed their babies at 6 monthsfrom 29 percent to 50 percent.386
However, women returning to work afterthe birth of a child who wish to continuebreastfeeding often face challenges. In fact,
a 2006 study found that working full-timehad a negative effect on breastfeeding dura-tion.387 While 39 states and D.C. have lawsthat specifically allow women to breastfeedin any public or private location, only 19states and D.C. have laws related to breast-feeding in the workplace.388
Mothers who wish to express or ‘pump’breast milk often lack a clean, private spacewhere they can do so. According to aCochrane Review article on breastfeeding inthe workplace, “unless these mothers getsupport from their employers and fellowemployees, they might give up breastfeedingwhen they return to work. As a result, theduration and exclusivity of breastfeeding tothe recommended age of the babies wouldbe affected.”389 The review went on to notethat by promoting and supporting programsto support breastfeeding, not only couldemployers influence the duration of breast-feeding and by doing so improve the healthof mother and baby, but the employerwould also benefit from less work absen-teeism, higher productivity, and increasedemployee morale and retention.390
EMPLOYMENT AS A BARRIER TO BREASTFEEDING
106
The health care industry also has a role inthe Nat ional St rat egy t o Combat O bes it y .Insurance companies have to pay outexcessive amounts of money for obesity-related chronic diseases such as hyperten-sion and diabetes. Preventive services maycause increased costs for the insurer upfront, but reduced rates of obesity willlower costs over time.
Health economists, however, have notedthat the current U.S. healthcare system isnot set up to focus on obesity prevention.According to Eric Finkelstein, co-author of“The Fattening of America”, private insurersreap few benefits from paying for preven-tion programs as the majority of the cost-sav-ings are realized when their customers ageout of private insurance and are coveredunder Medicare. He argues that since thefederal government would benefit from anyprevention and wellness programs institutedby private insurers, the government shouldoffer financial incentives that make it prof-itable for these private companies to pro-vide preventive benefits
As part of the National St rategy to CombatO besit y , insurance companies should:
� Promote Prevention Efforts in theMarketplace
� Offering more prevention-focused benefitoptions to employers could improve long-term health and make an economic differ-ence. This should extend to providing pre-vention support and offering healthy foodand activity capabilities to their ownemployees as well.
� Work with Companies of All Sizes
� Insurers should work with small- and medi-um-sized employers to provide programsthat are affordable.
� Insurance Companies Should NotDiscriminate Based on a Person’s Weight
� Obesity or overweight should not be usedas a risk factor for determining eligibilityfor insurance or coverage of treatment.Insurers should reimburse for all evi-dence-based services and treatments. (SeeSection 3: State Responsibilities and Policies fora discussion on state insurance coverage laws.)
H. INSURANCE COMPANIES
CURRENT GOVERNMENT POLICY PROVIDES DISINCENTIVES FOR INSURERS TO
INCORPORATE OBESITY PREVENTION PROGRAMS INTO THEIR POLICIES.391
— ERIC A. FINKELSTEIN, HEALTH ECONOMIST AND CO-AUTHOR OF THE FATTENING OF AMERICA: HOW
THE ECONOMY MAKES US FAT, IF IT MATTERS, AND WHAT TO DO ABOUT IT.
“ ”
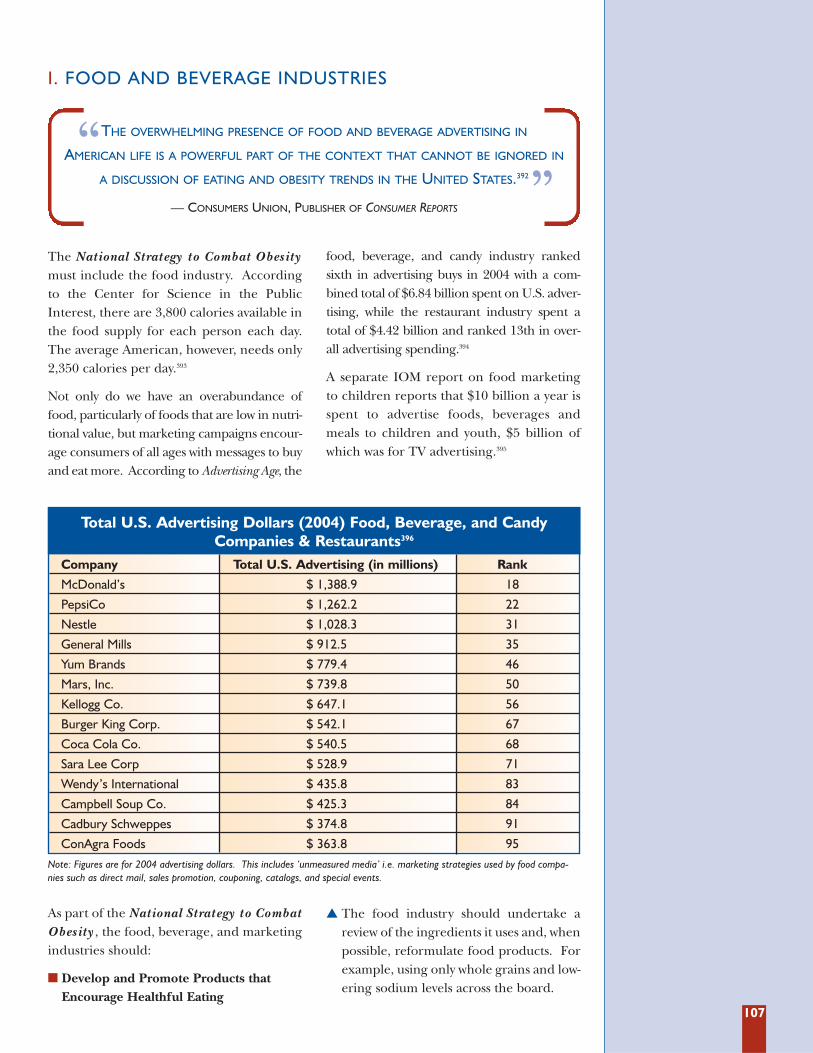
107
The National St rategy to Combat O besit ymust include the food industry. Accordingto the Center for Science in the PublicInterest, there are 3,800 calories available inthe food supply for each person each day.The average American, however, needs only2,350 calories per day.393
Not only do we have an overabundance offood, particularly of foods that are low in nutri-tional value, but marketing campaigns encour-age consumers of all ages with messages to buyand eat more. According to Advertising Age, the
food, beverage, and candy industry rankedsixth in advertising buys in 2004 with a com-bined total of $6.84 billion spent on U.S. adver-tising, while the restaurant industry spent atotal of $4.42 billion and ranked 13th in over-all advertising spending.394
A separate IOM report on food marketingto children reports that $10 billion a year isspent to advertise foods, beverages andmeals to children and youth, $5 billion ofwhich was for TV advertising.395
I. FOOD AND BEVERAGE INDUSTRIES
THE OVERWHELMING PRESENCE OF FOOD AND BEVERAGE ADVERTISING IN
AMERICAN LIFE IS A POWERFUL PART OF THE CONTEXT THAT CANNOT BE IGNORED IN
A DISCUSSION OF EATING AND OBESITY TRENDS IN THE UNITED STATES.392
— CONSUMERS UNION, PUBLISHER OF CONSUMER REPORTS
“”
Total U.S. Advertising Dollars (2004) Food, Beverage, and CandyCompanies & Restaurants396
Company Total U.S. Advertising (in millions) Rank
McDonald’s $ 1,388.9 18
PepsiCo $ 1,262.2 22
Nestle $ 1,028.3 31
General Mills $ 912.5 35
Yum Brands $ 779.4 46
Mars, Inc. $ 739.8 50
Kellogg Co. $ 647.1 56
Burger King Corp. $ 542.1 67
Coca Cola Co. $ 540.5 68
Sara Lee Corp $ 528.9 71
Wendy’s International $ 435.8 83
Campbell Soup Co. $ 425.3 84
Cadbury Schweppes $ 374.8 91
ConAgra Foods $ 363.8 95Note: Figures are for 2004 advertising dollars. This includes ‘unmeasured media’ i.e. marketing strategies used by food compa-nies such as direct mail, sales promotion, couponing, catalogs, and special events.
As part of the National St rategy to CombatO besit y , the food, beverage, and marketingindustries should:
� Develop and Promote Products thatEncourage Healthful Eating
� The food industry should undertake areview of the ingredients it uses and, whenpossible, reformulate food products. Forexample, using only whole grains and low-ering sodium levels across the board.
108
� Inform Customers about Healthy Options
� Providing customers with healthy optionsand additional product information andnutritional values can be good for bothhealth and the bottom line. The food andbeverage industry should provide consis-tent nutrition labeling to consumers, basedon product size. Industry should seek theinput of parents and other communitymembers to establish standards and prac-tices for marketing products to children.
� Improve Access to Healthy Foods in AllCommunities
� The Grocery Manufacturers Association(GMA) should encourage members to opennew supermarkets in underserved communi-ties where they can provide these communi-ties with more access to fresh fruits and veg-etables and other healthy food options.Working with local communities, GMA mem-bers should develop feasibility studies to assessthe economic viability of opening new outlets.
The Maine-based supermarket chain,Hannaford Bros., developed one of the firstnutritional rating systems for grocery storeshoppers in 2006. The system, Guiding Stars,rates meat, dairy, fresh produce, and packagedgoods on their nutritional content and awardseither a 1-, 2-, or 3-star rating to the prod-uct.397 One-star is “good nutritional value”; 2-stars are “better nutritional value”; and 3-starsare “best nutritional value.” Out of a total ofmore than 25,500 rated food items through-out the stores, more than one-quarter (28percent) receive one, 2 or 3 stars.398
According to store officials, the Guiding Starsystem has had a major impact on shoppers’buying habits as consumers flock to productswith stars. For instance, sales of cereals,breads, canned and jarred foods, dried pasta,snack foods, and beverages with one, 2 or 3stars grew steadily at 2-and-a-half-times therate of those without stars.399 Given that over70 percent of the products sold in Hannaford
stores that were evaluated failed to receive asingle star, some experts wonder if ratings sys-tems such as Guiding Stars could spur foodmanufacturers to make healthier items.
The ratings system, developed by a team ofnutritionists and public-health experts, uses aformula that credits a food’s score for thepresence of vitamins and minerals, fiber andwhole grains. It debits the score for transfats, saturated fats, cholesterol, added sugars,and added sodium. The criteria support therecommendations of the 2005 DGAs and aremeant to be used in tandem with theNutrition Facts label and the ingredient list.
Currently, Guiding Stars is used in 164 super-markets across New England and New York.Hannaford Bros.’ parent company, a Belgium-based firm, is introducing the Guiding Starssystem at its Florida chain, Sweetbay, andplans to expand to Food Lion, a supermarketchain present in the southeast and mid-Atlantic regions of the United States.
SUPERMARKETS EXPERIMENT WITH NUTRITION LABELING
In May 2004, the University of VirginiaHealth System placed so-called warninglabels on the 120 vending machines locatedon its premises. The warning labels usedthe stop-light model to distinguish amongthe nutritional values of snack foods. A redlabel indicated the item contained 201 calo-ries or more (or 10.1 percent of more satu-rated fats); a yellow label indicated the itemcontained between 141 and 200 calories (or5.1 percent to 10 percent saturated fat); agreen label was placed on items 140 caloriesor less (and less than 5 percent saturatedfat.)400 In addition, the university added a 5-cent tax to the cost of red items. Proceeds
from this levy were donated to the universi-ty’s Children’s Fitness Program. Large signsdescribing the stop-light system and taxwere placed next to each vending machine.
After one year, red-labeled snack salesdecreased 5.3 percent, yellow-labeled snacksales increased 30.7 percent, and green-labeled snack sales increased 16.5 percent.401
The 5-cent tax raised $6,700. The universityis now comparing sales of color-coded itemsin one of its hospital cafeterias with the saleof non-color-coded items in a second hospi-tal cafeteria to see if the plan merits expan-sion to vending machines and cafeteria pro-grams in schools throughout the state.
WARNING LABELS ON VENDING MACHINES -- THE UNIVERSITY OF VIRGINIA EXPERIENCE
109
According to USDA, Americans do not eatenough fruit and vegetables. A 2008 studyfound that based on USDA daily recom-mended levels, Americans need to boostfruit consumption by 132 percent and over-all vegetable consumption by 31 percent.Certain subgroups of vegetables such aslegumes would need to be increased by 431percent; orange vegetables by 183 percent;and dark green vegetables by 175 percent.Meanwhile, starchy vegetables, such as pota-toes, need to be decreased by 35 percent.403
The study notes, however, that the U.S. foodproduction system is “currently incapable ofproviding sufficient levels of fruit and vegeta-bles for all to consume a healthy diet.”404 Infact, 60 percent of all fresh fruits and vegeta-bles consumed in the U.S. are imported.405
One reason so much of the fruit and vegeta-bles Americans consume is imported is thatthe majority of U.S. farm acreage is devoted togrowing cash crops such as soy, wheat, corn,and rice. Critics of domestic U.S. farm policycharge that farm subsidies have led to theoverproduction of corn and soybeans. Thesecheap, surplus crops are used to make highfructose corn syrup and hydrogenated veg-etable oils, which enter the American diet asexcess sugar and fat. According to the
Institute for Agriculture Trade and Policy, aMinnesota-based public policy organizationworking to ensure fair and sustainable food,farm, and trade systems, “our misguided farmpolicy is making poor eating habits an eco-nomically sensible choice in the short term.”406
As part of the National St rategy to CombatO besit y , agribusinesses and farmers should:
� Farmers’ Markets Should Be Equippedto Redeem Food Stamps and WICCoupons.
� Farmers should work with local and stategovernments to equip farmers’ marketswith the necessary technology to processelectronic food stamp debit cards andWIC program cards.
� Work with Schools and CommunityGroups to Develop Urban Gardens
� Farmers and agribusiness should collabo-rate with schools and community groupsto develop urban gardens. Agribusinesscan provide materials while farmers canprovide technical support to urban gar-deners. Urban gardens provide access tofresh fruits and vegetables to communi-ties who might otherwise not be able topurchase these healthy foods in theirneighborhoods.
J. AGRIBUSINESS AND FARMERS
WE STRIVE TO FULFILL CONSUMER NEEDS FOR GREAT-TASTING, HIGH-QUALITY
FRESH VEGETABLES, AND AFFORDABLE HEALTHY FOOD CHOICES, BUT WE NEED
AGRICULTURAL POLICY PRIORITIES TO ASSIST US IN THAT EFFORT.402
— MAUREEN TORREY MARSHALL, CO-CHAIR OF THE UNITED FRESH FRUIT & VEGETABLE ASSOCIATION
“”
110
There is a growing body of research onnutrition, physical activity, obesity, and obe-sity-related health outcomes and associatedinterventions. Public health officials, how-ever, argue that more effort, money, andevaluation of obesity-prevention programsare needed in order to develop a set of evi-dence-based, proven interventions. Thereis also a need for research “on how to framethe obesity issue in order to gain support forpublic health interventions,” according toscientists at Yale University’s Rudd Centerfor Food Policy and Obesity. 408
As part of the National St rategy to CombatO besit y , researchers should:
� Translate Research into Practice
� Too often researchers publish the results oftheir trials or interventions and walk away,thinking their job is done. For publichealth practitioners, however, simply hav-ing the results of a new study is not enough.Many of these studies demonstrate the “effi-cacy” of an intervention or medical treat-ment while failing to consider how “effec-tive” they will be under real world circum-stances. Researchers must do a better job oftranslating their work into practice, whichmeans considering the full range of envi-ronmental and socioeconomic factors thatinfluence people. Researchers must alsoaddress cost effectiveness and give publichealth officials a sense of per capita costs asthey attempt to use these small controlledinterventions on a community-wide level.
� Challenge to the Research Community: 4Key Questions
� TFAH has identified 4 key research ques-tions that have not yet been adequatelyanswered and could help provide break-
throughs in developing even more effectiveobesity prevention and control strategies.
1) Small Changes Make a Big Difference. There is increasing evidence that substan-tial weight loss is not needed to changehealth outcomes for obese individuals; infact, as little as a 5 to 10 percent weight losscan reduce the risk factors for some dis-eases, including diabetes and some cardio-vascular diseases. What are the smallchanges that work? How does a smallchange in weight or a small increase in phys-ical activity affect an individual’s health?
2) Redefine Success.Too many Americans, including healthpractitioners, have an unrealistic expecta-tion about how much weight loss isenough to achieve meaningful change.The research community should redefinesuccessful weight loss as it pertains to “con-trolling or reducing health risks andcosts,” instead of meeting some unrealisticstandard set by society.409 Researchers andclinicians should communicate the impor-tance of making small changes in order toreduce health risks to the American publicin order to counter the unrealistic viewsmost obese individuals and their health-care providers hold about weight loss.
3) The Cost of Obesity Prevention.What are the costs of various obesity inter-ventions, particularly those that targetcommunities and the environment?What are the per person costs associatedwith obesity interventions? What does itcost to bring an intervention to scale?Given the substantial investments in obe-sity prevention and control, researchersshould work on developing standardizedways of reporting intervention costs in a
K. ROLE FOR INCREASED RESEARCH AND EVALUATION
IF WE WANT MORE EVIDENCE-BASED PRACTICE, WE NEED MORE
PRACTICE-BASED EVIDENCE.407
— LAWRENCE W. GREEN, FORMER DIRECTOR, OFFICE OF SCIENCE & EXTRAMURAL RESEARCH, PUBLIC
HEALTH PRACTICE PROGRAM OFFICE, CENTERS FOR DISEASE CONTROL AND PREVENTION (CDC)
“ ”
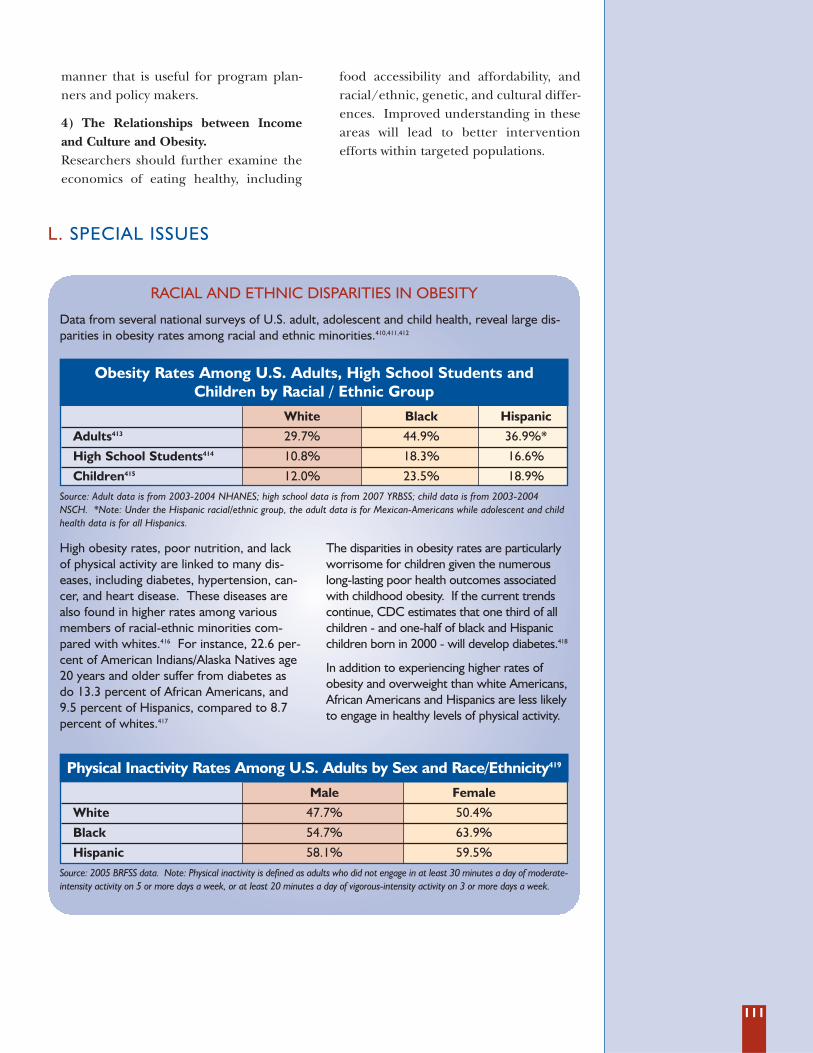
111
manner that is useful for program plan-ners and policy makers.
4) The Relationships between Incomeand Culture and Obesity.Researchers should further examine theeconomics of eating healthy, including
food accessibility and affordability, andracial/ethnic, genetic, and cultural differ-ences. Improved understanding in theseareas will lead to better interventionefforts within targeted populations.
L. SPECIAL ISSUES
Data from several national surveys of U.S. adult, adolescent and child health, reveal large dis-parities in obesity rates among racial and ethnic minorities.410,411,412
Source: Adult data is from 2003-2004 NHANES; high school data is from 2007 YRBSS; child data is from 2003-2004NSCH. *Note: Under the Hispanic racial/ethnic group, the adult data is for Mexican-Americans while adolescent and childhealth data is for all Hispanics.
Source: 2005 BRFSS data. Note: Physical inactivity is defined as adults who did not engage in at least 30 minutes a day of moderate-intensity activity on 5 or more days a week, or at least 20 minutes a day of vigorous-intensity activity on 3 or more days a week.
High obesity rates, poor nutrition, and lackof physical activity are linked to many dis-eases, including diabetes, hypertension, can-cer, and heart disease. These diseases arealso found in higher rates among variousmembers of racial-ethnic minorities com-pared with whites.416 For instance, 22.6 per-cent of American Indians/Alaska Natives age20 years and older suffer from diabetes asdo 13.3 percent of African Americans, and9.5 percent of Hispanics, compared to 8.7percent of whites.417
The disparities in obesity rates are particularlyworrisome for children given the numerouslong-lasting poor health outcomes associatedwith childhood obesity. If the current trendscontinue, CDC estimates that one third of allchildren - and one-half of black and Hispanicchildren born in 2000 - will develop diabetes.418
In addition to experiencing higher rates ofobesity and overweight than white Americans,African Americans and Hispanics are less likelyto engage in healthy levels of physical activity.
RACIAL AND ETHNIC DISPARITIES IN OBESITY
Obesity Rates Among U.S. Adults, High School Students and Children by Racial / Ethnic Group
White Black Hispanic
Adults413 29.7% 44.9% 36.9%*
High School Students414 10.8% 18.3% 16.6%
Children415 12.0% 23.5% 18.9%
Physical Inactivity Rates Among U.S. Adults by Sex and Race/Ethnicity419
Male Female
White 47.7% 50.4%
Black 54.7% 63.9%
Hispanic 58.1% 59.5%
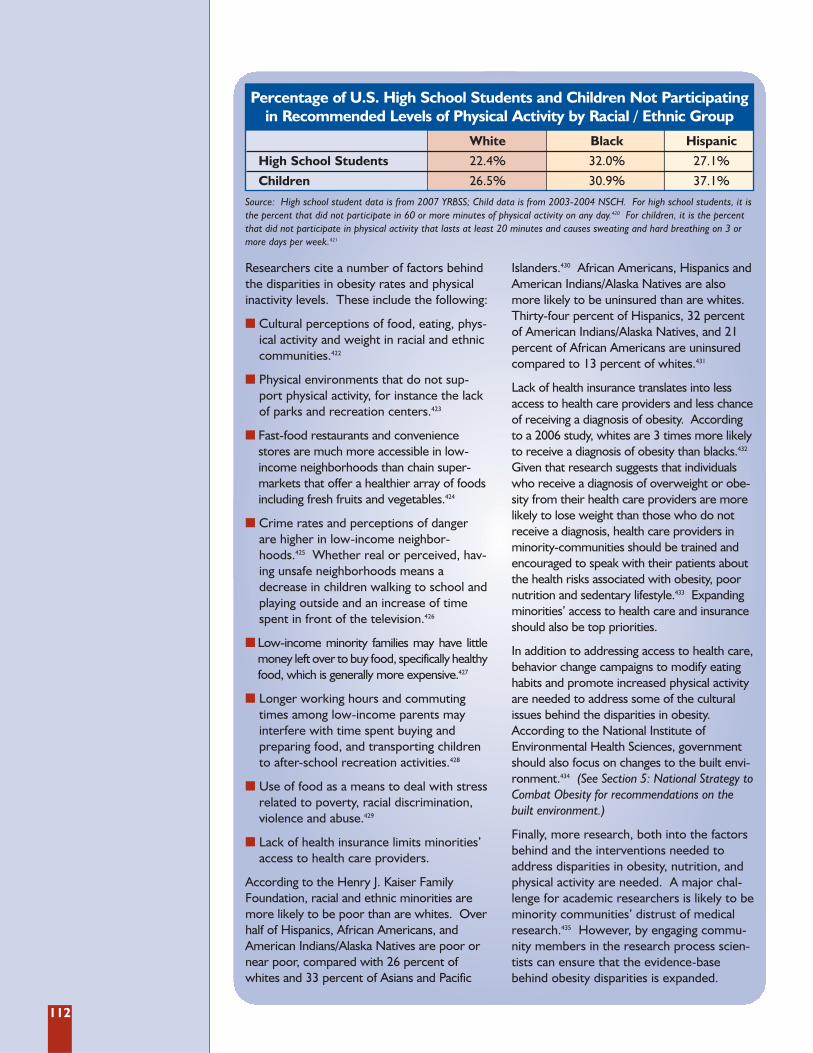
112
Source: High school student data is from 2007 YRBSS; Child data is from 2003-2004 NSCH. For high school students, it isthe percent that did not participate in 60 or more minutes of physical activity on any day.420 For children, it is the percentthat did not participate in physical activity that lasts at least 20 minutes and causes sweating and hard breathing on 3 ormore days per week.421
Researchers cite a number of factors behindthe disparities in obesity rates and physicalinactivity levels. These include the following:
� Cultural perceptions of food, eating, phys-ical activity and weight in racial and ethniccommunities.422
� Physical environments that do not sup-port physical activity, for instance the lackof parks and recreation centers.423
� Fast-food restaurants and conveniencestores are much more accessible in low-income neighborhoods than chain super-markets that offer a healthier array of foodsincluding fresh fruits and vegetables.424
� Crime rates and perceptions of dangerare higher in low-income neighbor-hoods.425 Whether real or perceived, hav-ing unsafe neighborhoods means adecrease in children walking to school andplaying outside and an increase of timespent in front of the television.426
� Low-income minority families may have littlemoney left over to buy food, specifically healthyfood, which is generally more expensive.427
� Longer working hours and commutingtimes among low-income parents mayinterfere with time spent buying andpreparing food, and transporting childrento after-school recreation activities.428
� Use of food as a means to deal with stressrelated to poverty, racial discrimination,violence and abuse.429
� Lack of health insurance limits minorities’access to health care providers.
According to the Henry J. Kaiser FamilyFoundation, racial and ethnic minorities aremore likely to be poor than are whites. Overhalf of Hispanics, African Americans, andAmerican Indians/Alaska Natives are poor ornear poor, compared with 26 percent ofwhites and 33 percent of Asians and Pacific
Islanders.430 African Americans, Hispanics andAmerican Indians/Alaska Natives are alsomore likely to be uninsured than are whites.Thirty-four percent of Hispanics, 32 percentof American Indians/Alaska Natives, and 21percent of African Americans are uninsuredcompared to 13 percent of whites.431
Lack of health insurance translates into lessaccess to health care providers and less chanceof receiving a diagnosis of obesity. Accordingto a 2006 study, whites are 3 times more likelyto receive a diagnosis of obesity than blacks.432
Given that research suggests that individualswho receive a diagnosis of overweight or obe-sity from their health care providers are morelikely to lose weight than those who do notreceive a diagnosis, health care providers inminority-communities should be trained andencouraged to speak with their patients aboutthe health risks associated with obesity, poornutrition and sedentary lifestyle.433 Expandingminorities’ access to health care and insuranceshould also be top priorities.
In addition to addressing access to health care,behavior change campaigns to modify eatinghabits and promote increased physical activityare needed to address some of the culturalissues behind the disparities in obesity.According to the National Institute ofEnvironmental Health Sciences, governmentshould also focus on changes to the built envi-ronment.434 (See Section 5: National Strategy toCombat Obesity for recommendations on thebuilt environment.)
Finally, more research, both into the factorsbehind and the interventions needed toaddress disparities in obesity, nutrition, andphysical activity are needed. A major chal-lenge for academic researchers is likely to beminority communities’ distrust of medicalresearch.435 However, by engaging commu-nity members in the research process scien-tists can ensure that the evidence-basebehind obesity disparities is expanded.
Percentage of U.S. High School Students and Children Not Participatingin Recommended Levels of Physical Activity by Racial / Ethnic Group
White Black Hispanic
High School Students 22.4% 32.0% 27.1%
Children 26.5% 30.9% 37.1%
113
Many Americans may associate living in arural setting with a healthy lifestyle because itmay offer opportunities for physical activity,consuming locally grown produce, access toopen land and clean air that invite outdooractivities.436 But recent studies have foundthat rural children are just as likely to beobese as urban children.437,438,439 An analysisfrom the South Carolina Rural HealthResearch Center, using the 2003 NationalSurvey on Children’s Health data, found that:
� 31.5 percent of rural children aged 10 to 17years old were overweight or obese, com-pared to 30.4 percent of urban children.
� 16.5 percent of rural children were obese,compared to 14.4 percent of urban children.
� Rural African-American children had thehighest levels of overweight (44.1 percent)and obesity (26.3 percent) compared to allother racial and ethnic groups.
� Children living in the South were mostlikely to be overweight or obese (33.1percent), followed by the Midwest (30.2percent), the Northeast (29.5 percent),and the West (28.1 percent).
� As family income increased, the proportionof children who are overweight decreasedsignificantly among rural and urban residents.
� 25.4 percent of rural children failed tomeet physical activity recommendations.
� 40.7 percent of rural children did not par-ticipate in any after school sports teamsor activities.
� Nearly half of rural children (48 percent)spent at least 2 hours a day with electron-ic entertainment media (TV viewing,video games, computer use).
Poverty rates are also quite high for ruralchildren, 21 percent of whom live in poverty
compared to 18 percent of urban children.440
According to Save the Children, the leadingindependent organization promoting chil-dren’s health and well-being, “children wholive in poverty have a greater challengeengaging healthy lifestyle behaviors to sup-port normal growth and development.”441
One challenge is lack of access to healthyfoods, beverages, and meals. A 2007 studyfound more than 800 counties where ruralresidents live 10 miles from a large foodretailer.442 Another challenge is lack of accessto opportunities and facilities for regularphysical activity.443 Poverty and food insecuri-ty are only 2 factors behind the high rates ofchildhood obesity in rural areas. In addition,children living in rural areas struggle with alack of resources and infrastructure to sup-port physical activity and healthy eating.444
In order to address the problem of ruralchildhood obesity, in 2005 Save the Childrenlaunched the CHANGE (Creating Healthy,Active, and Nurturing Growing-upEnvironments) Program to increase rural chil-dren’s access to daily physical activity and ahealthy snack. The CHANGE Program oper-ates in 5 rural regions of the U.S. wherepoverty rates are highest: Appalachia, theSoutheast, the Mississippi River Delta,California’s Central and San BernardinoValley, and Native American reservations inthe Southwest. During the 2007-2008 schoolyear, the CHANGE program served nearly7,000 children at 95 sites in 12 states. Alarge-scale community-based intervention isunderway called the CHANGE Study, whichis adapting and testing Tufts University’sShape Up Somerville model. The researchwill identify a package of interventions toreduce rural children’s obesity risk and createenvironments that support healthy lifestylebehaviors. Results are expected in 2010.
CHILDHOOD OBESITY IN RURAL AMERICA
114
In 1946, 3.4 million babies were born -- a jump of 22 percentfrom the previous year, a trend that continued until 1964, cre-ating a population bulge we call “baby boomers.”445 With thefirst round of baby boomers turning 60, there are questionsabout the overall health of the generation: Are they livinglonger and healthier lives? Is the health care system preparedto handle the boomer demographic bulge? Currently, scien-tists know the following about the baby boomers:
� Access to better food and health care has improved, but con-sumption of high fat foods and rates of obesity has increased,while rates of physical activity remain unchanged.446
� The number of obese Americans 55-64 has increased from31 percent (1988-1994) to 39 percent (1999-2002).447
� A study published in 2005 found that members of the babyboom generation have a higher prevalence of obesity, andbecame obese at younger ages, than their predecessors inthe silent generation.448
� A report from the Centers for Medicare and MedicaidServices predicts that unless major health changes occur,U.S. health care spending will reach $4.3 trillion (almost 20percent of the gross domestic product) by 2017 as the firstof the baby boomers begin to enroll in Medicare.449
� Sixty-two percent of 50-64 year-olds claim to have at leastone of the following obesity-related chronic conditions:diabetes, heart disease, hypertension, cancer, arthritis, andhigh cholesterol.
� The highest prevalence of obesity occurs among women intheir 50’s -- fitting squarely into the baby boomer population.450
� Individuals obese in middle-age are projected to be twice asexpensive to cover under Medicare as healthy weight people.451
� Data from a 2007 U.S. Health and Retirement Study showspeople in their early to mid-50s reporting more health prob-lems and a lower quality of life than previously described.452
While many studies point to startling statistics relating toincreasing rates of obesity among the baby boomer popula-tion, other analysts are finding contradictory health trendsamong the boomer generation. For example, descriptionsabout health in the National Health Interview Survey show ahigher percentage of those 50-64 reporting health as “verygood” or “excellent” in 2004 than in 1994.453 Although thereis conflicting data, there is no argument that very soonMedicare will be inundated with a population bulge ofboomers, many of whom are overweight or obese.
BABY BOOMERS AND OBESITY
MENTAL HEALTH, STRESS AND OBESITYThere is growing evidence documenting the association betweenobesity and poor mental health. Researchers in the Adult andCommunity Health division of CDC analyzed 2006 BRFSS dataand found that depression and anxiety are associated withobesity.454 Adults currently or previously diagnosed with depres-sion were 60 percent more likely to be obese, and those withanxiety disorders were 30 percent more likely to be obese thantheir non-depressed counterparts.455 Adults with depression oranxiety were also less likely to engage in regular physical activity.456
A separate study analyzing data from more than 41,000Americans who participated in the National EpidemiologicSurvey on Alcohol and Related Conditions found that adults withhigh BMI (BMI ≥ 30) were more likely to suffer from mood, anx-iety, and personality disorders than people of normal weight(18.5 ≤ BMI < 25) .457 Even individuals in the moderately over-weight category (25 ≤ BMI < 30) were at an elevated risk ofanxiety disorders compared to those of normal weight.458
The significant associations between obesity and poor mentalhealth has led CDC researchers to “suggest that public health inter-ventions should address mental and physical health as a combinedentity and that programs to simultaneously improve people's men-tal and physical health should be developed and implemented.”459
Stress and ObesityA 2007 study found a direct connection between stress and obesi-ty. Scientists, performing studies on mice, found a chain of molecu-lar events that link chronic stress with obesity. The study foundthat when stressed and non-stressed mice were fed the same,high-calorie diet, the stressed mice gained twice as much fat.460
According to the study, the long-term combination of stress and ahigh fat/high sugar diet will lead to obesity and metabolic syn-drome symptoms such as hypertension and glucose intolerance.461
In addition to the traditional methods of weight loss, researcherssuggested also including stress reduction therapy and a neuropep-tide Y receptor inhibitor to induce fat “melting.”462
Binge eating disorder is a classified psychiatric disorder whichaffects more than 7 million adults in the U.S.463 Binge eatingis a compulsive pattern of regular bingeing of unusually largeamounts of food and complete loss of control over one's eat-ing patterns.464 While only 1 to 3 percent of the general pop-ulation is affected by binge eating disorder, a much higher
prevalence, 25 percent or more, has been reported bypatients who are obese or seeking help for weight loss.465
Because long-term weight management is more likely in anindividual who is able to control eating patterns, physicianstreating obese patients need to address the behavioral andpsychological components of binge eating disorders.466
BINGE EATING DISORDER AND OBESITY
115
WHAT ARE OTHER COUNTRIES DOING?According to the World Health Organization (WHO), globallythere are some 1.6 billion adults (age 15 and older) who areoverweight and 400 million adults who suffer from obesity; atleast 20 million children under the age of 5 years were over-weight globally in 2005.467 WHO projects by 2015 thatapproximately 2.3 billion adults will be overweight and morethan 700 million will be obese.468
The problem is not confined to the industrialized countries; infact, overweight and obesity are on the rise in less developedcountries, particularly in urban settings.
In response to the global obesity problem, in May 2004 WHOadopted the Global Strategy on Diet, Physical Activity andHealth.469 The Global Strategy has 4 main objectives: 1. Reduce risk factors for chronic diseases that stem from
unhealthy diets and physical inactivity through public healthactions.
2. Increase awareness and understanding of the influences ofdiet and physical activity on health and the positive impactof preventive interventions.
3. Develop, strengthen and implement global, regional, nationalpolicies and action plans to improve diets and increase physical activity that are sustainable, comprehensive andactively engage all sectors.
4. Monitor science and promote research on diet and physical activity.
Although the United States has failed to develop a nationalplan, WHO reports that there are 36 countries that haveadopted national plans regarding diet and physical activity.470 Asearchable database of countries with national plans is availableonline at http://www.who.int/infobase/dpas/dpas.aspx.
United KingdomThe British released a cross-sectoral, multi-agency obesity pre-vention plan in January 2008, “Healthy Weight, Healthy Lives: ACross-Government Strategy for England”, and set out an ambi-tious goal to be the first major nation to reverse the trend ofincreasing obesity and overweight among the population.471 Theplan’s initial focus is on children and by 2020 the goal is to reducethe proportion of overweight and obese children to 2000 levels.
One of the critical components of the U.K.’s anti-obesity strate-gy is the national commitment to changing the physical andsocial environments in communities. The government isredesigning several communities into so-called “healthy towns”that feature bike lanes and facilities to encourage people tocommute by bike and foot instead of car. A pilot project in thetown of Peterborough led to a 13 percent reduction in car useand a 21 percent increase in walking.472
The strategy also includes public service announcements to edu-cate parents about healthy eating habits and activity levels forchildren. Already, Britain has implemented tough new food-stan-dards for school lunches and other school foods, in addition torequiring schoolchildren to engage in at least 2 hours of physicaleducation and activity a week.473 The government has alsocracked down on food manufacturers and marketers, imple-
menting new rules that limit exposure to fatty, sugary, food adson children’s television.474
According to Will Cavendish, Director of Health and Well-Being,United Kingdom Department of Health, there were 2 major fac-tors that led the British government to draft and adopt the com-prehensive obesity-prevention plan. First, in October 2007 theBritish government forecasting office published a report thatlooked at obesity trends in the United Kingdom and the associat-ed economic costs. The report estimated that by 2050 at least50 percent of adults and 25 percent of children under age 16would be obese, which would cost society and business an esti-mated 49.9 billion pounds a year (or some $100 billion) if theepidemic were not brought under control through dramaticchanges across British society.475 The report’s authors comparedthe problem to global climate change and noted that it wouldrequire a government-wide, multi-sectoral approach to solvingthe problem. “This really changed the environment in the U.K.from one where obesity was a passing interest to one in whichobesity is a serious concern,” Cavendish said at an April 2008obesity conference in Washington, D.C.476
The second was a national listening tour the newly electedprime minister, Gordon Brown, carried out soon after assumingoffice in 2007. The tour was to focus on health issues and whatstood out, according to Cavendish, was that parents’ numberone concern was childhood obesity. These 2 factors -- a strong,evidence-based call to action and the political leadership andbuy-in -- were enough to get all levels of government workingtogether, according to Cavendish. The national governmentalso put resources behind the national plan: 372 million pounds,or $726 million over the next 3 years.477
FranceThe French government released a national childhood obesityplan in January 2004 that focuses both on primary prevention --with recommendations for families, teachers, and communities,and secondary prevention -- with recommendations for healthprofessionals.
The French plan also focuses on the importance of social and physical changes to the environment. According to MichelChauliac, Coordinator, National Nutrition and Health Program,French Ministry of Health, the overall goal is to improve health,with nutrition and physical activity seen as critical components ofhealth. He says the French government wants consumers to makeinformed choices but realizes that choice is limited by the environ-ment. “So the goal is to improve the nutritional environment.”478
To improve the nutritional environment, France has:� Banned vending machines in all schools;� Mandated nutritional qualities of school meals;� Incorporated health messages on all manufactured foods
and beverages; and� Considered a possible ban on TV advertisements for children.The plan is already showing promising results according toFrench researchers who reported the findings from 2 differentstudies that showed a leveling off of childhood obesity rates.479
116
Data for this analysis was obtained from theBehavioral Risk Factor Surveillance System(BRFSS) dataset (publicly available on theweb at www.cdc.gov/brfss). The analysis wasconducted by Daniel Eisenberg, PhD, andEdward N. Okeke, MBBS, of the Departmentof Health Management and Policy of theUniversity of Michigan School of PublicHealth.
BRFSS is an annual cross-sectional surveydesigned to measure behavioral risk factorsin the adult population (18 years of age orolder) living in households. Data are collect-ed from a random sample of adults (one perhousehold) through a system of telephonesurveys. The BRFSS currently includes datafrom 50 states, the District of Columbia,Puerto Rico, Guam, and the Virgin Islands.The most recent data available was 2007.
To account for the complex nature of thesurvey design and obtain estimates accu-rately representative at the state level,researchers used sample weights providedby the CDC in the dataset. The main pur-pose of weighting is to reduce bias in popu-lation estimates by up-weighting populationsub-groups that are under represented anddown-weighting those that are over repre-sented in the sample. Also, estimation ofvariance (which indicates precision and isused in calculating confidence intervals),needs to take into account the fact that theelements in the sample will generally not bestatistically independent as a result of themultistage sampling design.
We specified the sampling plan to STATA480
using the svyset command and the followingset of weights: sample weight variable(FINALWT), first-stage stratification variable(STSTR), and primary sampling unit vari-
able (PSU). Omission of the stratificationvariable in STATA implies no stratification ofPSUs prior to first-stage sampling. Omissionof the primary sampling unit variableimplies one-stage sampling of elements andno clustering of sampled elements.Omission of the sample weight impliesequally weighted sample elements. Meanproportions for each variable were estimatedusing the svy: proportion command.
Variables of interest included BMI, physicalinactivity, asthma, smoking, high blood pres-sure and diabetes. BMI was calculated bydividing self-reported weight in kilograms bythe square of self-reported height in metres.Obesity was then defined as calculated BMIgreater than or equal to 30 and overweightwas defined as calculated BMI greater thanor equal to 25 but less than 30. For the phys-ical inactivity variable a binary indicatorequal to one was created for adults whoreported not engaging in physical activity orexercise during the previous thirty daysother than their regular job. For diabetes,researchers created a binary variable equalto one if the respondent reported ever beingtold by a doctor that he/she had diabetesand for smoking we created a variable equalto 1 if the respondent self-identified as a cur-rent smoker. For asthma, all respondentswho reported ever being told that they hadasthma were coded as 1 and 0 otherwise.
The hypertension variable481 had to be treat-ed differently because of changes in how thequestion was asked. Prior to 2003 the ques-tion asked was “Have you ever been told bya doctor, nurse or other health professionalthat you have high blood pressure?”Respondents could answer “yes”, “no”, or“don’t know/not sure”, or could refuse to
Methodology for Obesityand Other Rates UsingBRFSS
AA P P E N D I X
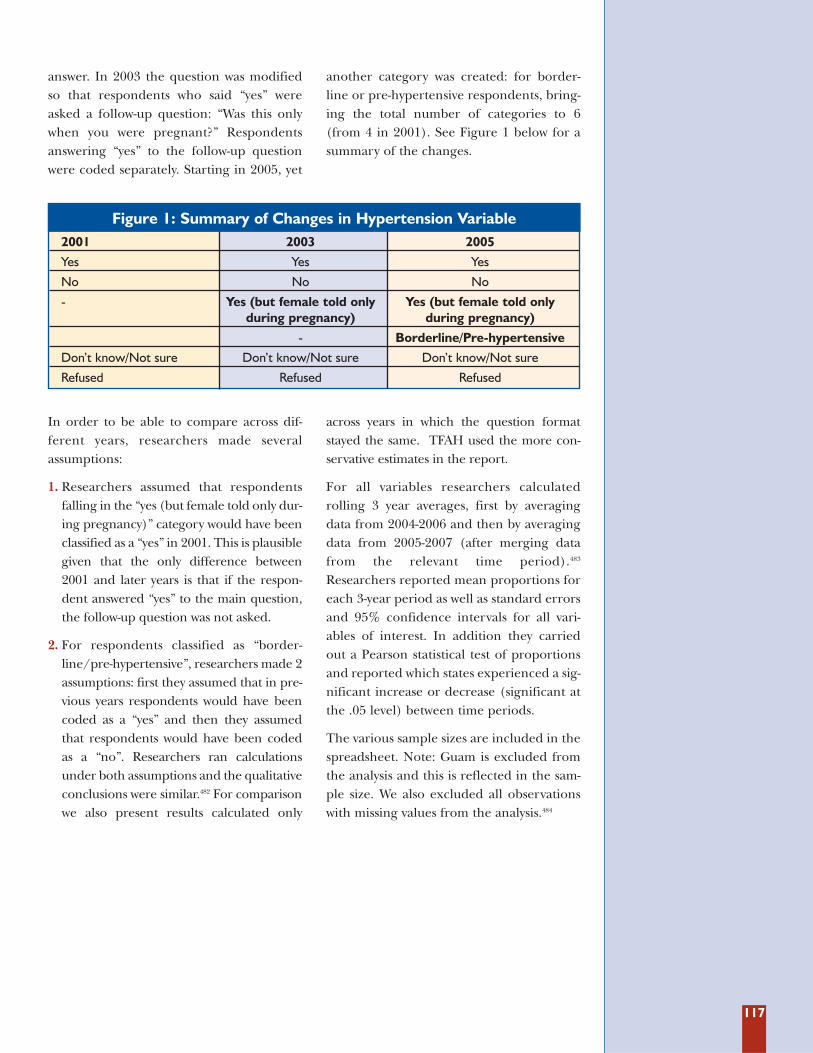
117
answer. In 2003 the question was modifiedso that respondents who said “yes” wereasked a follow-up question: “Was this onlywhen you were pregnant?” Respondentsanswering “yes” to the follow-up questionwere coded separately. Starting in 2005, yet
another category was created: for border-line or pre-hypertensive respondents, bring-ing the total number of categories to 6(from 4 in 2001). See Figure 1 below for asummary of the changes.
In order to be able to compare across dif-ferent years, researchers made severalassumptions:
1. Researchers assumed that respondentsfalling in the “yes (but female told only dur-ing pregnancy)” category would have beenclassified as a “yes” in 2001. This is plausiblegiven that the only difference between2001 and later years is that if the respon-dent answered “yes” to the main question,the follow-up question was not asked.
2. For respondents classified as “border-line/pre-hypertensive”, researchers made 2assumptions: first they assumed that in pre-vious years respondents would have beencoded as a “yes” and then they assumedthat respondents would have been codedas a “no”. Researchers ran calculationsunder both assumptions and the qualitativeconclusions were similar.482 For comparisonwe also present results calculated only
across years in which the question formatstayed the same. TFAH used the more con-servative estimates in the report.
For all variables researchers calculatedrolling 3 year averages, first by averagingdata from 2004-2006 and then by averagingdata from 2005-2007 (after merging datafrom the relevant time period).483
Researchers reported mean proportions foreach 3-year period as well as standard errorsand 95% confidence intervals for all vari-ables of interest. In addition they carriedout a Pearson statistical test of proportionsand reported which states experienced a sig-nificant increase or decrease (significant atthe .05 level) between time periods.
The various sample sizes are included in thespreadsheet. Note: Guam is excluded fromthe analysis and this is reflected in the sam-ple size. We also excluded all observationswith missing values from the analysis.484
Figure 1: Summary of Changes in Hypertension Variable2001 2003 2005
Yes Yes Yes
No No No
- Yes (but female told only Yes (but female told only during pregnancy) during pregnancy)
- Borderline/Pre-hypertensive
Don’t know/Not sure Don’t know/Not sure Don’t know/Not sure
Refused Refused Refused
118
TFAH researchers searched the public healthdepartment and governor’s website of eachstate and D.C. for physical activity, nutrition,and obesity plans. The search took place inApril 2008. Several states, including Idaho,Indiana, Kansas, Tennessee, and D.C., had anoverall health promotion plan which includ-ed a section on obesity, but these were notcounted as strategic plans to combat obesity.Virginia and D.C. had state plans aimed atthe prevention of obesity only among chil-dren, which TFAH counted as strategic plansto combat obesity.
If a plan was not available online, TFAHresearchers emailed the most appropriateperson or department in that state to inquirewhether or not the state had a strategic planto prevent and treat obesity. States that didnot respond to inquiries via email were con-tacted via the National Association ofChronic Disease Directors. In this way, TFAHwas able to confirm the status of each state’sobesity plan.
Researchers read and evaluated each stateplan based on the following criteria:
Does the state obesity plan involve multiplestate agencies?
Does the plan specifically assign roles &responsibilities to state agencies?
Does the plan contain clear and measura-ble objectives?
Are the plan’s objectives related to reducingrates of obesity?
Does the plan link funding to objectives?
Does the plan include private sector (busi-ness, industry) and community groups?
Does the plan include provisions regardinga healthier state workforce?
Does the plan have a system for evaluationand review?
Methodology for StateObesity Plan ReviewBA P P E N D I X
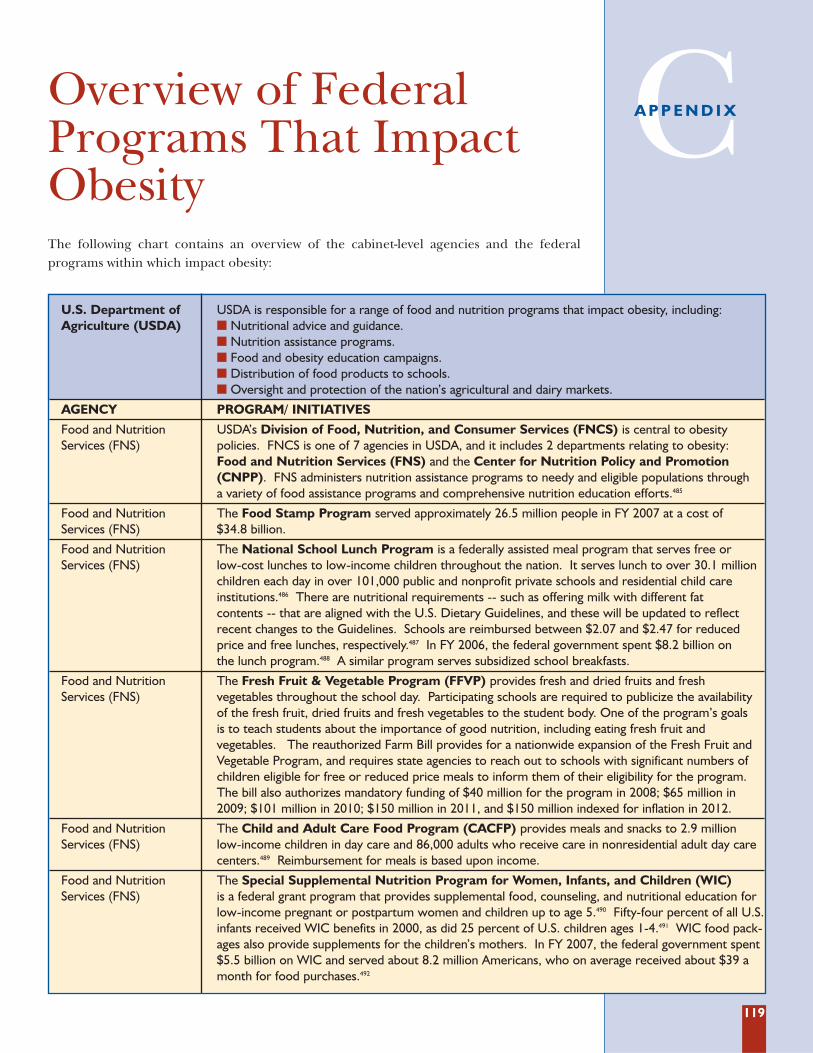
119
The following chart contains an overview of the cabinet-level agencies and the federal programs within which impact obesity:
Overview of FederalPrograms That ImpactObesity
CA P P E N D I X
U.S. Department of USDA is responsible for a range of food and nutrition programs that impact obesity, including:Agriculture (USDA) � Nutritional advice and guidance.
� Nutrition assistance programs.� Food and obesity education campaigns.� Distribution of food products to schools.� Oversight and protection of the nation’s agricultural and dairy markets.
AGENCY PROGRAM/ INITIATIVES
Food and Nutrition USDA’s Division of Food, Nutrition, and Consumer Services (FNCS) is central to obesity Services (FNS) policies. FNCS is one of 7 agencies in USDA, and it includes 2 departments relating to obesity:
Food and Nutrition Services (FNS) and the Center for Nutrition Policy and Promotion(CNPP). FNS administers nutrition assistance programs to needy and eligible populations through a variety of food assistance programs and comprehensive nutrition education efforts.485
Food and Nutrition The Food Stamp Program served approximately 26.5 million people in FY 2007 at a cost of Services (FNS) $34.8 billion.
Food and Nutrition The National School Lunch Program is a federally assisted meal program that serves free or Services (FNS) low-cost lunches to low-income children throughout the nation. It serves lunch to over 30.1 million
children each day in over 101,000 public and nonprofit private schools and residential child care institutions.486 There are nutritional requirements -- such as offering milk with different fat contents -- that are aligned with the U.S. Dietary Guidelines, and these will be updated to reflectrecent changes to the Guidelines. Schools are reimbursed between $2.07 and $2.47 for reducedprice and free lunches, respectively.487 In FY 2006, the federal government spent $8.2 billion on the lunch program.488 A similar program serves subsidized school breakfasts.
Food and Nutrition The Fresh Fruit & Vegetable Program (FFVP) provides fresh and dried fruits and fresh Services (FNS) vegetables throughout the school day. Participating schools are required to publicize the availability
of the fresh fruit, dried fruits and fresh vegetables to the student body. One of the program’s goals is to teach students about the importance of good nutrition, including eating fresh fruit and vegetables. The reauthorized Farm Bill provides for a nationwide expansion of the Fresh Fruit andVegetable Program, and requires state agencies to reach out to schools with significant numbers ofchildren eligible for free or reduced price meals to inform them of their eligibility for the program.The bill also authorizes mandatory funding of $40 million for the program in 2008; $65 million in2009; $101 million in 2010; $150 million in 2011, and $150 million indexed for inflation in 2012.
Food and Nutrition The Child and Adult Care Food Program (CACFP) provides meals and snacks to 2.9 million Services (FNS) low-income children in day care and 86,000 adults who receive care in nonresidential adult day care
centers.489 Reimbursement for meals is based upon income.
Food and Nutrition The Special Supplemental Nutrition Program for Women, Infants, and Children (WIC) Services (FNS) is a federal grant program that provides supplemental food, counseling, and nutritional education for
low-income pregnant or postpartum women and children up to age 5.490 Fifty-four percent of all U.S.infants received WIC benefits in 2000, as did 25 percent of U.S. children ages 1-4.491 WIC food pack-ages also provide supplements for the children’s mothers. In FY 2007, the federal government spent$5.5 billion on WIC and served about 8.2 million Americans, who on average received about $39 amonth for food purchases.492
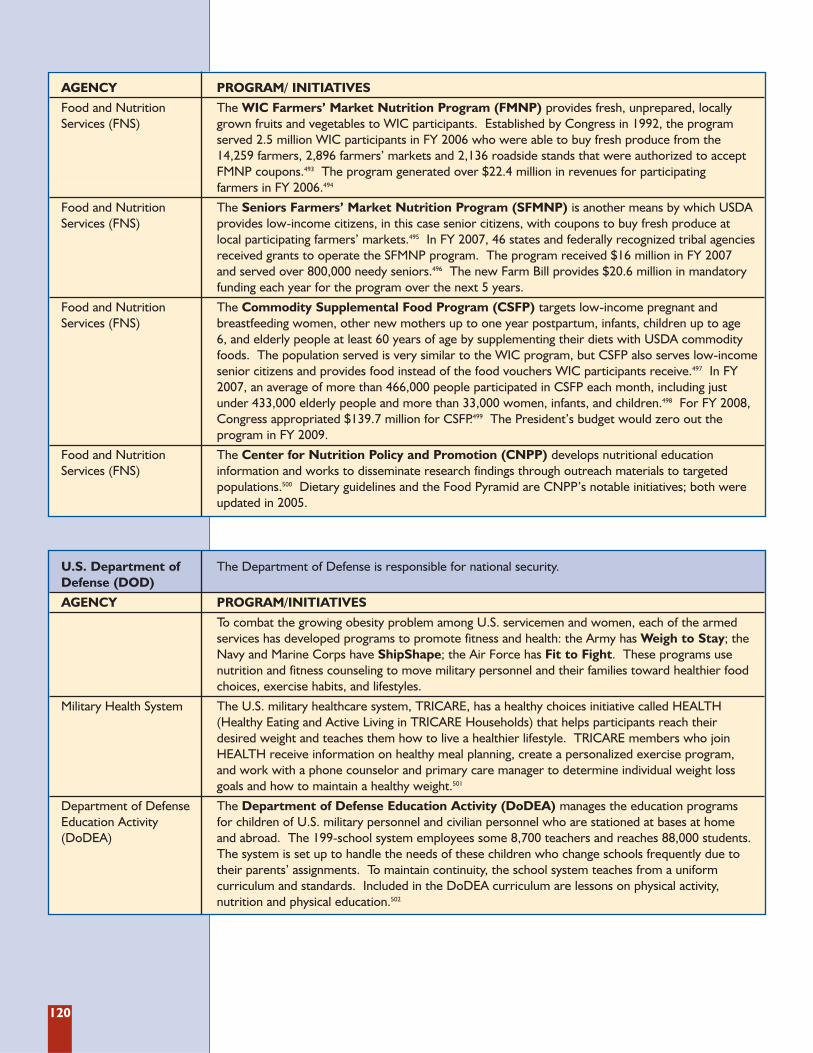
120
AGENCY PROGRAM/ INITIATIVES
Food and Nutrition The WIC Farmers’ Market Nutrition Program (FMNP) provides fresh, unprepared, locally Services (FNS) grown fruits and vegetables to WIC participants. Established by Congress in 1992, the program
served 2.5 million WIC participants in FY 2006 who were able to buy fresh produce from the 14,259 farmers, 2,896 farmers’ markets and 2,136 roadside stands that were authorized to acceptFMNP coupons.493 The program generated over $22.4 million in revenues for participating farmers in FY 2006.494
Food and Nutrition The Seniors Farmers’ Market Nutrition Program (SFMNP) is another means by which USDA Services (FNS) provides low-income citizens, in this case senior citizens, with coupons to buy fresh produce at
local participating farmers’ markets.495 In FY 2007, 46 states and federally recognized tribal agenciesreceived grants to operate the SFMNP program. The program received $16 million in FY 2007 and served over 800,000 needy seniors.496 The new Farm Bill provides $20.6 million in mandatoryfunding each year for the program over the next 5 years.
Food and Nutrition The Commodity Supplemental Food Program (CSFP) targets low-income pregnant and Services (FNS) breastfeeding women, other new mothers up to one year postpartum, infants, children up to age
6, and elderly people at least 60 years of age by supplementing their diets with USDA commodityfoods. The population served is very similar to the WIC program, but CSFP also serves low-incomesenior citizens and provides food instead of the food vouchers WIC participants receive.497 In FY2007, an average of more than 466,000 people participated in CSFP each month, including just under 433,000 elderly people and more than 33,000 women, infants, and children.498 For FY 2008,Congress appropriated $139.7 million for CSFP.499 The President’s budget would zero out the program in FY 2009.
Food and Nutrition The Center for Nutrition Policy and Promotion (CNPP) develops nutritional education Services (FNS) information and works to disseminate research findings through outreach materials to targeted
populations.500 Dietary guidelines and the Food Pyramid are CNPP’s notable initiatives; both wereupdated in 2005.
U.S. Department of The Department of Defense is responsible for national security.Defense (DOD)
AGENCY PROGRAM/INITIATIVES
To combat the growing obesity problem among U.S. servicemen and women, each of the armedservices has developed programs to promote fitness and health: the Army has Weigh to Stay; theNavy and Marine Corps have ShipShape; the Air Force has Fit to Fight. These programs usenutrition and fitness counseling to move military personnel and their families toward healthier foodchoices, exercise habits, and lifestyles.
Military Health System The U.S. military healthcare system, TRICARE, has a healthy choices initiative called HEALTH(Healthy Eating and Active Living in TRICARE Households) that helps participants reach their desired weight and teaches them how to live a healthier lifestyle. TRICARE members who joinHEALTH receive information on healthy meal planning, create a personalized exercise program, and work with a phone counselor and primary care manager to determine individual weight lossgoals and how to maintain a healthy weight.501
Department of Defense The Department of Defense Education Activity (DoDEA) manages the education programs Education Activity for children of U.S. military personnel and civilian personnel who are stationed at bases at home (DoDEA) and abroad. The 199-school system employees some 8,700 teachers and reaches 88,000 students.
The system is set up to handle the needs of these children who change schools frequently due totheir parents’ assignments. To maintain continuity, the school system teaches from a uniform curriculum and standards. Included in the DoDEA curriculum are lessons on physical activity, nutrition and physical education.502
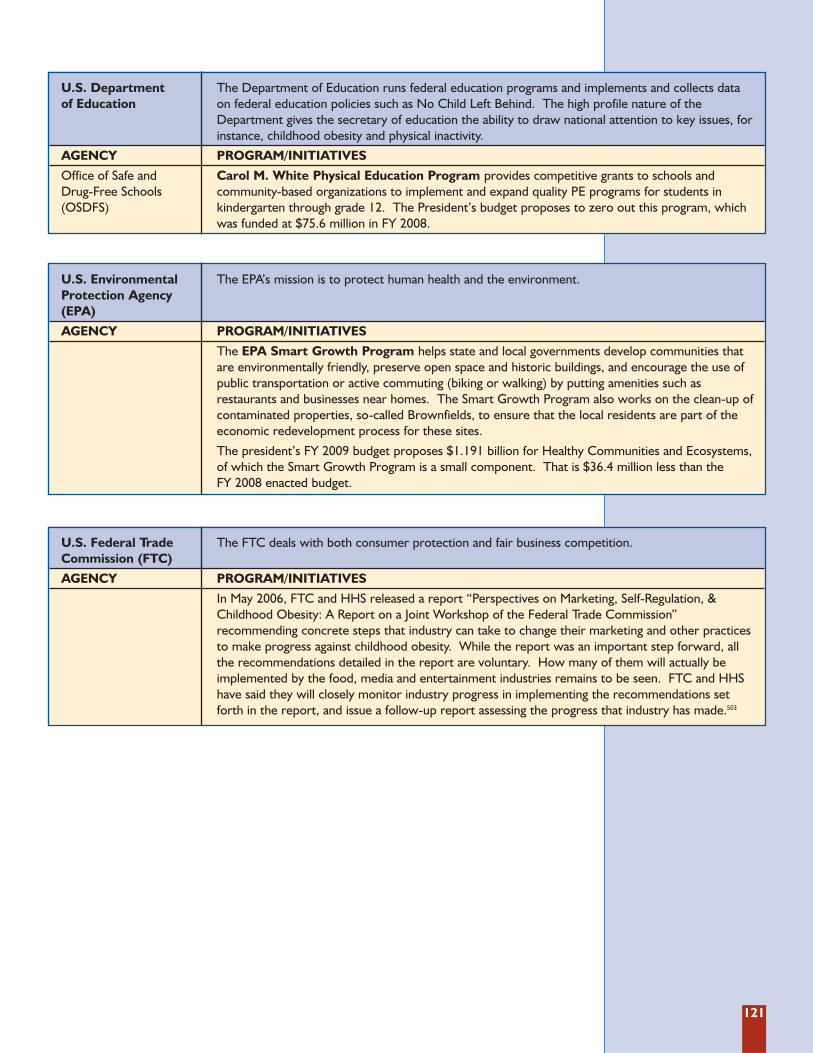
121
U.S. Environmental The EPA’s mission is to protect human health and the environment.Protection Agency (EPA)
AGENCY PROGRAM/INITIATIVES
The EPA Smart Growth Program helps state and local governments develop communities that are environmentally friendly, preserve open space and historic buildings, and encourage the use ofpublic transportation or active commuting (biking or walking) by putting amenities such as restaurants and businesses near homes. The Smart Growth Program also works on the clean-up ofcontaminated properties, so-called Brownfields, to ensure that the local residents are part of theeconomic redevelopment process for these sites.
The president’s FY 2009 budget proposes $1.191 billion for Healthy Communities and Ecosystems,of which the Smart Growth Program is a small component. That is $36.4 million less than the FY 2008 enacted budget.
U.S. Federal Trade The FTC deals with both consumer protection and fair business competition.Commission (FTC)
AGENCY PROGRAM/INITIATIVES
In May 2006, FTC and HHS released a report “Perspectives on Marketing, Self-Regulation, &Childhood Obesity: A Report on a Joint Workshop of the Federal Trade Commission” recommending concrete steps that industry can take to change their marketing and other practicesto make progress against childhood obesity. While the report was an important step forward, all the recommendations detailed in the report are voluntary. How many of them will actually be implemented by the food, media and entertainment industries remains to be seen. FTC and HHShave said they will closely monitor industry progress in implementing the recommendations set forth in the report, and issue a follow-up report assessing the progress that industry has made.503
U.S. Department The Department of Education runs federal education programs and implements and collects data of Education on federal education policies such as No Child Left Behind. The high profile nature of the
Department gives the secretary of education the ability to draw national attention to key issues, forinstance, childhood obesity and physical inactivity.
AGENCY PROGRAM/INITIATIVES
Office of Safe and Carol M. White Physical Education Program provides competitive grants to schools and Drug-Free Schools community-based organizations to implement and expand quality PE programs for students in (OSDFS) kindergarten through grade 12. The President’s budget proposes to zero out this program, which
was funded at $75.6 million in FY 2008.
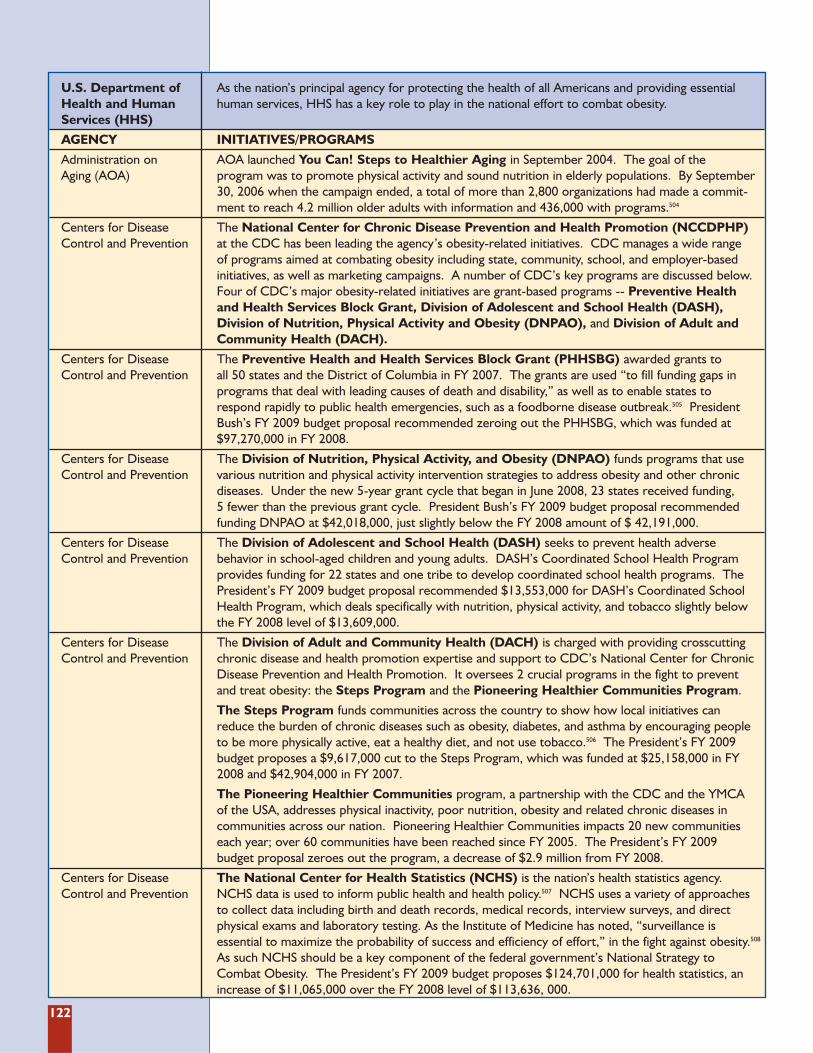
122
U.S. Department of As the nation’s principal agency for protecting the health of all Americans and providing essential Health and Human human services, HHS has a key role to play in the national effort to combat obesity.Services (HHS)
AGENCY INITIATIVES/PROGRAMS
Administration on AOA launched You Can! Steps to Healthier Aging in September 2004. The goal of the Aging (AOA) program was to promote physical activity and sound nutrition in elderly populations. By September
30, 2006 when the campaign ended, a total of more than 2,800 organizations had made a commit-ment to reach 4.2 million older adults with information and 436,000 with programs.504
Centers for Disease The National Center for Chronic Disease Prevention and Health Promotion (NCCDPHP) Control and Prevention at the CDC has been leading the agency’s obesity-related initiatives. CDC manages a wide range
of programs aimed at combating obesity including state, community, school, and employer-based initiatives, as well as marketing campaigns. A number of CDC’s key programs are discussed below.Four of CDC’s major obesity-related initiatives are grant-based programs -- Preventive Health and Health Services Block Grant, Division of Adolescent and School Health (DASH),Division of Nutrition, Physical Activity and Obesity (DNPAO), and Division of Adult andCommunity Health (DACH).
Centers for Disease The Preventive Health and Health Services Block Grant (PHHSBG) awarded grants to Control and Prevention all 50 states and the District of Columbia in FY 2007. The grants are used “to fill funding gaps in
programs that deal with leading causes of death and disability,” as well as to enable states to respond rapidly to public health emergencies, such as a foodborne disease outbreak.505 PresidentBush’s FY 2009 budget proposal recommended zeroing out the PHHSBG, which was funded at$97,270,000 in FY 2008.
Centers for Disease The Division of Nutrition, Physical Activity, and Obesity (DNPAO) funds programs that use Control and Prevention various nutrition and physical activity intervention strategies to address obesity and other chronic
diseases. Under the new 5-year grant cycle that began in June 2008, 23 states received funding, 5 fewer than the previous grant cycle. President Bush’s FY 2009 budget proposal recommendedfunding DNPAO at $42,018,000, just slightly below the FY 2008 amount of $ 42,191,000.
Centers for Disease The Division of Adolescent and School Health (DASH) seeks to prevent health adverse Control and Prevention behavior in school-aged children and young adults. DASH’s Coordinated School Health Program
provides funding for 22 states and one tribe to develop coordinated school health programs. ThePresident’s FY 2009 budget proposal recommended $13,553,000 for DASH’s Coordinated SchoolHealth Program, which deals specifically with nutrition, physical activity, and tobacco slightly belowthe FY 2008 level of $13,609,000.
Centers for Disease The Division of Adult and Community Health (DACH) is charged with providing crosscutting Control and Prevention chronic disease and health promotion expertise and support to CDC’s National Center for Chronic
Disease Prevention and Health Promotion. It oversees 2 crucial programs in the fight to prevent and treat obesity: the Steps Program and the Pioneering Healthier Communities Program.
The Steps Program funds communities across the country to show how local initiatives can reduce the burden of chronic diseases such as obesity, diabetes, and asthma by encouraging peopleto be more physically active, eat a healthy diet, and not use tobacco.506 The President’s FY 2009budget proposes a $9,617,000 cut to the Steps Program, which was funded at $25,158,000 in FY2008 and $42,904,000 in FY 2007.
The Pioneering Healthier Communities program, a partnership with the CDC and the YMCA of the USA, addresses physical inactivity, poor nutrition, obesity and related chronic diseases in communities across our nation. Pioneering Healthier Communities impacts 20 new communitieseach year; over 60 communities have been reached since FY 2005. The President’s FY 2009 budget proposal zeroes out the program, a decrease of $2.9 million from FY 2008.
Centers for Disease The National Center for Health Statistics (NCHS) is the nation’s health statistics agency. Control and Prevention NCHS data is used to inform public health and health policy.507 NCHS uses a variety of approaches
to collect data including birth and death records, medical records, interview surveys, and direct physical exams and laboratory testing. As the Institute of Medicine has noted, “surveillance is essential to maximize the probability of success and efficiency of effort,” in the fight against obesity.508
As such NCHS should be a key component of the federal government’s National Strategy to Combat Obesity. The President’s FY 2009 budget proposes $124,701,000 for health statistics, anincrease of $11,065,000 over the FY 2008 level of $113,636, 000.
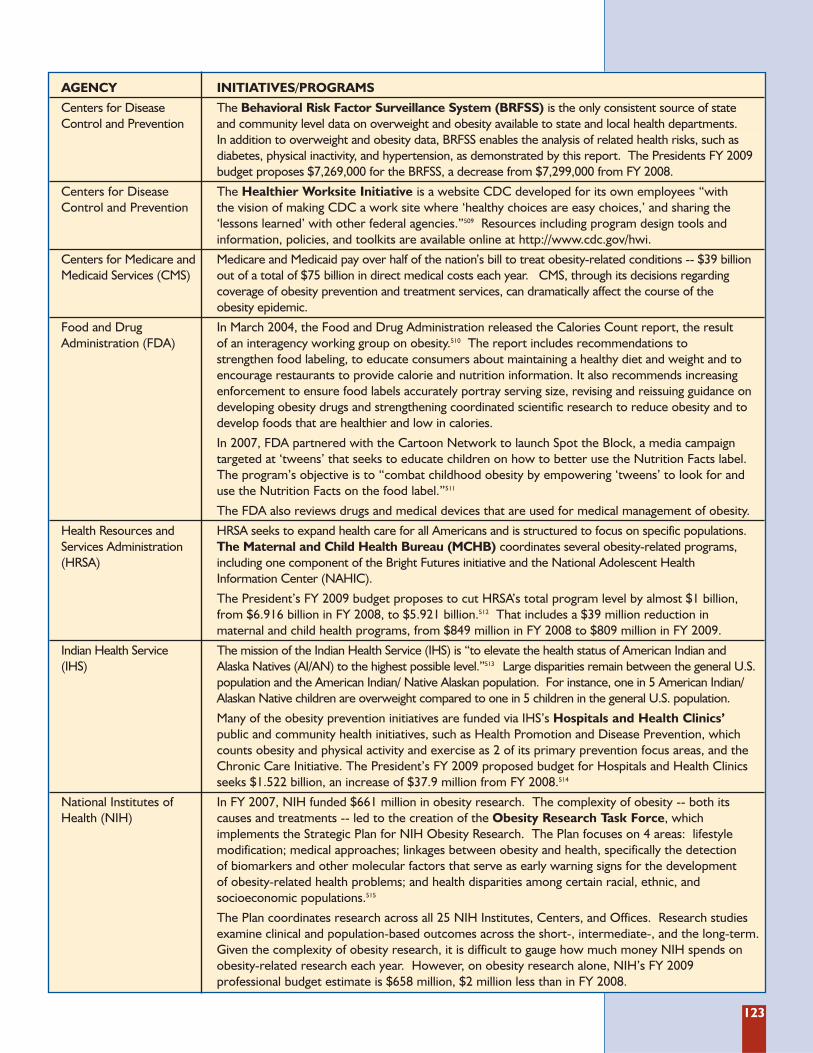
123
AGENCY INITIATIVES/PROGRAMS
Centers for Disease The Behavioral Risk Factor Surveillance System (BRFSS) is the only consistent source of state Control and Prevention and community level data on overweight and obesity available to state and local health departments.
In addition to overweight and obesity data, BRFSS enables the analysis of related health risks, such as diabetes, physical inactivity, and hypertension, as demonstrated by this report. The Presidents FY 2009budget proposes $7,269,000 for the BRFSS, a decrease from $7,299,000 from FY 2008.
Centers for Disease The Healthier Worksite Initiative is a website CDC developed for its own employees “with Control and Prevention the vision of making CDC a work site where ‘healthy choices are easy choices,’ and sharing the
‘lessons learned’ with other federal agencies.”509 Resources including program design tools and information, policies, and toolkits are available online at http://www.cdc.gov/hwi.
Centers for Medicare and Medicare and Medicaid pay over half of the nation’s bill to treat obesity-related conditions -- $39 billion Medicaid Services (CMS) out of a total of $75 billion in direct medical costs each year. CMS, through its decisions regarding
coverage of obesity prevention and treatment services, can dramatically affect the course of the obesity epidemic.
Food and Drug In March 2004, the Food and Drug Administration released the Calories Count report, the result Administration (FDA) of an interagency working group on obesity.510 The report includes recommendations to
strengthen food labeling, to educate consumers about maintaining a healthy diet and weight and toencourage restaurants to provide calorie and nutrition information. It also recommends increasingenforcement to ensure food labels accurately portray serving size, revising and reissuing guidance ondeveloping obesity drugs and strengthening coordinated scientific research to reduce obesity and todevelop foods that are healthier and low in calories.
In 2007, FDA partnered with the Cartoon Network to launch Spot the Block, a media campaign targeted at ‘tweens’ that seeks to educate children on how to better use the Nutrition Facts label.The program’s objective is to “combat childhood obesity by empowering ‘tweens’ to look for and use the Nutrition Facts on the food label.”511
The FDA also reviews drugs and medical devices that are used for medical management of obesity.
Health Resources and HRSA seeks to expand health care for all Americans and is structured to focus on specific populations. Services Administration The Maternal and Child Health Bureau (MCHB) coordinates several obesity-related programs, (HRSA) including one component of the Bright Futures initiative and the National Adolescent Health
Information Center (NAHIC).
The President’s FY 2009 budget proposes to cut HRSA’s total program level by almost $1 billion,from $6.916 billion in FY 2008, to $5.921 billion.512 That includes a $39 million reduction in maternal and child health programs, from $849 million in FY 2008 to $809 million in FY 2009.
Indian Health Service The mission of the Indian Health Service (IHS) is “to elevate the health status of American Indian and (IHS) Alaska Natives (AI/AN) to the highest possible level.”513 Large disparities remain between the general U.S.
population and the American Indian/ Native Alaskan population. For instance, one in 5 American Indian/Alaskan Native children are overweight compared to one in 5 children in the general U.S. population.
Many of the obesity prevention initiatives are funded via IHS’s Hospitals and Health Clinics’ public and community health initiatives, such as Health Promotion and Disease Prevention, whichcounts obesity and physical activity and exercise as 2 of its primary prevention focus areas, and theChronic Care Initiative. The President’s FY 2009 proposed budget for Hospitals and Health Clinicsseeks $1.522 billion, an increase of $37.9 million from FY 2008.514
National Institutes of In FY 2007, NIH funded $661 million in obesity research. The complexity of obesity -- both its Health (NIH) causes and treatments -- led to the creation of the Obesity Research Task Force, which
implements the Strategic Plan for NIH Obesity Research. The Plan focuses on 4 areas: lifestyle modification; medical approaches; linkages between obesity and health, specifically the detection of biomarkers and other molecular factors that serve as early warning signs for the development of obesity-related health problems; and health disparities among certain racial, ethnic, and socioeconomic populations.515
The Plan coordinates research across all 25 NIH Institutes, Centers, and Offices. Research studiesexamine clinical and population-based outcomes across the short-, intermediate-, and the long-term.Given the complexity of obesity research, it is difficult to gauge how much money NIH spends onobesity-related research each year. However, on obesity research alone, NIH’s FY 2009 professional budget estimate is $658 million, $2 million less than in FY 2008.
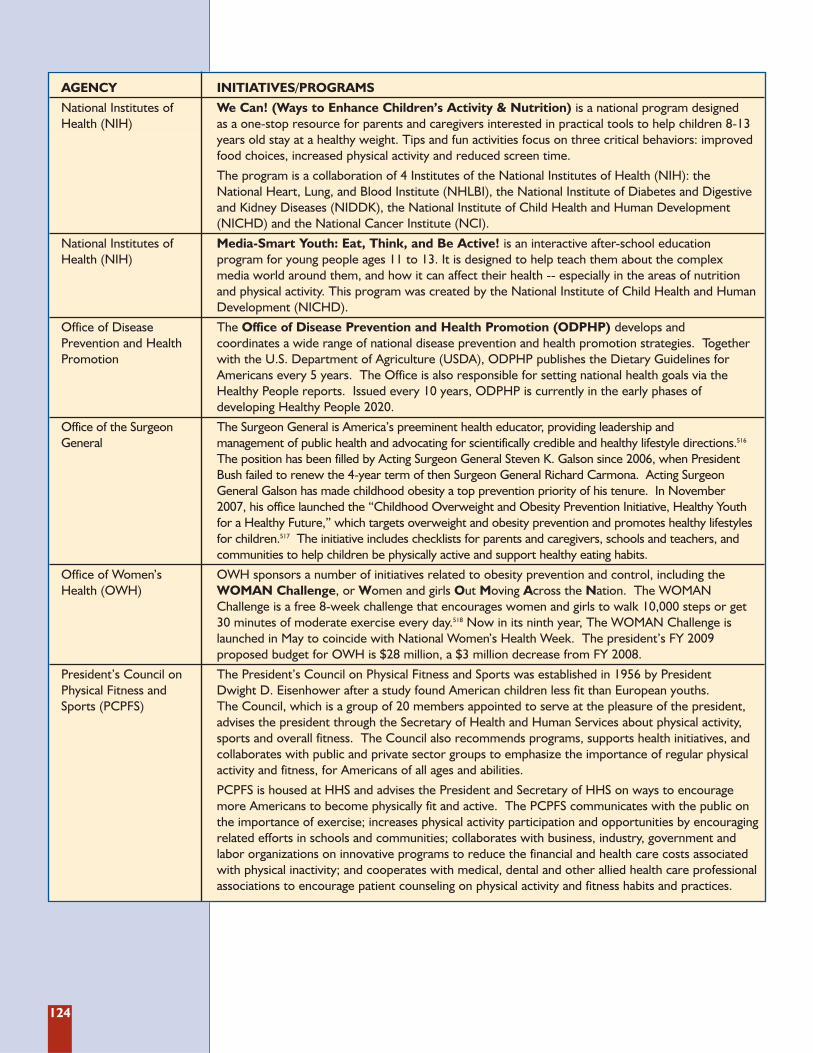
124
AGENCY INITIATIVES/PROGRAMS
National Institutes of We Can! (Ways to Enhance Children’s Activity & Nutrition) is a national program designed Health (NIH) as a one-stop resource for parents and caregivers interested in practical tools to help children 8-13
years old stay at a healthy weight. Tips and fun activities focus on three critical behaviors: improvedfood choices, increased physical activity and reduced screen time.
The program is a collaboration of 4 Institutes of the National Institutes of Health (NIH): the National Heart, Lung, and Blood Institute (NHLBI), the National Institute of Diabetes and Digestiveand Kidney Diseases (NIDDK), the National Institute of Child Health and Human Development(NICHD) and the National Cancer Institute (NCI).
National Institutes of Media-Smart Youth: Eat, Think, and Be Active! is an interactive after-school education Health (NIH) program for young people ages 11 to 13. It is designed to help teach them about the complex
media world around them, and how it can affect their health -- especially in the areas of nutrition and physical activity. This program was created by the National Institute of Child Health and HumanDevelopment (NICHD).
Office of Disease The Office of Disease Prevention and Health Promotion (ODPHP) develops and Prevention and Health coordinates a wide range of national disease prevention and health promotion strategies. Together Promotion with the U.S. Department of Agriculture (USDA), ODPHP publishes the Dietary Guidelines for
Americans every 5 years. The Office is also responsible for setting national health goals via theHealthy People reports. Issued every 10 years, ODPHP is currently in the early phases of developing Healthy People 2020.
Office of the Surgeon The Surgeon General is America’s preeminent health educator, providing leadership and General management of public health and advocating for scientifically credible and healthy lifestyle directions.516
The position has been filled by Acting Surgeon General Steven K. Galson since 2006, when PresidentBush failed to renew the 4-year term of then Surgeon General Richard Carmona. Acting SurgeonGeneral Galson has made childhood obesity a top prevention priority of his tenure. In November 2007, his office launched the “Childhood Overweight and Obesity Prevention Initiative, Healthy Youthfor a Healthy Future,” which targets overweight and obesity prevention and promotes healthy lifestylesfor children.517 The initiative includes checklists for parents and caregivers, schools and teachers, andcommunities to help children be physically active and support healthy eating habits.
Office of Women’s OWH sponsors a number of initiatives related to obesity prevention and control, including the Health (OWH) WOMAN Challenge, or Women and girls Out Moving Across the Nation. The WOMAN
Challenge is a free 8-week challenge that encourages women and girls to walk 10,000 steps or get 30 minutes of moderate exercise every day.518 Now in its ninth year, The WOMAN Challenge islaunched in May to coincide with National Women’s Health Week. The president’s FY 2009 proposed budget for OWH is $28 million, a $3 million decrease from FY 2008.
President’s Council on The President’s Council on Physical Fitness and Sports was established in 1956 by President Physical Fitness and Dwight D. Eisenhower after a study found American children less fit than European youths. Sports (PCPFS) The Council, which is a group of 20 members appointed to serve at the pleasure of the president,
advises the president through the Secretary of Health and Human Services about physical activity,sports and overall fitness. The Council also recommends programs, supports health initiatives, andcollaborates with public and private sector groups to emphasize the importance of regular physicalactivity and fitness, for Americans of all ages and abilities.
PCPFS is housed at HHS and advises the President and Secretary of HHS on ways to encouragemore Americans to become physically fit and active. The PCPFS communicates with the public onthe importance of exercise; increases physical activity participation and opportunities by encouragingrelated efforts in schools and communities; collaborates with business, industry, government andlabor organizations on innovative programs to reduce the financial and health care costs associatedwith physical inactivity; and cooperates with medical, dental and other allied health care professionalassociations to encourage patient counseling on physical activity and fitness habits and practices.
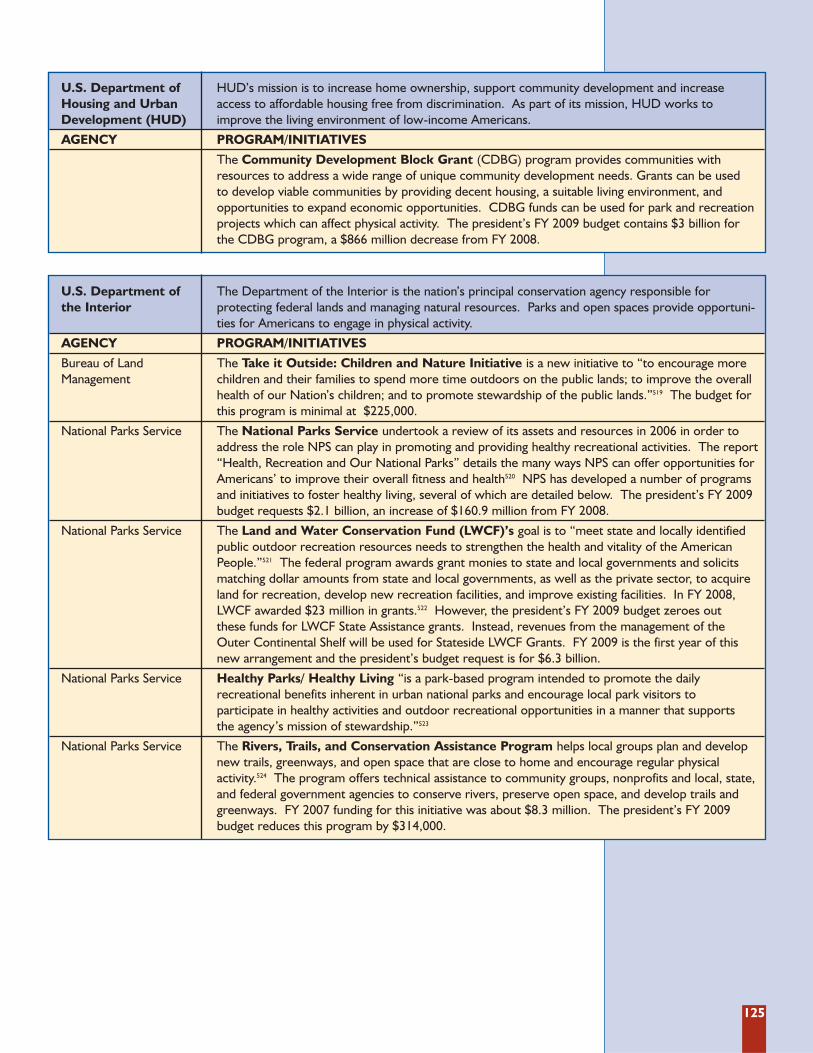
125
U.S. Department of HUD’s mission is to increase home ownership, support community development and increase Housing and Urban access to affordable housing free from discrimination. As part of its mission, HUD works to Development (HUD) improve the living environment of low-income Americans.
AGENCY PROGRAM/INITIATIVES
The Community Development Block Grant (CDBG) program provides communities withresources to address a wide range of unique community development needs. Grants can be used to develop viable communities by providing decent housing, a suitable living environment, and opportunities to expand economic opportunities. CDBG funds can be used for park and recreationprojects which can affect physical activity. The president’s FY 2009 budget contains $3 billion for the CDBG program, a $866 million decrease from FY 2008.
U.S. Department of The Department of the Interior is the nation’s principal conservation agency responsible for the Interior protecting federal lands and managing natural resources. Parks and open spaces provide opportuni-
ties for Americans to engage in physical activity.
AGENCY PROGRAM/INITIATIVES
Bureau of Land The Take it Outside: Children and Nature Initiative is a new initiative to “to encourage more Management children and their families to spend more time outdoors on the public lands; to improve the overall
health of our Nation’s children; and to promote stewardship of the public lands.”519 The budget forthis program is minimal at $225,000.
National Parks Service The National Parks Service undertook a review of its assets and resources in 2006 in order toaddress the role NPS can play in promoting and providing healthy recreational activities. The report“Health, Recreation and Our National Parks” details the many ways NPS can offer opportunities forAmericans’ to improve their overall fitness and health520 NPS has developed a number of programsand initiatives to foster healthy living, several of which are detailed below. The president’s FY 2009budget requests $2.1 billion, an increase of $160.9 million from FY 2008.
National Parks Service The Land and Water Conservation Fund (LWCF)’s goal is to “meet state and locally identifiedpublic outdoor recreation resources needs to strengthen the health and vitality of the AmericanPeople.”521 The federal program awards grant monies to state and local governments and solicitsmatching dollar amounts from state and local governments, as well as the private sector, to acquireland for recreation, develop new recreation facilities, and improve existing facilities. In FY 2008,LWCF awarded $23 million in grants.522 However, the president’s FY 2009 budget zeroes out these funds for LWCF State Assistance grants. Instead, revenues from the management of the Outer Continental Shelf will be used for Stateside LWCF Grants. FY 2009 is the first year of thisnew arrangement and the president’s budget request is for $6.3 billion.
National Parks Service Healthy Parks/ Healthy Living “is a park-based program intended to promote the daily recreational benefits inherent in urban national parks and encourage local park visitors to participate in healthy activities and outdoor recreational opportunities in a manner that supports the agency’s mission of stewardship.”523
National Parks Service The Rivers, Trails, and Conservation Assistance Program helps local groups plan and developnew trails, greenways, and open space that are close to home and encourage regular physical activity.524 The program offers technical assistance to community groups, nonprofits and local, state,and federal government agencies to conserve rivers, preserve open space, and develop trails andgreenways. FY 2007 funding for this initiative was about $8.3 million. The president’s FY 2009budget reduces this program by $314,000.
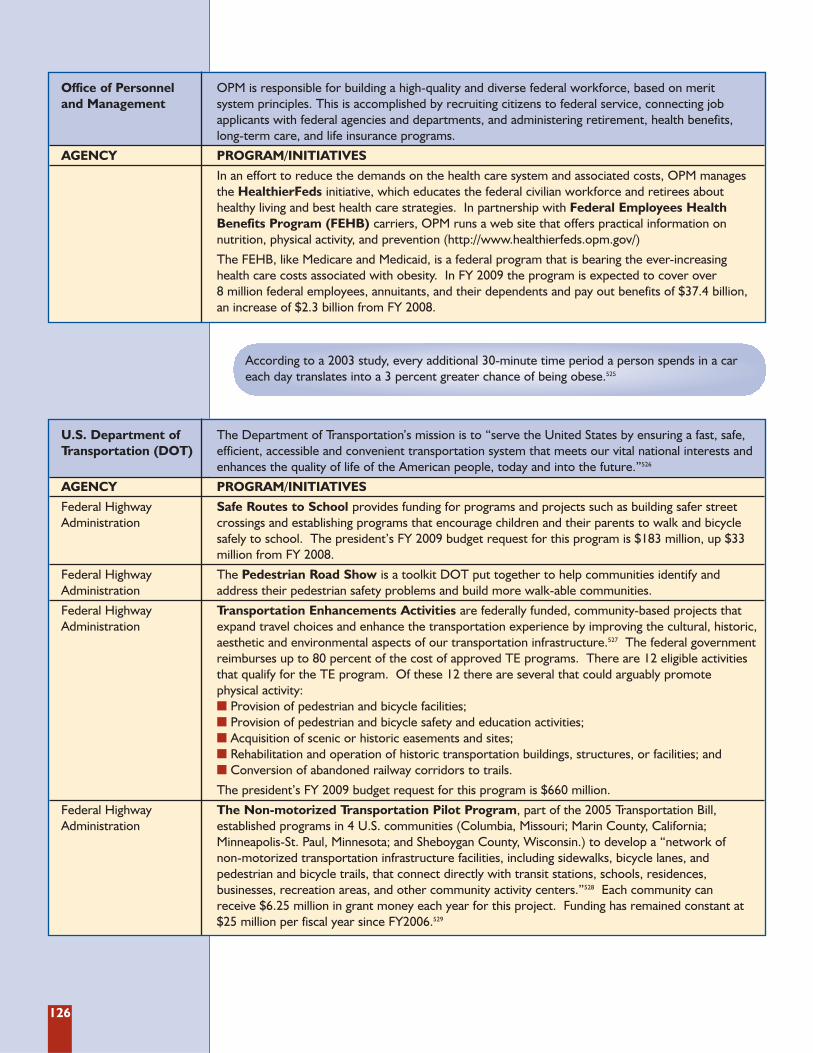
126
Office of Personnel OPM is responsible for building a high-quality and diverse federal workforce, based on merit and Management system principles. This is accomplished by recruiting citizens to federal service, connecting job
applicants with federal agencies and departments, and administering retirement, health benefits, long-term care, and life insurance programs.
AGENCY PROGRAM/INITIATIVES
In an effort to reduce the demands on the health care system and associated costs, OPM manages the HealthierFeds initiative, which educates the federal civilian workforce and retirees about healthy living and best health care strategies. In partnership with Federal Employees Health Benefits Program (FEHB) carriers, OPM runs a web site that offers practical information on nutrition, physical activity, and prevention (http://www.healthierfeds.opm.gov/)
The FEHB, like Medicare and Medicaid, is a federal program that is bearing the ever-increasing health care costs associated with obesity. In FY 2009 the program is expected to cover over 8 million federal employees, annuitants, and their dependents and pay out benefits of $37.4 billion, an increase of $2.3 billion from FY 2008.
U.S. Department of The Department of Transportation’s mission is to “serve the United States by ensuring a fast, safe, Transportation (DOT) efficient, accessible and convenient transportation system that meets our vital national interests and
enhances the quality of life of the American people, today and into the future.”526
AGENCY PROGRAM/INITIATIVES
Federal Highway Safe Routes to School provides funding for programs and projects such as building safer street Administration crossings and establishing programs that encourage children and their parents to walk and bicycle
safely to school. The president’s FY 2009 budget request for this program is $183 million, up $33million from FY 2008.
Federal Highway The Pedestrian Road Show is a toolkit DOT put together to help communities identify and Administration address their pedestrian safety problems and build more walk-able communities.
Federal Highway Transportation Enhancements Activities are federally funded, community-based projects that Administration expand travel choices and enhance the transportation experience by improving the cultural, historic,
aesthetic and environmental aspects of our transportation infrastructure.527 The federal governmentreimburses up to 80 percent of the cost of approved TE programs. There are 12 eligible activitiesthat qualify for the TE program. Of these 12 there are several that could arguably promote physical activity: � Provision of pedestrian and bicycle facilities; � Provision of pedestrian and bicycle safety and education activities; � Acquisition of scenic or historic easements and sites; � Rehabilitation and operation of historic transportation buildings, structures, or facilities; and � Conversion of abandoned railway corridors to trails.
The president’s FY 2009 budget request for this program is $660 million.
Federal Highway The Non-motorized Transportation Pilot Program, part of the 2005 Transportation Bill, Administration established programs in 4 U.S. communities (Columbia, Missouri; Marin County, California;
Minneapolis-St. Paul, Minnesota; and Sheboygan County, Wisconsin.) to develop a “network of non-motorized transportation infrastructure facilities, including sidewalks, bicycle lanes, and pedestrian and bicycle trails, that connect directly with transit stations, schools, residences, businesses, recreation areas, and other community activity centers.”528 Each community can receive $6.25 million in grant money each year for this project. Funding has remained constant at$25 million per fiscal year since FY2006.529
According to a 2003 study, every additional 30-minute time period a person spends in a careach day translates into a 3 percent greater chance of being obese.525
127
The VA serves over 6 million veterans; nearly 70 percent are overweight, of whom approximately 30 percent are obese.531
U.S. Department of The Treasury Department is responsible for promoting economic prosperity and ensuring the Treasury financial security of the United States. Among the Treasury Department’s responsibilities is the regu-
lation of financial markets and tax collection.
AGENCY PROGRAM/INITIATIVES
In the area of tax collection and the tax code, the Department of Treasury is able to issue rulings clar-ifying tax deductions. In fact, in 2002 the Treasury Department issued Revenue Ruling 2002-19 whichchanged the philosophy of the Internal Revenue Service by allowing weight-loss program deductionsfor obesity and as a treatment for hypertension.530 The Treasury Department did not go as far as toextend the tax deduction for exercise programs that are recommended by physicians to fosterweight loss among obese and overweight patients.
U.S. Department of The U.S. Department of Veterans Affairs provides patient care and federal benefits to veterans Veterans Affairs (VA) and their dependents.
AGENCY PROGRAM/INITIATIVES
The VA together with HHS implements HealthierUS Veterans, a program to educate veteransabout the health risks of obesity and diabetes. One component of the HealthierUS Veterans initiative is the MOVE! (Managing Overweight/Obesity for Veterans Everywhere) Program.The MOVE! Program is a weight management and physical activity initiative designed for veteransenrolled in the VA health care system who want assistance with managing their weight. The program relies on evidence-based methods that focus on behavior, nutrition, and physical activity. VA primary care providers give each veteran enrolled in MOVE! a pedometer, a brochure thatexplains how to use the pedometer, and an exercise prescription for recommended physical activity, such as a number of daily steps to walk. All providers have been encouraged to give theirpatients similar activity guidance.532
128
References1 U.S. Centers for Disease Control and Prevention.
“Overweight and Obesity - Introduction.” U.S.Department of Health and Human Services.http://www.cdc.gov/nccdphp/dnpa/obesity/index.htm (accessed June 17, 2008).
2 U.S. Centers for Disease Control and Prevention,National Center for Health Statistics. “Prevalenceof Overweight and Obesity Among Adults: UnitedStates, 2003-2004.” U.S. Department of Health andHuman Services. http://www.cdc.gov/nchs/products/pubs/pubd/hestats/overweight/overwght_adult_03.htm (accessed June 17, 2008).
3 U.S. Department of Health and Human Services,National Center for Health Statistics. Prevalence ofOverweight Among Children and Adolescents: UnitedStates, 1999. Hyattsville, MD: National Center forHealth Statistics; 2001. http://www.cdc.gov/nchs/products/pubs/pubd/hestats/overwght99.htm..(accessed July 14, 2008).
4 Ogden, C.L., M.D. Carroll, and K.M. Flegal. “HighBody Mass Index for Age among U.S. Children andAdolescents, 2003-2006.” Journal of the AmericanMedical Association 299, no. 20 (2008): 2401-2405.
5 Gregg, E.W., J. Yiling, B.L. Cadwell, et al.“Secular Trends in Cardiovascular Disease RiskFactors According to Body Mass Index in USAdults.” Journal of the American Medical Association293, no. 15 (2005): 1868-1874.
6 National Institutes of Diabetes and Digestive andKidney Diseases. “Do You Know the Health Risksof being Overweight?” U.S. Department of Healthand Human Services.http://win.niddk.nih.gov/publications/health_risks.htm (accessed April 18, 2007).
7 American Heart Association and AmericanStroke Association. Heart Disease and StrokeStatistics - 2008 Update. Dallas, TX: AmericanHeart Association, 2008.
8 Beydoun, M.A., H.A. Beydoun, and Y. Wang.“Obesity and Central Obesity as Risk Factors forIncident Dementia and Its Subtypes: A SystematicReview and Meta-Analysis.” Obesity Review 9, no. 3(2008): 204-218.
9 Petry, N. M., D. Barry, R. H. Pietrzak, and J. A.Wagner. “Overweight and Obesity Are Associatedwith Psychiatric Disorders: Results from theNational Epidemiologic Survey on Alcohol andRelated Conditions.” Psychosomatic Medicine 70,no. 3 (2008): 288-297.
10 Wang, Y., X. Chen, Y. Song, B. Caballero, andL.J. Cheskin. “Association between Obesity andKidney Disease: A Systematic Review and Meta-Analysis.” Kidney International 73, no. 1 (2008):19-33.
11 Trust for America’s Health. Healthy Women: ThePath to Healthy Babies, The Case for PreconceptionCare. Washington, D.C.: TFAH, 2008.
12 American Diabetes Association. “Total Prevalenceof Diabetes & Pre-Diabetes.” American DiabetesAssociation. http://diabetes.org/diabetes-statis-tics/prevalence.jsp (accessed April 18, 2008).
13 Whitaker, R.C., J.A. Wright, M.S. Pepe, K.D.Seidel, and W.H. Dietz. “Predicting Obesity inYoung Adulthood from Childhood and ParentalObesity.” New England Journal of Medicine 37, no.13 (1997): 869-873.
14 Serdula, M.K., D. Ivery, R.J. Coates, D.S. Freedman,D.F. Williamson, and T. Byers. “Do Obese Childrenbecome Obese Adults? A Review of the Literature.”Preventive Medicine 22, no.2 (1993):167-177.
15 U.S. Centers for Disease Control and Prevention.“Overweight and Obesity - Consequences.” U.S.Department of Health and Human Services.http://www.cdc.gov/nccdphp/dnpa/obesity/childhood/consequences.htm (accessed June17, 2008).
16 U.S. Centers for Disease Control and Prevention.“Preventing Obesity and Chronic Diseasesthrough Good Nutrition and Physical Activity.”U.S. Department of Health and Human Services,http://www.cdc.gov/nccdphp/publications/factsheets/Prevention/obesity.htm. (accessedApril 14, 2008).
17 Ogden, C.L., M.D. Carroll, and K.M. Flegal. “HighBody Mass Index for Age among U.S. Children andAdolescents, 2003-2006.” Journal of the AmericanMedical Association 299, no. 20 (2008): 2401-2405.
18 Wang, Y. and M.A. Beydoun. “The ObesityEpidemic in the United States - Gender, Age,Socioecononomic, Racial/Ethnic, andGeographic Characteristics: A SystematicReview and Meta-Regression Analysis.”Epidemiologic Reviews 29 (2007): 6-28.
19 U.S. Food and Drug Administration. “The Factsabout Weight Loss Products and Programs.” U.S.Department of Health and Human Services.http://www.cfsan.fda.gov/~dms/wgtloss.html(accessed June 5, 2008).
20 The CPT code set, maintained by the AmericanMedical Association, is used by physicians andother health care providers to bill for medicalservices and procedures. Obesity-relatedHCPCS (Health Care Financing AdministrationCommon Procedure Coding Systems) Level IIcodes were also selected. These codes are usedfor products, supplies, and services not includ-ed in the CPT codes but often covered byMedicare and other insurers.
21 U.S. Centers for Disease Control and Prevention,National Center on Vital Statistics. Health, UnitedStates, 2003. Atlanta, GA: U.S. Department ofHealth and Human Services, 2003.
22 Ibid.
23 Stunkard, A. J. and T. A. Wadden, eds. Obesity:Theory and Therapy. Second ed. New York, NY:Raven Press, 1993.
24 National Research Council. Diet and Health:Implications for Reducing Chronic Disease Risk.Washington, D.C.: National Academy Press, 1989.
25 Ibid.
26 Barlow, S.E. “Expert CommitteeRecommendations Regarding the Prevention,Assessment, and Treatment of Child andAdolescent Overweight and Obesity: SummaryReport.” Pediatrics 120, suppl 4 (2007): S164-S192.
27 Squires, S. “One Number Doesn’t Fit All.” TheWashington Post. July 5, 2005.
28 Ibid.
29 Ibid.
30 Parker-Pope, T. “Watch Your Girth.” The NewYork Times, May 13, 2008.
31 Ibid.
32 Ibid.
129
33 Freedman, D. S., L. K. Khan, M. K. Serdula, W.H. Dietz, S. R. Srinivasan, and G. S. Berenson.“The Relation of Childhood BMI to AdultAdiposity: The Bogalusa Heart Study.” Pediatrics115, no. 1 (2005): 22-27.
34 Freedman, D. S., H. S. Kahn, Z. Mei, L. M.Grummer-Strawn, W. H. Dietz, S. R. Srinivasan,and G. S. Berenson. “Relation of Body Mass Indexand Waist-to-Height Ratio to CardiovascularDisease Risk Factors in Children and Adolescents:The Bogalusa Heart Study.” The American Journalof Clinical Nutrition 86, no. 1 (2007): 33-40.
35 Must, A., J. Spadano, E. H. Coakley, A. E. Field,G. Colditz, and W. H. Dietz. “The DiseaseBurden Associated with Overweight andObesity.” The Journal of the American MedicalAssociation 282, no. 16 (1999): 1523-1529.
36 Parker-Pope, T. “Watch Your Girth.” The NewYork Times, May 13, 2008.
37 American Medical Association (AMA). ExpertCommittee Recommendations on the Assessment,Prevention, and Treatment of Child and Adolescent Over weight and Obesity. Chicago, IL: AMA, 2007,http://www.ama-assn.org/ama1/pub/upload/mm/433/ped_obesity_recs.pdf (accessed April 22, 2008).
38 Ogden, C.L., M.D. Carroll, and K.M. Flegal.“High Body Mass Index for Age among U.S.Children and Adolescents, 2003-2006.” Journalof the American Medical Association 299, no. 20(2008): 2401-2405.
39 Ebbeling, C.B. and D.S. Ludwig. “TrackingPediatric Obesity: An Index of Uncertainty?”Journal of the American Medical Association 299,no. 20 (2008): 2442-2443.
40 U.S. Department of Health and Human Services,Health Resources and Services Administration,Maternal and Child Health Bureau. NationalSurvey of Children’s Health 2003. Rockville, MD:U.S. Department of Health and Human Services,2005, http://www.mchb.hrsa.gov/overweight/techapp.htm (accessed April 22, 2008).
41 U.S. Centers for Disease Control andPrevention. “Youth Risk Behavior Surveillance -- United States, 2007.” Morbidity and MortalityWeekly Report 57, no. SS-4 (2008): 1-136.
42 Polhamus, B., K. Dalenius, E. Borland, B. Smith,and L. Grummer-Strawn. Pediatric NutritionSurveillance 2006 Report. Atlanta, GA: U.S.Department of Health and Human Services,Centers for Disease Control and Prevention, 2007.
43 Ezzati, M., H. Martin, S. Skjold, S. VanderHoorn, and C. J. Murray. “Trends in Nationaland State-Level Obesity in the USA afterCorrection for Self-Report Bias: Analysis ofHealth Surveys.” Journal of the Royal Society ofMedicine 99, no. 5 (May, 2006): 250-257.
44 Putnam, J., J. Allshouse, and L. S. Kantor. “U.S.per Capita Food Supply Trends: More Calories,Refined Carbohydrates, and Fats.” Food Review25, no. 3 (2002): 1-14.
45 National Institutes of Diabetes and Digestive andKidney Diseases. “Do You Know the Health Risks ofbeing Overweight?” U.S. Department of Health andHuman Services. http://win.niddk.nih.gov/publications/health_risks.htm (accessed April 18, 2007).
46 Cowie, C.C., K.F. Rust, D.D. Byrd-Hold, et al.“Prevalence of Diabetes and Impaired FastingGlucose in Adults in the U.S. Population: NationalHealth and Nutrition Examination Survey 1999-2002.” Diabetes Care 29, no. 6 (2006): 1263-1268.
47 Ibid.
48 U.S. Centers for Disease Control and Prevention.“Number of People with Diabetes Continues toIncrease.” U.S. Department of Health andHuman Services. http://cdc.gov/Features/DiabetesFactSheet/ (accessed June 26, 2008).
49 U.S. Centers for Disease Control and Prevention.CDC Protecting Health for Life: The State of the CDC,Fiscal Year 2004. Atlanta, GA: U.S. Department ofHealth and Human Services, 2005.
50 U.S. Centers for Disease Control and Prevention.“Number of People with Diabetes Continues toIncrease.” U.S. Department of Health andHuman Services. http://cdc.gov/Features/DiabetesFactSheet/ (accessed June 26, 2008).
51 Narayan, K. M., J. P. Boyle, L. S. Geiss, J. B.Saaddine, and T. J. Thompson. “Impact ofRecent Increase in Incidence on FutureDiabetes Burden: U.S., 2005-2050.” Diabetes Care29, no. 9 (Sep, 2006): 2114-2116.
52 American Diabetes Association. “Total Prevalenceof Diabetes & Pre-Diabetes.” American DiabetesAssociation. http://diabetes.org/diabetes-statis-tics/prevalence.jsp (accessed April 18, 2008).
53 Ibid.
54 The Diabetes Prevention Program ResearchGroup. “The Diabetes Prevention Program.”Diabetes Care 25, no. 12 (2002): 2165-2171.
55 U.S. Centers for Disease Control and Prevention.“National Diabetes Fact Sheet - General Infor -mation.” U.S. Department of Health and HumanServices. http://www.cdc.gov/diabetes/pubs/general05.htm#what (accessed April 21, 2008).
56 Kaufman, F.R. “Type 2 Diabetes in Children andYoung Adults: A ‘New Epidemic’.” ClinicalDiabetes 20, no. 4 (October 1, 2002): 217-218.
57 Ibid.
58 American Diabetes Association. “PreventingType 2 Diabetes in Children and Teens.” DiabetesSpectrum 18, no. 4 (October 1, 2005): 249-250.
59 Cavallo, J. “Who Has Diabetes?” Juvenile DiabetesResearch Foundation Countdown (Spring 2006): 10-19.
60 Writing Group for the SEARCH for Diabetes inYouth Study Group, D. Dabelea, R. A. Bell, R. B.D’Agostino Jr, G. Imperatore, J. M. Johansen, B.Linder, et al. “Incidence of Diabetes in Youth inthe United States.” The Journal of the AmericanMedical Association 297, no. 24 (2007): 2716-2724.
61 Kaufman, F.R. “Type 2 Diabetes in Children andYoung Adults: A ‘New Epidemic’.” ClinicalDiabetes 20, no. 4 (October 1, 2002): 217-218.
62 American Diabetes Association. “Total Prevalenceof Diabetes & Pre-Diabetes.” American DiabetesAssociation. http://diabetes.org/diabetes-statis-tics/prevalence.jsp (accessed April 18, 2008).
63 U.S. Department of Health and Human Services,Office of Disease Prevention and Health Promotion.“Physical Activity and Fitness-Improving Health,Fitness, and Quality Of Life through Daily PhysicalActivity.” Prevention Report, 16, no. 4 (July 2002): 1-15.http://odphp.osophs.dhhs.gov/pubs/prevrpt/02Volume16/Iss4Vol16.pdf (accessed May 12, 2008).
130
64 American Heart Association. Heart Disease andStroke Statistics - 2006 Update. Dallas, TX:American Heart Association, 2006.
65 Ibid.
66 National Institutes of Diabetes and Digestive andKidney Diseases. “Do You Know the Health Risksof being Overweight?” U.S. Department of Healthand Human Services. http://win.niddk.nih.gov/publications/health_risks.htm (accessed April 18,2007).
67 Ibid.
68 The Obesity Society. “Obesity Statistics - U.S.Trends.” The Obesity Society.http://www.obesity.org/statistics/obesity_trends.asp (accessed April 18, 2008).
69 National Institutes of Diabetes and Digestive andKidney Diseases. “Do You Know the Health Risksof being Overweight?” U.S. Department of Healthand Human Services. http://win.niddk.nih.gov/publications/health_risks.htm (accessed April 18,2007).
70 U.S. Centers for Disease Control and Prevention.“Obesity in the News: Helping Clear the Confusion.”Power Point Presentation, May 25, 2005.
71 American Cancer Society. Cancer Facts and Figures2007. Atlanta, GA: American Cancer Society, 2007.
72 U.S. Centers for Disease Control and Prevention.“Obesity in the News: Helping Clear the Confusion.”Power Point Presentation, May 25, 2005.
73 Beydoun, M.A., H.A. Beydoun, and Y. Wang.“Obesity and Central Obesity as Risk Factors forIncident Dementia and Its Subtypes: ASystematic Review and Meta-Analysis.” ObesityReview 9, no. 3 (2008): 204-218.
74 Petry, N. M., D. Barry, R. H. Pietrzak, and J. A.Wagner. “Overweight and Obesity AreAssociated with Psychiatric Disorders: Resultsfrom the National Epidemiologic Survey onAlcohol and Related Conditions.” PsychosomaticMedicine 70, no. 3 (2008): 288-297.
75 Ibid.
76 Wang, Y., X. Chen, Y. Song, B. Caballero, and L.J.Cheskin. “Association between Obesity and KidneyDisease: A Systematic Review and Meta-Analysis.”Kidney International 73, no. 1 (2008): 19-33.
77 Ibid.
78 Felson, D.T., and Y. Zhang. “An Update on theEpidemiology of Knee and Hip Osteoarthritiswith a View to Prevention.” Arthritis andRheumatism 41, no. 8 (1998):1343-1355.
79 U.S. Centers for Disease Control and Prevention.“NHIS Arthritis Surveillance.” U.S. Department ofHealth and Human Services. http://www.cdc.gov/arthritis/data_statistics/national_data_nhis.htm#excess (accessed June 26, 2008).
80 Warner, J. “Small Weight Loss Takes BigPressure off Knee.” WebMD Health News.http://www.webmd.com/osteoarthritis/news/20050629/small-weight-loss-takes-pressure-off-knee (accessed June 26, 2008).
81 Ogden, C.L., M.D. Carroll, and K.M. Flegal.“High Body Mass Index for Age among U.S.Children and Adolescents, 2003-2006.” Journalof the American Medical Association 299, no. 20(2008): 2401-2405.
82 Institute of Medicine (IOM). Childhood Obesityin the United States: Facts and Figures.Washington, D.C.: IOM, September 2004.
83 Daniels, S.R., F.R. Greer and the Committee onNutrition. “Lipid Screening and CardiovascularHealth in Childhood.” Pediatrics 122, no. 1(2008): 198-208.
84 U.S. Department of Health and HumanServices (USDHHS). The Surgeon General’s Call toAction to Prevent and Decrease Overweight andObesity. Washington, D.C.: USDHHS, 2001.
85 Ibid.
86 Levine, S., B. Maloney, B. Schulte, and R. Stein.“How Obesity Harms a Child’s Body.” TheWashington Post, May 18, 2008.
87 American College of Obstetricians andGynecologists. Adolescents and Obesity - A ResourceGuide. Washington, D.C.: American College ofObstetricians and Gynecologists, 2007.http://www.acog.org/departments/AdolescentHealthCare/AdolescentsandObesity.pdf(accessed May 28, 2008).
88 Trust for America’s Health. Healthy Women: ThePath to Healthy Babies, The Case for PreconceptionCare. Washington, D.C.: TFAH, 2008.
89 U.S. Centers for Disease Control andPrevention. “Recommendations to ImprovePreconception Health and Health Care-UnitedStates.” Morbidity and Mortality Weekly Report 55,no. 4 (2006): RR-6.
90 Chu, S.Y., D.J. Bachman, W.M. Callaghan, et al.“Association between Obesity during Pregnancyand Increased Use of Health Care.” New EnglandJournal of Medicine 358, no. 14, (April 2008):1444-1453.
91 Ibid.
92 U.S. Department of Health and Human Servicesand U.S. Department of Agriculture. DietaryGuidelines for Americans, 2005. 6th Edition,Washington, D.C.: U.S. Government PrintingOffice, 2005
93 Centers for Disease Control and Prevention.Physical Activity for Everyone. http://www.cdc.gov/nccdphp/dnpa/physical/everyone/recommendations/older_adults.htm (accessed July 1, 2008).
94 U.S. Department of Health and HumanServices and U.S. Department of Agriculture.Dietary Guidelines for Americans, 2005. 6thEdition, Washington, DC: U.S. GovernmentPrinting Office, January 2005
95 U.S. Centers for Disease Control andPrevention. Behavioral Risk Factor SurveillanceSystem Survey Data. Atlanta, GA: U.S. Departmentof Health and Human Services, 2006.
96 U.S. Centers for Disease Control and Prevention.Behavioral Risk Factor Surveillance System SurveyData . Atlanta, GA: U.S. Department of Healthand Human Services, 2005.
97 Blair, S.N. “The Importance of Fitness in Childrenand Adults.” Presentation at the IOM AnnualMeeting, October 16, 2000. http://www.iom.edu/CMS/7622/7625.aspx (accessed April 18, 2008).
98 U.S. Department of Health and Human Services,Public Health Service, Centers for Disease Controland Prevention, National Center for ChronicDisease Prevention and Health Promotion, andDivision of Nutrition and Physical Activity. PromotingPhysical Activity: A Guide for Community Action. Vol. 1.Champaign, IL: Human Kinetics, 1999.
131
99 U.S. Centers for Disease Control and Prevention.“Trends in Leisure-Time Physical Inactivity byAge, Sex, and race/ethnicity—United States,1994-2004.” Morbidity and Mortality Weekly Report54, no. 39 (Oct 7, 2005): 991-994.
100 U.S. Department of Health and HumanServices, Public Health Service, Centers forDisease Control and Prevention, NationalCenter for Chronic Disease Prevention andHealth Promotion, and Division of Nutritionand Physical Activity. Promoting Physical Activity:A Guide for Community Action. Vol. 1.Champaign, IL: Human Kinetics, 1999.
101 Ibid.
102 Nader, P.R., R.H. Bradley, R.M. Houts, S. L.McRitchie, and M. O’Brien. “Moderate-to-Vigorous Physical Activity from Ages 9 to 15Years.” Journal of the American Medical Association300, no. 3 (2008): 295-305.
103 U.S. Centers for Disease Control andPrevention. “Youth Risk Behavior Surveillance-- United States, 2007.” Morbidity and MortalityWeekly Report 57, no. SS-4 (2008): 1-136.
104 Ibid.
105 Ibid.
106 Ibid.
107 Ibid.
108 Exercise is Medicine. A Newsletter Promoting theBenefits of Activity. Volume 1, Spring 2008.
109 Andreyeva, T., R. Puhl, and K.D. Brownell.“Changes in Perceived Weight Discriminationamong Americans: 1995-1996 through 2004-2006.” Obesity 16, no. 5 (2008):1129-1134.
110 Roehling, M.V., P.V. Roehling, and S. Pichler.“The Relationship between Body Weight andPerceived Weight-Related Employment Discrim -ination: The Role of Sex and Race.” Journal ofVocational Behavior, 71, no. 2 (2007): 300-318.
111 Pingitore, R., R. Dugoni, S. Tindale, and B.Spring. “Bias against Overweight Job Applicantsin a Simulated Employment Interview.” Journalof Applied Psychology 79, no. 6 (1994): 909-917.
112 Baum, C.L. and W.F. Ford. “The Wage Effectsof Obesity: A Longitudinal Study.” HealthEconomics 13, no. 9 (2004):885-899.
113 Rudd Center for Food Policy and Obesity.Weight Bias: The Need for Public Policy. NewHaven, CT: Yale University, 2008.
114 Ibid.
115 Neumark-Sztainer, D., M. Story, and T. Harris.“Beliefs and Attitudes about Obesity amongTeachers and School Health Care ProvidersWorking with Adolescents.” Journal of NutritionEducation 31, no. 1 (1999): 3-9.
116 O’Brien, K.S., J.A. Hunter, and M. Banks. “ImplicitAnti-Fat Bias in Physical Educators: PhysicalAttributes, Ideology, and Socialisation.” InternationalJournal of Obesity 31, no. 2 (2007): 308-314.
117 Canning, H. and J. Mayer. “Obesity-Its PossibleEffects on College Acceptance.” New EnglandJournal of Medicine 275 (1966): 1172-1174.
118 Rudd Center for Food Policy and Obesity.Weight Bias: The Need for Public Policy. NewHaven, CT: Yale University, 2008.
119 Ibid.
120 Ibid.
121 Amy, N.K., A. Aalborg, P. Lyons, and LKeranen. “Barriers to Routine GynecologicalCancer Screening for White and African-American Obese Women.” International Journalof Obesity 30, no. 1 (2006): 147-155.
122 Olson, C.L., H.D. Schumaker, and B.P Yawn.“Overweight Women Delay Medical Care.”Archives of Family Medicine 3, no. 10 (1994): 888-892.
123 Fontaine, K.R., M.S. Faith, D.B. Allison, and L.JCheskin. “Body Weight and Health Care amongWomen in the General Population.” Archives ofFamily Medicine, 7, no. 4 (1998): 381-384.
124 Rand, C.S., and A.M. Macgregor. “Morbidly ObesePatients’ Perceptions of Social Discrim inationBefore and After Surgery for Obesity.” SouthernMedical Journal 83, no. 12 (1990): 1398-1395.
125 Schwimmer J.B., T.M. Burwinkle, and J.W.Varni. “Health-Related Quality of Life ofSeverely Obese Children and Adolescents.”Journal of the American Medical Association 289,no. 14 (2003): 1851-1853.
126 U.S. Department of Health and HumanServices and U.S. Department of Agriculture.Dietary Guidelines for Americans, 2005. 6thEdition, Washington, D.C.: U.S. GovernmentPrinting Office, 2005
127 McGinnis, M. J. Obesity: An American Public HealthEpidemic, Strategies to Better Understand it and ChangeAmerica’s Behavior. Washington, D.C.: NationalInstitute for Health Care Management, 2004.
128 Putnam, J., J. Allshouse, and L. S. Kantor. “U.S.per Capita Food Supply Trends: More Calories,Refined Carbohydrates, and Fats.” Food Review25, no. 3 (2002): 1-14.
129 U.S. Centers for Disease Control and Prevention.“Trends in Intake of Energy and Macronutrients—United States, 1971-2000.” Morbidity andMortality Weekly Report 53, no. 4 (2004): 80-82.
130 Briefel, R. R. and C. L. Johnson. “SecularTrends in Dietary Intake in the United States.”Annual Review of Nutrition 24, (2004): 401-431.
131 Nielsen, S. J. and B. M. Popkin. “Patterns andTrends in Food Portion Sizes, 1977-1998.”Journal of the American Medical Association 289,no. 4 (2003): 450-453.
132 Putnam, J., J. Allshouse, and L. S. Kantor.“U.S. per Capita Food Supply Trends: MoreCalories, Refined Carbohydrates, and Fats.”Food Review 25, no. 3 (2002): 1-14.
133 Ibid.
134 Ibid.
135 Ibid.
136 Ibid.
137 Cleveland, L. National Food Consumption Survey,1977-78. Washington, D.C.: U.S. Departmentof Agriculture, 1979.
138 U.S. Centers for Disease Control and Prevention,National Center for Health Statistics. “DHHS-USDA Dietary Survey Integration - What We Eat inAmerica.” U.S. Department of Health and HumanServices, http://www.cdc.gov/nchs/about/major/nhanes/faqs.htm (accessed April 18, 2008).
139 U.S. Centers for Disease Control and Prevention,National Center for Health Statistics. Health,United States, 2007: With Chartbook on Trends in theHealth of Americans. Washington, D.C.: U.S.Department of Health and Human Services, 2007.
132
140 Ibid.
141 Segal, D. “Objects on Your Plate May BeSmaller Than They Appear.” The WashingtonPost, April 13, 2008.
142 Pollan, M. “Supersize Me Organically.” The NewFarm. http://www.newfarm.org/features/2005/0805/pollen/index2_print.shtml. (accessedMay 22, 2008).
143 Ibid.
144 Martin, A. “Will Diners Swallow This?” TheNew York Times, March 25, 2007.
145 Ibid.
146 U.S. Centers for Disease Control andPrevention, National Center for HealthStatistics. “Calorie Consumption on the Risein United States, Particularly Among Women.”News Release, February 5, 2004.http://www.cdc.gov/nchs/PRESSROOM/04news/calorie.htm (accessed May 22, 2008).
147 Martin, A. “Will Diners Swallow This?” TheNew York Times, March 25, 2007.
148 Ibid.
149 U.S. Centers for Disease Control and Prevention.“Preventing Obesity and Chronic DiseasesThrough Good Nutrition and Physical Activity.”U.S. Department of Health and Human Services,http://www.cdc.gov/nccdphp/publications/factsheets/Prevention/obesity.htm. (accessedApril 14, 2008).
150 Ibid.
151 Rosen, B. and L. Barrington. Weights & Measures:What Employers Should Know about Obesity. NewYork, NY: The Conference Board, April 2008.
152 Ibid.
153 Ostbye, T., J. M. Dement, and K. M. Krause.“Obesity and Workers’ Compensation: Resultsfrom the Duke Health and Safety SurveillanceSystem.” Archives of Internal Medicine 167, no. 8(2007): 766-773.
154 The Robert Wood Johnson Foundation, theAmerican Stroke Association, and theAmerican Heart Association. A Nation at Risk:Obesity in the United States, A Statistical Sourcebook.Dallas, TX: American Heart Association, 2005.http://www.americanheart.org/downloadable/heart/1114880987205NationAtRisk.pdf(accessed April 14, 2008).
155 Pronk, N. P., B. Martinson, R. C. Kessler, A. L.Beck, G. E. Simon, and P. Wang. “TheAssociation between Work Performance andPhysical Activity, Cardiorespiratory Fitness, andObesity.” Journal of Occupational andEnvironmental Medicine 46, no. 1 (2004): 19-25.
156 Ostbye, T., J. M. Dement, and K. M. Krause.“Obesity and Workers’ Compensation: Resultsfrom the Duke Health and Safety SurveillanceSystem.” Archives of Internal Medicine 167, no. 8(2007): 766-773.
157 Pronk, N. P., B. Martinson, R. C. Kessler, A. L.Beck, G. E. Simon, and P. Wang. “TheAssociation between Work Performance andPhysical Activity, Cardiorespiratory Fitness, andObesity.” Journal of Occupational andEnvironmental 46, no. 1 (2004): 19-25.
158 Aldana, S. G. and N. P. Pronk. “Health PromotionPrograms, Modifiable Health Risks, andEmployee Absenteeism.” Journal of Occupationaland Environmental 43, no. 1 (2001): 36-46.
159 Gordian Health Solutions. Managing theObesity Problem: A Case Study with MeasurableResults. Nashville, TN: Gordian HealthSolutions, 2007.
160 Wang, F., T. McDonald, L. J. Champagne, andD. W. Edington. “Relationship of Body MassIndex and Physical Activity to Health Care Costsamong Employees.” Journal of Occupational andEnvironmental Medicine 46, no. 5 (2004): 428-436.
161 Burton, W. N., C. Y. Chen, A. B. Schultz, and D.W. Edington. “The Economic Costs Associatedwith Body Mass Index in a Workplace.” Journalof Occupational and Environmental Medicine 40,no. 9 (1998): 786-792.
162 Xiang, H., G. A. Smith, J. R. Wilkins, G. Chen,S. G. Hostetler, and L. Stallones. “Obesity andRisk of Nonfatal Unintentional Injuries.”American Journal of Preventive Medicine 29, no. 1(2005): 41-45.
163 Ostbye, T., J. M. Dement, and K. M. Krause.“Obesity and Workers’ Compensation: Resultsfrom the Duke Health and Safety SurveillanceSystem.” Archives of Internal Medicine 167, no. 8(2007): 766-773.
164 Ibid.
165 Berger, E. “Emergency Departments ShoulderChallenges of Providing Care, PreservingDignity for the ‘Super Obese.’” Annals ofEmergency Medicine 50, no. 4 (2007): 443-445.
166 Zezima, K. “Increasing Obesity Requires NewAmbulance Equipment.” The New York Times,April 8, 2008.
167 Ibid.
168 Berger, E. “Emergency Departments ShoulderChallenges of Providing Care, PreservingDignity for the ‘Super Obese.’” Annals ofEmergency Medicine 50, no. 4 (2007): 443-445.
169 Foreman, C.T. Remarks made as moderator ofthe panel “Changing the Food Environment,”part of the Transatlantic Public PolicyApproaches to Tackling Obesity and Diet-Related Disease conference held inWashington, D.C. on April 8, 2008.
170 Lyons, A.A., J. Park, and C. H. Nelson. “FoodInsecurity and Obesity: A Comparison of Self-Reported and Measured Height and Weight.”American Journal of Public Health 98, no. 4(2008): 751-757.
171 Monsivais, P., and A. Drewnowski. “The RisingCost of Low-Energy-Density Foods.” Journal ofthe American Dietetic Association 107, no. 12(2007): 2017-2076.
172 Ibid.
173 Lubrano, A. “Food Costs Likely to Boost Obesityin Poor.” Philadelphia Inquirer, May 6, 2008.
174 K. Downey. “Hunger Pains: As Economy Slows,Charities Face Tall Order to Feed Needy.” TheWashington Post, B01, April 8, 2008.
175 Ibid.
176 Booth, M., C. Chirico, B. Edwards, and K.Gramp. Monthly Budget Review Fiscal Year 2008: ACongressional Budget Office Analysis. Washington,D.C.: Congressional Budget Office, 2008,http://www.cbo.gov/ftpdocs/90xx/doc9023/03-2008-MBR.pdf (accessed April 16, 2008).
177 Eckholm, E. “As Jobs Vanish and Prices Rise,Food Stamp Use Nears Record.” The New YorkTimes, March 31, 2008.
133
178 Food and Nutrition Service. “Women, Infants,and Children.” U.S. Department of Agriculture.http://www.fns.usda.gov/wic/ (accessed April16, 2008).
179 Parham, P. Written Testimony of Penny Parham,Administrative Director, Department of Food andNutrition, Miami-Dade County, Florida, PublicSchools Before the Committee on Education and LaborUnited States House of Representatives. Miami, FL:Miami-Dade County Public Schools, March 4,2008. http://edlabor.house.gov/testimony/2008-03-04-PennyParham.pdf
180 Ibid.
181 Glod, M. “Schools Get a Lesson in Lunch LineEconomics: Food Costs Unravel Nutrition Init -iatives.” The Washington Post, A01, April 14, 2008.
182 Hecht, K. Testimony before the Committee onEducation and Labor, House of Representatives. SanFrancisco, CA: California Food Policy Advocates,2008, http://edlabor.house.gov/testimony/2008-03-04-KennethHecht.pdf (accessed April16, 2008).
183 U.S. Centers for Disease Control and Prevention.“CDC’s State Based Nutrition and Physical ActivityProgram to Prevent Obesity and other ChronicDiseases.” U.S. Department of Health andHuman Services. http://www.cdc.gov/nccdphp/dnpa/obesity/state_programs/index.htm.(accessed April 15, 2008).
184 Ibid.
185 Utah Department of Health, Bureau of HealthPromotion. Tipping the Scales Toward a HealthierPopulation: The Utah Blueprint to Promote HealthyWeight for Children, Youth, and Adults. Salt LakeCity, UT: Utah Department of Health, 2006.http://health.utah.gov/obesity/docs/Blueprint.pdf. (accessed April 9, 2008).
186 Arkansas Department of Health. Changing theCulture of Health in Arkansas: A CoordinatedApproach to Health Promotion and Prevention ofChronic Diseases and Related Complications. LittleRock, AR: Arkansas Department of Health, 2005.http://www.healthyarkansas.com/disease/chronic_disease_plan2006.pdf. (accessed April 3, 2008).
187 Veugelers, P.J. and A.L. Fitzgerald.“Effectiveness of School Programs inPreventing Childhood Obesity: A MultilevelComparison.” American Journal of Public Health95, no. 3 (2005): 432-435.
188 U.S. Department of Agriculture (USDA).Incorporating the 2005 Dietary Guidelines forAmericans into School Meals. SP 04-2008.Washington, D.C.: USDA, 2007.
189 Ibid.
190 U.S. Department of Agriculture, Food andNutrition Service, Office of Research,Nutrition and Analysis. School Nutrition DietaryAssessment Study-III, Vol. I: School Foodservice,School Food Environment, and Meals Offered andServed. Alexandria, VA: USDA, 2007.
191 Wharton, C.M., M. Long, and M.B. Schwartz.“Changing Nutrition Standards in Schools: TheEmerging Impact on School Revenue.” Journalof School Health 78, no. 5 (2008): 245-252.
192 Pennsylvania Department of Education, Divisionof Food and Nutrition. Nutrition Standards forCompetitive Foods in Pennsylvania Schools for the SchoolNutrition Incentive. Harrisburg, PA: PennsylvaniaDepartment of Education, July 27, 2007.
http://www.pde.state.pa.us/food_nutrition/lib/food_nutrition/nutrition_guidelines_r_3_-final.pdf (accessed July 23, 2008).
193 Wharton, C.M., M. Long, and M.B. Schwartz.“Changing Nutrition Standards in Schools: TheEmerging Impact on School Revenue.” Journalof School Health 78, no. 5 (2008): 245-252.
194 Ibid.
195 U.S. Department of Agriculture, Food andNutrition Service, Office of Research,Nutrition and Analysis. School Nutrition DietaryAssessment Study-III, Vol. I: School Foodservice,School Food Environment, and Meals Offered andServed. Alexandria, VA: USDA, 2007.
196 Ibid.
197 Finkelstein, D.M., E.L. Hill, and R.C. Whitaker.“School Food Environments and Policies inU.S. Public Schools.” Pediatrics 122, no. 1(2008): e251-e259. (E-pub ahead of print.)
198 U.S. Department of Agriculture, Food andNutrition Service. Foods Sold in Competition withUSDA School Meal Programs: A Report to Congress.Washington, D.C.: U.S. Department ofAgriculture, 2001. http://www.fns.usda.gov/cnd/Lunch/CompetitiveFoods/report_congress.htm (accessed April 25, 2008).
199 Ibid.
200 U.S. Government Accountability Office (GAO).School Meal Programs: Competitive Foods Are WidelyAvailable and Generate Substantial Revenues forSchools. Washington, D.C.: GAO, 2005.http://www.gao.gov/new.items/d05563.pdf(accessed May 28, 2008).
201 Center for Science in the Public Interest(CSPI). State School Foods Report Card 2007.Washington, D.C.: CSPI, 2007.
202 Institute of Medicine. Nutrition Standards forFoods in Schools: Leading the Way Toward HealthierYouth. Washington, D.C.: National AcademiesPress, 2007.
203 Wharton, C.M., M. Long, and M.B. Schwartz.“Changing Nutrition Standards in Schools: TheEmerging Impact on School Revenue.” Journalof School Health 78, no. 5 (2008): 245-252.
204 Ibid.
205 Institute of Medicine. Preventing ChildhoodObesity: Health in the Balance. Washington, D.C.:The National Academies Press, 2005.
206 Menschik, D., S. Ahmed, M. H. Alexander, andR.W. Blum. “Adolescent Physical Activities asPredictors of Young Adult Weight.” Archives ofPediatrics Adolescent Medicine 162, no. 1 (2008):29-33.
207 Institute of Medicine. Preventing ChildhoodObesity: Health in the Balance. Washington, D.C.:The National Academies Press, 2005.
208 U.S. Centers for Disease Control and Prevention.“Guidelines for School and CommunityPrograms to Promote Lifelong Physical ActivityAmong Young People.” MMWR Recommendationsand Reports 46, no. RR-6 (1997): 1-36.http://www.cdc.gov/mmwr/preview/mmwrhtml/00046823.htm (accessed May 5, 2008).
209 American Academy of Pediatrics, Committee ofSports Medicine and Fitness, and Committee onSchool Health. “Physical Fitness and Activity inSchools.” Pediatrics 105, no. 5 (2000): 1156-1157.
134
210 U.S. Centers for Disease Control andPrevention. “Youth Risk Behavior Surveillance-- United States, 2007.” Morbidity and MortalityWeekly Report 57, no. SS-4 (2008): 1-136.
211 Field, T., M. Diego, and C. E. Sanders.“Exercise is Positively Related to Adolescents’Relationships and Academics.” Adolescence 36,no. 141 (2001): 105-110.
212 Lee, S.M., C.R. Burgeson, J.E. Fulton, and C.G.Spain. “Physical Education and PhysicalActivity: Results From the School HealthPolicies and Programs Study 2006.” Journal ofSchool Health 77, no. 8 (2007): 435-463.
213 National Association for Sport and PhysicalEducation (NASPE). What Constitutes a QualityPhysical Education Program? Reston, VA:NASPE, 2003.
214 Hillman, C. H., K. I. Erickson, and A. F. Kramer.“Be Smart, Exercise Your Heart: Exercise Effectson Brain and Cognition.” Nature ReviewsNeuroscience 9, no. 1 (2008): 58-65.
215 Shephard, R. J. “Response of Brain, Liver,Kidney, and Other Organs and Tissues toRegular Physical Activity.” Chap. 8, In PhysicalActivity and Health, edited by C. Bouchard, S.N. Blair and W. L. Haskell, 127-140.Champaign, IL: Human Kinetics, Inc., 2007.
216 Shephard, R. J. “Habitual Physical Activity andAcademic Performance.” Nutrition Reviews 54,no. 4, Pt 2 (1996): S32-6.
217 Trost, S.G. Physical Education, Physical Activityand Academic Performance: Research Brief. SanDiego, CA: Active Living Research, RobertWood Johnson Foundation, 2007.
218 Ibid
219 Carlson, S. A., J. E. Fulton, S. M. Lee, et al.“Physical Education and Academic Achievementin Elementary School: Data from the EarlyChildhood Longitudinal Study.” AmericanJournal of Public Health 98, no. 4 (2008): 721-727.
220 Shephard, R. J. “Habitual Physical Activity andAcademic Performance.” Nutrition Reviews 54,no. 4, Pt 2 (1996): S32-6.
221 Castelli, D., C.H. Hillman, S.M. Buck, and H.E.Erwin. “Physical Fitness and AcademicAchievement in Third- and Fifth-GradeStudents.” Journal of Sport and ExercisePsychology 29, no. 2 (2007): 239-252.
222 Nelson, M.C., and P. Gordon-Larsen. “PhysicalActivity and Sedentary Behavior Patterns AreAssociated with Selected Adolescent Health RiskBehaviors.” Pediatrics 117, no. 4 (2006): 1281-1290.
223 Trost, S.G. Physical Education, Physical Activityand Academic Performance: Research Brief. SanDiego, CA: Active Living Research, RobertWood Johnson Foundation, 2007.
224 Coe, D.P., J.M. Pivarnik, C.J. Womack, M.J.Reeves, and R.M. Malina. “Effect of PhysicalEducation and Activity Levels on AcademicAchievement in Children.” Medicine and Sciencein Sports and Exercise 38, no. 8 (2006): 1515-1519.
225 CARDIAC WV Project. “Methods.” CARDIACWV Project. http://www.cardiacwv.org/methods.htm (accessed May 27, 2008).
226 The Associated Press. “Screening ShowsObesity Down Among W. Va. Children.” TheAssociated Press, May 22, 2008.
227 Ibid.
228 Foster, G. D., S. Sherman, K. E. Borradaile, etal. “A Policy-Based School Intervention toPrevent Overweight and Obesity.” Pediatrics121, no. 4 (2008): e794-802.
229 This assessment does not include a compre-hensive review of all food tax policies in allstates. Some states with a general food taxthat covers “junk food” may not be includedin this evaluation.
230 Center for Science in the Public Interest (CSPI).“CSPI to Urge Taxes on Junk Foods to FundHealth Campaigns.” News Release, May 25,2000. http://www.cspinet.org/new/tax_junkfood.html (accessed April 25, 2008).
231 Finkelstein, E. A. and L. Zuckerman. TheFattening of America: How the Economy Makes UsFat, If It Matters, and What to Do About It.Hoboken, NJ: John Wiley & Sons, Inc., 2008.
232 Brownell, K. D. “The Chronicling of Obesity:Growing Awareness of its Social, Economic,and Political Contexts.” Journal of Health Politics,Policy and Law 30, no. 5 (2005): 955-964.
233 Jacobson, M.H. and K.D. Brownell. “SmallTaxes on Soft Drinks and Snack Foods toPromote Health.” American Journal of PublicHealth 90, no. 6 (2000): 854-857.
234 Mississippi Health Advocacy Program (MHAP).Removing the Grocery Tax on Healthy Foods as aPublic Health Policy. Jackson, MS: MHAP, 2007.
235 Monsivais, P., and A. Drewnowski. “The RisingCost of Low-Energy-Density Foods.” Journal of theAmerican Dietetic Association 107, no. 12 (2007):2017-2076.
236 The American Medical Association. “AMAAdopts Policies to Promote Healthier FoodOptions to Fight Obesity in America.” NewsRelease, June 27, 2007. http://www.ama-assn.org/ama/pub/category/17768.html(accessed May 27, 2008).
237 National Restaurant Association. 2007 StateLegislative Session Summary. Washington, D.C.:National Restaurant Association, 2007.
238 Center for Science in the Public Interest (CSPI).Nutrition Labeling in Chain Restaurants -- State andLocal Bills/Regulations - 2007-2008. Washington,D.C.: CSPI, 2008. http://www.cspinet.org/nutritionpolicy/MenuLabelingBills2007-2008.pdf (accessed May 27, 2008).
239 Ibid.
240 The Rudd Center for Food Policy and Obesity. ACase Study of California’s Menu Labeling Legislation.New Haven, CT: Yale University, 2008.http://www.yaleruddcenter.org/what/policy/pdfs/CaliforniaSB120MenuLabelCaseStudy.pdf(accessed May 27, 2008).
241 Center for Science in the Public Interest (CSPI).Nutrition Labeling in Chain Restaurants -- State andLocal Bills/Regulations - 2007-2008. Washington,D.C.: CSPI, 2008. http://www.cspinet.org/nutritionpolicy/MenuLabelingBills2007-2008.pdf(accessed May 27, 2008).
242 Arizona Department of Health Services. “ArizonaSmart Choice Program - Criteria for ApprovedMenu Items.” Arizona Department of HealthServices. http://www.azsmartchoice.com/CriteriaAppovMenu.htm (accessed May 27, 2008).
135
243 Center for Science in the Public Interest (CSPI).Anyone’s Guess. The Need for Nutrition Labeling atFast-Food and Other Chain Restaurants.Washington, D.C.: CSPI, 2003.http://www.cspinet.org/restaurantreport.pdf(accessed May 27, 2008).
244 National Restaurant Association. “House Vote toPrevent Frivolous Lawsuits Against Restaurants,Food Manufacturers: Just Plain CommonSense.” Press Release, March 10, 2004.http://www.restaurant.org/pressroom/print/index.cfm?ID=833 (accessed April 25, 2008).
245 Hulse, C. “Vote in House Offers a Shield inObesity Suits.” New York Times, March 11, 2004.
246 Center for Science in the Public Interest (CSPI).“‘Big Food’ to Win Special Protection in Houseof Representatives.” News Release, March 10,2004. http://www.cspinet.org/new/200403102.html (accessed April 25, 2008).
247 109th Congress. Healthy Places Act of 2007.S.1067. 2nd sess. (March 29, 2007) and 109thCongress. Healthy Places Act of 2007. H.R. 398.2nd sess. (February 2, 2007).
248 McCann, B. and R. Ewing. Measuring the HealthEffects of Sprawl: A National Analysis of PhysicalActivity, Obesity, and Chronic Disease. Washington,D.C.: Smart Growth America and the SurfaceTransportation Policy Project, 2003.www.smartgrowthamerica.org/report/HealthSprawl8.03.pdf (accessed April 25, 2008).
249 Prevention Institute. Improving the Nutrition andPhysical Activity Environment in California.Oakland, CA: Prevention Institute, 2002.http://preventioninstitute.org/nutrition_PA.html. (accessed April 25, 2008).
250 U.S. Department of Health and Human Services.Healthy People 2010. 2nd Edition. Washington,D.C.: U.S. Government Printing Office, 2000.
251 McDonald, N. C. “Active Transportation toSchool: Trends among U.S. Schoolchildren,1969-2001.” American Journal of PreventiveMedicine 32, no. 6 (2007): 509-516.
252 U.S. Centers for Disease Control andPrevention. “Barriers to Children Walking andBiking to School—United States, 1999.”Morbidity and Mortality Weekly Report 51, no. 32(2002): 701-704.
253 Powell, K. E., L. Martin, and P. P. Chowdhury.“Places to Walk: Convenience and RegularPhysical Activity.” American Journal of PublicHealth 93, no. 9 (2003): 1519-1521.
254 Giles-Corti, B. and R. J. Donovan. “TheRelative Influence of Individual, Social, andPhysical Environment Determinants ofPhysical Activity.” Social Science & Medicine 54,no. 12 (2002): 1793-1812.
255 Robert Wood Johnson Foundation. Grant Results:Researchers Review State Policies on PromotingWalking and Biking - Identify Five with GreatestPotential to Work. Princeton, NJ: RWJF, 2005,http://www.rwjf.org/reports/grr/046958.htm(accessed April 10, 2008).
256 110th Congress. Complete Streets Act of 2008. S.2686. 2nd sess. (March 3, 2008).
257 McDonald, N. C. “Active Transportation toSchool: Trends among U.S. Schoolchildren,1969-2001.” American Journal of PreventiveMedicine 32, no. 6 (2007): 509-516.
258 Ewing R., Forinash C., and Schroeer W. “Neigh -bor hood Schools and Sidewalk Connections:What Are the Impacts on Travel Mode Choiceand Vehicle Emissions?” Transportation ResearchNews 237 (March-April 2005): 1-7.http://onlinepubs.trb.org/Onlinepubs/trnews/trnews237environment.pdf (April 30, 2008).
259 Staunton, C.E., D. Hubsmith, and W. Kallins.“Promoting Safe Walking and Biking to School:The Marin County Success Story.” American Journalof Public Health 93, no. 9 (2003): 1431-1434.
260 Patch, D. “Three Communities Get $422,400in State Grants for Sidewalks.” Toledo Blade,January 23, 2008.
261 Wisniewski, M. “Feds Foot Bill So Kids Can Walkto School.” The Chicago Sun-Times, March 7, 2008.
262 California Department of Transportation.“Caltrans Awards $52 Million in Safe Routes toSchool Funding.” Press Release, March 18, 2008.http://www.dot.ca.gov/hq/paffairs/news/pressrel/08pr4.htm (accessed May 2, 2008).
263 “North Coast Communities Receive Safe Routesto School Funding.” The Eureka Reporter, March29, 2008, http://www.eurekareporter.com/article/080329-communities-get-safe-routes-to-school-funding (accessed May 2, 2008).
264 For example, a law may fix a standard or directan administrative agency to adopt one or apotential range of standards through anadministrative process.
265 Cleveland Clinic. “Laparoscopic Weight LossSurgery.” http://my.clevelandclinic.org/services/laparoscopic_surgery/hic_laparoscopic_weight_loss_surgery.aspx (accessed July 2, 2008).
266 Newswise. “Insurance Coverage for Obesity isa Model for the Nation.”http://www.newswise.com/p/articles/view/507650. (accessed July 2, 2008).
267 Mant, D. “Effectiveness of Dietary Interventionin General Practice.” American Journal of ClinicalNutrition 65, no. Suppl 6 (1997):1933S-1938S.
268 Newswise. “Insurance Coverage for Obesity isa Model for the Nation.”http://www.newswise.com/p/articles/view/507650. (accessed July 2, 2008).
269 Ibid.
270 Heubeck, E. “Reimbursement Offers Hope forMore Obesity Counseling: New Pay Programs/AMA Guidelines Could Fuel the Fight AgainstPediatric Obesity. DOC News 4, no. 9 (September2007). http://docnews.diabetesjournals.org/cgi/content/full/4/9/8 (accessed July 2, 2008).
271 Ibid.
272 Ibid.
273 Goldfarb, B. “Medicare Issues Bariatric SurgeryPolicy Guidelines.” DOC News, May 2006.http://docnews.diabetesjournals.org/cgi/reprint/3/5/1-a.pdf (accessed July 2, 2008).
274 Ibid.
275 Barlow, S.E. and the Expert Committee.“Expert Committee RecommendationsRegarding the Prevention, Assessment, andTreatment of Child and AdolescentOverweight and Obesity: Summary Report.”Pediatrics 120, Suppl 4 (2007): S164-S192.
136
276 U.S. Department of Health and Human Services.“HHS Announces Revised Medicare ObesityCoverage Policy.” News Release, July 15, 2004.http://www.hhs.gov/news/press/2004pres/20040715.html (accessed July 14, 2008).
277 StateHealthFacts.org. “Total MedicaidEnrollment, FY2005.” Kaiser Family Foundation.http://statehealthfacts.org/comparemaptable.jsp?ind=198&cat=4 (accessed July 14, 2008).
278 Doering, C. “USDA Revises Food Program forWomen and Children.” Reuters, December 6,2007.
279 Institute of Medicine. WIC Food Packages: Timefor a Change. Washington, D.C.: The NationalAcademies Press, 2005.
280 Daniels, P., D. Whitford, A. Bartholomew and P.Mitchell. “The New WIC Food Packages.”Presentation at the National WIC Association’s18th Annual Washington Leadership Conferenceand WIC Food Package Implementation Summit.Washington, D.C., March 11, 2008.
281 Ibid.
282 Information provided to TFAH by the NationalWIC Association during a meeting at TFAHoffices on April 17, 2008.
283 U.S. Centers for Disease Control andPrevention. “Breastfeeding Practices - Resultsfrom the National Immunization Survey.” U.S.Department of Health and Human Services.http://www.cdc.gov/breastfeeding/data/NIS_data/data_2004.htm (accessed May 2, 2008).
284 Womenshealth.gov. “Health Risks of NotBreastfeeding.” U.S. Department of Health andHuman Services. http://www.4woman.gov/Breastfeeding/index.cfm?page=519 (accessedMay 2, 2008).
285 United States Department of Agriculture.(USDA) “Food Stamp Program Participation andCosts.” USDA. http://www.fns.usda.gov/pd/fssummar.htm (May 9, 2008).
286 Baum, C. The Effects of Food Stamps on Obesity.Washington, D.C.: Economic Research Service,United States Department of Agriculture,September 2007. http://www.ers.usda.gov/Publications/CCR34/CCR34.pdf (accessedJune 3, 2008).
287 Ver Ploeg, M., L. Mancino, and B.H. Lin. Foodand NutritionAssistance Programs and Obesity: 1976-2002. Washington, D.C.: Economic ResearchService, USDA, 2007. http://www.ers.usda.gov/Publications/ERR48/ERR48.pdf (May 9, 2008).
288 Baum, C. The Effects of Food Stamps on Obesity.Washington, D.C.: Economic Research Service,United States Department of Agriculture,September 2007. http://www.ers.usda.gov/Publications/CCR34/CCR34.pdf (accessedJune 3, 2008).
289 American Heart Association. “American HeartAssociation Meeting Report: People on FoodStamps Can’t Afford Heart-Healthy Meals --Abstract 3698.” News Release, November 9, 2004.
290 Center for Science in the Public Interest(CSPI). “Policy Options to Promote Nutritionand Activity.” CSPI. http://www.cspinet.org/nutritionpolicy/policy_options.html
291 Baum, C. The Effects of Food Stamps on Obesity.Washington, D.C.: Economic Research Service,United States Department of Agriculture,
September 2007. http://www.ers.usda.gov/Publications/CCR34/CCR34.pdf (accessedJune 3, 2008).
292 Richardson, J. Child Nutrition and WIC Programs:Background and Recent Funding. Washington, D.C.:Congressional Research Service, The Library ofCongress, 2006.
293 Ibid.
294 U.S. Department of Agriculture. Farm Bill: TitleIV Nutrition. Washington, D.C.: USDA, 2007.
295 Ibid.
296 Sisson, A. “Fruit and Vegetable Consumptionby Low-Income Americans.” Nutrition Noteworthy5, no. 1 (2002): 1-7.
297 Cotterill, R.W. and A.W. Franklin. The UrbanGrocery Store Gap. Hartford, CT: Storrs FoodMarketing Policy Center, University ofConnecticut, 1995.
298 Morris, P. M. Higher Prices, Fewer Choices: Shoppingfor Food in Rural America. Washington, D.C.:Public Voice for Food and Health Policy, 1990.
299 Putnam, J., J. Allshouse, and L.S. Kantor. “U.S.Per Capita Food Supply Trends: More Calories,Refined Carbohydrates, and Fats.” Food Review25, no. 3 (2002): 1-14.
300 Institute for Agriculture and Trade Policy. Foodwithout Thought: How U.S. Farm Policy Contributesto Obesity. Minneapolis, MN: Institute forAgriculture and Trade Policy, 2006.
301 Richardson, J. Child Nutrition and WICLegislation in the 108th and 109th Congresses.Washington, D.C.: Congressional ResearchService, The Library of Congress, 2006.
302 National Coalition for Promoting PhysicalActivity. Letter to Congress Concerning No ChildLeft Behind Legislation. June 12, 2007.
303 Jeffrey, R.W. and J. Utter. “The ChangingEnvironment and Population Obesity in theUnited States.” Obesity Research 11, Suppl (2003):12S-22S.
304 Ross, R. and I. Janssen. “Physical Activity,Fitness, and Obesity.” Chap. 11, In PhysicalActivity and Health, edited by C. Bouchard, S.N. Blair and W. L. Haskell. 1st ed. Vol. 1, 173-189. Champaign, IL: Human Kinetics, 2007.
305 Hedley, A.A., C.L. Ogden, C.L. Johnson, M.D.Carroll, L.R. Curtin, and K.M. Fegal. “Prevalenceof Overweight and Obesity Among U.S. Children,Adolescents, and Adults; 1999-2002.” Journal of theAmerican Medical Association 292, no. 23 (2004):2847-2850.
306 Haskell, W. L., S. N. Blair, and C. Bouchard.“An Integrated View of Physical Activity, Fitnessand Health.” Chap. 23, In Physical Activity andHealth, edited by C. Bouchard, S. N. Blair andW. L. Haskell. Vol. 1, 359-374. Champaign, IL:Human Kinetics, 2007.
307 U.S. Department of Transportation, Bureau ofTransportation Statistics. National Survey ofPedestrian and Bicyclist Attitudes and BehaviorsHighlights Report. Washington, D.C.: U.S.Department of Transportation, 2002.
308 Girl Scouts. “Girl Scouts and CongresswomanMary Bono Join Forces to Support Children’sHealth.” News Release, June 13, 2007.http://www.girlscouts.org/news/news_releases/2007/healthy_living.asp (accessed June 3, 2008).
137
309 GovTrack.us. H.R. 2677—110th Congress (2007):IMPACT Act, GovTrack.us (database of federal legisla-tion)http://www.govtrack.us/congress/bill.xpd?bill=h110-2677&tab=summar (accessed Jun 3, 2008).
310 GovTrack.us. “H.R. 3895—110th Congress (2007):MEAL Act”. GovTrack.us (database of federal legisla-tion)http://www.govtrack.us/congress/bill.xpd?bill=h110-3895&tab=summary (accessed Apr 22, 2008)
311 110th Congress. Complete Streets Act of 2008. S.2686. 2nd sess. (March 3, 2008).
312 Note: Some U.S. Centers for Disease Controland Prevention suggest the use of the term“cooperative agreement” and others suggestthe use of the term “grant” for these programs.
313 U.S. Centers for Disease Control and Prevention.“CDC’s State-Based Nutrition and PhysicalActivity Program to Prevent Obesity and OtherChronic Diseases.” U.S. Department of Healthand Human Services. http://www.cdc.gov/nccdphp/dnpa/obesity/state_programs/index.htm (accessed June 3, 2008).
314 U.S. Centers for Disease Control andPrevention. “Our Mission: Four Strategies toPromote National School Health.” U.S.Department of Health and Human Services.http://www.cdc.gov/HealthyYouth/about/mission.htm (accessed June 3, 2008).
315 U.S. Centers for Disease Control andPrevention (CDC). Steps to a HealthierUSProgram: Preventing Chronic Diseases Through LocalCommunity Action. Atlanta, GA: CDC, 2007.
316 U.S. Centers for Disease Control and Prevention.“FY 2009 Budget Submission Centers For DiseaseControl And Prevention Discretionary All-PurposeTable.” U.S. Department of Health and HumanServices. http://www.cdc.gov/fmo/PDFs/FY07-09_Functional_Table.pdf (accessed May 28, 2008).
317 Institute of Medicine. Preventing ChildhoodObesity: Health in the Balance. Washington, D.C.:The National Academies Press, 2005.
318 National Center for Health Statistics. Health,United States, 2006 with Chartbook on Trends in theHealth of Americans. Hyattsville, MD: U.S.Government Printing Office, 2006.http://www.cdc.gov/nchs/data/hus/hus06.pdf#073 (accessed April 28, 2008).
319 Institute of Medicine. Preventing ChildhoodObesity: Health in the Balance. Washington, D.C.:The National Academies Press, 2005.
320 Institute of Medicine. Progress in Preventing Child -hood Obesity: How Do We Measure Up? Washington,D.C.: The National Academies Press, 2007.
321 U.S. Department of Health and HumanServices. Healthy People 2010. 2nd Edition.Washington, D.C.: U.S. Government PrintingOffice, 2000.
322 Office of the Surgeon General. The SurgeonGeneral’s Call to Action to Prevent and Decrease Over -weight and Obesity. Rockville, MD: U.S. Departmentof Health and Human Services, 2001.
323 Perreault, L., Y. Ma, S. Dagogo-Jack, et al. “SexDifferences in Diabetes Risk and the Effect ofIntensive Lifestyle Modification in the DiabetesPrevention Program.” Diabetes Care (Epubahead of print, Mar 20, 2008).
324 Kohl, H.W. “Physical Activity andCardiovascular Disease: Evidence for a DoseResponse.” Medicine and Science in Sports andExercise 33, no. Suppl 6 (2001): S472-S483.
325 Katzmarzyk, P.T. and I. Janssen. “The EconomicCosts Associated with Physical Inactivity andObesity in Canada: An Update.” CanadianJournal of Applied Physiology 29 (2004): 90-115.
326 Pescatello, L.S., B.A. Franklin, R. Fagard, W.B.Farquhar, G.A. Kelley, and C.A. Ray.“American College of Sports Medicine PositionStand: Exercise and Hypertension.” Medicineand Science in Sports and Exercise 36 (2004): 533-553.
327 Alcazar, O., R.C. Ho, and L.J. Goodyear. “PhysicalActivity, Fitness and Diabetes Mellitus.” Chap. 21,In Physical Activity and Health, edited by C.Bouchard, S. N. Blair and W. L. Haskell. Vol. 1,191-204. Champaign, IL: Human Kinetics, 2007.
328 Institute of Medicine. Progress in Preventing Child -hood Obesity: How Do We Measure Up? Washington,D.C.: The National Academies Press, 2007.
329 Ibid.
330 Institute of Medicine. Preventing ChildhoodObesity: Health in the Balance. Washington, D.C.:The National Academies Press, 2005.
331 Institute of Medicine. Progress in Preventing Child -hood Obesity: How Do We Measure Up?Washington, D.C.: The National AcademiesPress, 2007.
332 Institute of Medicine. Preventing ChildhoodObesity: Health in the Balance. Washington, D.C.:The National Academies Press, 2005.
333 U.S. Department of Housing and UrbanDevelop ment. Interim Survey of Children.Washington, D.C.: U.D. Department of Housingand Urban Development, 2001.http://www.huduser.org/Research/IxIchildF.pdf (accessed April 30, 2008).
334 Abt Associates Inc. and the National Bureau ofEconomic Research. Moving to Opportunity InterimImpacts Evaluation. Washington, D.C.: U.S.Department of Housing and Urban Develop -ment, Office of Policy Development andResearch, 2003.http://www.huduser.org/Publications/pdf/MTOFullReport.pdf (accessed April 30, 2008).
335 Jones, B.H., M.W. Bovee, and J.J. Knapik.“Associations among Body Composition,Physical Fitness and Injury in Men and WomenArmy Trainees.” Chap. 9, In Body Compositionand Physical Performance: Applications for theMilitary Services, edited by B. M. Marriott and J.Grumstrup-Scott. Vol. 1, 141-174. Washington,D.C.: National Academies Press, 1992.
336 Hsu, L.L., R.L. Nevin, S.K. Tobler, and M.V.Rubertone. “Trends in Overweight andObesity among 18-Year-Old Applicants to theUnited States Military, 1993-2006.” The Journalof Adolescent Health 41, no. 6 (2007): 610-612.
337 Basu, S. “Military Not Immune From Obesity‘Epidemic.’” U.S. Medicine, March 25, 2004.http://www.usmedicine.com/dailyNews.cfm?dailyID=187 (accessed May 1, 2008).
338 Hoffman, M. “55 Percent of Airmen Overweight.” Air Force Times, April 30, 2008.http://www.airforcetimes.com/news/2008/04/airforce_fat_AF_042808w/ (accessed April 30, 2008).
339 Cable News Network. “Discharged ServicemenDispute Military Weight Rules.” CNN.com,September 6, 2000. http://www.cnn.com/2000/HEALTH/09/06/military.obesity/index.html (accessed May 2, 2008).
138
340 U.S. Department of Defense PharmacoEconomicCenter. “Pharmacoeconomic Analysis of ObesityTreatment.” PEC Update 97, no. 5 (1997): 1-17.http://www.pec.ha.osd.mil/Updates/97%20PDFs/97-05.PDF (accessed June 4, 2008).
341 The average cost of recruiting and training areplacement enlisted member were adjustedfor inflation for 2008 based on the change inthe Consumer Price Index (CPI) from fourthquarter 2006 to fourth quarter 2007. TFAHused the Consumer Price Index calculation,which is the inflation measure used by the U.S.Department of Labor, Bureau of LaborStatistics. http://www.bls.gov/home.htm(accessed June 4, 2008).
342 Dall, T.M., Y. Zhang, Y.J. Chen, et al. “Cost Assoc -iated with Being Overweight and with Obesity,High Alcohol Consumption, and Tobacco Usewithin the Military Health System’s TRICAREPrime-Enrolled Population.” American Journal ofHealth Promotion 22, no. 2 (2007): 120-139.
343 Freking, K. “Government to Unveil Fitness Testfor Adults.” The Associated Press, May 14, 2008.
344 Ibid.
345 Center for Science in the Public Interest(CSPI). “Why It’s Hard to Eat Well and BeActive in America Today.” CSPI.http://www.cspinet.org/nutritionpolicy/food_advertising.html (accessed May 14, 2008).
346 Institute of Medicine. Progress in Preventing Child -hood Obesity: How Do We Measure Up? Washington,D.C.: The National Academies Press, 2007.
347 Ibid.
348 National Governors Association. HealthyAmerica: Wellness Where We Live, Work and Learn.Call to Action: An Agenda for America’s Governors.Washington, D.C.: National GovernorsAssociation, 2006. http://www.nga.org/Files/pdf/0602HEALTHYAMCALL.PDF (accessedMay 13, 2008).
349 Institute of Medicine. Progress in Preventing Child -hood Obesity: How Do We Measure Up? Washington,D.C.: The National Academies Press, 2007.
350 National Governors Association. CreatingHealthy States: Actions for Governors. Washington,D.C.: National Governors Association, 2006.http://www.nga.org/Files/pdf/0602CREATINGHEALTHYSTATESACTIONS.PDF (accessedMay 13, 2008.)
351 Institute of Medicine. Progress in Preventing Child -hood Obesity: How Do We Measure Up? Washington,D.C.: The National Academies Press, 2007.
352 Ewing, R. and B. McCann. Measuring the HealthEffects of Sprawl: A National Analysis of PhysicalActivity, Obesity and Chronic Disease. Smart GrowthAmerica, Washington D.C., 2003.http://www.smart-growthamerica.org/report/HealthSprawl8.03.pdf. (May 1, 2008).
353 California Center for Public Health Advocacy,PolicyLink, and the UCLA Center for HealthPolicy Research. Designed for Disease: The LinkBetween Local Food Environments and Obesity andDiabetes. Davis, CA: California Center forPublic Health Advocacy, 2008.
354 Sallis, J. F. and K. Glanz. “The Role of BuiltEnvironments in Physical Activity, Eating, andObesity in Childhood.” The Future of Children16, no. 1 (2006): 89-108.
355 Ewing, R. and B. McCann. Measuring the HealthEffects of Sprawl: A National Analysis of PhysicalActivity, Obesity and Chronic Disease. SmartGrowth America, Washington D.C., 2003.http://www.smart-growthamerica.org/report/HealthSprawl8.03.pdf. (May 1, 2008).
356 Simon, P., C.J. Jarosz, T. Kuo, and J.E. Fielding.Menu Labeling as a Potential Strategy forCombating the Obesity Epidemic: A Health ImpactAssessment. Los Angeles, CA: Los AngelesCounty Department of Public Health, 2008.
357 New York City Department of Health and MentalHygiene. “Board of Health Votes to RequireChain Restaurants to Display Calorie Informationin New York City.” Press Release, January 22,2008. http://www.nyc.gov/html/doh/html/pr2008/pr008-08.shtml (accessed May 1, 2008).
358 The Associated Press. “New York Begins CitingRestaurants That Lack Calorie Counts onMenus.” The Associated Press, May 5, 2008.
359 Saul, S. “Conflict on the Menu.” The New YorkTimes, February 16, 2008.
360 Active Living by Design. “Active Seattle: Comm un ity Partnership.” Robert Wood Johnson Foundation.http://www.activelivingbydesign.org/cgi-bin/albd.org/view_services.cgi?request=show_public_home&dept_id=121 (accessed June 3, 2008).
361 Moore, L. V. and A. V. Diez Roux. “Associationsof Neighborhood Characteristics with theLocation and Type of Food Stores.” AmericanJournal of Public Health 96, no. 2 (2006): 325-331.
362 Giang, T., A. Karpyn, H. Burton Laurison, A.Hiller, and R.D. Perry. “Closing the GroceryGap in Underserved Communities: TheCreation of the Pennsylvania Fresh FoodFinancing Initiative.” Journal of Public HealthManagement Practice 14, no. 3 (2008): 272-279.
363 Ibid.
364 Baker, E. A., M. Schootman, E. Barnidge, and C.Kelly. “The Role of Race and Poverty in Access toFoods that Enable Individuals to Adhere toDietary Guidelines.” Preventing Chronic Disease 3,no. 3 (2006): A76.
365 Cubbin, C. and M.A. Winkleby. “FoodAvailability, Personal Constraints, andCommunity Resources.” Journal of Epidemiologyand Community Health 61, no. 11 (2007): 932.
366 The Reinvestment Fund. “Bringing Super -markets to Underserved Communities.” TRF.http://www.trfund.com/stories/supermarkets.html (accessed May 5, 2008).
367 Shulman, R. “Groceries Grow Elusive ForMany in New York City, With Rents Soaring,Stores Are Being Demolished for Condos.”The Washington Post, February 19, 2008.
368 Rivera, R. “Council Vote for Good Health MayWeaken Business at Groceries in Poor Neighbor -hoods.” The New York Times, February 28, 2008.
369 New Orleans Food Policy Advisory Committee.Building Healthy Communities: Expanding Access toFresh Food Retail. New Orleans, LA: New OrleansFood Policy Advisory Committee, 2007.http://www.no-hunger.org/news/FPAC-pr/REPORT%20FINAL.pdf (accessed May 5, 2008).
370 Troeh, E. “Food Shopping a Challenge in NewOrleans.” National Public Radio, March 28, 2007.
371 Ibid.
139
372 Institute of Medicine. Preventing ChildhoodObesity: Health in the Balance. Washington, D.C.:The National Academies Press, 2005.
373 Partnership to Fight Chronic Disease. KeepingAmerica Healthy: A Guide to Successful Programs.Washington, D.C. June 2008.
374 Story, M. K.M. Kaphingst, and S. French. “TheRole of Schools in Obesity Prevention.” TheFuture of Children, 16, no. 1 (2006): 1-34.
375 Gleason, P., C. Suitor, and U.S. Food andNutrition Service. Children’s Diets in the Mid-1990s: Dietary Intake and Its Relationship with SchoolMeal Participation, Special Nutrition Programs, Reportno. CN-01-CD1. Alexandria, VA.: U.S. Dept ofAgriculture, Food and Nutrition Service, 2001.
376 Brescoll, V.L., R. Kersh, and K.D. Brownell.“Assessing the Feasibility and Impact ofFederal Childhood Obesity Policies.” TheAnnals of the American Academy of Political andSocial Science 615, no. 1 (2008): 178-194.
377 Nihiser, A.J., S.M. Lee, H. Wechsler, et al. “BodyMass Index Measurement in Schools.” TheJournal of School Health 77, no. 10 (2007):651-671.
378 Ibid.
379 Institute of Medicine. Progress in Preventing Child -hood Obesity: How Do We Measure Up? Washington,D.C.: The National Academies Press, 2007.
380 Ibid.
381 Noguchi, Y. “Costs of Obesity Add to BusinessOverhead.” National Public Radio, May 23, 2008.
382 Hertz, R.P., A.N. Unger, M. McDonald, M.B.Lustik, and J. Biddulph-Krentar. “The Impact ofObesity on Work Limitations and CardiovascularRisk Factors in the U.S. Workforce.” Journal ofOccupational and Environmental Medicine 46, no.12 (2004): 1196-1203.
383 Institute of Medicine. Progress in Preventing Child -hood Obesity: How Do We Measure Up? Washington,D.C.: The National Academies Press, 2007.
384 American Academy of Pediatrics. “PolicyStatement: Breastfeeding and the Use of HumanMilk.” Pediatrics 115, no. 2 (2005): 496-506.
385 Ibid.
386 U.S. Department of Health and Human Services.Healthy People 2010. 2nd ed. With Understandingand Improving Health and Objectives for ImprovingHealth. 2 vols. Washington, D.C.: U.S.Government Printing Office, November 2000.
387 Ryan A.S., W. Zhou, and M.B. Arensberg.“The Effect of Employment Status onBreastfeeding in the United States.” Women’sHealth Issues 16, no. 5 (2006): 243-251.
388 National Conference of State Legislatures. “50State Summary of Breastfeeding Laws - UpdatedApril 2008.” National Conference of StateLegislatures. http://www.ncsl.org/programs/health/breast50.htm (accessed May 13, 2008).
389 Abdulwadud O.A. and M.E. Snow. “Interventionsin the Workplace to Support Breastfeeding forWomen in Employment.” Cochrane DatabaseSystem Review 18, no. 3 (2007):CD006177.
390 Ibid.
391 Finkelstein, E. A. and L. Zuckerman. TheFattening of America: How the Economy Makes UsFat, If It Matters, and What to Do About It.Hoboken, NJ: John Wiley & Sons, Inc., 2008.
392 Consumers Union. Out of Balance: Marketing ofSoda, Candy, Snacks and Fast Foods Drowns OutHealthful Messages. San Francisco, CA:Consumers Union, September 2005.
393 Center for Science in the Public Interest(CSPI). “Why It’s Hard to Eat Well and BeActive in America Today.” CSPI.http://www.cspinet.org/nutritionpolicy/food_advertising.html (accessed May 14, 2008).
394 Crain Communications Inc. and the Ad AgeGroup. “50th Annual 100 Leading NationalAdvertisers.” Advertising Age, June 27, 2005.
395 Institute of Medicine. Food Marketing to Childrenand Youth: Threat or Opportunity? Washington,D.C.: The National Academies Press, 2006, p.5.
396 Crain Communications Inc. and the Ad AgeGroup. “50th Annual 100 Leading NationalAdvertisers.” Advertising Age, June 27, 2005.
397 Hannaford Bros. “What is Guiding Stars?”Hannaford Bros. http://www.hannaford.com/Contents/Healthy_Living/Guiding_Stars/index.shtml (accessed May 29, 2008).
398 Hannaford Bros. “Grocery Shoppers AreFollowing Stars to More Nutritious Choices.”News Release, September 6, 2007.
399 Ibid.
400 Garson, A. and C.L. Engelhard. “AttackingObesity: Lessons from Smoking.” Journal of theAmerican College of Cardiology 49, no. 16 (2007):1673-1675.
401 Ibid.
402 Torrey Marshall, M. “Development of 2007 FarmBill: Prepared Statement by Maureen TorreyMarshall to the Committee on Agriculture,United States House of Representatives.”Washington, D.C.: United Fresh ProduceAssociation, June 26, 2006.http://www.unitedfresh.org/assets/files/Maureen%20Torrey%20Marshall%202007%20Farm%20Bill%20testimony.pdf (accessed May 14, 2008).
403 Hamm, M. W. “Linking SustainableAgriculture and Public Health: Opportunitiesfor Realizing Multiple Goals.” Journal of Hungerand Environmental Nutrition (In Press): 1-14.
404 Ibid.
405 U.S. Food and Drug Administration. Food Protect ionPlan: An Integrated Strategy for Protecting the Nation’sFood Supply. Washington, D.C.: U.S. Department ofHealth and Human Services, 2007.
406 Institute for Agriculture and Trade Policy. Foodwithout Thought: How U.S. Farm Policy Contributesto Obesity. Minneapolis, MN: Institute forAgriculture and Trade Policy, March 2006.
407 Green, L. W. and J. M. Ottoson. “From Efficacyto Effectiveness to Community and Back:Evidence-Based Practice Vs Practice-BasedEvidence.” Presented at the Conference FromClinical Trials to Community: The Science OfTranslating Diabetes and Obesity Research,Bethesda, MD, National Institutes of Health,January 12-13, 2004, http://www.niddk.nih.gov/fund/other/Diabetes-Translation/conf-publica-tion.pdf (accessed May 15, 2008).
408 Schwartz, M.B. and Brownell, K.D. “ActionsNecessary to Prevent Childhood Obesity:Creating the Climate for Change.” Journal ofLaw, Medicine & Ethics 35, no. 1 ( 2007): 78-89.
140
409 George Washington Univesity School of PublicHealth and Health Services, Department of HealthPolicy. Re-Visioning Success: How Stigma, Perceptionsof Treatment, and Definitions of Success Impact Obesityand Weight Management in America. A Research Reportfor the STOP Obesity Alliance. Washington, D.C.:George Washington University, 2007.
410 Ogden, C.L., M.D. Carroll, M.A. McDowell,and K.M. Flegal. Obesity among Adults in theUnited States- No Change Since 2003-2004. NCHSData Brief No 1. Hyattsville, MD: NationalCenter for Health Statistics, 2007.
411 U.S. Centers for Disease Control andPrevention. “Youth Risk Behavior Surveillance-- United States, 2007.” Morbidity and MortalityWeekly Report 57, no. SS-4 (2008): 1-136.
412 U.S. Department of Health and Human Services,Health Resources and Services Administration,Maternal and Child Health Bureau. NationalSurvey of Children’s Health 2003. Rockville, MD:U.S. Department of Health and Human Services,2005, http://www.mchb.hrsa.gov/overweight/techapp.htm (accessed April 22, 2008).
413 Ogden, C.L., M.D. Carroll, L.R. Curtin, et al.“Prevalence of Overweight and Obesity in theUnited States, 1999-2004.” Journal of the AmericanMedical Association 295, no. 13 (2006):1549-1555.
414 U.S. Centers for Disease Control andPrevention. “Youth Risk Behavior Surveillance-- United States, 2007.” Morbidity and MortalityWeekly Report 57, no. SS-4 (2008): 1-136.
415 U.S. Department of Health and Human Services,Health Resources and Services Administration,Maternal and Child Health Bureau. National Surveyof Children’s Health 2003. Rockville, MD: U.S.Department of Health and Human Services, 2005.
416 American Obesity Association. “Obesity inMinority Populations.” American ObesityAssociation. http://obesity1.tempdomainname.com/subs/fastfacts/Obesity_Minority_Pop.shtml. (accessed June 6, 2008).
417 American Diabetes Association. “Total Prevalenceof Diabetes and Pre-Diabetes.” American DiabetesAssociation. https://www.diabetes.org/diabetes-statistics/prevalence.jsp. (accessed June 9, 2008).
418 Olden, K. and S.L. White. “Health-Related Dispar -ities: Influence of Environmental Factors.” MedicalClinics of North America 89, no. 4 (2005): 721-738.
419 U.S. Centers for Disease Control andPrevention. “Prevalence of Regular PhysicalActivity Among Adults —- United States, 2001and 2005.” Morbidity and Mortality Weekly Report56, no. 46 (2007): 1209-1212.
420 U.S. Centers for Disease Control andPrevention. “Youth Risk Behavior Surveillance-- United States, 2007.” Morbidity and MortalityWeekly Report 57, no. SS-4 (2008): 1-136.
421 U.S. Department of Health and Human Services,Health Resources and Services Administration,Maternal and Child Health Bureau. National Surveyof Children’s Health 2003. Rockville, MD: U.S.Department of Health and Human Services, 2005.
422 Kumanyika, S.K., M.C. Whitt-Glover, T.L. Gary, et al.“Expanding the Obesity Research Paradigm toReach African American Communities.” PreventingChronic Disease 4, no. 4 (2007). http://www.cdc.gov/pcd/issues/2007/oct/07_0067.htm. (accessedJune 6, 2008).
423 Ibid.
424 Yancey, A.K. and S.K. Kumanyika. “Bridging theGap: Understanding the Structure of SocialInequities in Childhood Obesity.” American Journalof Preventive Medicine 33, no. 4S (2007): S172-S174.
425 Loukaitou-Sideris, A. “Crime Prevention andActive Living.” American Journal of HealthPromotion 21, no. 4 Suppl (2007):380-389.
426 Day, K. “Active Living and Social Justice: Plann -ing for Physical Activity in Low-Income, Black,and Latino Communities.” Journal of the AmericanPlanning Association 72, no. 1 (2006):88-99.
427 Bhattacharya, J., T. DeLeire, S. Heider, and J.Currie. “Heat or Eat? Cold-Weather Shocks andNutrition in Poor American Families.” AmericanJournal of Public Health 93, no. 7 (2003):1149-54.
428 Day, K. “Active Living and Social Justice: Plann -ing for Physical Activity in Low-Income, Black,and Latino Communities.” Journal of the AmericanPlanning Association 72, no. 1 (2006):88-99.
429 Kumanyika, S.K., M.C. Whitt-Glover, T.L. Gary, etal. “Expanding the Obesity Research Paradigmto Reach African American Communities.”Preventing Chronic Disease 4, no. 4 (2007).http://www.cdc.gov/pcd/issues/2007/oct/07_0067.htm. (accessed June 6, 2008).
430 The Henry J. Kaiser Family Foundation. Key Facts:Race, Ethnicity & Medical Care. Washington, D.C.:The Henry J. Kaiser Family Foundation, 2007.
431 Ibid.
432 Neal, D., G. Magwood, C. Jenkins, and C.L.Hossler. “Racial Disparity in the Diagnosis ofObesity among People with Diabetes.” Journalof Health Care for the Poor and Underserved 17,no. 2 Suppl (2006); 106-115.
433 Levy, B.T. and P.S. Williamson. “Patient Per -ceptions and Weight Loss of Obese Adults.” TheJournal of Family Practice 27, no. 3 (1988): 285-290.
434 Olden, K. and S.L. White. “Health-Related Dispar -ities: Influence of Environmental Factors.” MedicalClinics of North America 89, no. 4 (2005): 721-738.
435 Kumanyika, S.K., M.C. Whitt-Glover, T.L. Gary, etal. “Expanding the Obesity Research Paradigmto Reach African American Communities.”Preventing Chronic Disease 4, no. 4 (2007).http://www.cdc.gov/pcd/issues/2007/oct/07_0067.htm. (accessed June 6, 2008).
436 Liu, J., K.J. Bennett, N. Harun, X. Zheng, J.C.Probst, and R.R. Pate. Overweight and PhysicalInactivity among Rural Children Aged 10-17: ANational and State Portrait. Columbia, SC: SouthCarolina Rural Health Research Center, 2007.
437 Ibid.
438 Tudor-Locke, C. J.J. Kronenfeld, S.S. Kim, M.Benin, and M. Kuby. “A Geographical Compar isonof Prevalence of Overweight School-aged Children:The National Survey of Children’s Health 2003.”Pediatrics 120, no. 4 (2007): e1043-1050.
439 Lutfiyya, M.N., M.S. Lipsky, J. Wisdom-Behounek,and M. Inpanbutr-Martinkus. “Is Rural Residencya Risk Factor for Overweight and Obesity for U.S.Children?” Obesity 15, no. 9 (2007):2348-2356.
440 U.S. Department of Agriculture, EconomicResearch Service. Rural Children at a Glance.Washington, D.C.: USDA, 2005. Available atwww.ers.usda.gov/publications/EIB1/EIB1.pdf.
141
441 Save the Children. CHANGE for Children inRural America. Washington, D.C.: Save theChildren, 2008. Available athttp://www.savethechildren.org/programs/us-literacy-and-nutrition/STC_USP-CHANGE_brochure-FINAL-5-27-08.pdf.
442 Morton, L.W., and T.C. Blanchard. Starved forAccess: Life in Rural America’s Food Deserts.Columbia, MO: Rural Sociological Society, 2007.Available at http://www.ruralsociology.org/pubs/RuralRealities/RuralRealities1-4.pdf.
443 Walker, J.N., J.M. Del Rosso, and A.K. Held.Nutrition and Physical Activity Assessment ofChildren in Rural America. Westport, CT: Savethe Children, 2005.
444 Save the Children. CHANGE for Children inRural America. Washington, D.C.: Save theChildren, 2008. Available athttp://www.savethechildren.org/programs/us-literacy-and-nutrition/STC_USP-CHANGE_brochure-FINAL-5-27-08.pdf.
445 Valeo, T. “Growing Old, Baby-Boomer Style.”CBS NEWS Online, January 10, 2006.http://www.cbsnews.com/stories/2006/01/10/health/webmd/printable1195879.shtml(accessed May 13, 2008).
446 Leveille, S.G., C.C. Wee, and L.I. Iezzoni. “Trendsin Obesity and Arthritis among Baby Boomers andTheir Predecessors, 1971-2002.” American Journal ofPublic Health 95, no. 9 (2005): 1607-1613.
447 Valeo, T. “Growing Old, Baby-Boomer Style.”CBS NEWS Online, January 10, 2006.http://www.cbsnews.com/stories/2006/01/10/health/webmd/printable1195879.shtml(accessed May 13, 2008).
448 Leveille, S.G., C.C. Wee, and L.I. Iezzoni. “Trendsin Obesity and Arthritis among Baby Boomers andTheir Predecessors, 1971-2002.” American Journal ofPublic Health 95, no. 9 (2005): 1607-1613.
449 Centers for Medicaid and Medicare Services.National Health Expenditure Projections 2007-2017.Washington, D.C.: U.S. Department of Health andHuman Services, 2007. http://www.cms.hhs.gov/NationalHealthExpendData/Downloads/proj2007.pdf (accessed May 13, 2008).
450 Kuczmarski, R.J., K.M. Flegal, S.M. Campbell, andC.L Johnson. “Increasing Prevalence of Over -weight among U.S. Adults.” Journal of the AmericanMedical Association 272, no. 3 (1994): 205-211.
451 Daviglus, M.L., K. Liu, L.L Yan, et al. “Relationof Body Mass Index in Young Adulthood andMiddle Age to Medicare Expenditures in OlderAge.” Journal of the American Medical Association292, no. 22 (2004): 2743-2749.
452 National Institute on Aging, National Institutes ofHealth, and U.S. Department of Health andHuman Services. Growing Older in America: TheHealth and Retirement Study. Washington, D.C. U.S.Department of Health and Human Services, 2007.http://hrsonline.isr.umich.edu/docs/databook/HRS_Text_WEB.pdf (accessed May 13, 2008).
453 Rotstein, G. “Boomer Health Decline Reported:Are They Less Well Than Earlier Group? Or is itImagined?” Pittsburgh Post Gazette, March 18, 2007.
454 Rauscher, M. “Depression, Anxiety Tied toUnhealthy Habits.” Reuters, March 5, 2008.
455 Ibid.
456 Ibid.
457 Petry, N. M., D. Barry, R. H. Pietrzak, and J. A.Wagner. “Overweight and Obesity are Associatedwith Psychiatric Disorders: Results from theNational Epidemiologic Survey on Alcohol andRelated Conditions.” Psychosomatic Medicine 70,no. 3 (2008): 288-297.
458 Ibid.
459 Strine, T. W., A. H. Mokdad, S. R. Dube, et al.“The Association of Depression and Anxietywith Obesity and Unhealthy Behaviors amongCommunity-Dwelling U.S. Adults.” GeneralHospital Psychiatry 30, no. 2 (2008): 127-137.
460 National Institutes of Health. “Stress, ObesityLink Found.” U.S. Department of Health andHuman Services. http://www.nih.gov/news/research_matters/july2007/07092007stress.htm. (accessed May 8, 2008).
461 Kuo, L., J. Kitlinska, J. Tilan, et al.“Neuropeptide Y Acts Directly in the Peripheryon Fat Tissue and Mediates Stress-InducedObesity and Metabolic Syndrome.” NatureMedicine 13, no. 7 (2007): 803-811.
462 Zukowska, Z. “New Science behind Obesity:How Stress Can Make You Fat.” Power PointPresentation.
463 Hudson, J., E. Hiripi, H. Pope, and R. Kessler. “ThePrevalence and Correlates of Eating Dis orders inthe National Comorbidity Survey Repli cation.”Biological Psychiatry 61, no. 3 (2007): 348-358.
464 American Psychiatric Association. Diagnosticand Statistical Manual of Mental Disorder, 4th ed.Washington, D.C. American PsychiatricAssociation, 2000.
465 Pull, C. “Binge Eating Disorder.” CurrentOpinion in Psychiatry 17, no. 1 (2004): 43-48.
466 Mayo Clinic.com. “Binge-eating disorder.” MayoClinic.com.http://www.mayoclinic.com/health/binge-eating-disorder/DS00608. (accessed May 30, 2008).
467 World Health Organization (WHO). “Obesityand Overweight.” WHO. http://www.who.int/mediacentre/factsheets/fs311/en/index.html(accessed May 19, 2008).
468 Ibid.
469 World Health Organization (WHO). “GlobalStrategy: Overall Goal.” WHO.http://www.who.int/dietphysicalactivity/goals/en/index.html (accessed May 19, 2008).
470 World Health Organization (WHO). “GlobalStrategy on Diet, Physical Activity and Health:Member State Documents.” WHO.http://www.who.int/infobase/dpas/dpas.aspx(accessed April 8, 2008).
471 Cross Government Obesity Unit, Departmentof Health and Department of Children,Schools and Families. Healthy Weight, HealthyLives: A Cross-Government Strategy for England.London, England: H.M. Government, 2008.
472 BBC News. “Q&A: Anti-Obesity Strategy.”BBC. January 23, 2008.
473 Cross Government Obesity Unit, Departmentof Health and Department of Children,Schools and Families. Healthy Weight, HealthyLives: A Cross-Government Strategy for England.London, England: H.M. Government, 2008.
142
474 Comments by Tim Lobstein, InternationalObesity Taskforce, International Association forthe Study of Obesity, participant in the panel“Changing the Food Environment,” part of theTransatlantic Public Policy Approaches toTackling Obesity and Diet-Related Disease confer-ence held in Washington, D.C. on April 8, 2008.
475 Foresight. Tackling Obesities: Future Choices -Summary of Key Messages. London, England:Government Science Office, October 2007.http://www.foresight.gov.uk/Obesity/obesity_final/20.pdf (accessed May 19, 2008).
476 Comments by Dr. Will Cavendish, Director ofHealth and Well-Being, United KingdomDepartment of Health, participant in the panel“Changing the Food Environment,” part of theTransatlantic Public Policy Approaches toTackling Obesity and Diet-Related Disease confer-ence held in Washington, D.C. on April 8, 2008.
477 Cross Government Obesity Unit, Departmentof Health and Department of Children,Schools and Families. Healthy Weight, HealthyLives: A Cross-Government Strategy for England.London, England: H.M. Government, 2008.
478 Comments by Dr. Michel Chauliac, Coordinator,National Nutrition and Health Program, FrenchMinistry of Health, participant in the panel“Changing the Food Environment,” part of theTransatlantic Public Policy Approaches toTackling Obesity and Diet-Related Disease confer-ence held in Washington, D.C. on April 8, 2008.
479 Reuters. “Child Obesity Rates Level Off in France.”International Herald Tribune, May 15, 2008.
480 StataCorp. Stata Statistical Software: Release 9.College Station, TX: StataCorp LP, 2005.
481 The high blood pressure question is part of arotating core of questions which is asked inalternating years by all states: in this case 2001,2003, 2005 etc.
482 One can think about this as an upper and lowerbound on the true estimate because it is reason-able to think that some borderline hypertensiveswould have answered “yes” in previous yearswhile others would have answered “no”.
483 For hypertension the 3-year averages were calcu-lated over 2001/2003/2005 and 2003/2005/2007.
484 In all cases, observations with missing valuesaccounted for less than 5 percent of the totalnumber of observations.
485 Food and Nutrition Service, U.S. Departmentof Agriculture. “About FNS.” USDA.http://www.fns.usda.gov/fns/about.htm(accessed May 1, 2008).
486 U.S. Department of Agriculture, Food andNutrition Service. National School Lunch Program.Washington, D.C.: U.S. Department ofAgriculture, July 2007. http://www.fns.usda.gov/cnd/Lunch/AboutLunch/NSLPFactSheet.pdf(accessed April 30, 2008).
487 Ibid.
488 Ibid.
489 U.S. Department of Agriculture, Food andNutrition Service. “Child and Adult Care FoodProgram.” USDA. http://www.fns.usda.gov/cnd/care/CACFP/aboutcacfp.htm (accessedApril 30, 2008).
490 U.S. Department of Agriculture, Food andNutrition Services. WIC The Special SupplementalNutrition Program for Women, Infants and Children.Washington, D.C.: U.S. Department ofAgriculture, 2006. http://www.fns.usda.gov/wic/WIC-Fact-Sheet.pdf (accessed June 3, 2008).
491 Committee to Review the WIC Food Packages,Food and Nutrition Board. WIC Food Packages:Time for a Change. Washington, D.C.: NationalAcademies Press, 2005.
492 U.S. Department of Agriculture, Food andNutrition Service. “WIC ProgramParticipation and Costs.” U.S. Department ofAgriculture. http://www.fns.usda.gov/pd/wisummary.htm (accessed April 30, 2008).
493 U.S. Department of Agriculture, Food andNutrition Service. “WIC Farmers’ MarketNutrition Program.” U.S. Department ofAgriculture. http://www.fns.usda.gov/wic/FMNP/FMNPfaqs.htm (accessed April 30, 2008).
494 Ibid.
495 U.S. Department of Agriculture, Food andNutrition Service. Senior Farmers’ MarketNutrition Program. Washington, D.C.: U.S.Department of Agriculture, 2007.
496 Ibid.
497 U.S. Department of Agriculture, Food andNutrition Service. “Commodity SupplementalFood Program.” U.S. Department ofAgriculture. http://www.fns.usda.gov/fdd/programs/csfp/about-csfp.htm (accessedApril 30, 2008).
498 U.S. Department of Agriculture, Food andNutrition Service. Commodity Supplemental FoodProgram Fact Sheet. Washington, D.C.: U.S.Department of Agriculture, April 2008.http://www.fns.usda.gov/fdd/programs/csfp/pfs-csfp.pdf (accessed April 30, 2008).
499 Ibid.
500 U.S. Department of Agriculture. “Center forNutrition Policy and Promotion.” U.S. Depart -ment of Agriculture. http://www.usda.gov/cnpp/. (accessed June 3, 2008).
501 TRICARE. “Healthy Choices Initiatives InsideDoD.” TRICARE.mil. http://www.tricare.mil/healthychoices/init.cfm (accessed June 4, 2008).
502 Department of Defense Education Activity.“About DEA.” U.S. Department of Defense.http://www.dodea.edu/home/about.cfm(accessed May 1, 2008).
503 Federal Trade Commission. “FTC, HHS ReleaseReport on Food Marketing and ChildhoodObesity: Recommends Actions by FoodCompanies and the Media.” News Release, May2, 2006. http://www.ftc.gov/opa/2006/05/childhoodobesity.shtm (accessed April 30, 2008).
504 Administration on Aging. “You Can.” U.S.Department of Health and Human Services.http://www.aoa.gov/youcan/ (accessed April29, 2008).
505 U.S. Centers for Disease Control and Prevention.“The Preventive Health and Health ServicesBlock Grant.” U.S. Department of Health andHuman Services. http://www.cdc.gov/nccdphp/blockgrant/ (accessed April 29, 2008).
143
506 U.S. Centers for Disease Control and Prevention(CDC). Steps to a HealthierUS Program: PreventingChronic Diseases Through Local Community Action.Atlanta, GA: CDC, 2007.
507 U.S. Centers for Disease Control and Prevention,National Center for Health Statistics. “AboutNCHS.” U.S. Department of Health and HumanServices. http://www.cdc.gov/nchs/about.htm(accessed April 29, 2008).
508 Institute of Medicine. Progress in Preventing Child -hood Obesity: How Do We Measure Up? Washington,D.C.: The National Academies Press, 2007.
509 U.S. Centers for Disease Control and Prevention.“Healthier Worksite Initiative - About Us.” U.S.Department of Health and Human Services.http://www.cdc.gov/nccdphp/dnpa/hwi/about_us/index.htm. (accessed June 26, 2008.)
510 U.S. Food and Drug Administration. CaloriesCount: Report of the Working Group on Obesity.Washington, D.C.: U.S. Department of Healthand Human Services, March 2004.http://www.cfsan.fda.gov/~dms/owg-toc.html(accessed May 1, 2008).
511 U.S. Food and Drug Administration, Centerfor Food Safety and Applied Nutrition. “Spotthe Block - Campaign at a Glance.” U.S.Department of Health and Human Services.http://www.cfsan.fda.gov/~dms/spotcaag.html(accessed April 29, 2008).
512 U.S. Department of Health and HumanServices. U.S. Department of Health and HumanServices Budget in Brief Fiscal Year 2009.Washington, D.C.: U.S. Department of Healthand Human Services, 2008.http://www.hhs.gov/budget/09budget/2009BudgetInBrief.pdf (accessed May 29, 2008).
513 Indian Health Service. “Health Promotionand Disease Prevention - Welcome.” U.S.Department of Health and Human Services.http://www.ihs.gov/NonMedicalPrograms/HPDP/index.cfm (accessed June 27, 2008).
514 U.S. Department of Health and HumanServices (DHHS). Fiscal Year 2009 -- IndianHealth Service Justification of Estimates forAppropriations Committees. Washington, D.C.:DHHS, 2008.
515 National Institutes of Health. “Strategic Planfor NIH Obesity Research.” U.S. Departmentof Health and Human Services.http://obesityresearch.nih.gov/about/strategic-plan.htm (accessed April 29, 2008).
516 Office of the Surgeon General. “About theOffice of the Surgeon General.” U.S.Department of Health and Human Services.http://www.surgeongeneral.gov/aboutoffice.html#dutiessg. (accessed May 1, 2008).
517 U.S. Department of Health and HumanServices, Office of the Surgeon General.“Childhood Obesity Prevention.” U.S.Department of Health and Human Services.http://www.surgeongeneral.gov/obesityprevention.html (accessed April 29, 2008).
518 U.S. Department of Health and HumanServices, Office of Women’s Health. “WOMANChallenge: Woman and Girls Out Moving Acrossthe Nation.” U.S. Department of Health andHuman Services. http://www.4woman.gov/woman/index.cfm (accessed April 30, 2008).
519 United States Department of the Interior,Bureau of Land Management. “Take It Outside:Children and Nature Initiative” ProgramAnnouncement and Incentive Funding, ProjectCriteria and Application Process Information,Information Bulletin No. 2008-045. Washington,D.C.: U.S. Department of the Interior, 2008.
520 U.S. Department of the Interior, National ParkService. “Improve your Life: Be Fit, Have Fun, GetHealthy in Your National Parks.” Press Release,June 12, 2006. http://home.nps.gov/applications/digest/headline.cfm?type=PressReleases&id=659&urlarea=npsnews (accessed April 30, 2008).
521 U.S. Department of the Interior, National ParkService. Land and Water Conservation Fund StateAssistance Program 2007 Annual Report. Washington,D.C.: U.S. Department of the Interior, 2007.
522 U.S. Department of the Interior, National ParkService. “Current Funding for Grants.” U.S.Department of the Interior.http://www.nps.gov/ncrc/programs/lwcf/funding.html (accessed May 28, 2008).
523 U.S. Department of the Interior, National ParkService. “Pathways to Healthy Living: HealthProjects.” U.S. Department of the Interior.http://www.nps.gov/ncrc/portals/health/healthprojects.htm (accessed April 30, 2008).
524 Ibid.
525 Frank, L. D., M. A. Andresen, and T. L. Schmid.“Obesity Relationships with Community Design,Physical Activity, and Time Spent in Cars.”American Journal of Preventive Medicine 27, no. 2(2004): 87-96.
526 U.S. Department of Transportation. “Missionand History.” U.S. Department ofTransportation. http://www.dot.gov/mission.htm (accessed April 30, 2008).
527 U.S. Department of Transportation, FederalHighway Administration. “TransportationEnhancement Activities.” U.S. Department ofTransportation. http://www.fhwa.dot.gov/environment/te/ (accessed April 30, 2008).
528 Federal Highway Administration. “Bicycle andPedestrian Provisions in (SAFETEA-LU) NotCodified in Title 23.” U.S. Department ofTransportation. http://www.fhwa.dot.gov/environment/bikeped/legtealu.htm (accessedMay 8, 2008).
529 Federal Highway Administration. “Fact Sheetson Highway Provisions.” U.S. Department ofTransportation. http://www.fhwa.dot.gov/safetealu/factsheets/nonmotorized.htm(accessed May 8, 2008).
530 Posey, C.L. “Deduction or Distraction? The U.S.Treasury’s Stance on Obesity.” The CPA Journal,July 2003.
531 U.S. Department of Veterans Affairs. “MOVE!Weight Management Program.” U.S. Departmentof Veterans Affairs. (accessed June 3, 2008).
532 U.S. Department of Veterans Affairs.“HealthierUS Veterans: A Prescription forHealth.” U.S. Department of Veterans Affairs.http://www.healthierusveterans.va.gov/PrescriptionForHealth.asp (accessed May 1, 2008).

1730 M Street, NW, Suite 900Washington, DC 20036
(t) 202-223-9870(f) 202-223-9871