How not to run an election The Police & Crime Commissioner ...€¦ · Returning Officers...
28
How not to run an election The Police & Crime Commissioner Elections 15 November 2012 | Jess Garland & Chris Terry Report & Analysis
Transcript of How not to run an election The Police & Crime Commissioner ...€¦ · Returning Officers...
How not to run an electionThe Police & Crime Commissioner Elections15 November 2012 | Jess Garland & Chris Terry Report &
Analysis

Electoral Reform Society Thomas Hare House 6 Chancel StLondonSE1 0UU
Email: [email protected]: 020 7928 1622Web: www.electoral-reform.org.ukTwitter: @electoralreform

How not to run an electionThe Police & Crime Commissioner Elections15 November 2012 | Jess Garland & Chris Terry Report &
Analysis


Contents
5 Introduction
9 Active Participation?
13 Fair Representation?
19 Afterword
22 Appendix


Introduction5
election was conducted, the Government has not conceded that errors were made. There was no shortage of warnings: from us; from candidates; from the independent Electoral Commission. Yet all were ignored. One government minister even insisted the “carping” about the elections was just a “silly season story”.2
The news of the failures became so widespread that at least some voters came to know about the new office, even if for many it was after the ballot boxes had been emptied. However, polling shows that any awareness of who had been elected did not last that long. In fact, although the turnout of 15% was considered dismal by everyone (apart from the Government), it seems that even fewer people than actually voted can name their local PCC.
A poll, conducted by Populus in the last week of January 20133, showed that only 11% of respondents could correctly name the person elected for their area. In other words, after spending £75 million holding the elections and millions more to staff and resource officeholders, nearly 90% of Britons have no idea who their elected police and crime commissioner is.
There are lessons to be learnt which we want to see implemented for the next PCC election:
Never hold another election in the winter months which discourages people from turning out. Never leave voters in the dark about who or what they are voting for - ensure information on candidates is provided in mailings to voters. Ensure a level playing field for candidates through well-designed election rules.
On 15 November 2012 English and Welsh voters went to the polls to elect the first Police and Crime Commissioners (PCCs).
The election saw the lowest turnout in peacetime history with only 15.1% of voters turning out.
The post was introduced by the Police Reform and Social Responsibility Act 2011 which abolished police authorities, previously responsible for overseeing police forces, and replaced them with directly elected Police and Crime Commissioners. The Commissioners have a fixed four year term of office, limited to two terms and are elected by the Supplementary Vote.
The Home Office stated a desire to “empower the public - increasing local accountability and giving the public a direct say on how their streets are policed”.1 Unfortunately on 15 November 2012 less than 1 in 5 members of the public chose to take up this opportunity. This flagship policy was poorly delivered and failed both candidates and voters alike.
From the start, the PCC elections looked set to be an exercise in how not to run an election. The date of the election was moved from May to November creating the first barrier to voters turning out. Voters were then left in the dark about who they could vote for with a lack of centrally provided candidate information. Candidates were kept away by huge deposits, unclear eligibility rules, vast electoral districts and high campaign costs.
The Electoral Reform Society predicted these factors could add up to extremely low turnout – 18.5%. Unfortunately we were proved right.This report sets out the problems leading up to and including polling day on 15 November 2012. Despite calls from many people at the time to acknowledge the deficiencies at the way the
Jess Garland & Chris TerryHow not to run an electionThe Police and Crime Commissioner Electons
1. Policing in the 21st Century: Reconnecting police and the people, Home Office White Paper, July 2010.
2. Daily Telegraph, 18 August 2012, Turnout of 18% predicted for police commissioner election ‘shambles’http://www.telegraph.co.uk/news/uknews/law-and-order/9483006/Turnout-of-18-predicted-for-police-commissioner-election-shambles.html 3. Electoral Reform Society PCC Poll, Conducted by Populus, 30-31 January 2013, sample 1624 adults in England and Wales (excluding London).

Jess Garland & Chris TerryA Comedy of ErrorsThe Police and Crime Commissioner ElectonsX

Democratic accountability requires active participation and fair representation. The Police and Crime Commissioner elections failed to provide either for candidates or voters. This report provides a brief overview of the elections, the results and the candidate and voter experience.
We hope that the next elections will remedy the mistakes made in 2012.
Katie GhoseChief ExecutiveElectoral Reform Society
7Jess Garland & Chris TerryHow not to run an electionThe Police and Crime Commissioner Electons


9Jess Garland & Chris Terry
The Police and Crime Commissioner elections put up a number of obstacles for both voters and candidates. The result was low awareness amongst voters and correspondingly low participation resulting in the lowest peace-time turnout of any national election at just over 15%.
Why people didn’t voteAn ERS poll conducted by Populus immediately after the election found that:
45% of people who did not vote said they “didn’t have enough information about the candidates to make a decision”. In our survey the second most popular reason given for not voting was disagreement with the position itself. Nearly 1 in 5 non-voters said they “don’t agree with electing police officials in this way”.
It is clear that voters were suspicious about the nature of the post, confused about the reasons for conferring election upon it and in the dark about those standing for it. A failure to engage voters in this election meant that many simply chose not to participate.
No information The level of public awareness for the election was staggeringly low with voters left in the dark about who or what they were voting for. In our survey of PCC candidates we found that 88% of candidates felt that public awareness of the election was low, of these 62% thought it was very low.4 One candidate commented “The Government’s communication strategy was a complete disaster”.
Voter awareness was further depressed by a lack of information. Information on candidates was
How not to run an electionThe Police and Crime Commissioner Electons
Active Participation?
What kept people at home?
45%
19%
18%
18% I didn’t have enough information about the candidates to make a decision
I don’t agree with electing police officials this way
I wasn’t interested
Other
Electoral Reform Society PCC Poll, conducted by Populus, 16-19th November 2012, sample 1117, adults in England and Wales (excluding London).
4. ERS survey of PCC candidates, 16-27 November 2012, sample 46 candidates. We surveyed candidates and voters to find out their impressions of the election. Our candidate survey was completed by over a quarter of those who stood.
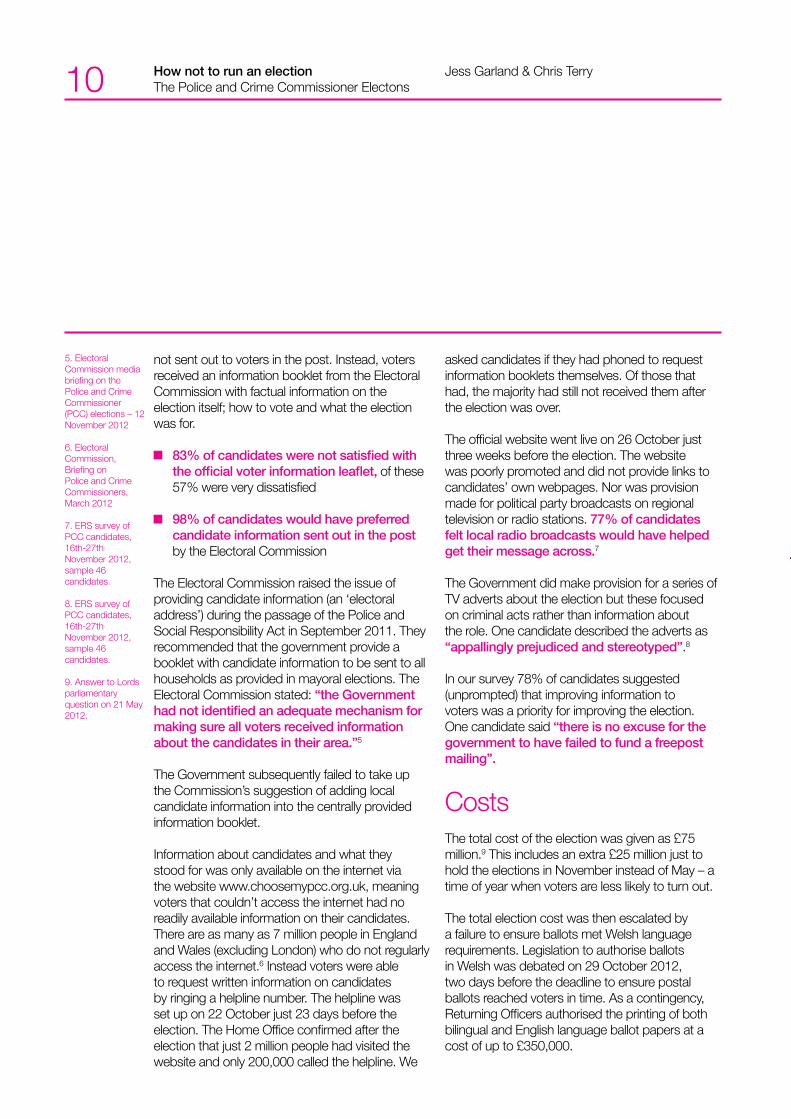
not sent out to voters in the post. Instead, voters received an information booklet from the Electoral Commission with factual information on the election itself; how to vote and what the election was for.
83% of candidates were not satisfied with the official voter information leaflet, of these 57% were very dissatisfied 98% of candidates would have preferred candidate information sent out in the post by the Electoral Commission
The Electoral Commission raised the issue of providing candidate information (an ‘electoral address’) during the passage of the Police and Social Responsibility Act in September 2011. They recommended that the government provide a booklet with candidate information to be sent to all households as provided in mayoral elections. The Electoral Commission stated: “the Government had not identified an adequate mechanism for making sure all voters received information about the candidates in their area.”5
The Government subsequently failed to take up the Commission’s suggestion of adding local candidate information into the centrally provided information booklet.
Information about candidates and what they stood for was only available on the internet via the website www.choosemypcc.org.uk, meaning voters that couldn’t access the internet had no readily available information on their candidates. There are as many as 7 million people in England and Wales (excluding London) who do not regularly access the internet.6 Instead voters were able to request written information on candidates by ringing a helpline number. The helpline was set up on 22 October just 23 days before the election. The Home Office confirmed after the election that just 2 million people had visited the website and only 200,000 called the helpline. We
asked candidates if they had phoned to request information booklets themselves. Of those that had, the majority had still not received them after the election was over.
The official website went live on 26 October just three weeks before the election. The website was poorly promoted and did not provide links to candidates’ own webpages. Nor was provision made for political party broadcasts on regional television or radio stations. 77% of candidates felt local radio broadcasts would have helped get their message across.7
The Government did make provision for a series of TV adverts about the election but these focused on criminal acts rather than information about the role. One candidate described the adverts as “appallingly prejudiced and stereotyped”.8
In our survey 78% of candidates suggested (unprompted) that improving information to voters was a priority for improving the election. One candidate said “there is no excuse for the government to have failed to fund a freepost mailing”.
Costs The total cost of the election was given as £75 million.9 This includes an extra £25 million just to hold the elections in November instead of May – a time of year when voters are less likely to turn out.
The total election cost was then escalated by a failure to ensure ballots met Welsh language requirements. Legislation to authorise ballots in Welsh was debated on 29 October 2012, two days before the deadline to ensure postal ballots reached voters in time. As a contingency, Returning Officers authorised the printing of both bilingual and English language ballot papers at a cost of up to £350,000.
Jess Garland & Chris TerryHow not to run an electionThe Police and Crime Commissioner Electons10
5. Electoral Commission media briefing on the Police and Crime Commissioner (PCC) elections – 12 November 2012
6. Electoral Commission, Briefing on Police and Crime Commissioners, March 2012
7. ERS survey of PCC candidates, 16th-27th November 2012, sample 46 candidates.
8. ERS survey of PCC candidates, 16th-27th November 2012, sample 46 candidates.
9. Answer to Lords parliamentary question on 21 May 2012.

The election was expensive for candidates too. The deposit for the election was set at £5,000; 10 times that required to stand as an MP or elected Mayor. The size of constituencies also created additional sizeable costs. Our survey found that 93% of candidates experienced difficulties associated with campaigning over large electoral districts.
The average PCC electorate was 885,778 and the average PCC area was 3,660km2 (approximately the same size as Essex). The largest Police area by population was Greater Manchester with an electorate of 2,002,284 (an area covered by 28 parliamentary constituencies), whereas the smallest was Dyfed-Powys, with an electorate of 394,78410. By geographical size, the largest Police Area was Dyfed-Powys at 10,976km2, covering more than half of Wales. The smallest Police Area was Cleveland, covering just 597km2.
These huge constituencies created pressures for candidates. On her withdrawal from running in South Yorkshire, Independent candidate Gillian Radcliffe stated that, “An expert in political campaigns has told me that even ‘doing it on the cheap’ would cost at least £50,000. I simply don’t have that sort of money, or anything like it.”11
The spending limits for such large districts were incredibly high. For the West Midlands area the spending limit was £357,000 reflecting how costly it was for candidates to try to reach such a large population.
Based on figures from the Police Foundation,12 forty-six candidates withdrew from the race. Fourteen of those candidates stated that the reason was at least partially motivated by the costs, or it being difficult to compete against the major parties (implying a comparative lack of resource).
It was not easy for party political candidates either. Of the three main parties only Labour
provided funding for the deposits of all their candidates. Conservative candidates had to raise their own funds, or borrow them from local party associations13 whereas the Liberal Democrats Federal Executive Committee decided that regional parties could stand candidates if they wished but would receive no financial backing from the central party.14
This lack of funding would not have been such an issue if the costs of campaigning were not so high. The lack of a free mail out and broadcasting subsidies for candidates only added to the problem. Considering the sheer scale of constituencies, reaching a large number of voters was extremely expensive. This combined with the lack of support from central government to create an extremely high threshold for candidates.
Other barriers The PCC election failed to promote voter participation and also failed candidates. The rules for this election, set out in the legislation, created a number of access problems for candidates. The Electoral Commission expressed concerns saying, “these rules have meant that a number of people who intended to stand as candidates have had to withdraw.”15
Early in the contest a number of candidates were forced to withdraw because of minor misdemeanours in their teenage years. According to the Police Reform and Social Responsibility Act 2011, those who had committed a crime for which a prison sentence could be applied at age 18 were disqualified from running to be a PCC.
The issue came to widespread attention when Falklands war veteran Simon Weston withdrew amid substantial confusion over whether he was able to stand or not due to a teenage conviction. Home Secretary, Theresa May, claimed that “it was not our intention to bar people like Simon Weston
11Jess Garland & Chris TerryHow not to run an electionThe Police and Crime Commissioner Electons
10. Electorate figures kindly provided by the BBC’s Political Research Unit, with figures gathered from each Police Area Returning Officer. 11. Radcliffe, Gillian Gillian Radcliffe withdraws from South Yorkshire PCC election http://topofthecops.com/2012/09/13/gillian-radcliffe-withdraws-from-south-yorkshire-pcc-election/ Published: 13/09/2012
12. Available at http://www.police-foundation.org.uk/uploads/holding/projects/pcc_candidates_update.pdf
13. Daily Telegraph, August 25, 2012,Tory police candidates must find £5,000 deposits while Labour fund theirs
14. Pack, Mark Liberal Democrats decide to pass up on fighting Police Commissioner elections (mostly) http://www.libdemvoice.org/liberal-democrats-decide-to-pass-up-on-fighting-police-commissioner-elections-mostly-25734.html Published: 27/10/2011 15. Electoral Commission media briefing on the Police and Crime Commissioner (PCC) elections – 12 November 2012
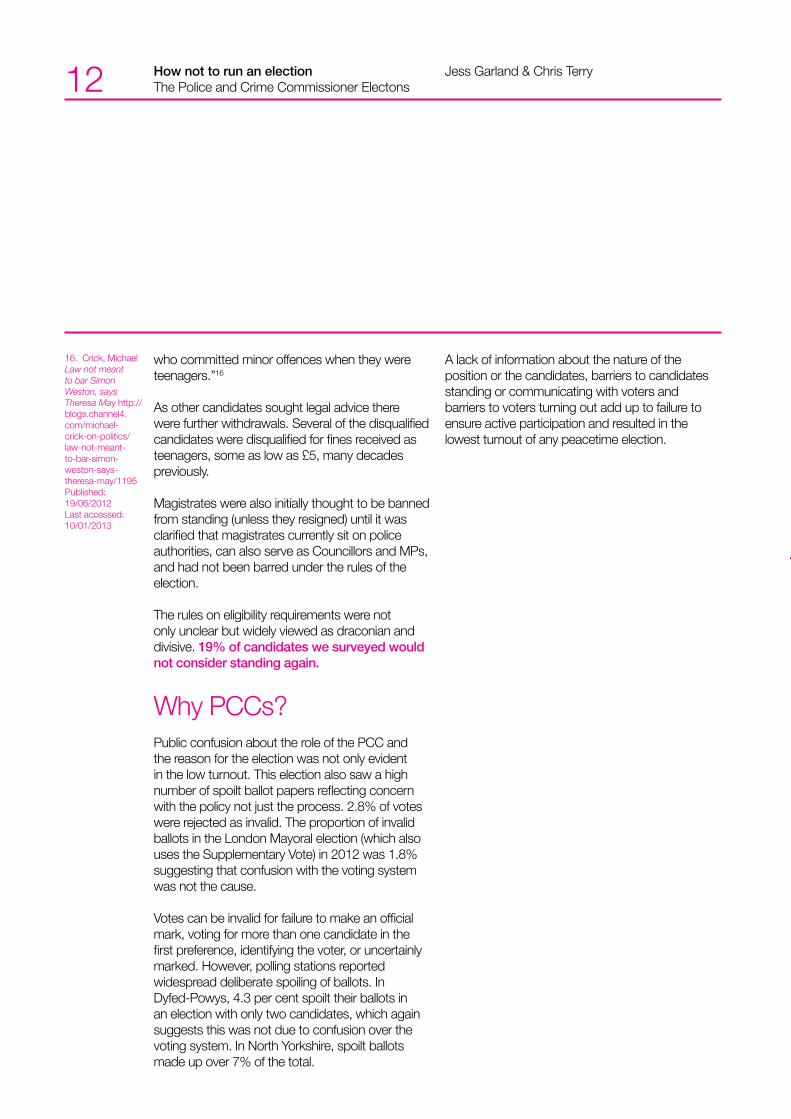
who committed minor offences when they were teenagers.”16
As other candidates sought legal advice there were further withdrawals. Several of the disqualified candidates were disqualified for fines received as teenagers, some as low as £5, many decades previously.
Magistrates were also initially thought to be banned from standing (unless they resigned) until it was clarified that magistrates currently sit on police authorities, can also serve as Councillors and MPs, and had not been barred under the rules of the election.
The rules on eligibility requirements were not only unclear but widely viewed as draconian and divisive. 19% of candidates we surveyed would not consider standing again.
Why PCCs?
Public confusion about the role of the PCC and the reason for the election was not only evident in the low turnout. This election also saw a high number of spoilt ballot papers reflecting concern with the policy not just the process. 2.8% of votes were rejected as invalid. The proportion of invalid ballots in the London Mayoral election (which also uses the Supplementary Vote) in 2012 was 1.8% suggesting that confusion with the voting system was not the cause. Votes can be invalid for failure to make an official mark, voting for more than one candidate in the first preference, identifying the voter, or uncertainly marked. However, polling stations reported widespread deliberate spoiling of ballots. In Dyfed-Powys, 4.3 per cent spoilt their ballots in an election with only two candidates, which again suggests this was not due to confusion over the voting system. In North Yorkshire, spoilt ballots made up over 7% of the total.
A lack of information about the nature of the position or the candidates, barriers to candidates standing or communicating with voters and barriers to voters turning out add up to failure to ensure active participation and resulted in the lowest turnout of any peacetime election.
Jess Garland & Chris TerryHow not to run an electionThe Police and Crime Commissioner Electons12
16. Crick, Michael Law not meant to bar Simon Weston, says Theresa May http://blogs.channel4.com/michael-crick-on-politics/law-not-meant-to-bar-simon-weston-says-theresa-may/1195 Published: 19/06/2012 Last accessed: 10/01/2013

In the 41 Police Areas 192 candidates stood for the Police and Crime Commissioner election. Only Labour and the Conservatives stood candidates in every area. The Liberal Democrats and UKIP stood candidates in slightly more than half of all areas, with the Liberal Democrats standing 23 candidates and UKIP 24.
The only other party to stand more than one candidate was the English Democrats, who stood 5. There were 58 other candidates and 54 of these were Independents. Two stood on the ballot line of what appear to be one man parties, who may, therefore, be considered de facto Independents, such as Don Jerrard of the Justice and Anti-Corruption Party in Hampshire and the Isle of Wight. Joe Michna in Cleveland stood as
the sole candidate of the Green Party of England and Wales, and Kevin Carroll, deputy leader of the English Defence League, stood for the British Freedom Party.
A full list of election candidates can be seen in Appendix 1, and the winners for each area are given in Appendix 2.
The ResultsLabour won the largest number of first preference votes, winning 32.1% of the votes, against 27.7% for the Conservatives and 25.1% for Independents and minor parties. However, the Conservatives won the largest number of Police and Crime Commissioners, 16 compared to Labour’s 13 and 12 Independents.
Independents and ‘one man parties’ performed particularly well in this election, winning a quarter of the available votes and securing 12 Police Areas. In one area, Lincolnshire, the second round ended in a contest between two different Independents. The success of independent candidates is particularly notable considering that in six areas no independent candidate or minor party candidate stood.
13Jess Garland & Chris TerryHow not to run an electionThe Police and Crime Commissioner Electons
Fair Representation?
PCC Candidates by party
Party Total Candidates
Labour 41Conservative 41Lib Dem 23UKIP 24 English Democrats 5Other 58Total 192
Party performance
Party First % First Second % Second Elected Preferences Preferences Preferences Preferences PCCsLabour 1,716,022 32.1% 170,976 26% 13Conservative 1,480,323 27.7% 239,195 36% 16Liberal Democrat 376,493 7.0% 0* 0% 0UKIP 375,587 7.0% 0* 0% 0English Democrat 59,308 1.1% 0* 0% 0Other 1,342,308 25.1% 248,321 38% 12Total 5,350,041 658,492
*Parties with candidates that did not proceed to second round in any contest.

Of the twelve independent candidates elected, all twelve had previously had at least some experience working in the criminal justice system with three holding positions as magistrates, five as police officers, and four serving on Police Authorities. In several cases the current Chair of the Police Authority essentially moved directly into being the new Police and Crime Commissioner.
The former occupations of the Independents elected as PCCs suggests that voters particularly favoured candidates with criminal justice backgrounds and may therefore have been confirmation of the desire (expressed in our voter survey) to avoid ‘politicising the police’.
Second preferences largely appeared to favour Independents and the Conservatives. However it is hard to tell how representative this is as only 658,492 voters cast valid second preferences (out of the 5,350,041 votes cast). It is also worth noting that 5 Labour candidates and 3 Conservative candidates were elected outright in the first round
(second preferences were not counted in these areas).
The electoral system
This election gave us a chance to see the Supplementary Vote in practice. In this system a ballot paper has two columns, one for the voter’s first preference and one for their second preference. If a candidate wins more than 50% of first preferences then they are elected. If not, all but the top two candidates are eliminated and second preferences to those two candidates are re-distributed. The candidate winning the largest number of votes is then elected.
The Supplementary Vote is also used to elect directly-elected mayors in English local government. Both elected mayors and Police and Crime Commissioners are single-member executive positions with strong local powers and the system is deemed most suitable as it should produce a wider mandate than First Past the Post.
Jess Garland & Chris TerryHow not to run an electionThe Police and Crime Commissioner Electons14
Background of elected Independents
Candidate Police Area Former job(s)
Sue Mountstevens Avon and Somerset Magistrate, Member of local police authorityMartyn Underhill Dorset Police Detective InspectorMartin Surl Gloucestershire Senior Police OfficerIan Johnston Gwent Chief Constable of British Transport PoliceSimon Hayes Hampshire Chair of regional branch of Crimestoppers, Chair of Hampshire Police Authority, Local councillorAnn Barnes Kent Magistrate, Chair of Kent Police AuthorityAlan Hardwick Lincolnshire Journalist, TV presenter, Police Authority media officerStephen Bett Norfolk Chair of Norfolk Police Authority, Local councillorWinston Roddick North Wales Police officer, barrister, counsel general for WalesKevin Hurley Surrey Detective Chief Superintendent in the Metropolitan Police, Senior Police advisor in Iraq, Head of the Counter Terrorism and Public Order department for City of London PoliceRon Ball Warwickshire Pilot, magistrateBill Longmore West Mercia Superintendent, businessman

The system does not necessarily mean that the elected candidate gets a majority of the vote, however and has been strongly criticised by some political scientists, most recently Professors Rallings and Thrasher. They criticise the system for being needlessly confusing to voters. This is because if voters are to use their second preference most effectively they must anticipate which candidates are going to be in the top two and then make a strategic decision about which of the likely two they prefer. As the number of candidates increases, it becomes correspondingly more difficult to judge which candidates will reach the second round.17
In three Police Areas, Dyfed-Powys, North Yorkshire and Staffordshire, only two candidates stood. In five Police areas, Durham, Greater Manchester, Merseyside, Northumbria, and South Yorkshire a candidate won more than 50% of the vote in the same round. Therefore in these areas the winning candidate would have almost certainly been the same under any majoritarian electoral system, including other alternatives such as First Past the Post and the Alternative Vote. However, other areas produced results useful for analysis.
In Devon and Cornwall, having ten candidates on the ballot illustrated one of the shortcomings of the Supplementary Vote. As SV limits the voter to two preferences, in elections with more than three candidates there can be a certain amount of guesswork involved. Of the 110,689 voters who did not cast their first preference for one of the two top candidates, 89,003 (80.4%) did not cast a valid second preference vote. It may be true that some voters did not have a preference between the two second-round candidates but it is difficult to believe that this stretched to 80% of the voters in Devon and Cornwall. This demonstrates the problem that voters would have had using SV with a large number of candidates on the ballot.
In a First Past the Post election it is possible for divisive candidates to be elected against the wishes of the majority if they face a divided opposition.
The Supplementary Vote partially remedies this by giving voters the opportunity to express a second preference, with divisive candidates unlikely to pick up many second preferences. Eight candidates came from second to win when they received second preferences, and another candidate who would have won had the election been First Past the Post subsequently lost.
However, of the 33 elected PCCs who did not receive a majority in the first round, only 11 achieved the support of a majority of voters when second preferences were included. In all, only 19 of the 41 PCCs were elected with a majority of support from voters, including 3 PCCs elected in straight two candidate races.
The picture of SV from the elections is clearly mixed. On the one hand the system has allowed the election of candidates on stronger mandates than they would have received under First Past the Post, and this is important for a single member executive position like this. However the system encounters problems as the number of candidates increases. The system still falls short of the Alternative Vote which would allow for a broader representative base for candidates, by giving voters the opportunity to cast as many preferences as they wish.
Weak Mandates
The low turnout of the election resulted in some extraordinarily weak mandates. The ‘mandate’
15Jess Garland & Chris TerryHow not to run an electionThe Police and Crime Commissioner Electons
17. Rallings, Colin, Thrasher, Michael and Cowling, David Mayoral referendums and elections: Uninterested electors and unknowing voters http://www.sociology.ox.ac.uk/documents/epop/papers/mayoral_referendums_and_elections_epop2012.pdf Paper presented: 07/09/12 Last accessed: 20/01/2013
Mandates - highs and lows
Police Area Mandate
Lowest Essex 4.7% Mandate Highest Avon & 10.1%Mandate SomersetAverage - 7.1% Mandate

figures provided in these tables is a calculation based upon the percentage of the electorate that endorsed the winning candidate. This was calculated on the basis of dividing the number of first and second preferences by the number of total eligible voters.
A full list of winning PCCs and their mandates is given in Appendix 2.
Only one PCC achieved a mandate of more than 10% of all eligible voters – Sue Mountstevens (Independent) in Avon and Somerset. One PCC, Nicholas Alston in Essex, achieved a mandate of less than 5%, one in twenty voters. On average PCCs had a mandate of 7.1%, less than three out of every forty eligible voters.
On the day of the PCCs election it was claimed by the Home Secretary, Theresa May, that PCCs would become the “voice of the people” and will be “visible, accessible and accountable”.18 It is difficult to see how this can be the case when in less than one in ten voters voted for their PCC.
Diversity?In total, only six women and no Black and Minority Ethnic (BAME) candidates were elected as Police and Crime Commissioners.
The two successful Labour women PCCs, Vera Baird and Jane Kennedy, won more than 50% of
first preferences and were thus elected in the first round. North Yorkshire was an interesting case as there were only two candidates, one Conservative and one Labour, both of whom were women. In some cases, however, women who may have been seen as very likely to win in fact lost to men. In Dyfed-Powys and Staffordshire, straight two candidate fights between a Labour woman and a Conservative man ended with the Conservative elected by less than four percentage points in both cases. In Gloucestershire and Surrey, Conservative women candidates lost to Independents. These are areas where the Conservative candidate would have been considered to have a strong chance of victory.
The lack of a single PCC of a Black or Ethnic Minority background is also concerning. The various independent candidates all struggled and none reached the second round. Neither of Labour’s two BAME candidates managed to get into the second round either. The best performing BAME candidate was the Conservative’s Jas Parmar, who lost to Labour’s Oliver Martins by just 3,858 votes in the second round in Bedfordshire. The lack of any other BAME candidates in winnable positions demonstrates a considerable problem for wider-representation. Ultimately the failure to elect more diverse PCCs comes down to a dearth of women and BAME candidates.
Of the 192 candidates, 35 were women, just 18.2% of the candidates. However, the proportion
Jess Garland & Chris TerryHow not to run an electionThe Police and Crime Commissioner Electons16
18. Daily Mail Online Landslide victory for Voter Apathy: The nation’s crushing verdict on elections for police chiefs… a turnout of only 14% http://www.dailymail.co.uk/news/e-2233386/Landslide-victory-voter-apathy-The-nations-crushing-verdict-elections-police-chiefs--turnout-14.html Published: 15/11/2012 Last Accessed: 06/02/2013
Range of mandates
PCC mandates Frequency
Under 5% 15-6.5% 126.6-7.5% 157.6-9% 119.1%-10% 1Over 10% 1
Female PCC Candidates by party
Party Female % Candidates FemaleLabour 15 36.6%Conservative 6 14.6%Lib Dem 4 17.4%UKIP 3 12.5%English Democrats 0 0.0%Other 7 12.1%Total 35 18.2%

of women elected, 14.6%, was actually slightly but noticeably lower than the proportion of candidates. Achieving gender representation is not just about selecting women but also about selecting women in winnable areas. It is noticeable, that Labour’s women candidates were disproportionately in Police Areas covering regions where the party is typically weak. Of the five Police Areas in South West England, an area of significant weakness for Labour, women candidates were selected in four. All but Avon and Somerset which may have been the most favourable to Labour as it includes Bristol. In Wales, an area of strength for Labour, only one Police Area had a woman Labour candidate, Dyfed-Powys, the weakest of the four areas for Labour.
Women Labour candidates were thus disproportionately more likely to be selected in rural and southern English Police Areas where Labour tends to be much weaker electorally. However, two women candidates were selected to stand in the two safest Labour areas (Jane Kennedy in Merseyside and Vera Baird in Northumbria) both former ministers.
Of the six Conservative candidates only Caroline Jones in South Wales and Geraldine Carter in West Yorkshire could be said to be in Police Areas which clearly favoured the opposition party. Therefore Conservative women PCC candidates were, compared to Labour, overrepresented in winnable seats. This is however in the context of nominating only two fifths as many women as Labour in the first place.
Of the three main parties the Lib Dems nominated the least women, only four. However, they only stood candidates in twenty-three Police Areas, only slightly more than half (56.1%) of the available positions. Thus proportionately they had the second highest number of women candidates (17.4%). UKIP stood the lowest number of women of those parties who stood a significant number of candidates, just three (12.5%) and none of the five
English Democrat candidates were women. It should also be noted that of the fifty-eight candidates who were independent or the sole candidate nominated by their party, only seven (12.1%) were women, a lower proportion than for any party besides the English Democrats. As those candidates represented almost one third (30.2%) of the available candidates the low proportion of women standing as independents or for minor parties was particularly damaging to voter choice.Overall women were severely underrepresented amongst PCC candidates. Fifteen Police Areas had no woman candidate. A further eighteen had only one woman candidate, seven had two women candidates and one Police Area, Merseyside, had three women candidates. On average, each PCC area had just 0.9 women candidates. In Devon and Cornwall just one of the ten available candidates was a woman. In contrast there was only one Police Area where there were no male candidates. The North Yorkshire contest featured only two candidates, (one Labour and one Conservative), both women. Six additional Police Areas achieved gender balance. However, these areas are exceptions and the overall picture was slanted heavily against women.
As of the 2011 census, 14% of the usual resident population of the UK was of non-White origin . By contrast, only fourteen (7.3%) of PCC candidates were of non-white origin, approximately half the national equivalent.19
17Jess Garland & Chris TerryHow not to run an electionThe Police and Crime Commissioner Electons
19. Office for National Statistics Ethnicity and National Identity England and Wales 2011 http://www.ons.gov.uk/ons/rel/census/2011-census/key-statistics-for-local-authorities-in-england-and-wales/rpt-ethnicity.html Published: 11/12/2012 Last accessed 04/01/2013
Black and Minority Ethnic PCC Candidates
Party BAME % Candidates BAME Labour 2 4.9%Conservative 1 2.4%Lib Dem 2 8.7%UKIP 0 0.0%English Democrats 0 0.0%Other 9 15.5%Total 14 7.3%

In contrast to the women candidates, the majority of black and minority ethnic (BAME) candidates, (nine of the fourteen) stood as Independents (15.5% of Independents and Other candidates). Once again, the party with the highest proportion of BAME candidates was the Liberal Democrats (though, overall, they only stood two BAME candidates) for whom 8.7% of candidates were BAME. Labour also stood two BAME candidates but this represented a much lower proportion (4.9%) because Labour stood far more candidates in total. The Conservatives stood just one BAME candidate.
Labour’s two BAME PCC candidates, Rupi Dhanda in Gloucestershire and Sherma Batson in Hertfordshire were selected in areas where Labour is traditionally weak. In contrast, Conservative candidate Jas Parmar was selected in Bedfordshire, a marginal area with areas of strength for both Labour and the Conservatives, which could be considered a winnable seat.
The low number of women and BAME candidates and the poor placement of those candidates is the primary driver behind the poor representation of both groups.
Jess Garland & Chris TerryHow not to run an electionThe Police and Crime Commissioner Electons18

19Jess Garland & Chris TerryHow not to run an electionThe Police and Crime Commissioner Electons
20. Electoral Reform Society PCC Poll, Conducted by Populus, 16-19th November 2012, sample 1117 adults in England and Wales (excluding London).
Safeguarding active participation and fair representationThe 2012 Police and Crime Commissioner elections failed to provide for either active participation or fair representation for candidates or voters.
Future elections to the post should address the democratic failings of this election by making simple changes to actively engage the public and ensure fair access for candidates.
Our recommendations:
Never hold another election in the winter months which discourages people from turning out.
Holding future PCC elections alongside existing elections in May will cut costs and raise turnout.
Never leave voters in the dark about who or what they are voting for.
Provide candidate information directly to voters through freepost mailings or a booklet with candidate election addresses and make local or regional broadcasts part of a package of awareness-raising measures.
Ensure a level playing field for candidates through well-designed election rules
A thorough review of the experience of candidates should be conducted with view to amending the rules which created unnecessary barriers. This should include reviewing the size of the deposit and ensuring clarity on eligibility.
The future of local democratic accountabilityThe failure of this election raises wider concerns about the future of local democracy; concerns that go beyond the problems of introducing one newly elected office.
Whilst there were specific errors in the handling of this election, it was not merely the processes but the policy which raised questions. Nearly 1 in 5 non-voters said they “don’t agree with electing police official in this way”20. This can be seen as a failure to communicate the value in conferring democratic accountability to the role or explaining the nature of the post. It can also be viewed as evidence of widespread public dissatisfaction with the type of democratic engagement on offer.
At the outset the Government said the aim of electing Police and Crime Commissioners was to reconnect the public and the police. With 85% of the public not turning out to vote, that objective has clearly not been met.
The Electoral Reform Society strongly supports the idea of bringing power closer to people, but we have been concerned by the way in which successive governments have chosen to deliver it. We have made a call to action, supported by thousands of concerned citizens, for all party leaders to produce a plan to give genuine power to local communities. It’s time to go back to the drawing board for local democracy:
Recent experiments in creating better local accountability have fallen flat with citizens voting ‘no’ in all but one of the Mayoral referendums and appallingly low turnout in PCC elections. Candidate-centred reforms such as the introduction of PCCs and Elected
Afterword

Jess Garland & Chris TerryHow not to run an electionThe Police and Crime Commissioner Electons20
Mayors need to have clearly defined powers and responsibilities with explanation of how they differ from the status quo. Creating the post alone is not enough to ensure local accountability.
Top-down reforms which fail to engage citizens risk deepening the divide between people and politics. The expensive experiment with PCC elections demonstrates how change without engagement leads to a lack of participation.
Piecemeal changes to the local political landscape must stop and citizens should be brought into a conversation about the local democracy they want to see. Involving citizens in shaping the local services they want and holding decision-makers to account will lead to a working democracy people want to participate in rather than ‘top down devolution’ that has manifestly failed.

21Jess Garland & Chris TerryHow not to run an electionThe Police and Crime Commissioner Electons

1. Third Party and Non-Party Candidates by Police Authority
Police Area No of Lib UKIP ED Ind F BAME Candidates Dem /OthersAvon & Somerset 4 Y N N 1 1 0Bedfordshire 5 Y N N 2 1 2Cambridgeshire 7 Y Y Y 2 0 2Cheshire 5 Y Y N 1 2 0Cleveland 4 N N N 2 0 1Cumbria 4 Y N N 1 2 0Derbyshire 4 N Y N 1 0 0Devon and Cornwall 10 Y Y N 6 1 0Dorset 4 Y N N 1 1 0Durham 4 N Y N 1 0 0Essex 6 N Y Y 2 2 0Gloucestershire 4 Y N N 1 2 1Greater Manchester 5 Y Y N 1 0 0Hampshire 6 Y Y N 2 1 0Hertfordshire 4 Y Y N 0 2 1Humberside 7 Y Y N 3 1 0Kent 6 N Y Y 2 2 1Lancashire 4 Y Y N 0 0 1Leicestershire 3 N N N 1 1 1Lincolnshire 4 N N N 2 0 0Merseyside 6 Y Y Y 1 3 0Norfolk 5 Y Y N 1 0 0North Yorkshire 2 N N N 0 2 0Northamptonshire 5 N Y N 2 0 0Northumbria 4 Y Y N 0 1 0Nottinghamshire 4 N N N 2 0 1South Yorkshire 5 Y Y Y 0 0 0Staffordshire 2 N N N 0 1 0Suffolk 4 N Y N 1 1 0Surrey 6 Y Y N 2 1 0Sussex 5 Y Y N 1 1 0Thames Valley 6 Y Y N 2 1 1Warwickshire 3 N N N 1 0 0West Mercia 3 N N N 1 0 0West Midlands 7 Y Y N 3 1 2West Yorkshire 4 Y N N 1 1 0Wiltshire 6 Y Y N 2 1 0Dyfed-Powys 2 N N N 0 1 0Gwent 4 N N N 2 0 0North Wales 5 N Y N 2 0 0South Wales 4 N N N 2 1 0 192 23 24 5 58 35 14
Jess Garland & Chris TerryHow not to run an electionThe Police and Crime Commissioner Electons22
Appendix

2. Results, Turnout and Mandates by Police Authority
Winning Winning Turnout Mandate Candidate PartyAvon & Somerset Sue Mountstevens Other 18.77% 10.1%Bedfordshire Oliver Martins Lab 17.75% 7.8%Cambridgeshire Sir Graham Bright Con 14.77% 5.3%Cheshire John Dwyer Con 13.74% 6.1%Cleveland Barry Coppinger Lab 14.73% 7.5%Cumbria Richard Rhodes Con 15.63% 6.4%Derbyshire Alan Charles Lab 14.35% 7.3%Devon and Cornwall Tony Hogg Con 14.70% 5.0%Dorset Martyn Underhill Other 16.30% 8.8%Durham Ron Hogg Lab 14.40% 7.4%Essex Nick Alston Con 12.80% 4.7%Gloucestershire Martin Surl Other 15.96% 7.4%Greater Manchester Tony Lloyd Lab 13.59% 7.0%Hampshire Simon Hayes Other 14.60% 5.5%Hertfordshire David Lloyd Con 14.10% 7.8%Humberside Matthew Grove Con 19.15% 6.0%Kent Ann Barnes Other 15.99% 8.9%Lancashire Clive Grunshaw Lab 15.00% 7.1%Leicestershire Sir Clive Loader Con 16.36% 8.3%Lincolnshire Alan Hardwick Other 15.28% 7.2%Merseyside Jane Kennedy Lab 12.40% 7.0%Norfolk Stephen Bett Other 14.51% 6.0%North Yorkshire Julia Mulligan Con 13.30% 7.7%Northamptonshire Adam Simmonds Con 19.50% 7.9%Northumbria Vera Baird Lab 16.45% 9.2%Nottinghamshire Paddy Tipping Lab 16.42% 8.1%South Yorkshire Shaun Wright Lab 14.50% 7.5%Staffordshire Matthew Ellis Con 11.63% 6.0%Suffolk Tim Passmore Con 15.41% 6.7%Surrey Kevin Hurley Other 15.36% 6.2%Sussex Katy Bourne Con 15.82% 6.5%Thames Valley Thames Valley Con 13.30% 5.5%Warwickshire Ron Ball Other 15.23% 7.9%West Mercia Bill Longmore Other 14.50% 7.8%West Midlands Bob Jones Lab 12.00% 5.9%West Yorkshire Mark Burns-Williamson Lab 13.34% 7.1%Wiltshire Angus Macpherson Con 15.30% 6.9%Dyfed-Powys Christopher Salmon Con 16.40% 8.3%Gwent Ian Johnston Other 14.00% 7.0%North Wales Winston Roddick Other 14.83% 6.8%South Wales Alun Michael Lab 15.19% 6.8%
23Jess Garland & Chris TerryHow not to run an electionThe Police and Crime Commissioner Electons


On 15 November 2012 English and Welsh voters went to the polls to elect the first Police and Crime Commissioners (PCCs). The Home Office stated a desire to “empower the public - increasing local accountability and giving the public a direct say on how their streets are policed”.
Less than 1 in 5 members of the public chose to take up this opportunity. The Electoral Reform Society looks at the avoidable mistakes made in an election that failed candidates and voters alike.
www.electoral-reform.org.uk