How Much Should Leads Cost? - Home | · PDF file · 2013-10-01How Much Should Leads...
90
Tips for different channels, industries, and deal sizes How Much Should Leads Cost? Daniel Burstein Director of Editorial Content MECLABS
Transcript of How Much Should Leads Cost? - Home | · PDF file · 2013-10-01How Much Should Leads...

Tips for different channels, industries, and deal sizes
How Much Should Leads Cost?
Daniel Burstein
Director of Editorial Content
MECLABS

Session Speakers
2
Atri Chatterjee
CMO
Act-On Software
@atrichatt
Erik Matlick
CEO
Madison Logic
@ematlick
Tom Reid
Executive Director
Hacker Group
Dave Walters
Product Evangelist
Silverpop
@_DaveWalters

Ask the Audience:
How many people are measured by the volume of leads?

Ask the Audience:
How many people are measured by the cost of leads?

Ask the Audience:
How many people are measured by lead conversion into revenue?

CAPTURE QUALIFY NURTURE
• Define a lead
• Evaluate costs
• Talk about lead costs

DefineQuestions we get asked…

! CAUTIONThis is a discussion about lead
cost only. Lead qualification and nurturing will be covered in
later sessions.

DefineBefore we begin…
What pains you in talking about lead costs?

DefineThe lack of:
Alignment in terms of
volume, follow-up, feasibility
Consideration of value of
sale/complexity of sale
Inclusion of all appropriate
costs
Clear definition of “lead”

CAPTURE QUALIFY NURTURE
• Define a lead
• Evaluate costs
• Talk about lead costs

“It depends on what the meaning of the word ‘is’ is. If the — if he — if ‘is’ means is and never has been, that is not — that is one thing. If it means there is none, that
was a completely true statement.”– President Bill Clinton
http://commons.wikimedia.org/wiki/File:President_Clinton_speaks_at_Norfolk_Naval_Station.jpg

Define
A lead is…
Definition:

Define
Where is a lead?
http://www.flickr.com/photos/paul_gillum
Heck, what is a lead?

Marketers discuss cost per lead … but what do they mean by “lead?”

What do they mean by “lead?”
Inquiry?
Qualified lead?MQL?
SQL?
Sales-ready?
Hand-raiser?
Purchased list?
Shared lead?Multi-touch
lead?
High-quality lead?

More “sales-ready” requests drive higher CPL
Agree with Sales on a definition AND follow up – Feedback mandate

It’s a prospect, not a lead
Awareness
Names
Engaged Prospect
Lead
Sales Lead Opportunity
Customer
Start

It’s a prospect, not a lead
Start
Engaged Prospect
Visit website and either fill out a form or download
content

It’s a prospect, not a lead
Lead
Start
Prospect
Demographic lead scoring

DefineLead Cost
What are the costs that should go into the calculation of cost-per-lead?

Define
25%$150 or more
Chart: Can you get a high-quality lead for $20?
36%Less than $20
16%$21-$50
23%$51-$150
Source: ©2011 MarketingSherpa B2B Marketing Benchmark
Survey Methodology: Fielded June 2011, N=1,745

DefineDefining a Lead: Some statistics
40% of B2B buyers had their first contact with a solution provider after actively
downloading/interacting with content from its website. (Demand Gen Report)
Vendors involved in the early phases of the buying process (before contact has been
made with the prospect) will close the sale 65% of the time. (Forrester Research)
More than 90% of B2B purchases started with content engagement.(Demand Gen Report)

Define
“ Calculating lead costs
Marketing Costs
Content Creation Costs-Per-Lead
The cost of a lead is no longer buying leads on the market or a webinar attendee – it’s an aggregation of all of the costs that go into
turning a prospect into a lifelong client.
”

Evaluate
• Creative, production, media (includes postage)• Include internal and
external costs
• Websites, BRE entry, telemarketing (setup,
training, etc.)
• Offers and premiums, pick-pack-ship costs
Fulfillment costs
Cost-per-lead components
Response capture costsAll-in solicit costs
All marketing costs to produce “sales-ready” leads

DefineEvaluating cost-per-lead
Lower cost
Higher qualified leads

DefineEvaluating cost-per-lead
Lower cost
Higher qualified leads
“Simply sending more leads over the fence to Sales will only result in more early stage
leads being lost, ignored or discarded.”– Brian Carroll

DefineMetrics every marketer should track:
1
2
3
4
Number of inquiries (people that raised their hand)
Number of leads (qualified as “sales-ready”)
Number of opportunities (leads that move to pipeline)
Number of closed sales (generated from marketing leads)

DefineWhen you know those metrics you can track:
Inquiry-to-lead ratio
Lead-to-opportunity
ratio
Lead-to-pipeline revenue
ratio
Lead-to-sale (win) ratio

DefineWhen you know those metrics you can track:
Inquiry to lead ratio
Lead to opportunity
ratio
Lead to pipeline revenue
ratio
Lead to sale (win) ratio
“A value-driven mindset requires leaders and marketers to plan and budget for the long term and to take a more holistic view that goes beyond cost-per-lead budgets.”
– Brian Carroll

Evaluate
CAPTURE QUALIFY NURTURE
• Define a lead
• Evaluate costs
• Talk about lead costs

Evaluate
“Perfect numbers like perfect men are very rare.”
– Descartes
EvaluateLead Cost
What about costs related to leads purchased through media versus acquired through organic traffic?

EvaluateInbound marketing costs 61% LESS per lead than traditional outbound marketing
Source: State of Inbound Marketing, Hubspot, March 2012
Outbound:
Inbound:
AVG COST/LEAD:
AVG COST/LEAD:
$346
$135

Evaluate
HR Healthcare Marketing Technology
Average $45 $65 $35 $43
Range $25 - $57 $35 - $82 $20 - $43 $31 - $125
Data compiled from the Madison Logic Network, Jan 2012- June 2013
Each of the following elements will drive up the cost of a lead:
• Geographic Restrictions• Job Titles• Company Budget/Size• Custom Questions (BANT Qualifying)
Average Cost-Per-Lead by Vertical

EvaluateCase Study: Global provider of enterprise cloud services
Experiment ID: Cost-per-Lead: Intent vs. FiltersTesting Phase: Lead Generation
Background: A data company promoted a white paper associated with the following topics: Business Analytics, Analytics Applications, Cloud Computing, Risk Management, Analytical Applications, Business Technology, Security Policies, Application Security.
Objective: Determine if strict filters for job titles are necessary for lead volume
Primary Research Question: Which form will provide high-quality leads at a low cost?
Test Design: A/B split test
Research Notes:
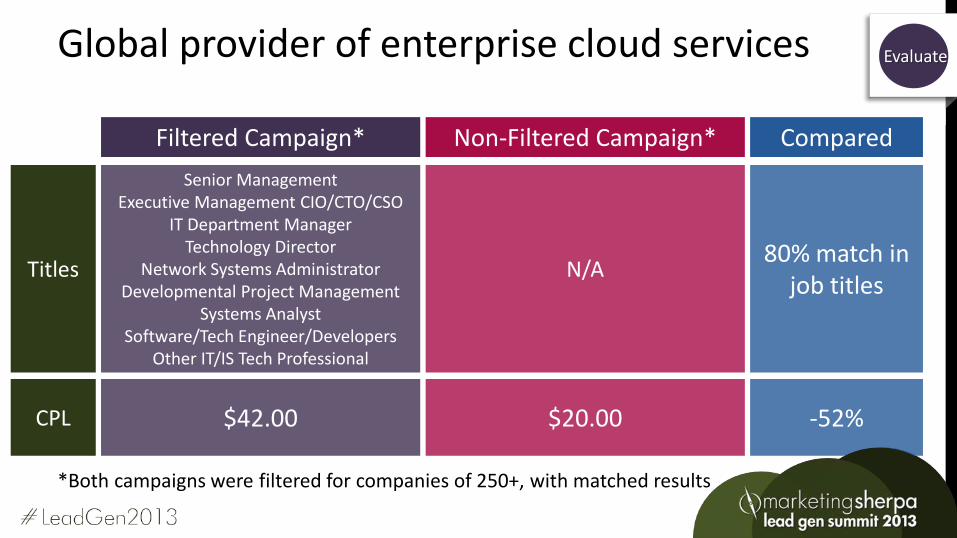
EvaluateGlobal provider of enterprise cloud services
Filtered Campaign* Non-Filtered Campaign* Compared
Titles
*Both campaigns were filtered for companies of 250+, with matched results
CPL
Senior ManagementExecutive Management CIO/CTO/CSO
IT Department ManagerTechnology Director
Network Systems Administrator Developmental Project Management
Systems Analyst Software/Tech Engineer/Developers
Other IT/IS Tech Professional
N/A80% match in
job titles
$42.00 $20.00 -52%

EvaluateGlobal provider of enterprise cloud services
Filtered Campaign* Non-Filtered Campaign* Compared
Titles
*Both campaigns were filtered for companies of 250+
CPL
Senior ManagementExecutive Management CIO/CTO/CSO
IT Department ManagerTechnology Director
Network Systems Administrator Developmental Project Management
Systems Analyst Software/Tech Engineer/Developers
Other IT/IS Tech Professional
n/a80% match in
job titles
$42.00 $20.00 -52%
The non-filtered campaign generated intent-qualified leads from 6 additionaljob titles that were originally restricted
by the filtered campaign.

Evaluate
35% Increase in Leads Generatedwith a 52% reduction in cost-per-lead
Design Leads Generated Cost/Lead
Control – Strict filters for job titles 375 $42
Treatment – No filters for job titles 506 $20
Relative Difference 35% -52%
! There was 4x greater campaign reach with the treatment
Results: Global provider of enterprise cloud services

EvaluateLead Cost
How should marketers think about deal size when evaluating lead costs?

EvaluateChart: Average B2B deal sizes by organization size
5%
11%
18%
36%
23%
14%
18%
20%
26%
13%
22%
21%
17%
12%
8%
More than$250,000
$50,001 - $250,000
$10,001 - $50,000
$1,001 - $10,000
Under $1,000
Lg (more than 1,000 emp) Med (100 to 1,000 emp) Sm (fewer than 100 emp)
Source: ©2011 MarketingSherpa B2B Marketing Benchmark
Survey Methodology: Fielded June 2011, N=1,745
Q: What is the amount of your organization’s average sale?

EvaluateLead Cost
How should marketers think about the lifetime value of a prospect in relation to lead costs?

EvaluateTraditional Lifetime Value Calculations
Average value of
sale
Number of repeat
transactions
Average retention
time
Lifetime Value

EvaluateLeads Must be “Qualified” to be Worthwhile
Unqualified leads Qualified leads
Cost/Leads
Cost/Sale
How to Calculate Your True Cost-per-Lead (Josephson, 2013)

EvaluateLead Cost
What role does brand play in lead costs?

EvaluateLead Cost
What other factors should marketers consider when evaluating lead costs?

EvaluateAverage length of B2B sales cycle by lead generation maturity
9%
31%
22%
22%
10%
Less than 1month
1- 3 months
4 - 6 months
7 - 12months
More than 1year
StrategicSource: ©2011 MarketingSherpa B2B Marketing Benchmark
Survey Methodology: Fielded June 2011, N=1,745

EvaluateAverage length of B2B sales cycle by lead generation maturity
12%
33%
21%
16%
9%
Less than 1month
1- 3 months
4 - 6 months
7 - 12months
More than 1year
TransitionSource: ©2011 MarketingSherpa B2B Marketing Benchmark
Survey Methodology: Fielded June 2011, N=1,745

EvaluateAverage length of B2B sales cycle by lead generation maturity
26%
28%
18%
13%
7%
Less than 1month
1- 3 months
4 - 6 months
7 - 12months
More than 1year
TrialSource: ©2011 MarketingSherpa B2B Marketing Benchmark
Survey Methodology: Fielded June 2011, N=1,745

EvaluateAverage length of B2B sales cycle by lead generation maturity
9%
31%
22%
22%
10%
12%
33%
21%
16%
9%
26%
28%
18%
13%
7%
Less than 1month
1- 3 months
4 - 6 months
7 - 12months
More than 1year
Strategic
Transition
TrialSource: ©2012 MarketingSherpa B2B Marketing Benchmark
Survey Methodology: Fielded June 2011, N=1,745

EvaluateCost vs. Quality
What are the most important things marketers should do to reduce lead costs without reducing lead quality?

EvaluateThe Cost of a Click

EvaluateThe Cost of a Click
0.67% CTR
2.29% CTR

EvaluateThe Cost of a Click
0.67% CTR
2.29% CTR
25% conversion rate
8% conversion rate

EvaluateThe Cost of a Click
0.67% CTR
2.29% CTR
25% conversion rate
8% conversion rate$70
per sign-up
$24 per
sign-up
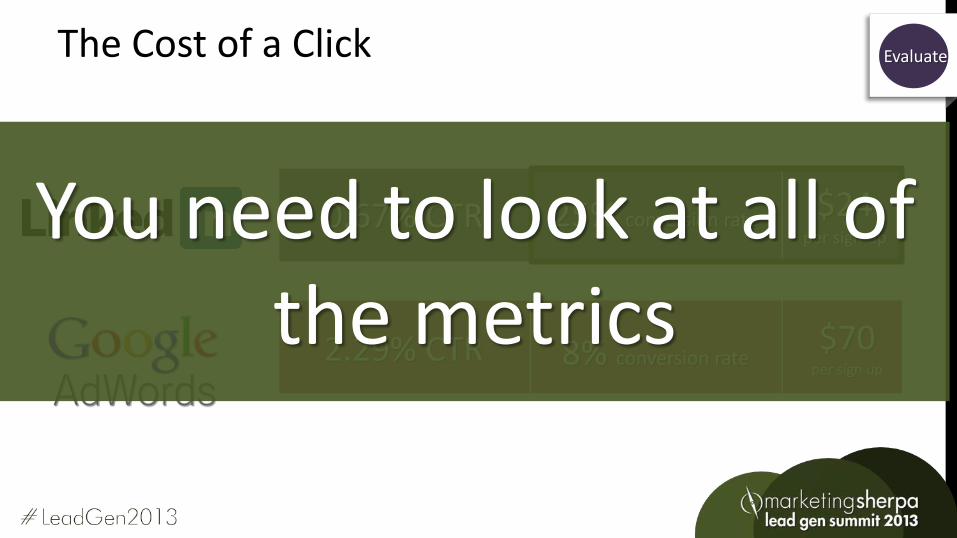
EvaluateThe Cost of a Click
0.67% CTR
2.29% CTR
25% conversion rate
8% conversion rate$70
per sign up
$24 per sign upYou need to look at all of
the metrics

EvaluateCommon Mistakes
What are the most common mistakes marketers make that impact lead costs?

Evaluate
Poor data capture
Too much product content
Lack of an offer strategy
Poor capacity planning
Too much product content
Lack of an offer strategy
Poor capacity planning
Inability to attribute cause and effect
Common Mistakes
Poor data capture

Evaluate
Not enough focus on selling the offer
Poor data capture
Too much product content
Lack of an offer strategy
Poor capacity planning
Too much product content
Lack of an offer strategy
Poor capacity planning
Common Mistakes
Too much product content

Evaluate
Poor data capture
Too much product content
Lack of an offer strategy
Poor capacity planning
Too much product content
Lack of an offer strategy
Poor capacity planning
Vital for long duration or complex sales
Common Mistakes
Lack of offer strategy

Evaluate
Poor data capture
Too much product content
Lack of an offer strategy
Poor capacity planning
Too much product content
Lack of an offer strategy
Poor capacity planning
Abandoned calls or deluged sites
Common Mistakes
Poor capacity planning

Evaluate
Poor data capture
Too much product content
Lack of an offer strategy
Poor capacity planning
Too much product content
Lack of an offer strategy
Poor capacity planning
One list, one outlet is not enough
Common Mistakes
Cursory list or media work

Evaluate
Poor data capture
Too much product content
Lack of an offer strategy
Poor capacity planning
Too much product content
Lack of an offer strategy
Poor capacity planning
Finding and beating controls is a must
Common Mistakes
Lack of ongoing testing

Evaluate
Poor data capture
Too much product content
Lack of an offer strategy
Poor capacity planning
Too much product content
Lack of an offer strategy
Poor capacity planning
Speaks volumes about your solutions
Common Mistakes
Lack of mobile enablement

EvaluateMarketing Channels
Which marketing channels have you had the most success with for generating leads?

EvaluateChart: Inbound or outbound
SEOOptimization
ContentTrade Shows
0% 5% 10% 15% 20% 25% 30% 35% 40%
5%
10%
15%
20%
25%
30%
Deg
ree
of
Dif
ficu
lty
Level of Effectiveness
Degree of difficulty not affecting use of effective tactics
Source: ©2011 MarketingSherpa B2B Marketing Benchmark
Survey Methodology: Fielded June 2011, N=1,745

EvaluateChart: Inbound or outbound
Mobile Marketing
Social Media
0% 5% 10% 15% 20% 25% 30% 35% 40%
5%
10%
15%
20%
25%
30%
Deg
ree
of
Dif
ficu
lty
Level of Effectiveness
PPC
Webinars
Degree of difficulty not affecting use of effective tactics
Source: ©2011 MarketingSherpa B2B Marketing Benchmark
Survey Methodology: Fielded June 2011, N=1,745
SEOOptimization
ContentTrade Shows

EvaluateChart: Inbound or outbound
Mobile Marketing
Social Media
0% 5% 10% 15% 20% 25% 30% 35% 40%
5%
10%
15%
20%
25%
30%
Deg
ree
of
Dif
ficu
lty
Level of Effectiveness
Direct MailPrint
AdsEmail
Marketing
PPC
Webinars
Degree of difficulty not affecting use of effective tactics
Source: ©2011 MarketingSherpa B2B Marketing Benchmark
Survey Methodology: Fielded June 2011, N=1,745
SEOOptimization
ContentTrade Shows

EvaluateCPL Considerations: Media mix
Effective programs involve multiple marketing vehicles
Reach your audience where they live, work and play
Look at CPL by vehicle AND average across all verticals

Evaluate
Vehicle CPS Qty Budget
Resp
Rate
Resp
Qty CPR
Lead
Rate Leads CPL
Mbr.
Rate Mbrs. CPM
Direct Mail
Mail: 3 pkgs $0.45 2,055,000 $931,600 1.15% 23,633 $39 90% 21,270 $44 15% 3,190 $292
DRTV Calls/Spot60s Spot $196 2,800 $550,000 2 5,600 $94 85% 4,760 $116 15% 714 $770
Digital Clicks ConvertsSearch $5.50 7,556 $41,558 8.0% 604 $69 85% 514 $81 15% 77 $539
Email $1.65 30,000 $49,500 4.5% 1,350 $37 85% 1,148 $43 15% 172 $288Display $4.33 9,800 $42,434 3.0% 294 $144 85% 250 $170 15% 37 $1,132
Mobile Display $1.24 47,690 $59,136 0.25% 119 $496 85% 101 $584 15% 15 $3,890
Digital 95,046 $192,628 2.49% 2,368 $81 85% 2,013 $96 15% 302 $638
InsertsNewspaper $0.22 1,041,000 $229,020 0.15% 1,562 $147 85% 1,328 $172 15% 199 $1,438Shared Mail $0.12 1,200,000 $144,000 0.10% 1,200 $120 85% 1,020 $141 15% 153 $1,176
Inserts $0.17 2,241,000 $373,020 0.12% 2,762 $135 85% 2,347 $159 15% 352 $1,126
Total $0.48 4,306,356 $2,047,248 0.80% 34,363 $60 89% 30,389 $67 15% 4,558 $449
Direct Mail CPL: $44
Media Mix Review for Healthcare Company

EvaluateMedia Mix Review for Healthcare Company
Vehicle CPS Qty Budget
Resp
Rate
Resp
Qty CPR
Lead
Rate Leads CPL
Mbr.
Rate Mbrs. CPM
Direct Mail
Mail: 3 pkgs $0.45 2,055,000 $931,600 1.15% 23,633 $39 90% 21,270 $44 15% 3,190 $292
DRTV Calls/Spot60s Spot $196 2,800 $550,000 2 5,600 $94 85% 4,760 $116 15% 714 $770
Digital Clicks ConvertsSearch $5.50 7,556 $41,558 8.0% 604 $69 85% 514 $81 15% 77 $539
Email $1.65 30,000 $49,500 4.5% 1,350 $37 85% 1,148 $43 15% 172 $288Display $4.33 9,800 $42,434 3.0% 294 $144 85% 250 $170 15% 37 $1,132
Mobile Display $1.24 47,690 $59,136 0.25% 119 $496 85% 101 $584 15% 15 $3,890
Digital 95,046 $192,628 2.49% 2,368 $81 85% 2,013 $96 15% 302 $638
InsertsNewspaper $0.22 1,041,000 $229,020 0.15% 1,562 $147 85% 1,328 $172 15% 199 $1,438Shared Mail $0.12 1,200,000 $144,000 0.10% 1,200 $120 85% 1,020 $141 15% 153 $1,176
Inserts $0.17 2,241,000 $373,020 0.12% 2,762 $135 85% 2,347 $159 15% 352 $1,126
Total $0.48 4,306,356 $2,047,248 0.80% 34,363 $60 89% 30,389 $67 15% 4,558 $449
DRTV: CPL $116

EvaluateMedia Mix Review for Healthcare Company
Vehicle CPS Qty Budget
Resp
Rate
Resp
Qty CPR
Lead
Rate Leads CPL
Mbr.
Rate Mbrs. CPM
Direct Mail
Mail: 3 pkgs $0.45 2,055,000 $931,600 1.15% 23,633 $39 90% 21,270 $44 15% 3,190 $292
DRTV Calls/Spot60s Spot $196 2,800 $550,000 2 5,600 $94 85% 4,760 $116 15% 714 $770
Digital Clicks ConvertsSearch $5.50 7,556 $41,558 8.0% 604 $69 85% 514 $81 15% 77 $539
Email $1.65 30,000 $49,500 4.5% 1,350 $37 85% 1,148 $43 15% 172 $288Display $4.33 9,800 $42,434 3.0% 294 $144 85% 250 $170 15% 37 $1,132
Mobile Display $1.24 47,690 $59,136 0.25% 119 $496 85% 101 $584 15% 15 $3,890
Digital 95,046 $192,628 2.49% 2,368 $81 85% 2,013 $96 15% 302 $638
InsertsNewspaper $0.22 1,041,000 $229,020 0.15% 1,562 $147 85% 1,328 $172 15% 199 $1,438Shared Mail $0.12 1,200,000 $144,000 0.10% 1,200 $120 85% 1,020 $141 15% 153 $1,176
Inserts $0.17 2,241,000 $373,020 0.12% 2,762 $135 85% 2,347 $159 15% 352 $1,126
Total $0.48 4,306,356 $2,047,248 0.80% 34,363 $60 89% 30,389 $67 15% 4,558 $449
Digital: CPLSearch: $81Email: $43Display: $170Mobile Display: $584
Total Avg: $96

EvaluateMedia Mix Review for Healthcare Company
Vehicle CPS Qty Budget
Resp
Rate
Resp
Qty CPR
Lead
Rate Leads CPL
Mbr.
Rate Mbrs. CPM
Direct Mail
Mail: 3 pkgs $0.45 2,055,000 $931,600 1.15% 23,633 $39 90% 21,270 $44 15% 3,190 $292
DRTV Calls/Spot60s Spot $196 2,800 $550,000 2 5,600 $94 85% 4,760 $116 15% 714 $770
Digital Clicks ConvertsSearch $5.50 7,556 $41,558 8.0% 604 $69 85% 514 $81 15% 77 $539
Email $1.65 30,000 $49,500 4.5% 1,350 $37 85% 1,148 $43 15% 172 $288Display $4.33 9,800 $42,434 3.0% 294 $144 85% 250 $170 15% 37 $1,132
Mobile Display $1.24 47,690 $59,136 0.25% 119 $496 85% 101 $584 15% 15 $3,890
Digital 95,046 $192,628 2.49% 2,368 $81 85% 2,013 $96 15% 302 $638
InsertsNewspaper $0.22 1,041,000 $229,020 0.15% 1,562 $147 85% 1,328 $172 15% 199 $1,438Shared Mail $0.12 1,200,000 $144,000 0.10% 1,200 $120 85% 1,020 $141 15% 153 $1,176
Inserts $0.17 2,241,000 $373,020 0.12% 2,762 $135 85% 2,347 $159 15% 352 $1,126
Total $0.48 4,306,356 $2,047,248 0.80% 34,363 $60 89% 30,389 $67 15% 4,558 $449
Inserts: CPLNewspaper: $172Shared Mail: $141
Inserts Avg: $159

EvaluateMedia Mix Review for Healthcare Company
Vehicle CPS Qty Budget
Resp
Rate
Resp
Qty CPR
Lead
Rate Leads CPL
Mbr.
Rate Mbrs. CPM
Direct Mail
Mail: 3 pkgs $0.45 2,055,000 $931,600 1.15% 23,633 $39 90% 21,270 $44 15% 3,190 $292
DRTV Calls/Spot60s Spot $196 2,800 $550,000 2 5,600 $94 85% 4,760 $116 15% 714 $770
Digital Clicks ConvertsSearch $5.50 7,556 $41,558 8.0% 604 $69 85% 514 $81 15% 77 $539
Email $1.65 30,000 $49,500 4.5% 1,350 $37 85% 1,148 $43 15% 172 $288Display $4.33 9,800 $42,434 3.0% 294 $144 85% 250 $170 15% 37 $1,132
Mobile Display $1.24 47,690 $59,136 0.25% 119 $496 85% 101 $584 15% 15 $3,890
Digital 95,046 $192,628 2.49% 2,368 $81 85% 2,013 $96 15% 302 $638
InsertsNewspaper $0.22 1,041,000 $229,020 0.15% 1,562 $147 85% 1,328 $172 15% 199 $1,438Shared Mail $0.12 1,200,000 $144,000 0.10% 1,200 $120 85% 1,020 $141 15% 153 $1,176
Inserts $0.17 2,241,000 $373,020 0.12% 2,762 $135 85% 2,347 $159 15% 352 $1,126
Total $0.48 4,306,356 $2,047,248 0.80% 34,363 $60 89% 30,389 $67 15% 4,558 $449
Avg CPL: $67

EvaluateMedia Mix Review for Healthcare Company
Vehicle CPS Qty Budget
Resp
Rate
Resp
Qty CPR
Lead
Rate Leads CPL
Mbr.
Rate Mbrs. CPM
Direct Mail
Mail: 3 pkgs $0.45 2,055,000 $931,600 1.15% 23,633 $39 90% 21,270 $44 15% 3,190 $292
DRTV Calls/Spot60s Spot $196 2,800 $550,000 2 5,600 $94 85% 4,760 $116 15% 714 $770
Digital Clicks ConvertsSearch $5.50 7,556 $41,558 8.0% 604 $69 85% 514 $81 15% 77 $539
Email $1.65 30,000 $49,500 4.5% 1,350 $37 85% 1,148 $43 15% 172 $288Display $4.33 9,800 $42,434 3.0% 294 $144 85% 250 $170 15% 37 $1,132
Mobile Display $1.24 47,690 $59,136 0.25% 119 $496 85% 101 $584 15% 15 $3,890
Digital 95,046 $192,628 2.49% 2,368 $81 85% 2,013 $96 15% 302 $638
InsertsNewspaper $0.22 1,041,000 $229,020 0.15% 1,562 $147 85% 1,328 $172 15% 199 $1,438Shared Mail $0.12 1,200,000 $144,000 0.10% 1,200 $120 85% 1,020 $141 15% 153 $1,176
Inserts $0.17 2,241,000 $373,020 0.12% 2,762 $135 85% 2,347 $159 15% 352 $1,126
Total $0.48 4,306,356 $2,047,248 0.80% 34,363 $60 89% 30,389 $67 15% 4,558 $449
Reality check: Can we hit our quantity or cost-per-sale objectives within budget?
Stakeholder alignment: Reaching goals may require reallocation from historical approach.

EvaluateCase Study: Software company tests field length
Experiment ID: Marketing automation companyTesting Phase: Form field optimization
Background: Company incentivizes users to fill out forms with high-quality content.
Objective: Get the most information, while reducing overall lead gen costs.
Primary Research Question: Which number of fields will generate the most information at the lowest cost?
Test Design: A/B/C split test
Research Notes:

EvaluateTreatments
Treatment A Treatment B Treatment C
5 Fields
7 Fields
9 Fields

Evaluate
34% Increase in Conversion Rate25% reduction in lead costs
Design Cost-per-lead Relative Diff. Conv. Rate Relative Diff.
9-field form $41.90 ---- 10.0% ----
7-field form $34.94 -16.6% 12.0% 20%
5-field form $31.24 -25% 13.4% 34%
! Shorter forms are more effective in getting Web visitors to complete registration, more value from higher conversion rate and appending data.
Results

Talk
CAPTURE QUALIFY NURTURE
• Define a lead
• Evaluate costs
• Talk about lead costs

Talk
“A cynic is a man who knows the price of everything and the value of nothing.”
– Oscar Wilde

TalkTell your boss…
What should marketers tell the CEO and CFO about lead costs?

TalkChart: Average value for B2B leads
9%10%
15%15%
9%
4%
8%
5%
7%
0%
2%
4%
6%
8%
10%
12%
14%
16%
18%
20%
Pe
rce
nt
of
Re
spo
nd
en
ts
Average Value of B2B Leads
7%
Source: ©2011 MarketingSherpa B2B Marketing Benchmark
Survey Methodology: Fielded June 2011, N=1,745
Select the range that represents the estimated DOLLAR VALUE of one qualified lead to your organization (i.e.,
what is the revenue contribution of each qualified lead?)

Talk
9%10%
11%
7%
15%15%
9%
4%
8%
5%
7%
0%
2%
4%
6%
8%
10%
12%
14%
16%
18%
20%
Pe
rce
nt
of
Re
spo
nd
en
ts
Average Value of B2B Leads
15%
Source: ©2011 MarketingSherpa B2B Marketing Benchmark
Survey Methodology: Fielded June 2011, N=1,745
Chart: Average value for B2B leadsSelect the range that represents the estimated DOLLAR VALUE of one qualified lead to your organization (i.e.,
what is the revenue contribution of each qualified lead?)

Talk
9%10%
11%
7%
15%15%
9%
4%
8%
5%
7%
0%
2%
4%
6%
8%
10%
12%
14%
16%
18%
20%
Pe
rce
nt
of
Re
spo
nd
en
ts
Average Value of B2B Leads
Source: ©2011 MarketingSherpa B2B Marketing Benchmark
Survey Methodology: Fielded June 2011, N=1,745
Chart: Average value for B2B leadsSelect the range that represents the estimated DOLLAR VALUE of one qualified lead to your organization (i.e.,
what is the revenue contribution of each qualified lead?)

EvaluateWhat should marketers tell the CEO?
Purchasing decision makers can be upwards of 10 people, not just the C-level who signs off on the deal.
— Aberdeen

TalkTell Sales leaders…
For B2B marketers, what should marketing say about lead costs to Sales leaders?

TalkImportant developments
In the last couple of years, what are the most important developments affecting lead costs?

Talk
Work BackwardsAvailable audience to solicit/
cost
Sales rate
Number/ Volume of sales and
cost-per-sale
Leads required to reach objective
Response rate required
to reach objective
Consider the media mix, average sale size and complexity
Provide pro-forma projections
Scale matters
How to talk about lead costs

Thank You
90
Atri Chatterjee
CMO
Act-On Software
@atrichatt
Erik Matlick
CEO
Madison Logic
@ematlick
Tom Reid
Executive Director
Hacker Group
Dave Walters
Product Evangelist
Silverpop
@_DaveWalters