How Much is a Green Card Worth? Evidence from Mexican and...
31
How Much is a Green Card Worth? Evidence from Mexican and Puerto Rican Men Who Marry Women Born in the U.S. Miao Chi * and Scott Drewianka ** Abstract Recognizing that U.S. immigrants can acquire Permanent Resident status by marrying natives, we quantify the value of that status using the earnings premium received by Mexican-born men who marry U.S.-born women. Men born in Puerto Rico are a natural control group because they are U.S. citizens, but otherwise face similar challenges. IV estimates indicate that intermarried Mexicans earn a 30 percent premium, while intermarried Puerto Ricans receive no premium. The premium vanishes within ten years after immigration, consistent with waiting times for green cards. However, among Mexicans who immigrated less than six years ago, the estimated premium exceeds 100 percent. JEL Classification: J61, J12 Keywords: immigration, green card, economic assimilation, intermarriage * Rollins College and University of Wisconsin-Milwaukee. Mail: Rollins College, Dept. of Economics, 1000 Holt Ave. -2751, Winter Park, FL 32789. E-mail: [email protected]. ** University of Wisconsin-Milwaukee. Mail: UWM Dept. of Economics, Bolton Hall 860, 3210 N. Maryland Ave., Milwaukee, WI 53211. E-mail: [email protected]. The authors gratefully acknowledge comments by Scott Adams, Keith Bender, and John Heywood. We are responsible for all errors that remain.
-
Upload
truongliem -
Category
Documents
-
view
216 -
download
2
Transcript of How Much is a Green Card Worth? Evidence from Mexican and...

How Much is a Green Card Worth? Evidence from Mexican and Puerto
Rican Men Who Marry Women Born in the U.S.
Miao Chi* and Scott Drewianka
∗∗
Abstract
Recognizing that U.S. immigrants can acquire Permanent Resident status by marrying natives,
we quantify the value of that status using the earnings premium received by Mexican-born men
who marry U.S.-born women. Men born in Puerto Rico are a natural control group because they
are U.S. citizens, but otherwise face similar challenges. IV estimates indicate that intermarried
Mexicans earn a 30 percent premium, while intermarried Puerto Ricans receive no premium. The
premium vanishes within ten years after immigration, consistent with waiting times for green
cards. However, among Mexicans who immigrated less than six years ago, the estimated
premium exceeds 100 percent.
JEL Classification: J61, J12
Keywords: immigration, green card, economic assimilation, intermarriage
* Rollins College and University of Wisconsin-Milwaukee. Mail: Rollins College, Dept. of Economics, 1000
Holt Ave. -2751, Winter Park, FL 32789. E-mail: [email protected]. ∗∗
University of Wisconsin-Milwaukee. Mail: UWM Dept. of Economics, Bolton Hall 860, 3210 N. Maryland
Ave., Milwaukee, WI 53211. E-mail: [email protected].
The authors gratefully acknowledge comments by Scott Adams, Keith Bender, and John Heywood. We are
responsible for all errors that remain.
1
I. Introduction
It is widely believed that the right to work permanently in the U.S. is of great economic
value to immigrants. Knowing the value of that right would inform calls to expedite the green
card application process, and it would provide a useful benchmark for proposed reforms that
would allow undocumented immigrants to remain in the U.S. after paying a fine. That value
would also provide an upper bound on the implicit economic rents collected by U.S.
employers and consumers during the years that immigrants work under more restrictive visas.
Nevertheless, few studies have attempted to quantify the value of Permanent Resident
status. A key difficulty is that most sources of variation in immigrants’ legal status also
influence their wages directly. For example, immigrants who are related to U.S. citizens, who
have been in the U.S. longer, or who possess rare occupational skills may be more likely to
obtain a green card, but we would have expected them to earn higher wages in any event.
Most previous studies have identified the effect of Permanent Resident status from plausibly
exogenous reforms like the Immigration Reform and Control Act (IRCA) of 1986, which
granted amnesty to over 2.7 million undocumented immigrants. Those studies have generally
found that the law caused immigrants’ wages to rise by less than ten percent (Bailey, 1985,
Borjas and Tienda, 1993; Singer, 1994; Kassoudji and Cobb-Clark, 2002; Barcellos, 2010).
This paper instead exploits the fact that immigrants can acquire Permanent Resident
status faster if they marry a U.S. citizen, which some call “intermarriage.” Our strategy thus
involves measuring a wage premium earned by intermarried immigrant men from Mexico
(the largest source country for U.S. immigrants1). Since this plan does not rely on a particular
1 Currently about 30 percent of the U.S. foreign-born population is from Mexico, about six times the share from the next largest source country, China (Grieco and Trevelyan, 2010). Passel and Taylor (2009) report

2
historical event, it avoids potential problems due to contemporaneous economic shocks or
general equilibrium effects arising from the sudden jump in the supply of authorized workers.
Even so, this approach still faces two broad challenges. First, marriage is obviously not a
randomly assigned treatment. Married and intermarried immigrants likely differ from their
peers on observable and unobservable dimensions that may affect their wages directly. We
thus rely heavily on the inclusion of appropriate control variables and the use of
geography-based instrumental variables that generate independent variation in marital status.
The other difficulty is that a native spouse may offer other benefits beyond legal rights,
such as knowledge of institutions, culture, and social or professional networks. To overcome
this problem, we use a control group of people who were also born outside the U.S. mainland,
yet automatically enjoy permanent access to the U.S. labor market: Puerto Ricans. While they
face many of the same challenges as immigrants from elsewhere in Latin America, including
language barriers and potential discrimination, they do not face any legal barriers because all
Puerto Ricans have been U.S. citizens since 1917.2 In contrast, legal immigrants from other
places initially have visas that are time-restricted and employer-specific, limiting both their
appeal to potential employers and their ability to negotiate for higher wages. Of course,
undocumented immigrants face additional constraints, including the risk of deportation.
This approach will yield conservative estimates because we have no way of knowing if
that 64 percent of the 47 million Hispanics in the U.S. mainland (including U.S. natives) are of Mexican descent, while the next two largest subgroups are Puerto Ricans (9 percent) and Cubans (3.5 percent). 2 The U.S. annexed Puerto Rico from Spain in 1898 as part of the Treaty of Paris that ended the Spanish-American War. Puerto Rico became an autonomous commonwealth in 1952, but it maintains a formal association with the U.S. and periodically votes on whether to petition for U.S. statehood. Its foreign relations are governed by the U.S., and its people are U.S. citizens. Borjas (2008) covers the relevant history, as well as migration patterns into and out of Puerto Rico. For linguistic convenience, we will use “immigrants” to describe all U.S. residents born outside the 50 states and the District of Columbia, even though the term is inaccurate for both Puerto Ricans and persons without immigrant visas.

3
some Mexican immigrants may have obtained Permanent Resident status in other ways. Even
so, our results indicate that access to U.S. labor markets is quite valuable. When we use our
complete sample of immigrant men, we find that Permanent Residents earn about one-third
more than similar immigrants without a green card. This estimate is remarkably robust to
alternate instruments, control variables, model specifications, and sample selection criteria.
Moreover, we find no statistically-significant premium among immigrants who had been in
the U.S. for more than ten years, consistent with our expectation that they would have been
able to acquire a green card within that time frame regardless of marital status. However, men
who immigrated less than six years ago appear to receive a premium exceeding 100 percent.
Our results also contribute to the small but growing literature on the economic benefits
of marriage between immigrants and natives. While most studies find that such immigrants
earn a positive wage premium, none have attempted to distinguish between competing
explanations. Our results imply that legal rights are likely the main source of that premium.
Indeed, despite estimating numerous specifications, we find no evidence that Puerto Ricans
earn a statistically significant premium for marrying a woman born in the U.S. mainland.
The next section briefly explains some reasons why immigrants’ earnings may be related
to their marital status. Section III outlines our empirical strategy, and Section IV describes the
data. Results appear in Section V. Section VI concludes with a short discussion.
II. Potential Wage Benefits of Marriage and Intermarriage
Economists have long noted that the average wages among married men were higher
than those of unmarried men. Many have suspected that the pattern reflects either reverse

4
causality or spurious correlation, such as if potential wives preferred men with higher wages
or personal traits that employers also value. However, there is also some evidence for a causal
effect of marriage on men’s wages, possibly related to marriage’s effect on time use, although
that effect appears to have fallen over the last three decades (Daniel, 1993; Gray, 1997).
Similar issues arise when considering foreign-born men who marry U.S. natives. Such
immigrants may be more likely than others to possess unobservable traits that are valued in
the labor market, like ambition, a high IQ, English proficiency, cultural tolerance, physical
attractiveness, or a social network that alerts them to employment opportunities (Kantarevic,
2004). Endogeneity may also arise if high-earning immigrants have more opportunities to
intermarry, e.g., if they interact more frequently with natives of similar background or if
native-born women prefer men with higher incomes. On the other hand, some of those
wage-enhancing traits might also be obtained via intermarriage. For example, a native-born
wife might provide access to a wider social network or help in attaining English proficiency.3
This paper focuses on another possible mechanism, expedited access to Permanent
Resident status – a “green card.” Many U.S. immigrants, especially new arrivals, do not have
a green card, but rather work under an H-1B visa, which is employer-specific and typically
valid for no more than six years. An immigrant with an H-1B loses eligibility to work if his
employer does not petition for his green card before the visa expires, or if the worker changes
jobs or is laid off. Due to high legal fees and the lengthy process, many firms choose not to
hire non-permanent residents or sponsor H-1B visas, and those who do may offer lower
wages as a compensating differential. In contrast, Permanent Residents can freely move to
3 Chiswick and Miller (1995) show that language proficiency expedites assimilation in other ways as well.
5
jobs that more closely match their skills and preferences. That mobility may also increase
their ability to negotiate for higher wages, even if they do not actually switch jobs.
Immigrants who marry U.S. citizens can apply for a green card on the basis of marriage
rather than employment. Since immigration law gives priority to immediate family members
of U.S. citizens,4 the process of obtaining a green card can take as little as six months for
intermarried immigrants, whereas others often must wait for six to eight years.5 Intermarried
immigrants also become eligible to apply for citizenship sooner, which may confer additional
benefits and possibly new employment opportunities (e.g., in the federal government).
While many sociologists have studied intermarriage as both an indicator and a means of
assimilation (Lieberson and Waters, 1986), only a few economic studies have estimated a
causal effect of intermarriage on immigrants’ wages, and there is little evidence on nature of
the premium. Meng and Gregory (2005) find that intermarried immigrants in Australia earn a
15 to 23 percent (after accounting for endogeneity), and Meng and Meurs (2009) find a 25 to
35 percent premium in France. Estimates for the U.S. are smaller, however. Kantarevic (2004)
finds no intermarriage wage premium in the 1970 and 1980 U.S. Censuses, though Furtado
and Theodoropoulous (2009) find that intermarriage raises the probability of being employed.
III. Methodology
Since we do not directly observe which immigrants have green cards, our strategy is to
identify the effect of Permanent Resident status from those who marry a native-born wife. We
4 Since 2001, the law has not granted expedited consideration to intermarried immigrants who entered the
U.S. without a valid visa. However, this is not relevant for the 2000 Census data examined in this paper. 5 For a complete list of ways in which an immigrant can acquire a green card, and the rules for each, see the U.S. Citizenship and Immigration Services (USCIS) website, http://www.uscis.gov.

6
thus estimate separate wage premiums earned by intermarrying men born in Mexico and
Puerto Rico, above and beyond a general marriage premium. The difference between the two
groups’ intermarriage premiums is then attributed to the fact that Mexicans may have thereby
obtained a green card, whereas Puerto Ricans have no need for one.
More formally, we want to estimate a model like the following:
1 2' g gijg g ij j ij g ij g ijgY X Y N D , (1)
where the dependent variable is the log weekly earnings of immigrant i living in place j
from country g (=M and P for Mexico and Puerto Rico). The vector contains individual-
and place-level controls, including quadratic terms in the immigrant’s age and years since he
immigrated; dummy variables indicating educational attainment, English proficiency, school
attendance, residence in metro areas, regions, and disability and veteran status; and the share
of the local population that is of Hispanic descent to account for variation in wages associated
with ethnic enclaves.6 is the average log weekly earnings of native men in place j who
have the same level of educational attainment, which we include to control for differences in
price levels across cities within the region. Price levels may be correlated with intermarriage
rates, e.g., if intermarriage is more common in larger cities where prices are also higher.
The remaining explanatory variables are the main object of interest. is a dummy
variable that equals 1 if the immigrant is married to another immigrant, and is a dummy
that equals 1 if the immigrant is married to a native. The coefficient thus represents a wage
premium associated with marriage, and ( ) is the additional premium for intermarriage.
6 Regions include Northeast, Midwest, South, and West. The disability dummy equals one if the individual has a lasting physical or mental health condition that causes difficulty working. Although we use the term “Hispanic,” it would be equally appropriate to refer to both Mexicans and Puerto Ricans as “Latinos;” preferences between those terms vary within the affected groups (Passel and Taylor, 2009).

7
The green card premium is thus ( ), since we attribute the difference in
intermarriage premiums to the fact only Mexicans can benefit from a green card.
Equation (1) would be consistently estimated by OLS if an immigrant’s marital status
were uncorrelated with his unobserved factors εij. However, as explained in Section II, there
are many reasons to suspect that those unobserved factors are correlated with both marriage
and intermarriage. It is thus necessary to adjust the estimates for the potential endogeneity.
A. Instrumental Variables Estimation
The standard method to address this endogeneity issue is to instrument for the marriage
dummies, which obviously requires variables Z that predict variation in marital status but are
otherwise unrelated to individuals’ earnings. A further complication arises here because our
focal explanatory variables are dummies. In principle, one could use Z directly as instruments
for immigrants’ marital statuses, which amounts to using a linear probability model in the
first-stage IV regression. However, it is generally more efficient to use those factors instead
as excluded exogenous variables in a non-linear model predicting marital status, then use the
fitted values as instruments in a standard IV procedure.7 We implement this approach using a
multinomial logit to predict immigrants’ marital status. Denoting an individual’s marital
status by ijgS (=0,n,d for single, married to another immigrant, or intermarried), we estimate
0 1 2 3
0 1 2 30, ,
exp 'Pr( )
1 exp '
q q q qij j
ijg s s s sij j
s n d
X Y ZS q
X Y Z
for 0, , , (2)
and use fitted values gijN , g
ijD as instruments for gijN , g
ijD in (1).
7 For a more general discussion of this approach, see Wooldridge (2002, 230-237) or Angrist and Pischke (2009, 190-192).
8
The excluded exogenous variables used here all involve the demographic composition of
the population across locations. Similar strategies have been used in most previous work on
intermarriage (Kantarevic, 2004; Meng and Gregory, 2005; Furtado and Theodoropoulos,
2009; Meng and Meurs, 2009). Since we are predicting two variables for each individual (e.g.,
NM and DM for Mexicans), we need two excluded exogenous variables. Our preferred
specification uses (1) the ratio of immigrants to natives within the location’s population of
unmarried Hispanic women, and (2) the share of local women who are unmarried.
The intuition for the former variable begins with the observation that a high percentage
of Mexican and Puerto Rican immigrants marry Hispanic wives. Rosenfeld (2001) shows that
this tendency represents more than just marriage within groups defined by national origin, but
rather what he calls a “pan-national Hispanic identity.” It is not just that, e.g., Mexicans are
more likely to marry other Mexicans, but also that they are disproportionately likely (given
the local ethnic composition) to marry other Hispanics. We thus infer that the entire Hispanic
population constitutes the relevant marriage market, and since our proposed variable
measures the share of that market that is native-born, we anticipate that it will be a good
predictor for whether a married immigrant man has a foreign-born or native-born wife.
Our second variable is intended to indicate the availability of potential wives, so we
expect it to be most useful for predicting whether an individual is married or single. Since
there are more singles in large cities, and wages are generally higher there, one might fear
that this factor is correlated with the dependent variable. However, note that our specification
controls for natives’ wages, effectively eliminating the proposed source of the correlation.
Bias would thus result only if there were a correlation between (a) immigrants’ wages relative
9
to those of similarly educated natives, and (b) the share women who are single beyond what
would be expected given those same natives’ wages. We know of no reason to suspect one.
Still, given the potential for controversy with any instrument, Table 5 below will show
that the estimated green card premium is robust to the use of alternative excluded exogenous
variables. Among those we consider are analogues to two instruments used by Meng and
Gregory (2005) and others: the share of local single women who are Hispanic immigrants,
and the sex ratio among single Hispanic immigrants.8 We also try Kantarevic’s instrument,
the ratio of immigrants to natives among local single women, relative to the same ratio over
the entire U.S. Two new variables are also proposed: the share of local women who are
Hispanic (including both immigrants and natives) and the sex ratio among all local singles.
B. Discussion of Potential Biases
That table will also address the concern that the demographically-based excluded
exogenous variables may be spuriously correlated with immigrant wages because either
marriage rates or immigrant concentrations respond to local economic shocks. For example,
labor demand shocks might increase both the immigrant population and immigrants’ wages,
especially considering that immigrants may have chosen their location relatively more
recently. However, Table 5 will show that the estimated difference in intermarriage premiums
remains if identification is based on either locations’ demographic characteristics ten years
earlier or the current demographic conditions in the location where an immigrant lived five
years earlier, suggesting that the result reflects more than just local labor market conditions.
8 While these variables are similar to those used by Meng and Gregory, they reference a different ethnic group, reflecting the difference in national origin among immigrants to the U.S. and to Australia.

10
There are at least two reasons to believe that this estimation strategy is conservative. One
is simply that marrying a native is not the only way to obtain a green card. Some Mexican
immigrants who do not have a U.S.-born wife may have already obtained a green card via the
usual employment-based process, and in that case the estimated intermarriage wage premium
would understate the true value of Permanent Resident status.
The other reason is that IV estimates reflect the average treatment effect among the
subpopulation whose propensity to be treated is sensitive to the instrumental variable (Imbens
and Angrist, 1994). All of our instruments are based on variation in local demographics, so
the intermarriage premium is identified from the immigrants who become more likely to
marry a native when the marriage market includes relatively more native-born unmarried
Hispanics. For example, this group would include any men who encountered potential wives
at random and were largely indifferent about their place of birth. However, immigrants who
would benefit greatly from intermarriage would likely direct their search toward finding a
native wife even if they lived among many unmarried immigrant women. It thus seems likely
our estimate places little weight on the subgroup of immigrants who would gain most from
intermarriage. If so, our estimate represents a lower bound on the true average effect.
IV. Data and Descriptive Statistics
This study analyzes data from the 5 percent sample of the 2000 U.S. Census.9 The
sample is restricted to immigrant men aged 16 to 44,10 born in Mexico or Puerto Rico, who
9 The data was obtained via the Integrated Public Use Microdata Series (Ruggles et al., 2008) 10 The sample is restricted to relatively young couples in order to limit the potential bias caused by different divorce rates across the two types of marriage. For instance, if intermarried couples with low earnings were more likely to divorce than nonintermarried immigrants with low earnings, then the estimated effect of intermarriage would be biased upward.

11
worked at least one week in 1999 and do not reside in group quarters. We drop observations
with missing information on the man’s wage and salary income, his (and if applicable, his
wife’s) place of birth, or his year of immigration. Finally, we exclude a small number of
immigrant men who are married to non-Hispanic immigrant wives. The resulting sample
includes 101,203 immigrant men born in Mexico and 6,891 men born in Puerto Rico.
One significant shortcoming of the 2000 U.S. Census is a lack of information on
whether immigrants have green cards or H1-B visas, or for that matter whether they are in the
U.S. legally. We use intermarriage to identify a group of Permanent Residents, but the set of
other immigrants includes some with each visa status. The length of time since the immigrant
arrived in the U.S. can provide further insight into the likelihood that non-intermarried
immigrants have green cards (see Table 7). Still, there is no clear way to know whether the
remaining immigrants are legal or illegal. Thus, while one would ideally measure the value of
a green card relative to both of those alternatives, we can only estimate its value relative to a
mixture of the two in a proportion determined by their relative frequencies in the sample.11
In principle, this estimate would still represent the average Mexican immigrant’s benefit of a
green card relative to his alternate status, at least insofar as our instrument does not
inadvertently reweight the probabilities that legal and illegal immigrants marry natives.
However, this issue does caution against extrapolating the results to other immigrant groups.
The Census data also does not contain information on the age at which respondents
married, so it is impossible to identify whether immigrants were married when they arrived in
the U.S. This is unfortunate because immigrants who married before arriving in the U.S.
11 A further complication is that the sample composition may not equal the population composition, particularly if undocumented immigrants attempt to avoid detection by the Census.

12
could only become intermarried if their first marriage ended (Meng and Gregory 2005). We
attempt to exclude such men by dropping those who first came to the U.S. after age 25, which
is the mean age at which men marry in Mexico and Puerto Rico (United Nations, 2000).
We define intermarriage as a marital union between a man born in Mexico or Puerto
Rico and a wife born in one of the 50 U.S. states or the District of Columbia. Note that this
does not include wives born in Puerto Rico, even though they are U.S. citizens. If we instead
treated men married to women born in Puerto Rico as intermarried, only 506 Puerto Rican
men (seven percent) would be classified as married to a foreign-born wife. The cost of this
scheme is that 127 Mexican men who are married to wives born in Puerto Rico are not called
intermarried, when in fact it is possible that the marriage did grant them greater legal access
to the U.S. labor market. However, note that this only affects a small share of the sample (0.1
percent of our Mexican immigrant men and 0.2 percent of those who are married), and at any
rate, the classification should bias the estimated intermarriage premium downward.
The dependent variable is the natural logarithm of individuals’ pre-tax wage and salary
income per week worked in 1999, including wages, salaries, commissions, cash bonuses, tips,
and other money income received from an employer. Key control variables include an
indicator of English proficiency (=1 if the person speaks only English or speaks English
“very well” or “well”) and separate dummy variables for each level of education.12
Several other controls and all proposed instrument are computed on a geographic basis.
Markets are defined by metropolitan areas (MA); for each state, we have also created an
“at-large” market consisting of all individuals residing outside of a metro area. 12 This is the standard procedure to control for English proficiency in the literature. Table 6 below also reports estimates from a specification that includes a separate dummy variable for each category. The 2000 Census reports individuals’ highest degree or level of school completed, not their actual years of schooling.

13
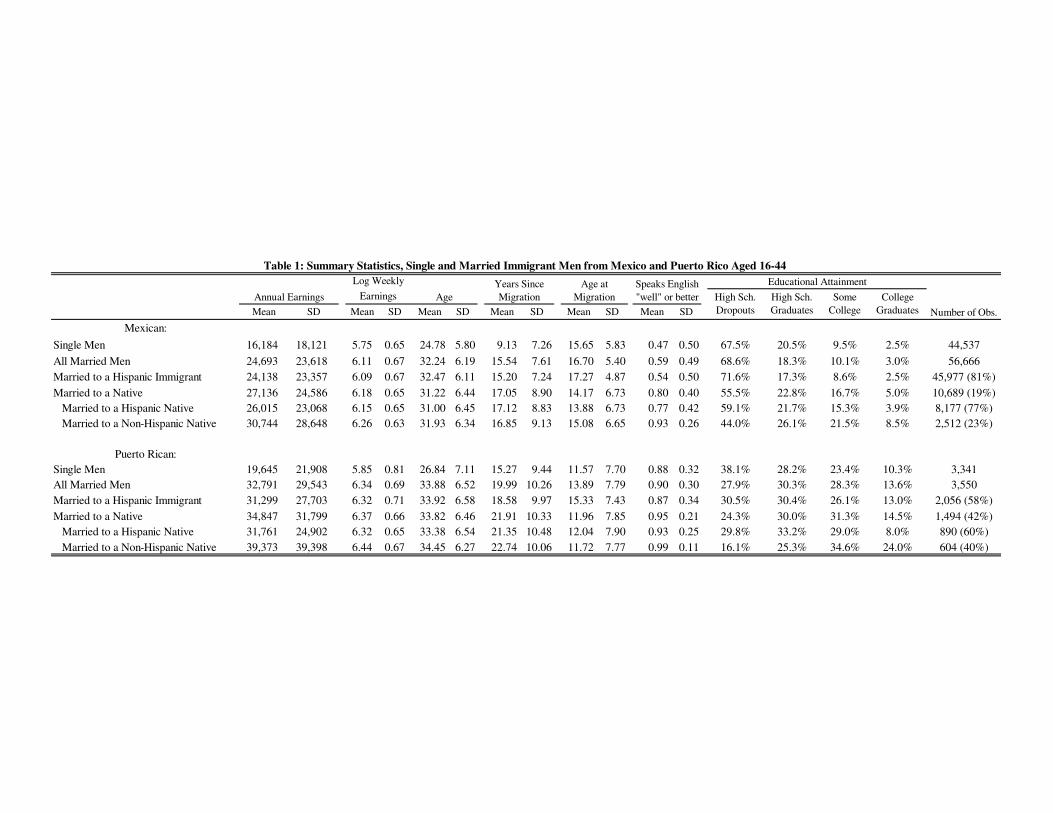
Table 1 presents summary statistics. Although similar shares of Mexicans (56 percent)
and Puerto Ricans (52 percent) are married, Puerto Ricans are twice as likely to be married to
a wife born in the U.S. (42 percent of married Puerto Ricans, versus 19 percent for Mexicans),
possibly suggesting that they have more opportunities to interact with the native-born
population. Intermarried men in both groups are more likely to be better educated, to be
proficient in English, to have been in the U.S. longer, and to have migrated at a younger age.
[Table 1 about here.]
The raw intermarriage premium for Mexicans is only modestly larger than that of Puerto
Ricans (9 percent versus 5 percent). In both groups intermarried men earn about 11-12
percent less if their wives are Hispanic, which is more common among Mexicans (77 percent
versus 60 percent). This compositional difference thus suggests that the difference in raw
intermarriage premiums understates the causal effect of Permanent Resident status. In fact,
among immigrant men from Puerto Rico with a Hispanic wife, the average log weekly wages
are identical whether the wives were born in the U.S. or abroad. Other compositional
differences that would appear to narrow the difference in raw intermarriage premiums include
differences in age and time since migration. The married-intermarried gaps in education and
English proficiency appear to work in the opposite direction, however.
V. Empirical Results
A. Determinants of Intermarriage
Table 2 presents results from a multinomial logit predicting the probability that an
immigrant is single, married to another immigrant, or married to a native. It reports estimates

14
as elasticities for the average man; for example, the first estimate indicates that a ten percent
increase in the immigrant/native ratio among local single Hispanic women is associated with
a 2.9 percent (not percentage point) decrease in the probability that an average immigrant
man is intermarried. Separate estimates are also reported for Mexicans and Puerto Ricans.
[Table 2 about here.]
The main result to note is that immigrants’ marital decisions appear to be sensitive to our
two proposed excluded exogenous variables. As anticipated, the ratio of immigrants to
natives among local single Hispanic women is a statistically significant predictor of
intermarriage, although it is not significantly related to the probability of being single, and the
share of local women who are single is a significant predictor of all three outcomes. The two
factors are jointly significant at the one percent level at both margins.
The results also indicate that Mexican and Puerto Rican men are similarly sensitive to
each of the reported factors for all three outcomes. We interpret this finding as evidence that
the two groups make marital decisions on similar bases, and possibly that native women view
them as close substitutes for one another. However, immigrant men who are proficient in
English are almost twice as likely to be married to a native.
B. Main Results
Table 3 presents the main results: the estimates of the intermarriage premium under our
preferred specification. The first column reports ordinary least-squares estimates of equation
(1). These estimates indicate that if we control only for observables, intermarried Mexican
men earn 6.3 percent more than those married to other immigrants, who in turn earn 14.3

15
percent more than single men. That 6.3 percent difference is statistically significant, but the
comparable 0.3 percent difference among Puerto Rican men is not. The OLS estimate of the
green card premium is thus 5.9 percent. Given that the raw premiums received by the two
groups are close (see Table 1), the larger gap under OLS suggests that the observable
differences in demographic characteristics and human capital explain only part of the raw
intermarriage premium for Mexicans, but almost the entire premium for Puerto Ricans.
[Table 3 about here.]
The remaining two columns report IV estimates that treat the marriage and intermarriage
indicators as endogenous. As described in our methodology section, the instruments are
predicted probabilities of marriage and intermarriage from multinomial logits. The middle
column reports estimates in which the instruments for both Mexicans and Puerto Ricans are
calculated from a single logit on the combined sample (as reported in Table 2 above), while
the final column is based on predictions from separate logits for the two groups.
The two approaches ultimately yield similar conclusions: the estimated difference in
intermarriage premiums between the two groups is 38.1 percent in the one specification and
34.6 percent in the other. The tables below will confirm that similar estimates emerge under a
wide variety of modifications, so we will conclude that the true effect likely lies in this range.
The fact that the IV estimates are larger than the OLS estimates suggests negative
selection into intermarriage. Similar findings emerged in previous work on intermarriage
wage premiums in Australia (Meng and Gregory, 2005) and France (Meng and Meurs, 2009),
and on intermarriage employment premiums in the U.S. (Furtado and Thedoropolous, 2009).
One potential explanation is that immigrant men prefer immigrant wives, and those who earn
16
more “spend” a portion in the form of a foregone intermarriage premium. Since our
instruments are geography-based, it is also possible that more talented immigrants migrate to
cities with more immigrants, although Table 5 below offers little support for that hypothesis.
This pattern is more pronounced for Mexicans than Puerto Ricans. In both IV
specifications, the estimated intermarriage premium for Mexicans is greater than 40 percent
and statistically significant, whereas the estimated premium for Puerto Ricans is 7 to 11
percent, but statistically insignificant. The greater increase in the estimated Mexican premium
as we move from OLS to IV suggests that Mexicans are more strongly (negatively) selected
into intermarriage, such as if relatively poorer Mexicans benefited more from intermarriage,
e.g., because their employers were less likely to sponsor green card applications.13
While the two IV models yield similar estimates of the green card premium, there are
greater differences in the component estimates. When we run separate multinomial logits for
the two groups, we estimate that both groups receive larger wage premiums for marrying
both immigrants and natives. The specifications reported below also show similar instability
in the estimated baseline marriage premium, but there is much less variation in the estimated
intermarriage premium (i.e., ( ) from equation (1)). A similar comparison holds across
Meng and Gregory’s (2005, Table 4) estimates using different possible instrumental variables.
The lower panel of Table 3 reports statistics from the first-stage IV (2SLS) regressions.
It indicates that the multinomial logit fitted values are strong instruments for the marriage and
intermarriage dummies in equation (1). The smallest of the reported F-statistics is 193, or
about 20 times larger than the minimum guideline suggested by Stock and Yogo (2002).
13 However, Barcellos (2010) finds that college educated Mexican immigrants experienced more wage growth than high school dropouts after the Immigration Reform and Control Act of 1986 .

17
C. Robustness
Tables 4, 5, and 6 respectively list the estimated intermarriage premiums under alternate
sample selection criteria, excluded exogenous variables, and control variables. The first
column of Table 4 presents IV estimates from a sample that includes only men who
immigrated before age 18, so that we can be confident that they were not married before they
arrived. The estimates indicate that intermarried Mexican immigrants earn a 46 percent wage
premium, but the estimated premium for Puerto Ricans is negative and statistically
insignificant. The difference-in-differences point estimate suggests that a green card increases
wages by about 50 percent. The next column uses only immigrant men who are reported to
speak English “well” or better; much as in Table 3, the estimated green card premium is just
over 30 percent and statistically significant. Estimates are also very similar if we exclude
individuals living in the three largest cities (column 3), which includes the most common
locations of both groups (Los Angeles for Mexicans and New York for Puerto Ricans).
[Table 4 about here]
The samples used the last three columns are subject to potentially severe selection biases,
and the first two also conflict with the intuition for one of our excluded exogenous variables
(immigrants/natives among local single Hispanic women), yet the results are still largely
consistent with the previous IV estimates. The samples used in the fourth and fifth columns
exclude men who marry non-Hispanic or Hispanic natives, respectively. In both cases the
estimated Mexican intermarriage premium is similar to previous estimates (37 and 28 percent)
and statistically significant, and the latter sample even yields a similar estimate of the green

18
card premium, a statistically significant 33 percent. The corresponding estimate is smaller
and insignificant when men married to non-Hispanic natives are excluded, but the deviation
from earlier results arises mainly from the large yet imprecise estimated intermarriage
premium for Puerto Ricans (24 percent, but the p-value is 0.34), which strikes us as less
troublesome than uninformative. Finally, the sample used in the last column excludes single
men. While this change substantially reduces the two groups’ intermarriage premiums, the
difference between those premiums is again about 30 percent and statistically significant.
Table 5 presents estimates from several variations on our IV strategy. The first two
specifications address the concern that immigrants may have chosen cities with favorable
labor or marriage market shocks; they respectively compute our preferred set of excluded
exogenous variables using metro areas’ demographics ten years earlier (from the 1990 Census)
and individuals’ locations five years earlier. The next three columns report results using the
alternate excluded exogenous variables described at the end of Section III.A. The instruments
used in the last column are fitted values from a multinomial probit rather than a logit.
[Table 5 about here]
The estimated green card premiums from these specifications are remarkably similar to
both one another and to the estimates reported in Table 3. In all cases the estimated premium
is about 0.35 and statistically significant at the one percent level. Moreover, the estimated
intermarriage premium among Mexicans is almost always near 0.40 and significant, but the
estimated intermarriage premiums are never significant for Puerto Ricans.
Table 6 reports estimates from three specifications that include expanded controls. The
first column includes a dummy variable for each state, the second adds dummy variables for

19
each industry, and the third includes separate dummies for each reported level of English
proficiency, rather than a simple binary variable. In each case, the estimated green card effect
is on the order of 30 percent; it is statistically significant at the one percent level for the first
two cases and at the six percent level when the expanded set of proficiency dummies. The
only substantial difference from the IV estimates in Table 3 is that Puerto Rican intermarriage
premium is larger here, although still significant at only the nine percent level.
[Table 6 about here]
D. Estimates by Time Since Immigration
As explained earlier, the main way in which immigrants acquire green cards is not via
marriage to a native, but through sponsorship by an employer. The latter process usually takes
more than five years, but less than ten. It thus seems likely that the Mexican immigrants in
our sample who have been in the U.S. for more than ten years have acquired a green card
regardless of their marital decisions, but those who arrived less than six years ago probably
do not have a green card unless they are intermarried. We can therefore test our empirical
strategy further by stratifying the sample on the basis of time in the U.S., with the expectation
that our measure of the green card premium is much larger for the recent immigrants.
Table 7 confirms this prediction. For men who immigrated at least ten years earlier, the
estimated intermarriage premiums for both Mexicans and Puerto Ricans and the green card
premium are all statistically insignificant (and negative). However, for those who immigrated
less than six years ago, the estimated green card premium is 0.766, implying a statistically
significant 115 percent increase in weekly earnings.
[Table 7 about here.]

20
The clear implication is that Permanent Resident status is very valuable. This group earns
$15,500 on average, so the point estimate implies an annual premium of about $18,000.
That point estimate is admittedly quite noisy: the 95 percent confidence interval ranges
from $2,600 to $46,000. However, similar magnitudes are implied by estimates from the full
sample of immigrant men in Tables 3 through 6. That group has an average annual income of
$21,100, so the preferred estimate of the green card premium from Table 3 (e0.346-1=0.41)
amounts to $8,700 per year, but Table 7 implies that the effect is almost entirely concentrated
among immigrants who arrived less than six years ago. Since that group includes only 31
percent of the Mexican men who arrived after age 16 (20,688 out of 66,440), the implied
green card premium for those recent immigrants would be $28,000 per year. If we instead
assumed an eight year wait for a green card, the point estimate falls to $19,900. Alternatively,
using our smallest compelling IV estimate (from the last column of Table 6) and again
assuming a six year wait, the estimated effect would be $19,100 per year.
These are clearly crude, back-of-the-envelope calculations, but they consistently imply
that for the average recent Mexican immigrant, the difference between having a green card or
not – which for some means holding a more limited work visa and for others means having
no legal authorization to work – is roughly $20,000 per year, or somewhere on the order of
$100,000 to $150,000 over a typical wait for an employment-based green card.
VI. Concluding Comments
As noted in the introduction, the green card premium can be described as the amount by
which the wages of male Mexican immigrants fall short of their potential due to the delay in

21
obtaining a green card. It is not clear what becomes of the loss, however. The consequences
for the immigrants themselves are obvious, but it would be an interesting question for future
research to apportion the premium into parts accruing to employers of immigrants, to workers
shielded from competition from immigrants, to consumers facing lower prices, and to the
deadweight loss of unrealized gains from potentially more efficient employment matches.
While we have identified some reasons to believe that our estimates are conservative,
several concluding caveats are in order. For one thing, we have not considered any potential
costs to the immigrant, such as the legal fees that often accompany green card applications.
Further, our estimates are based only on the experience of men born in Mexico, so it remains
to be seen if women or men from other countries experience similar gains. They may not; the
fact that many Mexican immigrants are undocumented suggests that green cards may be
especially valuable to them. It should also be noted that these figures specifically do not
estimate the increase in immigrants’ wages relative to what they would have earned in
Mexico. Finally, while the 2001 immigration law preventing undocumented immigrants from
acquiring a green card through intermarriage presumably reduced the value of intermarriage
for that group, we know of no reason to suspect that it altered the value of a green card itself.
References
Angrist, Joshua D. and Jörn-Steffen Pischke. 2009. Mostly Harmless Econometrics: An Empiricist's Companion. Princeton, NJ: Princeton University Press.
Bailey, Thomas. 1985. “The influence of legal status on the labor market impact of immigration.” International Migration Review 19(2), 220-38.
Barcellos, Silvia Helena. 2010. “Legalization and the economic status of immigrants.” RAND Working Paper Series, no. WR-754.

22
Borjas, George J. 2008. “Labor outflows and labor inflows in Puerto Rico.” Journal of Human Capital 2(1), 32-68.
Borjas, George J. and Marta Tienda. 1993. “The employment and wages of legalized immigrants.” International Migration Review 27(4), 712-47. Chiswick, Barry R., and Paul W. Miller. 1995. “The endogeneity between language and earnings: International analyses.” Journal of Labor Economics 13(2), 246–88. Daniel, Kermit Erik. 1993. “Does marriage make male workers more productive?” Ph.D. dissertation, University of Chicago. Furtado, Delia, and Nikolaos Theodoropoulos. 2009. “I’ll marry you if you get me a job: marital assimilation and immigrant employment rates.” International Journal of Manpower 30( 1-2), 116-26. Gray, Jeffrey S. 1997. “The fall in men’s return to marriage: Declining productivity effects or changing selection?” Journal of Human Resources 32(3), 481-504. Grieco, Elizabeth M., and Edward N. Trevelyan. 2010. “Place of birth of the foreign-born population: 2009.” American Survey Community Briefs, number 09-15. Imbens, Guido W., and Joshua D. Angrist. 1994. “Identification and estimation of local average treatment effects.” Econometrica 62(2), 467-75. Kantarevic, Jasmin. 2004. “Interethnic marriages and economic assimilation of immigrants.” IZA Discussion Paper Series, no. 1142, Institute for the Study of Labor, Bonn, Germany. Kossoudji, Sherrie A. and Deborah A. Cobb-Clark. 2000. “IRCA’s impact on the occupational concentration and mobility of newly-legalized Mexican men.” Journal of Population Economics 13(1), 81-98. Lieberson, Stanley, and Mary C. Waters. 1986. “Ethnic groups in flux: the changing ethnic responses of American whites.” Annual American Academy of Political and Social Sciences 487(1), 79–91. Meng, Xin and Robert G. Gregory. 2005. “Intermarriage and the Economic Assimilation of Immigrants.” Journal of Labor Economics 23(1), 135-74. Meng, Xin, and Dominique Meurs. 2009. “Intermarriage, language, and economic assimilation process: a case study of France.” International Journal of Manpower 30(1-2), 127-44. Passel, Jeffrey, and Paul Taylor. 2009. “Who’s Hispanic?” Press release, Pew Hispanic Center.

23
Rosenfeld, Michael J. 2001. “The salience of pan-national Hispanic and Asian identities in U.S. marriage markets.” Demography 38(2), 161-175. Ruggles, Steven, Matthew Sobek, Trent Alexander, Catherine A. Fitch, Ronald Goeken, Patricia K. Hall, Miriam King, and Chad Ronnander. 2008. Integrated Public Use Microdata Series: Version 4.0 [Machine-readable database]. Minneapolis, MN: Minnesota Population Center. Available at http://usa.ipums.org/usa/. Singer, Audrey. 1994. “Changes in the employment and earnings of the legalized population.” Washington D.C.: U.S. Department of Labor. Stock, James H., and Morohiro Yogo. 2002. “Testing for weak instruments in linear IV regression.” NBER Working Paper Series, Technical Working Paper 284. United Nations, Population Division, Department of Economic and Social Affairs. 2000. World Marriage Patterns, 2000. New York. Wooldridge, Jeffrey W. 2002. Econometric Analysis of Cross Section and Panel Data. Cambridge, MA: MIT Press.
Mean SD Mean SD Mean SD Mean SD Mean SD Mean SD
Mexican:
Single Men 16,184 18,121 5.75 0.65 24.78 5.80 9.13 7.26 15.65 5.83 0.47 0.50 67.5% 20.5% 9.5% 2.5% 44,537
All Married Men 24,693 23,618 6.11 0.67 32.24 6.19 15.54 7.61 16.70 5.40 0.59 0.49 68.6% 18.3% 10.1% 3.0% 56,666
Married to a Hispanic Immigrant 24,138 23,357 6.09 0.67 32.47 6.11 15.20 7.24 17.27 4.87 0.54 0.50 71.6% 17.3% 8.6% 2.5% 45,977 (81%)
Married to a Native 27,136 24,586 6.18 0.65 31.22 6.44 17.05 8.90 14.17 6.73 0.80 0.40 55.5% 22.8% 16.7% 5.0% 10,689 (19%)
Married to a Hispanic Native 26,015 23,068 6.15 0.65 31.00 6.45 17.12 8.83 13.88 6.73 0.77 0.42 59.1% 21.7% 15.3% 3.9% 8,177 (77%)
Married to a Non-Hispanic Native 30,744 28,648 6.26 0.63 31.93 6.34 16.85 9.13 15.08 6.65 0.93 0.26 44.0% 26.1% 21.5% 8.5% 2,512 (23%)
Puerto Rican:
Single Men 19,645 21,908 5.85 0.81 26.84 7.11 15.27 9.44 11.57 7.70 0.88 0.32 38.1% 28.2% 23.4% 10.3% 3,341
All Married Men 32,791 29,543 6.34 0.69 33.88 6.52 19.99 10.26 13.89 7.79 0.90 0.30 27.9% 30.3% 28.3% 13.6% 3,550
Married to a Hispanic Immigrant 31,299 27,703 6.32 0.71 33.92 6.58 18.58 9.97 15.33 7.43 0.87 0.34 30.5% 30.4% 26.1% 13.0% 2,056 (58%)
Married to a Native 34,847 31,799 6.37 0.66 33.82 6.46 21.91 10.33 11.96 7.85 0.95 0.21 24.3% 30.0% 31.3% 14.5% 1,494 (42%)
Married to a Hispanic Native 31,761 24,902 6.32 0.65 33.38 6.54 21.35 10.48 12.04 7.90 0.93 0.25 29.8% 33.2% 29.0% 8.0% 890 (60%)
Married to a Non-Hispanic Native 39,373 39,398 6.44 0.67 34.45 6.27 22.74 10.06 11.72 7.77 0.99 0.11 16.1% 25.3% 34.6% 24.0% 604 (40%)
Table 1: Summary Statistics, Single and Married Immigrant Men from Mexico and Puerto Rico Aged 16-44
Age
Years Since
Migration
Speaks English
"well" or betterEarnings
Age at
Migration
Number of Obs.
Log Weekly
High Sch.
Dropouts
High Sch.
Graduates
Some
College
College
Graduates
Educational Attainment
Annual Earnings

Explanatory Variable Elast. SE P Elast. SE P Elast. SE P
Immigrant/native ratio among local unmarried Hispanic women
All -0.29 0.05 0.00 0.04 0.02 0.01 0.02 0.02 0.23
Men born in Mexico -0.29 0.05 0.00 0.04 0.02 0.01 0.02 0.02 0.31
Men born in Puerto Rico -0.32 0.06 0.00 0.09 0.03 0.00 0.06 0.02 0.00
Share of local women who are not married
All -1.37 0.21 0.00 -0.26 0.13 0.05 0.61 0.15 0.00
Men born in Mexico -1.38 0.21 0.00 -0.27 0.13 0.04 0.60 0.15 0.00
Men born in Puerto Rico -1.36 0.21 0.00 -0.20 0.17 0.23 0.70 0.14 0.00
Share of local population that is Hispanic
All -0.20 0.04 0.00 0.02 0.02 0.26 0.02 0.02 0.36
Men born in Mexico -0.20 0.05 0.00 0.02 0.02 0.27 0.02 0.02 0.39
Men born in Puerto Rico -0.12 0.03 0.00 0.03 0.02 0.12 0.03 0.01 0.06
Average wage of local native-born married men in educational group
All -8.98 1.04 0.00 -0.04 0.50 0.93 2.32 0.55 0.00
Men born in Mexico -9.02 1.05 0.00 -0.10 0.49 0.83 2.25 0.56 0.00
Men born in Puerto Rico -8.39 0.99 0.00 0.79 0.61 0.20 3.21 0.55 0.00
Dummy: English proficiency (semi-elasticity)
All 0.94 0.04 0.00 -0.06 0.01 0.00 -0.14 0.01 0.00
Men born in Mexico 0.88 0.04 0.00 -0.12 0.01 0.00 -0.19 0.01 0.00
Men born in Puerto Rico 0.95 0.04 0.00 -0.06 0.01 0.00 -0.13 0.01 0.00
χ2(2) P χ
2(2) P
Test: Excluded variables are jointly significant 65.77 0.00 14.63 0.00
Pseudo R2
0.23
No. of Observations 108,094
Table 2: Estimated Mean Elasticities of Probabilities of Marital Outcomes with Respect to Selected Explanatory
Variables in Multinomial Logit Model, Mexican and Puerto Rican Immigrant Men Aged 16-44
SingleIntermarried Non-intermarried
(base category)
Notes: The reported estimates are interpreted as percentage changes in the average man's probability of the indicated
outcome per percentage change in the explanatory variable; for fluency, it is the percentage change in the probability of the
outcome if the individual is fluent rather than not fluent. The first two explanatory variables comprise our preferred set of
excluded exogenous variables. Other non-reported controls include a quadratic in the number of years since the person
migrated to the U.S. (excluding Puerto Rico); dummy variables for current school attendance, urban residence, and veteran
status; and complete sets of dummy variables for age, education, and region of residence. Intercepts and the effects of
educational attainment are allowed to differ between Mexicans and Puerto Ricans; we have also tried allowing other
coefficients to vary across groups, but none of the differences were statistically significant. The sample excludes men who
are divorced, widowed, married to a non-Hispanic immigrant, or married to an absent spouse. All estimates use person-level
sample weights, and standard errors correct for non-independence (clustering) of observations within metropolitan areas.

Estimated Coefficients in Wage Equation
Est.
(x100)
SE
(x100) P
Est.
(x100)
SE
(x100) P
Est.
(x100)
SE
(x100) P
Mexican:
Intermarried versus Single 20.6 1.0 0.00 20.3 14.2 0.15 31.4 12.0 0.01
Non-intermarried versus Single 14.3 0.6 0.00 -29.1 14.8 0.05 -10.1 8.7 0.24
Intermarriage Premium 6.3 0.8 0.00 49.4 13.0 0.00 41.5 11.4 0.00
Puerto Rican:
Intermarried versus Single 26.1 1.8 0.00 2.7 18.7 0.89 21.5 14.3 0.13
Non-intermarried versus Single 25.8 2.1 0.00 -8.6 20.7 0.68 14.6 11.0 0.19
Intermarriage Premium 0.3 2.3 0.89 11.3 23.1 0.63 6.9 16.7 0.68
Difference in Differences 5.9 2.6 0.02 38.1 16.4 0.02 34.6 13.1 0.01
R2
Observations
First-stage IV regressions R2
F P R2
F P
Intermarriage - Mexicans 0.11 386.2 0.00 0.11 440.4 0.00
Non-intermarriage - Mexicans 0.30 1,814.8 0.00 0.30 1,330.7 0.00
Intermarriage - Puerto Ricans 0.29 193.4 0.00 0.30 194.3 0.00
Non-intermarriage - Puerto Ricans 0.37 201.9 0.00 0.38 312.2 0.00
Mexicans and Puerto Ricans in a single or
separate multinomial logits?
Table 3: OLS and IV Estimates of the Wage Premiums Associated with Marriage to a U.S. Native or
Another Immigrant, Mexican and Puerto Rican Immigrant Men Aged 16-44
IV (2SLS)
0.11
108,094
single separate
OLS IV (2SLS)
Notes: The excluded variables used are (1) ratio of immigrants to natives among local unmarried Hispanic
women, and (2) share of all local women aged 16-44 who are unmarried. Other controls included are the fraction
of the local population who are Hispanic immigrants, a quadratic in the number of years since the individual
migrated, and dummy variables indicating his English fluency, educational attainment, age, veteran status,
current school attendance, urban residence, and nine geographic regions. Intercepts and effects of educational
attainment are allowed to differ between Mexicans and Puerto Ricans. The sample excludes men who are
divorced, widowed, married to a non-Hispanic immigrant, or married to an absent spouse. All estimates use
person-level sample weights, and standard errors correct for non-independence (clustering) of observations
within metropolitan areas.
108,094
0.150.18
108,094

Sample:
Est.
(x100)
SE
(x100) P
Est.
(x100)
SE
(x100) P
Est.
(x100)
SE
(x100) P
Est.
(x100)
SE
(x100) P
Est.
(x100)
SE
(x100) P
Est.
(x100)
SE
(x100) P
Mexicans:
Intermarried versus Single 12.8 13.9 0.36 25.5 13.2 0.05 25.4 12.1 0.04 24.2 12.6 0.06 20.9 13.4 0.12
Non-intermarried versus Single -33.8 12.8 0.00 -12.3 10.4 0.24 -11.6 10.1 0.25 -12.8 5.8 0.13 -7.1 7.9 0.37
Intermarriage Premium 46.5 12.8 0.01 37.8 12.9 0.00 37.0 11.9 0.00 37.0 13.2 0.01 27.9 12.6 0.03 -2.6 10.1 0.80
Puerto Ricans:
Intermarried versus Single -11.1 15.8 0.48 11.6 14.2 0.41 21.7 14.8 0.14 31.0 21.3 0.15 11.8 13.2 0.37
Non-intermarried versus Single -7.6 19.3 0.69 6.5 13.8 0.64 18.5 12.1 0.13 7.0 10.8 0.52 17.1 9.9 0.08
Intermarriage Premium -3.5 20.0 0.86 5.1 18.3 0.78 3.2 16.8 0.85 24.0 25.4 0.34 -5.3 14.4 0.71 -30.9 13.1 0.02
Difference in Differences (IV) 50.0 17.6 0.01 32.7 13.4 0.02 33.8 13.5 0.01 12.9 22.6 0.57 33.2 13.9 0.02 28.4 9.6 0.00
Difference in Differences (OLS) 7.9 3.4 0.02 5.4 2.7 0.04 3.3 2.6 0.20 4.7 3.1 0.13 8.7 3.1 0.01 6.5 2.6 0.02
R2
Observations
Table 4: Alternative Sample Selection Criteria - Selected IV Estimates of the Earnings Equation, Mexican and Puerto Rican Immigrant Men Aged 16-44
Exclude men older
than 18 upon arrival
Speaks English "well"
or better
Exclude men from
NYC, LA, Chicago
Exclude men married to
non-Hispanic natives
Exclude single menExclude men married
to Hispanic natives
0.17
Notes: The excluded variables used are (1) ratio of immigrants to natives among local unmarried Hispanic women, and (2) share of all local women aged 16-44 who are unmarried. Other
controls included are the fraction of the local population who are Hispanic immigrants, a quadratic in the number of years since the individual migrated, and dummy variables indicating his
English fluency, educational attainment, age, veteran status, current school attendance, urban residence, and nine geographic regions. Intercepts and effects of educational attainment are
allowed to differ between Mexicans and Puerto Ricans. The sample excludes men who are divorced, widowed, married to a non-Hispanic immigrant, or married to an absent spouse. All
estimates use person-level sample weights, and standard errors correct for non-independence (clustering) of observations within metropolitan areas.
68,472
0.13
60,308 82,907
0.16
104,978
0.11
60,215
0.14
99,027
0.15

Est.
(x100)
SE
(x100) P
Est.
(x100)
SE
(x100) P
Est.
(x100)
SE
(x100) P
Est.
(x100)
SE
(x100) P
Est.
(x100)
SE
(x100) P
Est.
(x100)
SE
(x100) P
Mexican:
Intermarried versus Single 43.3 11.7 0.00 10.5 15.7 0.50 43.5 11.0 0.00 37.2 12.3 0.00 25.6 12.4 0.04 33.3 12.2 0.01
Non-intermarried versus Single -6.5 9.0 0.47 -29.3 13.2 0.03 -17.0 9.2 0.07 -8.1 9.6 0.40 -13.5 9.0 0.13 -13.4 8.9 0.13
Intermarriage Premium 49.9 12.7 0.00 39.8 12.0 0.00 60.5 11.7 0.00 45.3 12.7 0.00 39.1 12.6 0.00 46.7 11.3 0.00
Puerto Rican:
Intermarried versus Single 30.5 14.0 0.03 -4.2 18.3 0.82 29.5 13.0 0.02 25.2 14.6 0.09 15.7 14.6 0.28 21.3 14.5 0.14
Non-intermarried versus Single 14.9 11.8 0.21 -6.7 14.9 0.65 2.4 11.6 0.84 15.2 12.20 0.214 10.4 11.7 0.37 11 11.3 0.33
Intermarriage Premium 15.6 18.0 0.39 2.5 17.9 0.89 27.1 15.6 0.08 10.0 17.9 0.21 5.3 17.5 0.76 10.3 17.0 0.54
Difference in Differences 34.3 13.0 0.01 37.3 13.8 0.01 33.4 13.0 0.01 35.3 13.2 0.01 33.8 13.2 0.01 36.4 13.5 0.01
Excluded variables for multinomial logit
R2
Observations
Table 5: Alternative Excluded Variables in Equation (2) - Selected IV Estimates from the Earnings Equation, Mexican and Puerto Rican Immigrant Men Aged 16-44
Meng and Gregory's
(2005) instruments
(1) Share of local
unmarried women who are
Hispanic immigrants
(2) Sex ratio (women/men)
among unmarried Hispanic
immigrants
Kantarevic's (2004)
instrument plus sex ratio
(1) Ratio of Hispanic
immigrants/natives among
local unmarried women /
same ratio for entire US
(2) Sex ratio (women/men)
among all local people
108,094 108,094
Notes: Other controls included are the fraction of the local population who are Hispanic immigrants, a quadratic in the number of years since the individual migrated, and dummy variables indicating his
English fluency, educational attainment, age, veteran status, current school attendance, urban residence, and nine geographic regions. Intercepts and effects of educational attainment are allowed to differ
between Mexicans and Puerto Ricans. The sample excludes men who are divorced, widowed, married to a non-Hispanic immigrant, or married to an absent spouse. All estimates use person-level sample
weights, and standard errors correct for non-independence (clustering) of observations within metropolitan areas.
89,762107,082 108,094 108,094
0.14
Baseline set, using
location's 1990 data
Baseline set, using
individual's location
5 years earlier
(excludes persons
abroad 5 years ago)
0.140.150.120.14 0.10
Baseline set, using
multinomial probit
rather than logit
(Two other candidate
excluded variables)
(1) Share of local native
unmarried women who
are of Hispanic descent
(2) Sex ratio
(women/men) among all
unmarried people
(1) Iimmigrant/native
ratio among local
unmarried Hispanic
women
(2) Share of all local
women aged 16-44
who are unmarried

Est.
(x100)
SE
(x100) P
Est.
(x100)
SE
(x100) P
Est.
(x100)
SE
(x100) P
Mexican:
Intermarried versus Single 40.3 12.1 0.00 29.0 8.9 0.00 35.4 11.7 0.00
Non-intermarried versus Single -5.1 8.3 0.54 -10.8 6.4 0.09 -14.3 8.5 0.09
Intermarriage Premium 45.4 10.5 0.00 39.8 8.9 0.00 49.7 10.2 0.00
Puerto Rican:
Intermarried versus Single 30.2 13.2 0.02 23.4 9.9 0.02 28.5 14.1 0.04
Non-intermarried versus Single 18.7 10.2 0.07 12.2 7.6 0.11 3.6 10.1 0.72
Intermarriage Premium 11.5 14.1 0.42 11.1 11.1 0.32 24.9 14.6 0.09
Difference in Differences 34.0 11.8 0.00 28.6 9.7 0.00 24.8 13.1 0.06
R2
Additional controls
Observations
Table 6: Alternative Controls - Selected IV Estimates of the Earnings Equation, Mexican and Puerto Rican
Immigrant Men Aged 16-44
0.13
Notes: The excluded variables used are (1) ratio of immigrants to natives among local unmarried Hispanic women,
and (2) share of all local women aged 16-44 who are unmarried. Other controls included are the fraction of the
local population who are Hispanic immigrants, a quadratic in the number of years since the individual migrated,
and dummy variables indicating his English fluency, educational attainment, age, veteran status, current school
attendance, urban residence, and nine geographic regions. Intercepts and effects of educational attainment are
allowed to differ between Mexicans and Puerto Ricans. The sample excludes men who are divorced, widowed,
married to a non-Hispanic immigrant, or married to an absent spouse. All estimates use person-level sample
weights, and standard errors correct for non-independence (clustering) of observations within metropolitan areas.
108,094 108,094
0.17
108,094
0.15
state dummies industry dummies detailed language
proficiency dummies

Sample
Est.
(x100)
SE
(x100) P
Est.
(x100)
SE
(x100) P
Est.
(x100)
SE
(x100) P
Est.
(x100)
SE
(x100) P
Mexican:
Intermarried versus Single 14.1 2.0 0.00 20.1 17.5 0.25 21.2 2.3 0.00 25.5 27.6 0.36
Non-intermarried versus Single 5.8 1.1 0.00 -50.2 16.8 0.00 17.6 1.4 0.00 37.0 28.4 0.19
Intermarriage Premium 8.3 2.1 0.00 70.4 19.5 0.00 3.6 1.6 0.02 -11.5 12.7 0.37
Puerto Rican:
Intermarried versus Single 26.5 5.3 0.00 26.5 24.8 0.28 25.5 7.0 0.00 14.6 30.4 0.63
Non-intermarried versus Single 26.4 4.8 0.00 32.7 19.8 0.10 26.4 6.1 0.00 24.5 23.0 0.29
Intermarriage Premium 0.1 6.3 0.99 -6.2 28.5 0.83 -0.9 3.8 0.80 -9.9 19.3 0.61
Difference in Differences 8.2 6.5 0.21 76.6 31.2 0.01 4.5 4.1 0.27 -1.5 18.9 0.94
Observations
Notes: The excluded variables used are (1) ratio of immigrants to natives among local unmarried Hispanic women, and (2) share of all local
women aged 16-44 who are unmarried. Other controls included are the fraction of the local population who are Hispanic immigrants, a
quadratic in the number of years since the individual migrated, and dummy variables indicating his English fluency, educational attainment,
age, veteran status, current school attendance, urban residence, and nine geographic regions. Intercepts and effects of educational attainment
are allowed to differ between Mexicans and Puerto Ricans. The sample excludes men who are divorced, widowed, married to a non-Hispanic
immigrant, or married to an absent spouse. All estimates use person-level sample weights, and standard errors correct for non-independence
(clustering) of observations within metropolitan areas.
32,63032,630
IV (2SLS)OLS
Men who immigrated more than 10 years ago,
arrived at age greater than 15
Table 7: Disaggregation - Selected Results from OLS and Two-Stage Estimation of the Earnings Equation, Mexican and Puerto
Rican Immigrant Men Aged 16-44
21,52121,521
OLS IV (2SLS)
Men who immigrated 0-5 years ago, arrived at age
greater than 15