How MucH Are TeAcHers PAid? - OECD.org - OECD MucH Are TeAcHers PAid? • The statutory salaries of...
16
INDICATOR D3 Education at a Glance © OECD 2011 406 1 2 http://dx.doi.org/10.1787/888932461978 HOW MUCH ARE TEACHERS PAID? • e statutory salaries of teachers with at least 15 years of experience average USD 38 914 at the primary level, USD 41 701 at the lower secondary level and USD 43 711 at the upper secondary level. • On average in OECD countries, teachers’ salaries at the primary-school level amount to 77% of full-time, full-year earnings for 25-64 year-olds with a tertiary education, while teachers’ salaries at the lower secondary level amount to 81% of that benchmark and teacher’s salaries at the upper secondary level amount to 85% of it. 140 000 120 000 100 000 80 000 60 000 40 000 20 000 0 Equivalent USD converted using PPPs Luxembourg Switzerland 1 Germany Ireland 2 Netherlands Denmark Korea Spain Scotland 2 Japan Australia England Belgium (Fl.) Belgium (Fr.) United States 2 Austria Finland 2 Norway 2 Portugal OECD average Italy Sweden 2 France Slovenia Greece Iceland Israel Mexico Czech Republic Chile Poland Estonia Hungary 2 Slovak Republic Indonesia 1. Salaries after 11 years of experience. 2. Actual salaries. 3. Year of reference 2008. 4. Year of reference 2007. 5. Year of reference 2006. Countries are ranked in descending order of teachers' salaries in lower secondary education after 15 years of experience and minimum training. Source: OECD. Indonesia: UNESCO Institute for Statistics (World Education Indicators Programme). Tables D3.1 and D3.2. See Annex 3 for notes (www.oecd.org/edu/eag2011). Chart D3.1. Teachers’ salaries (minimum, after 10 years experience, 15 years experience, and maximum) in lower secondary education (2009) Annual statutory teachers’ salaries in public institutions in lower secondary education, in equivalent USD converted using PPPs, and the ratio of salary after 15 years of experience to earnings for full-time, full-year workers with tertiary education aged 25 to 64 Salary after 15 years of experience/minimum training Salary at the top of scale/minimum training Salary after 10 years of experience/minimum training Starting salary/minimum training 1.5 1.0 0.5 0.0 Ratio Luxembourg Germany Ireland 2 Netherlands 3 Denmark Korea 3 Spain 3 Scotland 2 Australia England Belgium (Fl.) Belgium (Fr.) United States 2 Austria Finland 2 Norway 2, 4 Portugal OECD average Italy 3 Sweden 2, 3 France 5 Slovenia Iceland 5 Israel Czech Republic Poland 3 Estonia Hungary 2 Slovak Republic Ratio of salary after 15 years of experience/minimum training to earnings for full-time, full-year workers with tertiary education aged 25 to 64 (2009 or latest available year)
Transcript of How MucH Are TeAcHers PAid? - OECD.org - OECD MucH Are TeAcHers PAid? • The statutory salaries of...

IndIcator D3
Education at a Glance © OECD 2011406
1 2 http://dx.doi.org/10.1787/888932461978
How MucH Are TeAcHers PAid?
•The statutory salaries of teachers with at least 15 years of experience average USD 38 914 at the primary level, USD 41 701 at the lower secondary level and USD 43 711 at the upper secondary level.
•On average in OECD countries, teachers’ salaries at the primary-school level amount to 77% of full-time, full-year earnings for 25-64 year-olds with a tertiary education, while teachers’ salaries at the lower secondary level amount to 81% of that benchmark and teacher’s salaries at the upper secondary level amount to 85% of it.
140 000120 000100 000
80 00060 00040 00020 000
0
Equivalent USD converted using PPPs
Luxe
mbo
urg
Swit
zerl
and1
Ger
man
yIr
elan
d2
Net
herl
ands
Den
mar
kK
orea
Spai
nSc
otla
nd2
Japa
nA
ustr
alia
Engl
and
Belg
ium
(Fl.)
Belg
ium
(Fr.)
Uni
ted
Stat
es2
Aus
tria
Finl
and2
Nor
way
2
Port
ugal
OEC
D a
vera
geIt
aly
Swed
en2
Fran
ceSl
oven
iaG
reec
eIc
elan
dIs
rael
Mex
ico
Czec
h R
epub
licC
hile
Pola
ndEs
toni
aH
unga
ry2
Slov
ak R
epub
licIn
done
sia
1. Salaries after 11 years of experience.2. Actual salaries.3. Year of reference 2008.4. Year of reference 2007.5. Year of reference 2006.Countries are ranked in descending order of teachers' salaries in lower secondary education after 15 years of experience and minimum training.Source: OECD. Indonesia: UNESCO Institute for Statistics (World Education Indicators Programme). Tables D3.1 and D3.2. See Annex 3 for notes (www.oecd.org/edu/eag2011).
Chart D3.1. Teachers’ salaries (minimum, after 10 years experience, 15 years experience, and maximum) in lower secondary education (2009)
Annual statutory teachers’ salaries in public institutions in lower secondary education, in equivalent USD converted using PPPs, and the ratio of salary after 15 years of experience
to earnings for full-time, full-year workers with tertiary education aged 25 to 64
Salary after 15 years of experience/minimum training
Salary at the top of scale/minimum training
Salary after 10 years of experience/minimum training
Starting salary/minimum training
1.5
1.0
0.5
0.0
Ratio
Luxe
mbo
urg
Ger
man
yIr
elan
d2
Net
herl
ands
3
Den
mar
kK
orea
3
Spai
n3
Scot
land
2
Aus
tral
iaEn
glan
dBe
lgiu
m (F
l.)Be
lgiu
m (F
r.)U
nite
d St
ates
2
Aus
tria
Finl
and2
Nor
way
2, 4
Port
ugal
OEC
D a
vera
geIt
aly3
Swed
en2,
3
Fran
ce5
Slov
enia
Icel
and5
Isra
el
Czec
h R
epub
lic
Pola
nd3
Esto
nia
Hun
gary
2
Slov
ak R
epub
licRatio of salary after 15 years of experience/minimum training to earnings
for full-time, full-year workers with tertiary education aged 25 to 64 (2009 or latest available year)

IndIcator D3
Education at a Glance © OECD 2011 407
contextTeachers’ salaries represent the largest single cost in school education. Burgeoning national debt, spurred by governments’ responses to the financial crisis of late 2008, have put pressure on policy makers to reduce government expenditure – particularly on public payrolls. Since compensation and working conditions are important for attracting, developing and retaining skilled and high-quality teachers, policy makers should carefully consider teachers’ salaries as they try to ensure both quality teaching and balanced education budgets (see Indicators B6 and B7).
other findings• In most OECD countries, teachers’ salaries increase with the level of education they teach.
For example, in Belgium, Indonesia, Luxembourg and Poland, the salary of an upper secondary school teacher with at least 15 years of experience is at least 25% higher than that of a primary school teacher with the same experience.
•Salaries at the top of the scale are, on average, around 64% higher than starting salaries in both primary and secondary education, and the difference tends to be greatest when it takes many years to progress through the scale. In countries where it takes 30 years or more to reach the top of the scale, the salaries at this level are an average of 80% higher than starting salaries.
•Among the 35 countries with available data, half offer an additional payment to teachers for outstanding performance.
TrendsTeachers’ salaries rose, in real terms, in most countries with available data between 1995 and 2009. Notable exceptions are France and Switzerland, where there was a decline in teachers’ salaries in real terms during that period.
Using data for countries with available data in all reference years, the growth rate in teachers’ salaries was lower than the growth rate in GDP per capita in most countries between 2000 and 2008. However, from 2008 to 2009, most countries experienced an increase in teachers’ salaries relative to GDP per capita. This is likely to be a result of the sharp slowdown in GDP growth in the aftermath of the financial crisis.

chapter D The Learning environmenT and organisaTion of schooLs
D3
Education at a Glance © OECD 2011408
Analysis
Comparing teachers’ salaries
Teachers’ salaries are one component of teachers’ total compensation. Other benefits such as regional allowances for teaching in remote regions, family allowances, reduced rates on public transport and tax allowances on the purchase of cultural materials may also form part of teachers’ total remuneration. There are also large differences in taxation and social-benefits systems in OECD countries. All this should be borne in mind when comparing salaries across countries
Teachers’ salaries vary widely across countries. The salaries of lower secondary school teachers with at least 15 years of experience range from less than USD 15 000 in Hungary, Indonesia and the Slovak Republic to USD 60 000 or more in Germany, Ireland and the Netherlands, and exceed USD 100 000 in Luxembourg (Table D3.1 and Chart D3.1).
In most OECD countries, teachers’ salaries increase with the level of education taught. In Belgium, upper secondary school teachers with 15 years of experience earn about 30% more than both primary and lower secondary school teachers with the same experience, while in Luxembourg, both lower and upper secondary school teachers receive the same salary, which is 50% higher than that of a primary school teacher. In Chile, Iceland, Japan, Korea and Turkey, there is less than a 5% difference between upper secondary and primary school teachers’ salaries and in Australia, England, Estonia, Greece, Ireland, Portugal, Scotland, the Slovak Republic and Slovenia, both primary and secondary school teachers received the same salary. In contrast, in Israel, an upper secondary school teacher earns 14% less than a primary school teacher (Table D3.1).
Differences in teachers’ salaries at different education levels may influence how schools and school systems attract and retain teachers and may also influence the extent to which teachers move among education levels.
Teachers’ salaries relative to earnings for workers with a tertiary education
The propensity of young people to undertake teacher training, as well as of training teachers to enter or stay in the profession will be influenced by the salaries of teachers relative to those of other occupations requiring similar levels of qualification. In all OECD countries, a tertiary qualification is required to become a teacher; so the likely alternative to teacher education is another tertiary education programme (Table D3.2 and Box D3.1). Thus, to interpret salary levels in different countries and reflect comparative labour-market conditions, teachers’ salaries are compared to those of other similarly-educated professionals: 25-64 year-old full-time, full-year workers with a tertiary education (for additional information, see Indicator A10). This indicator uses the salaries of teachers with minimum qualifications and after 15 years of experience. Teachers may be of any age. The average earnings for teachers are likely to be higher than this specific statutory salary.
Teachers’ salaries at the primary level amount on average to 77% of full-time, full-year earnings for 25-64 year-olds with tertiary education, 81% at the lower secondary level and 85% for upper secondary schools. The lowest relative teachers’ salaries, compared to the salaries of other professionals with comparable education are found in the Slovak Republic at all levels of education, and in Hungary and Iceland for primary and lower secondary school teachers, where statutory salaries for teachers with 15 years of experience are 50% or less of what a full-time, full-year worker with a tertiary education earns, on average.
Relative salaries for teachers in primary and lower secondary education are highest in Korea, Portugal and Spain, where teachers earn more than the average salary of a worker with a tertiary education. In upper secondary education, teachers’ salaries are at least 10% higher than those of comparably educated workers in Belgium, Luxembourg and Portugal, and up to 32% higher in Spain (Table D3.2 and Chart D3.1).
Teaching experience and salary scales
Salary structures define the salaries paid to teachers at different points in their careers. Deferred compensation, which rewards employees for staying in organisations or professions and for meeting established performance criteria, is also used in teachers’ salary structures. OECD data on teachers’ salaries are limited to information

D3
How Much Are Teachers Paid? – InDIcator D3 chapter D
Education at a Glance © OECD 2011 409
on statutory salaries at four points of the salary scale: starting salaries, salaries after 10 years of service, salaries after 15 years of experience and salaries at the top of the scale. The salaries discussed here are those of teachers who have the minimum required training. These salaries must be interpreted with caution since, in some countries, further qualifications can lead to wage increases. However, some inferences can be drawn from this data, notably the degree to which teachers’ salary structures provide for salary increases at different levels of promotion and tenure.
In OECD countries, statutory salaries for lower secondary school teachers with 10 years of experience and 15 years of experience are, respectively, 24% and 35% higher, on average than starting salaries. Furthermore, salaries at the top of the salary scale, which is reached after an average of 24 years of experience, are on average 64% higher than starting salaries. However, a number of countries have relatively flat salary scales. For example, the difference between salaries at the top and bottom of the scale is less than 25% in Denmark and Iceland at the primary and lower secondary level. In Norway, the Slovak Republic and Turkey, the difference is less than 25% at all levels of education (Table D3.1).
Box d3.1. Pre-service teacher training
all oEcD countries require a tertiary qualification for entry to the teaching profession at the primary level and beyond, and in most, a tertiary-type a (largely theory-based) qualification is required to become a teacher, especially at the upper secondary level. In Belgium and Luxembourg, a tertiary-type B (shorter, and largely vocational) qualification is sufficient to become a primary school teacher, while in Ireland, Japan, Poland and Portugal, both tertiary-type A and tertiary-type B qualifications are accepted. To teach lower secondary school, a tertiary-type B qualification is sufficient in Belgium, while both tertiary-type A and tertiary-type B qualifications are accepted in Ireland, Japan and Mexico. To teach at the upper secondary level, both tertiary-type A and tertiary-type B qualifications are accepted in Ireland, Mexico and Slovenia (Table D3.2).
on average, pre-service training for teachers in secondary education tends to be longer than in primary education. For primary teachers, the average length of pre-service training varies from three years in Austria, Belgium, Spain and Switzerland to five or more years in the Czech Republic, Finland, France, Germany and Slovenia. For lower secondary teachers, the average duration of pre-service training is longer than that for primary education in a third of all OECD countries. At the upper secondary level, it varies from three years (for some programmes) in England, Israel and Poland to more than six years in Germany and the Slovak Republic.
Lower secondary school teachers in Australia, Denmark, Estonia and Scotland reach the highest step on the salary scale within six to nine years. Some difficulties may arise in these countries due to weak monetary incentives as teachers approach the peak in their age-earnings profiles. However there may be some benefits to compressed pay scales. It is often argued, for example, that organisations in which there are smaller differences in salaries among employees enjoy more trust, freer flows of information and more collegiality among co-workers.
In Austria, Chile, the Czech Republic, France, Greece, Hungary, Indonesia, Israel, Italy, Japan, Korea, Luxembourg, Portugal, the Slovak Republic and Spain, lower secondary school teachers reach the top of the salary scale after at least 30 years of service (Table D3.1). While salary increases are gradual in two-thirds of the 28 OECD countries with relevant data, in the remaining one-third of countries, their salary scales include steps of uneven size. For example, in the Czech Republic and in Greece, salaries at the top of the scale are 50% higher than starting salaries, and teachers in both countries must work 32 (the Czech Republic) or 33 years (Greece) to reach the top salary.
chapter D The Learning environmenT and organisaTion of schooLs
D3
Education at a Glance © OECD 2011410
However, most of the increase in the Czech Republic occurs during the first 10 years of service and salaries rise at a slower rate during the next 22 years, while in Greece, there are gradual salary increases throughout the career.
When considering salary structure for teachers, it is important to remember that not all teachers reach the top of the salary scale. For example, in the Netherlands, there are three different salary levels for teachers in secondary education. In 2009, only 17% of these teachers were paid according to the highest salary scale.
Statutory salaries per hour of net teaching time
The average statutory salary per teaching hour after 15 years of experience is USD 51 for primary school teachers, USD 62 for lower secondary teachers, and USD 71 for upper secondary teachers in general education. Chile, Estonia, Hungary, Indonesia, Mexico and the Slovak Republic show the lowest salaries per teaching hour – USD 30 or less. In contrast, salaries per hour reach USD 70 or more at all education levels in Denmark, Germany, Japan and Luxembourg. (Table D3.1).
As secondary school teachers are required to teach fewer hours than primary school teachers, their salaries per teaching hour are usually higher than those of teachers at lower levels of education, even in countries where statutory salaries are similar (see Indicator D4). On average among OECD countries, upper secondary school teachers’ salaries per teaching hour exceed those of primary school teachers by around 34% (Table D3.1). In Chile the difference is less than 5% and in Scotland there is no difference, while it is about 100% in Denmark and Indonesia. In contrast, in England, primary school teachers’ salaries per teaching hour exceed those of upper secondary school teachers by 11%.
However, the difference between primary and secondary school teachers may disappear when comparing salaries per hour of working time. In Portugal, for example, there is a 14% difference in salaries per teaching hour between primary and upper secondary school teachers, even though statutory salaries and working time are actually the same at these levels. The difference is explained by the fact that primary school teachers spend more time in teaching activities than upper secondary teachers do (see Table D4.1).
Trends since 1995
Trends in salaries in real termsBetween 2000 and 2009, teachers’ salaries increased in real terms in most countries. The largest increases – of well over 50% – were seen in the Czech Republic, Estonia and Turkey. The only exceptions to this trend were Australia, France, Japan and Switzerland. Data for 1995 are only available for a small subsample of countries. All countries in this subsample saw an increase in real salaries between 1995 and 2009, except for France and Switzerland. (Table D3.3 and Chart D3.2).
Trends in relative salaries (GDP)Comparing statutory salaries to GDP per capita facilitates standardised comparisons over time and offers a way of contextualising teacher salary levels in terms of countries’ wealth. GDP per capita is related to several factors in addition to earnings, such as capital income and labour-force participation. Nevertheless, the amount countries invest in teachers relative to their available resources provides an approximate indication of the value countries place on education. According to this measure in 2009, statutory salaries for secondary teachers with 15 years of experience relative to GDP per capita are highest in Germany, Korea, Mexico (lower secondary level), Switzerland (upper secondary level) and Turkey. In primary education, the highest ratios are found in Korea and Turkey. Relative to GDP per capita, mid-career salaries are lowest in Estonia, Hungary, Indonesia and the Slovak Republic (Table D3.4).
Most countries saw a fall in teachers’ salaries relative to GDP per capita during the 2000-2009 period. The fall is most noticeable in Australia, France, Japan, Korea and Switzerland but except for Australia and France, teachers’ salaries relative to GDP per capita in these countries remain well above the OECD average. On the other hand, the Czech Republic, Denmark and Portugal all saw substantial increases in salaries relative to GDP per capita from 2000 to 2009 (Chart D3.3).

D3
How Much Are Teachers Paid? – InDIcator D3 chapter D
Education at a Glance © OECD 2011 411
150140130120110100
9080706050
Index of change 2005 = 100
Chart D3.2. Changes in lower secondary teachers’ salaries after 15 years of experience/minimum training (1995, 2000, 2005, 2009)
Esto
nia
Czec
h R
epub
lic
Den
mar
k
Irel
and1
Net
herl
ands
Icel
and
Isra
el
Nor
way
1
Port
ugal
Spai
n
Luxe
mbo
urg
Belg
ium
(Fr.)
Gre
ece
Aus
tria
Belg
ium
(Fl.)
Finl
and1
Swed
en1
OEC
D a
vera
ge
Mex
ico
Engl
and
Swit
zerl
and2
Scot
land
1
Ital
y
Kor
ea
Uni
ted
Stat
es1
Aus
tral
ia
Japa
n
Fran
ce
Hun
gary
1
1. Actual salaries.2. Salaries after 11 years of experience.Countries are ranked in descending order of the index of change between 2005 and 2009 in teachers' salaries in lower secondary education after 15 years of experience.Source: OECD. Table D3.3. See Annex 3 for notes (www.oecd.org/edu/eag2011).
2009 19952000
3
2
1
0
Ratio
Kor
ea
Mex
ico
Ger
man
y
Port
ugal
Spai
n
Swit
zerl
and1
Chi
le
Japa
n
Irel
and2
Net
herl
ands
Scot
land
2
Den
mar
k
Engl
and
Luxe
mbo
urg
OEC
D a
vera
ge
Slov
enia
Belg
ium
(Fl.)
Aus
tral
ia
Belg
ium
(Fr.)
Finl
and2
Ital
y
Gre
ece
Aus
tria
Fran
ce
Nor
way
2
Isra
el
Uni
ted
Stat
es2
Pola
nd
Swed
en2
Czec
h R
epub
lic
Icel
and
Esto
nia
Hun
gary
2
Slov
ak R
epub
lic
Indo
nesi
a
1. Salaries after 11 years of experience.2. Actual salaries.Countries are ranked in descending order of the ratio of salary after 15 years of experience/minimum training to GDP per capita in 2009.Source: OECD. Indonesia: UNESCO Institute for Statistics (World Education Indicators Programme). Table D3.4. See Annex 3 for notes (www.oecd.org/edu/eag2011).
2009 20002005
Chart D3.3. Trends in the ratio of salaries after 15 years of experience/minimum training to GDP per capita (2000, 2005, 2009)
Ratio of annual statutory teachers’ salaries in public institutions in lower secondary education after 15 years of experience to GDP per capita
1 2 http://dx.doi.org/10.1787/888932461997
1 2 http://dx.doi.org/10.1787/888932462016

chapter D The Learning environmenT and organisaTion of schooLs
D3
Education at a Glance © OECD 2011412
In most countries, GDP per capita is lower than the earnings of 25-64 year-old full-time, full-year workers with a tertiary education, thus the values of the indicator using GDP per capita are higher than those of the indicator using earnings (Table D3.2 and Table D3.4). For lower secondary school teachers, the average salary to GDP per capita across OECD countries is 1.24, while the average salary to earnings for other workers with tertiary education is 0.81. In addition, there is less variation in the latter indicator. This can be related to the fact that GDP per capita is a broad income measure and is the sum of capital income and labour income per capita in a country. However, the countries with high and low teachers’ salaries relative to GDP per capita also tend to have, respectively, high and low ratios of teachers’ salaries to average earnings for workers with tertiary education. Still, there are some noticeable exceptions. For example, in Korea, the indicator related to GDP per capita is high while the indicator using earnings is more in line with other countries. The opposite is true for Spain.
Box D3.2. Effect of the financial crisis
The financial crisis that hit the world economy in the last months of 2008 may significantly affect the salaries for civil servants and public sector workers in general. The first-order effect of the crisis was a general reduction in GDP growth in the OECD area and some countries went into a recession. The second-order effect was a large increase in national debt that put pressure on government expenditure in many countries. The combination of reduced economic growth and fiscal stress affect public-sector salaries, including teachers’ salaries in many ways. A decline in GDP per capita directly increases the salary-to-GDP ratio. In addition, the likely partial effect of reduced growth and recession is to increase relative teacher salaries as wages generally react more slowly than GDP to a cyclical downturn. On the other hand, the pressure to trim government expenditure in order to reduce national debt may result in cuts in teacher and other civil-service salaries in some countries. However, in most countries, these measures were implemented after 2009.
Additional payments: Incentives and allowances
In addition to basic pay scales, school systems increasingly use schemes that offer additional payments or other rewards for teachers. These may take the form of financial remuneration and/or reduction in the number of teaching hours. Greece and Iceland, for example, offer a reduction in required teaching hours to reward experience or long service. In Portugal, teachers may receive a salary increase and a reduction in teaching time when they carry out special tasks or activities, such as training student teachers or providing guidance counselling. Together with the starting salary, these payments may influence a person’s decision to enter or remain in the teaching profession. Additional payments early in a career may include family allowances and bonuses for working in certain locations, and higher initial salaries for higher-than-minimum teaching qualifications.
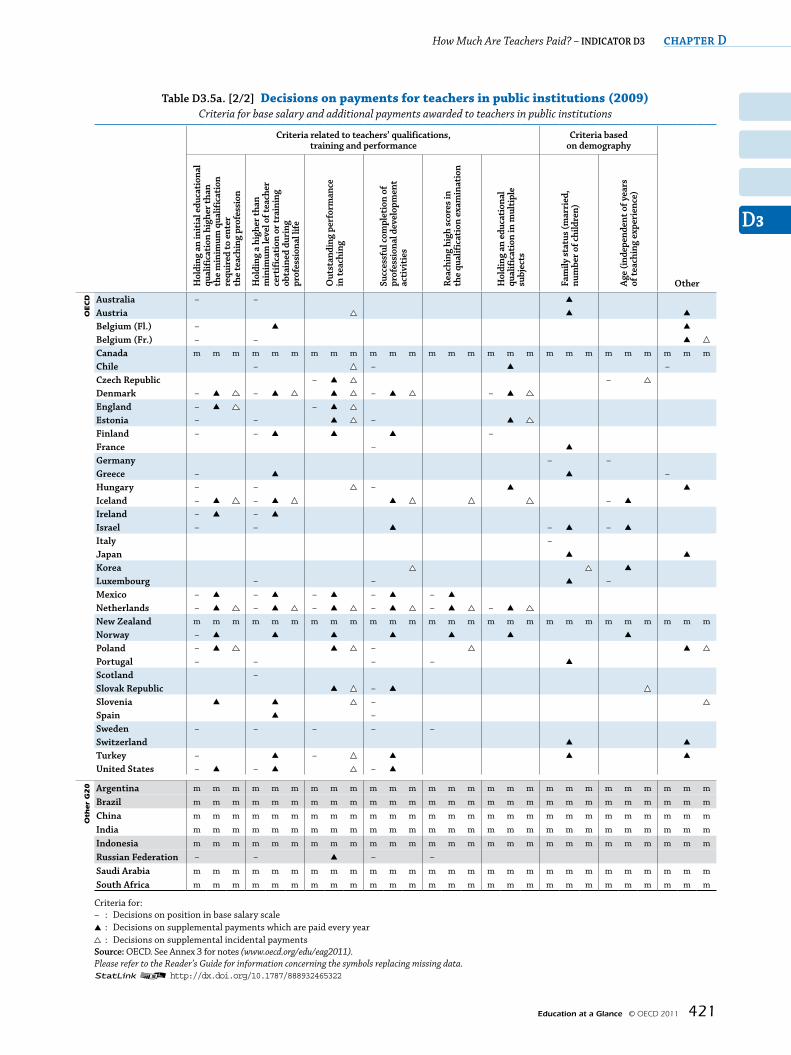
Data have not been collected on payment amounts but on whether additional payments are available and on the level at which the decision to award such payments is taken (Table D3.5a and Tables D3.5b, D3.5c and D3.5d available on line, and Annex 3 available at www.oecd.org/edu/eag2011).
Additional payments are most often awarded for particular responsibilities or working conditions, such as teaching in more disadvantaged schools, particularly those located in very poor neighbourhoods or those with a large proportion of students whose language is not the language of instruction. These schools often have difficulty attracting teachers and are more likely to have less-experienced teachers (OECD, 2005). These additional payments are provided annually in about half of the countries. Nine countries also offer additional payments, usually on an annual basis, for teachers who teach in certain fields in which there are teacher shortages.

D3
How Much Are Teachers Paid? – InDIcator D3 chapter D
Education at a Glance © OECD 2011 413
Additional payments based on teachers’ qualifications, training and performance are also common in OECD and partner countries. The most common types of payments are for an initial education qualification and/or a level of teacher certification and training that is higher than the minimum requirement. Some 65% of countries make these payments available, with half of all countries offering both types of payments. Twenty-two countries offer additional payments for the successful completion of professional development activities. In 16 of these countries, these payments help to determine the base salary, but in Korea they are only offered on an incidental basis.
Two-thirds of the 18 countries that offer an additional payment to reward outstanding teaching do so as incidental payments; 11 countries offer these payments as annual additions to teachers’ salaries. In 15 of the 18 countries that offer this performance incentive, the decision to award the additional payments can be made at the school level.
Less than half of all OECD countries offer additional payments based on teachers’ demographic characteristics (family status or age), and most of these are annual payments.
definitions
An adjustment to base salary is defined as any difference in salary between what a particular teacher actually receives for work performed at a school and the amount that he or she would expect to receive on the basis of experience (i.e. number of years in the teaching profession). Adjustments may be temporary or permanent, and they can effectively move a teacher off the scale and to a different salary scale or to a higher step on the same salary scale.
Earnings for workers with tertiary education (Table D3.2) are average earnings for full-time, full-year workers aged 25 to 64 and with an education at ISCED 5A/5B/6 level. The relative salary indicator is calculated for the latest year with earnings data available. For countries in which teachers’ salary and workers’ earnings information are not available for the same year (e.g. Poland), the indicator is adjusted for inflation using the GDP deflator. Reference statistics for earnings for workers with tertiary education are provided in Annexes 2 and 3.
Salaries after 15 years of experience refer to the scheduled annual salary of a full-time classroom teacher with the minimum training necessary to be fully qualified plus 15 years of experience. The maximum salaries reported refer to the scheduled maximum annual salary (top of the salary scale) of a full-time classroom teacher with the minimum training to be fully qualified for the job.
Starting salaries refer to the average scheduled gross salary per year for a full-time teacher with the minimum training necessary to be fully qualified at the beginning of the teaching career.
Statutory salaries (Table D3.1) refer to scheduled salaries according to official pay scales, while actual salaries refer to the average annual salary earned by a full-time teacher. The salaries reported are gross (total sum paid by the employer) less the employer’s contribution to social security and pension, according to existing salary scales. Salaries are “before tax”, i.e. before deductions for income tax. In Table D3.1, salary per hour of net contact divides a teacher’s annual statutory salary by the annual net teaching time in hours (see Table D4.1).
Methodology
Data on statutory teachers’ salaries and bonuses are derived from the 2010 OECD-INES Survey on Teachers and the Curriculum. Data refer to the school year 2008-09 and are reported in accordance with formal policies for public institutions.
Statutory salaries as reported by most of the countries here must be distinguished from actual expenditures on wages by governments and from teachers’ average salaries, which are also influenced by factors such as the age structure of the teaching force and the prevalence of part-time work.

chapter D The Learning environmenT and organisaTion of schooLs
D3
Education at a Glance © OECD 2011414
Measuring the statutory salary of a full-time teacher relative to the number of hours per year that a teacher is required to spend teaching does not adjust salaries for the amount of time that teachers spend in various other teaching-related activities. Since the proportion of teachers’ working time spent teaching varies across OECD countries, statutory salaries per hour of net teaching time must be interpreted with caution (see Indicator D4). However, it can provide an estimate of the cost of the actual time teachers spend in the classroom.
Gross teachers’ salaries were converted using GDP and purchasing power parities (PPPs) and exchange rate data from the OECD National Accounts database. The period of reference for teachers’ salaries is from 1 July 2008 to 30 June 2009. The reference date for GDP per capita and PPPs is 2008-09. As a complement to Table D3.1, which presents teachers’ salaries in equivalent USD, converted using PPPs, a table with teachers’ salaries in equivalent EUR converted using PPPs is included in Annex 2.
For calculation of changes in teachers’ salaries (Table D3.3), the GDP deflator is used to convert salaries to 2005 prices.
Notes on definitions and methodologies for each country are provided in Annex 3 at www.oecd.org/edu/eag2011.
The statistical data for Israel are supplied by and under the responsibility of the relevant Israeli authorities. The use of such data by the OECD is without prejudice to the status of the Golan Heights, East Jerusalem and Israeli settlements in the West Bank under the terms of international law.
referencesOECD (2005), Teachers Matter: Attracting, Developing and Retaining Effective Teachers, OECD, Paris.
OECD (2008c), Improving School Leadership, Volume 1: Policy and Practices, OECD, Paris.
The following additional material relevant to this indicator is available on line:
• Table D3.5b. Decisions made by school principal on payments for teachers in public institutions (2009) 1 2 http://dx.doi.org/10.1787/888932465341
• Table D3.5c. Decisions made by local or regional authority on payments for teachers in public institutions (2009) 1 2 http://dx.doi.org/10.1787/888932465360
• Table D3.5d. Decisions made by the national authority on payments for teachers in public institutions (2009) 1 2 http://dx.doi.org/10.1787/888932465379

D3
How Much Are Teachers Paid? – InDIcator D3 chapter D
Education at a Glance © OECD 2011 415
table D3.1. [1/2] teachers’ salaries (2009)Annual statutory teachers’ salaries in public institutions at starting salary, after 10 and 15 years of experience
and at the top of the scale, by level of education, in equivalent USD converted using PPPs
Primary education Lower secondary education Upper secondary education
Star
ting
sal
ary/
min
imum
trai
ning
Sala
ry a
fter
10
year
s
of e
xper
ienc
e/m
inim
um
trai
ning
Sala
ry a
fter
15
year
s
of e
xper
ienc
e/m
inim
um
trai
ning
Sala
ry a
t top
of s
cale
/m
inim
um tr
aini
ng
Star
ting
sal
ary/
min
imum
trai
ning
Sala
ry a
fter
10
year
s
of e
xper
ienc
e/m
inim
um
trai
ning
Sala
ry a
fter
15
year
s
of e
xper
ienc
e/m
inim
um
trai
ning
Sala
ry a
t top
of s
cale
/m
inim
um tr
aini
ng
Star
ting
sal
ary/
min
imum
trai
ning
Sala
ry a
fter
10
year
s
of e
xper
ienc
e/m
inim
um
trai
ning
Sala
ry a
fter
15
year
s
of e
xper
ienc
e/m
inim
um
trai
ning
Sala
ry a
t top
of s
cale
/m
inim
um tr
aini
ng
(1) (2) (3) (4) (5) (6) (7) (8) (9) (10) (11) (12)
oecd australia 34 664 48 233 48 233 48 233 34 664 48 233 48 233 48 233 34 664 48 233 48 233 48 233
austria 30 998 36 588 41 070 61 390 32 404 39 466 44 389 63 781 32 883 35 539 45 712 67 135Belgium (Fl.) 32 429 40 561 45 614 55 718 32 429 40 561 45 614 55 718 40 356 51 323 58 470 70 382Belgium (Fr.) 31 545 m 44 696 54 848 31 545 m 44 696 54 848 39 415 m 57 613 69 579canada m m m m m m m m m m m mchile 15 612 19 982 22 246 29 179 15 612 19 982 22 246 29 179 16 296 20 895 23 273 30 548czech republic 17 705 22 279 23 806 25 965 17 711 22 750 24 330 26 305 18 167 24 000 25 537 28 039Denmark 46 950 52 529 54 360 54 360 46 950 52 529 54 360 54 360 47 664 62 279 62 279 62 279England 32 189 47 047 47 047 47 047 32 189 47 047 47 047 47 047 32 189 47 047 47 047 47 047Estonia 14 881 15 758 15 758 21 749 14 881 15 758 15 758 21 749 14 881 15 758 15 758 21 749Finland1 32 692 37 632 41 415 50 461 34 707 40 550 44 294 54 181 35 743 45 444 49 237 61 089France 24 006 31 156 33 359 49 221 27 296 33 653 35 856 51 833 27 585 33 942 36 145 52 150Germany 46 446 m 57 005 61 787 51 080 m 62 930 68 861 55 743 m 68 619 77 628Greece 27 951 31 858 34 209 41 265 27 951 31 858 34 209 41 265 27 951 31 858 34 209 41 265Hungary1 12 045 13 838 14 902 19 952 12 045 13 838 14 902 19 952 13 572 16 211 17 894 25 783Iceland 28 767 31 537 32 370 33 753 28 767 31 537 32 370 33 753 26 198 30 574 32 676 34 178Ireland1 36 433 53 787 60 355 68 391 36 433 53 787 60 355 68 391 36 433 53 787 60 355 68 391Israel 18 935 27 262 28 929 42 425 17 530 24 407 27 112 39 942 16 715 22 344 25 013 37 874Italy 28 907 31 811 34 954 42 567 31 159 34 529 38 082 46 743 31 159 35 371 39 151 48 870Japan 27 995 41 711 49 408 62 442 27 995 41 711 49 408 62 442 27 995 41 711 49 408 64 135Korea 30 522 45 269 52 820 84 650 30 401 45 148 52 699 84 529 30 401 45 148 52 699 84 529Luxembourg 51 799 67 340 74 402 113 017 80 053 100 068 111 839 139 152 80 053 100 068 111 839 139 152Mexico 15 658 15 768 20 415 33 582 19 957 20 618 25 905 42 621 m m m mnetherlands 37 974 45 064 50 370 55 440 39 400 51 830 60 174 66 042 39 400 51 830 60 174 66 042new Zealand m m m m m m m m m m m mnorway1 35 593 40 392 43 614 43 861 35 593 40 392 43 614 43 861 38 950 42 258 46 247 46 495Poland 9 186 12 809 15 568 16 221 10 340 14 520 17 732 18 479 11 676 16 585 20 290 21 149Portugal 34 296 38 427 41 771 60 261 34 296 38 427 41 771 60 261 34 296 38 427 41 771 60 261Scotland1 32 143 51 272 51 272 51 272 32 143 51 272 51 272 51 272 32 143 51 272 51 272 51 272Slovak republic 12 139 13 352 13 964 15 054 12 139 13 352 13 964 15 054 12 139 13 352 13 964 15 054Slovenia 29 191 32 385 35 482 37 274 29 191 32 385 35 482 37 274 29 191 32 385 35 482 37 274Spain 40 896 44 576 47 182 57 067 45 721 49 807 52 654 63 942 46 609 50 823 53 759 65 267Sweden1 30 648 34 086 35 349 40 985 30 975 35 146 36 521 41 255 32 463 36 983 38 584 44 141Switzerland2 48 853 62 903 m 76 483 55 696 71 456 m 86 418 64 450 83 828 m 98 495turkey 25 536 26 374 27 438 29 697 a a a a 26 173 27 011 28 076 30 335United States1 36 502 42 475 44 788 51 633 36 416 42 566 44 614 54 725 36 907 43 586 47 977 54 666
oEcD average 29 767 36 127 38 914 48 154 31 687 38 683 41 701 51 317 33 044 40 319 43 711 53 651EU21 average 30 150 35 912 39 735 47 883 32 306 38 721 42 967 50 772 33 553 40 204 45 442 53 956
oth
er
G2
0 argentina m m m m m m m m m m m m
Brazil m m m m m m m m m m m m
china m m m m m m m m m m m m
India m m m m m m m m m m m m
Indonesia 1 564 m 1 979 2 255 1 667 m 2 255 2 450 1 930 m 2 497 2 721
russian Federation m m m m m m m m m m m m
Saudi arabia m m m m m m m m m m m m
South africa m m m m m m m m m m m m
1. Actual salaries.2. Salaries after 11 years of experience for Columns 2, 6 and 10.Source: OECD. Indonesia: UNESCO Institute for Statistics (World Education Indicators Programme). See Annex 3 for notes (www.oecd.org/edu/eag2011).Please refer to the Reader’s Guide for information concerning the symbols replacing missing data.1 2 http://dx.doi.org/10.1787/888932465246

chapter D The Learning environmenT and organisaTion of schooLs
D3
Education at a Glance © OECD 2011416
table D3.1. [2/2] teachers’ salaries (2009)Annual statutory teachers’ salaries in public institutions at starting salary, after 10 and 15 years of experience
and at the top of the scale, by level of education, in equivalent USD converted using PPPs
ratio of salary at top of scale to starting salary
Year
s fr
om s
tart
ing
to
top
sala
ry (l
ower
se
cond
ary
educ
atio
n)
Salary per hour of net contact (teaching) time after 15 years of experience
rat
io o
f sal
ary
per
teac
hing
hou
r of u
pper
se
cond
ary
to p
rim
ary
teac
hers
(aft
er 1
5 ye
ars
of e
xper
ienc
e)
Primary education
Lower secondary education
Upper secondary education
Primary education
Lower secondary education
Upper secondary education
(13) (14) (15) (16) (17) (18) (19) (20)
oecd australia 1.39 1.39 1.39 9 55 59 61 1.10
austria 1.98 1.97 2.04 34 53 73 78 1.47
Belgium (Fl.) 1.72 1.72 1.74 27 57 66 91 1.60
Belgium (Fr.) 1.74 1.74 1.77 27 61 67 94 1.55
canada m m m m m m m m
chile 1.87 1.87 1.87 30 18 18 19 1.05
czech republic 1.47 1.49 1.54 32 29 39 43 1.50
Denmark 1.16 1.16 1.31 8 84 84 165 1.97
England 1.46 1.46 1.46 10 74 66 66 0.89
Estonia 1.46 1.46 1.46 7 25 25 27 1.09
Finland1 1.54 1.56 1.71 16 61 75 90 1.46
France 2.05 1.90 1.89 34 36 56 58 1.58
Germany 1.33 1.35 1.39 28 71 83 96 1.36
Greece 1.48 1.48 1.48 33 58 80 80 1.38
Hungary1 1.66 1.66 1.90 40 25 25 30 1.20
Iceland 1.17 1.17 1.30 18 53 53 60 1.12
Ireland1 1.88 1.88 1.88 22 64 82 82 1.29
Israel 2.24 2.28 2.27 36 37 46 48 1.30
Italy 1.47 1.50 1.57 35 46 62 63 1.37
Japan 2.23 2.23 2.29 34 70 82 99 1.41
Korea 2.77 2.78 2.78 37 63 85 87 1.38
Luxembourg 2.18 1.74 1.74 30 101 177 177 1.75
Mexico 2.14 2.14 m 14 26 25 m m
netherlands 1.46 1.68 1.68 17 54 80 80 1.48
new Zealand m m m m m m m m
norway1 1.23 1.23 1.19 16 59 67 89 1.50
Poland 1.77 1.79 1.81 10 32 37 42 1.31
Portugal 1.76 1.76 1.76 34 48 54 54 1.14
Scotland1 1.60 1.60 1.60 6 60 60 60 1.00
Slovak republic 1.24 1.24 1.24 32 17 22 23 1.35
Slovenia 1.28 1.28 1.28 13 51 51 56 1.09
Spain 1.40 1.40 1.40 38 54 74 78 1.45
Sweden1 1.34 1.33 1.36 a m m m m
Switzerland2 1.57 1.55 1.53 27 m m m m
turkey 1.16 a 1.16 a 43 a 50 1.15
United States1 1.41 1.50 1.48 m 41 42 46 1.12
oEcD average 1.64 1.64 1.64 24 51 62 71 1.34
EU21 average 1.58 1.57 1.61 24 53 65 74 1.38
oth
er
G2
0 argentina m m m m m m m m
Brazil m m m m m m m m
china m m m m m m m m
India m m m m m m m m
Indonesia 1.44 1.47 1.41 32 2 3 3 2.16
russian Federation m m m m m m m m
Saudi arabia m m m m m m m m
South africa m m m m m m m m
1. Actual salaries.2. Salaries after 11 years of experience for Columns 17, 18, 19 and 20 .Source: OECD. Indonesia: UNESCO Institute for Statistics (World Education Indicators Programme). See Annex 3 for notes (www.oecd.org/edu/eag2011).Please refer to the Reader’s Guide for information concerning the symbols replacing missing data.1 2 http://dx.doi.org/10.1787/888932465246

D3
How Much Are Teachers Paid? – InDIcator D3 chapter D
Education at a Glance © OECD 2011 417
table D3.2. teachers’ salaries and pre-service teacher training requirements (2009)Annual statutory teachers’ salaries at 15 years of experience and system-level information on teacher training programme
ratio of salary after 15 years of experience (minimum training) to earnings for full-time, full-year workers with
tertiary education aged 25 to 64
Duration of teacher training programme
in years IScED type of final qualification1Percentage of current teacher stock
with this type of qualificationPr
imar
y ed
ucat
ion
Low
er
seco
ndar
y ed
ucat
ion
Upp
er
seco
ndar
y ed
ucat
ion
Prim
ary
educ
atio
n
Low
er
seco
ndar
y ed
ucat
ion
Upp
er
seco
ndar
y ed
ucat
ion
Prim
ary
educ
atio
n
Low
er
seco
ndar
y ed
ucat
ion
Upp
er
seco
ndar
y ed
ucat
ion
Prim
ary
educ
atio
n
Low
er
seco
ndar
y ed
ucat
ion
Upp
er
seco
ndar
y ed
ucat
ion
(1) (2) (3) (4) (5) (6) (7) (8) (9) (10) (11) (12)
oecd australia2 0.85 0.85 0.85 4 4 4 5A 5A 5A 87% 91% x(11)
austria 0.58 0.63 0.65 3 5.5 5.5 5A 5A 5A 94% 95% 78%Belgium (Fl.) 0.89 0.89 1.14 3 3 5 5B 5B 5A, 5B 98% 97% 96%Belgium (Fr.) 0.87 0.87 1.12 3 3 5 5B 5B 5A 100% m mcanada m m m m m m m m m m m mchile m m m m m m m m m m m mczech republic 0.51 0.52 0.55 5 5 5 5A 5A 5A 87% 88% 87%Denmark 0.93 0.93 1.06 4 4 6 5A 5A 5A 100% 100% 100%England 0.81 0.81 0.81 3, 4 3, 4 3, 4 5A 5A 5A 98% 95% 95%Estonia 0.82 0.82 0.82 4.5 4.5 4.5 5A 5A 5A 69% 75% 81%Finland2, 3 0.85 0.91 1.01 5 5 5 5A 5A 5A 89% 89% 93%France4 0.78 0.85 0.85 5 5 5, 6 5A 5A 5A m m mGermany 0.88 0.97 1.06 5.5 5.5, 6.5 6.5 5A 5A 5A m m mGreece m m m 4 4 4, 5 5A 5A 5A m 96% 98%Hungary3 0.45 0.45 0.54 4 4 5 5A 5A 5A 95% 100% 100%Iceland4 0.50 0.50 0.61 3, 4 3, 4 4 5A 5A 5A 87% 87% 78%Ireland3 0.88 0.88 0.88 3, 5.5 4, 5 4, 5 5A, 5B 5A, 5B 5A, 5B m m mIsrael 0.75 0.70 0.64 3, 4 3, 4 3, 4 5A 5A 5A 82% 92% 86%Italy5 0.59 0.64 0.66 4 4-6 4-6 5A 5A 5A 100% 100% 100%Japan m m m 2, 4, 6 2, 4, 6 4, 6 5A+5B, 5A, 5A 5A+5B, 5A, 5A 5A 18%, 78%, 1% 7%, 91%, 2% 72%, 28%Korea5 1.08 1.08 1.08 4 4 4 5A 5A 5A m m mLuxembourg 0.79 1.18 1.18 3, 4 5 5 5B 5A 5A 95.6%, 4.5% 100% 100%Mexico m m m 4 4, 6 4, 6 5A 5A, 5B 5A, 5B 96% 90% 91%netherlands5 0.67 0.81 0.81 4 4 5, 6 5A 5A 5A 100% 100% 100%new Zealand m m m m m m m m m m m mnorway3, 6 0.66 0.66 0.70 4 4 4 5A 5A 5A 47% 47% 21%Poland5 0.59 0.68 0.78 3, 5 3, 5 3, 5 5A, 5B 5A 5A 99% 99% 97%Portugal 1.19 1.19 1.19 3, 4, 6 5, 6 5, 6 5B, 5B, 5A 5A 5A 97% 91% 93%Scotland3 0.89 0.89 0.89 4, 5 4, 5 4, 5 5A 5A 5A m m mSlovak republic 0.44 0.44 0.44 4, 7 5, 7 5, 7 5A 5A 5A 93%, 7% 91%, 9% 87%, 13%Slovenia 0.81 0.81 0.81 5 5-6 5-6 5A 5A 5A, 5B m m mSpain5 1.16 1.27 1.32 3 6 6 5A 5A 5A 100% 100% 100%Sweden3, 5 0.74 0.75 0.81 3.5 4.5 4.5 5A 5A 5A 84% 84% 72%Switzerland7 m m m 3 5 6 5A 5A 5A m m mturkey m m m 4-5 a 4-5 5A a 5A 90% a 97%United States3 0.61 0.61 0.65 4 4 4 5A 5A 5A 99% 99% 99%
oEcD average 0.77 0.81 0.85EU21 average 0.78 0.83 0.88
oth
er
G2
0 argentina m m m m m m m m m m m mBrazil m m m m m m m m m m m mchina m m m m m m m m m m m mIndia m m m m m m m m m m m mIndonesia m m m m m m m m m m m mrussian Federation m m m m m m m m m m m mSaudi arabia m m m m m m m m m m m mSouth africa m m m m m m m m m m m m
1. Tertiary-type A programmes are largely theory-based and are designed to provide qualifications for entry into advanced research programmes and professions with high knowledge and skill requirements. Tertiary-type B programmes are classified at the same level of competence as tertiary-type A programmes but are more occupationally oriented and usually lead directly to the labour market.2. Year of reference 2010 for Columns 10 to 12. 3. Actual salaries for Columns 1, 2 and 3.4. Year of reference 2006 for Columns 1, 2 and 3.5. Year of reference 2008 for Columns 1, 2 and 3.6. Year of reference 2007 for Columns 1, 2 and 3.7. Salaries after 11 years of experience for Columns 1, 2 and 3.Source: OECD. See Annex 3 for notes (www.oecd.org/edu/eag2011).Please refer to the Reader’s Guide for information concerning the symbols replacing missing data.1 2 http://dx.doi.org/10.1787/888932465265

chapter D The Learning environmenT and organisaTion of schooLs
D3
Education at a Glance © OECD 2011418
table D3.3. trends in teachers’ salaries between 1995 and 2009 (2005 = 100)Index of change between 1995 and 2009 (2005 = 100) in statutory teachers’ salaries after 15 years of experience/minimum training
by level of education, converted to constant price levels using GDP deflators
Primary level Lower secondary level Upper secondary level
1995
2000
2005
2006
2007
2008
2009
1995
2000
2005
2006
2007
2008
2009
1995
2000
2005
2006
2007
2008
2009
(1) (2) (3) (4) (5) (6) (7) (8) (9) (10) (11) (12) (12) (13) (14) (15) (16) (17) (18) (19) (20)
oecd australia 96 98 100 94 93 96 96 96 98 100 95 95 97 96 96 98 100 95 95 97 96
austria m 90 100 101 102 102 104 m 86 100 100 101 102 104 m 94 100 101 102 103 105Belgium (Fl.) 90 93 100 100 100 99 103 96 98 100 100 100 99 103 96 98 100 100 100 99 103Belgium (Fr.) 91 94 100 101 101 100 107 98 99 100 100 100 99 105 98 99 100 100 100 99 106canada m m m m m m m m m m m m m m m m m m m m mchile m m m m m m m m m m m m m m m m m m m m mczech republic m 57 100 101 118 117 120 m 57 100 101 118 120 123 m 69 100 101 124 125 126Denmark m 96 100 100 100 101 119 m 96 100 100 100 101 119 98 93 100 102 100 100 112England 93 97 100 101 100 100 100 93 97 100 101 100 100 100 93 97 100 101 100 100 100Estonia m 86 100 108 117 135 146 m 86 100 108 117 135 146 m 86 100 108 117 135 146Finland1 82 89 100 110 110 111 113 80 86 100 100 100 101 103 83 80 100 98 97 98 100France 107 106 100 99 98 96 95 109 106 100 99 97 96 95 108 105 100 99 97 96 95Germany w w w w w w w w w w w w w w w w w w w w wGreece m 91 100 100 100 102 105 m 91 100 100 100 102 105 m 91 100 100 100 102 105Hungary1 m 65 100 98 94 93 82 m 65 100 98 94 93 82 m 65 100 94 94 89 79Iceland m 89 100 104 97 103 114 m 89 100 104 97 103 114 m 90 100 108 106 103 98Ireland1 m 86 100 103 106 108 117 m 87 100 103 106 108 117 m 87 100 103 106 108 117Israel 97 99 100 104 114 124 135 97 99 100 103 103 112 113 99 100 100 103 103 113 107Italy 93 95 100 99 98 98 99 93 95 100 99 98 98 99 93 96 100 99 98 98 99Japan 85 99 100 101 97 95 95 85 99 100 101 97 95 95 85 99 100 101 97 95 95Korea m 78 100 103 103 102 99 m 78 100 103 103 102 99 m 78 100 103 103 102 99Luxembourg 85 m 100 97 95 89 92 98 m 100 97 95 100 106 98 m 100 97 95 100 106Mexico 100 101 100 100 99 100 101 95 100 100 100 99 100 100 m m m m m m mnetherlands m 92 100 100 102 103 107 m 90 100 100 112 112 116 m 94 100 100 83 84 87new Zealand m 102 100 100 98 98 m m 102 100 100 98 98 m m 102 100 100 98 98 mnorway1 85 93 100 97 100 108 109 85 93 100 97 100 108 109 81 87 100 97 99 105 107Poland m m 100 m m 131 135 m m 100 m m 149 154 m m 100 m m 172 177Portugal 87 88 100 99 98 97 108 87 88 100 99 98 97 108 87 88 100 99 98 97 108Scotland1 87 86 100 100 99 99 99 87 86 100 100 99 99 99 87 86 100 100 99 99 99Slovak republic m m m m m m m m m m m m m m m m m m m m mSlovenia m m 100 104 106 107 110 m m 100 104 106 107 110 m m 100 104 106 107 110Spain 106 99 100 100 98 103 106 m 95 100 100 98 100 106 108 100 100 100 98 103 106Sweden1 m 94 100 99 102 99 101 m 92 100 99 102 99 102 m 91 100 99 100 98 100Switzerland2 103 98 100 98 97 97 100 105 103 100 99 98 97 99 106 104 100 99 98 98 100turkey 108 55 100 95 99 101 106 a a a a a a a 111 51 100 96 100 102 107United States1 m m 100 101 101 99 99 m m 100 101 101 98 98 m m 100 101 101 106 105
oEcD average 94 90 100 101 101 104 107 93 91 100 100 101 104 107 96 90 100 100 101 104 107
oEcD average for countries with data available for all reference years
94 93 100 100 100 101 104 93 96 100 100 99 100 102 95 92 100 99 99 100 102
EU21 average for countries with data available for all reference years
93 94 100 101 100 100 103 93 94 100 100 99 99 101 95 94 100 100 99 99 103
oth
er
G2
0 argentina m m m m m m m m m m m m m m m m m m m m mBrazil m m m m m m m m m m m m m m m m m m m m mchina m m m m m m m m m m m m m m m m m m m m mIndia m m m m m m m m m m m m m m m m m m m m mIndonesia m m m m m m m m m m m m m m m m m m m m mrussian Federation m m m m m m m m m m m m m m m m m m m m mSaudi arabia m m m m m m m m m m m m m m m m m m m m mSouth africa m m m m m m m m m m m m m m m m m m m m m
1. Actual salaries. 2. Salaries after 11 years of experience.Source: OECD. See Annex 3 for notes (www.oecd.org/edu/eag2011).Please refer to the Reader’s Guide for information concerning the symbols replacing missing data.1 2 http://dx.doi.org/10.1787/888932465284

D3
How Much Are Teachers Paid? – InDIcator D3 chapter D
Education at a Glance © OECD 2011 419
table D3.4. trends in the ratio of salaries to GdP per capita (2000-09)Ratio of annual statutory teachers’ salaries in public institutions after 15 years of experience/minimum training to GDP per capita,
by level of education
Primary level Lower secondary level Upper secondary level
2000 2005 2006 2007 2008 2009 2000 2005 2006 2007 2008 2009 2000 2005 2006 2007 2008 2009(1) (2) (3) (4) (5) (6) (7) (8) (9) (10) (11) (12) (12) (13) (14) (15) (16) (17)
oecd australia 1.42 1.32 1.21 1.19 1.21 1.22 1.42 1.32 1.23 1.20 1.23 1.22 1.42 1.32 1.23 1.20 1.23 1.22
austria 1.02 1.07 1.05 1.03 1.01 1.04 1.06 1.16 1.13 1.11 1.09 1.13 1.17 1.18 1.16 1.14 1.12 1.16
Belgium (Fl.) 1.23 1.25 1.23 1.21 1.17 1.25 1.30 1.25 1.23 1.21 1.17 1.25 1.66 1.59 1.57 1.54 1.50 1.60
Belgium (Fr.) 1.19 1.18 1.18 1.16 1.13 1.22 1.27 1.20 1.18 1.16 1.13 1.22 1.64 1.54 1.51 1.48 1.44 1.57
canada m m m m m m m m m m m m m m m m m m
chile m m 1.01 0.94 m 1.54 m m 1.01 0.94 m 1.54 m m 1.05 0.98 m 1.61
czech republic 0.60 0.88 0.84 0.92 0.89 0.93 0.60 0.88 0.84 0.92 0.91 0.95 0.74 0.90 0.85 0.99 0.97 0.99
Denmark 1.21 1.19 1.17 1.14 1.15 1.41 1.21 1.19 1.17 1.14 1.15 1.41 1.42 1.45 1.45 1.39 1.39 1.61
England 1.43 1.33 1.31 1.28 1.26 1.31 1.43 1.33 1.31 1.28 1.26 1.31 1.43 1.33 1.31 1.28 1.26 1.31
Estonia 0.73 0.57 0.55 0.55 0.63 0.76 0.73 0.57 0.55 0.55 0.63 0.76 0.73 0.57 0.55 0.55 0.63 0.76
Finland1 1.08 1.07 1.14 1.09 1.07 1.13 1.23 1.25 1.22 1.17 1.15 1.21 1.29 1.43 1.35 1.28 1.26 1.35
France 1.18 1.05 1.03 1.00 0.97 0.98 1.27 1.14 1.11 1.07 1.05 1.06 1.27 1.14 1.12 1.08 1.06 1.06
Germany w w w w w 1.55 w w w w w 1.71 w w w w w 1.87
Greece 1.32 1.20 1.16 1.11 1.11 1.16 1.32 1.20 1.16 1.11 1.11 1.16 1.32 1.20 1.16 1.11 1.11 1.16
Hungary1 0.73 0.92 0.87 0.81 0.79 0.73 0.73 0.92 0.87 0.81 0.79 0.73 0.92 1.15 1.04 1.02 0.95 0.87
Iceland 0.80 0.77 0.78 0.70 0.74 0.85 0.80 0.77 0.78 0.70 0.74 0.85 0.94 0.91 0.94 0.90 0.87 0.86
Ireland1 1.29 1.23 1.23 1.23 1.27 1.47 1.31 1.23 1.23 1.23 1.27 1.47 1.31 1.23 1.23 1.23 1.27 1.47
Israel 0.88 0.86 0.86 0.91 0.97 1.05 0.98 0.96 0.96 0.92 0.98 0.98 0.96 0.94 0.94 0.90 0.96 0.90
Italy 1.02 1.04 1.03 1.01 1.01 1.06 1.12 1.14 1.12 1.10 1.10 1.16 1.16 1.17 1.15 1.13 1.13 1.19
Japan 1.68 1.59 1.58 1.49 1.44 1.49 1.68 1.59 1.58 1.49 1.44 1.49 1.69 1.59 1.58 1.49 1.44 1.49
Korea 2.17 2.26 2.22 2.13 2.04 1.96 2.17 2.25 2.22 2.12 2.03 1.95 2.17 2.25 2.22 2.12 2.03 1.95
Luxembourg m 0.99 0.93 0.87 0.81 0.85 m 1.30 1.22 1.14 1.18 1.28 m 1.30 1.22 1.14 1.18 1.28
Mexico 1.53 1.44 1.39 1.34 1.33 1.39 1.94 1.83 1.77 1.71 1.69 1.76 m m m m m m
netherlands 1.17 1.21 1.17 1.16 1.14 1.20 1.25 1.33 1.29 1.40 1.37 1.44 1.75 1.78 1.72 1.40 1.37 1.44
new Zealand 1.66 1.44 1.42 1.39 1.40 m 1.66 1.44 1.42 1.39 1.40 m 1.66 1.44 1.42 1.39 1.40 m
norway1 1.05 1.02 0.95 0.94 0.98 1.00 1.05 1.02 0.95 0.94 0.98 1.00 1.05 1.09 1.02 1.00 1.04 1.06
Poland m 0.76 m m 0.84 0.84 m 0.76 m m 0.96 0.96 m 0.76 m m 1.10 1.10
Portugal 1.43 1.58 1.56 1.52 1.49 1.67 1.43 1.58 1.56 1.52 1.49 1.67 1.43 1.58 1.56 1.52 1.49 1.67
Scotland1 1.40 1.46 1.43 1.39 1.38 1.43 1.40 1.46 1.43 1.39 1.38 1.43 1.40 1.46 1.43 1.39 1.38 1.43
Slovak republic m m m m m 0.61 m m m m m 0.61 m m m m m 0.61
Slovenia m 1.28 1.28 1.23 1.18 1.25 m 1.28 1.28 1.23 1.18 1.25 m 1.28 1.28 1.23 1.18 1.25
Spain 1.50 1.38 1.36 1.31 1.36 1.44 1.63 1.55 1.52 1.47 1.49 1.61 1.75 1.59 1.56 1.50 1.56 1.64
Sweden1 1.00 0.94 0.90 0.90 0.87 0.93 1.00 0.96 0.92 0.92 0.89 0.96 1.07 1.04 0.99 0.98 0.95 1.01
Switzerland2 1.49 1.48 1.42 1.37 1.33 1.39 1.78 1.68 1.63 1.56 1.52 1.58 2.12 1.97 1.91 1.83 1.80 1.86
turkey 1.24 1.94 1.73 1.73 1.74 1.88 a a a a a a 1.15 1.96 1.77 1.77 1.79 1.92
United States1 m 0.98 0.97 0.96 0.95 0.97 m 0.99 0.98 0.97 0.94 0.96 m 0.99 0.98 0.97 1.01 1.04
oEcD average 1.23 1.21 1.19 1.16 1.15 1.20 1.29 1.24 1.22 1.19 1.18 1.24 1.36 1.33 1.30 1.26 1.25 1.31
oEcD average for countries with data available for all reference years
1.22 1.23 1.20 1.17 1.17 1.24 1.27 1.26 1.23 1.20 1.19 1.26 1.34 1.36 1.32 1.28 1.27 1.33
EU21 average for countries with data available for all reference years
1.14 1.14 1.12 1.10 1.10 1.17 1.18 1.19 1.16 1.14 1.14 1.22 1.30 1.30 1.26 1.22 1.21 1.29
oth
er
G2
0 argentina m m m m m m m m m m m m m m m m m m
Brazil m m m m m m m m m m m m m m m m m m
china m m m m m m m m m m m m m m m m m m
India m m m m m m m m m m m m m m m m m m
Indonesia m m m 0.69 0.57 0.48 m m m 0.78 0.65 0.55 m m m 0.87 0.72 0.61
russian Federation m m m m m m m m m m m m m m m m m m
Saudi arabia m m m m m m m m m m m m m m m m m m
South africa m m m m m m m m m m m m m m m m m m
1. Actual salaries.2. Salaries after 11 years of experience.Source: OECD. Indonesia: UNESCO Institute for Statistics (World Education Indicators Programme). See Annex 3 for notes (www.oecd.org/edu/eag2011).Please refer to the Reader’s Guide for information concerning the symbols replacing missing data.1 2 http://dx.doi.org/10.1787/888932465303

chapter D The Learning environmenT and organisaTion of schooLs
D3
Education at a Glance © OECD 2011420
table D3.5a. [1/2] decisions on payments for teachers in public institutions (2009)Criteria for base salary and additional payments awarded to teachers in public institutions
Experiencecriteria based on teaching conditions/responsibilities
Year
s of
exp
erie
nce
as
a te
ache
r
Man
agem
ent r
espo
nsib
iliti
es
in a
ddit
ion
to te
achi
ng d
utie
s
teac
hing
mor
e cl
asse
s or
ho
urs
than
requ
ired
by
fu
ll-ti
me
cont
ract
Spec
ial t
asks
(car
eer g
uida
nce
or co
unse
lling
)
teac
hing
in a
dis
adva
ntag
ed,
rem
ote
or h
igh
cost
are
a (l
ocat
ion
allo
wan
ce)
Spec
ial a
ctiv
itie
s (e
.g. s
port
s an
d dr
ama
club
s, h
omew
ork
club
s, s
umm
er s
choo
l, et
c.)
teac
hing
stu
dent
s w
ith
spec
ial e
duca
tion
al n
eeds
(i
n re
gula
r sch
ools
)
teac
hing
cour
ses
in
a pa
rtic
ular
fiel
d
oecd australia – – s s
austria – s s s s Belgium (Fl.) – Belgium (Fr.) – canada m m m m m m m m m m m m m m m m m m m m m m m mchile – – czech republic – s – s s s s – s Denmark – s – s s s – s s s s
England – s – s – s – s – s
Estonia – s s – s – s s s Finland s – s s – s s – – France – s s s – s – Germany – – Greece – s s s Hungary – s s s s s s Iceland – s – s s – s s – s Ireland – s – s – s Israel – – s – s – s – s – s – s Italy – s Japan – s s s s Korea – s s s Luxembourg – – Mexico – s – s – s – s – s – s netherlands – s – s – s – s – s – s – s – s
new Zealand m m m m m m m m m m m m m m m m m m m m m m m mnorway – s – s s s Poland – s s s s Portugal – s s – Scotland – s Slovak republic – s s s s s – s Slovenia – – Spain – s s Sweden – – – – Switzerland – – – turkey – s s – s United States – s – s s s
oth
er
G2
0 argentina m m m m m m m m m m m m m m m m m m m m m m m m
Brazil m m m m m m m m m m m m m m m m m m m m m m m m
china m m m m m m m m m m m m m m m m m m m m m m m m
India m m m m m m m m m m m m m m m m m m m m m m m m
Indonesia m m m m m m m m m m m m m m m m m m m m m m m m
russian Federation – – – – s – s
Saudi arabia m m m m m m m m m m m m m m m m m m m m m m m m
South africa m m m m m m m m m m m m m m m m m m m m m m m m
Criteria for:– : Decisions on position in base salary scales : Decisions on supplemental payments which are paid every year
: Decisions on supplemental incidental payments Source: OECD. See Annex 3 for notes (www.oecd.org/edu/eag2011).Please refer to the Reader’s Guide for information concerning the symbols replacing missing data.1 2 http://dx.doi.org/10.1787/888932465322
D3
How Much Are Teachers Paid? – InDIcator D3 chapter D
Education at a Glance © OECD 2011 421
table D3.5a. [2/2] decisions on payments for teachers in public institutions (2009)Criteria for base salary and additional payments awarded to teachers in public institutions
criteria related to teachers’ qualifications, training and performance
criteria based on demography
otherHol
ding
an
init
ial e
duca
tion
al
qual
ific
atio
n hi
gher
than
th
e m
inim
um q
ualif
icat
ion
requ
ired
to e
nter
th
e te
achi
ng p
rofe
ssio
n
Hol
ding
a h
ighe
r tha
n m
inim
um le
vel o
f tea
cher
ce
rtif
icat
ion
or tr
aini
ng
obta
ined
dur
ing
pr
ofes
sion
al li
fe
out
stan
ding
per
form
ance
in
teac
hing
Succ
essf
ul co
mpl
etio
n of
pr
ofes
sion
al d
evel
opm
ent
acti
viti
es
reac
hing
hig
h sc
ores
in
the
qual
ific
atio
n ex
amin
atio
n
Hol
ding
an
educ
atio
nal
qual
ific
atio
n in
mul
tipl
e su
bjec
ts
Fam
ily s
tatu
s (m
arri
ed,
num
ber o
f chi
ldre
n)
age
(ind
epen
dent
of y
ears
of
teac
hing
exp
erie
nce)
oecd australia – – s
austria s s Belgium (Fl.) – s s Belgium (Fr.) – – s
canada m m m m m m m m m m m m m m m m m m m m m m m m m m mchile – – s – czech republic – s – Denmark – s – s s – s – s England – s – s Estonia – – s – s Finland – – s s s – France – s Germany – – Greece – s s – Hungary – – – s s Iceland – s – s s – s Ireland – s – s Israel – – s – s – s Italy – Japan s s Korea s Luxembourg – – s – Mexico – s – s – s – s – s netherlands – s – s – s – s – s – s new Zealand m m m m m m m m m m m m m m m m m m m m m m m m m m mnorway – s s s s s s s Poland – s s – s
Portugal – – – – s Scotland – Slovak republic s – s Slovenia s s – Spain s – Sweden – – – – – Switzerland s s turkey – s – s s s United States – s – s – s
oth
er
G2
0 argentina m m m m m m m m m m m m m m m m m m m m m m m m m m m
Brazil m m m m m m m m m m m m m m m m m m m m m m m m m m m
china m m m m m m m m m m m m m m m m m m m m m m m m m m m
India m m m m m m m m m m m m m m m m m m m m m m m m m m m
Indonesia m m m m m m m m m m m m m m m m m m m m m m m m m m m
russian Federation – – s – –
Saudi arabia m m m m m m m m m m m m m m m m m m m m m m m m m m m
South africa m m m m m m m m m m m m m m m m m m m m m m m m m m m
Criteria for:– : Decisions on position in base salary scales : Decisions on supplemental payments which are paid every year
: Decisions on supplemental incidental payments Source: OECD. See Annex 3 for notes (www.oecd.org/edu/eag2011).Please refer to the Reader’s Guide for information concerning the symbols replacing missing data.1 2 http://dx.doi.org/10.1787/888932465322