Effective multimodel anomaly detection using cooperative negotiation

Stephen E. Schwartz
April 4, 2018
https://www.bnl.gov/envsci/schwartz/ [email protected]
HOW LONG DOES ANTHROPOGENIC COSTAY IN THE ATMOSPHERE?
2
Environmental and Climate SciencesSeminar Series

OUR COLLECTIVE ENERGY USE
Equivalent to 100 watts
Standard diet US adult: 2000 Calories (k cal) per day
Equivalent to 100 people!
Per capita energy US use: 10,000 watts
And all these “people” are exhaling CO !2
100 100-watt light bulbs, 24 – 7

10,000 5000 0Time, yearsbefore 2005
Mix
ing
ratio
, ppm
1800 1900 2000Year
1960 20101985Year
350
300
250
200
400
50,000100,000150,000Time, years before 1950
Mixing ratio, ppm
350
300
250
200
400
CARBON DIOXIDE OVER TIME
ContemporaneousAnthropoceneHoloceneLast glacial cycle
Mauna LoaAntarcticaAntarctica
Lüthi (2008)Etheridge (1996)
Monnin (2001, 2004)Siegenthaler (2005)
MacFarling Meure (2006)Keeling (1995),updated
Dlugokencky (2018)
Antarctica, Cape Grim
GlobalAntarctica
Mauna Loa
Preindustrial

12
10
8
6
4
2
0
CO
2 em
issi
on, P
g yr
-1
200019501900185018001750
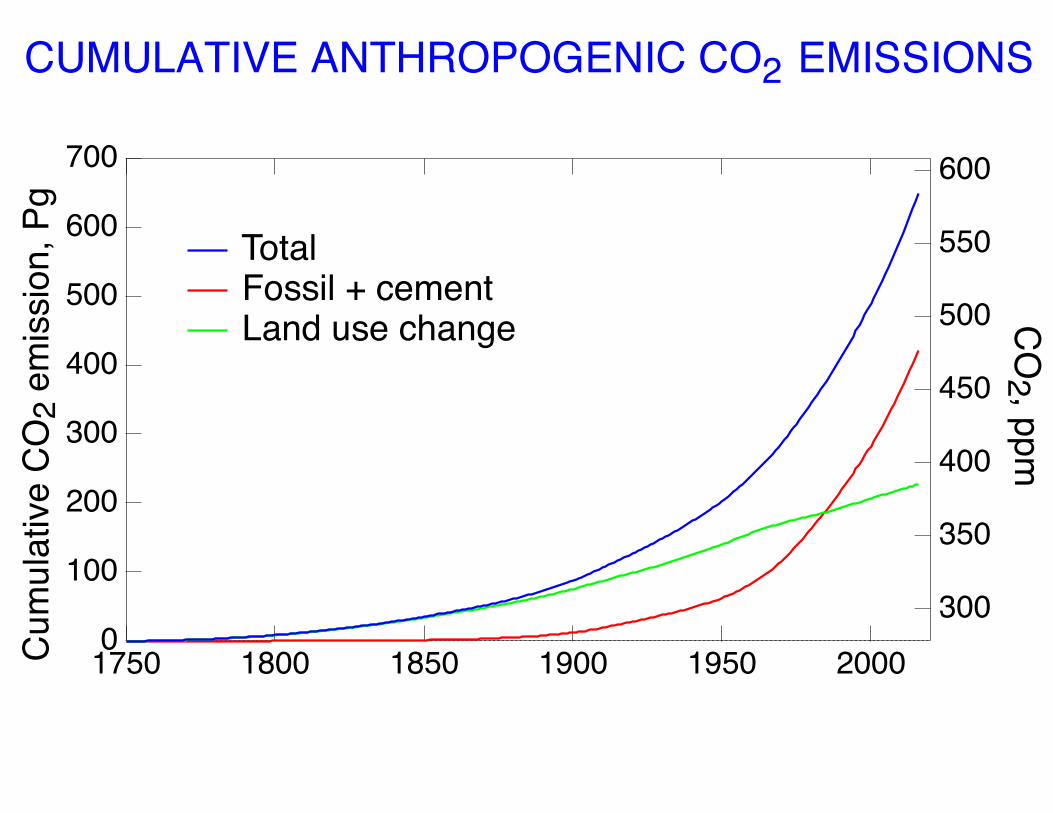
Total Fossil + cement Land use change
(Linear ramp 1750-1850)
ANTHROPOGENIC CARBON DIOXIDE EMISSIONS
Houghton and Nassikas, 2017Boden et al., 2017
700
600
500
400
300
200
100
0Cum
ulat
ive
CO
2 em
issi
on, P
g
200019501900185018001750
600
550
500
450
400
350
300
CO
2 , ppm
Total Fossil + cement Land use change
CUMULATIVE ANTHROPOGENIC CO2 EMISSIONS2

700
600
500
400
300
200
100
0Cum
ulat
ive
CO
2 em
issi
on, P
g
200019501900185018001750
600
550
500
450
400
350
300
CO
2 , ppm
Total cumulative emissions
CUMULATIVE ANTHROPOGENIC CO2 EMISSIONS2
Antarctica, Cape Grim Global CO2 in air
Nature’s “subsidy” of our carbon dioxide emissions
AND ANTHROPOGENIC ATMOSPHERIC STOCK

Motivation for this study

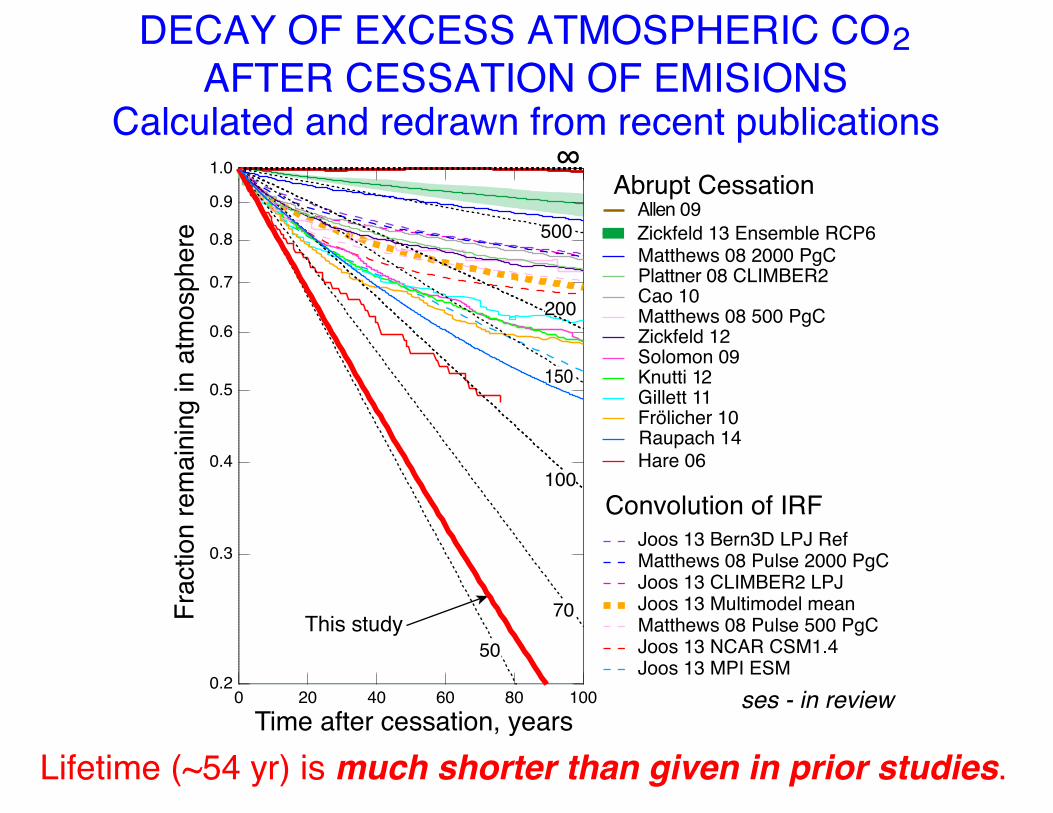
DECAY OF EXCESS ATMOSPHERIC CO2 AFTER CESSATION OF EMISIONS
Calculated and redrawn from recent publications
2
ses - in review
Frac
tion
rem
aini
ng in
atm
osph
ere
Time after cessation, years
Abrupt Cessation
Convolution of IRF
Matthews 08 2000 PgC Plattner 08 CLIMBER2 Cao 10 Matthews 08 500 PgC Zickfeld 12 Solomon 09 Knutti 12 Gillett 11 Frölicher 10
Hare 06
Allen 09 Zickfeld 13 Ensemble RCP6
Joos 13 Bern3D LPJ Ref Matthews 08 Pulse 2000 PgC Joos 13 CLIMBER2 LPJ Joos 13 Multimodel mean Matthews 08 Pulse 500 PgC Joos 13 NCAR CSM1.4 Joos 13 MPI ESM
Raupach 14
1.0
0.9
0.8
0.7
0.6
0.5
0.4
0.3
0.2100806040200
This study
∞
50
70
100
150
200
500
Lifetime (~54 yr) is much shorter than given in prior studies.
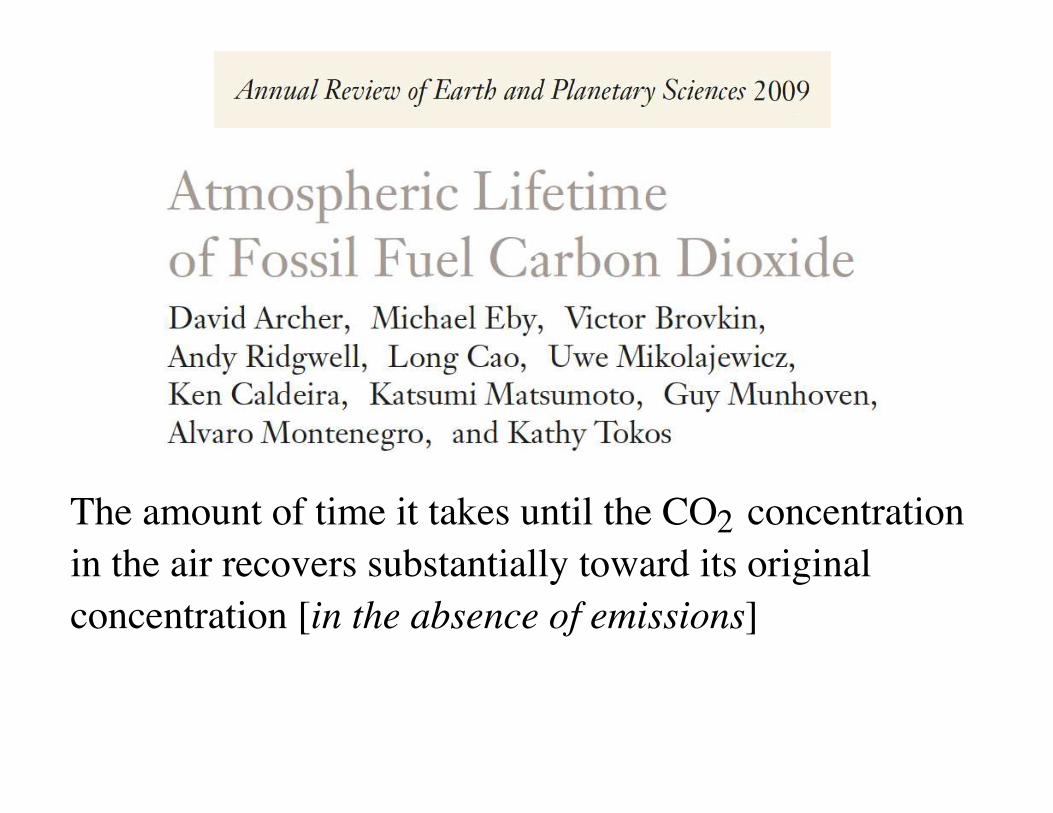
The amount of time it takes until the CO2 concentration in the air recovers substantially toward its original concentration [in the absence of emissions]
2
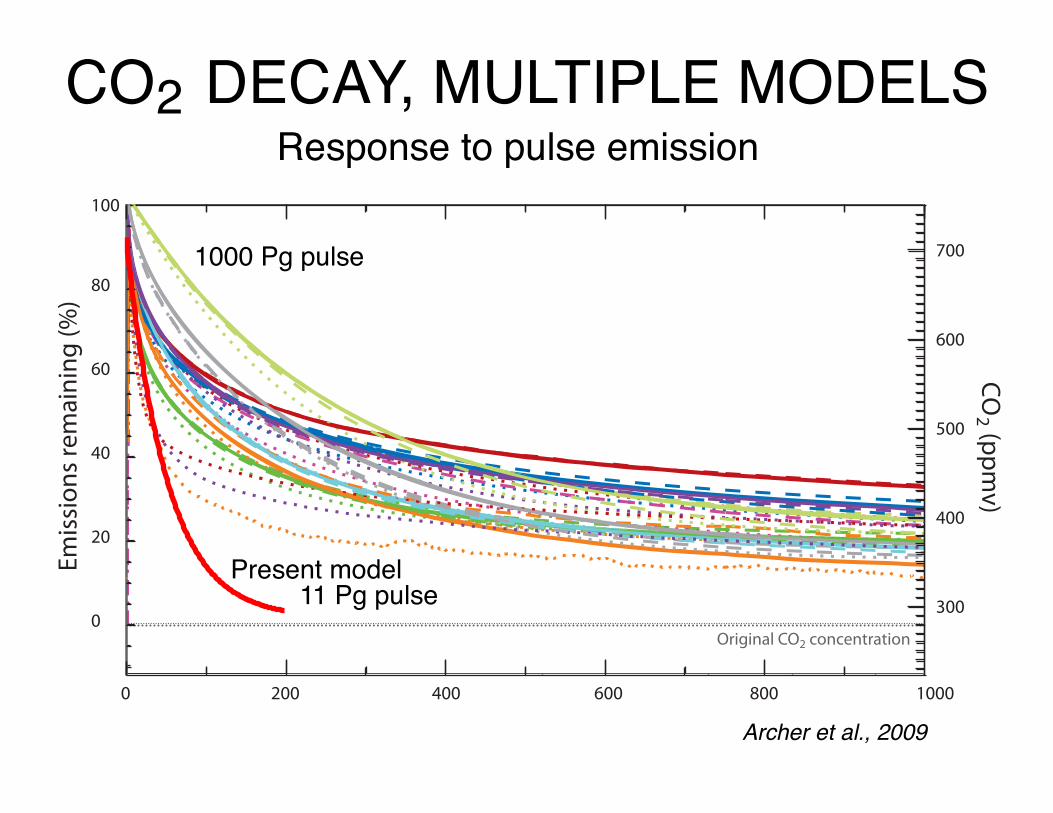
0 200 400 600 800 1000
Original CO2 noitartnecnoc
300
400
500
600
700
CO2 (ppm
v)
0
20
40
60
80
100
Emis
sion
s re
mai
ning
(%)
Present model
1000 Pg pulse
11 Pg pulse
Archer et al., 2009
CO2 DECAY, MULTIPLE MODELS2Response to pulse emission

DEFINITIONS
Turnover time: Ratio of Stock to Flux out
ito = Si
j Fij
Requires a budget. Need to specify which stock, which fluxes.
Adjustment time: Inverse of fractional removal rate
iadj =
SidSidt
, Qant = 0
Requires a model.
Lifetime: Time required, in absence of anthropogenic emissions, until the CO2 concentration in the air recoverssubstantially toward its original concentration.Qualitative.

The global CO budget2

CO2 STOCKS, FLUXES, AND ANNUAL CHANGE2
ses, in review
Preindustrial
3700 – 420
Surface sediment150
119.4120
Respiration
Gross primaryproductivity
70.670
Stock, PgFlux, Pg yr -1
Mixed-layer ocean906.1 + 32.2
100 m
3583 m
2034 + 73
Deep ocean35,917 + 124
44.750
5.3 ± 1.855.149.8
Concentration, µmol kg-1
2250 + 9
0.6Ftm
Sd
FmaFam
FmdFdm Fpc
Sm
FtaFat
Marine biota3
3700 – 422Fossil fuels & cement
Total ocean36,823 + 156
589.4 + 269.2AtmosphereSa
2300 – 228 + 219
Terrestrial vegetation,soil, and detritusSt
Surface sediment150
Steady state
Do nothing cycleDisequilibrium!
τ = 589/(120 + 70) ≈ 3 yr
τ = 36000/55 ≈ 600 yr
Nearlyequal Nearly equal
Near equilibrium
Detailed balance
Measured
Universal deposition velocity
Universal piston velocity
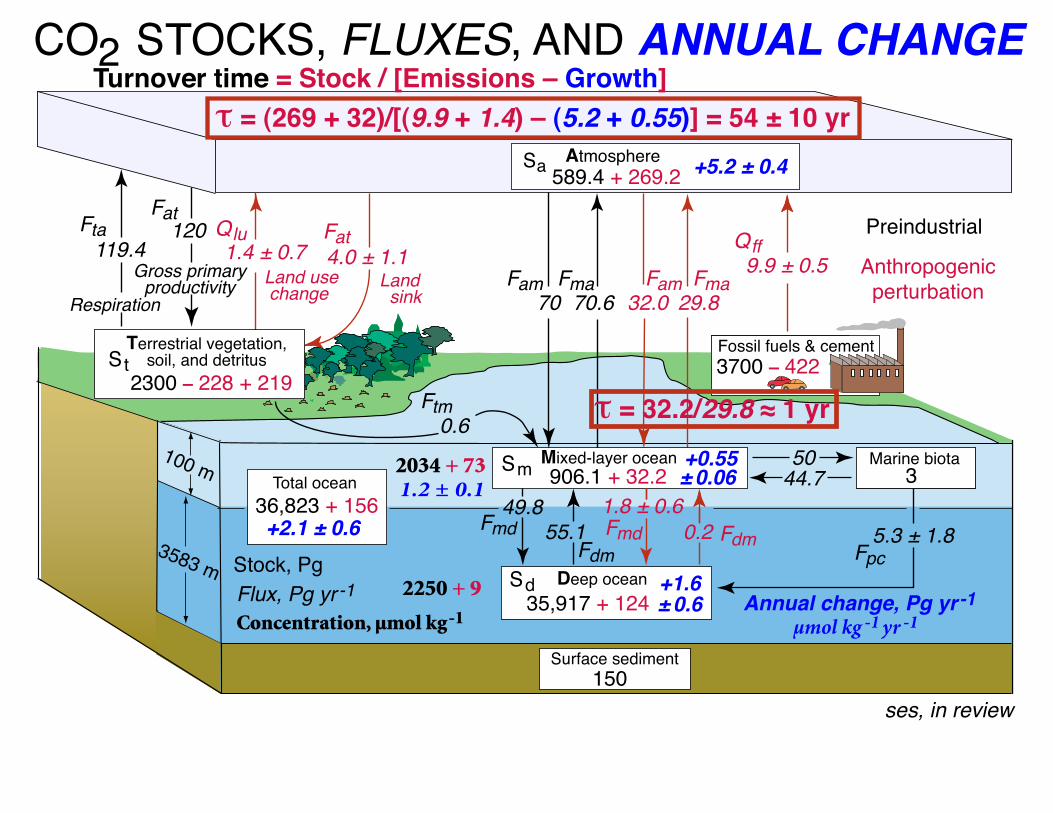
CO2 STOCKS, FLUXES, AND ANNUAL CHANGE2
ses, in review
Preindustrial
Anthropogenicperturbation
9.9 ± 0.51.4 ± 0.7
3700 – 420
Surface sediment150
119.4120
Respiration
Gross primaryproductivity Land
sinkLand use change 70.670
Stock, PgFlux, Pg yr -1
Mixed-layer ocean
1.8 ± 0.6
Annual change, Pg yr -1
906.1 + 32.2+0.55100 m
3583 m
32.0 29.8
2034 + 73
Deep ocean35,917 + 124
44.750
5.3 ± 1.855.149.8
Concentration, µmol kg-1
2250 + 9
0.2
4.0 ± 1.1
+1.6
0.6Ftm
Sd
FmaFam
FmdFdm Fpc
Sm
QluFtaFat
QffFat
Fam Fma
Fmd Fdm
Marine biota3
3700 – 422Fossil fuels & cement
+2.1 ± 0.6
Total ocean36,823 + 156
+5.2 ± 0.4589.4 + 269.2AtmosphereSa
2300 – 228 + 219
Terrestrial vegetation,soil, and detritusSt
Surface sediment150
± 0.6
± 0.061.2 ± 0.1
µmol kg yr-1 -1
τ = (269 + 32)/[(9.9 + 1.4) – (5.2 + 0.55)] = 54 ± 10 yr
τ = 32.2/29.8 ≈ 1 yr
Turnover time = Stock / [Emissions – Growth]

Global CO model2

Preindustrial
TRANSFER COEFFICIENTS FOR ANTHRO CO22
kam = Fam,pi / Sa,pi; global mean deposition velocity
kmdzm = kdmzd = vp; global mean piston velocity, 5.5 m yr-1
k By differenceat Q tot - dSa/dt( )/Sa,ant ] 2016= [ - dSm/dt - dSd/dt
From obs’d global heat uptake rate
UniversalAcid dissocchemistryKam = (dSa/dSm)eq , a known function of Sa, 5–10kma = kamKam;
Transfer coefficients, yr-1-1 Anthropogenic
emissions3700 – 420
Surface sediment150
0.6
Flux, Pg yr -1
Mixed-layer ocean100 m
3583 m Deep ocean
5.3
5.35.3
0.6Ftm
Sd
Fma,net
Fdm,net
Fpc
Sm
QluQ ffkat
kam kma
kmd kdm
Marine biota
Fossil fuels & cement
AtmosphereSa
St
at,netF0.6
0.01480.119 0.6–1.2
0.055 0.0015
2018-1218
9.9 ± 0.51.4 ± 0.7
Terrestrial vegetation,soil, and detritus
AssumptionAlert!

Assumed sink to terrestrial biosphere plus deep ocean agrees with sink based on measured increase in atmospheric stock and inventoried emissions.
Uncertainty fromuncertainty in emission
and variation in atmospheric growth rate
8
6
4
2
0
-2300250200100500
From observations and emissions Law Dome, Cape Grim Global CO2 in air
τ = 54.3 yr
+ Smant(Sa
ant ), Pg
Qan
t+
S mant
– d
(Saan
t)/d
t, Pg
yr-1
SINK RATE INTO TERRESTRIAL BIOSPHERE PLUS DEEP OCEAN

THE DIFFERENTIAL EQUATIONS
Four coupled ordinary differential equations.
dSadt
= kamSa + kmaSm kat Sa Spi( ) Ftmpi +Qant (t)
dSmdt
= kamSa kmaSm kmdSm + kdmSd +Ftmpi
dSddt
= kmdSm kdmSd +Fpc
dStdt
= kat Sa Spi( )
Fpc
Slightly nonlinear because kmidepends weakly on Si.
kmaSm
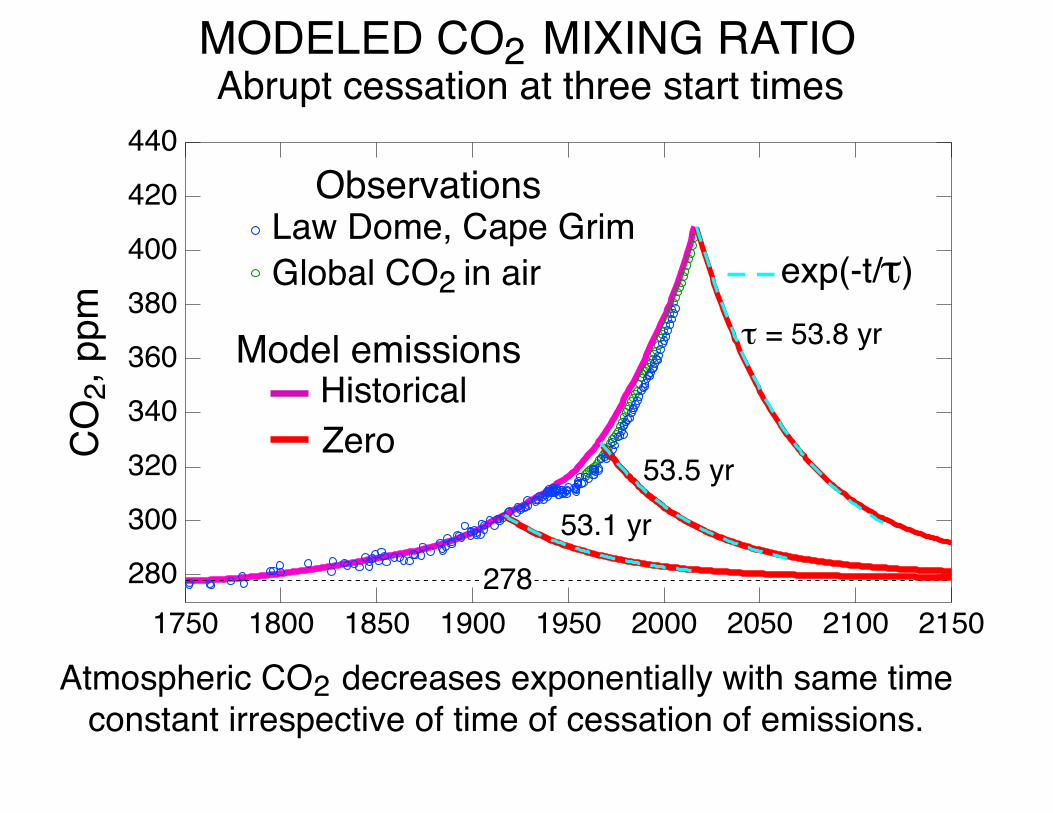
Atmospheric CO2 decreases exponentially with same time constant irrespective of time of cessation of emissions.
2
MODELED CO2 MIXING RATIO2Abrupt cessation at three start times
440
420
400
380
360
340
320
300
280
CO
2, pp
m
215021002050200019501900185018001750278
Model emissions
Law Dome, Cape Grim Global CO2 in air
Historical Zero
Observations
= 53.8 yr
exp(-t/ )
53.5 yr
53.1 yr

CO2 can be stabilized by reduction of emissions to present removal rate into terrestrial biosphere and deep ocean, about half of current emissions (nature’s subsidy).
2
MODELED CO2 MIXING RATIO2Abrupt reduction of emissions
440
420
400
380
360
340
320
300
280
CO
2, pp
m
215021002050200019501900185018001750278
Model emissions
Law Dome, Cape Grim Global CO2 in air
Historical Reduced
Observations

Usefully defined as sum of anthro atmospheric and mixed-layer stocks upon sum of net fluxes to deep ocean and terrestrial biosphere.
Virtually constant (52 – 54 yr) over Anthropocene, increasing to ~ 65 yr as flux into deep ocean decreases.
TURNOVER TIME OF ANTHROPOGENIC CO22
Agrees with multiple measures of life time.
=Sa +SmFat +Fmd,net
AM
70
65
60
55
50
45
40
Adju
stm
ent t
ime
, yr
21002050200019501900185018001750
Time of cessation or reduction of emissions
Reduction CessationHistorical AM
AM
Cessation AAM
Exponential fits Sa + Sma m Sma
BudgetAnalyticalNumerical
toant ant

NEAR EQUILIBRIUM BETWEEN ATMOSPHERE AND OCEAN MIXED LAYER
40353025201510
50
-5
Mix
ed la
yer s
tock
, Pg
C
215021002050200019501900185018001750
Anthropogenic Mixed-Layer Stock
Equilibrium Model Difference
Time constant for equilibration of atmosphere and ocean mixed layer is short, ~ 1 yr.These two compartments are thus in near equilibrium and are usefully considered a single compartment.

Assumed sink to terrestrial biosphere plus deep ocean agrees with sink based on measured and modeled increase in atmospheric stock and inventoried emissions.
Uncertainty fromuncertainty in emission
and variation in atmospheric growth rate
8
6
4
2
0
-2300250200100500
Historical Cessation
From observations and emissions Law Dome, Cape Grim Global CO2 in air
τ = 54.3 yr
+ Smant(Sa
ant ), Pg
Qan
t+
S mant
– d
(Saan
t)/d
t, Pg
yr-1
SINK RATE INTO TERRESTRIAL BIOSPHERE PLUS DEEP OCEAN
Comparison withObservations and
Other Models

Prescribed Land Use EmissionsModeled Land Use EmissionsPrescribed Land Use Emissions
with modeled nitrogen cycle
400
380
360
340
320
300
280
CO
2, pp
m
2000196019201880
Present model
Law Dome, Cape Grim Global CO2 in air
COMPARISON WITH OBSERVATIONS AND OTHER MODELSCO Mixing Ratio in Air2
Friedlingstein et al., 2014

COMPARISON WITH OBSERVATIONS AND OTHER MODELS
2.5
2.0
1.5
1.0
0.5
0.0
-0.5
ObservationMean of 13 modelsPresent model
Net
oce
an u
ptak
e Pg
yr-1
20402000196019201880
Gruber
Wang
Net Ocean Uptake Rate
15 CMIP5 models; observational data from Wang et al. (2016), Gruber et al. (2019)

4
3
2
1
020502000195019001850
Terre
stria
l upt
ake
Pg y
r-1 Present model
Gruber
COMPARISON WITH OBSERVATIONS AND OTHER MODELSTerrestrial uptake rate
Gruber et al. (2019) Difference of emissions and ocean uptake rateModels from Friedlingstein et al. (2006)
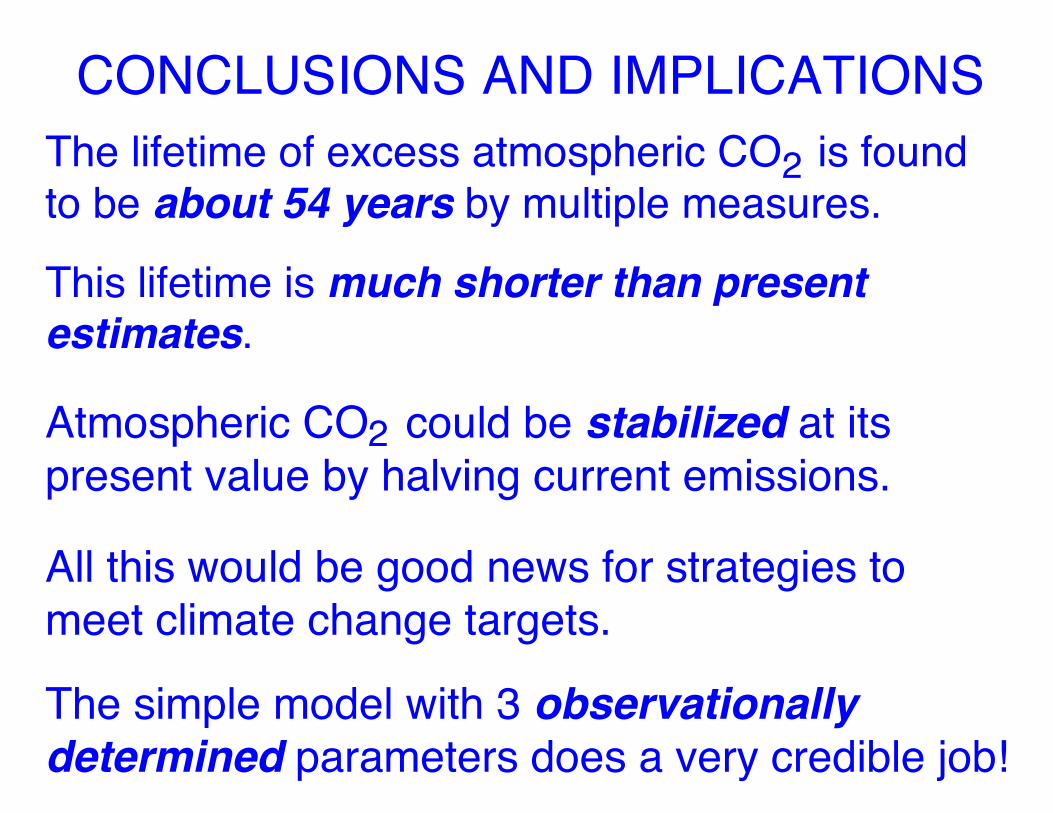
CONCLUSIONS AND IMPLICATIONS
Atmospheric CO2 could be stabilized at its present value by halving current emissions.
2
The lifetime of excess atmospheric CO2 is found to be about 54 years by multiple measures.
2
This lifetime is much shorter than present estimates.
All this would be good news for strategies to meet climate change targets.
The simple model with 3 observationally determined parameters does a very credible job!
DECAY OF EXCESS ATMOSPHERIC CO2 AFTER CESSATION OF EMISIONS
Calculated and redrawn from recent publications
2
ses - in review
Frac
tion
rem
aini
ng in
atm
osph
ere
Time after cessation, years
Abrupt Cessation
Convolution of IRF
Matthews 08 2000 PgC Plattner 08 CLIMBER2 Cao 10 Matthews 08 500 PgC Zickfeld 12 Solomon 09 Knutti 12 Gillett 11 Frölicher 10
Hare 06
Allen 09 Zickfeld 13 Ensemble RCP6
Joos 13 Bern3D LPJ Ref Matthews 08 Pulse 2000 PgC Joos 13 CLIMBER2 LPJ Joos 13 Multimodel mean Matthews 08 Pulse 500 PgC Joos 13 NCAR CSM1.4 Joos 13 MPI ESM
Raupach 14
1.0
0.9
0.8
0.7
0.6
0.5
0.4
0.3
0.2100806040200
This study
∞
50
70
100
150
200
500
Lifetime (~54 yr) is much shorter than given in prior studies.