How Has the Great Recession Changed Our Understanding of ...
22
How Has the Great Recession Changed Our Understanding of Macroeconomics? Stephen Williamson Vice President Federal Reserve Bank of St. Louis Professors Conference November 12, 2015
Transcript of How Has the Great Recession Changed Our Understanding of ...

How Has the Great Recession Changed Our Understanding of Macroeconomics?
Stephen Williamson Vice President Federal Reserve Bank of St. Louis
Professors Conference November 12, 2015

Outline Is Macro broken? Post-Great Recession Issues: Long-Run Growth Trend – stagnation? Labor market issues – labor market participation, labor
market tightness. Monetary policy – unconventional policies, normalization.

Is Macro Broken? The Financial Crisis and Great Recession created criticism directed at macroeconomists and macroeconomics.
Some common complaints: Macroeconomists did not predict the financial crisis. Macroeconomic models have omitted banking, financial frictions,
and financial crises. We can do just fine with pre-1970 Keynesian models, for example
the Hicks (1937) IS-LM model.

No, Macro is not Broken Theory tells us that, by their nature, financial crises are unpredictable, and that policymakers may not be able to stop one, even when they recognize it is underway. There has been much economic modeling of banking, financial frictions, and crises in the last 40+ years – though macroeconomists don’t always use what is on the shelf. There is much that IS-LM does not capture – dynamics, financial detail, unconventional monetary policy effects. The trick is to distill frontier work in macroeconomic theory to make it accessible to students.

How is the Post-Great Recession World Different?
Solow growth model – a standard tool for understanding economic growth, and often taught to undergraduates. Solow model says long-run growth in per-capita income is determined by the rate of technological change. Pre-Great Recession: U.S. looks like an economy driven by a roughly constant rate of technical change – per-capita income growth does not deviate much from a 2% trend.
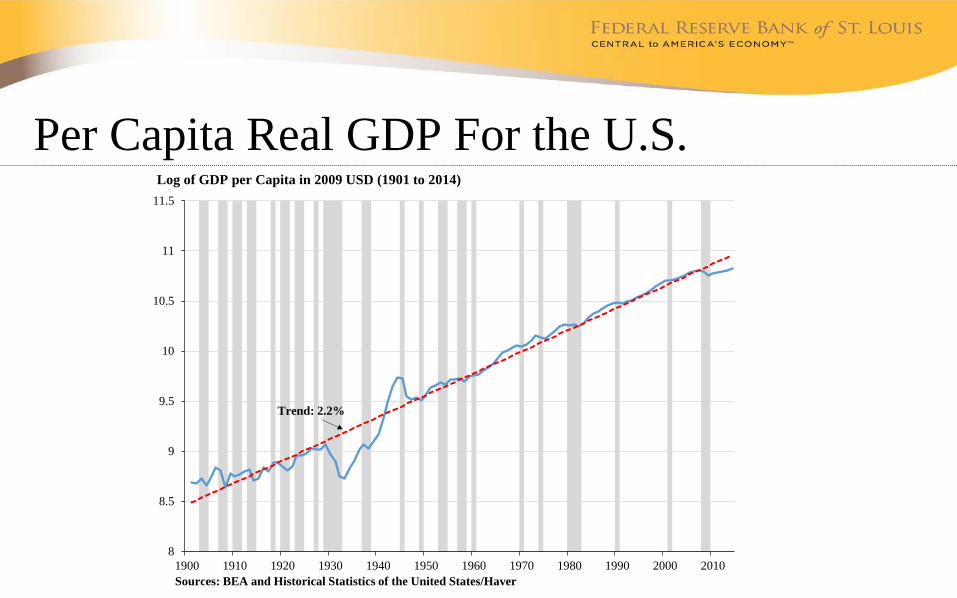
Per Capita Real GDP For the U.S.
8
8.5
9
9.5
10
10.5
11
11.5
1900 1910 1920 1930 1940 1950 1960 1970 1980 1990 2000 2010
Trend: 2.2%
Log of GDP per Capita in 2009 USD (1901 to 2014)
Sources: BEA and Historical Statistics of the United States/Haver

Real GDP, Post-WWII
7
7.5
8
8.5
9
9.5
10
10.5
1947 1957 1967 1977 1987 1997 2007
Trend: 3.3%
Log of GDP in Billions of 2009 USD (Q1 1947 to Q3 2015)
Sources: BEA/FRED

Real GDP, Recent History
9.4
9.45
9.5
9.55
9.6
9.65
9.7
9.75
9.8
9.85
9.9
2007 2008 2009 2010 2011 2012 2013 2014 2015
Long-Run Trend:3.3%
Post-RecessionTrend: 2.1%
Log of GDP in Billions of 2009 USD
Sources: BEA/FRED

Questions About Future U.S. Growth Performance
Has there been a permanent downward level adjustment in real GDP, and also a permanent downward adjustment in the growth rate? Or is this just a protracted response to the financial crisis? Will the future be a long period of secular stagnation? Low TFP growth – growth pessimists. Larry Summers and secular stagnation – dearth of investment
opportunities.

Labor Market Issues
0.0
10.0
20.0
30.0
40.0
50.0
60.0
70.0
80.0
90.0
100.0
1950 1960 1970 1980 1990 2000 2010
Labor Force Participation Rates, Seasonally Adjusted Percent
Sources: BLS/FRED
Men
Women
Total

Labor Market Tightness One measure of tightness: ratio of vacancies to unemployment.
0
0.1
0.2
0.3
0.4
0.5
0.6
0.7
0.8
0.9
1
2001 2002 2003 2004 2005 2006 2007 2008 2009 2010 2011 2012 2013 2014 2015
Total Nonfarm Job Openings Rate/Civilian Unemployment Rate, Both Seasonally Adjusted
Sources: BLS/FRED

Beveridge Curve
1.5
2.0
2.5
3.0
3.5
4.0
3.0 4.0 5.0 6.0 7.0 8.0 9.0 10.0 11.0
Tota
l Non
farm
Job
Ope
ning
s Rat
e, S
easo
nally
Adj
uste
d Pe
rcen
t
Civilian Unemployment Rate, Seasonally Adjusted PercentSources: BLS/FRED
December 2000 to August 2015

Long-Term Unemployed
0
1000
2000
3000
4000
5000
6000
7000
8000
2000 2001 2002 2003 2004 2005 2006 2007 2008 2009 2010 2011 2012 2013 2014 2015
Number of Civilians Unemployed 27 Weeks and Over, Seasonally Adjusted (Thousands)
Sources: BLS/FRED

Beveridge Curve #2: Insured Unemployment
1.5
2.0
2.5
3.0
3.5
4.0
1.5 2.0 2.5 3.0 3.5 4.0 4.5 5.0 5.5
Tota
l Non
farm
Job
Ope
ning
s Rat
e, S
easo
nally
Adj
uste
d Pe
rcen
t
Insured Unemployment Rate, Seasonally Adjusted Percent
December 2000 to August 2015
Sources: BLS and DOL/FRED

Monetary Policy Unconventional monetary policy tools: Extended ZIRP (zero interest rate policy). Quantitative easing: (i) Outright purchases of long-maturity Treasury
securities; (ii) Swaps of short Treasuries for long Treasuries; (iii) Purchases of non-Treasury debt – mortgage-backed securities.
Forward guidance: Promises about future policy actions. Negative policy interest rates (tried in Sweden, Euro area,
Switzerland, Denmark).

ZIRP
0.00
2.50
5.00
7.50
10.00
12.50
15.00
17.50
20.00
1955 1965 1975 1985 1995 2005 2015
Effective Federal Funds Rate, Percent
Sources: FRB/FRED

Fed Liabilities
0
500
1000
1500
2000
2500
3000
2007 2008 2009 2010 2011 2012 2013 2014 2015
Reserve Balances
Currency in Circulation
Reverse RepurchaseAgreements
Billions of US Dollars
Sources: FRB/FRED

Monetary Policy Normalization Steps in normalization (from FOMC’s posted “Policy Normalization Principles and Plans”): 1. Liftoff: Fed funds rate target range to increase from the 0-0.25%
range. 2. Reduction in the Fed’s balance sheet: Treasury securities mature,
and MBS run off – will take approximately 7 years (Board estimate) to return to normal size, and longer to return the maturity composition to normal.

Liftoff Will be somewhat complicated because of: Large balance sheet. Unusual features of U.S. financial markets.
Idea is to control fed funds rate, not by intervening to control reserve balances, but with: Interest rate on reserves (IOER). ON RRP (overnight repurchase agreement) rate.
IOER and ON RRP rate should bound the fed funds rate.

Fed Funds Rate, Post-Great Recession
0.00
0.05
0.10
0.15
0.20
0.25
0.30
2009 2010 2011 2012 2013 2014 2015
Effective Federal Funds Rate, Percent
Sources: FRB/FRED

Key U.S. Macroeconomic Issues Long run growth: Is the average rate of real GDP growth going to be 2% rather than 3%? Will the U.S. economy never return to its previous trend growth path?
Labor market: Is the decline in labor force participation permanent? Is the labor market as tight as it’s going to get?
Monetary policy: When will liftoff occur? What if ZIRP continues indefinitely? Will operational changes and Fed communications work smoothly in the
liftoff phase?

Federal Reserve Bank of St. Louis stlouisfed.org Federal Reserve Economic Data (FRED) research.stlouisfed.org/fred2/ St. Louis Fed Business Outlook Survey research.stlouisfed.org/outlooksurvey/