How far to the hospital? The effect of hospital closures...
22
Journal of Health Economics 25 (2006) 740–761 How far to the hospital? The effect of hospital closures on access to care Thomas C. Buchmueller a , Mireille Jacobson b,∗ , Cheryl Wold c a University of California, Irvine and NBER, United States b University of California, Irvine, United States c Los Angeles County Department of Health Services, United States Received 11 July 2004; received in revised form 28 October 2005; accepted 28 October 2005 Available online 13 December 2005 Abstract Do urban hospital closures affect health care access or health outcomes? We study closures in Los Angeles County between 1997 and 2003, through their effect on distance to the nearest hospital. We find that increased distance to the closest hospital increases deaths from heart attacks and unintentional injuries. This finding is robust to several sensitivity checks. We also find that, for residents with health insurance, increased distance shifts regular care towards doctor’s offices. While most residents are otherwise unaffected, we find some evidence that seniors perceive more difficulty accessing care. © 2005 Elsevier B.V. All rights reserved. JEL classification: I11; I12; I18 Keywords: Hospital closure; Access to care 1. Introduction Just prior to the November 2002 elections, Los Angeles County announced that without a US$ 350 million bailout it would be forced to close several area hospitals and clinics. High on the list of proposed closures were Harbor-UCLA and Olive View-UCLA Medical Centers, hospitals that serve a disproportionate share of the county’s Medi-Cal and uninsured populations. Since Harbor-UCLA is a Trauma I center, its closure would mean the loss of significant trauma and emergency care services in the Los Angeles area. The passage of a ballot initiative (Measure B) ∗ Corresponding author. Tel.: +1 734 936 1321; fax: +1 734 936 9813. E-mail address: [email protected] (M. Jacobson). 0167-6296/$ – see front matter © 2005 Elsevier B.V. All rights reserved. doi:10.1016/j.jhealeco.2005.10.006
Transcript of How far to the hospital? The effect of hospital closures...

Journal of Health Economics 25 (2006) 740–761
How far to the hospital?The effect of hospital closures on access to care
Thomas C. Buchmueller a, Mireille Jacobson b,∗, Cheryl Wold c
a University of California, Irvine and NBER, United Statesb University of California, Irvine, United States
c Los Angeles County Department of Health Services, United States
Received 11 July 2004; received in revised form 28 October 2005; accepted 28 October 2005Available online 13 December 2005
Abstract
Do urban hospital closures affect health care access or health outcomes? We study closures in Los AngelesCounty between 1997 and 2003, through their effect on distance to the nearest hospital. We find that increaseddistance to the closest hospital increases deaths from heart attacks and unintentional injuries. This finding isrobust to several sensitivity checks. We also find that, for residents with health insurance, increased distanceshifts regular care towards doctor’s offices. While most residents are otherwise unaffected, we find someevidence that seniors perceive more difficulty accessing care.© 2005 Elsevier B.V. All rights reserved.
JEL classification: I11; I12; I18
Keywords: Hospital closure; Access to care
1. Introduction
Just prior to the November 2002 elections, Los Angeles County announced that without a US$350 million bailout it would be forced to close several area hospitals and clinics. High on thelist of proposed closures were Harbor-UCLA and Olive View-UCLA Medical Centers, hospitalsthat serve a disproportionate share of the county’s Medi-Cal and uninsured populations. SinceHarbor-UCLA is a Trauma I center, its closure would mean the loss of significant trauma andemergency care services in the Los Angeles area. The passage of a ballot initiative (Measure B)
∗ Corresponding author. Tel.: +1 734 936 1321; fax: +1 734 936 9813.E-mail address: [email protected] (M. Jacobson).
0167-6296/$ – see front matter © 2005 Elsevier B.V. All rights reserved.doi:10.1016/j.jhealeco.2005.10.006

T.C. Buchmueller et al. / Journal of Health Economics 25 (2006) 740–761 741
Table 1Hospital closures and openings in the Los Angeles region: 1998–2002
Year Los Angeles County Neighboring counties
Open start ofyear
Closed duringyear
Opened duringyear
Open start ofyear
Closed duringyear
Opened duringyear
1997 131 3 0 89 2 01998 128 6 1 87 2 01999 123 1 0 85 1 22000 122 0 0 86 2 22001 122 3 0 86 0 12002 119 87
Source: OSHPD’s Annual Utilization Report of Hospitals, 1997–2001 and 2002 Hospital Facility Listing. Notes: Theneighboring counties are Orange, Ventura, Riverside and San Bernardino. General Acute Care (GAC) hospitals are allnon-federal hospitals except psychiatric hospitals (acute or long term), chemical recovery hospitals and state correctionalfacilities. A GAC hospital is listed as having closed in 1998 if it appeared in the Utilization Report or Hospital FacilityListing for 1997 but not the 1998 or later years. Some hospitals that were incorrectly not listed in certain years were addedback to the data; a detailed list of the reporting errors is available on request.
that increased tax funding for emergency rooms and trauma centers has reduced pressure on thecounty’s health care system though, even with this additional funding, the system is still projectedto face a deficit of between US$ 300 and 600 million over the next 3 years. Thus, the possibilityof imminent hospital closures remains real.
The proposed closures are part of an ongoing trend in Southern California. Between 1997 and2002, Los Angeles County lost roughly 10% of its initial 131 hospitals (see Table 1). Since 2002,nine more general acute care hospitals have closed in Los Angeles County. Although considerablemedia attention has focused on the potential deleterious effects of these closures on access to careand health outcomes, surprisingly little is known about the impact of urban hospital closures onpatients.
The bulk of the literature on urban closures focuses on the supply side of the market: thedeterminants of closure and the operating efficiency of hospitals remaining in the market (seeLindrooth et al. (2003) for a good summary). This literature finds that nationally, closed hospitalstend to be small (fewer than 100 beds), financially distressed, for-profit facilities, operating withexcess capacity. They also tend to offer fewer services, such as neonatal intensive care units, orspecialized cardiac or emergency care services.
Scheffler et al. (2001) confirm that poor financial performance was a key predictor of hospitalclosures in California between 1995 and 2001. As shown in Table 2, the hospitals that closed inthe Los Angeles Region between 1997 and 2002 were typical of closures on other dimensionsas well. Most were small (the mean number of beds was 88) and all but two were for-profitfacilities. Nonetheless, these hospitals did supply services that are critical for certain patients.For example, about two-thirds offered emergency medical or cardiac services, such as by-passsurgery or cardiac catheterization. The impact of closing this type of hospital on the health andhealth care needs of residents in surrounding areas is ultimately, however, an empirical question.
Research on the impact of closures on access to care and health more generally has focusedlargely on rural hospitals (Bindman et al., 1990; Mullner et al., 1989; Rosenbach and Dayhoff,1995; Succi et al., 1997; US GAO, 1991). For obvious reasons, such studies have, at best, limitedimplications for considering the consequences of hospital closures in urban areas, such as LosAngeles County. A notable exception, Vigdor (1999), examines the effect of changes in the density

742 T.C. Buchmueller et al. / Journal of Health Economics 25 (2006) 740–761
Table 2Characteristics of closed hospitals affecting Los Angeles County residents
Facility name Full yearclosed
Ownershiptype
GAC beds,1997
Emergencyservices
Cardiacservices
Newhall Community Hospital 1998 For-profit N/A N/A N/APioneer Hospital 1998 For-profit 99 Yes YesWoodruff Community Hospital 1998 For-profit 66 Yes YesThompson Memorial Med Center 1999 For-profit 105 Yes YesKaiser Foundation—Norwalk 1999 Kaiser 96 No NoLakewood Regional Med Centera 1999 For-profit 69 No NoNorth Hollywood Med Center 1999 For-profit 85 Yes NoRio Hondo Hospitalb 1999 Non-profit 103 No NoSouth Bay Medical Center 1999 For-profit 136 Yes YesWashington Medical Center 2000 For-profit 81 Yes YesWest Valley Hospital 2002 Non-profit 139 Yes YesWestside Hospital 2002 For-profit 57 Yes NoSuncrest Hospital of Orange Countyc 1998 For-profit 74 No NoFriendly Hills Regional Med Centerc 1999 For-profit 113 Yes NoPacifica Hospitalc 1999 For-profit 45 Yes No
Source: OSHPD’s Annual Utilization Report of Hospitals, 1997–2001 and 2002 Hospital Facility Listing.a Clark Avenue Facility.b Rio Hondo officially closed on 5/04/2001 but its license was suspended on 8/24/1998 and is thus coded as having
effectively closed in 1999.c Hospital is located in Orange County. Hospitals in counties bordering Los Angeles are included when they are the
closest general acute care facility to some Los Angeles County residents.
of hospitals in Los Angeles County between 1984 and 1995 on rates of avoidable hospitalizationsand deaths in the hospital from heart attacks and motor vehicle accidents. As pointed out by theauthor, however, by focusing solely on hospital discharges, Vigdor (1999) cannot assess the effectof closures on the health of people who never make it to the hospital in an emergency or on peoplewho rely on hospital-based outpatient facilities.
In this paper, we address the gap in the literature by assessing the impact of hospital clo-sures in the Los Angeles Region on perceived access to care, health care utilization and healthoutcomes. We consider closures through their effect on distance from a resident’s home to thenearest hospital. Past work has shown that patients typically choose both providers and hospitals,particularly for acute conditions, based on proximity and reduced travel time (Cohen and Lee,1985; Dranove et al., 1993; Hadley and Cunningham, 2004; Luft et al., 1990; McClellan et al.,1994; McGuirk and Porell, 1984). Thus, increased distance may translate to reduced access tocare. While patients affected by a closure in urban areas often have other hospitals nearby,1 thereduction in hospital supply may lead to increased crowding at and reduced access to the facilitiesremaining in the market. As a result, some may forgo or delay care when obtaining it becomes moredifficult.
On the other hand, closures may have beneficial effects for nearby residents. Since closedhospitals are typically low-volume, poor-performers, health care outcomes might improve asresidents are forced to choose among the remaining higher volume hospitals. Similarly, closures
1 One recent study reports that in 90% of urban communities that experienced a closure between 1990 and 2000,emergency and inpatient care were still available within 10 miles of the closed facility (Department of Health and HumanServices, Office of the Inspector General, 2003).

T.C. Buchmueller et al. / Journal of Health Economics 25 (2006) 740–761 743
may shift some patients’ usual source of care from a hospital to physician offices or communityclinics, which are generally viewed as more appropriate sources of primary care.
To the extent that closures affect access and utilization, the effects are likely to vary withpatient characteristics. We expect the effect of closures to be greatest on seniors, who travelshorter distances to the hospital (Vigdor, 1999) and low-income patients, who are both less likelyto travel far and more likely to use the hospital as their “regular” source of care (Weissman andEpstein, 1994).2 Indeed, in a study of hospital choice for maternal delivery in the San FranciscoBay Area, Phibbs et al. (1993) find that Medi-Cal women rely more heavily on public trans-portation than privately insured women and are therefore more sensitive to distance. Given thehigher likelihood among Medi-Cal women of delivering at hospitals lacking specialized neonatalcare and with worse perinatal outcomes, the authors interpret distance as a barrier to effectivecare for the poor. Similarly, in a study using national data, Currie and Reagan (2003) find thatcentral-city black children living further from a hospital are less likely to have had a check-up, regardless of their insurance status. Both studies suggest that to the extent that closures forcenearby residents to travel further for care, poor women and children may be particularly adverselyaffected.3
There may also be important differences with respect to health conditions. Even if the closureof weaker, poorer performing hospitals improves the average quality of hospitals, closures mayhave negative consequences for certain types of patients. In particular, outcomes for patientsexperiencing health events requiring fast attention, such as injuries sustained in an accident ora heart attack (AMI) may be affected by small changes in travel distance (Herlitz et al., 1993).In contrast, we would not expect urban hospital closures to affect mortality from conditions likechronic ischemic heart disease, where immediate emergency care is less relevant.
Our analysis is based on two distinct sources of health data: household surveys conducted bythe Los Angeles County Department of Health Services (LACDHS) between 1997 and 2002, theperiod when most of the recent closures were occurring, and annual administrative zip code levelmortality data from the California Department of Health Services. With the survey data, whichprovide information on residential location, we can assess the impact of changes in hospitalproximity on perceived health care access and reported health care utilization. The administrativedata give us an independent source of information on health outcomes that is not subject toself-reporting bias.
We find little effect of increased distance to the nearest hospital on outpatient utilization andthe effects we do find are mixed. On a positive note, we find that increased distance is associatedwith an increase in the probability that respondents report a regular source of care as well as anincrease in the likelihood that this care is sought at a doctor’s office. Distance has little effect onperceived access to care in the population generally, though it is negatively related to perceivedaccess for seniors, who may rely more on hospitals. Some models suggest that hospital closuresmay be associated with reductions in the probability that uninsured residents receive hospital-intensive diagnostic care, such as colon cancer screenings. Not surprisingly, we find no effect of
2 Among children with a regular source of care in 1993, only 5% of the privately insured rely on a clinic or emergencyroom whereas 35% of publicly insured and 20% of uninsured do so (Bloom et al., 1997a). The breakdown by insurancestatus is similar for working-age adults (Bloom et al., 1997b).
3 Patients whose choice of hospital is determined largely by proximity may be vulnerable in other, less easily measuredways. For example, several studies indicate that within the same medical center, patients who travel farther to receiveelective care or even cancer treatment have better outcomes than similar patients with the same disease and receiving thesame treatment, but who live nearby (Ballard et al., 1994; Goodman et al., 1997; Lamont et al., 2003).

744 T.C. Buchmueller et al. / Journal of Health Economics 25 (2006) 740–761
increased distance on the receipt of other types of preventive care, such as HIV tests, pap smears,mammograms and flu shots that are commonly provided in non-hospital settings.
While the survey data point to some beneficial effects of hospital closures, the mortality datatell a different story. We find that increased distance to the nearest hospital is associated with anincrease in deaths from acute myocardial infarction and unintentional injuries suffered at home,but not from other causes, such as cancer or chronic heart disease, for which timely care is lessimportant. Thus, these results suggest that even the closure of small, private hospitals in largeurban areas presents challenges to the provision of timely emergency care.
2. Data and methods
2.1. Data sources
Our area of study, Los Angeles County, has roughly 10 million residents spread over about4000 square miles. The county is comprised of 88 cities, the largest of which, the city of LosAngeles, is home to roughly 40% of the county’s population but covers only about 10% of itsland. Another 10% of the population lives in unincorporated towns/areas.
We use several independent sources of data to study this area. The first is household level datafrom the Los Angeles County Health Surveys (LACHS), which were conducted by the LACDHSin 1997, 1999/2000 and 2002/2003. The LACHS, which surveys roughly 8000 adults, dependingon the year, asks several questions on perceived access to care and self-reported utilization.Specifically, the survey asks whether the individual has a usual source of care (and where it is),how they perceive their access to care (very to somewhat difficult versus very to somewhat easy)and whether or not they have received several different types of preventive care (colon cancerscreening, vaccines, HIV tests). In addition, it has detailed information about a respondent’s healthstatus, demographics, socio-economic status and medical insurance status. Importantly for thisanalysis, there is also information on the zip code of each respondent’s residence, which allowsus to link respondents to measures of distance to the nearest hospital.4
To examine the effect of distance to the nearest hospital on health outcomes, we use deathreports from California’s Department of Health Services. We use cause-specific mortality datafrom 1997 to 2001 to test for an effect of distance to the nearest hospital on mortality (by zipcode of decedents’ residence) from conditions for which access to timely emergency care islikely to be an important determinant of survival. Specifically, we examine the effect of distanceon the number of deaths from heart attacks and unintentional injuries sustained at home.5 Weconsider only injuries at home so as to avoid picking up accidents that occur far from a resident’sclosest hospital. As a specification check, we also consider the relationship between distanceand both cancer and chronic ischemic heart disease deaths, outcomes that should be not besensitive to how long it takes to get to the nearest hospital. A finding that distance is relatedto these outcomes would most likely be spurious, which would then cast doubt on our researchdesign.
To calculate changes in travel distances from the center of each zip code in Los Angeles Countyto the address of the nearest hospital, we use data from the 1997 to 2001 Office of Statewide
4 Zip codes are stripped from the publicly available LACHS data.5 Unintentional injuries are (1) transport accidents and their sequelae and (2) other external causes of accidental injury
and their sequelae. These are covered by ICD-10 codes V01-X59 and Y85-Y86.

T.C. Buchmueller et al. / Journal of Health Economics 25 (2006) 740–761 745
Health Planning’s (OSHPD’s) Annual Utilization Report of Hospitals 1997–2001, supplementedby OSHPD’s 2002 Hospital Facility Listing. We consider hospitals in the entire Los AngelesRegion, as the nearest hospital to county residents may lie in neighboring counties within theregion. Since changes in proximity to the hospital for LA County residents came almost exclusivelythrough closures, whereas residents from other parts of the region experience many changes dueto openings as well as closures (see Table 1), we restrict our analysis to LA County residents.6
2.2. Econometric specification
We use a quasi-experimental design to examine how changes in driving distance from thepopulation center of a zip code in Los Angeles County to the nearest hospital have affectedperceived access, self-reported health care utilization and actual health outcomes among residentsin that zip code.7 Essentially, we compare changes in access or health among individuals inareas where hospitals closed to changes among otherwise similar individuals in areas where theavailability of hospital services remained constant. One set of regressions uses the individual-leveldata from the LACHS, while another uses mortality data aggregated to the level of the zip code.For both types of data, the general form of the econometric specification is:
Yzt = α distancezt + X′β + δz + γt + εzt (1)
where the dependent variable, Y, includes the measures of access, utilization and health outcomesjust described. Control variables are represented by the vector X. The primary controls in theLACHS regressions are individual characteristics that are likely to affect medical care utilizationand perceived access, such as income, health insurance coverage and health status. We alsoinclude some neighborhood characteristics, such as the number of community health clinics in azip code and city-level unemployment rates.8 Since clinics open and close frequently in order toservice unmet health care needs, particularly those of vulnerable populations, clinic counts helpcapture community-wide changes in the supply of health services (US GAO, 1995; Royer, 2005).Similarly, city unemployment rates help control for any effect of local economic conditions onhealth.9
In our main specification, we include zip code fixed effects, δz, to account for time-invariantdifferences in demand that may exist across areas due to factors, such as the socioeconomiccharacteristics of the population. However, because hospital closures are quite rare, a possibledisadvantage of this estimation strategy is that the model is identified by changes affecting a fairlysmall percentage of the population. Therefore, as an alternative specification, we estimate models
6 LA County residents were affected by one opening, a Kaiser facility in Baldwin Park. Because it was located close toanother neighborhood facility, Santa Rosa Hospital later called Legacy Hospital of San Gabriel Valley, distance from thetwo affected zip codes to the nearest hospital was essentially unchanged.
7 The zip center coordinates from http://www.oseda.missouri.edu/uic/zip.resources.html are essentially a population-weighted average of the coordinates for the census blocks in a zip code area. They are virtually identical to the zip centercoordinates given by both Yahoo!® Maps and MapQuest®.
8 Annual unemployment rates are available through the California Economic Development Department’s “Labor ForceData on Sub-County Areas in California.” For cities missing unemployment rates, we use the county-year average. We alsoinclude an indicator for this substitution in the regressions. Clinics are listed in OSHPD’s Primary Care Clinic Listings.
9 Ruhm (2000, 2005) studies the relationship between health and state unemployment rates and finds reductions inmortality and improvements in health behaviors (e.g. physical inactivity and smoking) when the state economy weakens.Since these health improvements may occur partially through changes in leisure time, local unemployment rates maycapture similar trends.

746 T.C. Buchmueller et al. / Journal of Health Economics 25 (2006) 740–761
that replace the zip code dummies with city or “community” fixed effects, where the geographicunit is the city or town for areas outside of the city of Los Angeles and neighborhoods that arerelatively homogeneous in terms of economic and demographic characteristics (e.g. Brentwoodor Boyle Heights) are the unit within the city of Los Angeles. To the extent that these communitiesare relatively homogeneous with respect to demographics and other demand side variables, thisspecification exploits additional within-community differences in distance related to the locationof all hospitals, not just those that closed or opened during the period of analysis. In all models,we also include year fixed effects, γ t, to capture any county-wide trends in access and health.
Another possible limitation of (1) is that it assumes that the effect of distance is the samefor all residents of an area, which clearly may not be the case. To the extent that uninsuredpatients are more likely to use emergency departments and hospital-based clinics as a source ofprimary care, we would expect them to be more strongly affected by the distance to the nearesthospital. Similarly, seniors and lower income people are likely to face higher transportation costs,which would translate to a larger effect of distance on access and utilization. In the modelsusing the LACHS data, we test for these possible differential effects by estimating models inwhich the distance variable is interacted with separate indicators for Medi-Cal, Medicare and“private” insurance, where private insurance captures those with employer-sponsored, military orindividually purchased health insurance policies. We also estimate models on the sub-sample ofindividuals reporting an annual household income of less than US$ 30,000, about 70% of medianhousehold in the county in 2000. To simplify the tables, we do not separately report results forthe higher income group since they are typically not significantly different from the full sampleresults. In some cases, we also report results separately for all seniors as well as those reportinghousehold income less than US$ 30,000. We do not include insurance interactions for this groupsince nearly all the seniors in our sample report Medicare coverage.
In the models estimated using the LACHS, the regressions are at the respondent level andare weighted by the inverse probability that the respondent was included due to the samplingdesign. The LACHS outcomes studied are all dichotomous: whether the usual source of careis an emergency room or hospital-based clinic, whether or not the respondent believes she hasgood access to care, and whether or not the person has received several types of preventive careor diagnostic tests. Because we are including zip code or community fixed effects, however, weuse linear probability models to consistently estimate the effect of changes in distance on theseoutcomes.10
For our models of annual zip code deaths by cause, we use Poisson regression models tocapture the non-negative count nature of the data. The Poisson model also allows us to includezip code fixed without introducing the incidental parameters problem common to other non-linearmodels (see Cameron and Trivedi, 1998, pp. 280–2). We include controls for total deaths, deathsby homicide (to proxy for the general risk of the neighborhood) and the age distribution of deaths(to proxy for the age structure of the neighborhood) as well as the number of health clinics in azip code year. We also estimate specifications that include separate linear time trends for eachzip code to account for demographic or economic shifts within a zip code that are not commonacross areas. We analyze the number of deaths rather than the death rate because we do not have
10 We also estimated the LACHS regressions as probits; the results were very similar to the LPM results (see Buchmuelleret al., 2004). We chose to report the LPM results because in cases where there the number of observations per zip code issmall, the probit estimates may suffer from an “incidental parameters” problem and therefore be inconsistent. The mainargument against the LPM specification is that the model’s predictions can fall outside the [0, 1] interval. This is not amajor issue for the outcomes we study because the sample means are not close to the boundary of this interval.

T.C. Buchmueller et al. / Journal of Health Economics 25 (2006) 740–761 747
annual zip code level population data and any imputations based on changes in zip code levelpopulation from the 1990 and 2000 censuses will be captured in the linear, zip code specific timetrends included in these models.11
To correct the serial correlation in the error terms, we estimate the standard errors in allLACHS models using a block bootstrap method (Efron and Tibshirani, 1994), which sampleswith replacement the full number of zip codes in (267) in our sample.12 The standard errorsare calculated as the standard deviation of the coefficient estimates from 200 bootstrap samples.Because the mortality models have few observations (5 years) within each block (335 zip codes)and too few observations per block increases the bias of the bootstrap method (Hardle et al., 2003),we correct these standard errors by allowing for an arbitrary correlation of the error terms at thezip code level (Bertrand et al., 2004).13
3. Results
3.1. Descriptive statistics: LACHS
Table 3 presents summary statistics for LACHS respondents overall, for those living in zipcodes unaffected by closures, those living in affected zip codes before a change in distance andthose living in affected zip codes after a change in distance. In addition to being directly relevantto our analysis that uses the LACHS, these figures also provide useful context for interpreting thezip code level mortality analysis.
For the full sample, the average driving distance to the nearest hospital is 2.65 miles. Thefigures in the second and third columns show that the average distance was initially similar forindividuals living in zip codes that were affected by closures compared to individuals for whomthe distance did not change. As shown in column 4, zip codes that experienced hospital closuresduring this period had an increase in driving distance to the nearest hospital of almost 2 miles,from an average driving distance of about 2.4–4.2 miles. Within this group, the change in distanceassociated with a closure ranged from roughly a tenth of a mile to about 5 miles.
Other initial differences between the two groups suggest the importance of controlling forindividual characteristics and area fixed effects. The areas that lost hospitals are relatively affluentcompared to the rest of the county. This is evident in the mean socioeconomic characteristics ofrespondents in zip codes that did and did not experience an increase in distance to the closesthospital. Those who faced a change were significantly more likely to be white (62% versus 39%),U.S. citizens (89% versus 78%), English-speaking (88% versus 76%) and have a college or post-graduate degree (40% versus 30%). Respondents in affected zip codes were also more likely tohave private health insurance (58% versus 51%) and less likely to have Medi-Cal (2.5% versus8.2%) and have slightly better self-reported health and access to care. These demographic andsocioeconomic differences largely persist in the post-closure period (column 4).
11 The correlation between zip code population from the 1990 and 2000 census is 0.97. As a sensitivity check, weperformed this analysis (not shown here) on the set of zip codes with a 1990–2000 percentage population change betweenthe 5th and 95th percentile. The results are virtually identical.12 We drop zip codes with six or fewer respondents across all survey years. The median and mean zip code remaining in
the sample has about 100 respondents.13 Moreover, “clustering” performs well when the cross-sectional element of the panel, in this case the 335 zip codes, is
large and the time element small (5 years); see Kezdi (2003).

748 T.C. Buchmueller et al. / Journal of Health Economics 25 (2006) 740–761
Table 3Los Angeles County Health Survey summary statistics
Overall By change in distance to closest hospital
No change Pre-change Post-change
Hospital distance variableMiles to closest hospital (driving) 2.65 (0.018) 2.54 (0.019) 2.35 (0.055) 4.15 (0.068)
Outcome variablesHas regular source of care 0.781 0.782 0.753 0.817Go to MD’s office for care 0.621 0.616 0.621 0.703Go to ER or outpatient clinic for care 0.133 0.138 0.102 0.085Ease of access to health care 0.714 0.708 0.708 0.776Colon cancer screen (age >50) 0.438 0.436 0.449 0.464Received HIV test (age <65) 0.358 0.365 0.350 0.291
Health insurance statusInsured—private, empl, military 0.521 0.512 0.578 0.610Medi-Cal, non-Medicare 0.077 0.081 0.025 0.050Medicare 0.122 0.121 0.119 0.122
Individual characteristicsGender (male) 0.407 0.406 0.444 0.436Age 43 (0.11) 43 (0.12) 43 (0.51) 44 (0.43)Race
Hispanic 0.376 0.390 0.222 0.0287White 0.411 0.391 0.621 0.556Black 0.100 0.109 0.041 0.032Asian 0.094 0.091 0.093 0.100Pacific Islander 0.008 0.008 0.014 0.008American Indian 0.005 0.004 0.003 0.005Other 0.003 0.003 0.005 0.010
Citizen 0.784 0.777 0.885 0.847
Survey taken inEnglish 0.770 0.763 0.877 0.838Spanish 0.200 0.209 0.096 0.130Mandarin 0.010 0.009 0.012 0.011Cantonese 0.006 0.006 0.001 0.004Korean 0.008 0.007 0.012 0.010Vietnamese 0.005 0.004 0.001 0.005
Household incomeUS$ <10,000 0.115 0.121 0.066 0.064US$ 10,000–20,000 0.179 0.185 0.148 0.132US$ 20,000–30,000 0.119 0.122 0.120 0.103US$ 30,000–40,000 0.099 0.100 0.131 0.093US$ 40,000–50,000 0.080 0.081 0.091 0.079US$ 50,000–75,000 0.119 0.116 0.168 0.146US$ >75,000 0.154 0.149 0.173 0.239Missing 0.136 0.126 0.103 0.144
Education level8th grade or less 0.094 0.096 0.047 0.0539–12th grade 0.102 0.107 0.049 0.075HS graduate 0.213 0.215 0.206 0.204Some college 0.278 0.279 0.295 0.274College grad 0.203 0.196 0.270 0.257Post-grad degree 0.110 0.107 0.133 0.137

T.C. Buchmueller et al. / Journal of Health Economics 25 (2006) 740–761 749
Table 3 (Continued )
Overall By change in distance to closest hospital
No change Pre-change Post-change
Working statusFull-time 0.463 0.463 0.531 0.470Part-time 0.109 0.109 0.121 0.115Hours unknown 0.005 0.005 0.001 0.006Not working 0.161 0.163 0.151 0.140Retired 0.127 0.126 0.119 0.139Homemaker 0.095 0.095 0.014 0.123Unknown 0.038 0.039 0.060 0.018
Marital statusMarried 0.479 0.475 0.449 0.533Co-habitating 0.072 0.075 0.046 0.051Widowed 0.064 0.064 0.052 0.066Divorced 0.100 0.100 0.125 0.093Separated 0.035 0.036 0.033 0.026Never married 0.250 0.251 0.295 0.229
Household size 3.09 (0.011) 3.12 (0.012) 2.67 (0.051) 3.04 (0.044)
Health status and behaviorsBMI 24.0 (0.054) 24.1 (0.058) 23.6 (0.228) 24.1 (0.204)Self-assessed health: 1 = excellent, 5 = poor 2.50 (0.007) 2.51 (0.008) 2.35 (0.034) 2.34 (0.028)Diabetes 0.063 0.064 0.043 0.059Arthritis 0.173 0.174 0.168 0.168Heart disease 0.060 0.060 0.046 0.064Smoke cigarettes 0.160 0.162 0.209 0.144
Observations 23503 21012 925 1566
Notes: Standard errors for continuous variables are given in parenthesis. With the exception of the hospital data which arefrom OSHPD, data are from the (adult) Los Angeles County Health Survey (LACHS) 1997, 1999/2000 and 2002/2003.Miles to closest hospital is defined as the MapQuest® driving distance from the population centroid or in some cases thephysical center of a zip code to the closest hospital. Insurance and health status questions refer to time of survey. BMI isdefined as weight in kilograms divided by the square of height in meters. Self-assessed health status ranges from excellent(1) to poor (5). Colon cancer screens include colonoscopies and sigmoidoscopies among respondents 50 and over in theirlifetime. All other questions about diagnostic exams refer to the past 2 years. The flu shot refers to this year.
Tables 3 also presents the outcomes we examine.14 The figures show that nearly over three-quarters of respondents report having a usual source of care and that for the vast majority thatsource was a physician’s office (62% of all respondents or 80% of those with a usual source ofcare). The fact that only 13% of the sample report that an ER or hospital clinic is their usualsource of care suggests that the effect of closures on access to primary care may be limited.Comparing columns 3 and 4, it appears that hospital closures were associated with a shift inpatients’ usual source of care, to physician offices away from emergency rooms or hospital-basedoutpatient clinics, though these changes are not statistically significant. Simple mean comparisonsalso suggest that, with the exception of HIV screening, other dimensions of care and access seemto have improved after a hospital closure.
14 The measures of usual source of care and perceived access are defined for the full sample. In contrast, some of thequestions concerning the receipt of diagnostic care were targeted to specific relevant populations—e.g. individuals overage 50 for colon cancer screening.

750 T.C. Buchmueller et al. / Journal of Health Economics 25 (2006) 740–761
Table 4Marginal effect of distance to the closest hospital on source of care
Sample Full sample HH income US$ <30,000
Panel A: have a place where regular care is soughtDriving distance to hospital (miles) 0.017 (0.010) 0.017 (0.010) 0.027 (0.015) 0.028 (0.016)Miles × private insurance – 0.0002 (0.004) – 0.001 (0.006)Miles × Medi-Cal – −0.005 (0.005) – −0.003 (0.005)Miles × Medicare – −0.001 (0.004) −0.004 (0.005)Private insurance 0.259 (0.011) 0.259 (0.015) 0.260 (0.014) 0.258 (0.020)Medi-Cal 0.254 (0.012) 0.266 (0.018) 0.264 (0.014) 0.271 (0.019)Medicare 0.237 (0.015) 0.240 (0.018) 0.248 (0.017) 0.256 (0.021)Observed probability 0.781 0.781 0.714 0.714Observations 22338 22338 11916 11916
Panel B: respondent goes to ED or outpatient clinic if care is neededDriving distance to hospital (miles) −0.001 (0.006) 0.002 (0.006) 0.0008 (0.010) 0.001 (0.010)Miles × private insurance – −0.004 (0.002) – −0.007 (0.003)Miles × Medi-Cal – −0.004 (0.005) – −0.003 (0.006)Miles × Medicare – −0.003 (0.003) – −0.004 (0.005)Private insurance −0.077 (0.006) −0.067 (0.009) −0.108 (0.010) −0.091 (0.012)Medi-Cal −0.067 (0.015) 0.077 (0.022) 0.043 (0.017) 0.049 (0.024)Medicare −0.068 (0.013) −0.060 (0.016) −0.088 (0.018) −0.080 (0.022)Observed probability 0.133 0.133 0.197 0.197Observations 22020 22020 11715 11715
Panel C: respondent goes to a doctors office if care is neededDriving distance to hospital (miles) 0.017 (0.010) 0.013 (0.010) 0.017 (0.012) 0.013 (0.013)Miles × private insurance – 0.008 (0.003) – 0.009 (0.005)Miles × Medi-Cal – 0.0002 (0.006) – 0.0002 (0.007)Miles × Medicare – 0.003 (0.004) – 0.003 (0.004)Private insurance 0.343 (0.013) 0.322 (0.014) 0.343 (0.013) 0.322 (0.018)Medi-Cal 0.213 (0.017) 0.213 (0.022) 0.213 (0.017) 0.213 (0.025)Medicare 0.326 (0.020) 0.319 (0.020) 0.326 (0.020) 0.319 (0.022)Observed probability 0.619 0.619 0.486 0.486Observations 22276 22276 11836 11836
Notes: Standard errors are computed using a block-bootstrap with 200 bootstrap samples and are shown in parenthesis.Regressions include survey year and zip code fixed effects and are estimated using survey weights. They also control forage, age-squared, gender, household size and its square, race (7 categories), citizenship, language the survey was taken in(6), household income (6), education (6), current employment status (6) and marital status (6).
3.2. Linear probability regression results: access to care and preventive screening
The linear probability regression results for these outcomes are reported in Table 4 (usualsource of care and place of care), Table 5 (perceived access) and Table 6 (diagnostic care). All“source of care” and access questions are point in time, without reference to a time period. Forsake of brevity, we do not report the estimated effects of health-related controls but these areinteresting in their own right and are available from the authors upon request.15
15 For example, these results confirm that more vulnerable patients (e.g. those with poor self-reported health status anddiabetics) are more likely to use an ED or hospital based clinic as their regular source of care. Similarly, those with poorself-reported health status and arthritics report more difficulty accessing care.

T.C.B
uchmueller
etal./JournalofHealth
Econom
ics25
(2006)740–761
751
Table 5Marginal effect of distance to the closest hospital on reported ease of access to health care services
Sample Full HH income US$ <30,000 Age ≥65
All Inc US$ <30,000
Distance to hospital (miles) 0.001 (0.010) 0.002 (0.010) −0.012 (0.018) −0.015 (0.018) −0.040 (0.022) −0.052 (0.036)Miles × private insurance – −0.001 (0.003) – 0.005 (0.005) – –Miles × Medi-Cal – 0.008 (0.005) – 0.011 (0.006) – –Miles × Medicare – −0.001 (0.004) – 0.004 (0.005) – –Private insurance 0.290 (0.009) 0.291 (0.012) 0.316 (0.012) 0.307 (0.017) 0.107 (0.043) 0.106 (0.053)Medi-Cal 0.264 (0.013) 0.243 (0.020) 0.288 (0.016) 0.262 (0.022) 0.013 (0.084) 0.073 (0.098)Medicare 0.289 (0.017) 0.290 (0.029) 0.299 (0.020) 0.290 (0.024) 0.100 (0.043) 0.080 (0.042)Probability 0.716 0.716 0.605 0.605 0.887 0.870Observations 21848 21848 11568 11568 2807 1858
Notes: Standard errors are computed using a block-bootstrap with 200 bootstrap samples and are shown in parenthesis. Regressions include survey year and zip code fixed effectsand are estimated using survey weights. They also control for age, age-squared, gender, household size and its square, race (7 categories), citizenship, language the survey wastaken in (6), household income (6), education (6), current employment status (6) and marital status (6).

752 T.C. Buchmueller et al. / Journal of Health Economics 25 (2006) 740–761
Table 6Marginal effect of distance to the closest hospital on colon cancer screening
Sample Full sample HH income US$ <30,000
Panel A: models using zip code fixed effectsDistance to hospital (miles) 0.008 (0.020) −0.009 (0.021) 0.013 (0.032) −0.001 (0.026)Miles × private insurance – 0.018 (0.006) – 0.022 (0.009)Miles × Medi-Cal 0.017 (0.015) 0.022 (0.017)Miles × Medicare 0.018 (0.007) 0.018 (0.010)Private insurance 0.099 (0.021) 0.057 (0.025) 0.104 (0.027) 0.052 (0.036)Medi-Cal 0.077 (0.035) 0.037 (0.052) 0.077 (0.037) 0.028 (0.050)Medicare 0.084 (0.020) 0.041 (0.027) 0.089 (0.027) 0.047 (0.036)Observed probability 0.441 0.441 0.421 0.421No. of observations 6971 6971 3754 3754
Panel B: models using community fixed effectsDistance to hospital (miles) 0.002 (0.004) −0.012 (0.006) 0.002 (0.006) −0.013 (0.008)Miles × private insurance – 0.016 (0.003) – 0.019 (0.010)Miles × Medi-Cal 0.017 (0.016) 0.022 (0.016)Miles × Medicare 0.016 (0.008) 0.018 (0.010)Observed probability 0.441 0.441 0.421 0.421No. of observations 6971 6971 3754 3754
See notes to Table 4.
Panel A of Table 4 looks at whether the respondent has a “particular regular source of carewhere he/she goes most often.” Columns 1 and 3 consider the main distance effect alone forthe full and low-income sub-samples; columns 2 and 4 include the interactions between healthinsurance (“private”, Medi-Cal or Medicare) and distance. All results are for the model with zipcode fixed effects. The models with community fixed effects (available upon request) yield similarresults.
In both the full and low-income samples, hospital closures appear to increase the proba-bility of reporting a usual source of care. The effect is largest for the low-income sample,where a 1 mile increase in distance to the nearest hospital is associated with an almost 4%(or 2.7 percentage points off a base of 71.4%) increase in the likelihood of reporting a par-ticular place where care is sought. One possible explanation for this result is that around thetime of a closure, county or city authorities may have increased outreach efforts to encourageresidents who had relied on the hospital emergency room or its outpatient clinic (but perhapsdid not view these as a “usual” source of care) to find an alternative. Similarly, residents mayhave responded to the considerable media attention given to hospital closures by identifyingan alternative source of care. Physicians or clinics that serve low-income populations mayhave also seen closures as a business opportunity and either moved into the area or marketedtheir services more aggressively. Finally, given that we only have 3 years of data, we cannotrule out that these results simply reflect differential improvements in access to care across theclosure and non-closure areas that might have occurred even in the absence of hospital clo-sures.
The results in Panels B and C, however, suggest a mechanism by which any increases inreporting a regular source of care might have occurred. Although quite imprecisely estimated,Panel B suggests that for insured patients, increased distance to the hospital may be associatedwith a decrease in reliance on an ED or clinic when sick. Panel C suggests that closurescoincide with an increased reliance on a physician’s office, particularly for insured residents.

T.C. Buchmueller et al. / Journal of Health Economics 25 (2006) 740–761 753
In both the full and low-income samples, the results suggest a roughly 1–2% increase inreporting that a doctor’s office is the usual place of care. Both the magnitude and precision ofthe interactions, suggest that these effects are concentrated among those with private healthinsurance.
Table 5 takes the analysis a step further by asking how closures and the subsequent shifting ofsources of care affect perceived access. Although this variable is subjective and may not be well-defined across respondents, we find it interesting nonetheless to examine how it has changed withincreased distance to the hospital. In addition to considering the full and low-income samples,we also study all respondents aged 65 and over (column 5) as well as those seniors reportinghousehold income under US$ 30,000 (column 6).
Across all residents, increased distance appears to have little effect on perceived access to care.This is not surprising, given that such a small fraction of the overall population rely on hospitalsas their usual source of care. However, the results for the “vulnerable” subpopulations offer somesupport for the hypothesis that the impact of closures should be felt most acutely by populationsthat have difficulty traveling farther for care. For adults over age 65, we find that a 1 mile increasein distance to the hospital is associated with a roughly 4 percentage point decline in ease of accessto care, statistically distinguishable from 0 below the 10% level. Similarly, the point estimates forthe low-income respondent suggest a 1-mile increase in the distance to the nearest hospital resultsin a roughly 2% decrease in ease of obtaining health care for those without health insurance,though this effect is imprecisely estimated. As with the source of care regressions, the results formodels using community fixed effects yield qualitatively similar results, although they are evenless precisely estimated.
While reported source of care and perceived access are clearly important, we care ultimatelyabout the effect of hospital closures on health services utilization and health outcomes. Therefore,we examine the effect of changes in the distance to the nearest hospital on use of health careservices. Table 6 considers colon cancer screenings (colonoscopy or sigmoidoscopy) in individualsover 50.16 We do not find a statistically significant effect of distance when we control for zip codefixed effects (Panel A).
However, the results from less restrictive specifications that controls for community fixedeffects suggest a statistically significant negative effect of distance on screening for the unin-sured (Panel B, columns 2 and 4). Estimates from the full sample indicate that a 1 mileincrease in distance is associated with a decline of 1.2 percentage points in the probabilitythat an uninsured respondent reports having been screened. This effect is fully offset by healthinsurance.
Finally, in models not reported, we examined the effect of distance on HIV tests for adults underage 65, PAP smear tests for women 18 and over, mammograms for women over 40, and flu shotsfor seniors, all within the last 2 years. Compared to the other types of screening, there is less reasonto expect an effect of distance on these outcomes. PAP smears and HIV tests can be administeredanywhere and are commonly provided in physicians’ offices. Similarly, mammograms are oftengiven in dedicated, non-hospital based facilities and flu shots are provided at an even broaderrange of places. It is not surprising, then, that for these outcomes we find no discernable effect ofdistance to the nearest hospital.
16 The question was asked of those 40 and older in 1997 but only those 50 and older in subsequent surveys. The referenceperiod for this question changes after the 1997 survey, from asking about tests in the last 2 years to tests at any point intime. This change biases us against finding a deleterious effect as the 1997 baseline (pre-closure) rate of screening in azip code is by definition less than (or equal to) the lifetime screening rate.
754 T.C. Buchmueller et al. / Journal of Health Economics 25 (2006) 740–761
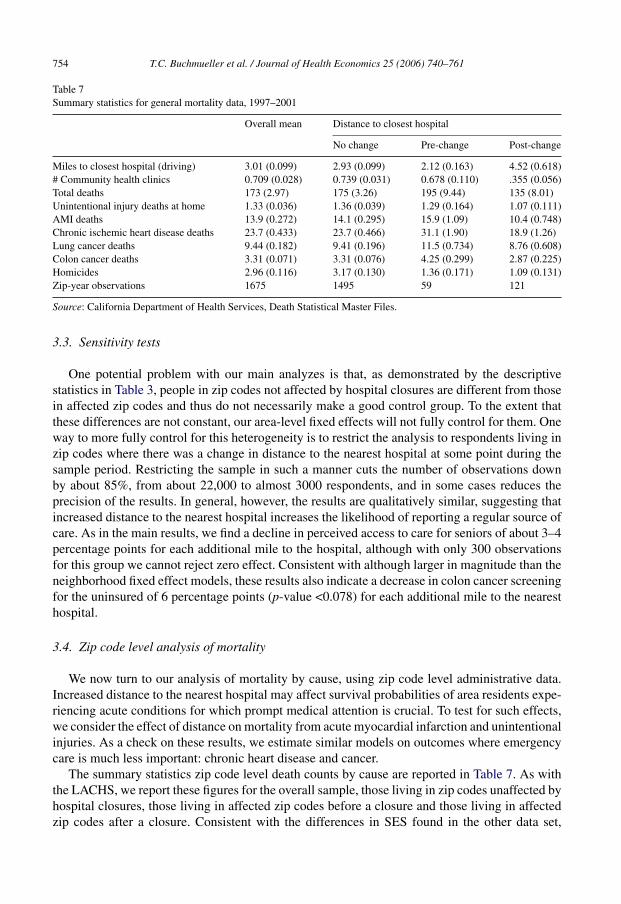
Table 7Summary statistics for general mortality data, 1997–2001
Overall mean Distance to closest hospital
No change Pre-change Post-change
Miles to closest hospital (driving) 3.01 (0.099) 2.93 (0.099) 2.12 (0.163) 4.52 (0.618)# Community health clinics 0.709 (0.028) 0.739 (0.031) 0.678 (0.110) .355 (0.056)Total deaths 173 (2.97) 175 (3.26) 195 (9.44) 135 (8.01)Unintentional injury deaths at home 1.33 (0.036) 1.36 (0.039) 1.29 (0.164) 1.07 (0.111)AMI deaths 13.9 (0.272) 14.1 (0.295) 15.9 (1.09) 10.4 (0.748)Chronic ischemic heart disease deaths 23.7 (0.433) 23.7 (0.466) 31.1 (1.90) 18.9 (1.26)Lung cancer deaths 9.44 (0.182) 9.41 (0.196) 11.5 (0.734) 8.76 (0.608)Colon cancer deaths 3.31 (0.071) 3.31 (0.076) 4.25 (0.299) 2.87 (0.225)Homicides 2.96 (0.116) 3.17 (0.130) 1.36 (0.171) 1.09 (0.131)Zip-year observations 1675 1495 59 121
Source: California Department of Health Services, Death Statistical Master Files.
3.3. Sensitivity tests
One potential problem with our main analyzes is that, as demonstrated by the descriptivestatistics in Table 3, people in zip codes not affected by hospital closures are different from thosein affected zip codes and thus do not necessarily make a good control group. To the extent thatthese differences are not constant, our area-level fixed effects will not fully control for them. Oneway to more fully control for this heterogeneity is to restrict the analysis to respondents living inzip codes where there was a change in distance to the nearest hospital at some point during thesample period. Restricting the sample in such a manner cuts the number of observations downby about 85%, from about 22,000 to almost 3000 respondents, and in some cases reduces theprecision of the results. In general, however, the results are qualitatively similar, suggesting thatincreased distance to the nearest hospital increases the likelihood of reporting a regular source ofcare. As in the main results, we find a decline in perceived access to care for seniors of about 3–4percentage points for each additional mile to the hospital, although with only 300 observationsfor this group we cannot reject zero effect. Consistent with although larger in magnitude than theneighborhood fixed effect models, these results also indicate a decrease in colon cancer screeningfor the uninsured of 6 percentage points (p-value <0.078) for each additional mile to the nearesthospital.
3.4. Zip code level analysis of mortality
We now turn to our analysis of mortality by cause, using zip code level administrative data.Increased distance to the nearest hospital may affect survival probabilities of area residents expe-riencing acute conditions for which prompt medical attention is crucial. To test for such effects,we consider the effect of distance on mortality from acute myocardial infarction and unintentionalinjuries. As a check on these results, we estimate similar models on outcomes where emergencycare is much less important: chronic heart disease and cancer.
The summary statistics zip code level death counts by cause are reported in Table 7. As withthe LACHS, we report these figures for the overall sample, those living in zip codes unaffected byhospital closures, those living in affected zip codes before a closure and those living in affectedzip codes after a closure. Consistent with the differences in SES found in the other data set,

T.C. Buchmueller et al. / Journal of Health Economics 25 (2006) 740–761 755
there were fewer homicide deaths in zip codes experiencing a change in distance. In contrast,over the whole period there was no significant difference in total deaths from heart attacks orunintentional injuries. However, the number of deaths overall and by all reported causes declinedin zip codes experiencing an increase in distance to the nearest hospital (columns 3 and 4). Incontrast, deaths from all reported causes in zip codes unaffected by closures remained remarkablyconstant over this period (not shown here). Thus, to the extent that our models do not fully capturethese differential trends, we risk understating any negative effects of delays in the receipt of timelyemergency care.
The mortality regression results are reported in Table 8. Panel A considers the simple effectof changes in distance to the closest hospital on deaths by type. Panel B adds some flexibility tothe model by allowing for a separate post-closure intercept (or a level effect) for the impacted zipcodes.
As shown in Panel A, for AMI deaths, the basic model indicates that a 1 mile increase indistance leads to a nearly a 6.5% increase in the number of deaths or just under one additionaldeath from a heart attack per zip code year (column 1). The magnitude of this effect is almostidentical when we include zip code specific time trends (column 2). This result is consistent withthe American Heart Association (2003) claim that the survival probability after cardiac arrestdecreases by 7–10% for every minute without treatment.
We also find increases in deaths from unintentional injuries sustained at home. A 1 mile increasein distance to the nearest hospital is associated with an 11–20% increase in the number of deathsfrom unintentional injuries, with the larger effect coming from the model with the zip code specifictime trends. Although these magnitudes seem large, deaths from injuries sustained at home arequite rare. Thus, these magnitudes imply that the typical hospital closure is associated with fewerthan 0.5 additional deaths per zip code year.
In contrast, the estimated relationship between changes in distance to the nearest hospitaland deaths from chronic heart disease or cancer17 are rather imprecisely estimated, and in thecase of chronic heart disease is of opposite sign. Though not presented here for sake of brevity,this invariance to distance is also found for deaths from chronic pulmonary obstructive disorder(COPD), Alzheimer’s disease and diabetes. We take these null results as some confirmation thatthe heart attack and unintentional injury findings are picking up real effects of changes in distanceto the nearest hospital rather than some unobserved factors affecting deaths more generally inthese zip codes.
Panel B largely confirms the findings from our basic model, that the increased distance to theclosest hospital induced by closures is associated with increases in deaths from heart attacks andunintentional injuries but has no clear impact on other causes of death. Interestingly, however,these increases appear to be partially offset by reductions caused by closing these poor perform-ing hospitals. In other words, closures may induce some survival benefit by forcing people tobe transported to higher volume hospitals, with more sophisticated equipment and more expe-rienced staff. This model should be taken only as suggestive, as we likely do not have enoughvariation to estimate both the effect of closures and a distinct effect of distance. In other words,given how few hospitals closed, it is not clear that we can distinguish a “pure closure” effect,
17 We also estimated separate models for lung and colon cancer. In the colon cancer models, the coefficient on distanceis negative, though not statistically significant. The results for lung cancer are small (1–2%) but borderline significant,suggesting that these deaths may increase with distance to the hospital. Unlike the results for AMI or unintentional injuries,however, these results decrease in both magnitude and precision when we limit the sample to zip codes that had at least10 deaths of any cause in a given year. This suggests that the lung cancer results may be driven by outliers.

756T.C
.Buchm
uelleretal./JournalofH
ealthE
conomics
25(2006)
740–761
Table 8Poisson models of death counts: percentage change in deaths due to a mile increase in distance to the hospital in Los Angeles County
AMI Unintentional injuries, home Chronic heart disease All cancer
Panel A: changes in distanceMiles 6.45 (1.89) 7.17 (4.20) 11.7 (6.45) 20.4 (12.8) −1.34 (1.33) −1.82 (3.35) 0.85 (0.61) 2.14 (1.67)Zip trends No Yes No Yes No Yes No YesMean deaths 14 14 1.3 1.3 24 24 39 39Observations 1675 1675 1675 1675 1675 1675 1675 1675
Panel B: separate effect of distance and closureMiles 11.4 (4.90) 17.9 (6.46) 55.1 (20.8) 80.6 (39.2) −0.30 (0.65) 0.37 (1.68) −0.48 (0.84) 0.02 (1.45)Closure −11.0 (10.1) −22.7 (12.8) −52.7 (13.6) −60.8 (18.2) −2.37 (3.77) −8.13 (5.73) 6.28 (3.10) 9.09 (6.50)Zip trends No Yes No Yes No Yes No YesMean deaths 14 14 1.3 1.3 24 24 39 39Observations 1675 1675 1675 1675 1675 1675 1675 1675
Notes: Standard errors are cluster-adjusted by zip code and shown in parenthesis. The key independent variable is the driving distance from each zip code population center tothe closest hospital in a given year. All models also control for total deaths, deaths by homicide, the age distribution of deaths and the number of community health clinics, all atthe zip code year level. They also include zip code and year fixed effects. Where indicated, zip code specific time trends are also included. Zip codes with fewer than five deathsin any given year are excluded as are zip codes that do not have any deaths in all years. Since the mean of the dependent variable in a Poisson regression model is parameterizedas µi = exp(X′
iβ), the percentage change in expected deaths from a unit change in distance is given by 100 × [exp(βk) − 1].

T.C.B
uchmueller
etal./JournalofHealth
Econom
ics25
(2006)740–761
757
Table 9Specification checks of Poisson models of death counts
AMI Unintentional injuries, home Chronic heart disease All cancers
Panel A: all deaths in LA County zip codes, controlling only for total deathsMiles 6.01 (1.88) 6.56 (4.12) 14.1 (6.26) 13.03 (2.43) −1.55 (1.25) −2.02 (3.37) 0.56 (0.64) 1.77 (1.90)Zip trends No Yes No Yes No Yes No Yes
Panel B: deaths in LA County zip codes where closest hospital is not a KaiserMiles 6.87 (1.96) 9.63 (3.42) 12.2 (6.71) 23.7 (13.4) −1.43 (1.35) −2.05 (3.30) 0.86 (0.62) 2.41 (1.71)Mean deaths 14 14 1.3 1.3 24 24 39 39Observations 1615 1615 1615 1615 1615 1615 1615 1615
Panel C: deaths in LA zip codes where closest hospital had an EDMiles 8.21 (1.98) 8.45 (5.36) 7.99 (7.28) 19.2 (21.1) −1.19 (1.36) −1.35 (4.041 1.25 (0.76) 1.03 (1.83)Mean deaths 9.5 9.5 3.6 3.6 16 16 39 39Observations 1260 1260 1260 1260 1260 1260 1260 1260
Panel D: all deaths as a function of distance to the closest EDMiles 0.32 (2.06) 3.93 (2.54) 3.28 (6.88) −0.64 (11.4) −0.76 (1.17) −2.29 (1.73) 0.47 (0.70) −0.22 (1.08)Mean deaths 9.5 9.5 3.6 3.6 16 16 39 39Observations 1675 1675 1675 1675 1675 1675 1675 1675
Panel E: deaths in zip codes affected by closuresMiles 8.23 (2.21) 9.36 (3.72) 39.0 (11.5) 31.3 (19.9) −0.91 (1.60) −1.83 (3.99) 0.92 (0.84) 0.54 (1.34)Mean deaths 12 12 1.3 1.3 23 23 39 39Observations 180 180 180 180 180 180 180 180
Notes: Standard errors are cluster-adjusted by zip code and shown in parenthesis. The key independent variable is the driving distance from each zip code population center tothe closest hospital in a given year. All models also control for total deaths, deaths by homicide, the age distribution of deaths and the number of community health clinics, allat the zip code year level. They also include zip code and year fixed effects. Within each set of cause of death results, the second column also includes zip code specific timetrends. Zip codes with fewer than five deaths in any given year are excluded, as are zip codes that do not have any deaths in all years. Since the mean of the dependent variablein a Poisson regression model is parameterized as µi = exp(X′
iβ), the percentage change in expected deaths from a unit change in distance is given by 100 × [exp(βk) − 1].

758 T.C. Buchmueller et al. / Journal of Health Economics 25 (2006) 740–761
as captured by the closure dummy, from a non-linear effect of distance or from an effect ofoutliers.
3.5. Sensitivity tests
Table 9 shows results from several sensitivity tests that broadly confirm the basic mortalityfindings. First, to test the sensitivity of our results to the choice of controls, we re-estimated themortality models but only included total annual deaths in a zip code, zip code and year fixedeffects, and in some specifications, zip code-specific time trends. The results from these shorterregressions (Panel A) are almost indistinguishable from those in the fully specified models.
We next excluded from our sample the 12 zip codes where Kaiser was the closest hospital atsome point during the sample period since Kaiser facilities are typically not available to the broadpublic. Not surprisingly, given how few zip codes are dropped, the results (Panel B) are againalmost identical to those in Table 8, although the AMI results with zip code specific time trendssuggests a slightly larger (9.6%, p-value <0.005) increase in AMI deaths.
We took two approaches to testing whether our results were capturing the effects of changesin timely access to urgent or emergency care services. We first eliminated from the sample all zipcodes where the closest hospital did not have an emergency room (Panel C). Doing so reducesthe sample size by 25%, but does not materially affect the results. Here again, the estimates arequite similar to and not statistically significantly different from the main results in Table 8.
We next used the full sample and, rather than eliminating zip codes, changed our definitionof closures to be limited to the closure of EDs. These results (Panel D) are quite impreciselyestimated. Based on the 95% confidence intervals of the estimated effects, we cannot reject theresults from our models in Table 8 but neither can we reject zero. One reason for this imprecisionmay be that since we cannot identify based on our current data where patients of different typesare taken and treated nor how hospitals change their services on the intensive margin, e.g. byscaling up or scaling down their ED’s, this new coding of closures may be somewhat arbitrary. Incontrast, when we consider hospital closures, we are clearly capturing the loss of an entire generalservice medical facility.
Lastly (in Panel E), we restricted the sample to zip codes where there was a change in distance tothe nearest hospital at some point during the sample period. As in the LACHS models, we did thisbecause the control group differs in many important ways (for example, insurance status, incomeand so on) from the group affected by closures. Despite the considerable reduction in sample sizecaused by this restriction, the magnitudes of the estimated impacts of a 1 mile increase in distanceto the hospital on deaths from AMI and unintentional injuries are virtually the same as in ourfull model and in the main specification (without zip code specific time trends) are statisticallysignificant below the 1% level.
4. Conclusions
While urban communities across the country have experienced a string of small hospital clo-sures over the past decade, Los Angeles County is unique in just how many closures have occurred.Should excess hospital capacity continue to grow in other urban areas, however, the Los Angelesexperience may become more common. The present study will provide useful lessons for thesecommunities.
Like past work showing that urban hospital closures improve the efficiency of the health caresystem by shifting care to lower cost facilities (Lindrooth et al., 2003), we find that hospital

T.C. Buchmueller et al. / Journal of Health Economics 25 (2006) 740–761 759
closures may shift care to doctor’s offices, generally considered an appropriate and cost-effectivesource of regular care (Baker and Baker, 1994). Although these efficiency savings from hospitalclosures are extremely important, they tell only part of the story.
We find some evidence that proximity to a hospital influences perceived access to care for themore vulnerable residents in Los Angeles County. Specifically, seniors, who tend to rely moreon hospitals, report more difficulty accessing care as a result of closures. Although impreciselyestimated, this result is found across samples and specifications. The subjective nature of thisoutcome makes it somewhat difficult to interpret. A widely publicized hospital closure may givenearby residents the impression that their access to care has deteriorated, even if there is littlechange in their actual use of care. However, the fact that the same group reports a decline incolon cancer screening suggests that there may be something real behind the change in perceivedaccess. Nonetheless, these results should be taken as suggestive. A small sample and changes inthe question across surveys, in the case of colon cancer screening, prevent us from obtaining goodestimates of these effects.
Using separate administrative data, we also find evidence that increased distance to the nearesthospital is associated with higher mortality counts from emergent conditions, such as heart attacksand possibly from unintentional injuries. These results are quite robust across sensitivity checks,although the weakness of the results using changes in distance to the nearest emergency departmentsuggests that they should be interpreted with some caution. That we consistently find no impactof closures on causes of mortality that should be unaffected by timely access to care, however,provides additional support for the conclusion that the results for heart attacks and injuries reflecta real effect of hospital closures and not spurious correlation. Should they hold up to furtherinvestigation, these results suggest that social welfare may be increased by promoting low-cost,non-hospital based ways of treating emergent conditions after a local hospital closure.
Acknowledgements
We thank Tom Y. Chang, Sendhil Mullainathan, Heather Royer, Antoinette Schoar, Gary Solon,Robert Town and seminar participants at the NBER Summer Institute Health Care meetings, theUniversity of Michigan, the University of Illinois, Urbana-Champaign, the University of Cali-fornia, Irvine’s Health Policy Research Center, the Association for Public Policy Analysis andManagement’s 2003 Fall Conference and the International Health Economics Association’s FifthWorld Congress for helpful comments. We are extremely grateful to Jim Winters at Califor-nia’s Office of Statewide Health Planning and Development for answering numerous questionsabout the Annual Utilization Reports. Yani Lam, Jennifer Savage and Abishek Tiwari providedexcellent research assistance. Tom Y. Chang graciously offered his technical skills in automat-ing MapQuest® and Yahoo! Maps®. Financial support was provided by the California PolicyResearch Center’s Program on Access to Care. All mistakes are our own. Jacobson also acknowl-edges support from the Robert Wood Johnson Foundation’s Scholars in Health Policy ResearchProgram.
References
American Heart Association, 2003. Heart and Stroke Facts. American Heart Association.Baker, L.C., Baker, L.S., 1994. Excess cost of emergency department visits for non-urgent care. Health Affairs 13 (5),
162–171.

760 T.C. Buchmueller et al. / Journal of Health Economics 25 (2006) 740–761
Ballard, D.J., Bryant, S.C., et al., 1994. Referral selection bias in the Medicare hospital mortality prediction model: arecenters of referral for Medicare beneficiaries necessarily centers of excellence? Health Services Research 28 (6),771–784.
Bertrand, M., Duflo, E., Mullainathan, S., 2004. How much should we trust differences-in-differences estimates? TheQuarterly Journal of Economics 119 (1), 249–275.
Bindman, A.B., Keane, D., Lurie, N., 1990. A public hospital closes: impact on patient’s access to care and health status.Journal of the American Medical Association 264 (22), 2899–2904.
Bloom, B., et al., 1997a. Access to health care Part 1: children, National Center for Health Statistics. Vital Health Statistics10 (196).
Bloom, B., et al., 1997b. Access to health care Part 2: working-age adults, National Center for Health Statistics. VitalHealth Statistics 10 (197).
Buchmueller, T., Jacobson, M., Wold, C., 2004. How Far to the Hospital: The Effect of Hospital Closures on Access toCare. NBER WP 10700.
Cameron, A.C., Trivedi, P.K., 1998. Regression Analysis of Count Data. Cambridge University Press, New York,NY.
Cohen, M., Lee, H.L., 1985. The determinants of spatial distribution of hospital utilization in a region. Medical Care 23(1), 27–38.
Currie, J., Reagan, P., 2003. Distance to hospital and children’s use of preventive care: is being closer better and for whom?Economic Inquiry 41 (3), 378–391.
Dranove, D., White, W.D., Wu, L., 1993. Segmentation in local hospital markets. Medical Care 31 (1), 52–64.Efron, B., Tibshirani, R., 1994. An Introduction to the Bootstrap, in Applied Statistics and Probability, no. 57. Chapman
and Hall, New York.Goodman, D.C., Fisher, E., et al., 1997. The distance to community medical care and the likelihood of hospitalizations:
is closer always better? American Journal of Public Health 87 (7), 1144–1150.Hadley, J., Cunningham, P., 2004. Availability of safety net providers and access to care of uninsured persons. Health
Services Research 39 (5), 1528–1546.Hardle, W., Horowitz, J.L., Kreiss, J.-P., 2003. Bootstrap methods for time series. International Statistical Review 71 (2),
435–459.Herlitz, J., Hartford, M., et al., 1993. Delay time between onset of myocardial infarction and start of thrombolysis in
relation to prognosis. Cardiology 82, 347–353.Kezdi, G., 2003. Robust Standard Errors Estimation in Fixed-Effects Panel Models. Central European University,
Mimeo.Lamont, E.B., Hayreh, D., et al., 2003. Is patient travel distance associated with survival on phase II clinical trials in
oncology? Journal of the National Cancer Institute 95 (18), 1370–1375.Lindrooth, R.C., Lo Sasso, A.T., Bazzoli, G.J., 2003. The effect of urban hospital closures on markets. Journal of Health
Economics 22 (5), 691–712.Luft, H.S., Garnick, D.W., et al., 1990. Does quality influence choice of hospital? Journal of the American Medical
Association 263 (21), 2899–2906.McClellan, M., McNeil, B.J., Newhouse, J.P., 1994. Does more intensive treatment of myocardial infarction decrease
mortality in the elderly. Journal of the American Medical Association 272 (11), 859–866.McGuirk, M.F., Porell, F., 1984. Spatial patterns of hospital utilization: the impacts of distance and time. Inquiry 21 (1),
84–95.Mullner, R., Robert, M., Rydman, J., et al., 1989. Rural community hospitals and factors correlated with risk of closure.
Public Health Reports 104, 315–325.Office of Statewide Health Planning and Development, 2001. California Perspectives in Healthcare, 1999, second ed.Phibbs, C.S., Mark, D.H., et al., 1993. Choice of hospital for delivery a comparison of high-risk and low-risk women.
Health Services Research 28 (2), 201–222.Rosenbach, M.L., Dayhoff, D.A., 1995. Access to care in rural America: impact of hospital closures. Health Care Financing
Review 17 (1), 15–37.Royer, H., 2005. The Response to a Loss in Medicaid Eligibility: Pregnant Immigrant Mothers in the Wake of Welfare
Reform. University of Michigan, Mimeo.Ruhm, C., 2005. Healthy living in hard times. Journal of Health Economics 24 (2), 341–363.Ruhm, C., 2000. Are recessions good for your health. Quarterly Journal of Economics 115 (2), 617–650.Scheffler, R., Kagan, R., et al., 2001. California’s Closed Hospitals, 1995–2000. Report of the Nicholas C. Petris Center.Succi, M.J., Lee, S.D., Alexander, J.A., 1997. Effects of market position and competition on rural hospital closures. Health
Services Research 31 (6), 679–699.

T.C. Buchmueller et al. / Journal of Health Economics 25 (2006) 740–761 761
US General Accounting Office, 1991. Rural Hospitals: Federal Efforts Should Target Areas Where Closures WouldThreaten Access to Care. GAO Report HRD-91-41.
US General Accounting Office, 1995. Community Health Centers. GAO Report HEHS-95-138.US Office of the Inspector General, 2003. Trends in Urban Hospital Closure, 1990–2000. OEI 04-02-00611.Vigdor, E., 1999. The Impact of Urban Hospital Closures on Health. Duke University, Mimeo.Weissman, J.S., Epstein, A.M., 1994. Falling Through the Safety Net: Insurance Status and Access to Health Care. Johns
Hopkins UP, Baltimore.