How does the toad's visual system discriminate different...
11
Biol. Cybern. 64, 251-261 (1991) Biological Cybernetics Springer-Verlag 1991 How does the toad's visual system discriminate different worm-like stimuli? * D. L. Wang and M. A. Arbib Center for Neural Engineering, University of Southern California, Los Angeles, CA 90089-2520, USA Received February 15, 1990/Accepted in revised form August 27, 1990 Abstract. Behavioral experiments show that toads ex- hibit stimulus- and locus-specific habituation. Different worm-like stimuli that toads can discriminate at a cer- tain visual location form a dishabituation hierarchy. What is the neural mechanism which underlies these behaviors? This paper proposes that the toad discrimi- nates visual objects based on temporal responses, and that discrimination is reflected in different average neu- ronal firing rates at some higher visual center, hypothet- ically anterior thalamus. This theory is developed through a large-scale neural simulation which includes retina, tectum and anterior thalamus. The neural model based on this theory predicts that retinal R2 cells play a primary role in the discrimination via tectal small pear cells (SP) and R3 cells refine the feature analysis by inhibition. The simulation demonstrates that the retinal response to the trailing edge of a stimulus is as crucial for pattern discrimination as the response to the leading edge. The new dishabituation hierarchies pre- dicted by this model by reversing contrast and shrink- ing stimulus size need to be tested experimentally. 1 Introduction After repeated presentation of the same prey dummy in their visual field, toads and frogs reduce the number of orienting responses toward the moving stimulus. This phenomenon is called habituation. Habituation has been extensively investigated, ranging from invertebrates, like Aplysia (Kandel 1976), where habituation seems to be independent of the specific patterning of the stimuli used, to mammals where habituation exhibits stimulus- specificity so that habituation to a certain stimulus pattern may be dishabituated by a different stimulus pattern (Thompson and Spencer 1966; Sokolov 1975). * The research described in this paper was supported in part by grant no. IROI NS 24926 from the National Institutes of Health (M.A.A., Principal Investigator) Visual habituation in toads has the following character- istics (for a review, see Ewert 1984): 1 Locus specificity After the habituation of an orienting response to a certain stimulus applied in a given location, the re- sponse can be released by the same stimulus applied at a different retinal locus (Eikmanns 1955; Ewert and Ingle 1971). 2 Hierarchical stimulus specificity After habituation to one stimulus, the response may be restored by presentation of a different stimulus at the same location. It seems that only certain stimuli can dishabituate a previously habituated response. Experi- mental results (Ewert and Kehl 1978) show that this dishabituation forms a hierarchy of stimulus patterns (Fig. 1), where patterns higher in the hierarchy can dishabituate the habituated responses of stimuli lower in the hierarchy. The biological relevance of the stimulus-specific ha- bituation phenomena may be to keep the IRM (innate releasing mechanism) for prey catching alert to "new" stimuli (Schleidt 1962). The dishabituation hierarchy suggests that it is configurational cues of the stimulus and not only its "newness" which decide the toad's response (Ewert and Kehl 1978). It is reasonable to assume that toads have not developed the advanced spatial shape recognition capability of higher animals, but have developed the ability to recognize certain stimulus configurations, which, for example, are used in discriminating prey and predator. However, our aim here is not to model such discrimination, but rather to investigate the neural mechanisms that might undedy this dishabituation hierarchy, which has been demon- strated so far only in behavioral experiments. For toads to exhibit the dishabituation hierarchy, there have to be differing representations of differentially habituatable shapes somewhere in their visual system. Physiological studies provide, however, few data on the response of the visual areas, such as retina and tectum, to a variety
-
Upload
nguyenthuy -
Category
Documents
-
view
216 -
download
0
Transcript of How does the toad's visual system discriminate different...

Biol. Cybern. 64, 251-261 (1991) Biological Cybernetics �9 Springer-Verlag 1991
How does the toad's visual system discriminate different worm-like stimuli? *
D. L. Wang and M. A. Arbib
Center for Neural Engineering, University of Southern California, Los Angeles, CA 90089-2520, USA
Received February 15, 1990/Accepted in revised form August 27, 1990
Abstract. Behavioral experiments show that toads ex- hibit stimulus- and locus-specific habituation. Different worm-like stimuli that toads can discriminate at a cer- tain visual location form a dishabituation hierarchy. What is the neural mechanism which underlies these behaviors? This paper proposes that the toad discrimi- nates visual objects based on temporal responses, and that discrimination is reflected in different average neu- ronal firing rates at some higher visual center, hypothet- ically anterior thalamus. This theory is developed through a large-scale neural simulation which includes retina, tectum and anterior thalamus. The neural model based on this theory predicts that retinal R2 cells play a primary role in the discrimination via tectal small pear cells (SP) and R3 cells refine the feature analysis by inhibition. The simulation demonstrates that the retinal response to the trailing edge of a stimulus is as crucial for pattern discrimination as the response to the leading edge. The new dishabituation hierarchies pre- dicted by this model by reversing contrast and shrink- ing stimulus size need to be tested experimentally.
1 Introduction
After repeated presentation of the same prey dummy in their visual field, toads and frogs reduce the number of orienting responses toward the moving stimulus. This phenomenon is called habituation. Habituation has been extensively investigated, ranging from invertebrates, like Aplysia (Kandel 1976), where habituation seems to be independent of the specific patterning of the stimuli used, to mammals where habituation exhibits stimulus- specificity so that habituation to a certain stimulus pattern may be dishabituated by a different stimulus pattern (Thompson and Spencer 1966; Sokolov 1975).
* The research described in this paper was supported in part by grant no. IROI NS 24926 from the National Institutes of Health (M.A.A., Principal Investigator)
Visual habituation in toads has the following character- istics (for a review, see Ewert 1984):
1 Locus specificity
After the habituation of an orienting response to a certain stimulus applied in a given location, the re- sponse can be released by the same stimulus applied at a different retinal locus (Eikmanns 1955; Ewert and Ingle 1971).
2 Hierarchical stimulus specificity
After habituation to one stimulus, the response may be restored by presentation of a different stimulus at the same location. It seems that only certain stimuli can dishabituate a previously habituated response. Experi- mental results (Ewert and Kehl 1978) show that this dishabituation forms a hierarchy of stimulus patterns (Fig. 1), where patterns higher in the hierarchy can dishabituate the habituated responses of stimuli lower in the hierarchy.
The biological relevance of the stimulus-specific ha- bituation phenomena may be to keep the IRM (innate releasing mechanism) for prey catching alert to "new" stimuli (Schleidt 1962). The dishabituation hierarchy suggests that it is configurational cues of the stimulus and not only its "newness" which decide the toad's response (Ewert and Kehl 1978). It is reasonable to assume that toads have not developed the advanced spatial shape recognition capability of higher animals, but have developed the ability to recognize certain stimulus configurations, which, for example, are used in discriminating prey and predator. However, our aim here is not to model such discrimination, but rather to investigate the neural mechanisms that might undedy this dishabituation hierarchy, which has been demon- strated so far only in behavioral experiments. For toads to exhibit the dishabituation hierarchy, there have to be differing representations of differentially habituatable shapes somewhere in their visual system. Physiological studies provide, however, few data on the response of the visual areas, such as retina and tectum, to a variety

252
5ram
20 mm
m
g
I I I I I I h
m o v e m e n t d i rec t ion
Fig. 1. Dishabituation hierarchy for worm stimuli used in stimulus- specific habituation. One stimulus can dishabituate all the stimuli below it. On the same level the left stimulus can slightly dishabituate the fight one (redrawn by permission from Ewert and Kehl 1978)
of relevant shapes (for reviews see Griisser and Griisser-Cornehls 1976; Ewert 1984).
In the Lara-Arbib model of stimulus-specific habit- uation behavior in the toad (Lara and Arbib 1985), the discrimination of the stimuli in Fig. 1 is made by retinal ganglion cell type R2. In order to achieve this, the authors introduce a measurement of the convexity of a stimulus, and provide a group of ad hoc functions each of which is used to emulate how a specific stimulus traverses the excitatory receptive field (ERF) of R2. However, Lara and Arbib's measurement of convexity does not really reflect the convexity of an object. To avoid such problems, the present model is based on detailed modeling of the anuran retina (Teeters 1989; Teeters and Arbib 1990).
The present model for discriminating different worm-like stimuli is able to simulate a class of cells whose average firing rate in response to the different stimulus types exhibits the same order as shown in the dishabituation hierarchy. We hypothesize that these cells lie in anterior thalamus, and thus suggest new physiological experiments to test our theory.
2 Distributed vs. temporal coding: basic hypothesis
An object can be neurally coded by distributed activity in a group of neurons, or by temporal firing patterns of single cells. Here the former is denoted as distributed coding and the latter as temporal coding. Distributed coding is strongly favored by theoreticians due to con- siderations of reliability, although it seems that both are used in the object representation of primates (Gross et
al. 1985). We can make the situation clearer by avoid- ing the suggestion of a strict dichotomy. In "purely distributed" coding, there is no single cell whose firing correlates strongly with the specific pattern being dis- criminated- only the firing of a population encodes that discriminand. In "purely temporal" coding, there is a unique cell ("a yellow Volkswagen detector") whose firing encodes the discriminand. However, data on toad tectum (e.g., Ewert 1987b) suggest a form of temporal coding which is also distributed in the sense that, for example, the firing of T5.2 cell signals the presence of a worm-like stimulus in its visual field (temporal coding), yet nearby T5.2 cells, having overlapping receptive fields, can encode the same stimulus if it appears nearby (thus yielding the redundancy and reliability of dis- tributed coding).
Our basic hypothesis, then, is that anurans repre- sent objects by temporal coding, in this latter sense. More specifically, we assert that the firing rate of specific neurons in some neural center of the toad visual system is higher in response to a stimulus in the upper part of the hierarchy than to one in the lower part, without denying that many cells may exhibit highly similar temporal codes.
If the difference between two patterns is measured only by their Hamming distance (i.e. the number of differing pixels) then dishabituation would be symmetri- cal, i.e., if stimulus A can dishabituate stimulus B, then stimulus B should be able to dishabituate stimulus A as well. This might be the case in higher animals like mammals where the dishabituation could be accounted for by a comparator model (Sokolov 1975), but this contradicts the observed hierarchy in toads (Ewert and Kehl 1978). Moreover, the discrimination capability of toads is rather limited. In their original experiment, Ewert and Kehl did not find other worm configurations of the same length and height than those in Fig. 1 that could be discriminated (Ewert, personal communica- tion 1989). This limitation could be straightforwardly explained by the hypothesis of temporal coding because a frequency coding can only be markedly differentiated into a number of levels and therefore the capacity is severely limited compared to distributed coding. It could be that amphibians, a phylogenetically older spe- cies than mammals, have not yet achieved the advanced distributed coding which has immense potentials in terms of capacity. Looked at from the other direction, however, amphibians do reach the hierarchical stimu- lus-specificity which does not seem to be obtained in invertebrates (Kandel 1976).
A direct prediction of our basic hypothesis is that the dishabituation hierarchy is underlain by the differ- ent firing rates of certain neurons in the toad visual system. This major prediction will be explored in simu- lations presented in the following sections. In the exper- iment of Ewert and Kehl (1978), all moving objects are 20 mm long and 5 mm high (see Fig. 1), which corre- sponds to 16 ~ and 4 ~ visual angle respectively, from the viewing distance of 70 mm. The dots which are added to the triangular objects (see Fig. 1) are 1 mm in diameter which is about 1 ~ Because all the moving

253
objects have the same length and height, the critical cues are (1) leading edge (or the angle subtended by a leading edge); (2) trailing edge; (3) isolated dot; (4) striped pattern. The following analysis will be made in terms of these cues.
Before we go into the detailed information process- ing of the toad visual system at different levels, the general paradigm of the simulation is provided first. The model that we have developed in the following sections is tested by a large-scale computer simulation which incorporates retina, tectum and a novel array of cells which we hypothesize to lie in anterior thalamus (The basis for this hypothesis will be presented below). The anatomy of the simulation is summarized in Fig. 2. In the figure, conical projections represent on-center off-surround convergence, while the cylindrical projec- tion from the R2 layer to the small pear cell (SP) layer represents a 1 to 1 mapping. The connections from the receptor layer to both the depolarizing bipolar cell (BD) layer and the hyperpolarizing bipolar cell (BH) layer also constitute a small many-to-one convergence. The receptor layer contains 140 • 140 cells which corre- spond to a 70 ~ x 70 ~ visual field. Bipolar and amacrine cell layers (ATD: on-channel, ATH: off-channel) con- sist of 140 • 140 cells respectively, in correspondence with the receptor layer. Three types of ganglion cells, R2, R3 and R4, have been modeled, each consisting of 25 x 25 cells which correspond to a 70~215 70 ~ visual field since the ganglion cells have 20 ~ RF and lie 2 ~ apart. The R2 layer projects to the SP layer in the tectum, and the SP layer and R3 layer together con- verge on the AT layer in the anterior thalamus, where
Receptor Layer
A er
AT layer
Fig. 2. Diagram of the entire model used in this simulation project. Retina, tectum and anterior thalamus have been incorporated in the model. For explanation see text
the worm-like pattern discrimination is finally achieved. The entire simulation contains about 100,000 cells. Bitmap stimuli are used.
3 Model of retinal processing
Any biologically significant neural model of visual ob- ject recognition must include retinal processing. The anuran retina is among the best known neural struc- tures, and triggers considerable modeling as well (for examples see Ewert and Seelen 1974; an der Heiden and Roth 1987; Teeters 1989; Teeters and Arbib 1990). Our analysis is mainly based on Teeters' retina model since it provides the most detailed account of the toad retina to date.
The receptive fields of retinal ganglion cells are usually thought to be composed of an excitatory cen- ter and an inhibitory surround (Kuffler 1953). Both mechanisms are described by spatially Gaussian-dis- tributed curves around a common midpoint, but the inhibitory one has a lower peak and wider spread. The whole neuronal response is formed as a difference of Gaussians (DOG), with the excitatory Gaussian minus the inhibitory one. However this ignores fine details of cellular interactions within the retina. A more detailed model (Teeters and Arbib 1990) for the anuran retina prior to ganglion cells (Fig. 2) follows the generally accepted overview of retinal processing. Receptors and horizontal cells together form the center-surround re- ceptive field for the bipolars. (Horizontal ceils are not shown in the figure due to their limited role in visual processing in this retina model. For detailed discussion see Teeters and Arbib 1990). The bipolar output pro- vides the input to amacrine cells where extensive pro- cessing is performed including temporal processing which emphasizes transient responses. Three different types of ganglion cell were identified in the retinotectal projection of toads (Griisser and Griisser-Cornehls 1970; Ewert and Hock 1972) which correspond to R2, R3 and R4 in frogs (Griisser and Griisser-Cornehls 1976). The responses of the three retinal ganglion types to three classes of stimuli used in the Ewert laboratory are summarized in the top panel of Fig. 3 (Ewert and Hock 1972; Ewert 1976). Each data point corresponds to the average firing rate of the given cell during the response to the leading edge of the horizon- tally traveling object (Ewert, personal communication 1989). We shall later consider data from the Ewert laboratory that also take the trailing edge into ac- count. In fact, the response to the trailing edge must be taken into account to explain the hierarchical stim- ulus specificity. The responses of R2, R3 and R4 gan- glion cells are formed by different combinations of ATD and ATH. For implementation details see Teeters and Arbib (1990).
During a simulation of the retina, a moving stim- ulus is directly mapped onto the receptor layer. The dynamics of the membrane potential m(t) of a neuron in a later layer is formed by input I(t) from previous layers according to the leaky integrator model

254
40,
30 .
20-
10-
0
Data
:; ,; ~ 1"8 s'2 EDGE SIZE (DEGREE)
R2 40,
30.
20"
10.
0
Data
Square
; ; 16 37 EDGE SIZE (DEGREE)
R3
Data 4O
- - " O - - - Worm 8 Antiworm
30. ~ Square
10-
EDGE SIZE (DEGREE)
R4
w o r l u
l
antiworm square
I r
40
30
20
10
0
Teeters' Result
~ i 1? 32 EDGE SlZE (DEGREE)
R2 4o "1
1
B Teeters' Result
�9 --o.--- Square
; d 46 3~ EDGE SIZE (DEGREE)
Teeters' Result
R3 40.
"---O=-- Worm �9 Antiworm
30. ~ Square
10 '
2 4 8 16 32
EDGE SIZE (DEGREE)
R4
Wang-Arbib Result 4 0 . 40 .
30. ~ / ~ R2
20. O ~
,o. - F - '2orm ~ Square
EDGE SIZE (DEGREE) EDGE SIZE
Hg. 3. Top pane/: The expedmentaJ data (redrawn by permission from Ewert 1976). R2, R3 and R4 responses to worm, antiworm, and square visual stimuli, which are dipicted in the figure. A worm stimulus is a rectangle with its elongated edge parallel to the direction of movement; An ant/worm stimulus is a rectangle with its elongated edge perpendicular to the direction of movement. Middle panel:
Wang-Arbib Result Wang-Arbib Result
3 0 .
20"
Worm lO - r Antiworm
---o--- Square o 2 ,; 1
R3 ----o--- Worm R4 ~ ~ �9 Antiworm
3o ~ Square
- 20
0 18 d2 ~ ; ~ 17 3~
(DEGREE) EDGE SIZE (DEGREE)
Corresponding response of the Teeters model (redrawn with permis- sion from Teeters 1989). Bottom panel: Corresponding response of our modified retina model. Each point in our model response, as in the Teeters model, represents the temporal average firing rate in response to the corresponding stimulus. Note that only the response to leading edge is recorded
( f o l l o w i n g the style o f m o d e l i n g in Lara et al. 1982):
~'n(t) ~" dt = - re ( t ) + I(t) + h (1)
where T,, is the time constant, h is a resting level, and I(t) represents the weighted sum of excitatory and inhibitory inputs. Rather than using a detailed model of spike initiation, the firing rate S(t) of the neuron is formed by ~(m(t)), where the choice of non-linear func- tion ~ may vary from cell-type to cell-type. In the
model, each cell type corresponds to a two dimensional matrix, with a single cell represented by the membrane potential m(i,j, t) of the neuron at position (i, j ) and time t. The input I(i,j, t) to this neuron is created by summing up the contributions of the preceding layers. Each contribution is formed as the convolution of a kernel which approximates a DOG with the output from the appropriate cell matrix:
I(i , j , t) = (k *S)(i,y, t) (2)
255
where �9 represents convolution, S indicates the output firing rate of the previous layer, and a kernel element k(x, y) is defined as
worm response Betts (1989) omitted the R4 connections used in an earlier model (Cervantes-Perez et al. 1985)
k(x, y) = (O We expt-(x= + Y2)/(2tr2)] - w~ e x p [ - (x 2 + y2)/(2a2)]
where R is the radius of the receptive field measured in degrees of visual angle. The activity distribution of the receptive field is uniquely determined by parameters We, Wi, ~e, and ai.
The retina model in this paper is a slightly modified version of the Teeters model (Teeters 1989) and more closely approximates the electrophysiological data. The difference between our model and the Teeters model for the toad retina, besides different implementations, can be summarized as the following: (1) Different sets of parameters for ganglion cells (see Table 1); (2) Our model simulates both the on-channel and off-channel response of R2 cells (see 4 below) while his model only simulates the off-channel response; (3) Our model ac- cepts bitmap stimuli directly, which is crucial for simu- lating the retinal response to various configurations of worm stimulus in Fig. 1, while his model only accepts structured stimulus shapes of worm, antiworm and square (see Fig. 3). Data from the Teeters model and our modified model are presented in Fig. 3 for the three types of ganglion cells respectively, together with the electrophysiological data.~ Table 1 lists various parame- ter values of R2, R3 and R4 cells used both in the Teeters model and in our model.
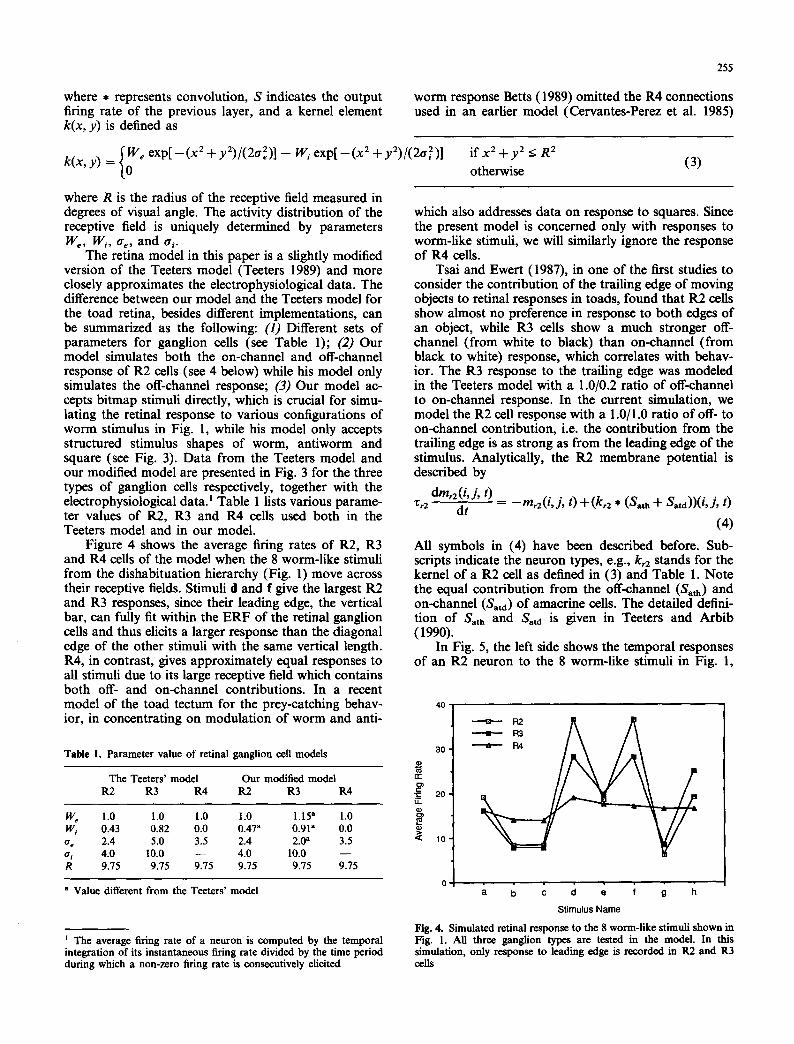
Figure 4 shows the average firing rates of R2, R3 and R4 cells of the model when the 8 worm-like stimuli from the dishabituation hierarchy (Fig. 1) move across their receptive fields. Stimuli d and f give the largest R2 and R3 responses, since their leading edge, the vertical bar, can fully fit within the ERF of the retinal ganglion cells and thus elicits a larger response than the diagonal edge of the other stimuli with the same vertical length. R4, in contrast, gives approximately equal responses to all stimuli due to its large receptive field which contains both off- and on-channel contributions. In a recent model of the toad tectum for the prey-catching behav- ior, in concentrating on modulation of worm and anti-
Table 1. Parameter value of retinal ganglion cell models
The Teeters' model Our modified model R2 R3 R4 R2 R3 R4
W e 1.0 1.0 1.0 1.0 1.15 a 1.0 W i 0.43 0.82 0.0 0.47 a 0.91 a 0.0 ~r e 2.4 5.0 3.5 2.4 2.0 a 3.5 o~ 4.0 10.0 - - 4.0 10.0 - - R 9.75 9.75 9.75 9.75 9.75 9.75
a Value different from the Teeters' model
i The average firing rate of a neuron is computed by the temporal integration of its instantaneous firing rate divided by the time period during which a non-zero firing rate is consecutively elicited
i f x 2 + y 2 < R 2
otherwise (3)
which also addresses data on response to squares. Since the present model is concerned only with responses to worm-like stimuli, we will similarly ignore the response of R4 cells.
Tsai and Ewert (1987), in one of the first studies to consider the contribution of the trailing edge of moving objects to retinal responses in toads, found that R2 cells show almost no preference in response to both edges of an object, while R3 cells show a much stronger off- channel (from white to black) than on-channel (from black to white) response, which correlates with behav- ior. The R3 response to the trailing edge was modeled in the Teeters model with a 1.0/0.2 ratio of off-channel to on-channel response. In the current simulation, we model the R2 cell response with a 1.0/1.0 ratio of off- to on-channel contribution, i.e. the contribution from the trailing edge is as strong as from the leading edge of the stimulus. Analytically, the R2 membrane potential is described by
dm,2(i,j, t) z'2 dt = -mr2(i , j , t) +(k,2 * (Sat h "~ Satd))(i,j, t)
(4) All symbols in (4) have been described before. Sub- scripts indicate the neuron types, e.g., k~2 stands for the kernel of a R2 cell as defined in (3) and Table 1. Note the equal contribution from the off-channel (Sath) and on-channel (Satd) of amacrine cells. The detailed defini- tion of Sath and S~td is given in Teeters and Arbib (1990).
In Fig. 5, the left side shows the temporal responses of an R2 neuron to the 8 worm-like stimuli in Fig. 1,
4O
3 0 '
r r
:_= 20 ' LL
~ 10'
0 �9 a b c ~ . i g
S t i m u l u s N a m e
Fig. 4. Simulated retinal response to the 8 worm-like stimuli shown in Fig. 1. All three ganglion types are tested in the model In this simulation, only response to leading edge is recorded in R2 and R3 cells

256
R2 Temporal Response
~ worm a
FR [ 50"0 ~ N , wormb FR[ 50"0
FR[ 50"0 //"k,X worme FR[ 50"~
FR[50"0 ~ r ~ N ~ X ~ , wormd FR[ 50"0
F~ [5o.o FR [50.0 , ~ ~ worm e
FRr50"0 / / ~ ~ wormf FR[ 50"~
FR [ 50.0 ~ g . . . . worm FR [ 50.0
FR[ 5~176 ~ wormh FRISO'O
R3 Temporal Response
. .
Fig. 5. Left: R2 temporal firing rate to the 8 worm-like stimuli from the retina model. Time runs from left to right. The unit of the numbers in the figure is impulses per second (Hz). FR: firing rate. Right: R3 temporal firing rate to the 8 worm-like stimuli from the retina model
and the fight side shows the corresponding R3 re- sponses from our modified retina model. Here only firing rate is displayed, with ~(x)= x if x > 0 and 0 otherwise for both R2 and R3 cells. In terms of single cell response, a vertical bar of 4 ~ height elicits the strongest response in both R2 and R3 cells, and the more inclined is a stimulus edge, the less efficient it is to trigger a retinal response. This is because the more inclined is a stimulus edge with the same vertical height, the larger does it encroach on the inhibitory surround and the longer is the duration of the response. Note the effect of the dots in worm e relative to a and worm g relative to h in the R2 response. Since the dot is encroaching R2's IRF while the edges of stimuli e and g traverse R2's ERF, worms e and g elicit smaller R2 responses than worms a and b respectively. Note also that the two response areas of R2 to an object in Fig. 5 generally correspond to the R2 response to the lead- ing edge and the trailing edge of the object. Since all objects are moving at the same speed, the distance between the peaks of the two areas corresponds to the distance between the middle points of the leading edge and the trailing edge of the object. For example, the distance between two peaks elicited by worm a is smaller than that elicted by worm d.
Figure 6 presents the 3-D snapshots of the mem- brane potentials of 25 x 25 matrices of cells in response to worms a, b, d, h traversing the visual field of the retina model for R2 and R3 respectively. The responses of R2 and R3 to the other 4 stimuli have also been simulated, but are omitted for space. In the simulation, the density of receptors is 1 cell/0.5 deg while the gan- glion cell density is 1 cell/2 deg resulting in a 4 to 1 density ratio. In addition each ganglion cell has a receptive field of approximately 20 x 20 deg or 40 x 40 receptors. This results in a 140 x 140 receptor matrix (i.e. a 70~ 70 ~ visual field) serving as input to the 25 x 25 ganglion cell matrix.
In contrast to Fig. 5 where the temporal response is given, Fig. 6 shows the spatial response of the ganglion cells, which are difficult to observe electrophysiologi- cally. Although a bit obscured in some cases (e.g. worm a in Fig. 6a) by the effects of sampling and the display
technique, there is generally a clear correspondence between the responses in Fig. 6a and b and their corresponding geometric shapes in Fig. 1. The off-chan- nel preference of R3 cells is clearly shown in the figure.
R 2 to worm a R 2 to worm b
~ec~O'~
R 2 to worm d R 2 to worm h
R3 to worm a R3 to worm b
85.0 r,ao.q e~e,:t~t "~i~eC~O ~
R3 to worm d R 3 to worm h
Fig. 6. a 3-D snapshot of the membrane potential of the 25 x 25 R2 layer to worm patterns a, b, d, and h shown in Fig. 1. Stimulus is moving from left to right, as shown in the figure. All response potentials are sealed uniformly, h 3-D snapshot of the membrane potential of the 25 x 25 R3 layer to worm patterns a, b, d, and h shown in Fig. 1. All response potentials are scaled uniformly

Since a single neuron in later visual centers (like tectum and anterior thalamus) integrates a 2-D cell patch of the retinal ganglion layes, the 3-D snapshots in Fig. 6 are very helpful in envisioning the response characteris- tics of later visual processing.
4 Tectal relay
Based on anatomical data (Neary and Northcutt 1983; Wilczynski and Northcut 1983) and functional lesion data, Ewert (1987a) suggested that the basic pathway for habituation in amphibians is: retina ~ tectum ~ A T (anterior thalamus) ~ MP(medial pallium) ~ P O / H Y P (preoptic region/hypothalamus)~tectum. This path- way is referred to as loop(2) and is generally supposed to be responsible for modulation of the innate releasing behaviors of amphibians. In this paper, we are only concerned with the first part of this loop: ret ina-~ tectum -~ A T, where the discrimination of the stimuli is presumably achieved using the circuitry analyzed below by our simulation. More specifically, we shall demon- strate a circuit (called ATH) that can effect the desired discrimination and, as a logically separate claim, sug- gest that it is located in AT.
In our model, we do not address the question of how the optic tectum discriminates prey from predator, but we do hypothesize that it plays little or no role in the finer pattern discrimination that underlies the disha- bituation hierarchy, but rather relays the input from the retina to anterior thalamus where the visual informa- tion is further processed and carried up to telen- cephalon. The reasons for this hypothesis are the following. The tectum receives inputs from both R2 and R3 retinal ceils, and is the neural center mediating prey-catching behavior in amphibians (Ewert 1987a, b). As for stimulus-specific habituation, behavioral data show that the releasing values for all the stimuli in the hierarchy are almost the same, as stressed by Ewert (1984). Also, the prey-catching behavior shows off- channel preference, which correlates very well with the neuronal activities in R3 and T5.2 cells (Tsai and Ewert 1987). This finding leads Tsai and Ewert (1987) to propose that R3, not R2, carries the primary informa- tion to prey analysis circuitry located in tectum. How- ever, as argued in the previous section, the response to the trailing edge should have a significant role in worm discrimination. This suggests that R2 may be more involved in the discrimination of worm-like stimuli than R3. This trailing edge consideration leads us to down- play the tectum as a major processor of "sub-worm" discrimination.
With HRP and cobalt-filling, Lfizfir et al. (1983) found that in frogs the main projection units to the anterior diencephalon from tectum are the small piri- form neurons (SP), which are located in layer 8 of the tectum. This finding leads us to assume that SP cells relay the visual information concerning worm discrimi- nation.
According to the tectal column model (Lara et al. 1982; Cervantes-Perez et al. 1985) which was abstracted
257
from the anatomy of the anuran tectum (Sz~kely and Lfizhr 1976), each column comprises a pyramidal cell, PY, as the sole output cell, a large pear-shaped cell, LP, a small pear-shaped cell, SP, and a stellate inhibitory interneuron, SN. Tectum is modeled by an array of locally connected columns. In the model of Cervantes- Perez et al. (1985), the SP cells are defined as follows:
dm~p(i,j , t) Z~p - - dt = - m s p ( i , j , t) + Sr2(i,j , t)
+ l~ ( i , j , 0 --Isn(i , j , t) - - I th3(i , j , t) (5)
where GL stands for the glomerulus within a tectal column, TH3 is one type of thalamic-pretectal cell, and Ig,(i,j , t), lsn(i, j , t), and I t h 3 ( i , j , t) represent weighted inputs from GL, SN, and TH3 cells respectively. In terms of retinal afferents, SP only receives R2 inputs. In the present model, SP cells also receive R2 inputs and projects to anterior thalamus. Since R2 projects to SP topographically, and the role that SP has in this model is to relay R2 activity, the neuronal response of SP is made equal to the response of R2 to any stimulus, in order to simplify the implementation. Future modeling will pay more attention to the dynamics of tectal cir- cuitry.
5 Integration in anterior thalamus
The anterior thalamus (AT) consists of many nuclei, but due to the lack of more specific data, AT will be discussed as a whole. The anterior thalamus receives ascending R3 and R4 retinal projections (Scalia and Gregory 1970; Griisser and Griisser-Cornehls 1976) and SP tectal projections (Lfizfir et al. 1983). Among other ascending projections to telencephalon, AT has a direct projection to the medial pallium (Scalia and Colman 1975; Neary and Northcutt 1983). Although responses of visually sensitive neurons have been recorded in AT, the data only provide a preliminary picture. Compared to the optic tectam and the caudal thalamus, AT is much less understood in terms of neurophysiology and morphology. For example, no well-observed neuronal types have been reported there. Functionally, it has been suggested that AT forms part of the anatomical substrate by which visual information reaches the me- dial pallium (Neary and Northcutt 1983). Ingle (1980) found that large ablations of AT usually depressed prey-catching behavior. Also AT has been proposed as part of the modulatory loop(2) (Ewert 1987a). How- ever, the kind of visual processing performed at AT remains unknown.
We offer in the present model a definite hypothesis: Based on the specific position of AT in loop(2) and our previous analysis of visual information processing, we propose that it is the anterior thalamus where the finest pattern discrimination is achieved by neuronal re- sponses. As stated above, it is too early to form a model of anatomical circuitry for AT. However, since the computational function of AT is one of our major concerns in this project, we will be contented with a

258
simple array of neurons, called ATH, for modeling anterior thalamus for the time being. ATH neurons receive excitatory-center inhibitory-surround inputs from tectal SP cells, and direct inhibitory inputs from R3 cells, as shown in Fig. 2. Quantitatively,
dmath(i,j, t) "Oath dt - math(i,j, t) + (kathl * S s p ) ( i , j , t)
-- Max[0,(kath2 * Sr3)(i,j, t)]
e [" wrp kathl(X, Y) --" ~ s p
(6) if Ixl ~ m,, lY[ ~ m, if m, <lxl <m2, m, <IYl <mz otherwise
(7)
if Ixl . , . lyl < n, if n, < Ix[ < n2, n, < [Yl < n2 (8) otherwise
e [" Wr.3 kath2(x, Y) = ~ W'r3
Sath(t)~_{oath(l)--Oat i f m ( t ) : > O a t h if not (9)
where the Max operation ensures the inhibitory effect of the R3 input. The meaning of the other symbols has been described previously. In the simulation, we have chosen m~ = nl = 6, and m2 = n2 = 12, resulting in a 25 ~ ERF surrounded by a 50 ~ IRF for the ATH cell.
Figure 7 shows the average firing rates (see the previous footnote) of a single ATH neuron to the 8 worm-like stimuli. The open symbols represent the re- sponse of the full model, while for a comparison the filled symbols provide the response without R3 inhibi- tion. See the legend for the values of the parameters introduced in (7), (8) and (9). The result clearly matches the ordered dishabituation hierarchy in Fig. 1. Not only do stimuli higher in the hierarchy generate larger ATH responses, but the stimulus pairs b - c and
42
40
38
'~ 36 tw
:.~ 34
32
3o
28 ---.,r With R3
26 .,; Without R3
24 a I:; c d e f g I~
Stimulus Name
Fig. 7. A T response to the 8 worm-like stimuli shown in Fig. 1. The 8 average firing rates are ordered, which corresponds to the ordered hierarchy in Fig. 1. The figure also shows ATH response to file stimuli without inhibitory projection from R3 cells. In the simulation, Zath = 0.065, 0=t h = 13.0, Ws~ = 0.0091, W~p = --0.003, W~ee 3 = 0,0095, W~. 3 = -0.003
d -e which are on the same level in the hierarchy generate nearly equal responses. The dishabituation hierarchy created by this model is almost the same as the one observed experimentally in Fig. 1, and the only discrepancy compared to Fig. 1 is that the model cannot create the preference of stimulus b over c, which is weakly exhibited in the animal.
In summary, we propose the following mechanisms to explain the dishabituation hierarchy in Fig. 1.
(1) Both the leading edge and the trailing edge of a worm stimulus have to be taken into consideration.
(2) The receptive field of ATH neurons (25 ~ ERF and 50 ~ IRF in our model) is big enough to "see" both the leading and the trailing edge (cf. Fig. 6). Stimulus a elicits the biggest response, particularly bigger than stimulus d, because both diagonal edges elicit strong responses in R2 cells (see Fig. 5a) and these responses can be best integrated in ATH cells due to the small distance between the midpoints of its leading and trail- ing edge response.
(3) Stimuli b and e are preferred to stimulus f because the inhibition of R3 cells, which has off-chan- nel preference, is bigger for f than for b and e.
(4) Stimuli with dots appear lower in the hierarchy because they elicit smaller R2 response due to IRF interaction.
(5) A striped pattern elicits the smallest response in ATH neurons because of R3 inhibition. This is particu- larly clear when we compare the two curves in Fig. 7.
6 Predictions
The simulations so far presented lead to a number of specific predictions:
(1) When the animal is presented with different worm-like stimuli, they will elicit different neuronal responses at a certain neural center, and the order exhibited based on average firing rate corresponds to the order exhibited in the dishabituation hierarchy.
(2) Retinal ganglion cell type R2 plays a primary role in the discrimination of the stimuli, since R2 responds best to small moving objects and detects equally well both the leading and trailing edge of a stimulus.
(3) In the discrimination of different "sub-worms", the optic tectum serves only to relay information from retina to AT via SP cells.
(4) R3 cells have an inhibitory role in worm pattern discrimination. This is due to their off-channel prefer- ence (from white to black).
(5) Anterior thalamus is the structure which reflects the final pattern discrimination due to its special posi- tion in the modulatory loop(2). This structure receives excitatory projections from SP and inhibitory projec- tions from R3.
The current model will create different hierarchies based on different sizes of worm-like stimuli. After completing the previous simulations, we shrank the size of all the stimuli to 10 mm long and 2.5 mm high corresponding to 8 ~ by 2 ~ , and tested these stimuli. The

worm that is 8 ~ long and 2 ~ high forms an optimal stimulus to T5.2 cells in the tectum which correlate well with prey-catching behavior (Ewert 1984). Figure 8 presents the dishabituation hierarchy predicted by this model. A remarkable difference has been found, com- pared to Fig. 1. Particularly, stimulus h lies at the top of Fig. 8, in contrast to the bottom position in Fig. 1, and the stimuli with dots appear higher in the hier- archy, reversing the original relation exhibited in Fig. 1. Our explanation is that since the stimulus size is halved compared to Fig. 1, the previous IRF interaction in the R2 receptive field is converted into an ERF interaction which strengthens overall responses. This ERF interac- tion is particularly manifested by stimulus h. Note that the R3 inhibition in ATH neurons is relatively smaller than the excitation from SP cells, and thus cannot prevent stimulus h from inducing a strong ATH re- sponse. This leads us to postulate that the effect of dot and striped pattern is relative to stimulus size in pattern discrimination. Furthermore, this prediction suggests that if multiple stimuli lie close to each other they tend to cooperate to form a stronger response than any one of them, while if the stimuli lie far from each other they tend to compete and counteract each other's response.
The above prediction of absolute size sensitivity of the dishabituation hierarchy is complicated by the size constancy which toads and frogs exhibit (Ewert et al. 1983). The mechanism underlying size constancy is unknown and has not been incorporated into this model. If, for example, size-constancy is not achieved until after the anterior thalamus, we may not be able to find the general absolute size sensitivity of the hier- archy. It would be interesting to test whether the disha- bituation hierarchy is sensitive to absolute stimulus size,
2.Smm
10 mm I I I I I I
h
d
e
a
f
g b c
movement direct ion
Fig. g. Dishabituation hierarchy predicted from this model by shrink- ing stimulus size. For explanation see the legend for Fig. 1. All the stimuli are 10 mm long and 2.5 mm high. The same set of stimulus configurations is used as in Fig. 1
259
Fig. 9. Dishabituation hierarchy predicted from this model by revers- ing contrast direction. For explanation see the legend for Fig. 1. In contrast to Fig. 1, white stimulus is moving against black back- ground. The same set of stimulus configurations is used as in Fig. I
and the result will provide useful information about where size-constancy is achieved. However, the pre- dicted dishabituation hierarchy presented in Fig. 8 can be precisely tested if the stimuli are moved at the same distance from the toads as in Fig. 1, i.e. 70 mm from toads.
In this model of pattern discrimination both on- channel and off-channel effects are considered impor- tant. We have tested the same stimulus patterns as in Fig. 1 but reversed the contrast-direction, i.e. white stimuli moving against a black background (w/b). A new dishabituation hierarchy is found in our simula- tion, shown in Fig. 9. The response of R2 cells with w/b is the same as with the b/w, but now R3 cells show a trailing edge preference. We continue the previous pre- diction list by summarizing what is presented above:
(6) When the stimulus size is halved, the new disha- bituation hierarchy shown in Fig. 8 is predicted for behavioral experiments.
(7) When the stimulus-background contrast direc- tion is reversed, the new dishabituation hierarchy shown in Fig. 9 is predicted for behavioral experiments.
7 Discussion
In this model we have suggested a pattern recognition paradigm for toads and frogs, which uses temporal coding for representing different worm-like objects. The hierarchical stimulus specificity manifested in this paradigm represents an intermediate step between stim- ulus non-specificity found in several invertebrates

260
(Kandel 1976) and full stimulus specificity demon- strated in mammals. The strict locus-specificity implied in temporal coding may hamper the animal's location invariance in recognizing objects which seems crucial for concept formation, an important feature of pattern recognition in many mammals. However, locus-specifi- city may have survival value for the anuran by allow- ing it to track the same stimulus moving at a different location. In fact, the capability of the pattern discrimi- nation of anurans is rather limited (Ewert, personal communication 1989). So the "sameness" of stimuli is different for anurans than for mammals where the visual discrimination is much more accurate. But one feature of the pattern recognition paradigm suggested in this paper is that pattern recognition is based on visual cues like leading edge, trailing edge, dots, or striped patterns, which contrasts with the paradigm based on Hamming distance. This is related to the fact that, in anurans, retinal ganglion cells respond to quite complex features of the stimulus, while by contrast, in mammals, the responses of retinal ganglion cells are rather stereotyped.
Much progress has been made in experimental re- search on the anuran retina; and much modeling effort has been devoted to understanding its function. How- ever, this project makes the first extensive utilization of anuran retinal processing to explore the capability of the anuran visual system in discrimination of similar objects. Our understanding of the anuran retina based on this study, as suggested in Fig. 6, is that R2 forms localized edge detectors and R3 best detects the transi- tion from white to black in the environment. Besides certain phenomena, such as erasability, which have been modeled by Teeters (1989), these functions of R2 and R3 can be basically achieved by a high-pass filter.
In the previous tectal column model (Lara et al. 1982; Cervantes-Perez et al. 1985), small pear cells received R2 inputs through the glomerulus dendrites, as well as SN inhibition. The output of SP projects on the large pear cell and the pyramidal cell in the same column. The interaction that SP is involved in the tectal column model makes it able to determine the proper times for vertical recruitment of excitation to facilitate a response in the efferent (PY) neuron. This tectal column model is anatomically based on an ear- lier view of synaptic interactions within the optic tec- tum (Sz6kely and Lfizfir 1976). The SP cells were considered as local neurons until recently Lfiz~r et al. (1983) found their projections onto anterior thalamus, which underlies this model where the SP cells behave as relays from retina to anterior thalamus for pattern discrimination. These two views on the role of small pear cells might suggest that there exist two physiolog- ical subtypes of small pear cells, one of which is involved in facilitation of prey-catching behavior and the other conveying information for sub-worm discrimination.
Based on this neural model, we have predicted two dishabituation hierarchies by using the same configura- tion of worm stimuli (c.f. Figs. 8 and 9) with different stimulus size and stimulus-background contrast. One
natural extension would be to consider the effect of speed on the dishabituation hierarchy. The speed effect on R2, R3 and R4 cells has been modeled in the Teeters retina model (1989). If the moving speed of the worm stimuli in Fig. 1 is changed, we expect the same dishabituation hierarchy since varying the mov- ing velocity of stimuli changes the response to all the stimuli uniformly in retinal ganglion cells (Griisser and Griisser-Cornehls 1976; Teeters 1989) and hence cells in higher neural centers. So the speed of the stimuli should not affect relative dishabituation.
The simulation of the pattern discrimination was done after the retina model was fixed. Since the retinal responses are constrained strongly by the experimental data (Ewert and Hock 1972, Tsai and Ewert 1987), the retinal model, even its various parameters, cannot be modified to fit other simulation purposes since other- wise the original match between the model and the data could not be preserved. This represents a real challenge for later simulations based on retinal output. On the other hand, this requirement also provides a strict testbed for hypotheses and neural models. An- other challenge we have faced is how to manage a large-scale neural simulation, since a large-size net- work simulation seems unavoidable if one wants to seriously study the anuran vision by a theoretical approach.
In this paper we are only concerned with the mech- anism for discriminating different worm-like stimuli. Given the ordered firing responses to the different stimuli, we must next ask how toads can store these responses, and later exhibit habituation and dishabitu- ation. This will be addressed in our next paper, where the medial pallium, the structure homologous with the hippocampus of mammals, will be our major concern.
Acknowledgements. We would like to express our gratitude to Peter Ewert for his insightful discussion of the experimental data; and Bill lktts for his contribution to the retina simulation, his patience in helping us use his simulation system, and his critical comments on earlier drafts of this paper.
References
An der Heiden U, Roth G (1987) Mathematical model and simula- tion of retina and tcctum opticum of lower vertebrates. Acta Biotheor. 36:179-212
Betts B (1989) The T5 base modulator hypothesis: a dynamic model of T5 neuron function in toads. In: Ewert JP, Arbib MA (eds) Visuomotor coordination: amphibians, comparisons, models, and robots. Plenum Press, New York, pp 269-307
Cervantes-Perez F, Lara R, Arbib MA (1985) A neural model of interactions subserving prey-predator discrimination and size preference in anuran amphibians. J Theor Biol l 13: I 17 - 152
Eikmanns KH (1955) Verhaltensphysiologiscbe Untersuchungen fiber den Beutefang und das Bewegnngsseben der Erdkr6te (Bufo bufo L.). Z Tierpsychol 12:229-253
Ewert JP (1976) The visual system of the toad: behavioral and physiological studies on a pattern recognition system. In: Fite K (ed) The amphibian visual system: a multidisciplinary approach. Academic Press, New York, pp 141-202

Ewert JP (1984) Tectal mechanisms that underlie prey-catching and avoidance behaviors in toads. In: Vanegas H (ed) Comparative neurology of the optic teetum. Plenum Press, New York London, pp 246-416
Ewert JP (1987a) Neuroethology: toward a functional analysis of stimulus-response mediating and modulating neural circuitries. In: Ellen P, Thinus-Blonc C (eds) Cognitive processes and spatial orientation in animal and man, part 1. Nijhoff, Dordrecht, pp 177-200
Ewert JP (1987b) Neuroethology of releasing mechanism: prey-catch- ing in toads. Behav Brain Sci 10:337-405
Ewert JP, Hock FJ (1972) Movement sensitive neurons in the toad's retina. Exp Brain Res 16:41-59
Ewert JP, Ingle D (1971) Excitatory effects following habituation of prey-catching activity in frogs and toads. J Comp Physiol Psy- chol 77:369-374
Ewert JP, Kehl W (1978) Confignrational prey-seleetion by individual experience in the toad Bufo bufo. J Comp Physiol 126:105-114
Ewert JP, Seelen WV (1974) Neurobiologie und System-Theorie eines visuellen Mustererkennungsmeehanismns bei Krtten. Kybernetik 14:167-183
Ewert JP, Burghagen H, Schiirg-Pfeiffer E (1983) Neuroethological analysis of the innate releasing mechanism for prey-catching behavior in toads. In: Ewert JP, Capranica RR,~Ingie D (eds) Advances in vertebrate neuroethology. Plenum Press, New York London, pp 413-475
Gross CG, Desimone R, Albright TD, Schwartz EL (1985) Inferior temporal cortex and pattern recognition. In: Chagas C, Gattass R, Gross C (eds) Pattern recognition mechanisms. Springer, Berlin Heidelberg New York, pp 179-201
Griisser OJ, Griisser-Cornehls U (1970) Die Neurophysiologie visueU gesteuerter Verhaltensweisen bei Anuren. Verb Dtseh Zool Ges 64:201-218 ~
Griisser OJ, Griisser-Cornehls U (1976) Neurophysiology of the anuran visual system. In: Llinas R, Precht W (eds) Frog neurobi- ology. Springer, Berlin Heidelberg New York, pp 297-385
Ingle D (1980) The frog's detection of stationary objects following lesions of the preteetum. Behav Brain Res 1:139-163
Kandel E (1976) Cellular basis of behavior: an introduction to behavioral neurobiology. Freeman, New York
Kulfler SW (1953) Discharge patterns and functional organization of mammalian retina. J Neurophysiol 16:37-68
Lara R, Arbib MA (1985) A model of the neural mechanisms
261
responsible for pattern recognition and stimulus specific habitua- tion in toads. Biol Cybern 51:223-237
Lara R, Arbib MA, Cromarty AS (1982) The role of the tectal column in facilitation of amphibian prey-catching behavior: a neural model. J Neurosci 2:521-530
I.Azfir Gy, Toth P, Csink Gy, Kicliter E (1983) Morphology and location of tectal projection neuron in frogs: a study with HRP and Cobalt-filling. J Comp Neurol 215:108-120
Neary TJ, Northcutt R (1983) Nuclear organization of the bullfrog diencephalon. J Comp Neurol 213:262-278
Scalia F, Colman DR 0975) Identification of telencephalic efferent thalamic nuclei associated with the visual system of the frog. Neuroseience (abstr) 1:65
Scalia F, Gregory K (1970) Retinofugal projections in the frog: location of the postsynaptic neurons. Brain Behav Evol 3:16-29
Schleidt W (1962) Die historiscbe Entwichlung der Begriffe "ange- borenes ausltsendes Schema" und "angeborener Ausltsemeeha- nismus" in der Ethologie. Z Tierpsychol 19:697-722
Sokolov E (1975) Neuronal mechanisms of the orienting reflex. In: Sokolov E, Vinogradova O (~ds) Neuronal mechanisms of the orienting reflex. Erlbaum Hillsdale, New York, pp 217-235
Sz~kely G, I.Azfir G (1976) Cellular and synaptic architecture of the optic teetum. In: Llinas R, Precht W (eds) Frog neurobiology. Springer, Berlin Heidelberg New York, pp 407-434
Teeters JL (1989) A simulation system for neural networks and model for the anuran retina. Technical Report 89-01, Center for Neural Engineering, University of Southern California, Los Angeles
Teeters JL, Arbib MA (1990) A model of anuran retina relating inter- neurons to ganglion cell responses. Biol Cybern 64:197-207
Tsai HJ, Ewert JP (1987) Edge preference of retinal and tectal neurons in common toads (Bufo bufo) in response to worm-like moving stripes: the question of behaviorally relevant "position indicators". J Comp Physiol A 161:295-304
Thompson RF, Spencer WA (1966) Habituation: A model phe- nomenon for the study of neuronal substrates of behavior. Psychol Rev 73:16-43
Wilczynski W, Northcutt R (1983) Connections of the bullfrog striatum: afferent organization. J Comp Neurol 214:321-332
Prof. Michael A. Arbib & De Liang Wang Center for Neural Engineering University of Southern California Los Angeles, CA 90089-2520, USA