
We appreciate your choice of our towing and recovery unit ...
Upload
hope-marshCategory
view
222download
1
Quality Choice and Product Recovery - Atasu & Souza
1
How Does Product Recovery Affect Quality Choice?
Gil Souza, Indiana University(with Atalay Atasu, Georgia Tech)
Presented at:

Quality Choice and Product Recovery - Atasu & Souza
2
Some Self Promotion
• Released in April 2010• Self contained chapters• Written with managers
in mind• Can be used in MBA
classroom

Quality Choice and Product Recovery - Atasu & Souza
3
Agenda1. Strategic vs. tactical decisions on CLSCs
1. Example of a Strategic Problem: Network Design
2. Motivation: examples of firms that practice product recovery and how that impacts their product quality design
3. Research question4. Related literature5. Model structure and basic assumptions6. Structural results7. Extension 1: Competition8. Extension 2: Differentiated remanufacturing9. Conclusion

Quality Choice and Product Recovery - Atasu & Souza
4
Strategic vs. Tactical Decisions in CLSCsLevel Examples
Strategic
•Network design: location and size of collection centers, aggregation centers, reman. facilities, etc.•Should the OEM engage in remanufacturing?•Pricing of new and remanufactured products•Impact of recovery on product design
Tactical
•Acquisition of returns: when, how many, at which price, at which quality?•Disposition decision: what should a firm do with a product return: remanufacture, dismantle for parts, recycle, etc.?
Operational•Disassembly planning: sequence and depth•Job shop control after disassembly

October 2004 Gil C. Souza 5
Reason for return % of Returns
Product defective 20%
Could not install 28%
Not compatible with user needs
40%
Convenience (better price elsewhere, remorse, etc.)
12%
Example of Network Design Problem: Consumer Returns at HP
Why Do Consumers Return Products?

October 2004 Gil C. Souza 6
What Happens to Commercial Returns?
Distributor Retailer SalesFactory
Evaluation of returns
Returns
RemanufacturingSecondary market
Returns
Sales
New returns
Disposal
•Large delays in reverse chain (e.g., 60-90 days for remanuf. of printers)
•This is critical for time-sensitive returns (e.g. printers)
October 2004 Gil C. Souza 7
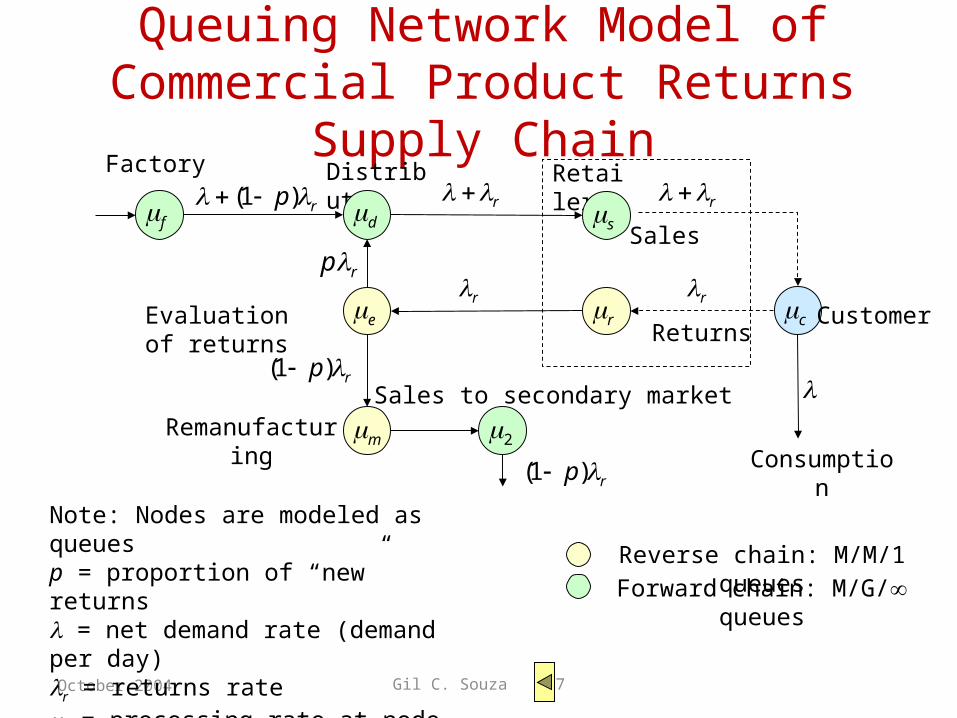
Queuing Network Model of Commercial Product Returns Supply Chain
Distributor Retailer
Sales
Factory
Evaluation of returns
eReturns
pr
Remanufacturing
r
m
r
(1 ) rp
(1 ) rp r d sf
c Customer
Consumption
r
r
Note: Nodes are modeled as queuesp = proportion of “new” returns = net demand rate (demand per day)r = returns ratei = processing rate at node i
Sales to secondary market2
(1 ) rp
Reverse chain: M/M/1 queuesForward chain: M/G/ queues
Gil C. Souza 8
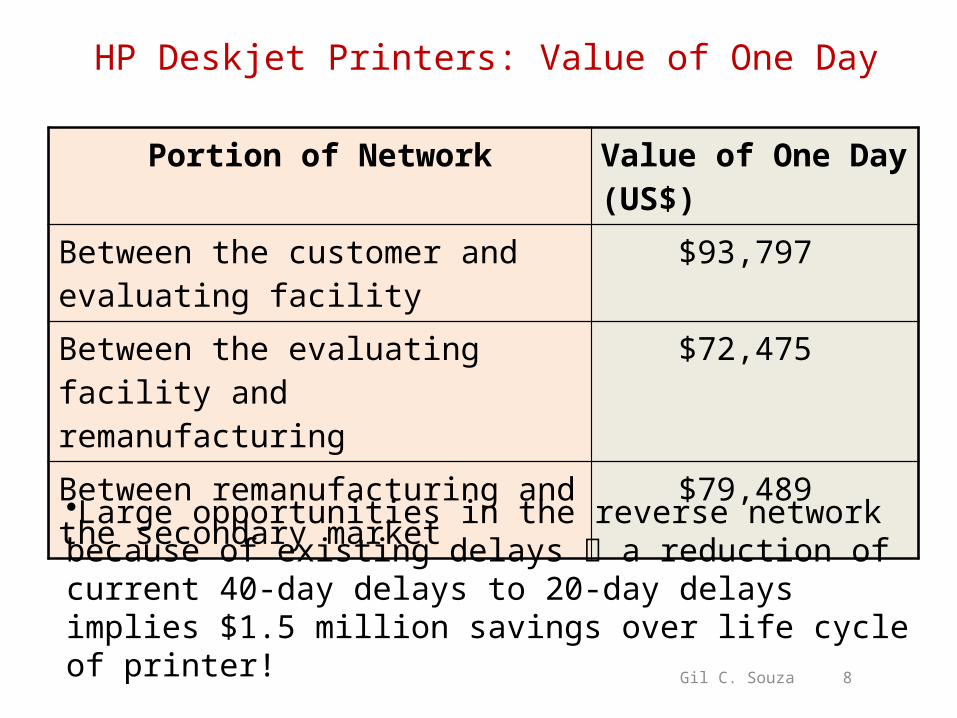
HP Deskjet Printers: Value of One Day
Portion of Network Value of One Day (US$)Between the customer and evaluating facility
$93,797
Between the evaluating facility and remanufacturing
$72,475
Between remanufacturing and the secondary market
$79,489
•Large opportunities in the reverse network because of existing delays a reduction of current 40-day delays to 20-day delays implies $1.5 million savings over life cycle of printer!

Bosch Power Tools: Value of One Day
Portion of Network Value of One Day ($)Between the customer and evaluating facility
$5,624
Between the evaluating facility and remanufacturing
$11,623
Between remanufacturing and the secondary market
$12,748
•Number are much lower than HP’s (particularly considering very long life cycles for power tools)
•It is clear that Bosch needs an efficient reverse supply chain, whereas HP needs a responsive reverse supply chain
Quality Choice and Product Recovery - Atasu & Souza
10
Quality Choice and Product Recovery: The Interface Between Product Recovery and Product Design

Quality Choice and Product Recovery - Atasu & Souza
11
Motivation 1: Undifferentiated Remanufacturing - Xerox
• Newly manufactured copiers contain a significant amount of remanufactured modules– We denote this case here a “remanufactured” copier
• A higher quality module (e.g., faster paper feeding) increases a consumer’s WTP for the product (but more expensive to produce)
• If Xerox can remanufacture that module (when the product comes back), it can decrease its average production cost for the product
Paper InputModule
Finishing Module
Imaging Module
Xerox iGEN 3

Quality Choice and Product Recovery - Atasu & Souza
12
Motivation 2: Differentiated Remanufacturing (Cummins)
• Remanufactured engines (or parts) are sold at an average discount of 35% relative to new - imperfect substitutes for new engines (or parts)
• A more powerful turbocharger, for example, increases consumers’ WTP for the engine but that turbocharger is more expensive to produce
• If Cummins can remanufacture the turbocharger, it can reduce its average remanufacturing cost for the engine
• Cummins said that remanufacturability impacts product design
Before Remanufacturing
After Remanufacturing
Quality Choice and Product Recovery - Atasu & Souza
13
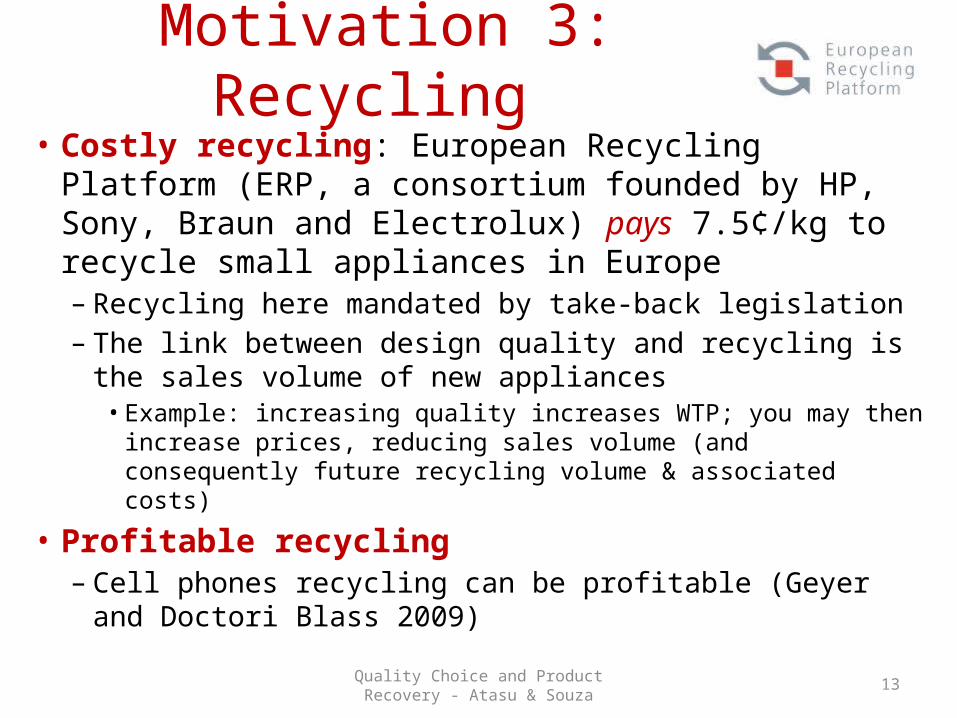
Motivation 3: Recycling • Costly recycling: European Recycling Platform (ERP, a
consortium founded by HP, Sony, Braun and Electrolux) pays 7.5¢/kg to recycle small appliances in Europe – Recycling here mandated by take-back legislation– The link between design quality and recycling is the sales
volume of new appliances • Example: increasing quality increases WTP; you may then increase
prices, reducing sales volume (and consequently future recycling volume & associated costs)
• Profitable recycling– Cell phones recycling can be profitable (Geyer and Doctori
Blass 2009)

Quality Choice and Product Recovery - Atasu & Souza
14
Research Question• Take-back and reprocessing (recycling or
remanufacturing) of used products by an OEM is driven by two factors:1. Take-back legislation (mandated)2. Value recovery (mostly economic reasons)
• How does the possibility of product recovery impacts the design quality of a product?
– Quality here is interpreted as an observable performance measure that increases consumers’ valuation for the product

Quality Choice and Product Recovery - Atasu & Souza
15
Related Literature• Closed-loop supply chains: why engage in
remanufacturing?– Atasu et al. (MS 2008), Debo et al. (MS 2005), Ferguson and
Toktay (POM 2006), Guide & Van Wassenhove (OR 2009), Hauser & Lund (2003)
• Closed-loop supply chains: economic impact of take-back legislation on product design– Atasu & Subramanian (2009), Plambeck & Wang (MS 2009)– Our paper differs here in that our design variable is quality—it
impacts consumer valuation for new product• Marketing: quality choice models
– Mussa & Rosen (1978), Moorthy (1988), Desai (2001)– Difference is that we consider product recovery

16
Model: Basic Assumptions• Monopolist, single period, single product
– We consider duopoly extension later– Single period: slice of a “steady-state” infinite horizon
• Consumer’s valuation for quality ~ U[0,1]
Quality Choice and Product Recovery - Atasu & Souza
u s p
Quality Price
Consumer type
Net utility
u 0Market size = 1
0 1ps
1p
qs
Consumers with positive utility

Quality Choice and Product Recovery - Atasu & Souza
17
Three Recovery Types• Quality recovery: quality inducing
components are recovered and (re)sold again. Profitable. Typical example: remanufacturing
• Profitable material recovery: recovery of quality inducing components not possible, but recovery overall is profitable. Typical example: profitable recycling [of cell phones]
• Costly recovery: recovery overall is not profitable; mostly done due to legislation. Typical example: costly recycling [WEEE]

Quality Choice and Product Recovery - Atasu & Souza
18
Basic Assumptions II: Recovery• A fraction (exogenous or decision variable) of total
products sold (in previous period) can be recovered• If recovery is in the form of quality recovery:
– is the fraction of demand q met with recovered products (1 - is fraction of demand met with new)
– This is the undifferentiated remanufacturing case– We have extended the model to the differentiated
remanufacturing case; later• If recovery is in the form of recycling (costly or profitable)
– All demand q is met with new products– is proportion of end-of-use products q recycled

Quality Choice and Product Recovery - Atasu & Souza
19
Basic Assumptions III: Costs (Quality Recovery case)
• Unit variable cost of producing a brand new product with quality s is (Moorthy 1988):
• Average variable cost of production to meet total demand q with recovery level t is – Where is average cost of quality with
recovery – r is cost savings from remanufacturing of quality-
inducing components– n is remanufacturing cost that is independent of the
quality choice
2nc c s
2mc s n
mc c r

Quality Choice and Product Recovery - Atasu & Souza
20
Basic Assumptions IV: Costs (Recycling case)
• Recycling can be thought of a particular case of remanufacturing where r = 0 (no quality recovery)
• That means and thus avg cost is – If recycling is profitable, n < 0– If recycling is costly, n > 0
mc c 2cs n

Quality Choice and Product Recovery - Atasu & Souza
21
Basic Assumptions V: Additional Convex Increasing Collection Cost
• Literature suggests diseconomies of scale in recovery costs as recovery volume increases (Ferguson and Toktay 2006)
• We also have empirical evidence from two data sets
North American Chemical Company European Consumer Electronics Firm

Quality Choice and Product Recovery - Atasu & Souza
22
Our General Model Is Then:
2 2
, , ( ) ( )max m
p sq p c s n q
Avg cost of productionConvex collection (recovery) cost
mc c r Notation reminder
Non-negative sales quantitys.t. 1 0 p
qs
Non-negative price 0p
Logical constraint 0 1
Firm choosesPrice p Quality sCollection rate

Quality Choice and Product Recovery - Atasu & Souza
23
Benchmark Result: No Recovery (Moorthy 1988)
2
, 1max
p s
pp cs
s
* 13NRs
c
* 29NRp
c
* 127NR c

Quality Choice and Product Recovery - Atasu & Souza
24
Result 1.1 (Legislation Case: Exogenous)
• The optimal quality level with quality recovery or costly recycling (n > 0) is higher than the non-recovery case:
• Due to take-back costs, take-back legislation provides an incentive for firms to increase the quality of their products: they are able to charge higher prices, decreasing consumption (and thus environmental impact)
* *NRs s

Quality Choice and Product Recovery - Atasu & Souza
25
Result 1.2 (Legislation Case: Exogenous)• The optimal quality level with profitable recycling (n
< 0) is: – Higher than the non-recovery case ( ) if– Lower than the non-recovery case ( ) if
• With profitable recycling and low enough , collection costs are low enough so that recycling overall is profitable– Firm has an incentive to choose a lower quality level,
charge a lower price, and sell more• With high enough , legislation accomplishes its
goals of reducing environmental impact through higher quality products, lower consumption
* *NRs s
* *NRs s

Quality Choice and Product Recovery - Atasu & Souza
26
Result 2.1 (No Legislation Case: is a Decision)
• The optimal quality level with quality recovery is no lower than the non-recovery case:
• With costly recycling, • Only difference from the case with take-back
legislation (exogenous ) is that for high enough recovery cost n, the optimal collection rate is zero ( ), implying
* *NRs s
* 0 * *NRs s
* *NRs s* 0

Quality Choice and Product Recovery - Atasu & Souza
27
Result 2.2 (No Legislation Case: is a Decision)
• The optimal quality level with profitable recycling (n < 0) is: – Same as non-recovery case ( ) if– Lower than the non-recovery case ( ) if
• Bottom line: for any type of product recovery, regulated markets for product recovery (setting a minimum recovery rate ) perform better—higher product quality, lower consumption—than in unregulated markets
* *NRs s n n
* *NRs s n n

Quality Choice and Product Recovery - Atasu & Souza
28
Environmental Impact of During Life Cycle with Recovery
• Denote ex as environmental impact per unit during product life cycle stage x. – Production: new + rem.– Use: – End of life: fraction going to landfill =
• Total environmental impact– EI = production + use + end-of-life–
(1 ) ( )p r p re q e q e eue q
(1 )eole q
(1 ) (1 )
( )p r u eolEI e q e q e q e q
q E e Increasing in q and decreasing in

Quality Choice and Product Recovery - Atasu & Souza
29
Environmental Benefits of Recovery Compared to No-Recovery Case
Recovery Scenario Environmental Benefits
Quality recovery +Profitable Recycling - or +
Costly Recycling +
Remember that consumption (q) is always lower under quality recovery and costly recycling, but higher under profitable recycling

Quality Choice and Product Recovery - Atasu & Souza
30
Impact on Consumer Surplus ( = 0)
Recovery Scenario
Impact on Manufacturer Profits and Consumer Surplus
Quality recovery +Profitable Recycling
+
Costly Recycling -
*
1/
Consumer Surplus2p s
s p d
0 1/p s
Consumer surplus and manufacturer’s profits are aligned (if collection costs are linear in recovery rate)
Consumers who buy

Quality Choice and Product Recovery - Atasu & Souza
31
Extension 1: Duopoly• Consider two identical firms with the same
cost structure• One possible equilibrium is symmetric: firms
price at marginal cost, and obtain zero profit• We focus on asymmetric case, where one firm
chooses a high quality (sh) at price ph, and the other a low quality (sl) at price pl
• Thus, consumer of type gets utility from firm i
i i iu s p

Quality Choice and Product Recovery - Atasu & Souza
32
Quantities Sold By Each Firm
l
l
ps
h l
h l
p ps s
0 1
( )
l
l h
qu u
( )
h
h l
qu uNothing
( 0)lu
Consumer type θ

Quality Choice and Product Recovery - Atasu & Souza
33
Problem Faced by Each Firm i
2
,max ( )
s.t. , 0i i
i i i m ip s
i i
q p c s n
p q
Again, solve sequentially: for given si and sj, each firm optimizes its prices. Then, substitute pi(si,sj) into above, and find optimal si, sj

Quality Choice and Product Recovery - Atasu & Souza
34
Results• Can find closed form expressions for prices as a
function of qualities• However, solution of optimal quality levels can only
be found numerically• Results confirm monopoly results
– With quality recovery or costly recycling, both firms chose a quality level that is higher than under no recovery: s* > sNR
– Quality level can be lower than no-recovery case if recovery is in the form of profitable recycling
– Firm’s profits (and consumer surplus) are higher than no-recovery case with profitable recovery

35
Impact of Recovery on Firm Quality under Competition
Quality Choice and Product Recovery - Atasu & Souza
Quality recovery
Costly recovery
Profitable material recovery
Quality of low-quality firm
Quality of high-quality firm
Quality gap between firms increases with recovery
Quality gap between firms decreases with recovery

Quality Choice and Product Recovery - Atasu & Souza
36
Extension 2: Differentiated Remanufacturing (Quality Recovery)
( )r ru s p
n nu s p Consumer’s utility for a new product of quality s and price pn
Consumer’s utility for a product of quality s that is remanufactured and sold at price pr
Where is the consumer’s perceived “quality gap” between a new and remanufactured product. This results in:
1 n rn
p pq
n r n rr
p p p pq
s

Quality Choice and Product Recovery - Atasu & Souza
37
Optimization Problem: Differentiated Remanufacturing
Can show that, just like in the undifferentiated remanufacturing case:
* *NRs s
2 2 2
, , ( ) ( )max
n r
n n r r np p s
q p cs n q p c r s q
s.t r nq q
, , , 0n r n rp p q q

Quality Choice and Product Recovery - Atasu & Souza
38
Conclusions: Impact of Product Recovery on Quality Choice
• Firms typically design products with higher quality when there is product recovery (compared to the case of no recovery)
• Exception occurs if there is profitable material recovery at relatively lower recovery rates mandated by legislation
• Results are robust
![[Recovery] Cwm Recovery 6.0.3](https://static.fdocuments.in/doc/165x107/55cf9443550346f57ba0c2b8/recovery-cwm-recovery-603.jpg)


![Robust Shape Recovery from Occluding Contours Using … · Robust Shape Recovery from Occluding Contours Using a ... obstacle avoidance and ... Canny, 1986]. The choice of edge detector](https://static.fdocuments.in/doc/165x107/5b15ac577f8b9a1a398db222/robust-shape-recovery-from-occluding-contours-using-robust-shape-recovery-from.jpg)