How Does an Economy Work? The Macro-Economics of European Economies MSc in Economic Policy Studies...
63
How Does an Economy Work? The Macro-Economics of European Economies MSc in Economic Policy Studies John FitzGerald, January 2015
-
Upload
nancy-sabina-marsh -
Category
Documents
-
view
219 -
download
0
Transcript of How Does an Economy Work? The Macro-Economics of European Economies MSc in Economic Policy Studies...

How Does an Economy Work?
The Macro-Economics of European EconomiesMSc in Economic Policy StudiesJohn FitzGerald, January 2015

Course Outline
1. How does an economy work? JF 16-1-2015
2. The genesis of macroeconomics AM 23-1-2015
3. Modern macroeconomics AM 30-1-2015
4. Banks and financial markets AM 6-2-2015
5. The recent crisis AM 13-2-2015
6. The labour market JF 20-2-2015
7. Fiscal Policy and forecasting JF 6-3-2015
8. Trade JF 13-3-2015
9. The economics of global warming JF 20-3-2015
10. The future of the Irish economy AM and JF 27-3-2015

Outline of Lecture
• Theory• Different “markets”• A model of the economy• Equilibrium and Disequilibrium• Market “Imperfections”, Expectations, Behaviour
• Applied - examples from 2000-15• The EU and the US economies• Disequilibria in EU economies• How economies adjust

Different Markets
• Useful to consider the economy as a series of markets• The Goods (and Services) market• Money / Financial Markets• Labour Market• Housing Market• Government sector
• These markets are interlinked – a “model” of the economy• For equilibrium in the economy the markets must be consistent

The Goods market - 1
• Demand for Goods (and Services)• C+I+G : Closed economy• C+I+G+X : Open economy
• C=Private Consumption; I= Investment; G= Government consumption; X=Exports
• Supply of Goods (and Services)• Y : Closed economy• Y+M : open Economy
• Y = Domestic Output; M=Imports
• Disequilibrium?• Inflation, Current account of the balance of payments
• Imperfections?

The Goods market - 2
• Y=C+I+G (+X-M)• Y= GDP, output = expenditure = income – demand for goods (and services)
• Y=Q• Q= National output – supply of goods (and services)
• C=a + b(Y - T)• T=Government revenue; a and b are coefficients, where b is 0<b<1
• Y=a + bY – bT + I + G + (X - M) • Y(1-b)= a + I + (X - M) + G - bT
• Assumes output will respond to an increase in demand• is the “multiplier”

The Goods market - 3
• S=Y-C-T• S= Savings
• Y=C+I+G+(X-M)• Y-C-T=S=I+(X-M)+(G-T)• S+(T-G)=I+(X-M)• Total savings equals investment plus the current account surplus• What happens if people want to save more?

The Goods market - 4
• Growth?• Output is a function of inputs and productivity• Inputs: labour, capital, materials• Investment increases capital and hence the productive potential of economy• Investment in human capital (education) increases productivity of labour• Investment in R&D may raise productivity of all factors
• Q= Y = a function of K,L,M, productivity• The stock of capital labour and materials determines potential output• However, how much will it be profitable to produce?

The Goods market - 5
• Profits=P*Q-W*L-Pk*K-Pm*M where firms maximise profits• P= price of output; W= price of labour; L= employment; Pk = price of capital; K= capital stock; M = materials;
Pm= price of materials
• This means that output doesn’t automatically adjust to meet demand• Open economy: is it profitable to produce in Ireland?
• If it is, how much labour, capital and materials will you need?• Competitiveness matters
• In the long run it is through raising output that living standards rise. • Raising demand on its own may not lead to increased output.
• e.g. Irish government policy in 1977-1979
• Imperfections?

Money / Financial markets
• Demand for Money• Need money to buy and sell• Affected by cost - credit
• Supply of Money• Central Bank can create money• Banks extend credit based on their stock of money
• Disequilibrium?• e.g. inflows on financial account of the balance of payments
• Imperfections?• e.g. Expectations – drive bubbles

The Labour market
• Labour Demand• How profitable are firms – what happens to output• Cost in home country relative to foreign determines share of world output• Price of labour (labour costs), price of capital, price of materials• Openness of economy affects behaviour
• Labour Supply• Demographics, Wage Rates, Costs of working, Value of leisure, Culture• Openness of economy affects behaviour - migration
• Equilibrium – Disequilibrium• Unemployment rate, rate of wage inflation
• Imperfections?

The Housing market
• Demand – factors driving demand• Demographics – natural increase• Income / wealth• Cost – user cost, a function of interest rates, expected prices
• Supply – factors driving supply• Profitability of building – price relative to costs• Costs – labour, materials, land
• Disequilibrium• How to measure it?• Rate of price increase?
• Imperfections?

Government Sector
• Revenue and Expenditure• Revenue
• Economic costs of taxation• Economic impact of taxation• Other Revenue
• Expenditure• Government Consumption• Government Transfers• Subsidies• Investment
• Measure of imbalance – Deficit or Surplus• Debt - sustainability

A model of the economy
• An equilibrium solution for economy requires equilibrium in all markets• Markets are interlinked.• Linked by many variables:• Interest rates, wage rates, prices, etc. etc.
• How will economy adjust to exogenous changes?• e.g. changes in budget, changes in oil prices, changes in monetary policy
• How can governments influence growth?• Importance of the supply side

Equilibrium, Disequilibrium
• May be out of long-term equilibrium. e.g.• Running an increasing current account deficit – demand > output• Inflation high and rising (prices and wages)• Unemployment high
• Will economy return to equilibrium of its own accord?• Possibility of multiple equilibria• What is the role of government?
• Adjustment takes time• Time to invest, to change output, to change expectations• Never actually in equilibrium

Market Imperfections, Expectations, Behaviour• Market imperfections e.g.:
• Monopolies / oligopolies: make more from lower output• Adjustment takes time e.g. investment• SME’s cannot finance themselves because of financial sector difficulties• Unions and employer cartels may affect wage bargaining• Restrictions on supply of building land may affect housing supply• Can Government improve the situation?
• Expectations e.g.• People have economic “models” in their heads. These models may or may not be correct• Consumption affected by lifetime income – what is lifetime income?• Expect a rise in house prices – get on the property ladder!
• Behaviour• In chemistry H2O always combine like that. • No such certainties with human behaviour. History rarely repeats itself.

Applied
• Europe and the US 2007• Goods market – Current account of the balance of payments and inflation• Money market – interest rates, nominal and real• Labour Market – unemployment and wage inflation• Housing Market – was there a housing market
• Europe and the US 2015• Goods market – Current account of the balance of payments and inflation• Money market – the “zero lower bound”• Labour market – out of equilibrium – will it return to full employment?• Housing market – EU economies and the US• The investment question

Current account of Balance of Payments - 1
-6
-5
-4
-3
-2
-1
0
1
80 82 84 86 88 90 92 94 96 98 00 02 04 06 08
BP_USA/GDPV_USA*100BP_EU28/GDPV_EU28*100
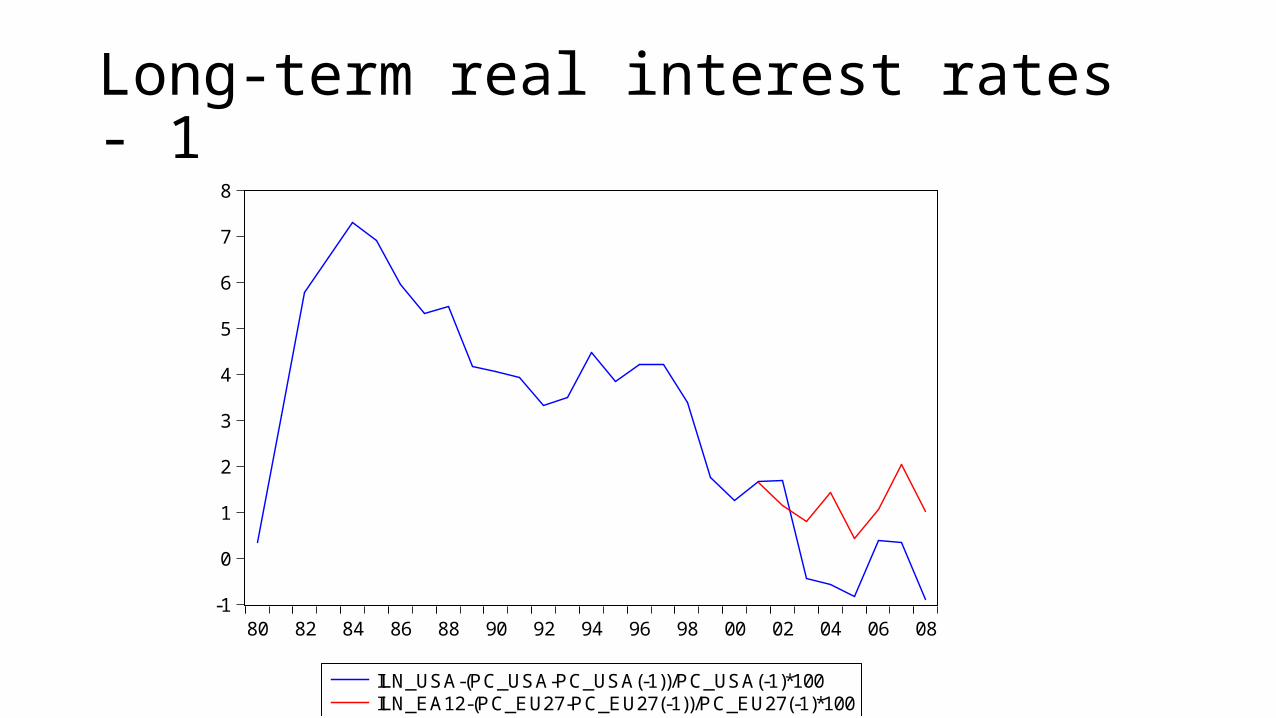
Long-term real interest rates - 1
-1
0
1
2
3
4
5
6
7
8
80 82 84 86 88 90 92 94 96 98 00 02 04 06 08
ILN_USA-(PC_USA-PC_USA(-1))/PC_USA(-1)*100ILN_EA12-(PC_EU27-PC_EU27(-1))/PC_EU27(-1)*100

Rate of inflation - 1
-2
0
2
4
6
8
10
12
1980 1985 1990 1995 2000 2005 2010
(PC_USA-PC_USA(-1))/PC_USA(-1)*100(PC_EU27-PC_EU27(-1))/PC_EU27(-1)*100

House Price Inflation - 1
19801981
19821983
19841985
19861987
19881989
19901991
19921993
19941995
19961997
19981999
20002001
20022003
20042005
20062007
20082009
20102011
20122013
2014
-20
-15
-10
-5
0
5
10
15
20
25
30
UKUSA

Government Borrowing - 1
-8
-7
-6
-5
-4
-3
-2
-1
0
1
80 82 84 86 88 90 92 94 96 98 00 02 04 06 08
GB_EU15/GDPV_EU15*100GB_USA/GDPV_USA*100

Debt – GDP ratio - 1
40
45
50
55
60
65
70
75
80 82 84 86 88 90 92 94 96 98 00 02 04 06 08
GNT_USA/GDPV_USA*100GNT_EU27/GDPV_EU27*100

Current account of Balance of Payments - 2
-6
-5
-4
-3
-2
-1
0
1
2
00 01 02 03 04 05 06 07 08 09 10 11 12 13 14
BP_USA/GDPV_USA*100BP_EU27/GDPV_EU27*100

Long-term real interest rates - 2
-1
0
1
2
3
4
00 01 02 03 04 05 06 07 08 09 10 11 12 13 14
ILN_USA-(PC_USA-PC_USA(-1))/PC_USA(-1)*100ILN_EA12-(PC_EU27-PC_EU27(-1))/PC_EU27(-1)*100

Rate of inflation - 2
2001 2002 2003 2004 2005 2006 2007 2008 2009 2010 2011 2012 2013 2014
-1
0
1
2
3
4
5
6
pc inf_eu27 pc inf_usa

Government Borrowing - 2
-14
-12
-10
-8
-6
-4
-2
0
2
00 01 02 03 04 05 06 07 08 09 10 11 12 13 14
GB_USA/GDPV_USA*100GB_EU15/GDPV_EU15*100

Debt – GDP ratio - 2
50
60
70
80
90
100
110
00 01 02 03 04 05 06 07 08 09 10 11 12 13 14
GNT_USA/GDPV_USA*100GNT_EU27/GDPV_EU27*100

Individual Countries in EU
• Look at 3 examples of problems and adjustment• Latvia• Spain• UK

Latvia – current account of BOP
-25
-20
-15
-10
-5
0
5
10
00 01 02 03 04 05 06 07 08 09 10 11 12 13 14
BP_LVA/GDPV_LVA*100

Latvia – rate of inflation
• Consumer prices, nominal wages and house prices.
2000 2001 2002 2003 2004 2005 2006 2007 2008 2009 2010 2011 2012 2013 2014
-50
-40
-30
-20
-10
0
10
20
30
40
50
cons price inf_lva wage inf_lva house price inf_lva

Latvia – real interest rate
-30
-20
-10
0
10
20
30
00 01 02 03 04 05 06 07 08 09 10 11 12 13 14
ILN_LVA-(PC_LVA-PC_LVA(-1))/PC_LVA(-1)*100

Latvia – Investment share of GDP
• Housing, building and construction and total
0
5
10
15
20
25
30
35
40
00 01 02 03 04 05 06 07 08 09 10 11 12 13 14
ITOTV_LVA/GDPV_LVA*100IHV_LVA/GDPV_LVA*100IBCV_LVA/GDPV_LVA*100

Latvia – exports share of GDP
2000 2001 2002 2003 2004 2005 2006 2007 2008 2009 2010 2011 2012 2013 20140
10
20
30
40
50
60
70
Exports scaled by GDP
Exports scaled by GDP

Relative wage rates
• Wage rates in a common currency to base 2000=100:• Latvia, Spain, Germany, Ireland, UK, Portugal, EU28
2000 2001 2002 2003 2004 2005 2006 2007 2008 2009 2010 2011 2012 2013 201480
130
180
230
280
330
380
430
w_gbrw_prtw_eu28w_irlw_deuw_espw_lva

Latvia – unemployment rate
2000 2001 2002 2003 2004 2005 2006 2007 2008 2009 2010 2011 2012 2013 20140
5
10
15
20
25
Unemployment Rate
Series1

Latvia – government borrowing as % of GDP
-9
-8
-7
-6
-5
-4
-3
-2
-1
0
00 01 02 03 04 05 06 07 08 09 10 11 12 13 14
GB_LVA/GDPV_LVA*100

Latvia – Debt as % of GDP
2000 2001 2002 2003 2004 2005 2006 2007 2008 2009 2010 2011 2012 2013 20140
5
10
15
20
25
30
35
40
45
50
Debt share of GDP

Latvia – Conclusions?

Spain – current account of BOP
-10
-8
-6
-4
-2
0
2
00 01 02 03 04 05 06 07 08 09 10 11 12 13 14
BP_ESP/GDPV_ESP*100

Spain – rate of inflation
• Consumer prices, nominal wages and house prices.
-20
-15
-10
-5
0
5
10
15
20
2000 2002 2004 2006 2008 2010 2012 2014
cons price inf_esp wage inf_esp house p inf_esp

Spain – real interest rate
0
1
2
3
4
5
6
7
8
9
00 01 02 03 04 05 06 07 08 09 10 11 12 13 14
ILN_ESP-(PC_ESP-PC_ESP(-1))/PC_ESP(-1)*100

Spain – Investment share of GDP
• Housing, building and construction and total
0
5
10
15
20
25
30
35
00 01 02 03 04 05 06 07 08 09 10 11 12 13 14
ITOTV_ESP/GDPV_ESP*100IHV_ESP/GDPV_ESP*100IBCV_ESP/GDPV_ESP*100

Spain – exports share of GDP
2000 2001 2002 2003 2004 2005 2006 2007 2008 2009 2010 2011 2012 2013 20140
5
10
15
20
25
30
35
Exports scaled by GDP
Exports scaled by GDP

Relative wage rates
• Wage rates in a common currency to base 2000=100:• Latvia, Spain, Germany, Ireland, UK, Portugal, EU28
2000 2001 2002 2003 2004 2005 2006 2007 2008 2009 2010 2011 2012 2013 201480
90
100
110
120
130
140
150
160
170
w_gbrw_prtw_eu28w_irlw_deuw_esp

Spain – unemployment rate
2000 2001 2002 2003 2004 2005 2006 2007 2008 2009 2010 2011 2012 2013 20140
5
10
15
20
25
30
Unemployment Rate
Unemployment rate

Spain – government borrowing as % of GDP
-12
-10
-8
-6
-4
-2
0
2
4
00 01 02 03 04 05 06 07 08 09 10 11 12 13 14
GB_ESP/GDPV_ESP*100

Spain – Debt as % of GDP
30
40
50
60
70
80
90
100
00 01 02 03 04 05 06 07 08 09 10 11 12 13 14
GNT_ESP/GDPV_ESP*100

Spain – Conclusions?

UK – current account of BOP
-4.4
-4.0
-3.6
-3.2
-2.8
-2.4
-2.0
-1.6
-1.2
00 01 02 03 04 05 06 07 08 09 10 11 12 13 14
BP_GBR/GDPV_GBR*100
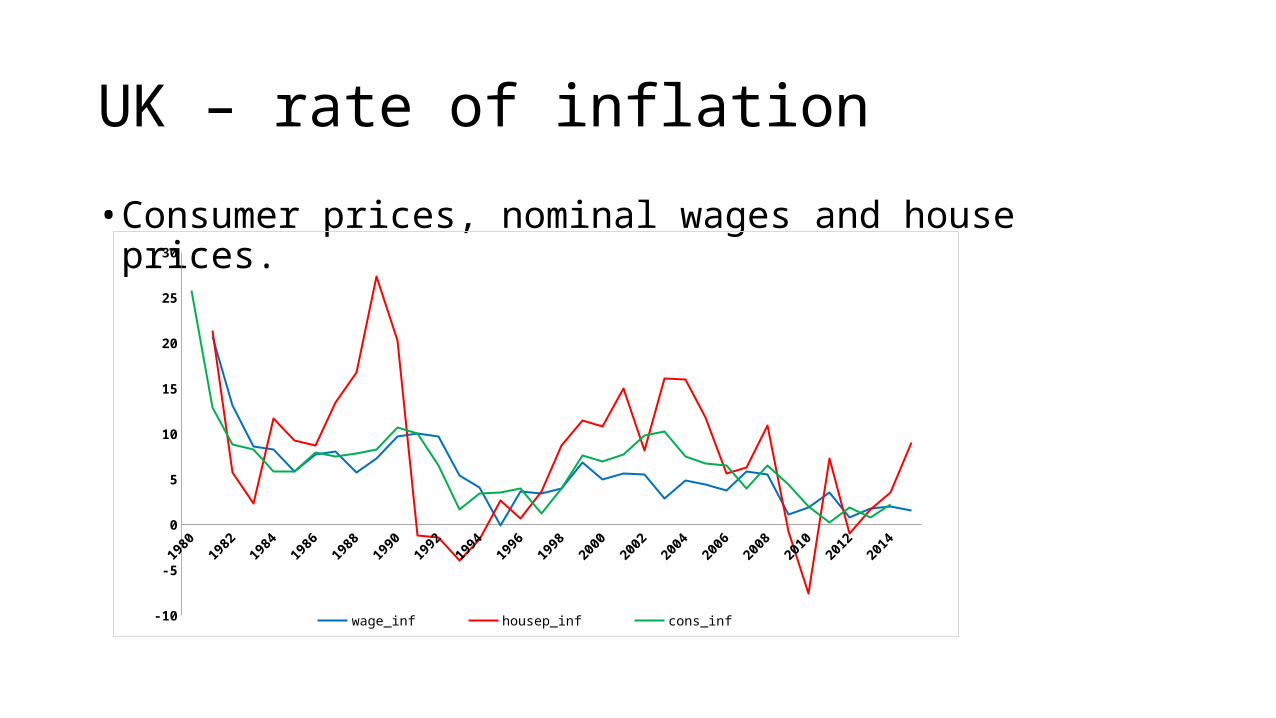
UK – rate of inflation
• Consumer prices, nominal wages and house prices.
19801981
19821983
19841985
19861987
19881989
19901991
19921993
19941995
19961997
19981999
20002001
20022003
20042005
20062007
20082009
20102011
20122013
2014
-10
-5
0
5
10
15
20
25
30
wage_inf housep_inf cons_inf

UK – real interest rate
-1.0
-0.5
0.0
0.5
1.0
1.5
2.0
2.5
3.0
00 01 02 03 04 05 06 07 08 09 10 11 12 13 14
ILN_GBR-(PC_GBR-PC_GBR(-1))/PC_GBR(-1)*100

UK – Investment share of GDP
• Housing, building and construction and total
0
4
8
12
16
20
00 01 02 03 04 05 06 07 08 09 10 11 12 13 14
ITOTV_GBR/GDPV_GBR*100IHV_GBR/GDPV_GBR*100IBCV_GBR/GDPV_GBR*100

UK – exports share of GDP
2000 2001 2002 2003 2004 2005 2006 2007 2008 2009 2010 2011 2012 2013 20140
5
10
15
20
25
30
35
Exports scaled by GDP
Exports scaled by GDP

Relative wage rates
• Wage rates in a common currency to base 2000=100:• Latvia, Spain, Germany, Ireland, UK, Portugal, EU28
2000 2001 2002 2003 2004 2005 2006 2007 2008 2009 2010 2011 2012 2013 201480
90
100
110
120
130
140
150
160
170
w_gbrw_prtw_eu28w_irlw_deuw_esp

UK – unemployment rate
2000 2001 2002 2003 2004 2005 2006 2007 2008 2009 2010 2011 2012 2013 20140
1
2
3
4
5
6
7
8
9
Unemployment Rate
Unemployment rate

UK – government borrowing as % of GDP
-12
-10
-8
-6
-4
-2
0
2
00 01 02 03 04 05 06 07 08 09 10 11 12 13 14
GB_GBR/GDPV_GBR*100

UK – Debt as % of GDP
30
40
50
60
70
80
90
00 01 02 03 04 05 06 07 08 09 10 11 12 13 14
GNT_GBR/GDPV_GBR*100

UK – Conclusions?

AMECO Database
• Many annual variables for EU economies, US, Japan etc.• Don’t assume that the data are always right!• Where available, runs from 1960. Includes EU forecasts to 2016• Be careful that 2014 onwards are EU forecasts!
• Three approaches to accessing it:1. Online: http://ec.europa.eu/economy_finance/ameco/user/serie/SelectSerie.cfm
2. Excel File: AMECONov14.xlsx plus list_of_variables.pdf
3. Excel File: AMECOTCD.xlsx – a limited number of variables, 1 variable per sheet
• House prices from BIS datatbase:• Online: http://www.bis.org/statistics/pp_detailed.htm#selected

Future Presentations
1. The origins and resolution of the current crisis in Estonia, Bulgaria, Greece and Spain (20th February)• What were the origins? How is it resolving? Look at disequilibria in markets
2. The origins and resolution of the current crisis in Latvia, Portugal, Spain and Italy (20th February)• What were the origins? How is it resolving? Look at disequilibria in markets
3. The crisis in Scandinavia (Finland, Sweden, Denmark) 1988-1995 (6th March)• What were the origins? How was it resolved? Look at disequilibria in markets

Reading for this lecture
• Basic text:• “Macroeconomics a European Perspective”, Blanchard, Amighini and Giavazzi. Probably
more theory than you need, but provides the basics• Chapters 3-6
• The rest of the reading discusses real economic situations. • The objective is to evaluate whether economies are out of equilibrium and if so why?
How are they adjusting or how have they adjusted? What are the problems?• FitzGerald, J., 2013 “Financial crisis, economic adjustment and a return to growth in the EU”, Revue de l’OFCE - Debates and policies,
No.127 pp. 277-302 http://www.ofce.sciences-po.fr/pdf/revue/127/revue-127.pdfLook at one or two of these publications for the EU and its component economies• IMF World Economic Outlook, October 2014. http://www.imf.org/external/pubs/ft/weo/2014/02/pdf/text.pdf• OECD Economic Outlook, November 2014,
http://www.oecd.org/eco/outlook/General-assessment-of-the-macroeconomic-situation.pdf• National Institute Economic Review, November 2014, http://ner.sagepub.com/content/230/1.toc• European Commission: European Economic Forecast, Winter 2014
http://ec.europa.eu/economy_finance/publications/european_economy/2014/pdf/ee2_en.pdf

Reading for this lecture
•Possible additional reading for projects• OECD country surveys http://www.oecd.org/eco/surveys/
• Zsolt Darvas, A TALE OF THREE COUNTRIES: RECOVERY AFTER BANKING CRISES, Bruegel Policy Contribution ISSUE 2011/19, DECEMBER 2011
• http://ec.europa.eu/economy_finance/publications/publication13551_en.pdf and http://ec.europa.eu/economy_finance/publications/publication692_en.pdf compares Finland and Sweden in the 1990 crisis